
Quantifying the Driving Forces of Informal Urbanization in the Western Part of the Greater Cairo Metropolitan Region


Abstract
:1. Introduction
2. Informal Urbanization in the Greater Cairo Region
3. Methods
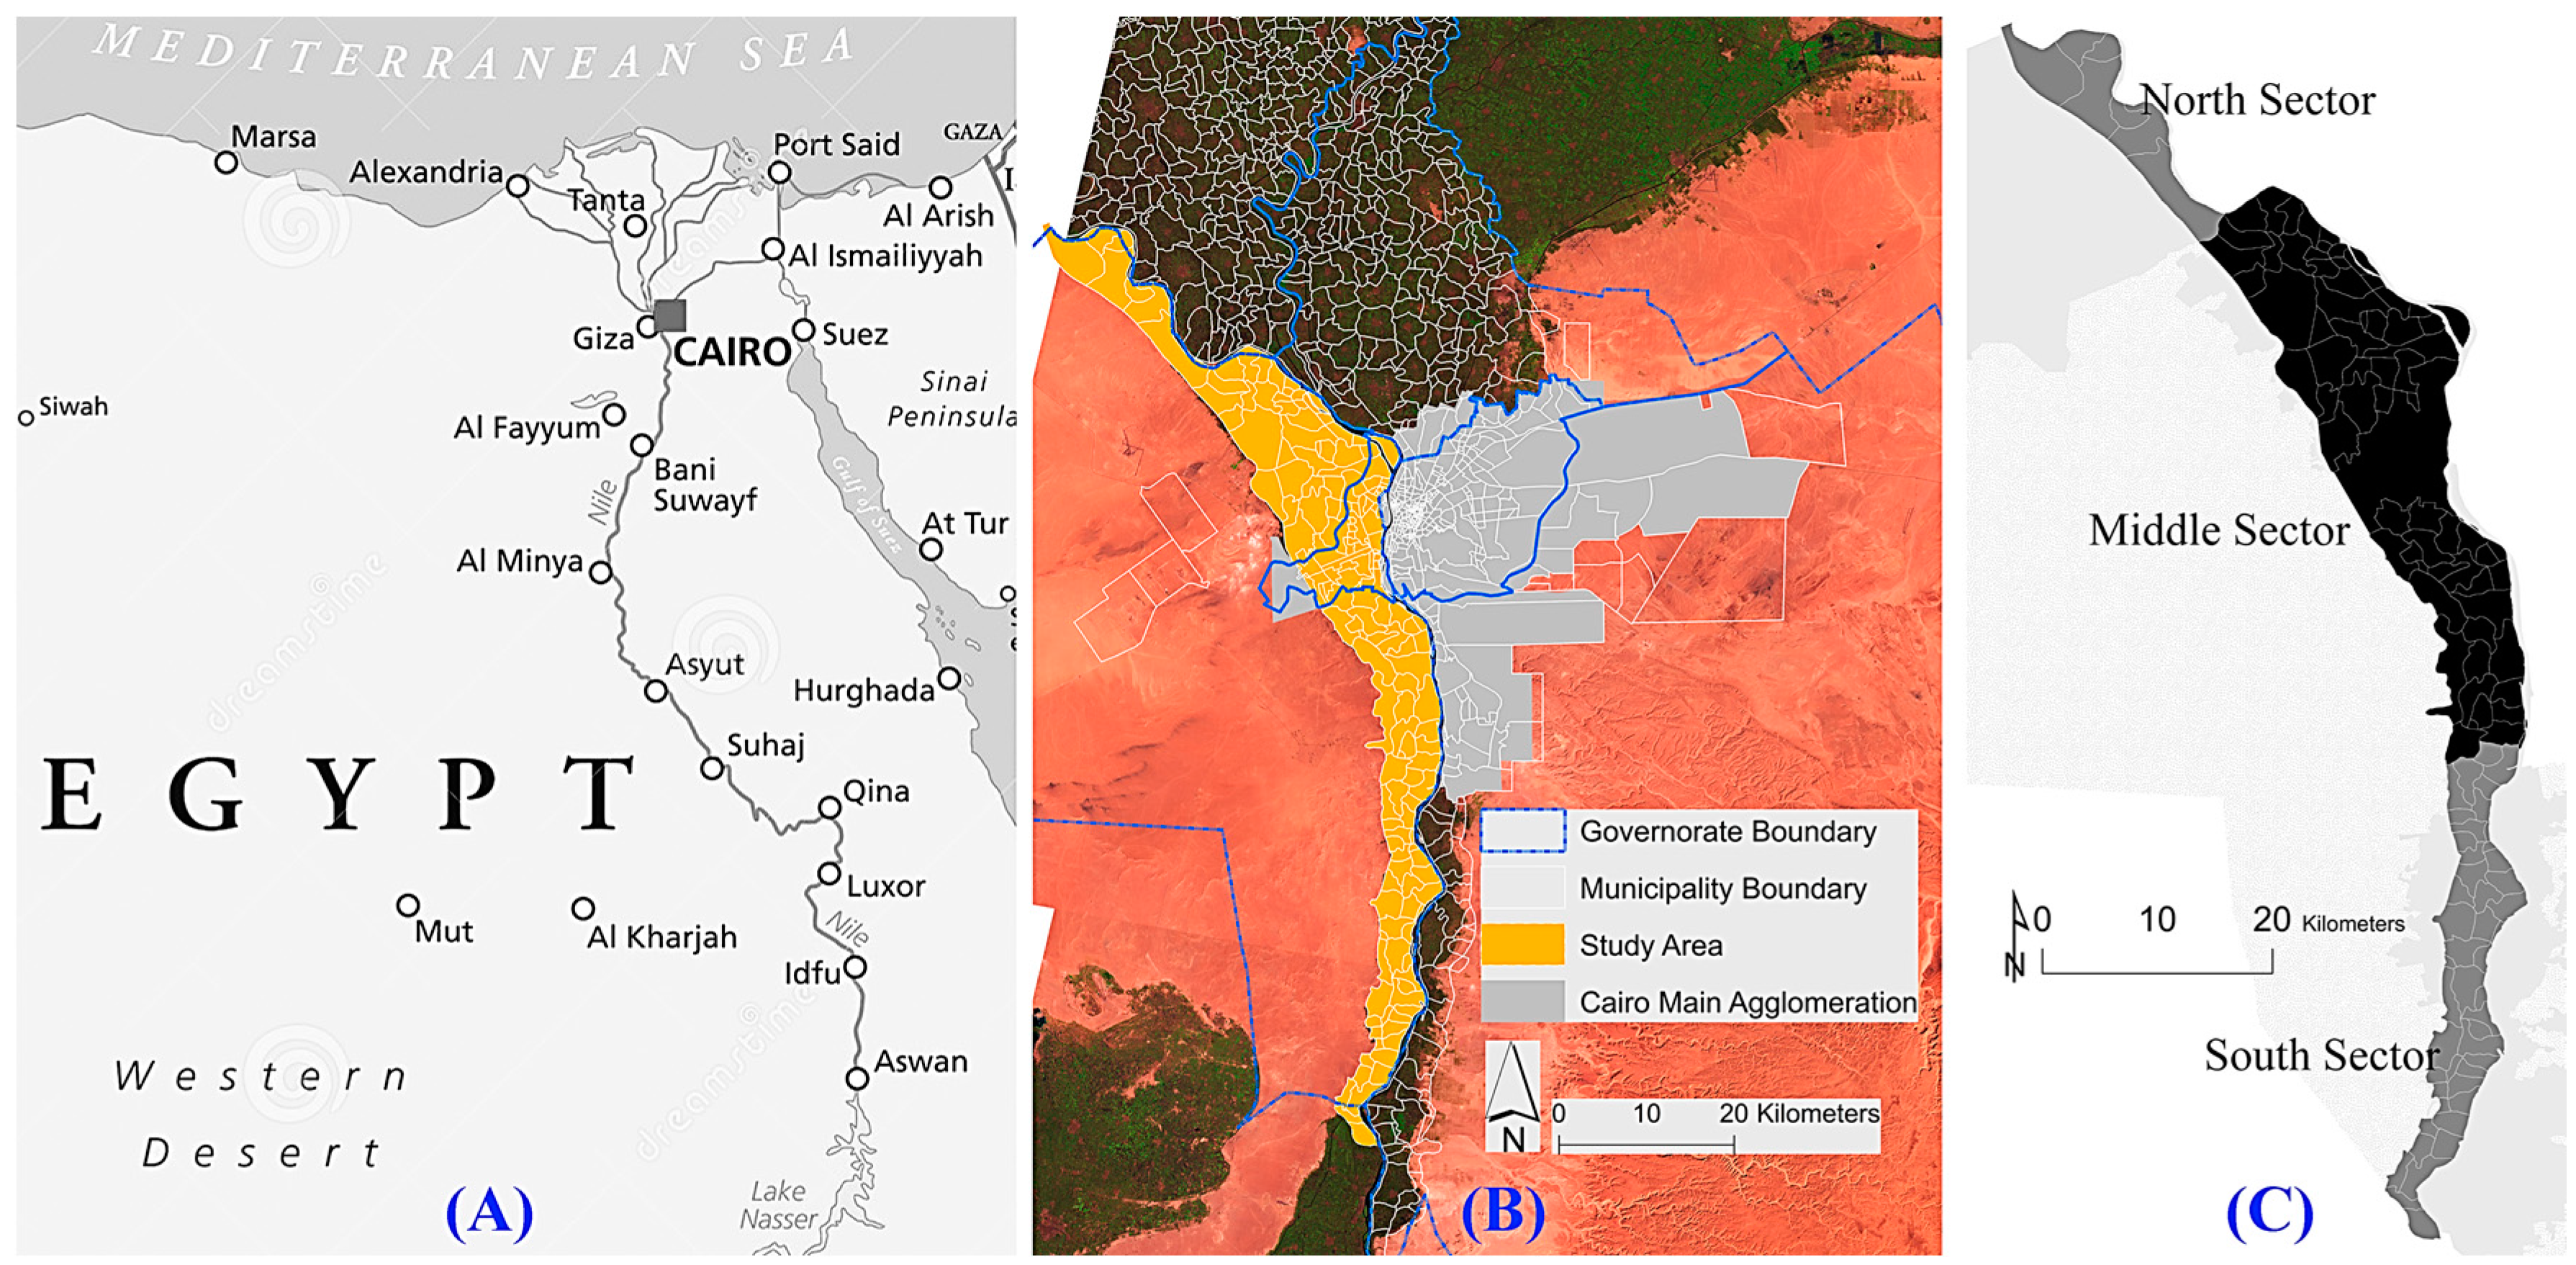
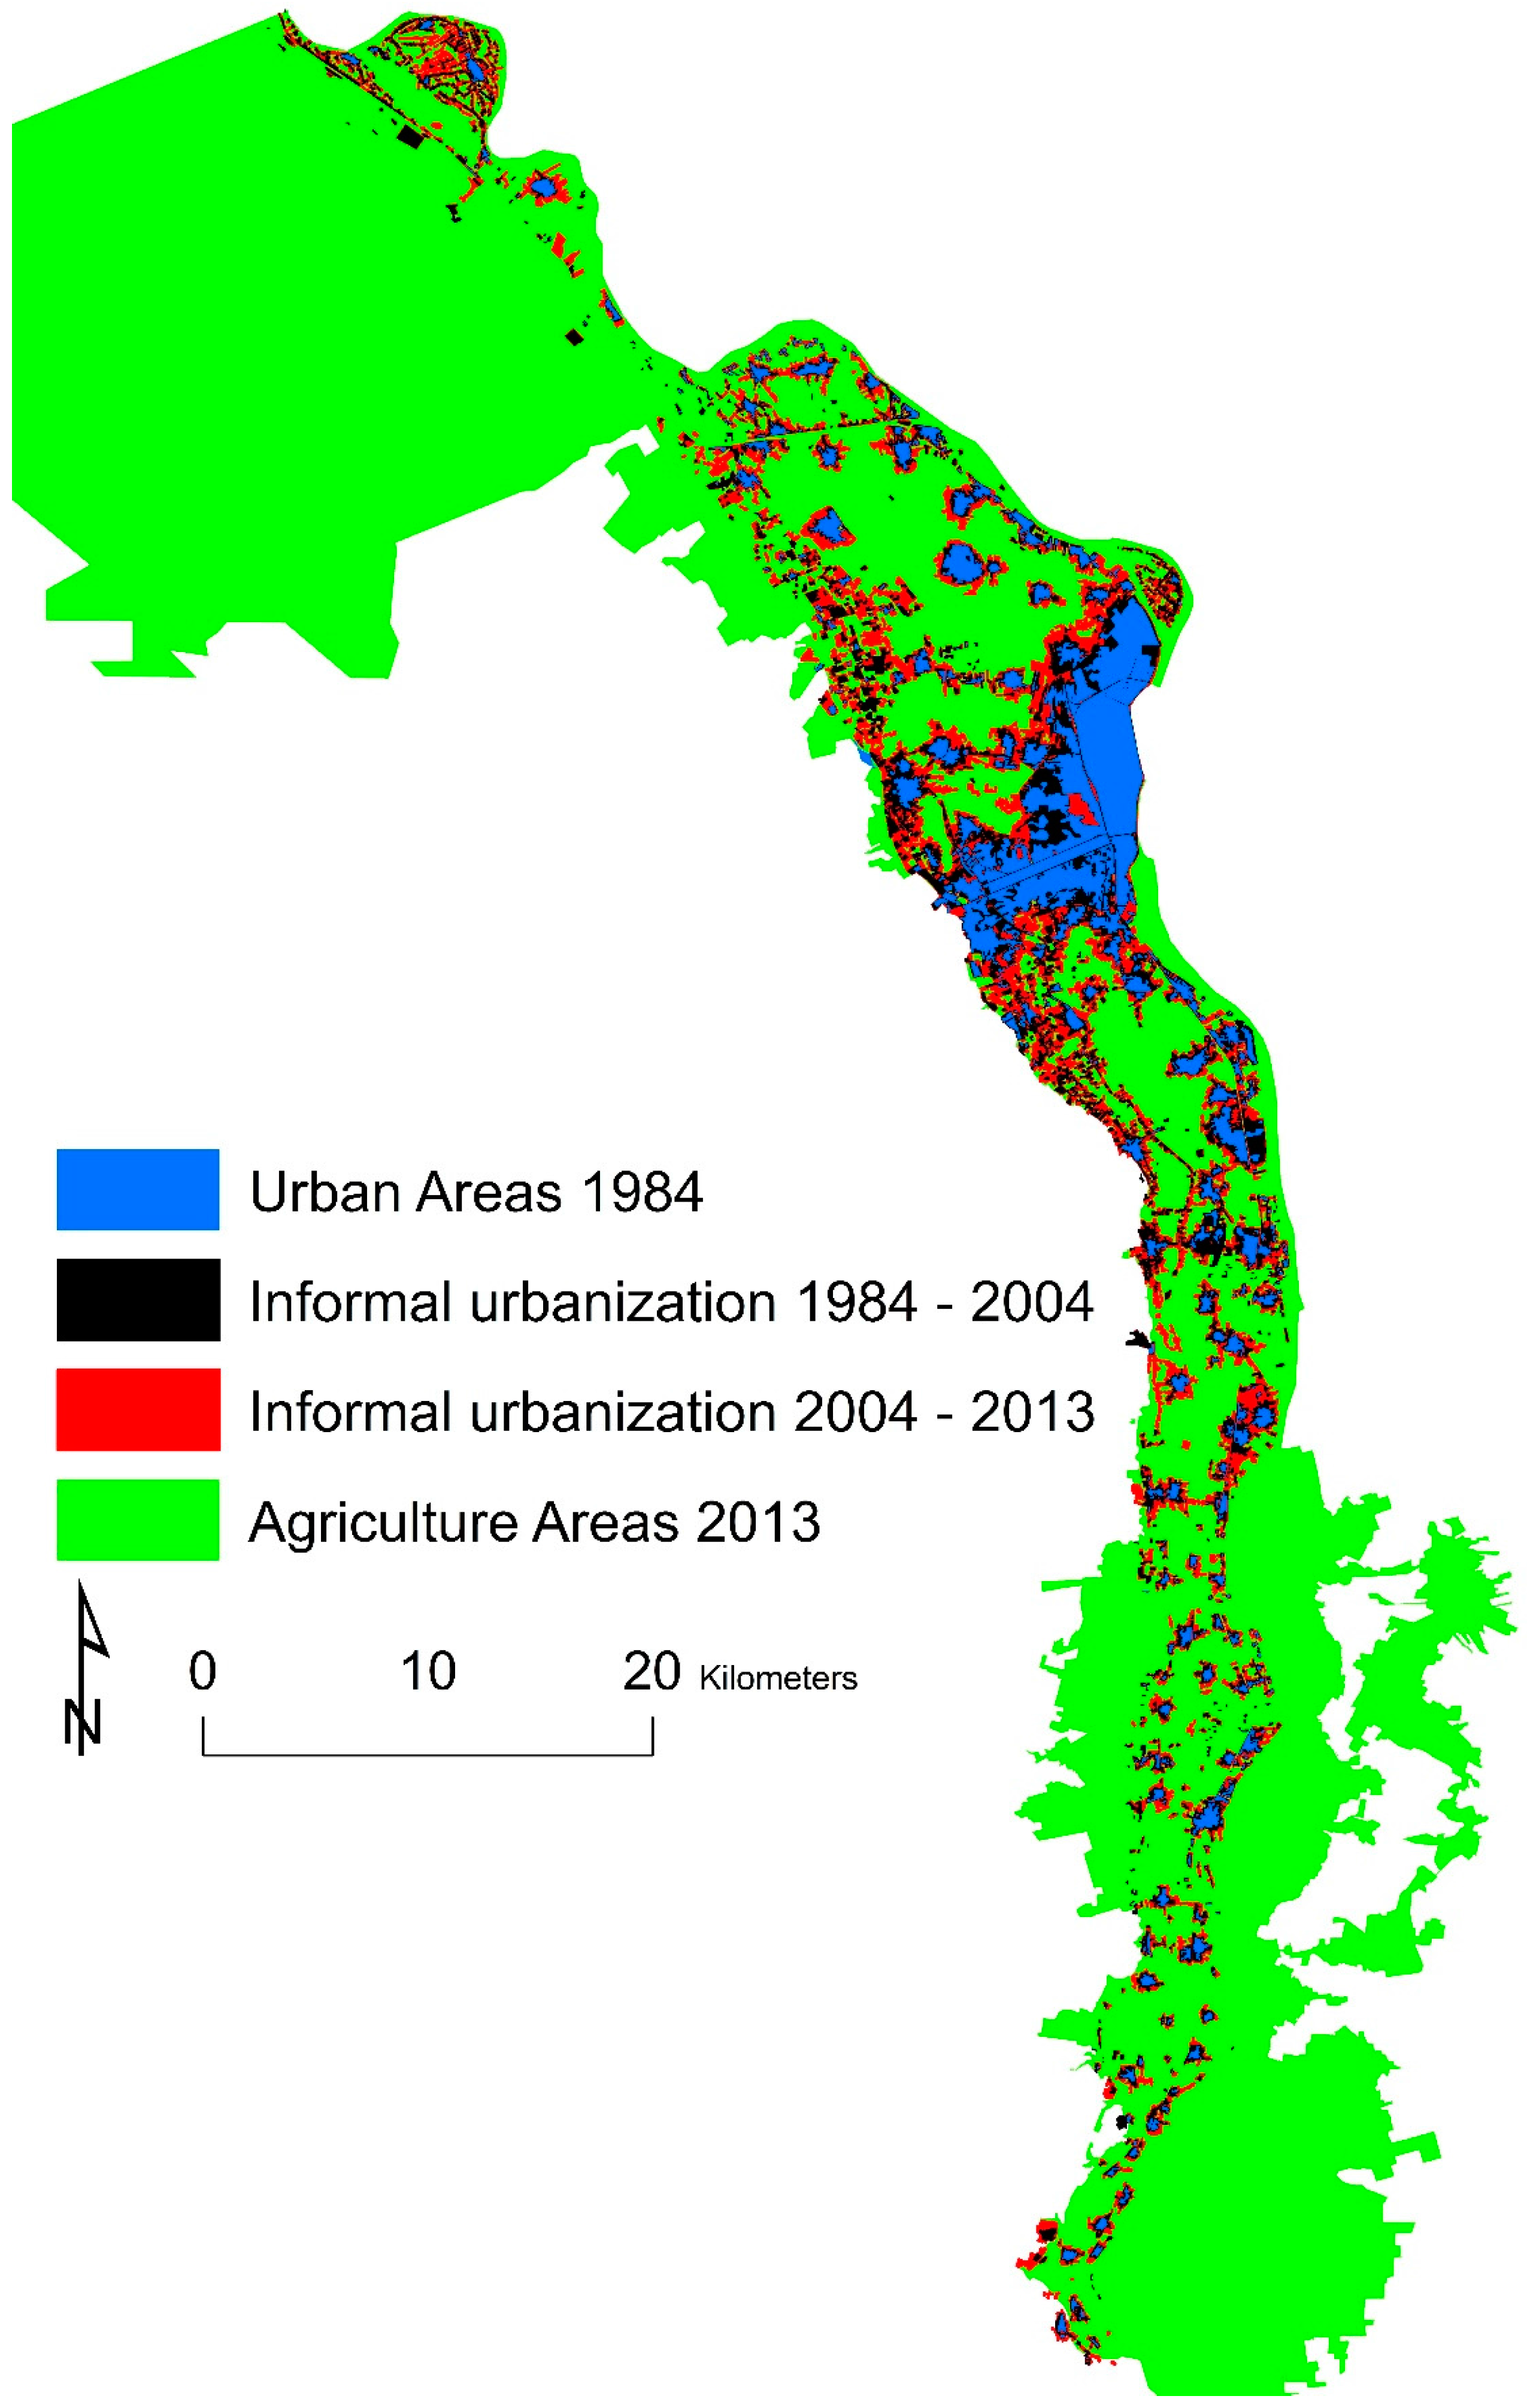
3.1. Research Area
3.2. Identifying Driving Forces (DF)
3.3. Modeling the Driving Forces: The AHP Framework
3.3.1. Analytic Hierarchy Process (AHP)
3.3.2. Evolving the AHP Hierarchy
3.3.3. Specifying the Pairwise Differentiation Module
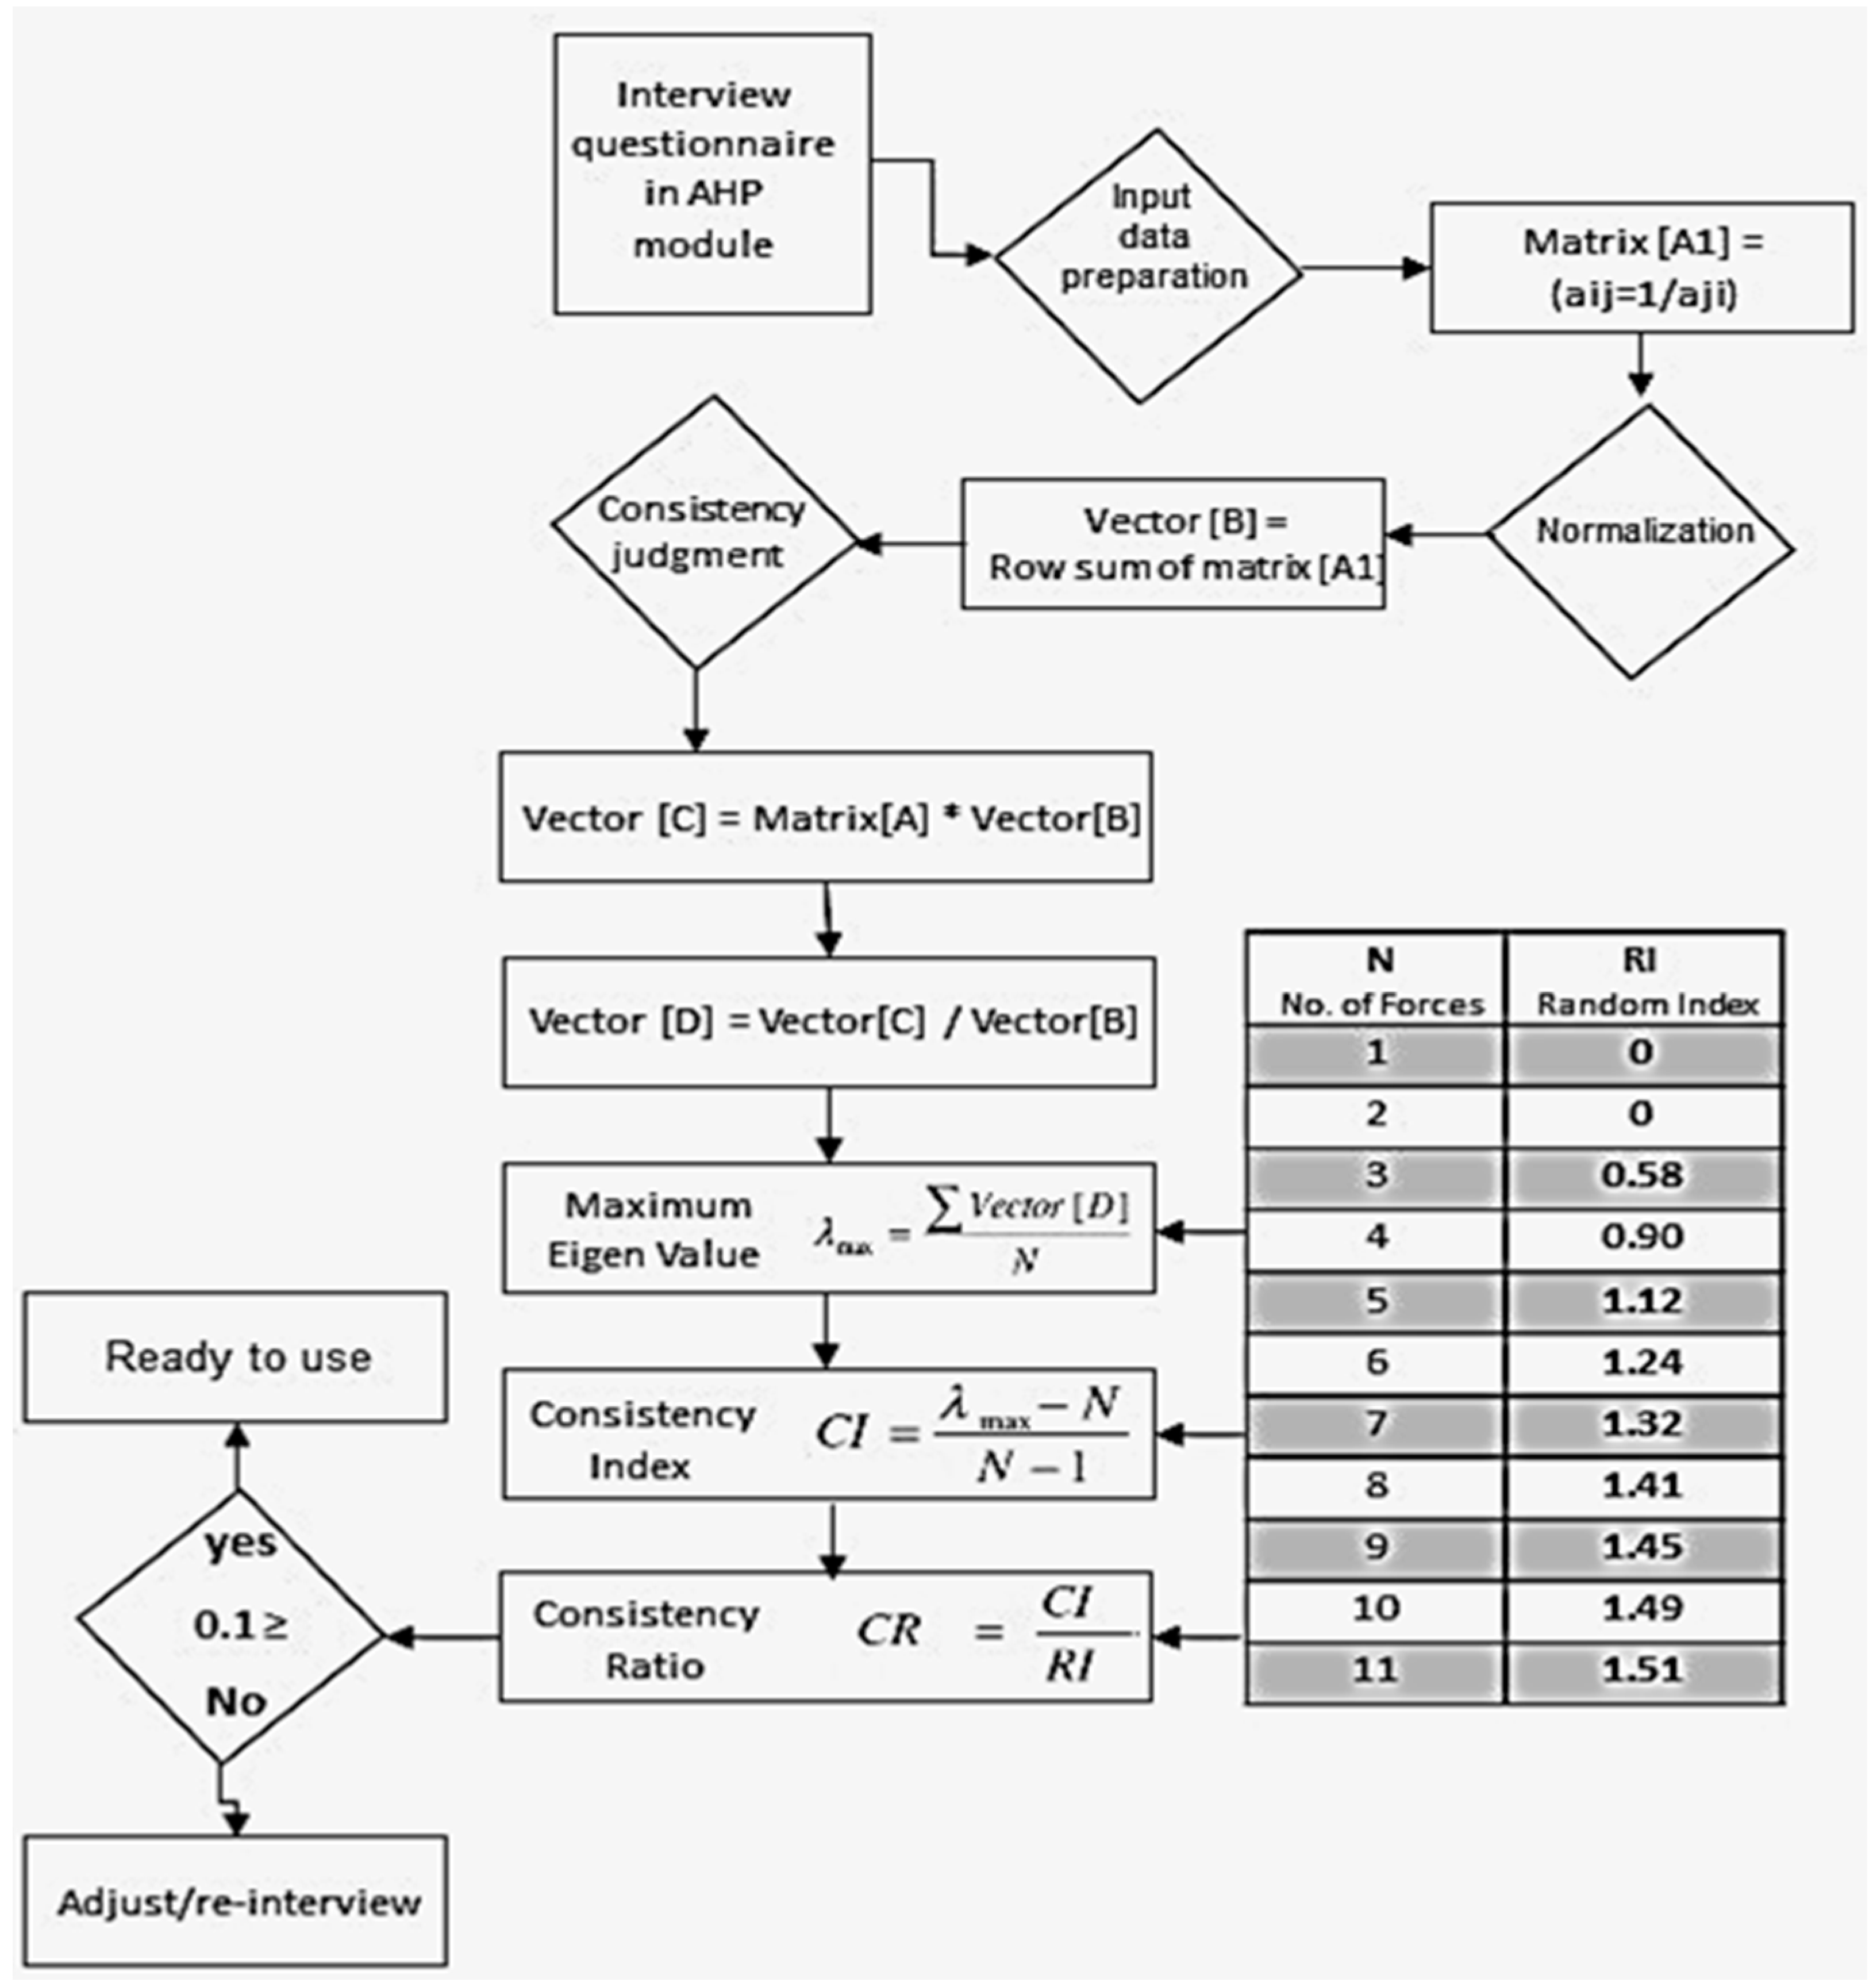
3.3.4. Counting Consistency Ratio
3.3.5. Calculating the Definitive Weights
4. Results
4.1. Driving Forces in Middle Sector
4.2. Driving Forces in the North Sector
4.3. Driving Forces in the South Sector
5. Discussion
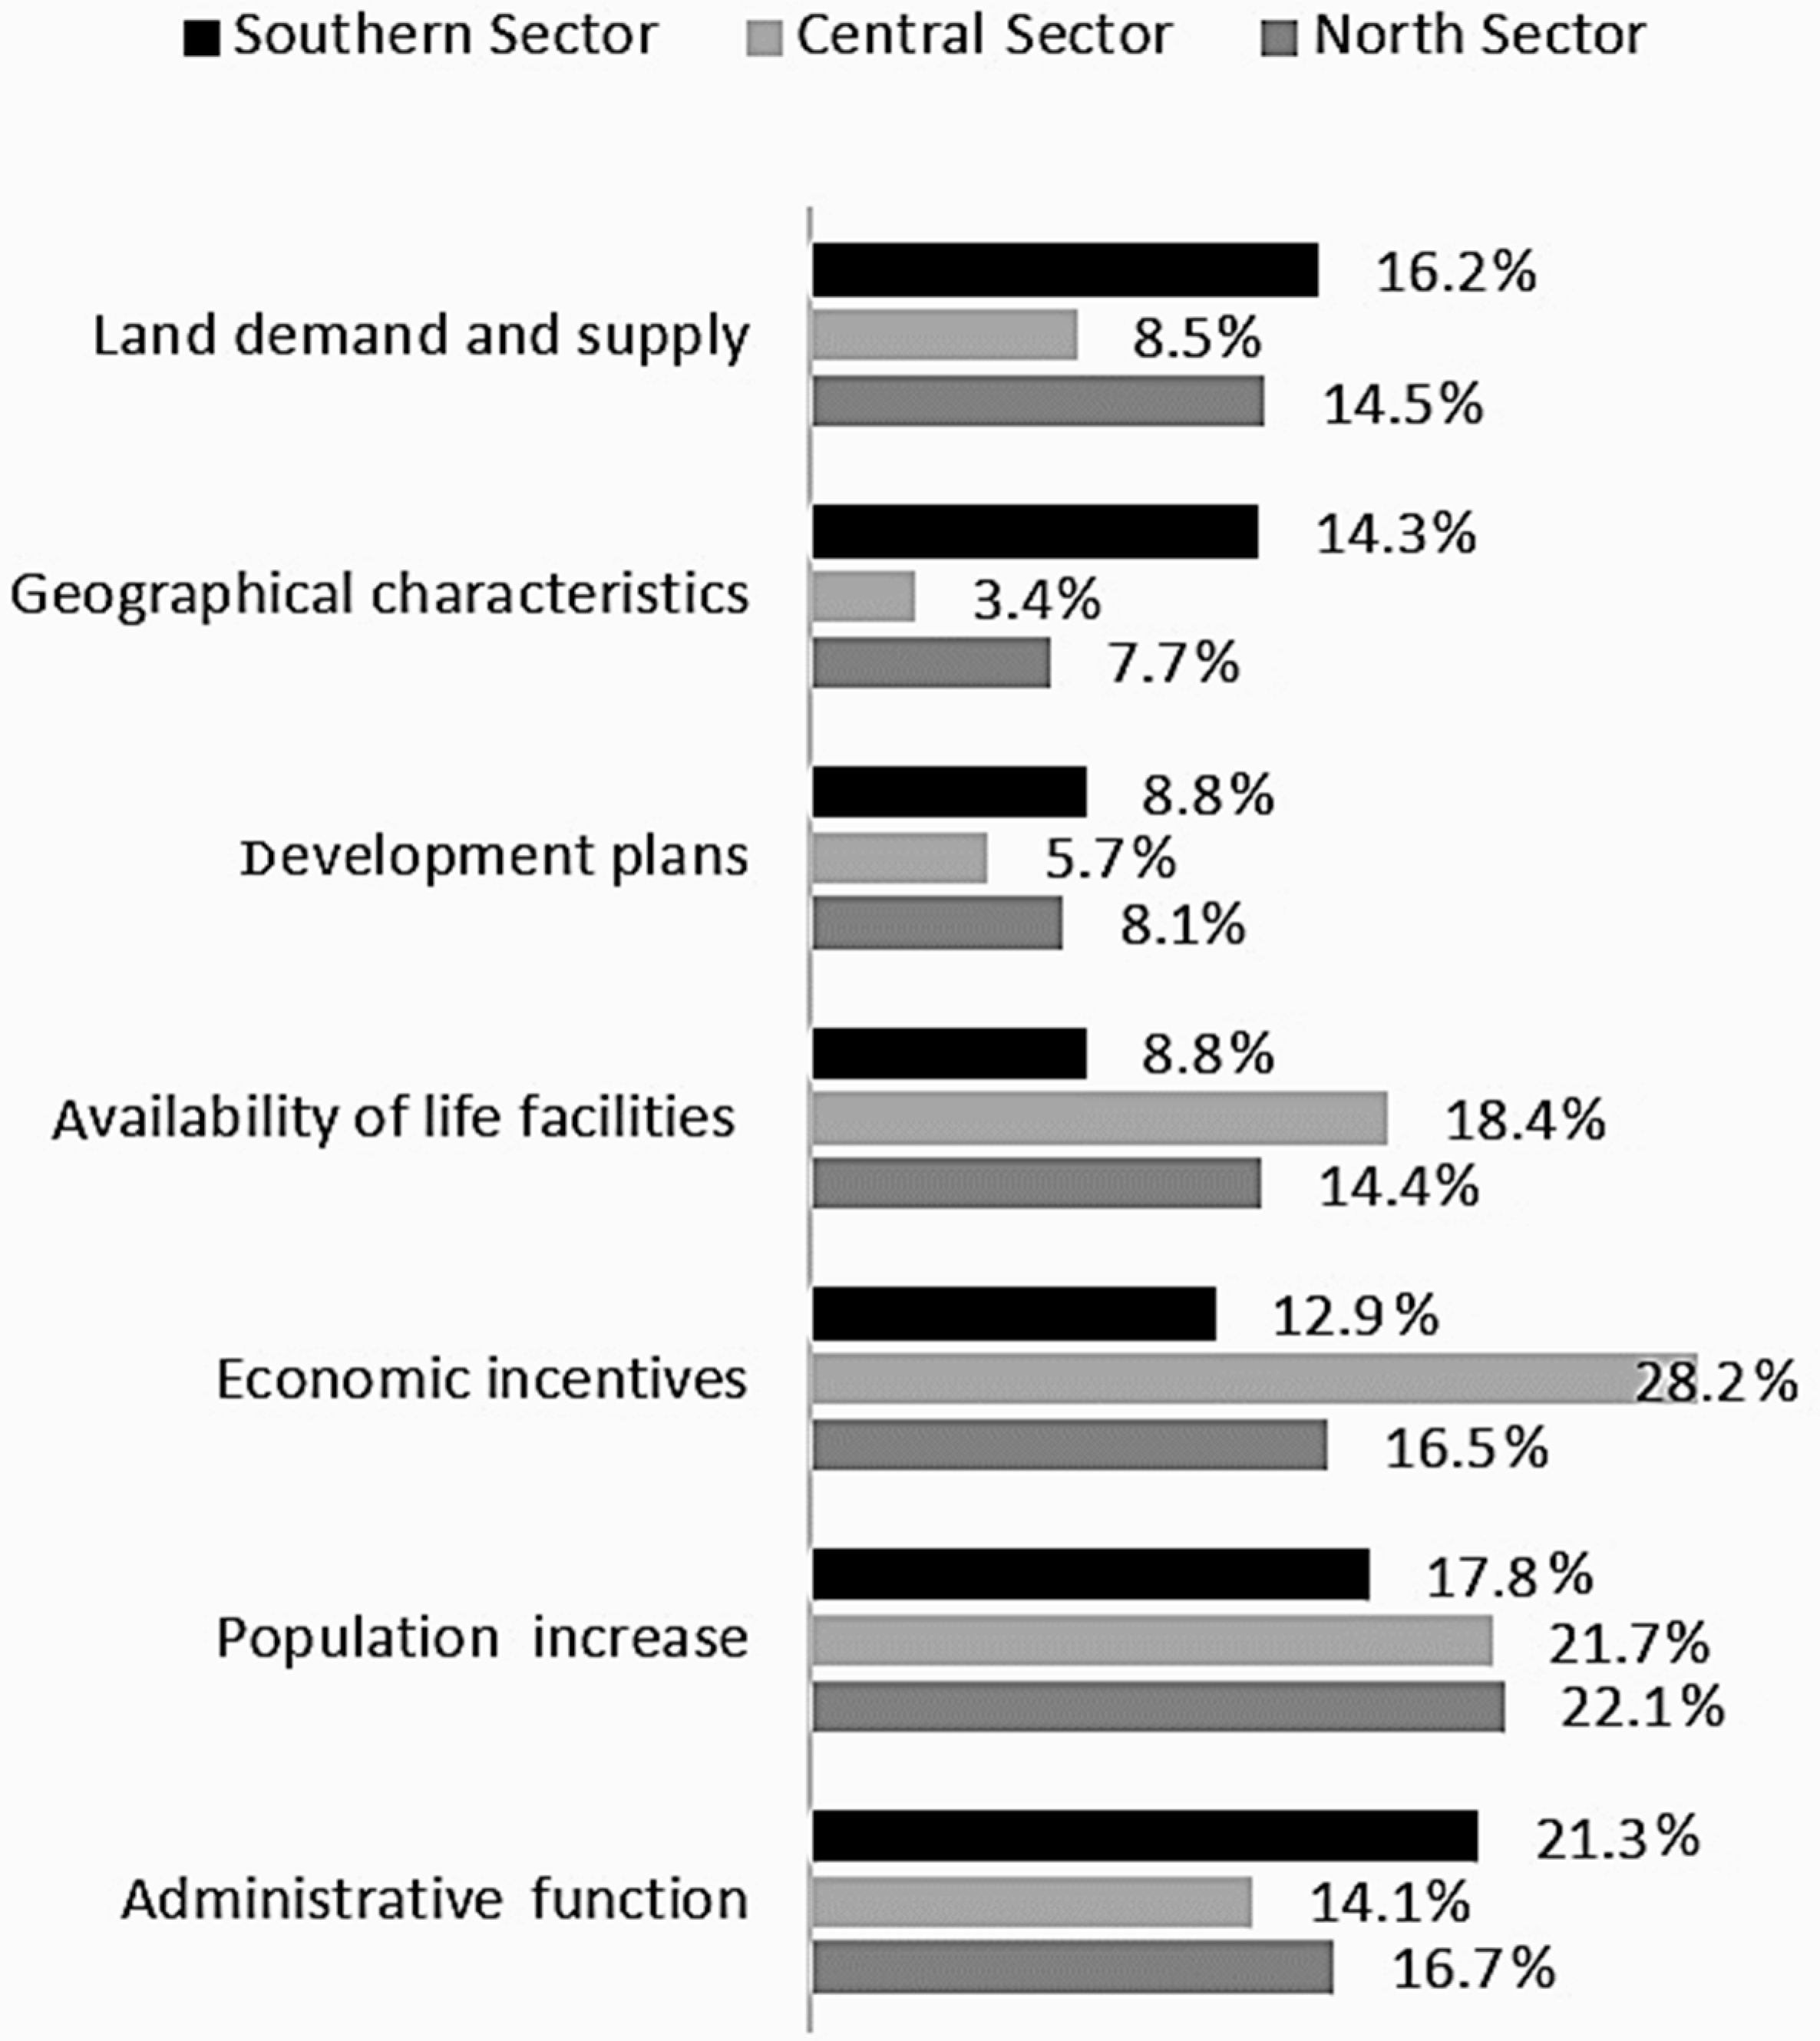
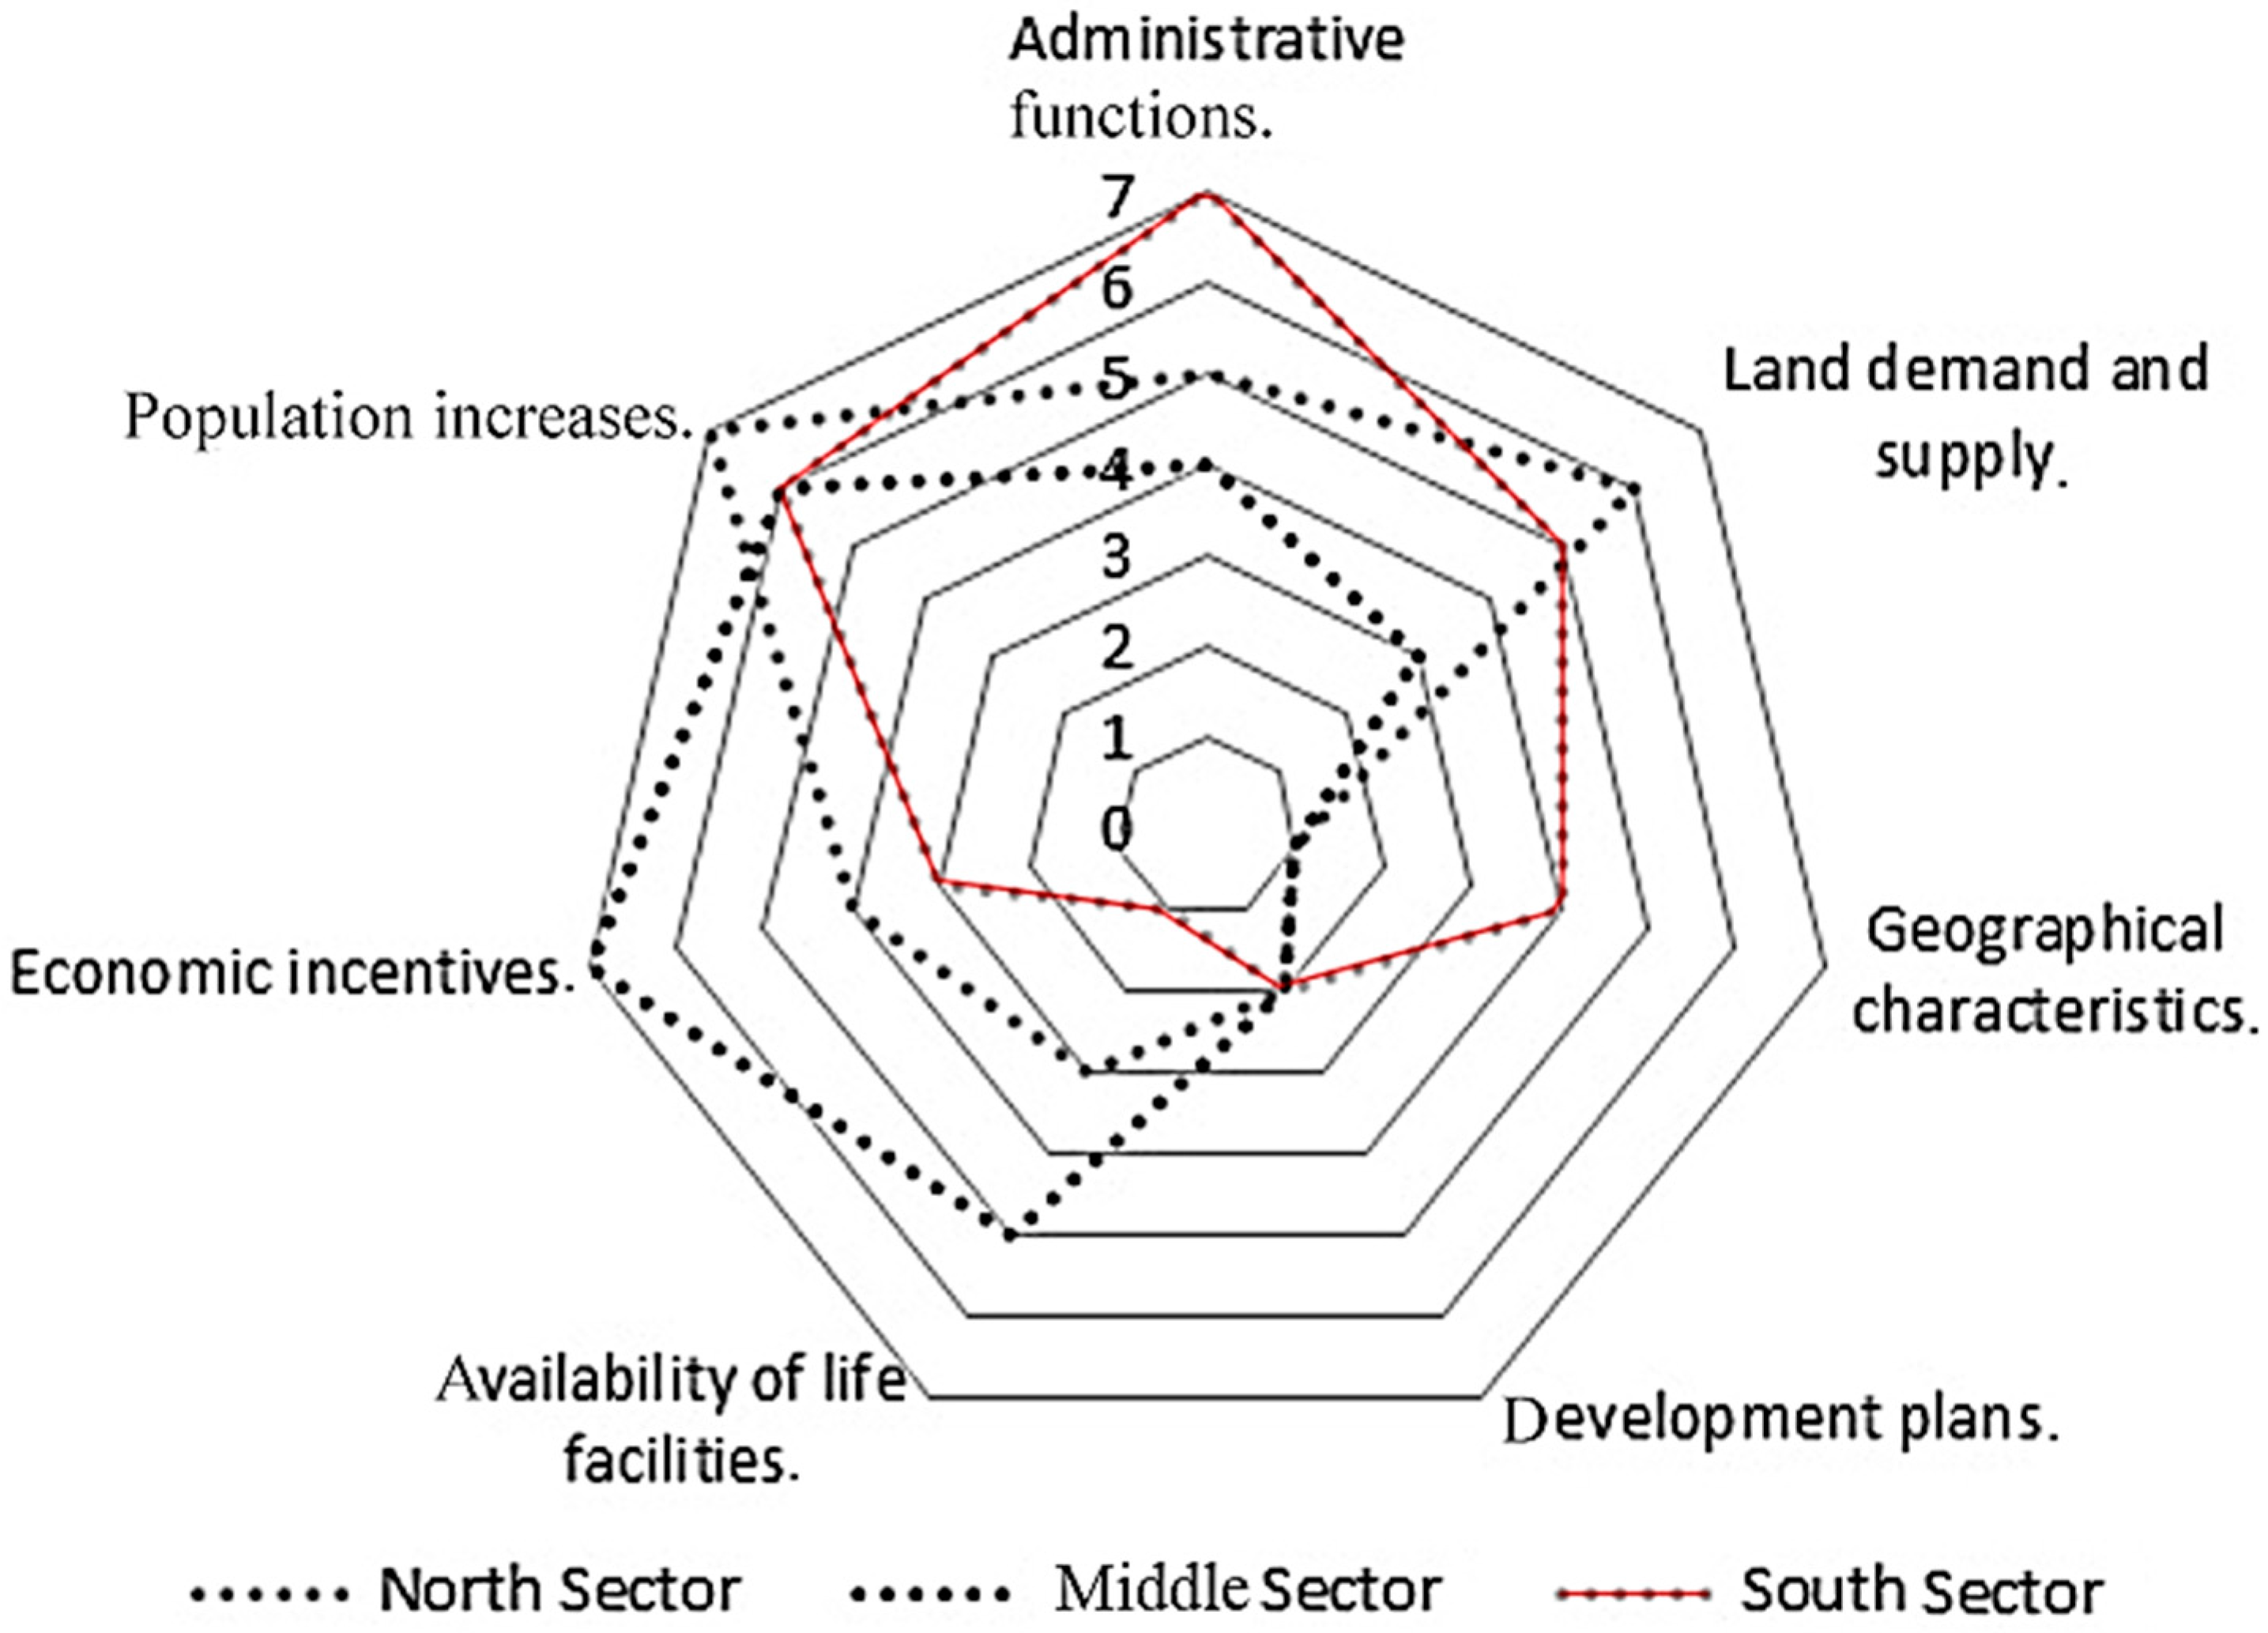
5.1. Comparing the Driving Forces by Structural Areas
5.2. Rating of Driving Forces by Study Sector
6. Conclusions
Acknowledgments
Author Contributions
Conflicts of Interest
References
- United Nations Department of Economic and Social Affairs. World Population Prospects: The 2010 Revision; UNDESA: New York, NY, USA, 2012; Volume 1. [Google Scholar]
- Central Intelligence Agency World Factbook. Available online: https://www.cia.gov/index.html (accessed on 14 December 2015).
- Schneider, A.; Friedl, M.A.; Potere, D. A new map of global urban extent from MODIS satellite data. Environ. Res. Lett. 2009, 4, 044003. [Google Scholar] [CrossRef]
- Lopez, T.D.M.; Aide, T.M.; Thomlinson, J.R. urban expansion and the loss of prime agricultural lands in Puerto Rico. Ambio 2001, 30, 49–54. [Google Scholar] [CrossRef] [PubMed]
- Alphan, H. Land use change and urbanization in Adana, Turkey. Land Degrad. Dev. 2003, 14, 575–586. [Google Scholar] [CrossRef]
- Turner, B.L., II. Local faces, global flows: The role of land use and land cover in global environmental change. Land Degrad. Dev. 1994, 5, 71–78. [Google Scholar] [CrossRef]
- Li, Y.Y.; Zhang, H.; Kainz, W. Monitoring patterns of urban heat islands of the fast-growing Shanghai metropolis, China: Using time-series of Landsat TM/ETM+ data. Int. J. Earth Observ. Geoinf. 2012, 19, 127–138. [Google Scholar] [CrossRef]
- McKinney, M.L. Urbanization, biodiversity, and conservation. Bioscience 2002, 52, 883–890. [Google Scholar] [CrossRef]
- Herold, M.; Goldstein, N.C.; Clarke, K.C. The spatiotemporal form of urban growth: Measurement, analysis and modeling. Remote Sens. Environ. 2003, 86, 286–302. [Google Scholar]
- Dewan, A.M.; Yamaguchi, Y. Land use and land cover change in Greater Dhaka, Bangladesh: Using remote sensing to promote sustainable urbanization. Appl. Geogr. 2009, 29, 390–401. [Google Scholar] [CrossRef]
- Dewan, A.M.; Kabir, H.; Nahar, K.; Rahman, Z. Urbanisation and environmental degradation in Dhaka Metropolitan Area of Bangladesh. Int. J. Environ. Sustain. Dev. 2012, 11, 118–147. [Google Scholar] [CrossRef]
- Alves, D.S.; Skole, D.L. Characterizing land cover dynamics using multi-temporal imagery. Int. J. Remote Sens. 1996, 17, 835–839. [Google Scholar] [CrossRef]
- Dewan, A.M.; Yamaguchi, Y. Using remote sensing and GIS to detect and monitor land use and land cover change in Dhaka Metropolitan of Bangladesh during 1960–2005. Environ. Monit. Assess. 2009, 150, 237–249. [Google Scholar] [CrossRef] [PubMed]
- Osman, T.; Arima, T.; Divigalpitiya, P. Measuring Urban Sprawl Patterns in Greater Cairo Metropolitan Region. J. Indian Soc. Remote Sens. 2016, 44, 287–295. [Google Scholar] [CrossRef]
- Osman, T.; Divigalpitiya, P.; Arima, T. Modeling urban growth scenarios in Cairo metropolitan region 2035. In Proceedings of the 14th International Conference on Computers in Urban Planning and Urban Management, Cambridge, MA, USA, 7–10 July 2015.
- Sims, D.; Sejoume, M.; Shorbagi, M. Understanding Slums, Case Studies for the Global Report 2003; German Technical and Financial Cooperation (GTZ): Cairo, Egypt, 2003. [Google Scholar]
- UNDP/INP. Egypt Human Development Report 2004: Choosing Decentralization for Good Governance Cairo; UNDP/Institute of National Planning: Cairo, Egypt, 2004. [Google Scholar]
- Denis, E. Urban Planning and Growth in Cairo; Middle East Report; Centre de Research et de Documentation Economique, Juridique, et Social (CEDEJ): Cairo, Egypt, 1997; Volume 27. [Google Scholar]
- Denis, E.; Sejourne, M. ISIS: Information System for Informal Settlements; Ministry of Planning: Cairo, Egypt, 2002. [Google Scholar]
- Osman, T.; Divigalpitiya, P.; Arima, T. Effect of Governmental Housing Regulations on the Egyptian Housing Market: Focusing on Greater Cairo Metropolitan Region. J. Architecture and Urban Des. 2015, 28, 1–9. [Google Scholar]
- Fang, S.; Gertner, G.Z.; Sun, Z.; Anderson, A.A. The impact of interactions in spatial distribution of the dynamics of urban sprawl. Landsc. Urban Plan. 2005, 73, 294–306. [Google Scholar] [CrossRef]
- Seto, K.C.; Sánchez-Rodríguez, R.; Fragkias, M. The new geography of contemporary urbanization and the environment. Ann. Rev. Environ. Resour. 2010, 35, 167–194. [Google Scholar] [CrossRef]
- Dewan, A.M.; Corner, R.J. Dhaka Megacity: Geospatial Perspectives on Urbanisation, Environment and Health; Springer: Dordrecht, The Netherlands, 2014; pp. 99–121. [Google Scholar]
- Stewart, D.J.; Yin, Z.Y.; Bullard, S.M.; MacLachlan, J.T. Assessing the spatial structure of urban and population growth in the Greater Cairo Area, Egypt: A GIS and imagery analysis approach. Urban Stud. 2004, 41, 95–116. [Google Scholar] [CrossRef]
- Japanese International Cooperation Agency (JICA). The Strategic Urban Development Master Plan Study for Sustainable Development of the Greater Cairo Region in the Arabic Republic of Egypt; Ministry of Housing and Urban Development: Cairo, Egypt, 2008; Volume 1. [Google Scholar]
- Tian, G.; Liu, J.; Xie, Y.; Yang, Z.; Zhuang, D.; Niu, Z. Analysis of spatiotemporal dynamic pattern and driving forces of urban land in China in the 1990s using TM images and GIS. Cities 2005, 22, 400–410. [Google Scholar] [CrossRef]
- Verburg, P.H.; Ritsema van Eck, J.; de Nijs, T.; Schot, P.; Dijst, M. Determinants of land-use change patterns in the Netherlands. Environ. Plan. B 2004, 31, 125–150. [Google Scholar] [CrossRef]
- Thapa, R.B.; Murayama, Y. Drivers of urban growth in the Kathmandu valley, Nepal: Examining the efficacy of the analytic hierarchy process. Appl. Geogr. 2010, 30, 70–83. [Google Scholar] [CrossRef]
- Mottet, A.; Ladet, S.; Coque, N.; Gibon, A. Agricultural land-use change and its drivers in mountain landscapes: A case study in the Pyrenees Agriculture. Ecosyst. Environ. 2006, 114, 296–310. [Google Scholar] [CrossRef]
- Saaty, T.L. The Analytic Hierarchy Process; McGraw-Hill: New York, NY, USA, 1980. [Google Scholar]
- Sudhira, H.S.; Ramachandra, T.V. Characterizing urban sprawl from remote sensing data and using landscape metrics. In Proceedings of the 10th International Conference on Computers in Urban Planning and Urban Management, Iguassu Falls, Brazil, 11–13 July 2007.
- Osman, T.; Arima, T.; Divigalpitiya, P. Tale of Slums in Cairo Region: Describing the actual gap between the unplanned and planned urban growth in the greater Cairo Metropolitan Region. J. Habitat Eng. Urban Des. 2014, 6, 83–93. [Google Scholar]
- Briassoulis, H. Analysis of land use change: Theoretical and modeling approaches. In The Web-Book of Regional Science; Jackson, W.R., Ed.; Regional Research Institute, West Virginia University: Morgantown, WV, USA, 2000. [Google Scholar]
- Hersperger, A.M.; Bürgi, M. Going beyond Landscape Change Description: Quantifying the Importance of Driving Forces of Landscape Change in a Central Europe Case Study. Land Use Policy 2009, 26, 640–648. [Google Scholar] [CrossRef]
- Zhang, T.W. Community features and urban sprawl: The case of the Chicago metropolitan region. Land Use Policy 2001, 18, S221–S232. [Google Scholar] [CrossRef]
- Wang, Z.Y.; Gao, H.Y. An Important Problem: Urban Sprawl. J. Northeast. Univ. 2005, 7, S391–S394. [Google Scholar]
- Deng, X.Z.; Zhan, J.Y.; Chen, R. The patterns and driving forces of urban sprawl in China. In Proceedings of the 2005 IEEE International Geoscience and Remote Sensing Symposium, Seoul, Korea, 25–29 July 2005.
- Li, Q.; Yang, K.Z. Urban Sprawl; Machinery Industry Press: Beijing, China, 2006. [Google Scholar]
- Nieman, T.J.; Meshako, D.S. An Analytical Approach to Weighting Attributes for Landscape Planning; University of Kentucky, Department of Horticulture and Landscape Architecture: Lexington, KY, USA, 1983. [Google Scholar]
- McDonald, G.T.; Brown, A.L. The land suitability approach to strategic land use planning in urban fringe areas. Landsc. Plan. 1984, 11, 125–150. [Google Scholar] [CrossRef]
- Banai, R. Fuzziness in geographical information systems: Contributions from the analytic hierarchy process. Int. J. Geogr. Inf. Syst. 1993, 7, 315–329. [Google Scholar] [CrossRef]
- Banai-Kashani, R. A new method for site suitability analysis: The analytic hierarchy process. Environ. Manag. 1989, 13, 685–693. [Google Scholar] [CrossRef]
- Miller, W.; Collins, M.G.; Steiner, F.R.; Cook, E. An Land-Use Suitability Analysis 619approach for greenway suitability analysis. Landsc. Urban Plan. 1998, 42, 91–105. [Google Scholar] [CrossRef]
- Malczewski, J. A GIS-based approach to multiple criteria group decision-making. Int. J. Geogr. Inf. Syst. 1996, 10, 955–971. [Google Scholar] [CrossRef]
- Xiang, W.N.; Whitley, D.L. Weighting land suitability factors by the PLUS method. Environ. Plan. B Plan. Des. 1994, 21, 273–304. [Google Scholar] [CrossRef]
- Collins, M. An Integrative Approach to Multi-objective Greenway Suitability Analysis. Master’s Thesis, Arizona State University, Tempe, AZ, USA, 1996. [Google Scholar]
- Wu, F. SimLand: A prototype to simulate land conversion through the integrated GIS and CA with AHP-derived transition rules. Int. J. Geogr. Inf. Sci. 1998, 12, 63–82. [Google Scholar] [CrossRef]
- Dey, P.K.; Gupta, S.S. Quantitative approach to impact assessment: A case study on cross-country petroleum pipeline project in India. In Proceedings of the 20th Annual Meeting of the International Association for Impact Assessment, Hong Kong, China, 19–23 June 2000.
- Dai, F.C.; Lee, C.F.; Zhang, X.H. GIS-based geo-environmental evaluation for urban land-use planning: A case study. Eng. Geol. 2001, 61, 257–271. [Google Scholar] [CrossRef]
- Uy, P.D.; Nakagoshi, N. Application of land suitability analysis and landscape ecology to urban greenspace planning in Hanoi, Vietnam. Urban For. Urban Green. 2008, 7, 25–40. [Google Scholar] [CrossRef]
- Sims, D. The Case of Cairo, Egypt UN Habitat, Global Report on Human Settlements 2003, the Challenge of Slums; Earthscan: London, UK, 2003. [Google Scholar]
- MOP and GTZ, (Ministry of Planning—German Technical and Financial Cooperation). New Practice of Participatory Local—Development in Egypt’s Urban Areas; Participatory Development Programme in Urban Areas (PDP): Cairo, Egypt, 2004. [Google Scholar]
- El-Hefnawi, A. Protecting agricultural land from urbanization or managing the conflict between informal urban growth while meeting the demands of the communities. In Proceedings of the 3rd Urban Research Symposium on Land Development, Urban Policy and Poverty Reduction, Brasilia, Brazil, 4–6 April 2005.
- Central Agency for Population, Mobilization and Statistics (CAPMAS). Census of Egypt, The Final Results: Population and Housing Census of the Year 2006; CAPMAS: Cairo, Egypt, 2008. [Google Scholar]
- Taylor, I. Survey Sample Sizes e How Many Respondents Do You Really Need? 2012. Available online: http://blog.questionpro.com/ author/thirdforce/ (accessed on 26 April 2012).
- Saaty, T.L. A scaling method for priorities in hierarchical structures. J. Math. Psychol. 1977, 15, 234–281. [Google Scholar] [CrossRef]
- Saaty, T.L. How to make a decision: The analytic hierarchy process. Eur. J. Oper. Res. 1990, 48, 9–26. [Google Scholar] [CrossRef]
- Boroushaki, S.; Malczewski, J. Implementing an extension of the analytical hierarchy process using ordered weighted averaging operators with fuzzy quantifiers in ArcGIS. Comput. Geosci. 2008, 34, 399–410. [Google Scholar] [CrossRef]
- Buckley, J.J. Fuzzy hierarchical analysis. Fuzzy Sets Syst. 1985, 17, 233–247. [Google Scholar] [CrossRef]
- Malczewski, J. GIS and Multicriteria Decision Analysis; John Wiley & Sons: New York, NY, USA, 1999. [Google Scholar]
- Buckley, J.J.; Feuring, T.; Hayashi, Y. Fuzzy hierarchical analysis revisited. Eur. J. Oper. Res. 2001, 129, 48–64. [Google Scholar] [CrossRef]
- Gordon, C.; Cindy, W. A note on the analysis of subjective judgment matrices. J. Math. Psychol. 1985, 29, 387–405. [Google Scholar]
- Barzilai, J. Deriving weights from pairwise comparison matrices. J. Oper. Res. Soc. 1997, 48, 1226–1232. [Google Scholar] [CrossRef]
- Osman, T.; Arima, T.; Divigalpitiya, P. Dynamism generated by alternative use of space in the unplanned settlements of Greater Cairo Metropolitan Region. In Proceedings of the 2013 International Symposium on City Planning, Sendai, Japan, 23 August 2013.
- General Organization of Physical Planning (GOPP). Project of Development Plans for Egyptian Villages; Ministry of Housing: Cairo, Egypt, 2005. [Google Scholar]
- General Organization of Physical Planning (GOPP). The National Urban Development Plans in the Arab Republic of Egypt, Ministry of Housing; GOPP: Cairo, Egypt, 2009. [Google Scholar]
- Osman, T.; Divigalpitiya, P.; Arima, T. Driving Factors of Urban Sprawl in Giza Governorate of the Greater Cairo Metropolitan Region Using a Logistic Regression Model. Int. J. Urban Sci. 2016, in press. [Google Scholar] [CrossRef]
- Marc, A. Why landscapes of the past are important for the future. Landsc. Urban Plan. 2005, 70, 21–34. [Google Scholar]
- Hersperger, A.M.; Burgi, M. Driving forces of landscape change in the urbanizing Limmat valley, Switzerland. In Modelling Land-Use Change; Koomen, E., Stillwell, J., Bakema, A., Scholten, H.J., Eds.; Springer Netherlands: Berlin, Germany, 2007; pp. 45–60. [Google Scholar]


| Driving Factors | Descrition |
|---|---|
| Administrative function | Cairo, as a capital of Egypt, is the head of the administrative and political system in Egypt. In previously socialist countries like Egypt, high administrative function means more facilities, jobs, business opportunities, and an easier life. A higher administrative rank leads to more facilities, so the capital is the best place to live, the city is more attractive than native villages, and small villages are the worst place to live. |
| Population increase | High population growth (2.2%/year) in the region puts more pressure on finite potentials by asking for more life facilities, eventually resulting in land use alterations. |
| Economic incentives | Cairo, as a prime economic center of Egypt, identifies diverse high-paying business and job opportunities in the medical, educational, tourism, financial, manufacture, and commercial sectors. |
| Availability of life facilities | The facilities and services obtainable in the region are potable water, medical services, electricity, transportation, entertainment facilities, commercial, waste disposal, and education. The concentration of these facilities may vary by place. |
| Development plans | The efficaciousness of zoning, land improvements, land integration, pilot land projects, economic and exploitation plans of the government was investigated. |
| Geographical characteristics | Geographical location characteristics as nearest to centers, regional roads, the Nile river, etc.; soils and topography are executing a role in IU and land use alterations. |
| Land demand and supply | Land speculators, real estate contractors, and local residents in Cairo are very active in acquiring undeveloped land, then developing the land and offering it on the real estate market. |
| Intensity of Significance | Verbal Assessment of Preference |
|---|---|
| 1 | Equal significance |
| 3 | Moderate significance |
| 5 | Strong significance |
| 7 | Very strong significance |
| 9 | Extreme significance |
| 2, 4, 6, 8 | Moderate rates between adjacent scale rates |
© 2016 by the authors; licensee MDPI, Basel, Switzerland. This article is an open access article distributed under the terms and conditions of the Creative Commons Attribution (CC-BY) license (http://creativecommons.org/licenses/by/4.0/).
Share and Cite
Osman, T.; Divigalpitiya, P.; Arima, T. Quantifying the Driving Forces of Informal Urbanization in the Western Part of the Greater Cairo Metropolitan Region. Environments 2016, 3, 13. https://doi.org/10.3390/environments3020013
Osman T, Divigalpitiya P, Arima T. Quantifying the Driving Forces of Informal Urbanization in the Western Part of the Greater Cairo Metropolitan Region. Environments. 2016; 3(2):13. https://doi.org/10.3390/environments3020013
Chicago/Turabian StyleOsman, Taher, Prasanna Divigalpitiya, and Takafumi Arima. 2016. "Quantifying the Driving Forces of Informal Urbanization in the Western Part of the Greater Cairo Metropolitan Region" Environments 3, no. 2: 13. https://doi.org/10.3390/environments3020013