Article

Exploiting High Resolution Multi-Seasonal Textural Measures and Spectral Information for Reedbed Mapping

by
Alex Okiemute Onojeghuo
1,2,*,† and
George Alan Blackburn
1,†
1
Department of Geography, Lancaster Environment Centre, Lancaster University, Lancaster LA1 4YQ, UK
2
Department of Surveying and Geoinformatics, Nnamdi Azikiwe University, Awka, Anambra State 420110, Nigeria
*
Author to whom correspondence should be addressed.
These authors contributed equally to this work.
Environments 2016, 3(1), 5; https://doi.org/10.3390/environments3010005
Submission received: 22 January 2016 / Revised: 19 February 2016 / Accepted: 22 February 2016 / Published: 25 February 2016

Abstract

:
Reedbeds across the UK are amongst the most important habitats for rare and endangered birds, wildlife and organisms. However, over the past century, this valued wetland habitat has experienced a drastic reduction in quality and spatial coverage due to pressures from human related activities. To this end, conservation organisations across the UK have been charged with the task of conserving and expanding this threatened habitat. With this backdrop, the study aimed to develop a methodology for accurate reedbed mapping through the combined use of multi-seasonal texture measures and spectral information contained in high resolution QuickBird satellite imagery. The key objectives were to determine the most effective single-date (autumn or summer) and multi-seasonal QuickBird imagery suitable for reedbed mapping over the study area; to evaluate the effectiveness of combining multi-seasonal texture measures and spectral information for reedbed mapping using a variety of combinations; and to evaluate the most suitable classification technique for reedbed mapping from three selected classification techniques, namely maximum likelihood classifier, spectral angular mapper and artificial neural network. Using two selected grey-level co-occurrence textural measures (entropy and angular second moment), a series of experiments were conducted using varied combinations of single-date and multi-seasonal QuickBird imagery. Overall, the results indicate the multi-seasonal pansharpened multispectral bands (eight layers) combined with all eight grey level co-occurrence matrix texture measures (entropy and angular second moment computed using windows 3 × 3 and 7 × 7) produced the optimal reedbed (76.5%) and overall classification (78.1%) accuracies using the maximum likelihood classifier technique. Using the optimal 16 layer multi-seasonal pansharpened multispectral and texture combined image dataset, a total reedbed area of 9.8 hectares was successfully mapped over the three study sites. In conclusion, the study has demonstrated the value of utilizing multi-seasonal texture measures and pansharpened multispectral data for reedbed mapping.

1. Introduction

The need for an effective, accurate and robust system designated for wetland mapping is a crucial tool for agencies charged with the responsibility of protecting and managing such delicate habitats. Reedbed habitats in the UK have been identified as a priority habitat for most regional Biodiversity Partnerships, thus making the mapping of this threatened wetland habitat crucial. The regional Biodiversity Partnership was set up across different regions of the UK as part of Britain’s response to ratifying the Convention on Biological Diversity following the Rio Earth Summit in 1992. It delivers a wide range of biodiversity conservation, communication and public education across different local areas. The partnership usually comprises of a number of organizations drawn from one (or more) local authority area with contributions from national agencies or local biodiversity authorities. Such information is vital in developing suitable management plans for the conservation and expansion of reedbed sites across the UK. Because reedbeds tend to exist as small patches across large landscapes, there is need to use high resolution satellite data containing sufficient spectral information for its mapping. The availability of high resolution satellite data, such as IKONOS or QuickBird imagery, has facilitated the mapping of wetlands and other land-cover types [1,2,3,4,5], and proven to be an effective and cost efficient method of mapping [6]. However, the mapping of different land-cover types having similar spectral responses is an issue that has restricted the use of single-date image datasets [7]. Studies have shown that using multi-seasonal images could improve the accuracy of image classification owing to the amount of phenological data contained in the vegetation cover [7,8,9,10,11,12,13,14,15,16]. Davranche et al. [10] combined multi-seasonal reflectance data contained in SPOT-5 images with field campaign data to estimate the area of marshes covered with common reeds (Phragmites austrillis) and other submerged land cover types.
The use of fine spatial information contained in high resolution satellite data has proven to be valuable for land-cover classification systems in areas with complex landscapes. In particular, textural measures, such as gray level co-occurrence matrix (GLCM) measures [17,18], have been shown to improve image classification accuracies when combined with spectral ones [19,20,21,22,23,24,25,26,27]. As demonstrated by Onojeghuo and Blackburn [28], the combination of GLCM texture images and multispectral data was shown to significantly improve the delineation of reedbed habitats from surrounding land cover classes. The study indicated that the most effective texture measures for reedbed mapping using high resolution QuickBird imagery were entropy and angular second moment. However, the study was limited to the use of a single image data set and concentrated on further refinement using other datasets such as elevation models and implementing the use of spectral degradation to minimize noise and consequently improve classification accuracy. This current research goes a step further, as it aims to investigate in more detail the place of multi-seasonal textural and spectral information in reedbed mapping.
Several studies have compared the performance of different classifiers such as the maximum likelihood classifier (MLC), artificial neural network (ANN) or spectral angular mapper (SAM) in classifying single-date and multi-seasonal images. Murthy et al. [13], for example, compared the performance of MLC and ANN for the classification of wheat crops using multi-seasonal images. Two approaches to classification were evaluated, namely: (1) MLC with different strategies: sequential MLC, MLC with Principal Components and iterative MLC; and (2) ANN with the back-propagation method. The ANN method was found to perform best for this application. In other studies, Principal Component Analysis (PCA) has been successfully used to derive thematic information from multi-temporal images [29]. Furthermore, SAM has been used in numerous studies [30,31,32,33,34] which have demonstrated the advantages of this classifier in terms of its speed and ease in mapping spectral similarity between the image and reference spectra. Nevertheless, despite the extensive testing of these classification approaches, no particular technique has emerged as the universal optimum and there remains the need to identify the most effective method for specific application. Consequently, this study aimed to develop a methodology for accurately mapping reedbed through the combined use of multi-seasonal texture measures and spectral information contained in high resolution QuickBird satellite imagery. The objectives of the study included:
(1)
to determine the most effective single-date (autumn or summer) and multi-seasonal QuickBird imagery suitable for reedbed mapping over the study area;
(2)
to evaluate the effectiveness of combining multi-seasonal texture measures and spectral information for reedbed mapping using a variety of combinations; and
(3)
to evaluate the most suitable classification technique for reedbed mapping from three selected classification techniques, namely maximum likelihood classifier, spectral angular mapper and artificial neural network back propagation technique.

2. Materials and Methods
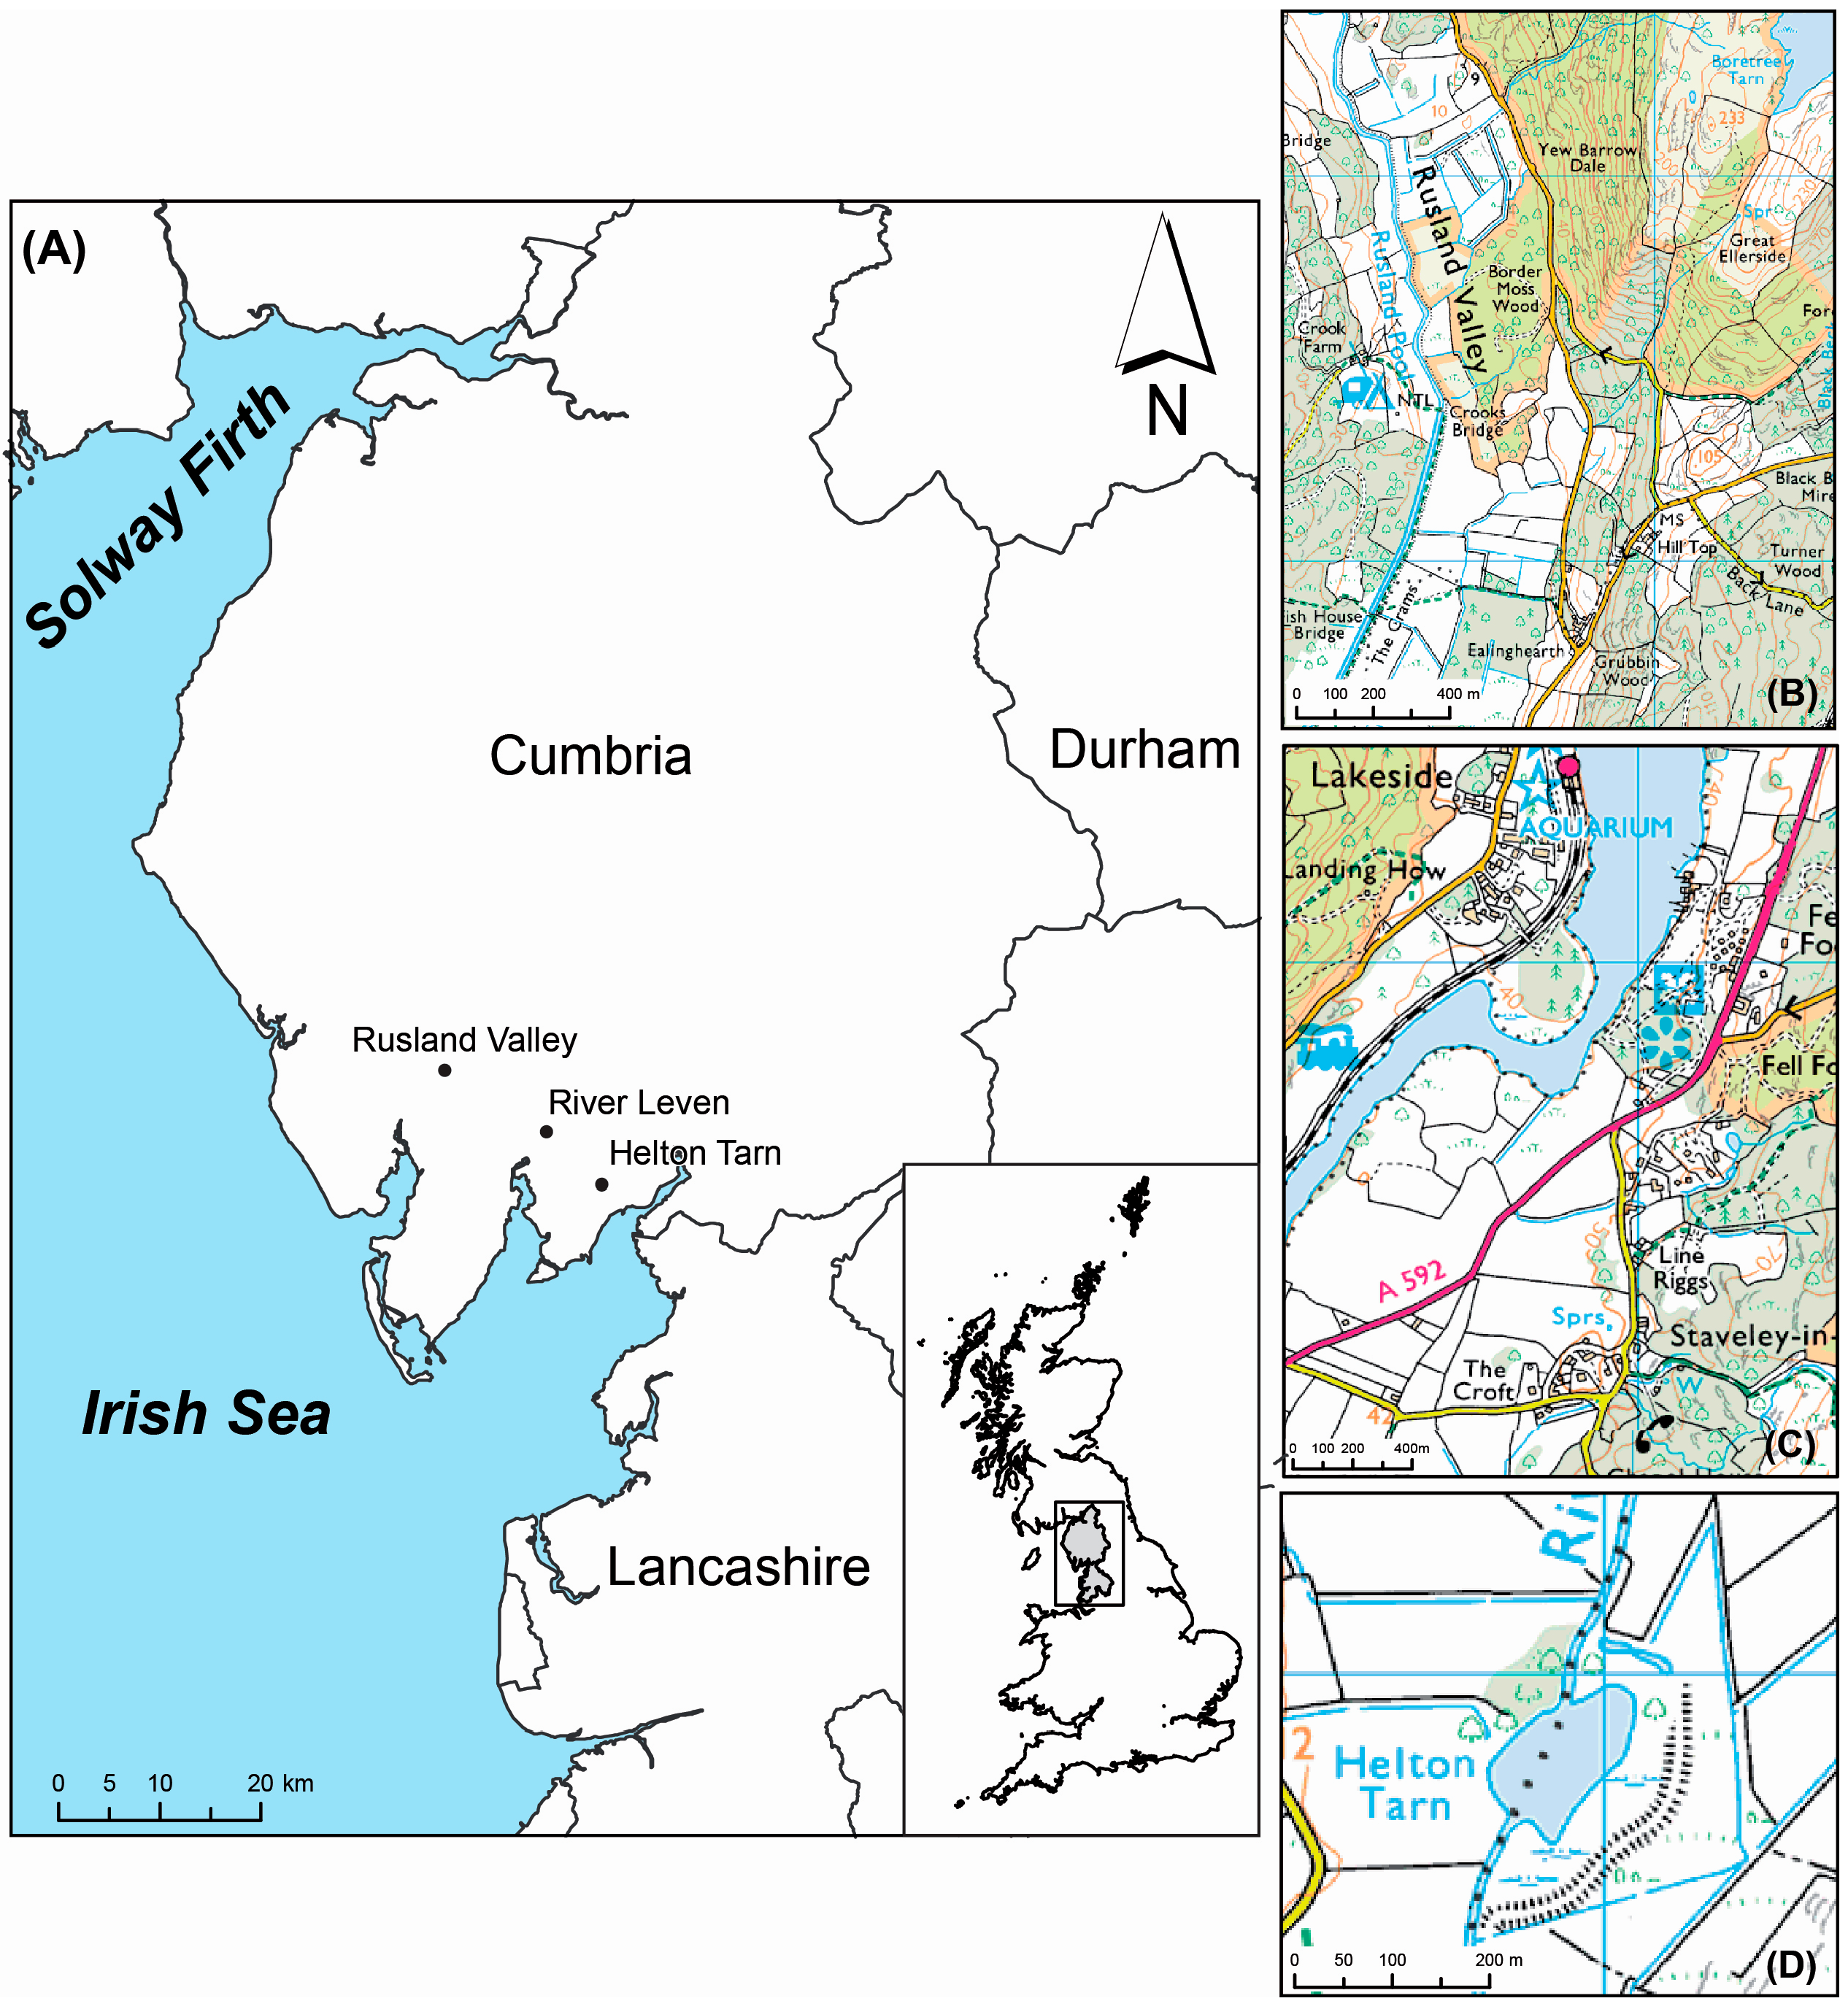
2.1. Study Areas

In this study, three key sites of interest were investigated, namely: River Leven situated in Cumbria, NW England (2°29′ W, 54°21′ N) with an approximate land mass of 300 hectares (ha) is dominated by a distribution of small reedbed patches spread across the landscape; Rusland Valley (3°00′ W, 54°16′ N) and Helton Tarn (2°53′ W, 54°15′ N) respectively, each with an area of 300 and 34 ha (Figure 1). The three sites were selected based on the extent and diversity of reedbed identified from existing information held by the Cumbria Wildlife Trust and Environment Agency. Some of the key reedbed sites include: Crook Moss, Chapel Beck, Miller Beck, South Windermere, Newbly Bridge, Rusland Moss, Hulleter Moss and Helton Tarn. These reedbed sites incorporate a range of combinations of different plant species existing alongside the dominant reed species Phragmites austrillis and Phalaris arundinacea, making these useful areas for testing remotely sensed mapping methods.

2.2. Satellite Image Acquisition and Processing

The remotely sensed data used for the study were high resolution QuickBird sensor panchromatic (0.6 m) and multispectral (2.4 m) images acquired over the same area in late autumn (5 November 2008) and early summer (1 June 2009), respectively. The basis for these dates were aimed to depict distinct phonological stages of reedbed habitats in comparison to surrounding land cover types as demonstrated in Ouyang et al. [35]. The autumn imagery represented the reedbed during the leaf-off stage while the early summer image represented reeds in the early stage of leaf development.
The QuickBird imagery for both dates were re-projected from WGS 84 coordinate system to the British National Grid and geometrically corrected using a rational polynomial coefficients (RPC) geometric model. The RCP file contained coefficients which are based on the satellite position during image capture. The final georectification of the multispectral and panchromatic images was done using 10 evenly spread ground control points extracted from the Ordnance Survey (OS) reference map. The root mean square (r.m.s) error results for the autumn panchromatic and multispectral images were 0.32 and 0.11, while the summer r.m.s values were 0.12 and 0.28, respectively. The images were radiometrically corrected, and a dark object subtraction [36] was applied to reduce atmospheric effects before they were used for further analysis. Using individual panchromatic bands for both dates, each multispectral image was pan-sharpened using the resolution merge tool in ERDAS Imagine [37] and subsequently used for analysis in the study.
The data used for training and testing were collected using a combination of methods and sources, namely: DGPS field positions, Phase 1 habitat survey base-map, recent Ordnance Survey (OS) vector maps, aerial photographs and the QuickBird image (for visual interpretation of certain features such as cloud and shadow only). Pixels for training and testing the classifier were independent of each other and randomly selected. The process of sampling was performed using a stratified random sampling approach. This approach was selected as it allows for a proper representation of key land cover types within the study area. With stratified random sampling, the allocation of a larger amount of strata with more variance and a smaller sample size of strata with less variance is achievable. Hence, the approach allows for a more precise representation of ground verification samples during data acquisition for ground truthing and training. The land cover types used as strata for this study were extracted from existing Phase 1 habitat survey base-maps and OS vector maps covering the study area. The training and testing dataset used for processing the single-date images (autumn and summer) for the main study site were 589 polygons and 521 points, respectively, while the training and testing dataset common to both single-date images used for the multi-seasonal image classification were 459 polygons and 498 points. The sampling scheme used in the study was a simple random selection, an unbiased selection procedure with excellent statistical properties [38,39].

2.3. Texture Measures Calculation

The texture measures used in the study were the GLCM angular second moment (glcm4) and entropy (glcm5) (Equations (1) and (2)):
e n t r o p y   ( g l c m 4 ) = i , j P ( i , j ) log P ( i , j )
a n g u l a r   s e c o n d   m o m e n t   ( g l c m 5 ) = i , j P 2 ( i , j )
where P(i,j) are elements of the co-occurrence matrix space; P(i), P(j) are the row and column values of the co-occurrence matrix, respectively.
The optimal window sizes for calculating entropy (glcm4) and angular second moment (glcm5) were based on semivariograms derived from sub-scenes of panchromatic images over the major land cover types (i.e., broadleaved forest, coniferous forest, improved grassland and marshy grassland and reedbeds) mapped in this study.
The semivariograms for major land cover types indicated reedbeds, improved grasslands and marshy grasslands started to saturate at lag distance of 3, while coniferous and broadleaved forest saturated at lag distance of 7 (Figure 2). Based on these results, the window sizes 3 × 3 and 7 × 7 were selected for computing glcm3 and glcm4 textural measures. The aforementioned GLCM texture measures were calculated from four directions (0°, 45°, 90°, 135°) of a co-occurrence matrix and the corresponding mean of all four directions was used as the output.
The outputs from each texture measures (entropy—glcm4 and angular second moment—glcm5) were combined with the corresponding pan-sharpened multispectral image of each date, and a series of classifications performed using supervised training and MLC. In addition, principal component analysis was applied to different combinations of the texture measures generated using both window sizes. The resulting first and second principal component images were combined with the pansharpened multispectral data for classification. A detailed description of the datasets generated for classification and methodology used is presented in the following section.

2.4. Texture Measures Calculation

Table 1 describes the image datasets used for the single-date and multi-seasonal image classifications. The image datasets used in this study comprised of single-date images (autumn and summer) and multi-seasonal imagery. Additional multi-seasonal image datasets were generated using PCA transformation and image differencing, respectively. The PCA transformation was applied to the GLCM textural measures entropy and angular second moment computed using windows 3 × 3 and 7 × 7 for each single date image (autumn and summer). The first two PC bands, PC1 and PC2, of the GLCM texture measures were subsequently combined with the pan sharpened multispectral bands of each single date image. Amongst the multi-seasonal image datasets evaluated in this study was the combination of the eight multispectral bands of both dates and PC bands 1–4 of GLCM texture measures—entropy and angular second moment computed using windows 3 × 3 and 7 × 7 for autumn and summer. All the PC bands selected in each phase of the study represented over 98% of the information contained in original image datasets before PCA transformation was applied. The difference images of the autumn and summer image datasets were classified.
The single-date and multi-seasonal image datasets were classified using the supervised classifier MLC. The MLC was performed using a decision rule which operates based on the probability that a pixel belongs to a particular class. For this study, the assumptions of the maximum likelihood parametric rule, which are that the probabilities for all the classes are equal and the input bands have normal distributions, were satisfied. The output land-cover types identified in the study included broadleaved forests, built-up areas (comprising of roads and buildings), coniferous forests, improved grassland, marshy grassland, reedbeds, water bodies, shadow and cloud cover.

2.5. Evaluating Image Classification Techniques for Reedbed Mapping

The optimal multi-seasonal image identified using the MLC technique was further evaluated using the ANN and SAM classifiers in order to determine the best classifier for reedbed mapping. The ANN analysis was performed using a Multi-Layer Perceptron (MLP) hard classifier algorithm using back-propagation (this shall be referred to as ANN in further sections of the paper). The ANN network architectures used in this study consisted of 16 input units (eight QuickBird multispectral bands for autumn and summer plus relevant texture measures computed using panchromatic images for both dates). A single hidden layer with 16 nodes and an output layer of eight nodes representing each class were used. The network was trained with a learning rate of 0.01 and learning momentum of 0.7, to ensure stable learning. The network was trained until the RMSE was minimised, after 20,000 cycles. A sigmoid function constant of 1 was used and the acceptable RMSE set to 0.0001. The training and testing RMSE were 0.0007 and 0.0015 respectively, while the accuracy rate of the network was 93%. These parameters were selected after a series of rigorous tests using different parameter settings. For the SAM classification algorithm, the endmember spectra used were extracted directly from the image as a region of interest (ROI) average spectra. The ROI files were generated from the training dataset. The ArcGIS polygon shapefiles were imported as vectors and used to extract the endmembers. A series of maximum thresholds ranging from 6 to 90 degrees (0.10–1.57 radians) were set as thresholds in the single value mode of the SAM classifier and the optimal threshold for reedbed and other land cover classification identified.

2.6. Accuracy Assessment

In this study, the reedbed user’s and overall accuracies were used as measures of estimating the quality of reedbed mapping. The user’s accuracy was selected as it provides vital insight as to the level of classification accuracy from the user’s perspective, identifying within a classified map the number of pixels that actually represent the class it depicts. Also, the Kappa discrete multivariate analysis technique was used to statistically assess the accuracy of the different classification error matrices generated in the study [40], while the Z statistic was used to test for significant differences [41,42,43,44,45]. This method calculates the difference between the kappa coefficients of two classifications and divides this by the square root of the sum of variances of both classifications. This test statistic is employed for testing if two independent error matrices are significantly different as is the case in this study. The Z-values larger than 1.96 and 2.58 (positive or negative) indicated that two classification results were significantly different at the 95% and 99% confidence levels, respectively.

3. Results and Discussion

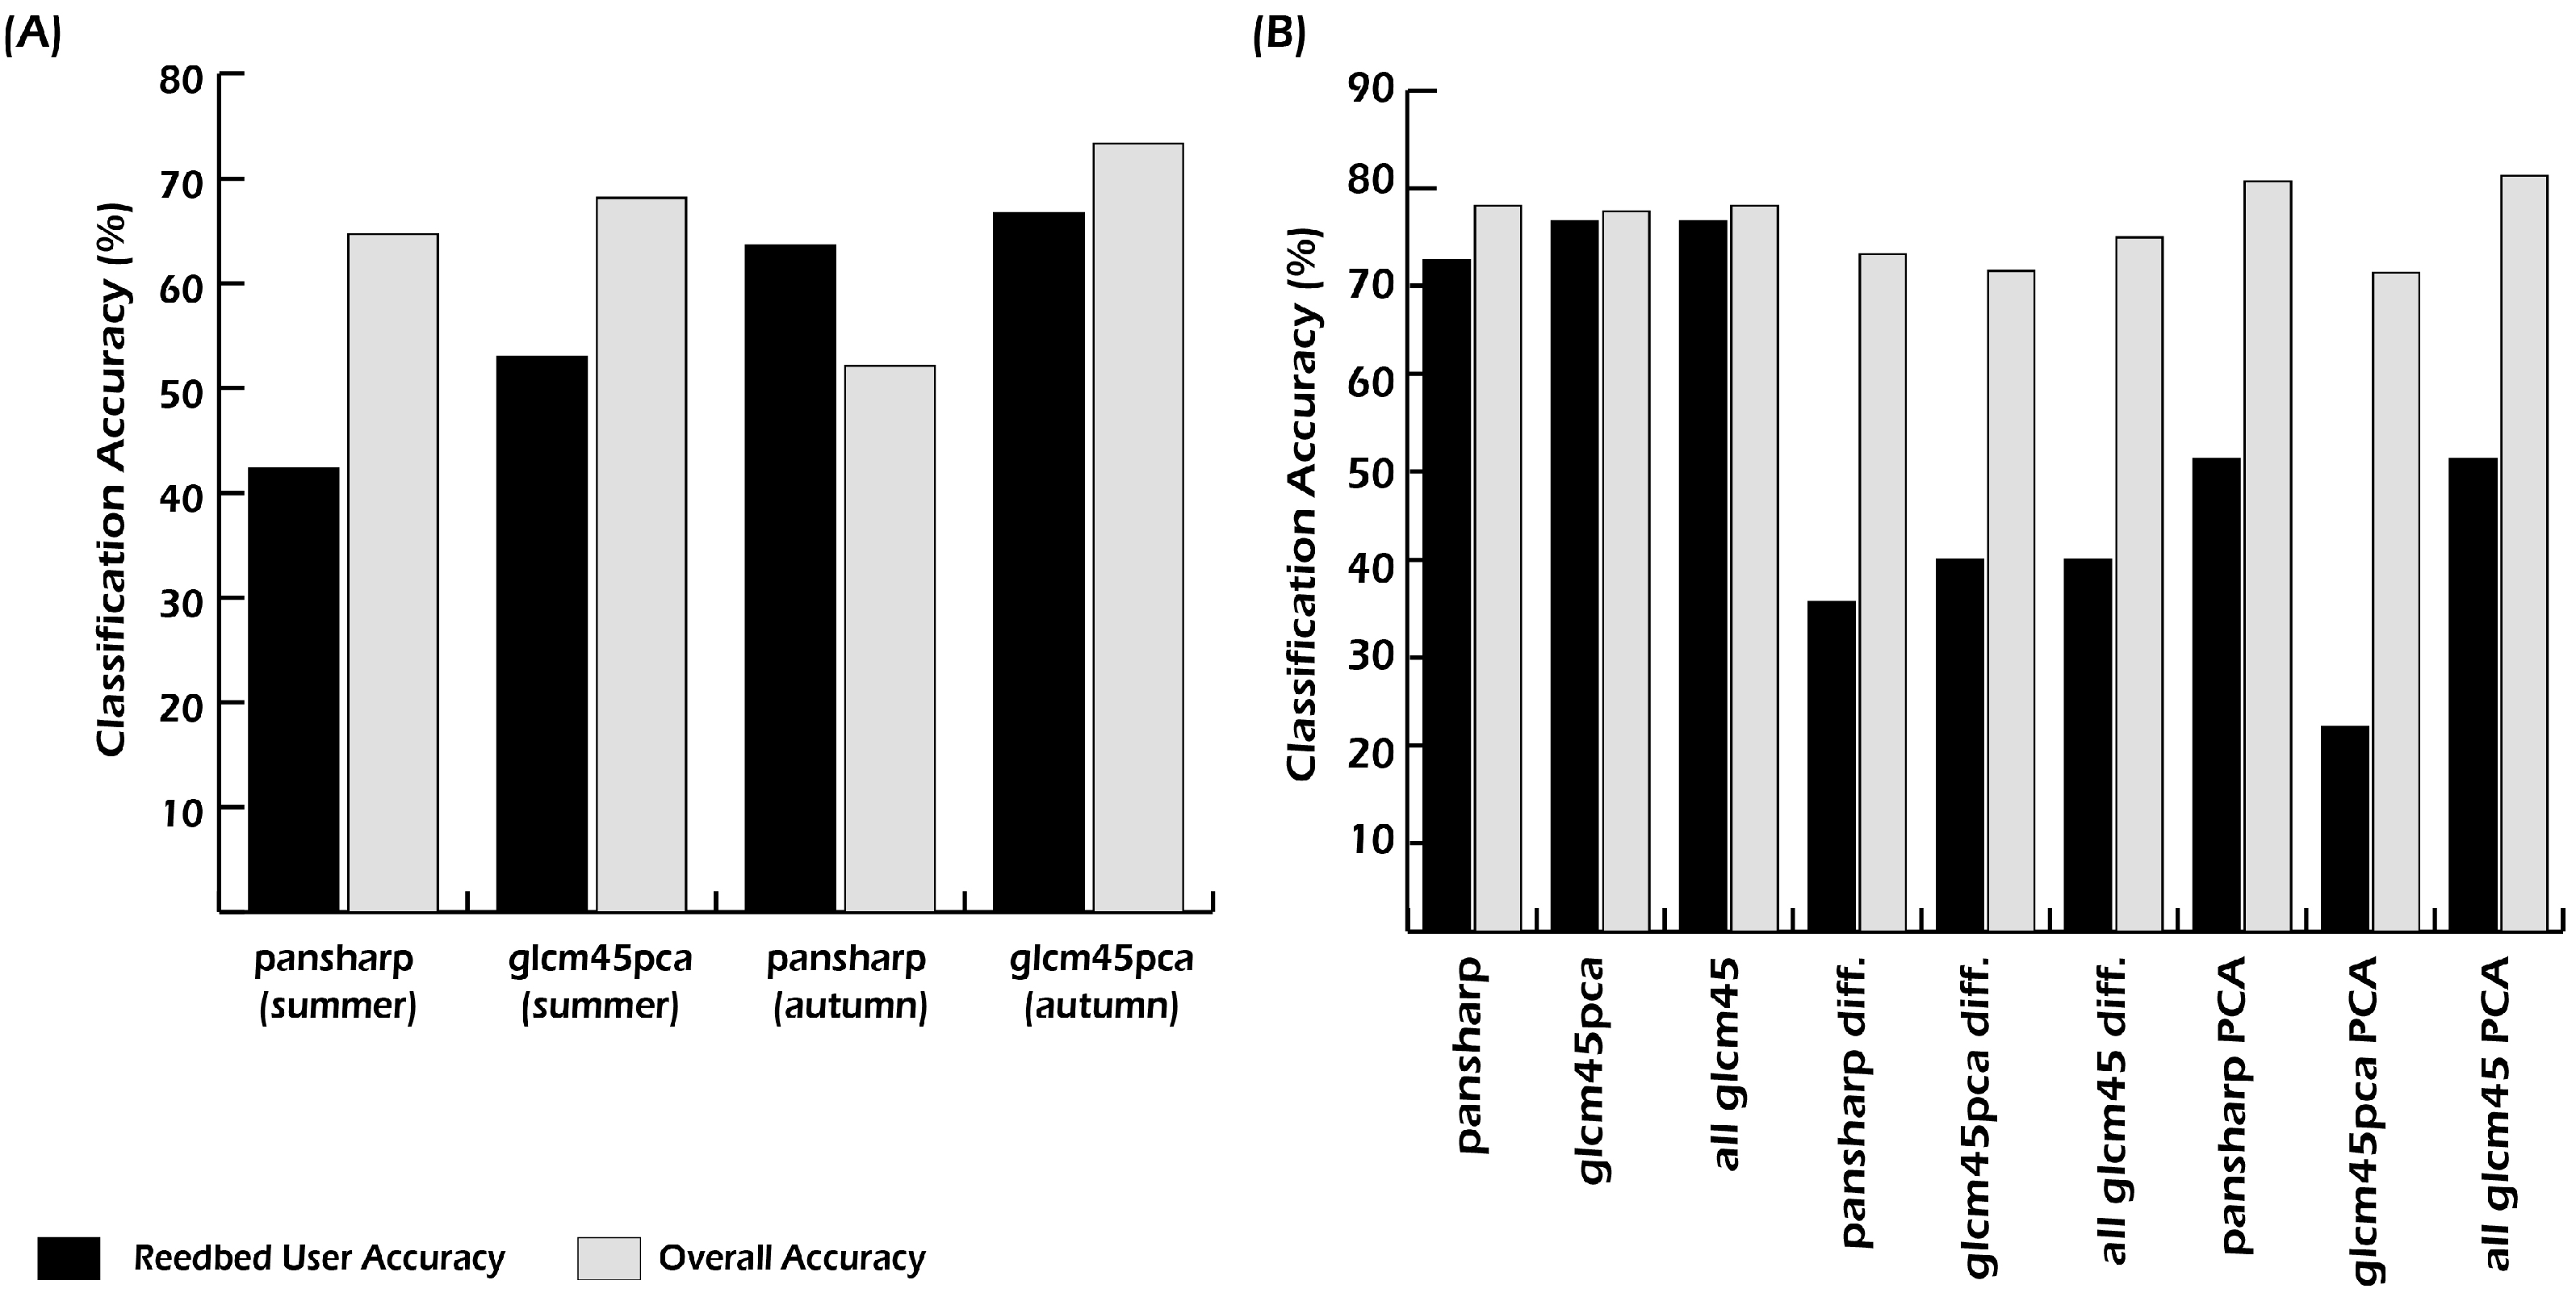
3.1. Single-Date Classification Accuracies

Figure 3A,B shows the classification accuracies achieved overall and for reedbed specifically when applying the MLC technique to the single-date and multi-seasonal image datasets, respectively. Table 2 present the accuracy assessment results for single-date classifications. The results show that for both dates, inclusion of textural measures increased the reedbed user’s and overall accuracies, respectively. These results are in agreement with results obtained in previous studies [19,20,21,22,24,25,26,27,46] which demonstrated that adding textural measures to spectral information increases the classification accuracy of land use and cover mapping. The results of statistical tests, shown in Table 3, revealed the combination of spectral information and texture measures for the single-date image datasets significantly increased the reedbed (99% confidence level) and overall classification (95% confidence level) accuracies compared to using only spectral information contained in the pansharpened image datasets. For the single-date pansharpened and texture combined image datasets, the statistical tests show that reedbed accuracy of the autumn image i.e., glcm45pca (autumn) was significantly higher (99% confidence interval) than the glcm45pca (summer) image, an increase of 15%. However, the overall classification accuracy of both single-date pansharpened and texture combined image datasets was not significantly different for the autumn and summer image datasets, being 70.2% and 70.0%, respectively.
Hence, the implication of the significance tests and classification accuracies for the reedbed and other land-cover types was that the autumn pansharpened and texture combined image dataset was the most effective single-date image for classification. The higher reedbed accuracy could be attributed to timing of the reedbed growth cycle when the image was acquired. During early autumn, the reedbed canopy is characterised by a mixture of dry stems and leaves with purple-brown panicles, a sharp contrast to that of surrounding wetland vegetation types and other land cover types. However, in early summer, the reedbed canopy and surrounding wetland vegetation are both dominated by photosynthesizing leaves which makes it difficult to spectrally differentiate reeds from other surrounding vegetation.

3.2. Comparison of MLC Single-Date and Multi-Seasonal Classification Accuracies

The results of the multi-seasonal image classification experiment (Table 4 and Figure 3B) indicated that the multi-seasonal pansharpened and texture combined image comprising of 16 layers (eight spectral and the eight GLCM texture measures) had the best combination of reedbed accuracy and overall classification accuracy, which were 76.5% and 78.1%, respectively. These results indicated that the optimal multi-seasonal image was more effective than the single-date images for reedbed delineation and general land-cover mapping. The increased performance of the multi-seasonal images could be attributed to the quality of phenological data contained in the combination of the two single-date images [7,11,47,48]. Guerschman et al. [7] observed that at a particular date, for two land cover types that have similar biophysical properties or are at the same phenological stage, the use of spectral data for discrimination would be low. However, the use of more than one satellite image would enhance the classification accuracy because it contains subtle phenological differences that are vital in discriminating between different land cover types during image classification.

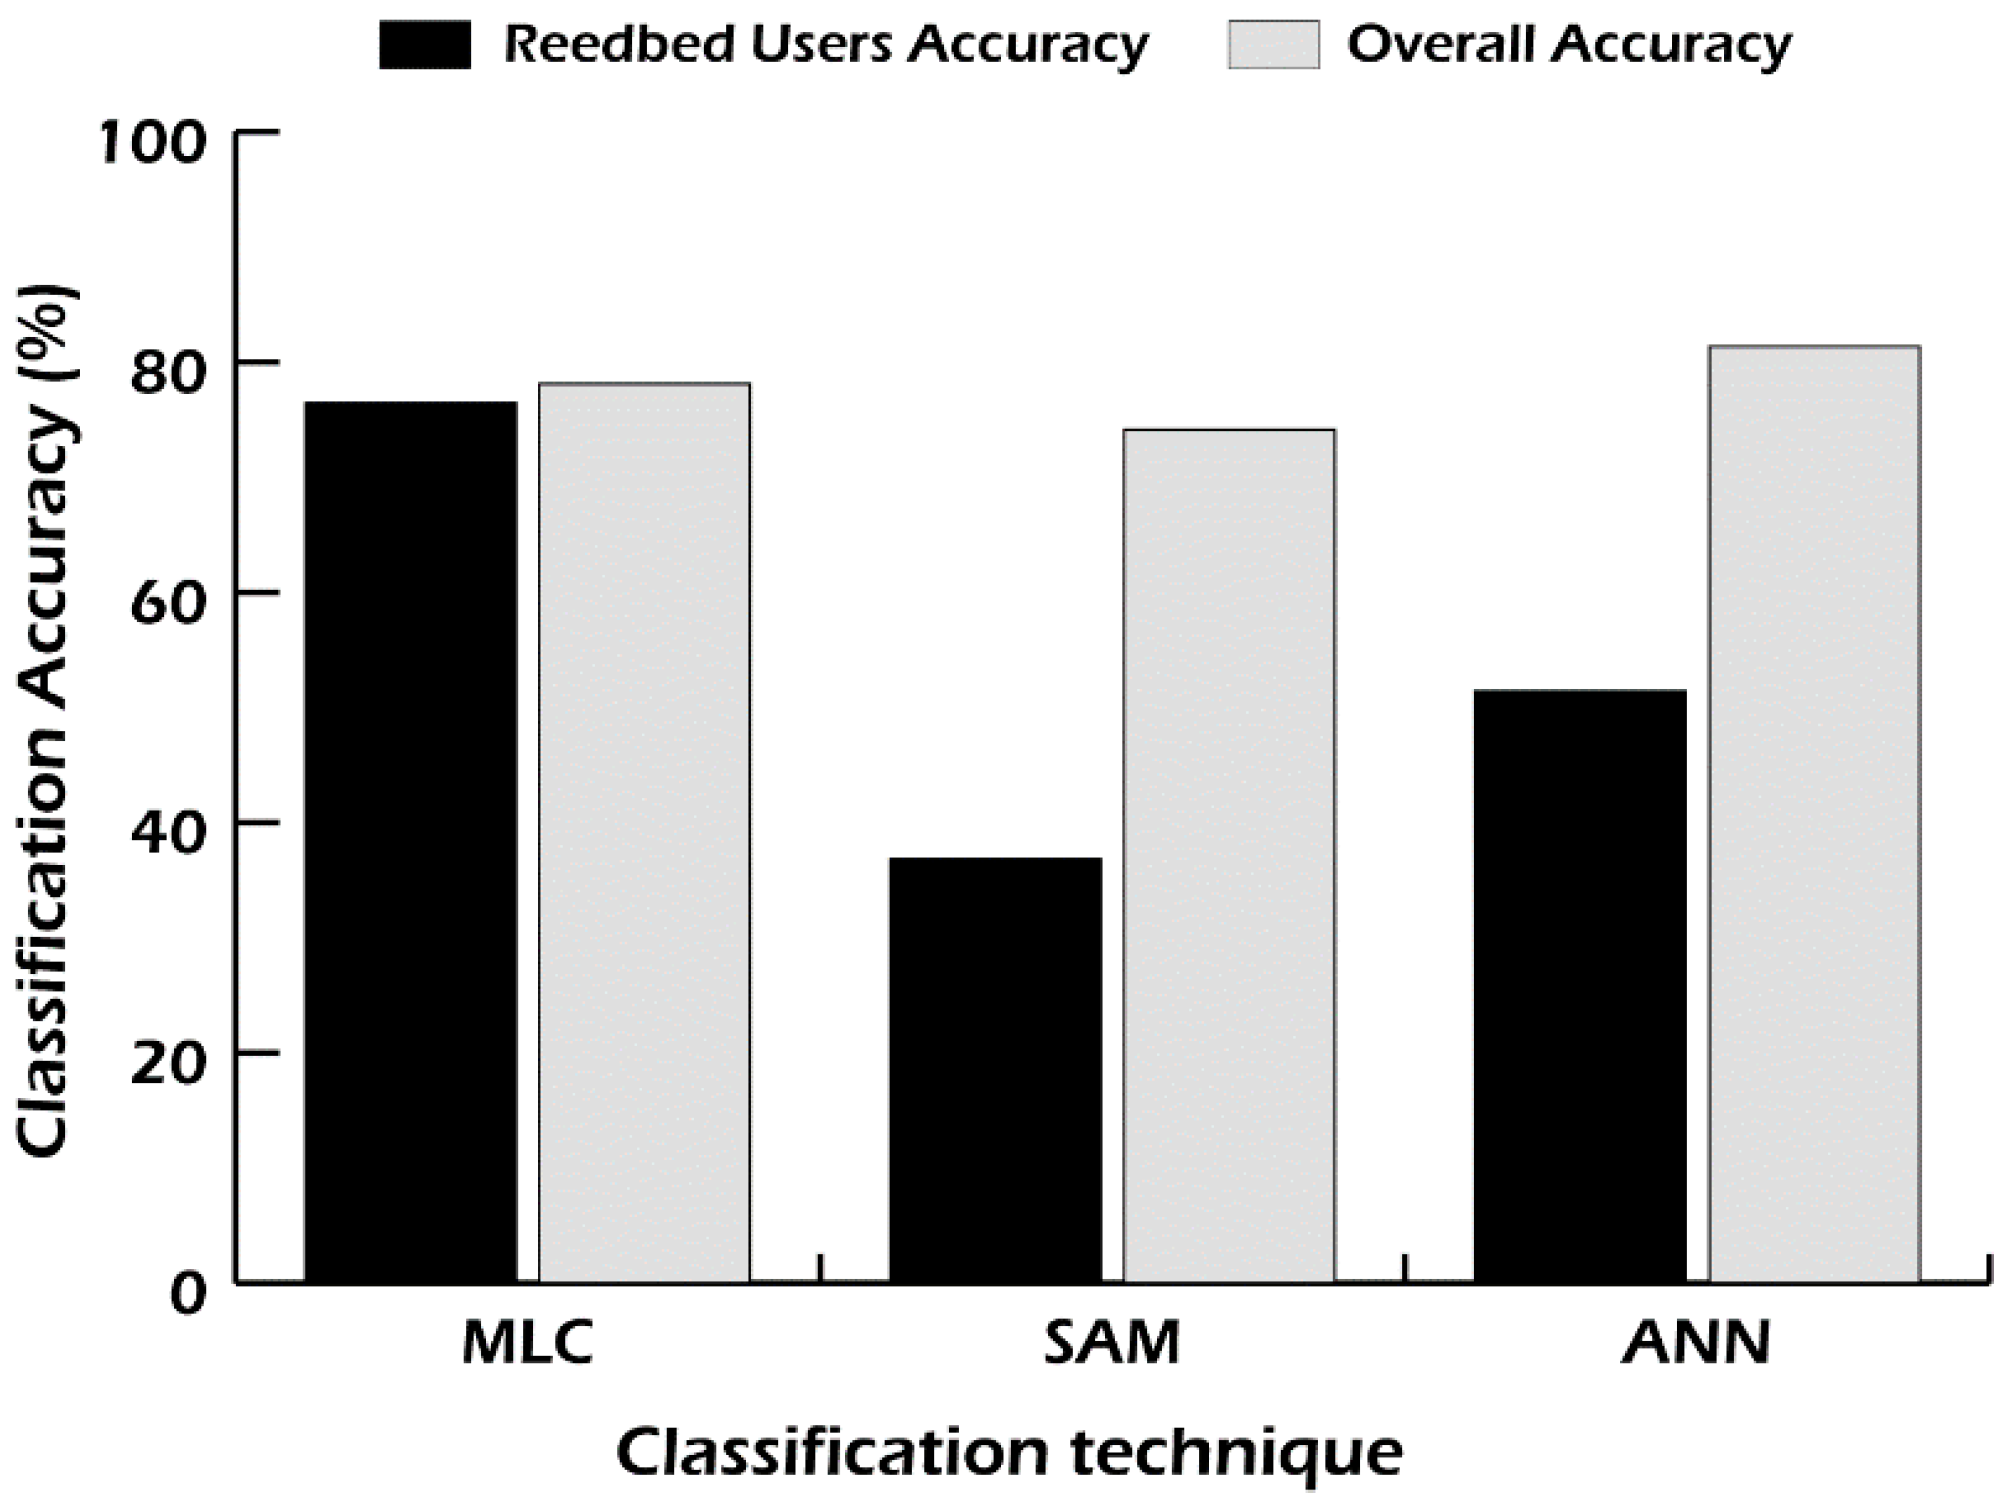
3.3. Comparison of Classification Techniques Using Optimal Multi-Seasonal Dataset

The MLC derived optimal multi-seasonal dataset was evaluated further using two other classifiers, namely ANN and SAM. The results show that the ANN classifier had the highest overall classification accuracy of 85%, followed by MLC (84%) and SAM (77%), respectively (Figure 4). In this study, the effectiveness of the back propagation ANN classifier for the overall classification was similar to results obtained by Murthy et al. [13]. The classifier with the highest reedbed accuracy was the MLC (76.5%), while the ANN and SAM classifiers were 51.4% and 36.8%, respectively. A similar trend is demonstrated in Dai and Liu [49] in which the authors evaluated the performance of six classifiers: MLC, support vector machine (SVM), ANN, SAM, minimum distance classifier (MD) and decision tree classifier (DTC). Using the same number of training and testing data for classification and accuracy assessment, four broad classes (broadleaved forest, scrubland, cropland and water bodies) were accurately mapped and the order of performance was as follows: SVM (91.2%), MLC (90.5%), DTC (87.4%), ANN (83.3%), SAM (80.3%) and MD (76.9%). The three top classification techniques in the order of performance that overlapped with this current study were MLC, ANN and SAM (similar to earlier reported results).
In addition to accuracy assessment, the reedbed and overall classification accuracies of each classifier were tested for significant differences using the Z statistics (Table 5). The pairwise comparison result of the MLC vs. the ANN classifiers indicated that the MLC produced a significantly higher accuracy for the reedbed class (99% confidence level). However, there was no significant difference in the overall accuracies of the MLC and ANN. This result indicates that for the reedbed classification MLC is preferred to the ANN, while for general land cover mapping either of the classifiers could be used. Figure 5a shows the reedbed map generated using the MLC. As can be seen in Figure 5b, the ANN classifier overestimates the reedbed area and confuses it with other land cover types particularly broadleaved forests and marshy grasslands while the SAM underestimates areas classified as reeds (Figure 5c).

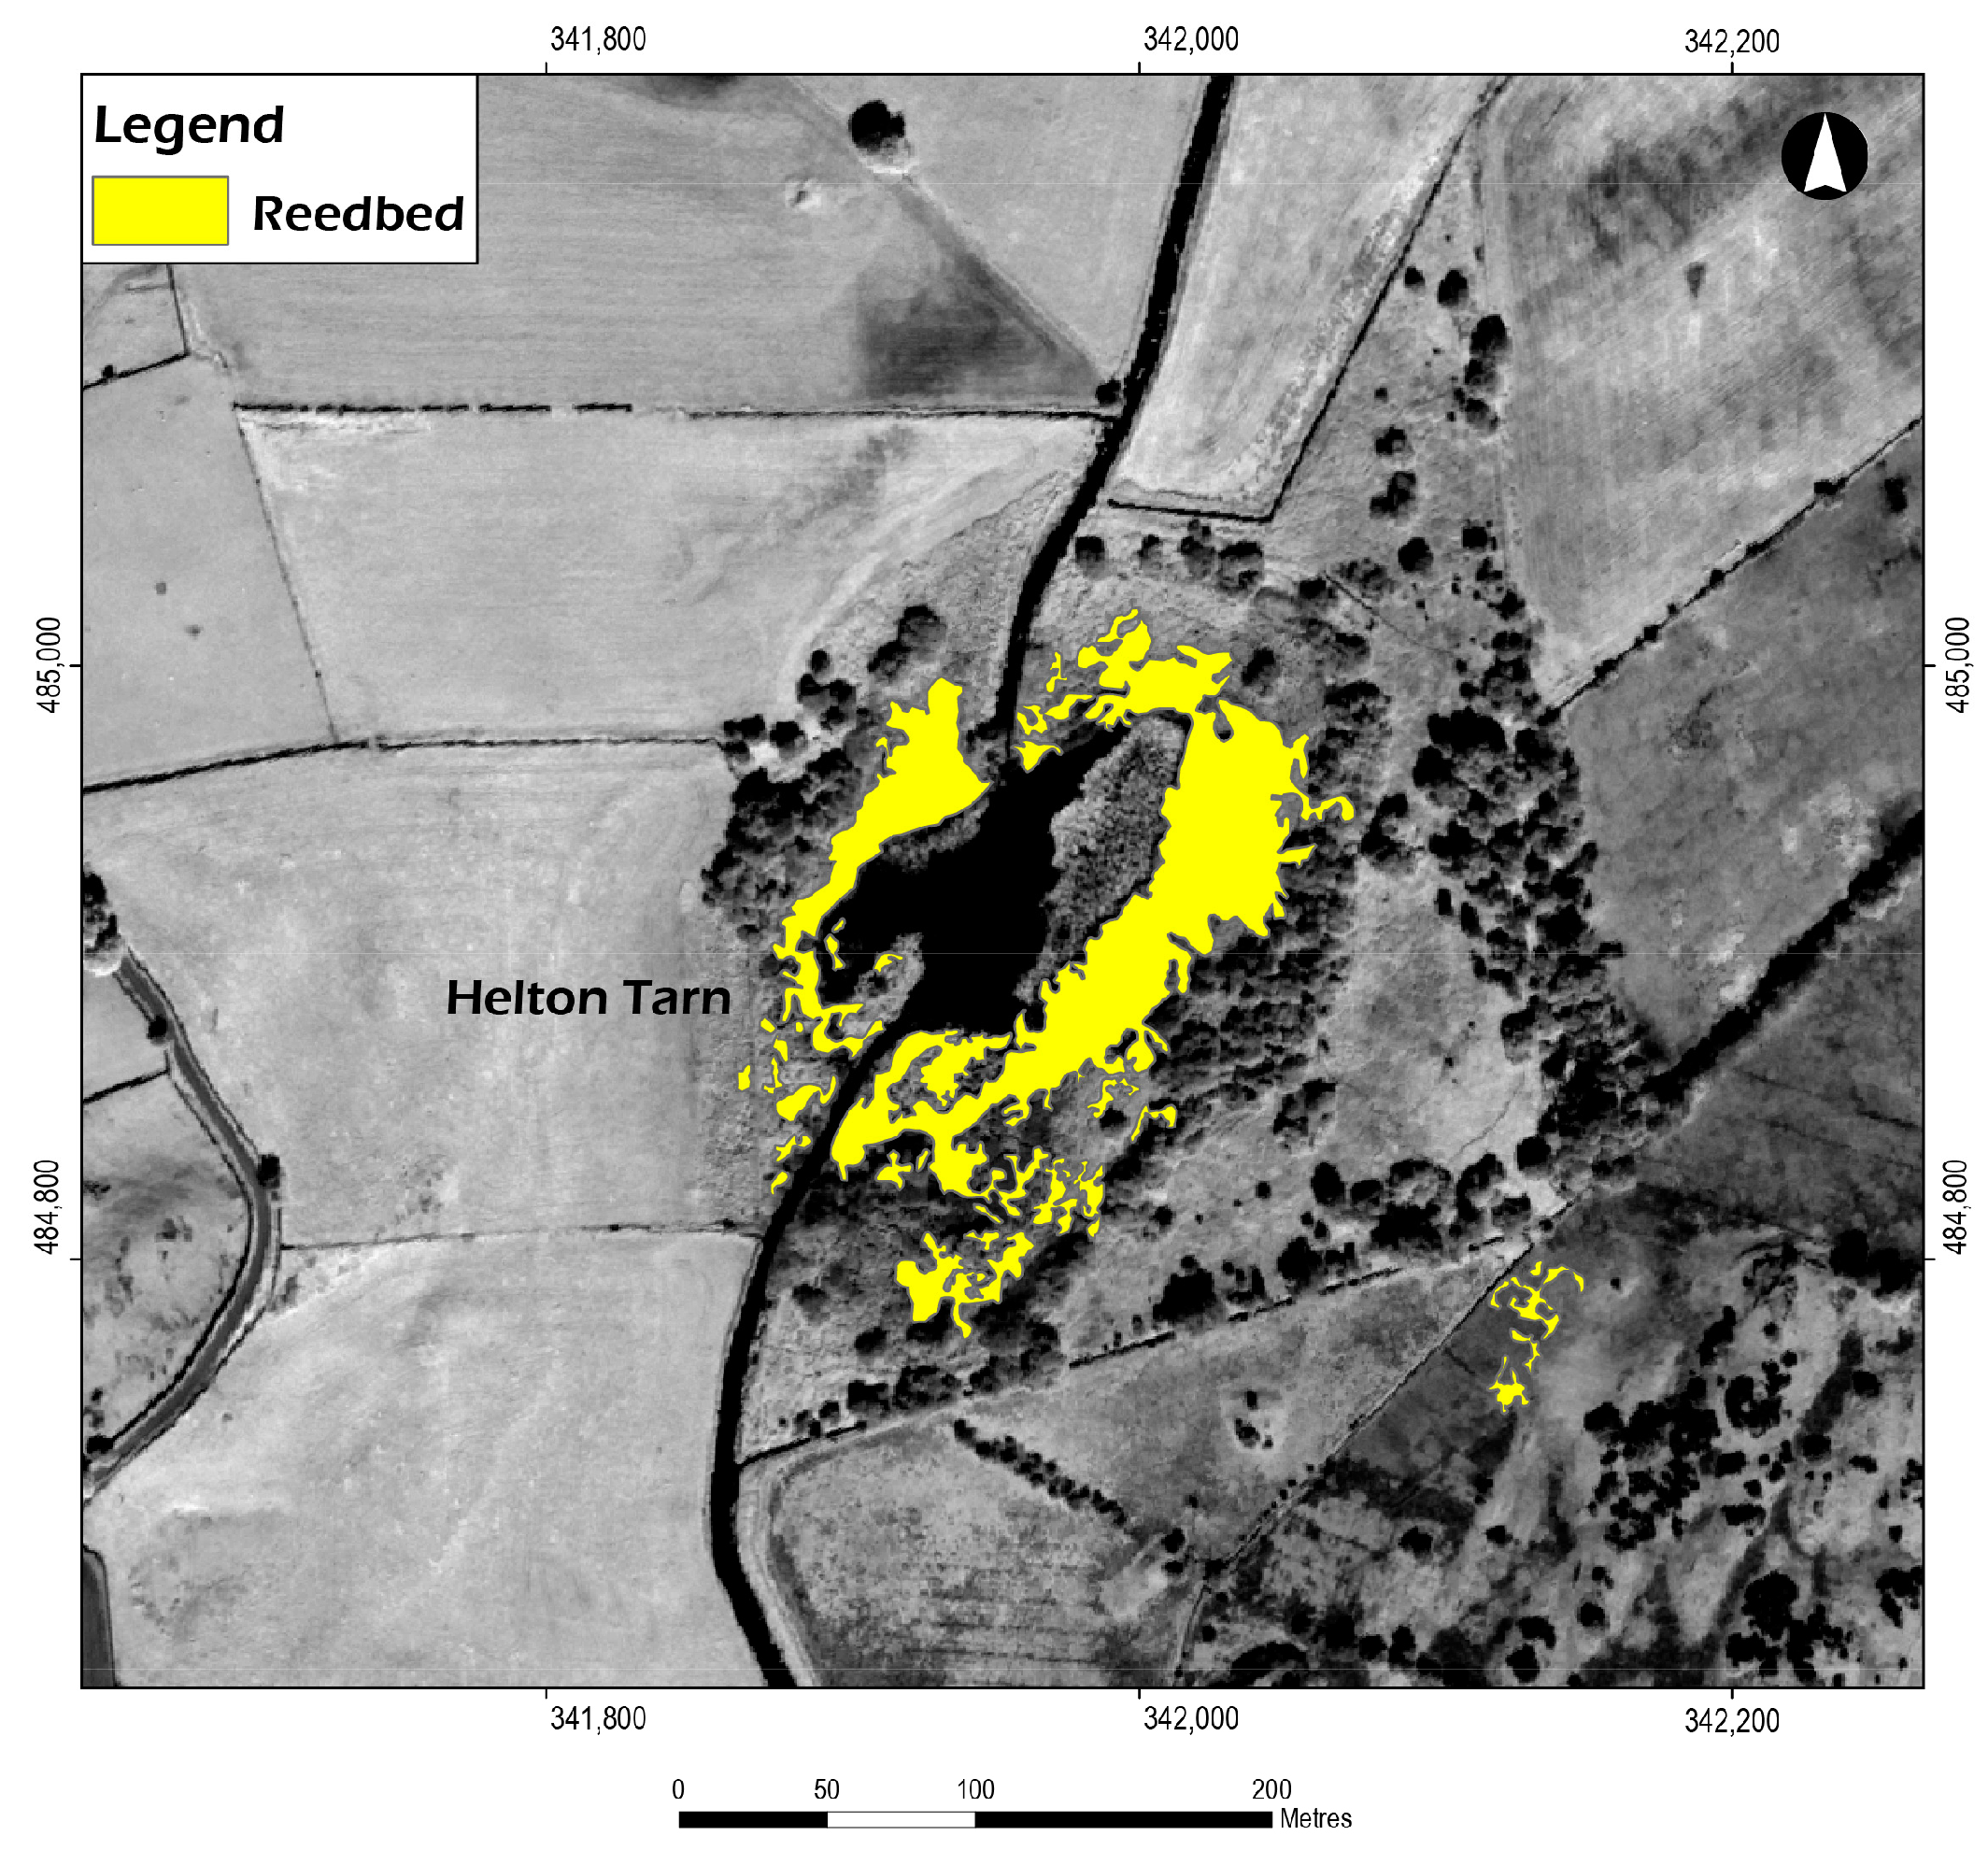
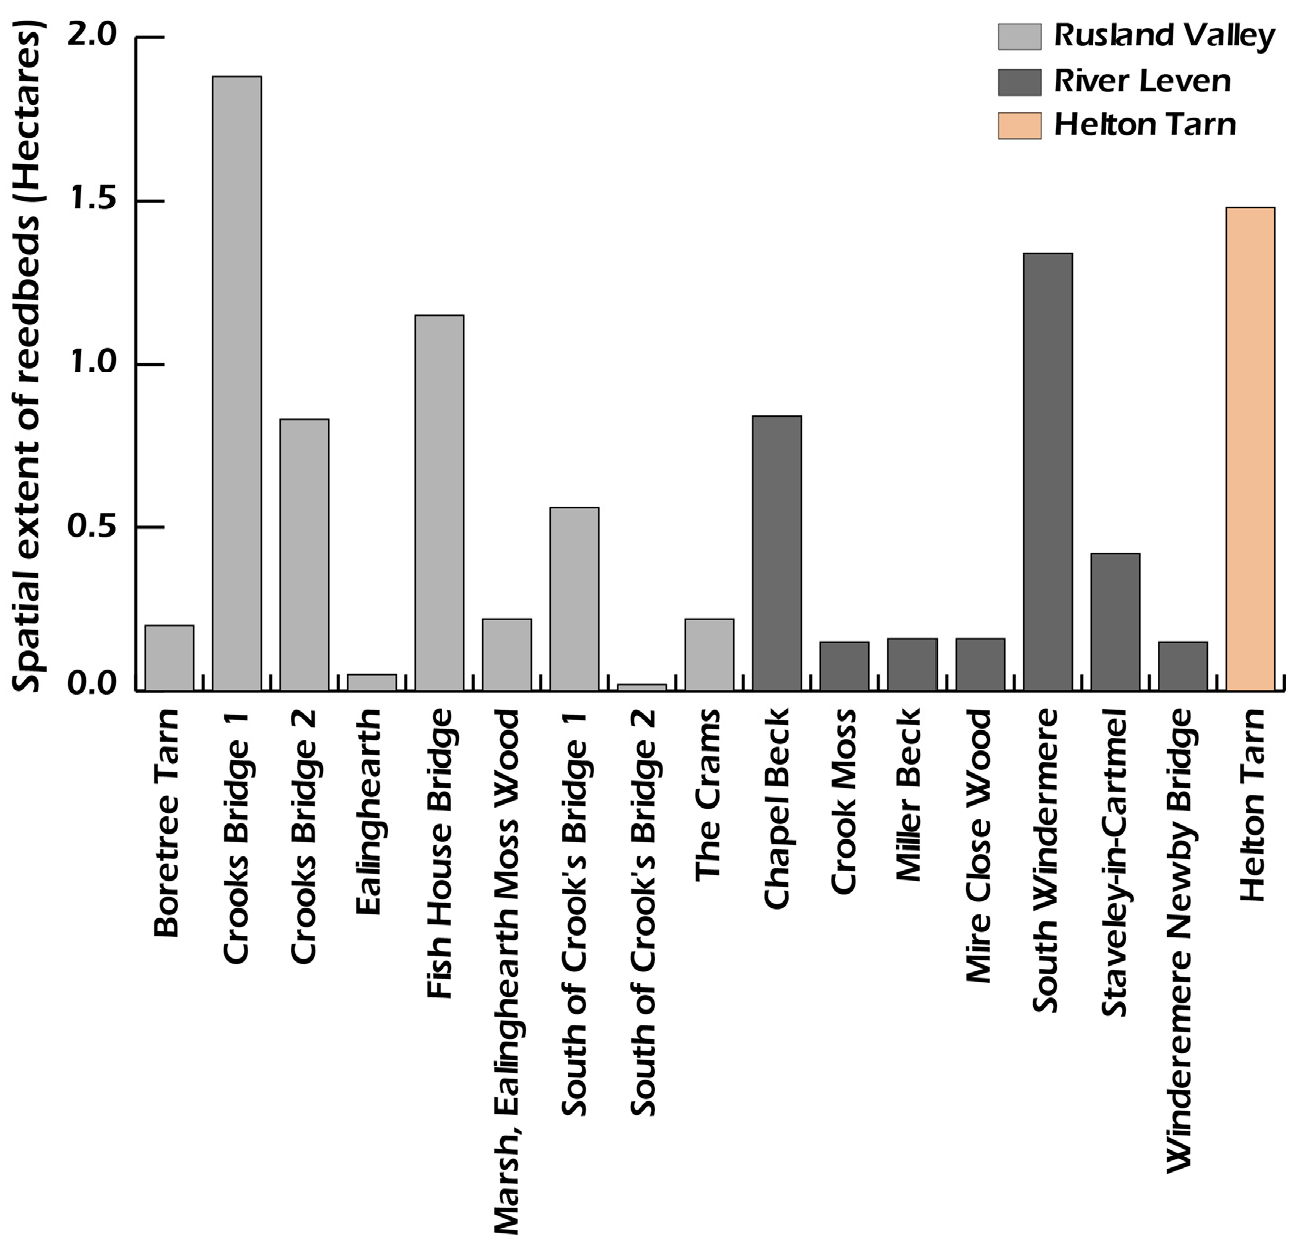
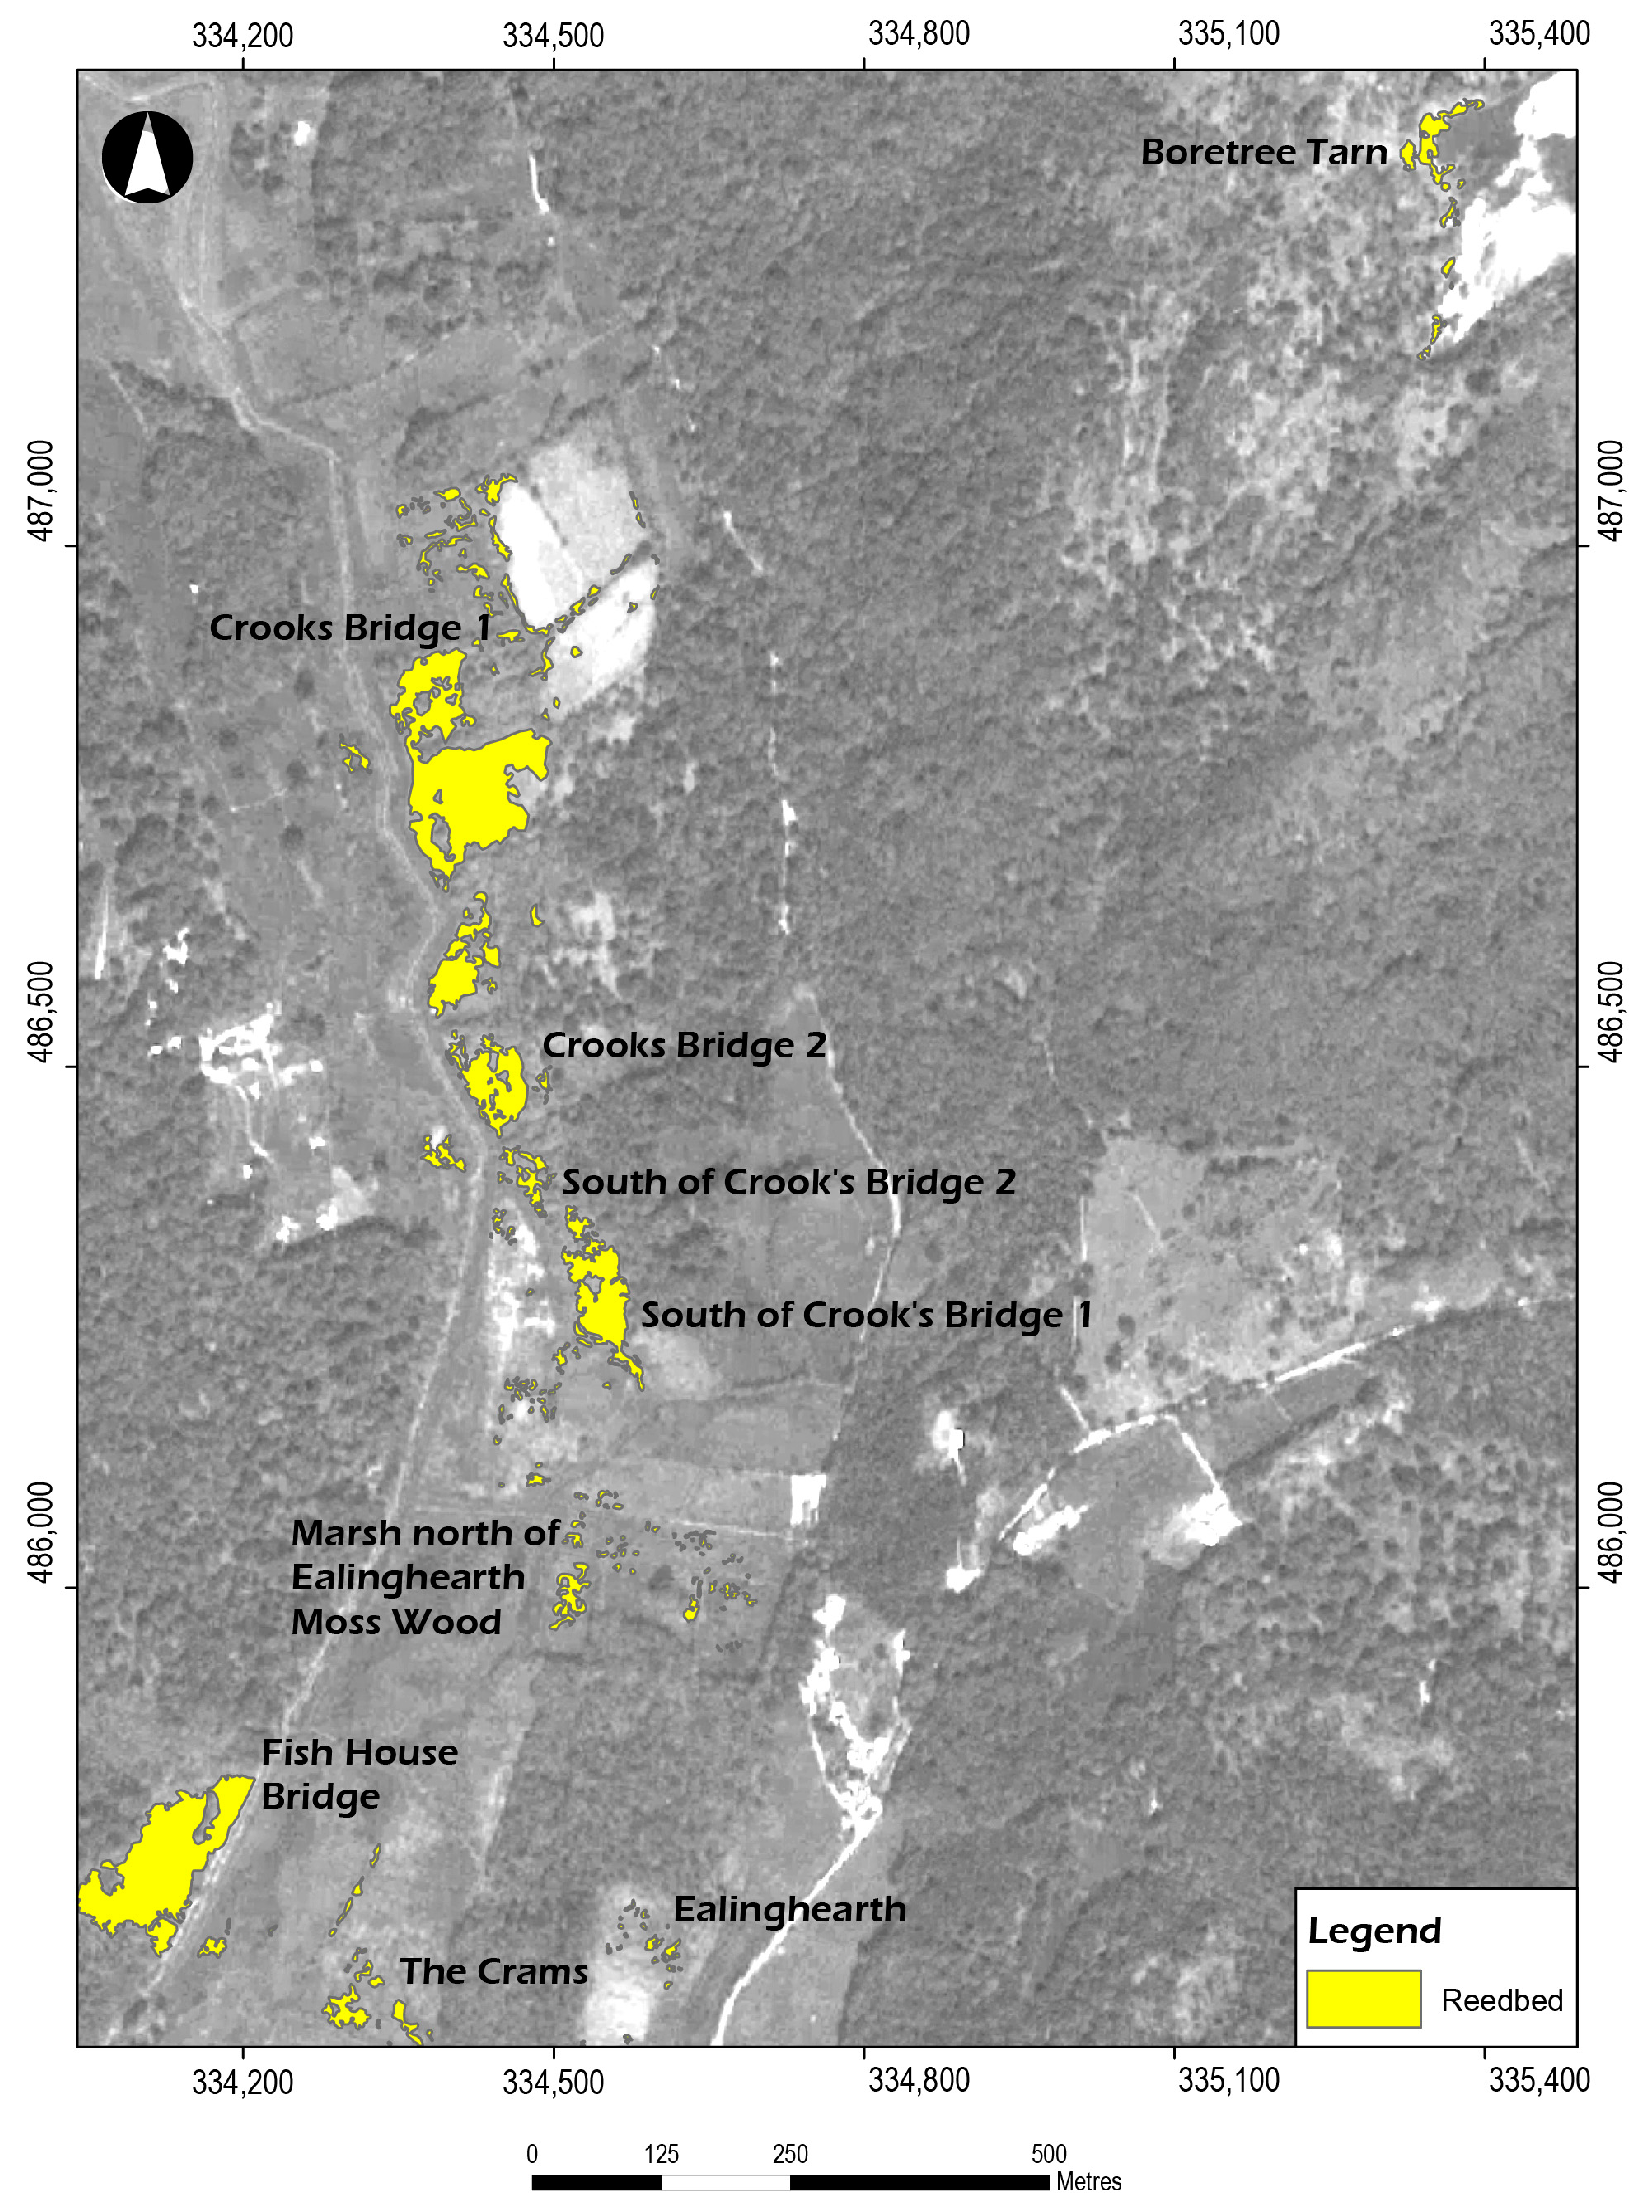
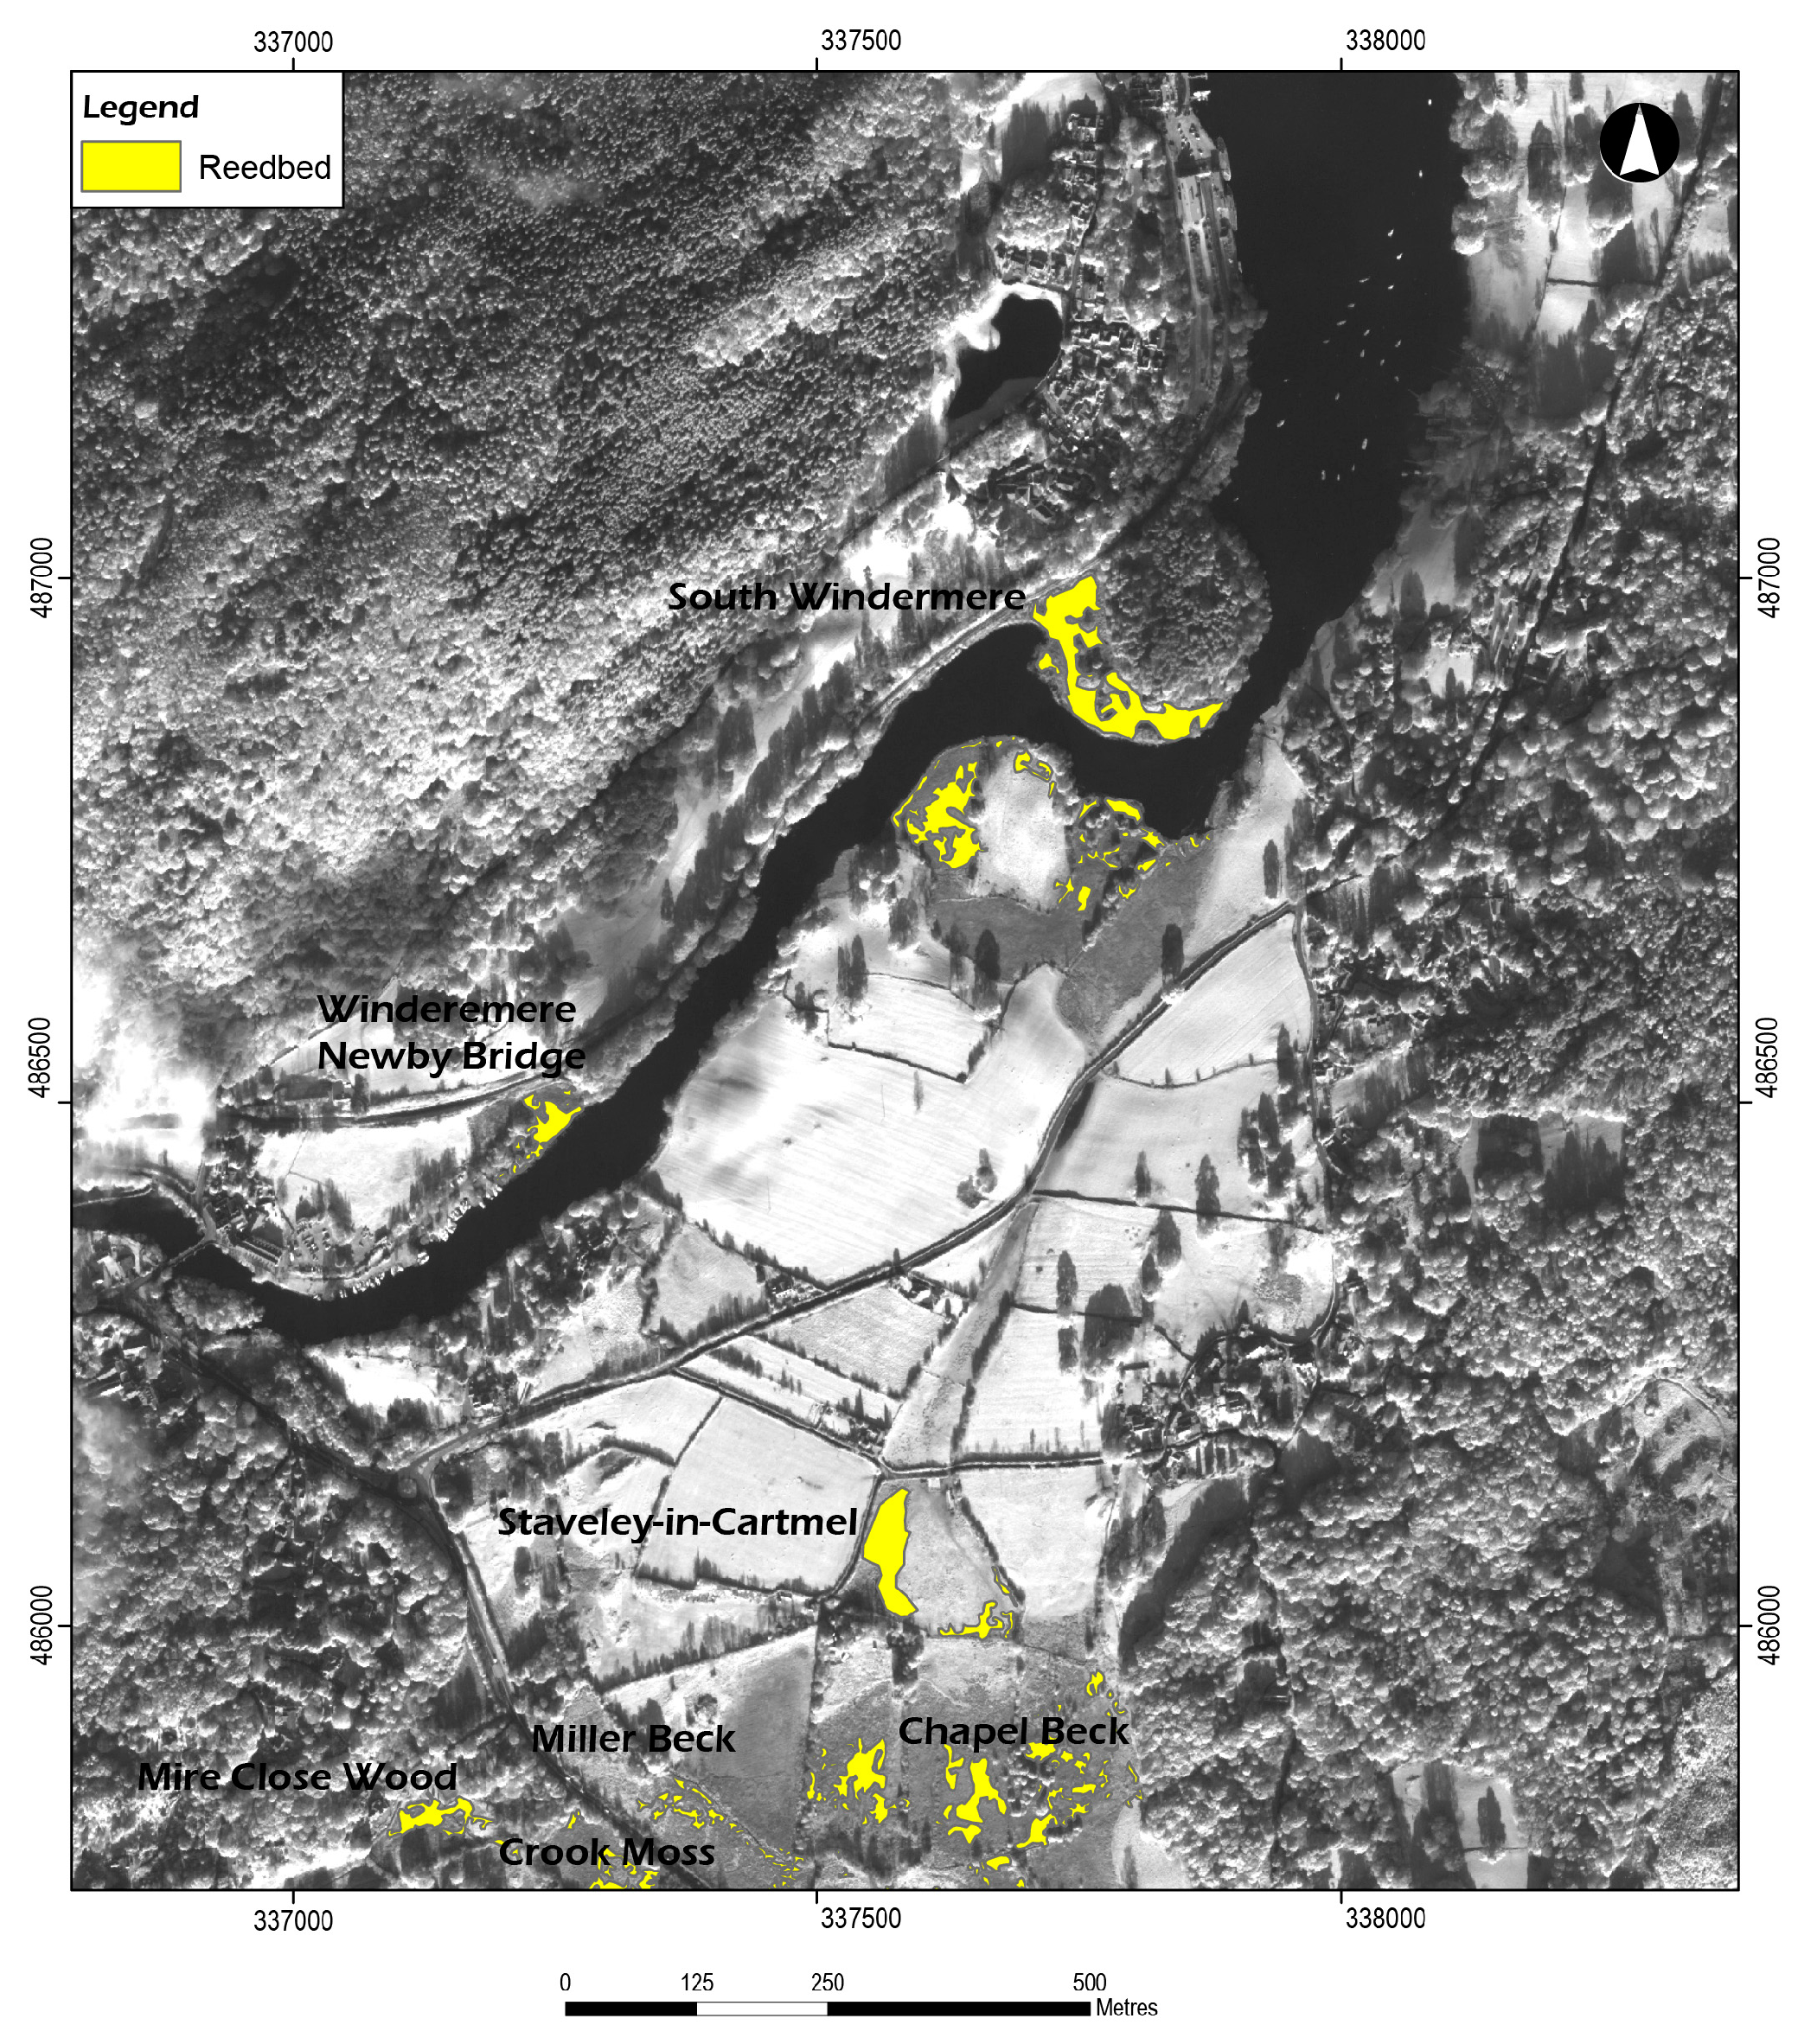
3.4. Inventory of Mapped Reedbed Habitats

Figure 6 presents the spatial extent of mapped reedbed sites across Rusland valley, River Leven and Helton Tarn using the optimal multi-seasonal spectral and textural combined dataset. The results showed the total mapped reedbeds area across all three sites was 9.8 hectares. Across Rusland Valley, the total area of mapped reedbeds ranged from 0.02 ha (south of Crook’s Bridge 2) to 1.9 ha (Crooks Bridge 1, the largest patch of reedbeds across the three study sites). In River Leven, the spatial extent of mapped reedbed sites ranged from 0.15 ha in Crook Moss to 1.34 ha in South Windermere while for Helton Tarn this was approximately 1.5 ha (second largest patch of mapped reedbed patches across all three sites). Figure 7, Figure 8 and Figure 9 display the vectorised reedbed habitats for Rusland valley; River Leven and Helton Tarn generated using optimal multi-seasonal dataset. The results demonstrate the effectiveness of mapping reedbed habitats of varied sizes and spatial distribution across large landscape areas. These results highlight the distinct and unique pattern of spatial variability associated with the mapped reedbed habitats across all three sites. With the dominant presence of large reedbed areas to sparse distribution of small reedbed patches across the landscapes, the effectiveness of this proposed methodology is demonstrated.

4. Conclusions

The results described in this paper demonstrate the importance of combining multi-seasonal textural measures with pansharpened multispectral data as a means of improving reedbed classification, all based on the use of a suitable classification technique such as MLC. The increased performance of multi-seasonal images could be attributed to subtle phenological differences that are vital in discriminating between different land cover types during image classification. Summarised below are the key findings of the study:
(1) There was a significant increase in the classification accuracy of reedbeds and other land cover types when GLCM texture measures were combined with the spectral information for both single-date images and multi-seasonal image datasets. The GLCM texture measures used for this experiment were the angular second moment and entropy. The results are synonymous with outputs of Laba et al. [50], which suggested that the combination of per-pixel classification and incorporation of texture measures with spectral bands increased the classification accuracy of wetland habitats.
(2) The most effective of the single-date image datasets was the autumn texture combined image which produced reedbed and overall classification accuracies of 54% and 76%, respectively. However, the optimal multi-seasonal image dataset produced significantly higher reedbed and overall classification accuracies of 76.5% and 78.1%, respectively. The optimal multi-seasonal image dataset was identified as the multi-seasonal pansharpened and texture combined image comprising of 16 layers (eight spectral and the eight GLCM texture measures). The increased performance of the optimal multi-seasonal image was attributed to the quality of vegetation phenological data contained in the images. The use of multi-seasonal reflectance data contained in satellite images has the advantage of increased phenological information that consequently results in increased classification accuracy as demonstrated by Davranche et al. [10]. Using a similar approach, Davranche et al. [10] showed that multi-seasonal spectral information contained in SPOT-5 satellite data was used to effectively map the spatial distribution of marshes covered with common reeds (Phragmites austrillis) and other submerged land cover types.
(3) The results obtained by applying three classifiers (MLC, ANN, and SAM) to the optimal multi-seasonal dataset indicated that the MLC and ANN classifiers produced the same overall classification accuracy which was significantly higher than the SAM. The MLC produced significantly higher reedbed accuracy than the other two techniques.
In view of future research, the authors note the limitation of using only the available cloud free high resolution satellite data as provided by the data supplier in this study. Hence, the use of freely available high to medium resolution satellite with better temporal resolutions (such as Sentinel 1 or 2 Earth Observation Missions) shall be investigated for further research.

Acknowledgments

The authors appreciate Cumbria Wildlife Trust, Environment Agency and the Petroleum Technology Development Fund (Nigeria) for their contributions to this study.

Author Contributions

Alex Onojeghuo processed and analyzed the satellite images used in the study. The manuscript was prepared by Alex Onojeghuo and reviewed by George Alan Blackburn, who also contributed to the study in an advisory capacity as project supervisor.

Conflicts of Interest

The authors declare no conflict of interest.

References

  1. Goetz, S.J.; Wright, R.K.; Smith, A.J.; Zinecker, E.; Schaub, E. Ikonos imagery for resource management: Tree cover, impervious surfaces, and riparian buffer analyses in the mid-atlantic region. Remote Sens. Environ. 2003, 88, 195–208. [Google Scholar] [CrossRef]
  2. Laba, M.; Downs, R.; Smith, S.; Welsh, S.; Neider, C.; White, S.; Richmond, M.; Philpot, W.; Baveye, P. Mapping invasive wetland plants in the Hudson River National Estuarine Research Reserve using Quickbird satellite imagery. Remote Sens. Environ. 2008, 112, 286–300. [Google Scholar] [CrossRef]
  3. Lawrence, R.; Hurst, R.; Weaver, T.; Aspinall, R. Mapping prairie pothole communities with multitemporal IKONOS satellite imagery. Photogramm. Eng. Remote Sens. 2006, 72, 169–174. [Google Scholar] [CrossRef]
  4. Wang, L.; Sousa, W.P.; Gong, P.; Biging, G.S. Comparison of ikonos and Quickbird images for mapping mangrove species on the Caribbean coast of Panama. Remote Sens. Environ. 2004, 91, 432–440. [Google Scholar] [CrossRef]
  5. Wolter, P.T.; Johnston, C.A.; Niemi, G.J. Mapping submergent aquatic vegetation in the US Great Lakes using Quickbird satellite data. Int. J. Remote Sens. 2005, 26, 5255–5274. [Google Scholar] [CrossRef]
  6. Mas, J.F.; Flores, J.J. The application of artificial neural networks to the analysis of remotely sensed data. Int. J. Remote Sens. 2008, 29, 617–663. [Google Scholar] [CrossRef]
  7. Guerschman, J.P.; Paruelo, J.M.; Di Bella, C.; Giallorenzi, M.C.; Pacin, F. Land cover classification in the argentine pampas using multi-temporal landsat TM data. Int. J. Remote Sens. 2003, 24, 3381–3402. [Google Scholar] [CrossRef]
  8. Brisco, B.; Browm, R.J. Multidate SAR/TM synergism for crop classification in western Canada. Photogramm. Eng. Remote Sens. 1995, 61, 1009–1014. [Google Scholar]
  9. Conese, C.; Maselli, F. Use of multi temporal information to improve classification performance of TM scenes in complex terrain. ISPRS J. Photogramm. Remote Sens. 1991, 46, 187–197. [Google Scholar] [CrossRef]
  10. Davranche, A.; Lefebvre, G.; Poulin, B. Wetland monitoring using classification trees and SPOT-5 seasonal time series. Remote Sens. Environ. 2010, 114, 552–562. [Google Scholar] [CrossRef] [Green Version]
  11. Liu, X.-H.; Skidmore, A.K.; van Oosten, H. Integration of classification methods for improvement of land-cover map accuracy. ISPRS J. Photogramm. Remote Sens. 2002, 56, 257–268. [Google Scholar] [CrossRef]
  12. Lunetta, R.S.; Balogh, M.E. Application of multi-temporal landsat 5 TM imagery for wetland identification. Photogramm. Eng. Remote Sens. 1999, 65, 1303–1310. [Google Scholar]
  13. Murthy, C.S.; Raju, P.V.; Badrinath, K.V.S. Classification of wheat crop with multi-temporal images: Performance of maximum likelihood and artificial neural networks. Int. J. Remote Sens. 2003, 24, 4871–4890. [Google Scholar] [CrossRef]
  14. Nageswara, R.P.; Mohan, K.A. Rice crop identification and area estimation using remotely sensed data from Indian cropping patterns. Int. J. Remote Sens. 1987, 8, 639–650. [Google Scholar]
  15. Oetter, D.R.; Cohen, W.B.; Berterretche, M.; Maiersperger, T.K.; Kennedy, R.E. Land cover mapping in an agricultural setting using multiseasonal thematic mapper data. Remote Sens. Environ. 2000, 76, 139–155. [Google Scholar] [CrossRef]
  16. Vieira, C.A.O.; Mather, P.M.; Mccullagh, M. The spectral temporal response surface and its use in the multi sensor, multi temporal classification of agricultural crops. In XIX ISPRS: IAPRS; ISPRS: Amsterdam, The Netherlands, 2000; Volume XXXIII. [Google Scholar]
  17. Haralick, R.M. Statistical and structural approaches to texture. Syst. Man Cybern. IEEE Trans. Syst. 1979, 67, 786–804. [Google Scholar] [CrossRef]
  18. Haralick, R.M.; Shanmugam, K.; Dinstein, I. Textural features for image classification. Syst. Man Cybern. IEEE Trans. Syst. 1973, 3, 610–621. [Google Scholar] [CrossRef]
  19. Berberoglu, S.; Curran, P.J. Merging spectral and textural information for classifying remotely sensed images. In Remote Sensing Image Analysis: Including the Spatial Domain; Steven, M.J., Freek, D.M., Eds.; Kluwer Academic: Dordrecht, The Netherlands; Boston, MA, USA; London, UK, 2004; Volume 5, pp. 113–136. [Google Scholar]
  20. Berberoglu, S.; Curran, P.J.; Lloyd, C.D.; Atkinson, P.M. Texture classification of mediterranean land cover. Int. J. Appl. Earth Observ. Geoinform. 2007, 9, 322–334. [Google Scholar] [CrossRef]
  21. Dikshit, O. Textural classification for ecological research using ATM images. Int. J. Remote Sens. 1996, 17, 887–915. [Google Scholar] [CrossRef]
  22. Franklin, S.E.; Hall, R.J.; Moskal, L.M.; Maudie, A.J.; Lavigne, M.B. Incorporating texture into classification of forest species composition from airborne multispectral images. Int. J. Remote Sens. 2000, 21, 61–79. [Google Scholar] [CrossRef]
  23. Franklin, S.E.; Maudie, A.J.; Lavigne, M.B. Using spatial co-occurence texture to increase forest structure and species composition classification accuracy. Photogramm. Eng. Remote Sens. 2001, 67, 849–855. [Google Scholar]
  24. Hudak, A.T.; Wessman, C.A. Textural analysis of high resolution imagery to quantify bush encroachment in madikwe game reserve, South Africa, 1955–1996. Int. J. Remote Sens. 2001, 22, 2731–2740. [Google Scholar] [CrossRef]
  25. Pearlstine, L.; Portier, K.M.; Smith, S.E. Textural discrimination of an invasive plant, Schinus terebinthifolius, from low altitude aerial digital imagery. Photogramm. Eng. Remote Sens. 2005, 71, 289–298. [Google Scholar] [CrossRef]
  26. Tsai, F.; Ming Jhong, C. Texture augmented analysis of high resolution satellite imagery in detecting invasive plant species. J. Chin. Inst. Eng. 2006, 29, 581–592. [Google Scholar] [CrossRef]
  27. Tsai, F.; Ming Jhong, C.; Wang, H.H. Texture analysis of high resolution satellite imagery for mapping invasive plants. In Proceedings of the International Geoscience and Remote Sensing Symposium (IGARSS’05), Seoul, Korea, 25–29 July 2005; IEEE International: Seoul, Korea; pp. 3024–3027.
  28. Onojeghuo, A.O.; Blackburn, G.A. Mapping reedbed habitats using texture based classification of Quickbird imagery. Int. J. Remote Sens. 2011, 32, 8121–8138. [Google Scholar] [CrossRef]
  29. Richards, J.A. Thematic mapping from multitemporal image data using the principal components transformation. Remote Sens. Environ. 1984, 16, 35–46. [Google Scholar] [CrossRef]
  30. Girouard, G.; Bannari, A.; El Harti, A.; Desrochers, A. Validated spectral angle mapper algorithm for geological mapping: Comparative study between Quickbird and Landsat-TM. In XXth ISPRS Congress; Geo-Imagery Bridging Continents: Istanbul, Turkey, 2004. [Google Scholar]
  31. Kruse, F.A.; Boardman, J.W.; Lefkoff, A.B.; Heidebrecht, K.B.; Shapiro, A.T.; Barloon, P.J.; Goetz, A.F.H. The spectral image processing system (SIPS)—Interactive visualization and analysis of imaging spectrometer data. Remote Sens. Environ. 1993, 44, 145–163. [Google Scholar] [CrossRef]
  32. Sohn, Y.; Moran, E.; Gurri, F. Deforestation in North-Central Yucatan (1985–1995): Mapping secondary succession of forest and agricultural land use in Sotuta using the cosine of the angle concept. Photogramm. Eng. Remote Sens. 1999, 65, 947–958. [Google Scholar]
  33. Sohn, Y.; Rebello, N.S. Supervised and unsupervised spectral angle classifiers. Photogramm. Eng. Remote Sens. 2002, 68, 1271–1281. [Google Scholar]
  34. Yuhas, R.H.; Goetz, A.F.H.; Boardman, J.W. Discrimination among semi-arid landscape endmembers using the spectral angle mapper (SAM) algorithm. In Summaries of the 4th JPL Airborne Earth Science Workshop; Green, R.O., Ed.; JPL Publication: Pasadena, CA, USA, 1992; Volume 92–14, pp. 147–149. [Google Scholar]
  35. Ouyang, Z.-T.; Gao, Y.; Xie, X.; Guo, H.-Q.; Zhang, T.-T.; Zhao, B.; Convertino, M. Spectral discrimination of the invasive plant spartina alterniflora at multiple phenological stages in a saltmarsh wetland. PLoS ONE 2013, 8. [Google Scholar] [CrossRef] [PubMed]
  36. Chavez, P.S. An improved dark-object subtraction technique for atmospheric scattering correction of multispectral data. Remote Sens. Environ. 1988, 24, 459–479. [Google Scholar] [CrossRef]
  37. ERDAS. Erdas Imagine 2014; Hexagon Geospatial: Norcross, GA, USA, 2014. [Google Scholar]
  38. Congalton, R.G.; Green, K. Assessing the Accuracy of Remotely Sensed Data: Principles and Practice; CRC Press/Taylor & Francis: Boca Raton, FL, USA, 2009. [Google Scholar]
  39. Stehman, S.V.; Czaplewski, R.L. Design and analysis for thematic map accuracy assessment: Fundamental principles. Remote Sens. Environ. 1998, 64, 331–344. [Google Scholar] [CrossRef]
  40. Bishop, C.M. Neural Networks for Pattern Recognition; Clarendon Press, Oxford University Press: Oxford, NY, USA, 1995. [Google Scholar]
  41. Cohen, J. A coefficient of agreement of nominal scales. Educ. Psychol. Meas. 1960, 20, 37–46. [Google Scholar] [CrossRef]
  42. Congalton, R.G. A review of assessing the accuracy of classifications of remotely sensed data. Remote Sens. Environ. 1991, 37, 35–46. [Google Scholar] [CrossRef]
  43. Congalton, R.G.; Oderwald, R.G.; Mead, R.A. Assessing landsat classification accuracy using discrete multivariate analysis statistical techniques. Photogramm. Eng. Remote Sens. 1983, 49, 1671–1678. [Google Scholar]
  44. Dwivedi, R.S.; Kandrika, S.; Ramana, K.V. Comparison of classifiers of remote-sensing data for land-use/land-cover mapping. Curr. Sci. 2003, 86, 328–335. [Google Scholar]
  45. Murakami, T. Seasonal variation in classification accuracy of forest-cover types examined by single band or band combinations. J. For. Res. 2004, 9, 211–215. [Google Scholar] [CrossRef]
  46. Franklin, S.E.; Wulder, M.A.; Gerylo, G.R. Texture analysis of IKONOS panchromatic data for Douglas-fir forest age class separability in British Columbia. Int. J. Remote Sens. 2001, 22, 2627–2632. [Google Scholar] [CrossRef]
  47. Helmer, E.H.; Brown, S.; Cohen, W.B. Mapping montane tropical forest successional stage and land use with multi-date landsat imagery. Int. J. Remote Sens. 2000, 21, 2163–2183. [Google Scholar] [CrossRef]
  48. Liu, Q.J.; Takamura, T.; Takeuchi, N.; Shao, G. Mapping of boreal vegetation of a temperate mountain in China by multitemporal Landsat TM imagery. Int. J. Remote Sens. 2002, 23, 3385–3405. [Google Scholar] [CrossRef]
  49. Dai, L.; Liu, C. Multiple classifier combination for land cover classification of remote sensing image. In Proceedings of the 2010 2nd International Conference on Information Science and Engineering (ICISE), Hangzhou, China, 4–6 December 2010; pp. 3835–3839.
  50. Laba, M.; Blair, B.; Downs, R.; Monger, B.; Philpot, W.; Smith, S.; Sullivan, P.; Baveye, P.C. Use of textural measurements to map invasive wetland plants in the Hudson River National Estuarine Research Reserve with IKONOS satellite imagery. Remote Sens. Environ. 2010, 114, 876–886. [Google Scholar] [CrossRef]
Figure 1. Map of study site showing: (A) Cumbria and Lancashire counties with inset map of the UK, and the Ordnance Survey base maps (scale: 1:50,000) of (B) Rusland Valley; (C) River Leven, the main study site study site; and (D) Helton Tarn. © Crown Copyright OS Master Map and 1:50,000 Colour Raster 2007. An Ordnance Survey/Edina supplied service.
Environments 03 00005 g001
Figure 2. Semivariograms used to analyse sensitivity and determine optimal window sizes.
Environments 03 00005 g002
Figure 3. Classification accuracy results of single-date (A) and multi-seasonal (B) images generated using MLC technique.
Environments 03 00005 g003
Figure 4. Accuracy comparisons of three different classifiers (maximum likelihood classifier—MLC, artificial neural network—ANN, and spectral angular mapper—SAM) applied to the optimal multi-seasonal image dataset.
Environments 03 00005 g004
Figure 5. Reedbed map of sites across River Leven generated using the following classifiers: (a) MLC techniques; (b) ANN back propagation technique; and (c) SAM, with the QuickBird panchromatic image in the background.
Environments 03 00005 g005
Figure 6. Graph showing spatial extent of mapped reedbed sites across Rusland valley, River Leven and Helton Tarn using the optimal multi-seasonal spectral and textural dataset.
Environments 03 00005 g006
Figure 7. Reedbed map of Rusland Valley generated using MLC generated optimal multi-seasonal dataset with QuickBird image background.
Environments 03 00005 g007
Figure 8. Reedbed map of River Leven generated using MLC generated optimal multi-seasonal dataset with QuickBird image background.
Environments 03 00005 g008
Figure 9. Reedbed map of Helton Tarn generated using MLC generated optimal multi-seasonal dataset with QuickBird image background.
Environments 03 00005 g009
Table 1. Description of image datasets used for single-date and multi-seasonal classifications.
Image DatasetDescriptionNumber of Bands
pansharp MS (single-date)Multispectral bands only (summer and autumn separately)4
glcm45pca (single-date)Multispectral bands combined with principal components 1–2 of GLCM entropy and angular second moment computed using windows 3 × 3 and 7 × 7 (autumn and winter)6
pansharpCombination of multispectral bands for autumn and summer QB images.8
glcm45pcaCombination of eight multispectral bands and principal components 1–4 of GLCM texture measures (entropy and angular second moment computed using windows 3 × 3 and 7 × 7) for autumn and summer QB images12
all glcm45Combination of 8 pansharpened multispectral bands and 8 GLCM texture measures (entropy and angular second moment computed using windows 3 × 3 and 7 × 7) for autumn and summer QB images16
pansharp differenceImage difference of autumn and summer pansharpened multispectral images.4
glcm45pca differenceImage difference of autumn and summer pansharpened and texture combined image datasets6
all glcm45 differenceImage difference of autumn and summer datasets each having four spectral and four GLCM texture measures—entropy and angular second moment computed using windows 3 × 3 and 7 × 78
pansharp PCAFirst 3 principal components of spectral bands for both dates3
glcm45pca PCAFirst 3 principal components of autumn and summer datasets—glcm45pca3
all glcm45 PCAFirst 3 principal components of autumn and summer datasets—all glcm453
Note: Pansharp, QuickBird pansharpened multispectral bands with a spatial resolution of 0.6 m; Image difference = autumn image − summer image; GLCM, grey level co-occurrence matrix; glcm45pca, PCA output of window sizes 3 × 3 and 7 × 7.
Table 2. Accuracy assessment result of single-date classification generated using MLC technique.
Image DatasetClassified TotalNumber CorrectReedbed PAReedbed UAOverall AccuracyReedbed KappaOverall Kappa
pansharp (summer)261132.3542.3164.680.380.53
glcm45pca (summer)17926.4752.9468.140.50.58
pansharp (autumn)221441.1863.6452.120.610.4
glcm45pca (autumn)6411.7666.6773.340.650.66
Note: UA, User’s accuracy for reedbed; OA, overall classification accuracy; GLCM, grey level co-occurrence matrix; glcm45pca, PCA output of window sizes 3 × 3 and 7 × 7; multi-date = autumn + summer images.
Table 3. Results of tests for significant differences in the accuracy of single-date classifications using the MLC classifier. Kappa coefficients and associated variances for each classification are given in the upper part of the table.
ClassError MatrixKAPPA StatisticsVariance
Reedbed onlypansharp (summer)-(SP)0.24900.000492101
glcm45pca (summer)-(SP+T)0.39010.000446294
pansharp (autumn)-(AP)0.40750.000495398
glcm45pca (autumn)-(AP+T)0.51100.000438014
Overall classpansharp (summer)0.64850.000492101
glcm45pca (summer)0.71240.000446294
pansharp (autumn)0.65120.000495398
glcm45pca (autumn)0.71600.000438014
ClassPairwise ComparisonZ StatisticsConfidence Level (%)
Reedbed onlySP vs. (SP+T)−4.606199% significant
AP vs. (AP+T)−3.387799% significant
SP vs. AP5.043899% significant
(AP+T) vs. (SP+T)4.065699% significant
Overall classSP vs. (SP+T)−2.086095% significant
AP vs. (AP+T)−2.121095% significant
AP vs. SP0.0859Not significant.
(AP+T) vs. (SP+T)0.1211Not significant
Table 4. Accuracy assessment result of multi-seasonal classification.
Image DatasetTotalCorrectR-PAR-UAOAR-KPO-KPNumber
pansharp181338.2472.2278.110.70.78
glcm45pca171338.2476.4777.510.690.7512
all glcm45171338.2476.4778.110.70.7516
pansharp difference311132.3535.4872.890.630.318
glcm45pca difference351441.184071.080.60.366
all glcm45 difference401647.064074.70.660.368
pansharp PCA613191.1850.8280.720.760.473
glcm45pca PCA591338.2422.0370.880.640.163
all glcm45 PCA613191.1850.8281.330.760.473
Note: Total = Classified total; Correct = Number correct; R-PA = Reedbed Producer Accuracy; R-UA = Reedbed User’s Accuracy; OA = Overall accuracy; R-KP = Reedbed kappa statistic; O-KP = Overall kappa statistic; and No. = Number of bands; GLCM, grey level co-occurrence matrix; glcm45pca, PCA output of window sizes 3 × 3 and 7 × 7; multi-date = autumn + summer images.
Table 5. Results of tests for significant differences in the accuracy of the classifiers (MLC, ANN, and SAM) applied to the most effective multi-seasonal image. Kappa coefficients and associated variances for each classification are given in the upper part of the table. Here, MLC = maximum likelihood classifier; ANN = artificial neural network; and SAM = spectral angular mapper.
ClassError MatrixKAPPA StatisticsVariance
Reedbed onlyMLC0.71860.0003620
ANN0.58780.0003101
SAM0.50940.0004674
Overall classMLC0.79880.0003620
ANN0.82530.0003101
SAM0.71100.0004674
ClassPairwise ComparisonZ StatisticsConfidence Level (%)
Reedbed onlyMLC vs. ANN5.045499% significant
MLC vs. SAM2.811699% significant
ANN vs. SAM2.811699% significant
Overall classMLC vs. ANN−1.0222Not significant
MLC vs. SAM4.099099% significant
ANN vs. SAM4.099099% significant

