
Using Landscape Metrics Analysis and Analytic Hierarchy Process to Assess Water Harvesting Potential Sites in Jordan


Abstract
:1. Introduction
2. State of the Art of the Methodologies Applied
3. Methodology
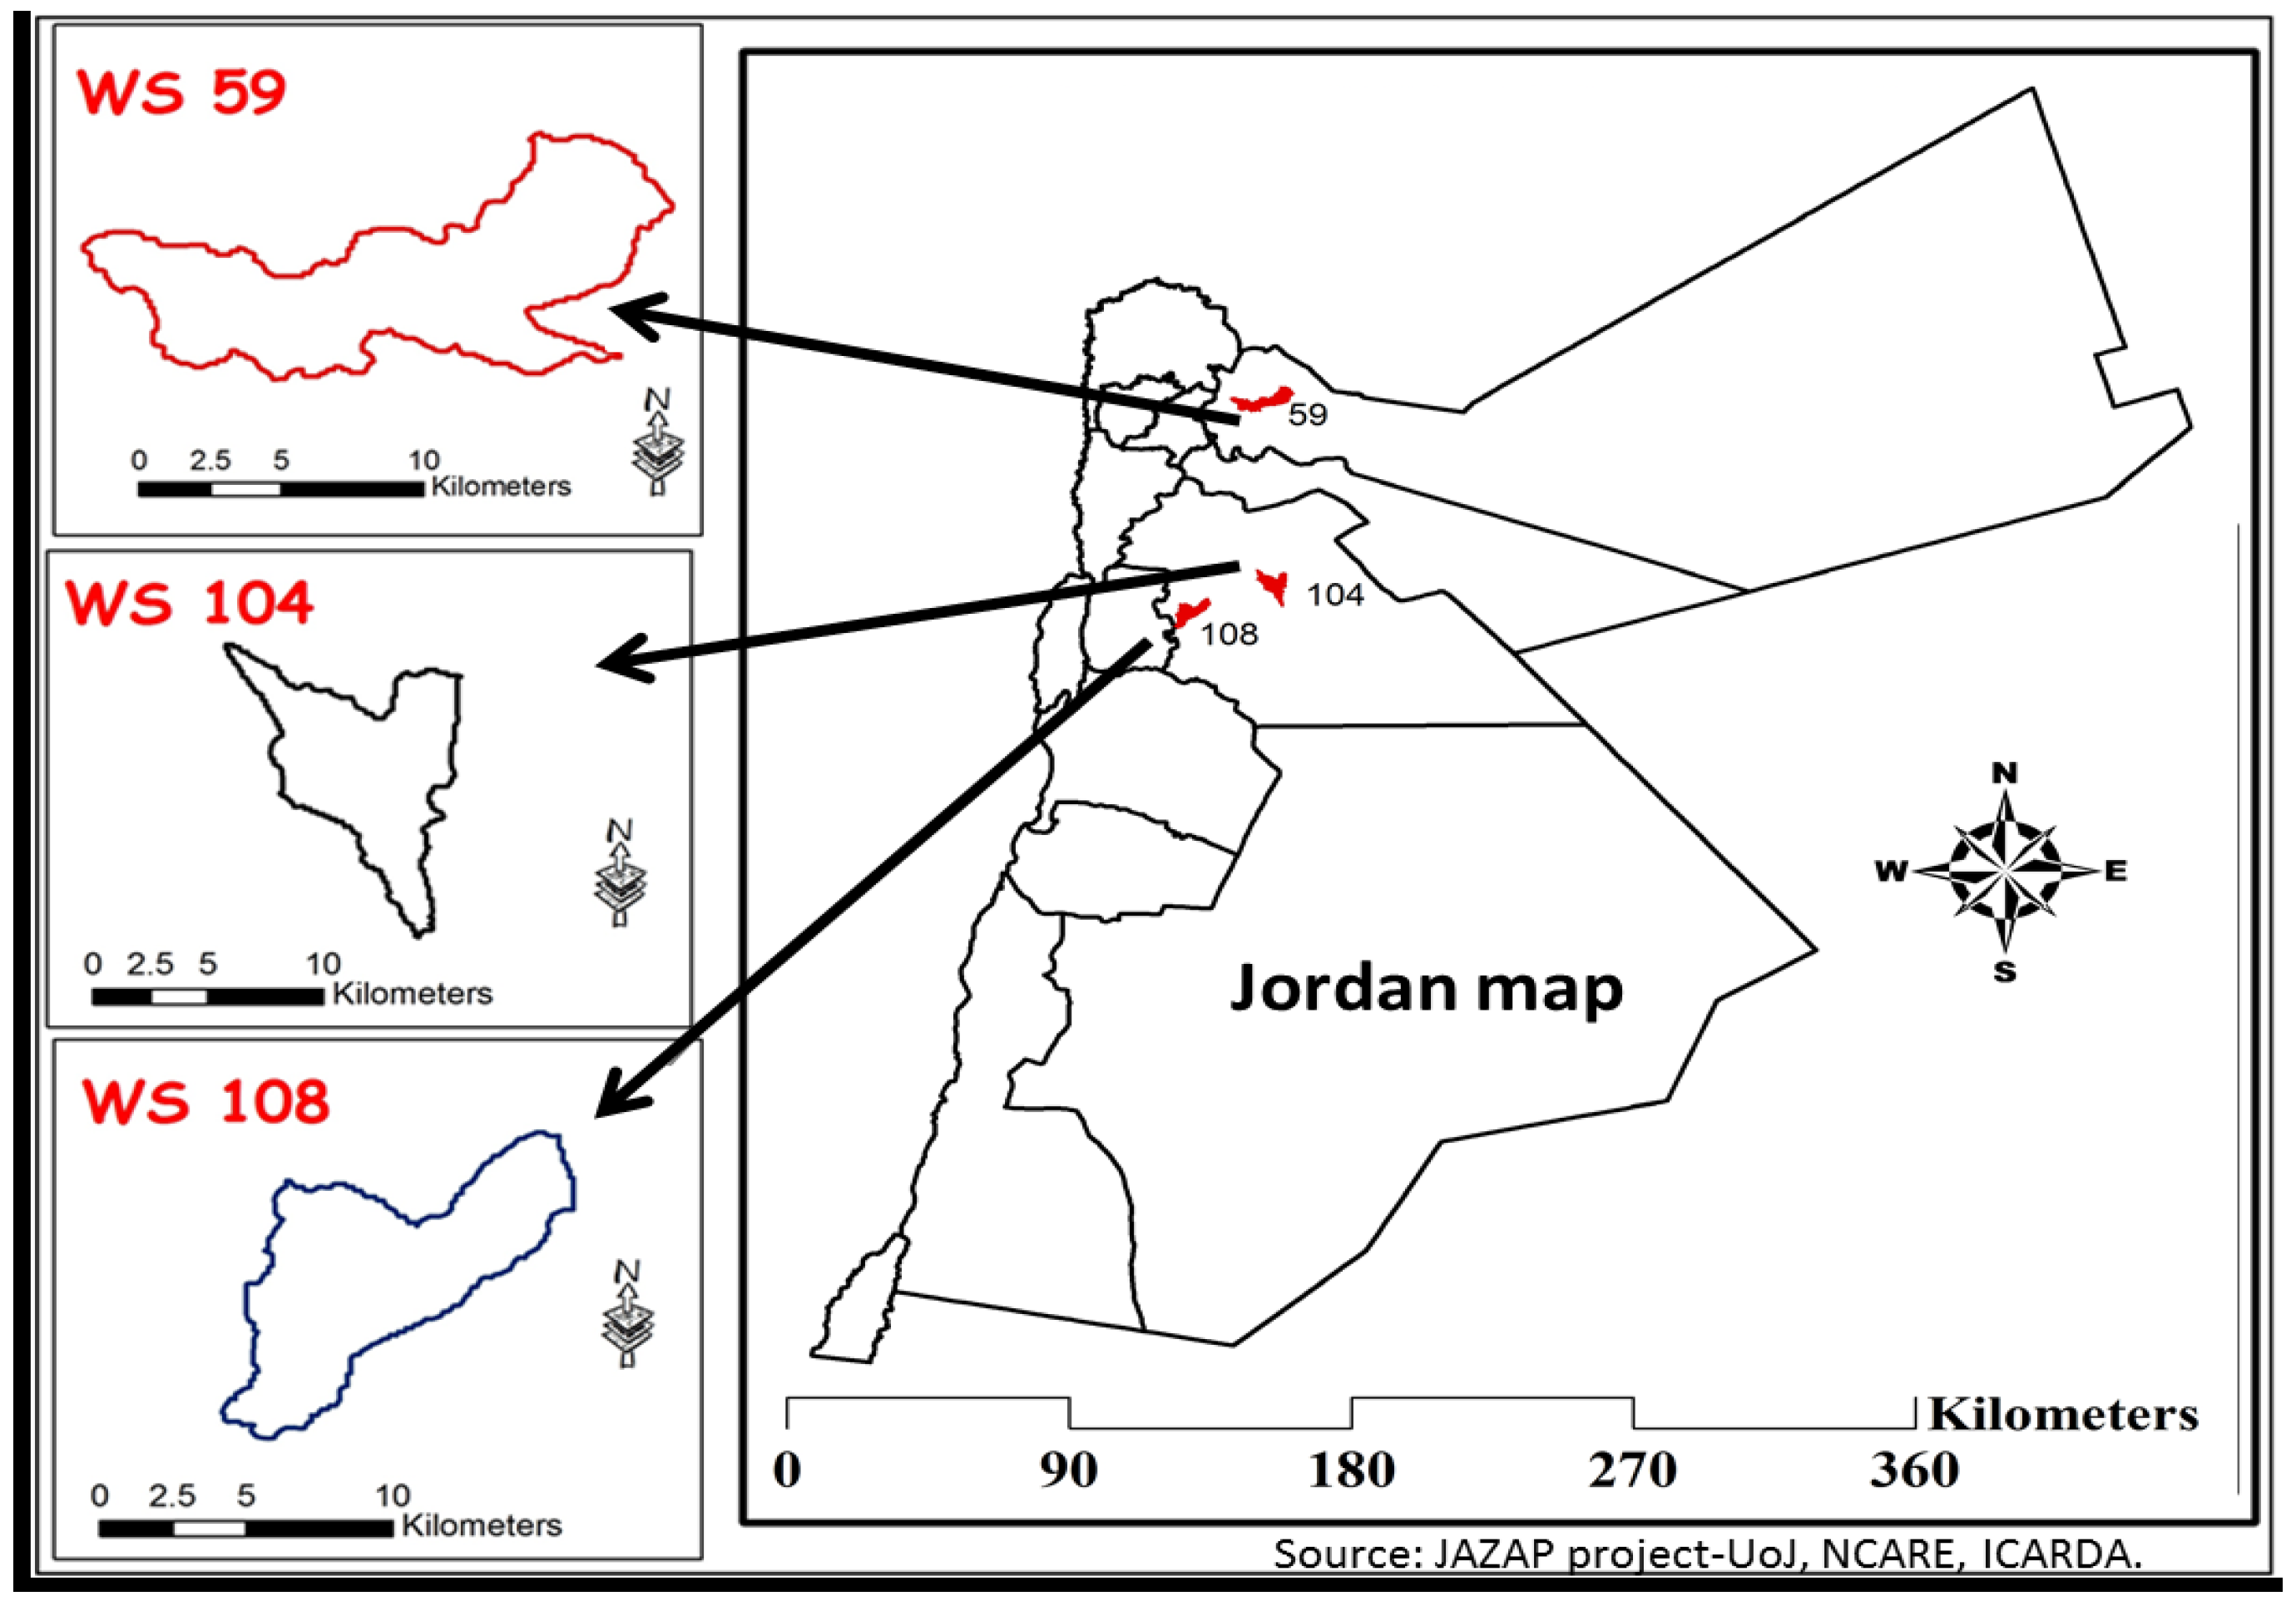
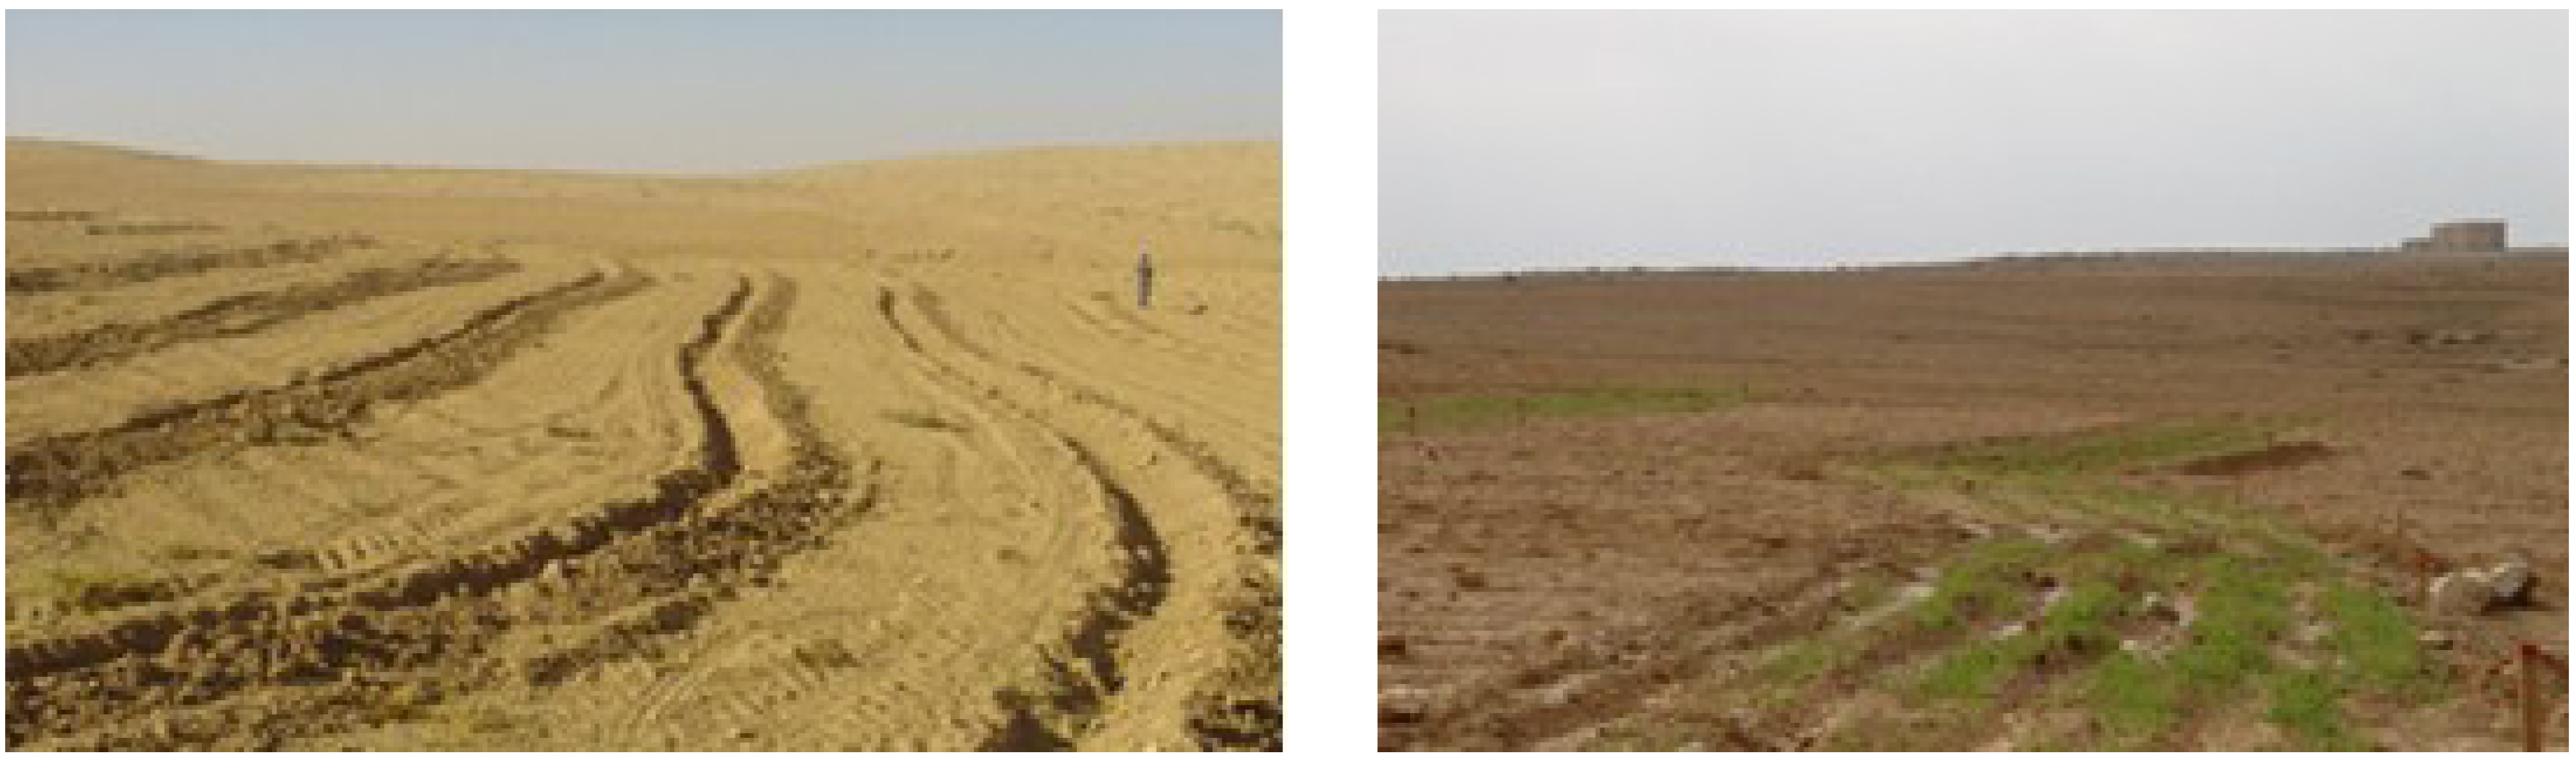
3.1. Study Area

| Landscape Name | Area Name | Surface Area (m2) |
|---|---|---|
| WS 104 | Mohareb | 9356 |
| WS 59 | Mansheyat Bani Hasan | 6060 |
| WS 108 | Urainbeh Al-gharbieh | 6149 |
3.2. Procedure for Using Combined Landscape Metrics and Analytic Hierarchy Process Analysis

| Implement Rainwater Harvesting under Different Landscape Metrics Values | Metrics Comparisons | Benefits from rainwater harvesting | Suitability of Rainwater Harvesting (S) | ||||||||
|---|---|---|---|---|---|---|---|---|---|---|---|
| Amount of Water Collected | Decrease the Soil Erosion Rates | Improve the Soil Water Holding Capacity | Improve the Water Availability for Plants | Improve the Soil Structure | Reduce the Surface Runoff | Maintain Soil Organic Matter | Reducing the Impact of Drought | ||||
A | B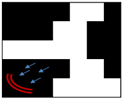 | MPS(B) > MPS(A) PN(A) > PN(B) | B > A | B > A | B > A | B > A | B > A | B > A | B > A | B > A | S(B) > S(A) |
C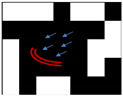 | D | CA(C) > CA(D) CAP(C) > CAP(D) | C > D | C > D | C > D | C > D | C > D | C > D | C > D | C > D | S(C) > S(D) |
E | F | PROX(E) > PROX(F) | E > F | E > F | E > F | E > F | E > F | E > F | E > F | E > F | S(E) > S(F) |
G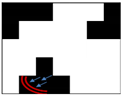 | H | ENN(H) > ENN(G) | H > G | H > G | H > G | H > G | H > G | H > G | H > G | H > G | S(H) > S(G) |
I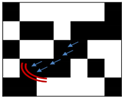 | J | GYRATE(I) > GYRATE(J) | I > J | I > J | I > J | I > J | I > J | I > J | I > J | I > J | S(I) > S(J) |
K | L | SHAPE (K) > SHAPE(L) TE(K) > TE(L) | L > K | L > K | L > K | L > K | L > K | L > K | L > K | L > K | S(L) > S(K) |
M | N | ECON(M) > ECON(N) | M > N | M > N | M > N | M > N | M>N | M>N | M>N | M>N | S(N) > S(M) |
 Rainwater harvesting construction;
  Patch from a LCT;
  Direction of collecting the rainwater.
4. Results
4.1. Landscape Spatial Patterns
| The studied landscapes | Patch Richness | PN | MPS (m2) |
|---|---|---|---|
| WS 59 | 5 | 124 | 75 |
| WS 104 | 2 | 6 | 1013 |
| WS 108 | 5 | 40 | 154 |
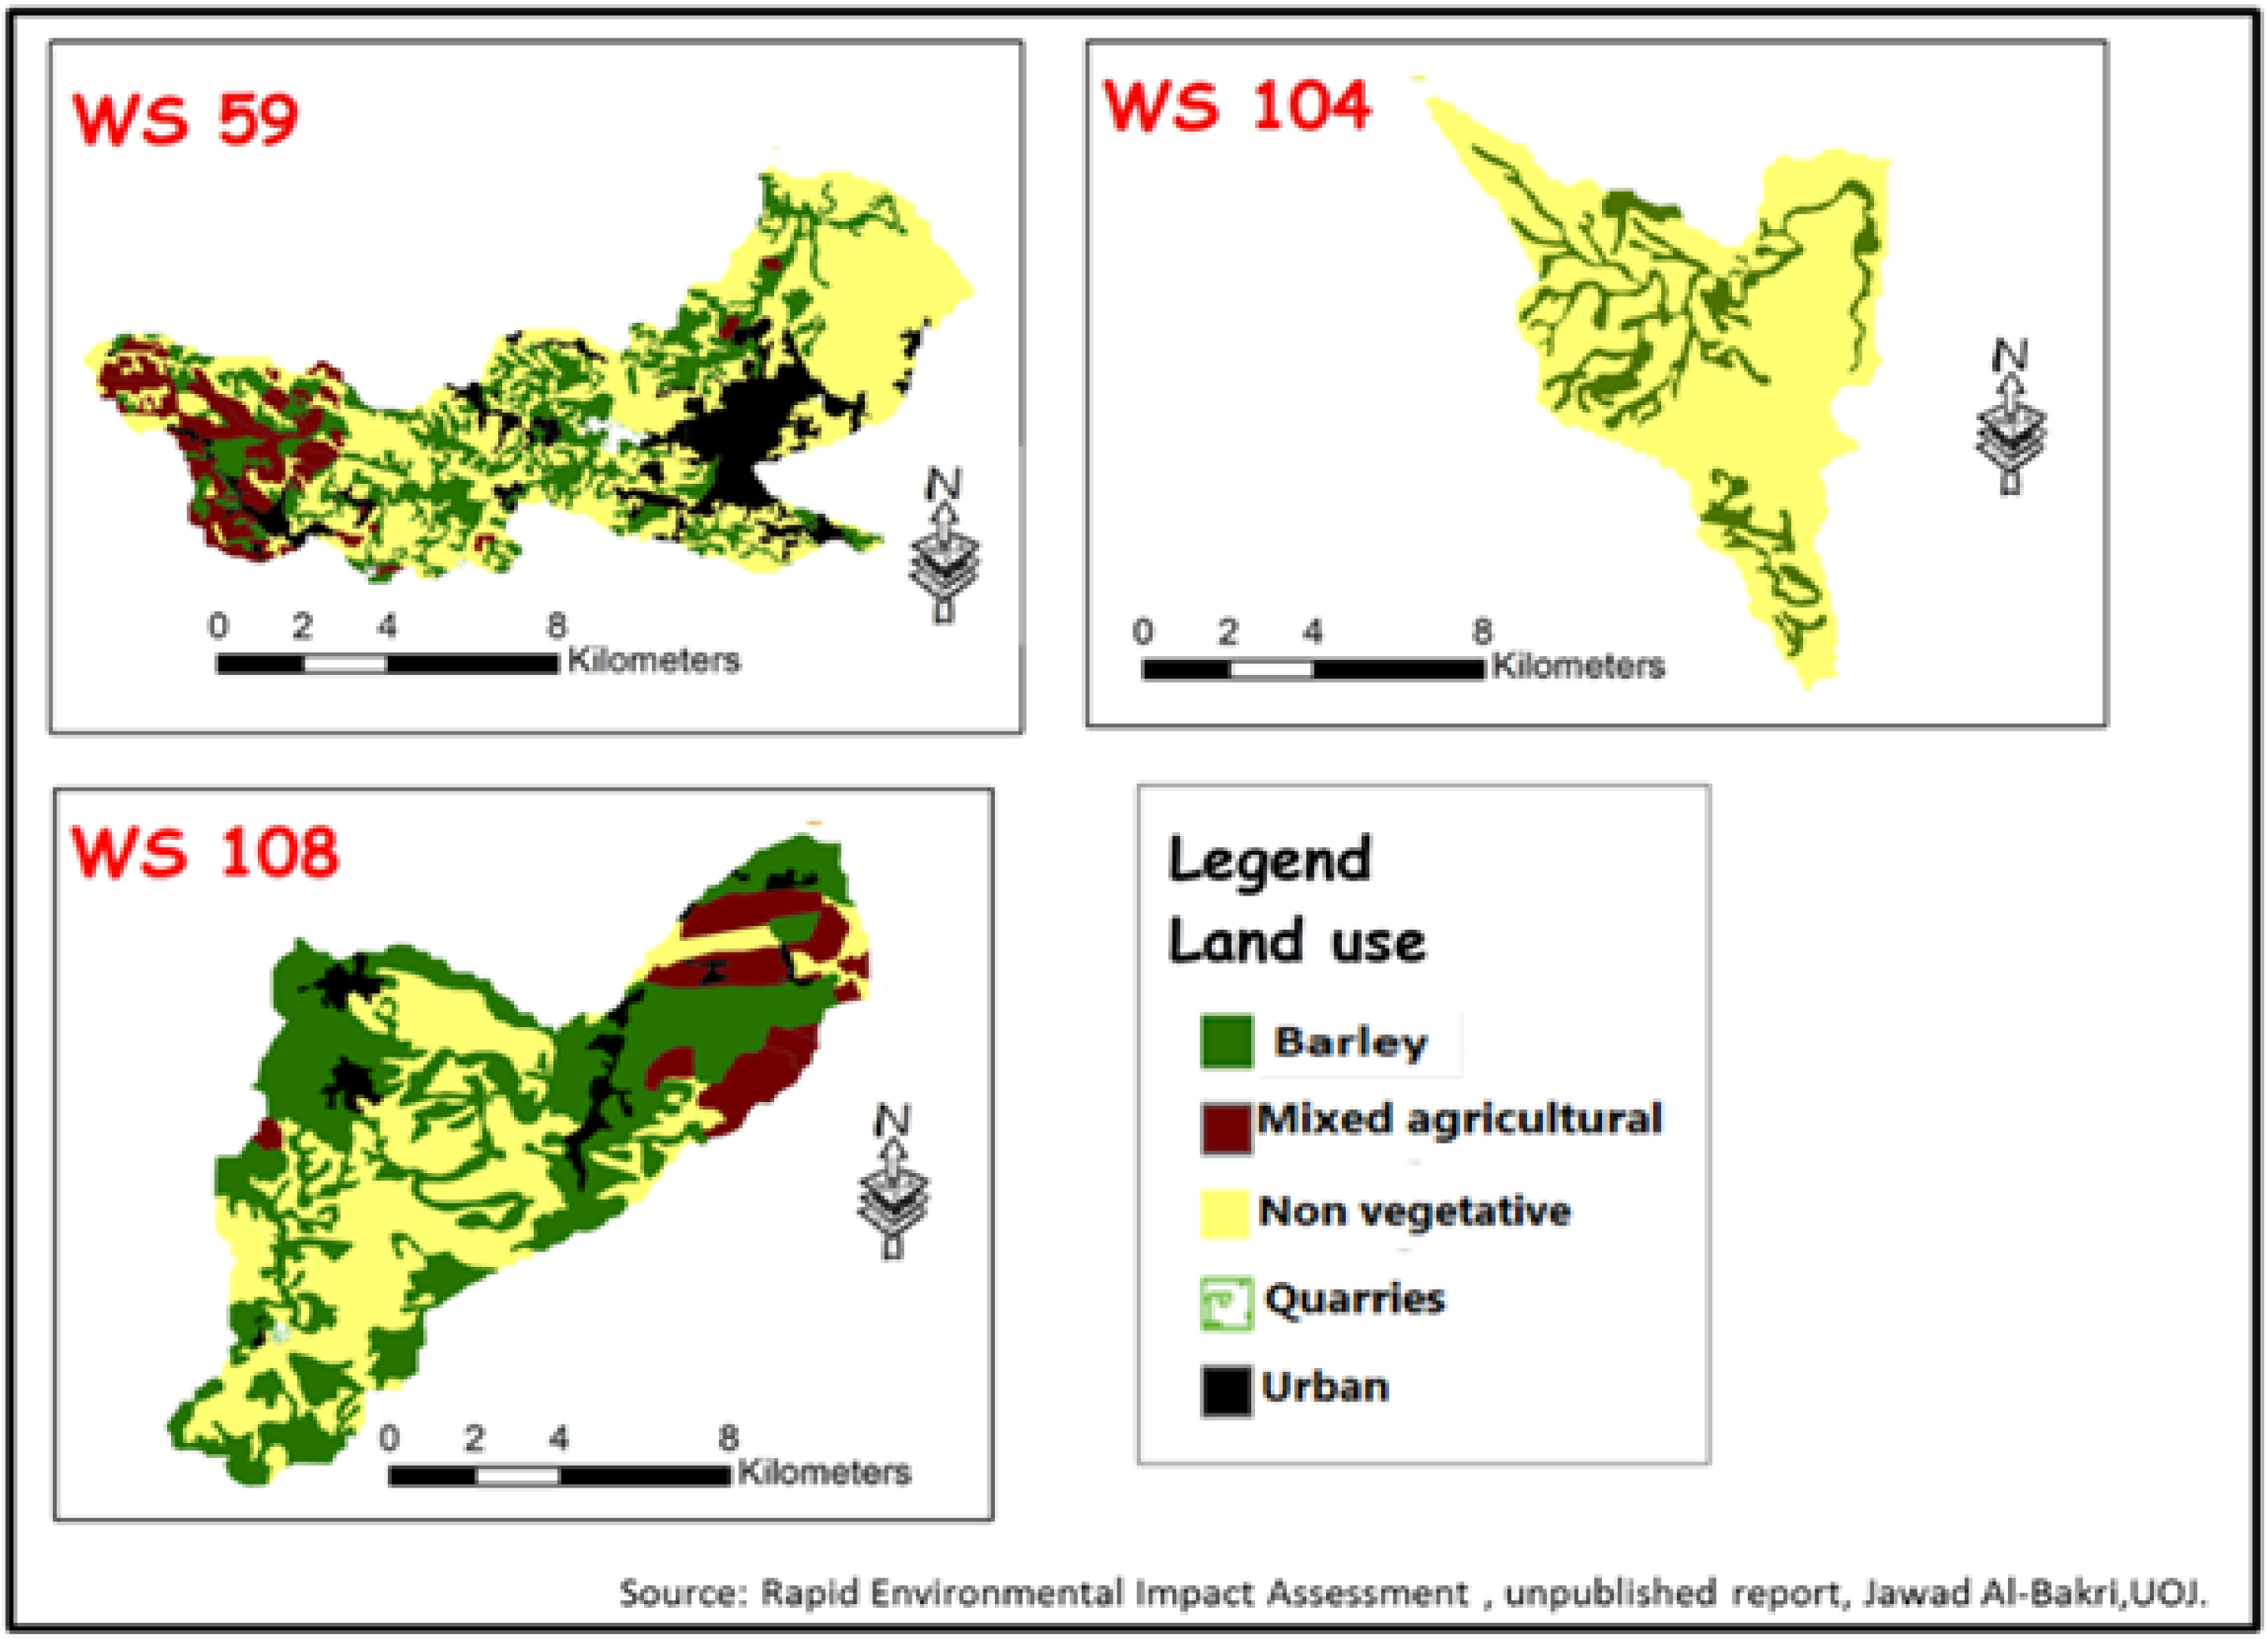
4.2. Spatial Features of Land Cover Types
4.2.1. Dominancy and Fragmentation
| LCTs | CA(m2) | CAP (%) | ||||
|---|---|---|---|---|---|---|
| WS 59 | WS 104 | WS 108 | WS 59 | WS 104 | WS 108 | |
| Barley | 2361 | 1171 | 2893 | 25 | 19 | 47 |
| Urban | 1350 | - | 297 | 14 | - | 5 |
| Non-vegetative | 4665 | 4908 | 2349 | 50 | 81 | 38 |
| Quarries | 75 | - | 11 | 0.8 | - | 0.2 |
| Mixed Agriculture | 904 | - | 597 | 10 | - | 10 |
| LCTs | Number of Patches | Mean Patch Size (m2) | ||||
|---|---|---|---|---|---|---|
| WS 59 | WS 104 | WS 108 | WS 59 | WS 104 | WS 108 | |
| Barley | 41 | 5 | 5 | 58 | 234 | 579 |
| Urban | 18 | - | 11 | 75 | - | 27 |
| Non-vegetative | 39 | 1 | 15 | 110 | 4908 | 157 |
| Quarries | 4 | - | 1 | 19 | - | 11 |
| Mixed Agriculture | 22 | - | 8 | 41 | - | 75 |
4.2.2. Connectivity and Shape
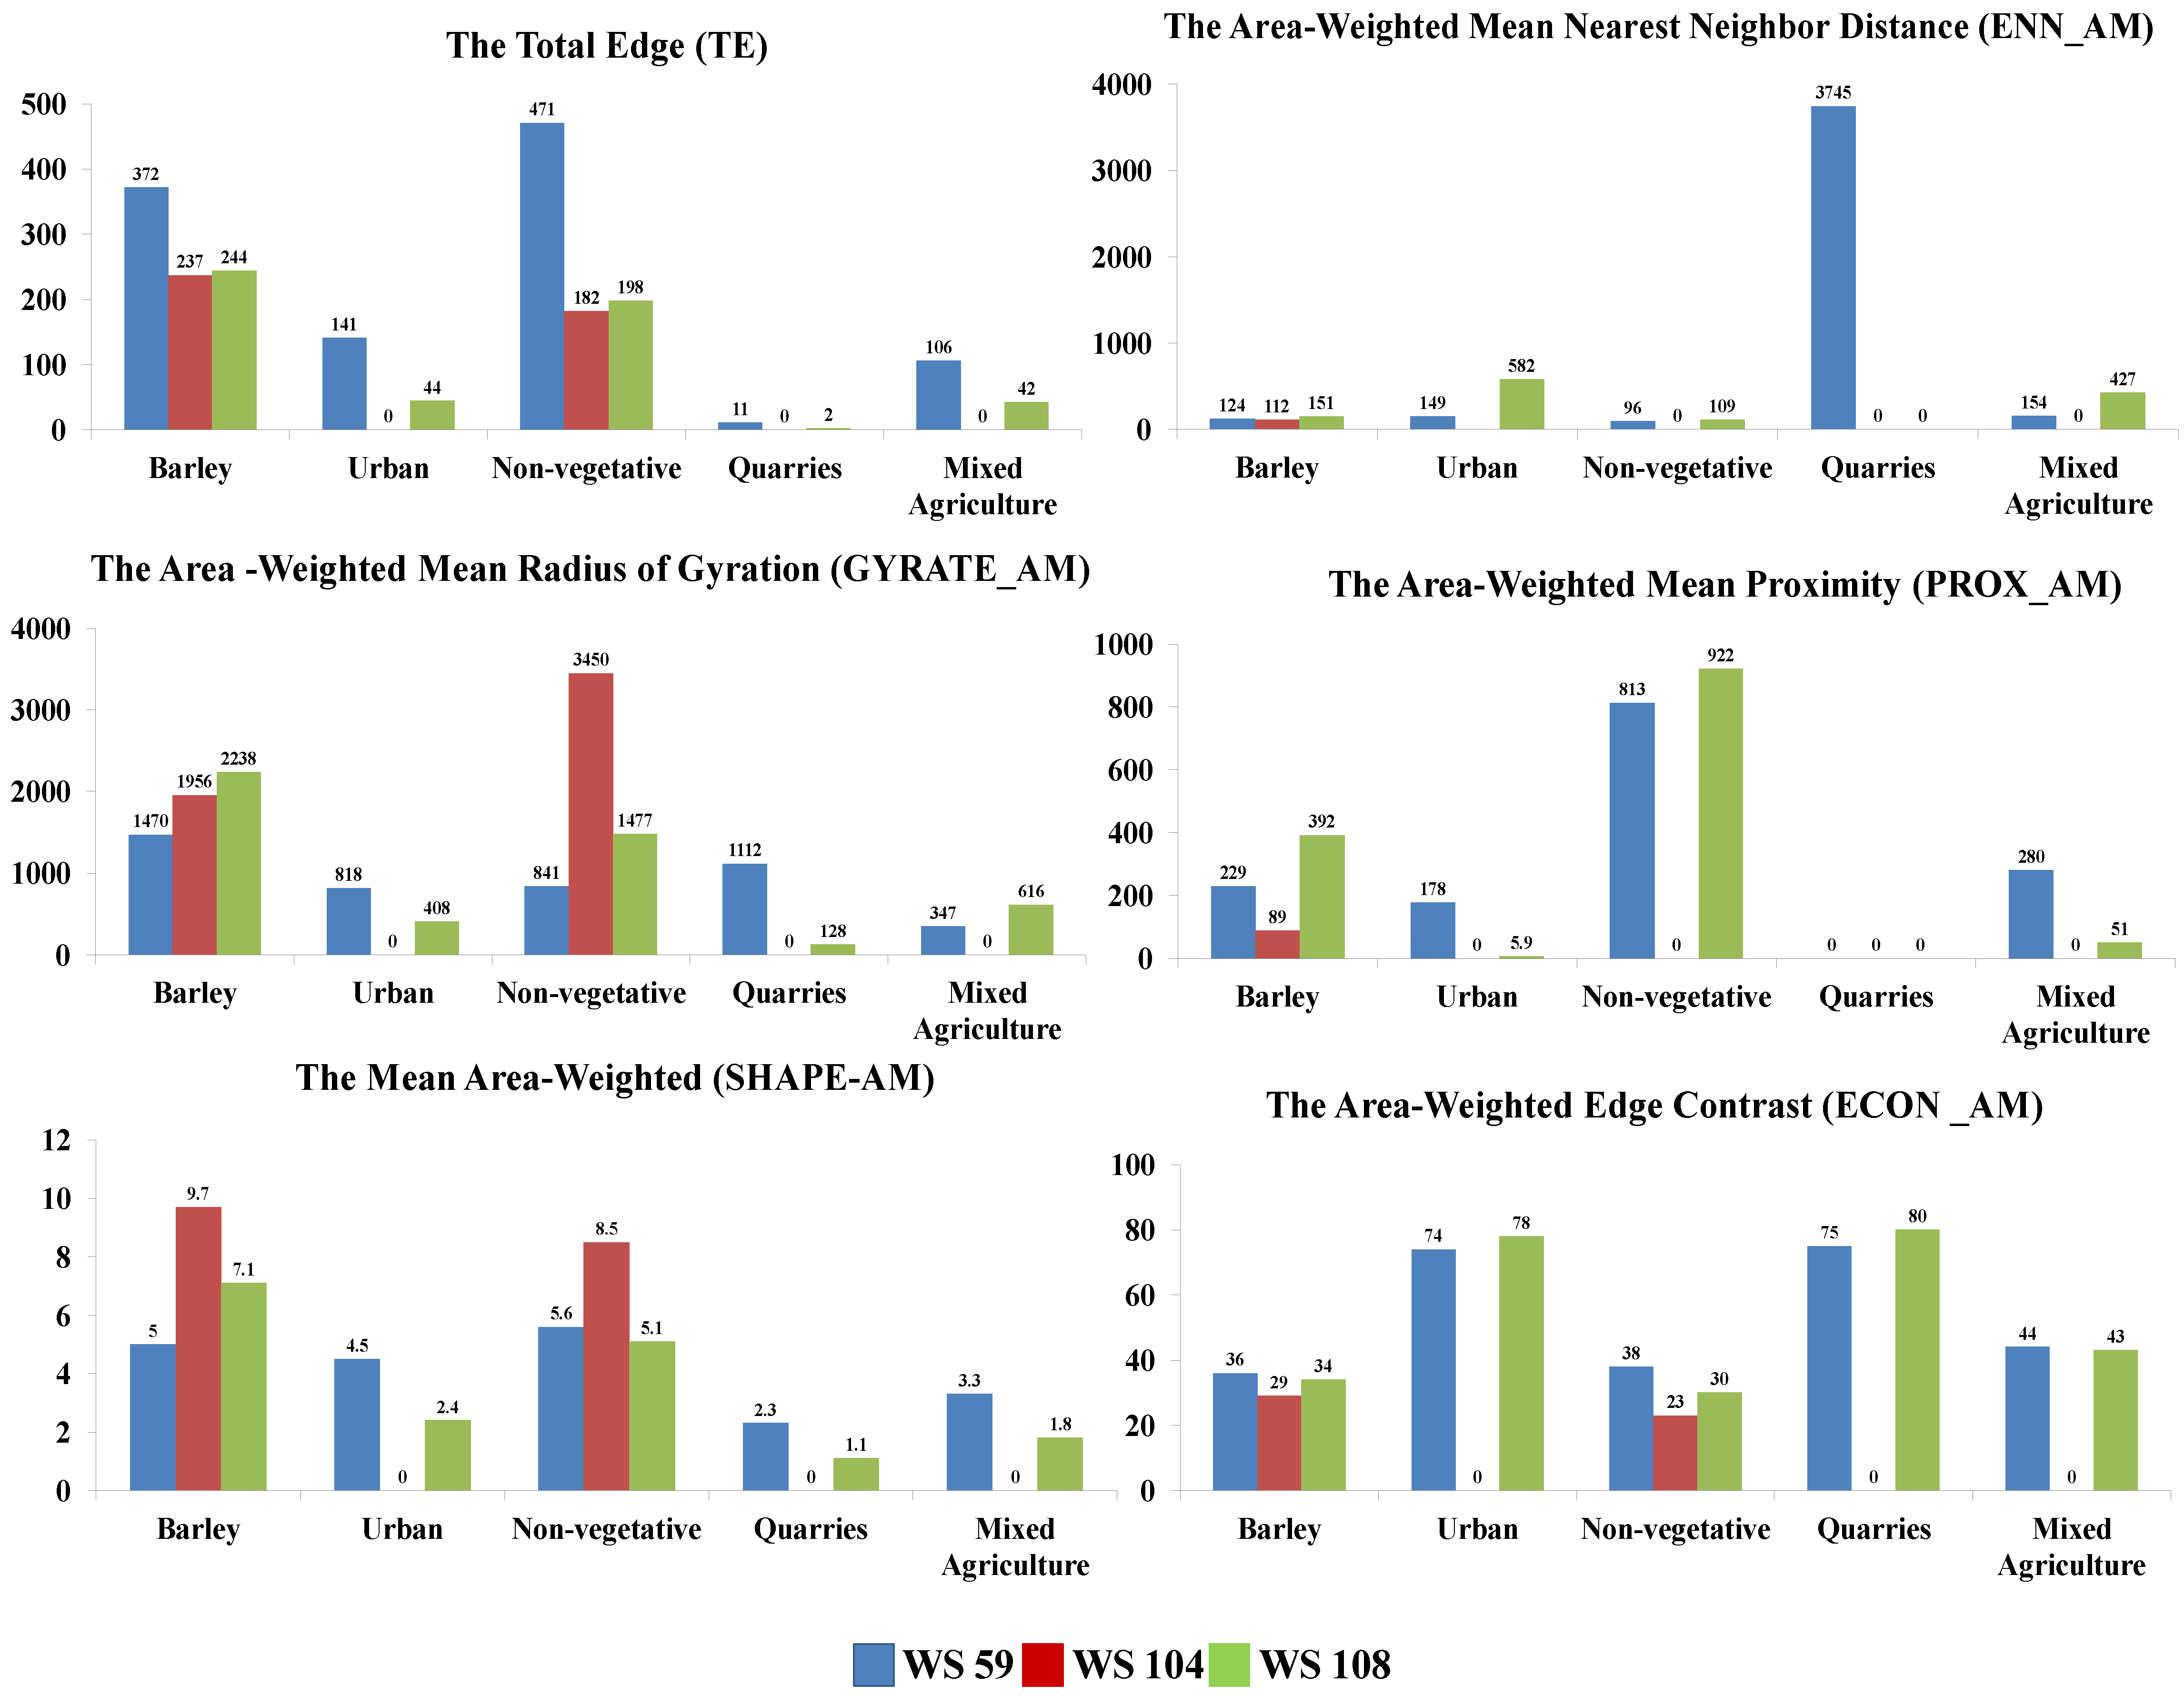
4.3. Determination of Candidate Rainwater Harvesting Sites
| Landscape Metrics | WS 59 | WS 104 | WS 108 | |||||
|---|---|---|---|---|---|---|---|---|
| Non-Vegetative | Barley | Mixed Agriculture | Non-Vegetative | Barley | Non-Vegetative | Barley | Mixed Agriculture | |
| PN | * | * | * | |||||
| MPS | * | * | * | * | ||||
| CA | * | * | * | * | ||||
| CAP | * | * | * | * | ||||
| TE | * | * | * | |||||
| SHAPE | * | * | * | |||||
| GYRATE | * | * | * | |||||
| ENN | * | * | * | |||||
| PROX | * | * | * | |||||
| ECON | * | * | * | * | ||||
| Total number of * | 7 | 2 | 1 | 7 | 3 | 7 | 6 | 1 |
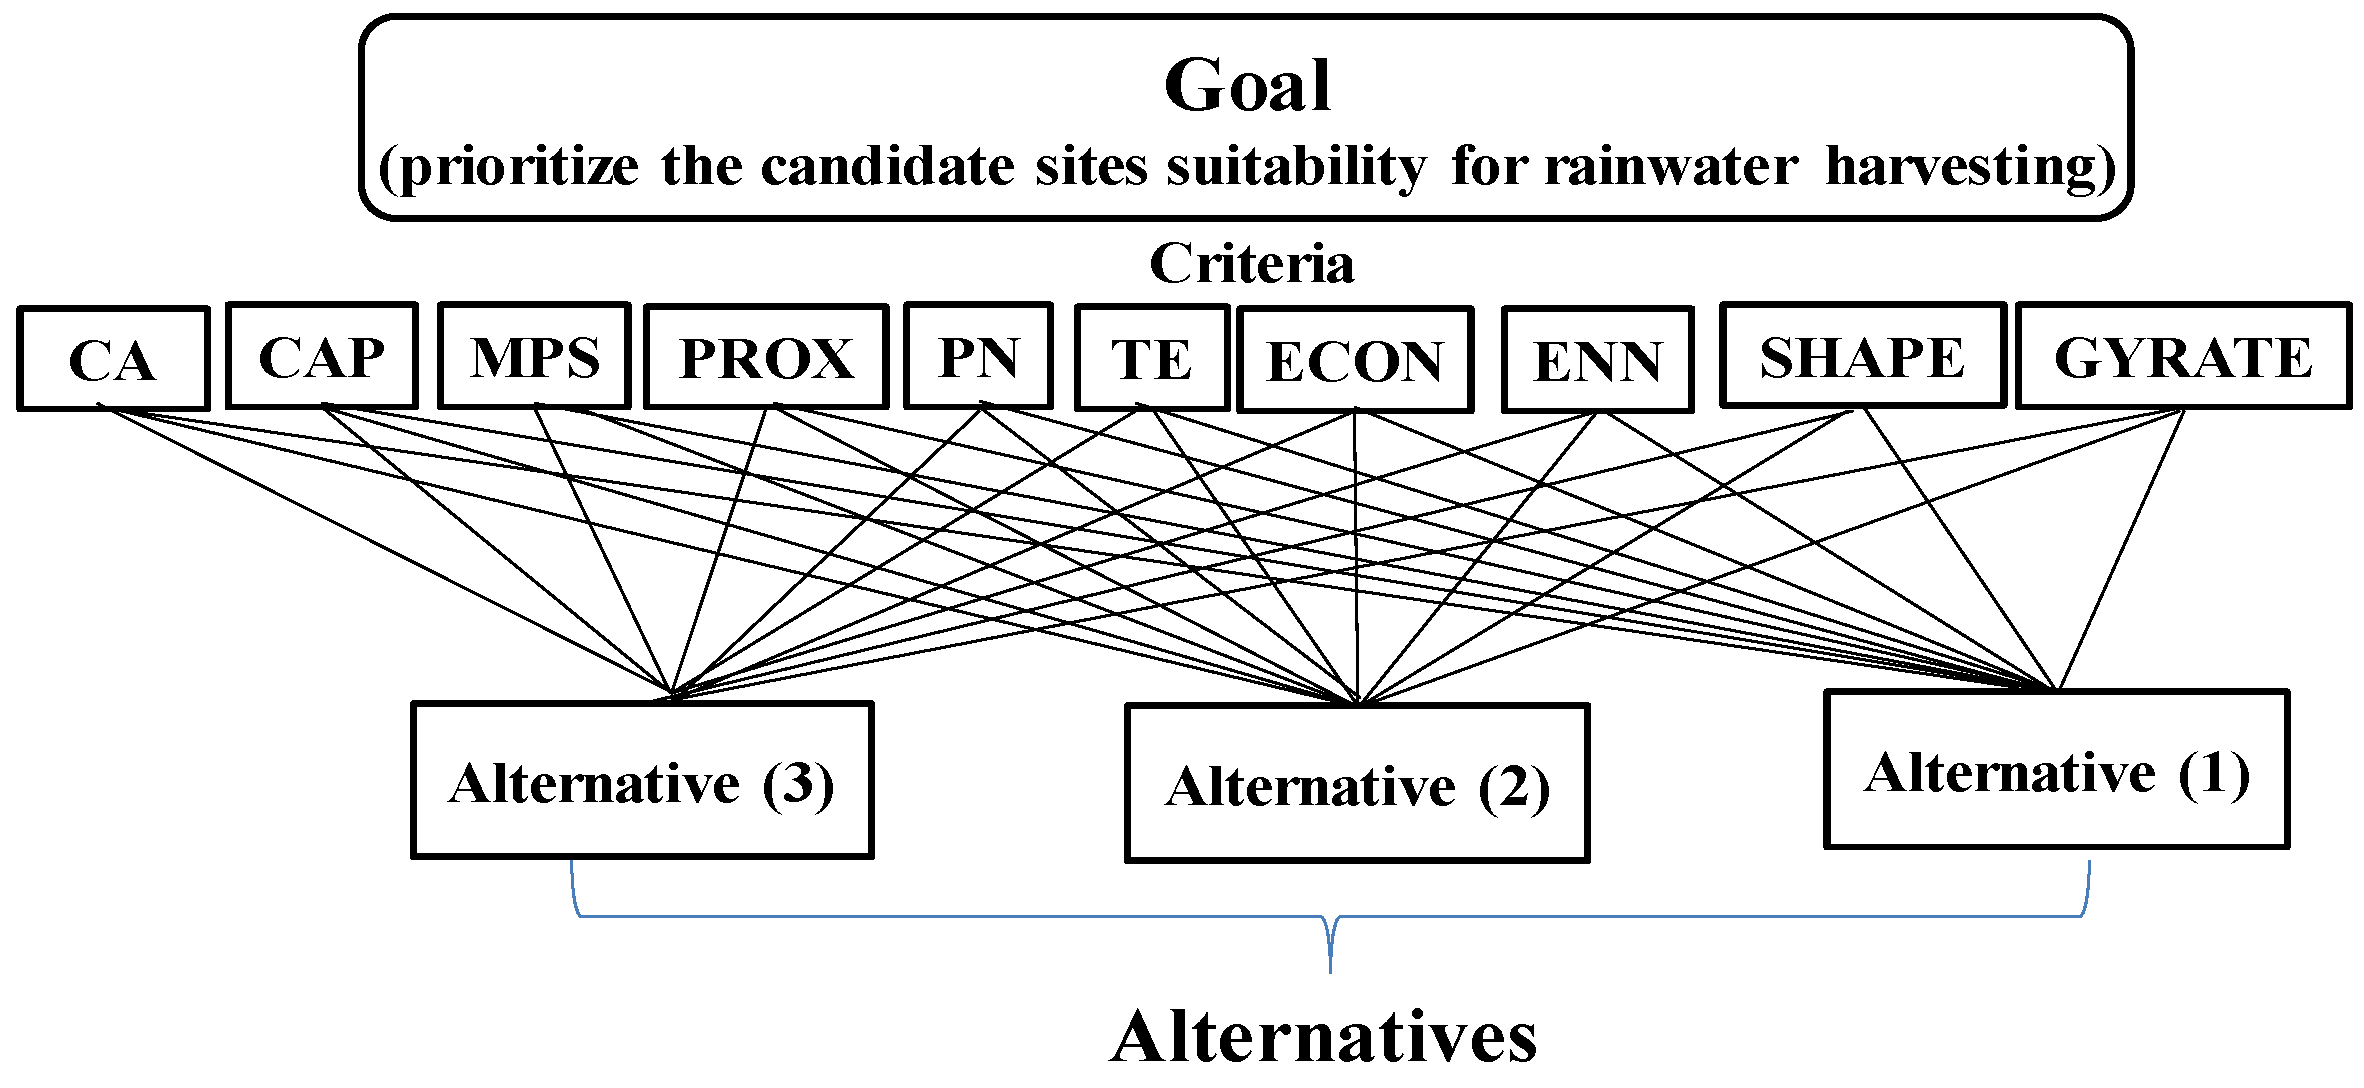
4.4. Analytic Hierarchy Process Results
| Alternatives | Ideals | Normals | Raw |
|---|---|---|---|
| Non-vegetative LCT in WS 59 | 0.609923 | 0.289810 | 0.144905 |
| Non-vegetative LCT in WS 104 | 1.000000 | 0.475159 | 0.237579 |
| Non-vegetative LCT in WS 108 | 0.494637 | 0.235031 | 0.117516 |
5. Discussion
6. Conclusions
Author Contributions
Conflicts of Interest
References
- Al-Adamat, R.; AlAyyash, S.; Al-Amoush, H.; Al-Meshan, O.; Rawajfih, Z.; Shdeifat, A.; Al-Harahsheh, A.; Al-Farajat, M. The combination of indigenous knowledge and geo-informatics for water harvesting siting in the Jordanian Badia. J. Geogr. Inf. Syst. 2012, 4. [Google Scholar] [CrossRef]
- Al-Bakri, J.T.; Salahat, M.; Suleiman, A.; Suifan, M.; Hamdan, M.R.; Khresat, S.; Kandakji, T. Impact of climate and land use changes on water and food security in jordan: Implications for transcending “the tragedy of the commons”. Sustainability 2013, 5, 724–748. [Google Scholar] [CrossRef]
- Ziadat, F.; Oweis, T.; Mazahreh, S.; Bruggeman, A.; Haddad, N.; Karablieh, E.; Benli, B.; Zanat, M.A.; Al-Bakri, J.; Ali., A. Selection and Characterization of Badia Watershed Research Sites; International Center for Agricultural Research in the Dry Areas (ICARDA): Aleppo, Syria, 2006. [Google Scholar]
- Ziadat, F.K.; Mazahreh, S.S.; Oweis, T.Y.; Bruggeman, A. A GIS Based Approach for Assessing Water Harvesting Suitability in a Badia Benchmark Watershed in Jordan. In Proceedings on the Fourteenth International Soil Conservation Organization Conference: Water Management and Soil Conservation in Semi-Arid Environments, Marrakech, Morocco, 14–19 May 2006.
- Critchley, W.; Siegert, K. Water harvesting; FAO: Rome, Italy, 1991. [Google Scholar]
- Shawahneh, N.; Saoub, H.; Oweis, T.; Haddad, N.; Karrou, M. Impact of Microcatchment Water Harvesting on the Diversity of the Badia Rangelands of Jordan. In Rehabilitation and Integrated Management of Dry Rangelands Environments with Water Harvesting; Report no. 9; International Center for Agricultural Research in the Dry Areas (ICARDA): Alepo, Syria, 2011; p. 85. [Google Scholar]
- Barron, J. Rainwater Harvesting: A Lifeline for Human Well-Being; A Rep. Prepared for UNEP by Stockholm Environment Institute; United Nations Environment Program (UNEP): Nairobi, Kenya, 2009. [Google Scholar]
- Mbilinyi, B.P.; Tumbo, S.D.; Mahoo, H.F.; Senkondo, E.M.; Hatibu, N. Indigenous knowledge as decision support tool in rainwater harvesting. Phys. Chem. Earth Parts A/B/C 2005, 30, 792–798. [Google Scholar] [CrossRef]
- Gowing, J.W.; Mahoo, O.; Hatibu, N. Review of rainwater harvesting techniques and evidence for their use in semi-arid Tanzania. Anzan. J. Agric. Sci. 1999, 2, 171–180. [Google Scholar]
- Al-Adamat, R.; Diabat, A.; Shatnawi, G. Combining GIS with multicriteria decision making for siting water harvesting ponds in Northern Jordan. J. Arid Environ. 2010, 74, 1471–1477. [Google Scholar] [CrossRef]
- Mbilinyi, B.; Tumbo, S.D.; Mahoo, H.F.; Mkiramwinyi, F.O. GIS-based decision support system for identifying potential sites for rainwater harvesting. Phys. Chem. Earth Parts A/B/C 2007, 32, 1074–1081. [Google Scholar] [CrossRef]
- Leitão, A.B.; Miller, J.; Ahern, J.; McGarigal, K. Measuring Landscapes: A Planner’s Handbook; Island Press: Washington, DC, USA, 2012. [Google Scholar]
- Lee, S.-W.; Hwang, S.-J.; Lee, S.-B.; Hwang, H.-S.; Sung, H.-C. Landscape ecological approach to the relationships of land use patterns in watersheds to water quality characteristics. Landsc. Urb. Plan. 2009, 92, 80–89. [Google Scholar] [CrossRef]
- Alberti, M.; Booth, D.; Hillc, K.; Coburna, B.; Avolio, C.; Coe, S.; Spirandelli, D. The impact of urban patterns on aquatic ecosystems: An empirical analysis in Puget lowland sub-basins. Landsc. Urb. Plan. 2007, 80, 345–361. [Google Scholar] [CrossRef]
- Sekar, I.; Randhir, T. Spatial assessment of conjunctive water harvesting potential in watershed systems. J. Hydrol. 2007, 334, 39–52. [Google Scholar] [CrossRef]
- McGarigal, K.; Marks, B.J. Spatial Pattern Analysis Program for Quantifying Landscape Structure (General technical report PNW); US Department of Agriculture, Forest Service, Pacific Northwest Research Station: Portland, OR, USA, 1995.
- Aguilera, F.; Valenzuela, L.M.; Botequilha-Leitão, A. Landscape metrics in the analysis of urban land use patterns: A case study in a Spanish metropolitan area. Landsc. Urb. Plan. 2011, 99, 226–238. [Google Scholar] [CrossRef]
- McGarigal, K.; Cushman, S.A.; Neel, M.C.; Ene, E. FRAGSTATS: Spatial Pattern Analysis Program for Categorical Maps. Computer Software Program. University of Massachusetts Amherst. Available online: www.umass.edu/landeco/research/fragstats/fragstats.html (accessed on 15 May 2015).
- Aithal, B.H.; Sanna, D.D. Insights to urban dynamics through landscape spatial pattern analysis. Int. J. Appl. Earth Obs. Geoinf. 2012, 18, 329–343. [Google Scholar]
- Zhang, Q.; Ban, Y. Analysis of Landscape Dynamics in Shanghai Using Landscape Metrics: Effects of Spatial Resolution. In Proceedings of the XXI Congress of International Society for Photogrammetry and Remote Sensing, Beijing, China, 3–11 July 2008.
- Saaty, T.L. How to make a decision: The analytic hierarchy process. Eur. J. Oper. Res 1990, 48, 9–26. [Google Scholar] [CrossRef]
- Saaty, T.L. Decision making with the analytic hierarchy process. Int. J. Serv. Sci. 2008, 1, 83–98. [Google Scholar] [CrossRef]
- Figueira, J.; Greco, S.; Ehrgott, M. Multiple Criteria Decision Analysis: State of the Art Surveys; Springer Science & Business Media: Berlin, Germany, 2005; Volume 78. [Google Scholar]
- Vaidya, O.S.; Kumar, S. Analytic hierarchy process: An overview of applications. Eur. J. Oper. Res. 2006, 169, 1–29. [Google Scholar] [CrossRef]
- Schmoldt, D.; Kangas, J.; Mendoza, G.A.; Pesonen, M. The Analytic Hierarchy Process in Natural Resource and Environmental Decision Making; Springer Science & Business Media: Berlin, Germany, 2013; Volume 3. [Google Scholar]
- Ramanathan, R. A note on the use of the analytic hierarchy process for environmental impact assessment. J. Environ. Manag. 2001, 63, 27–35. [Google Scholar] [CrossRef] [PubMed]
- Saaty, T.L. Decision Making for Leaders: the Analytic Hierarchy Process for Decisions in a Complex World; RWS Publications: Pittsburgh, PA, USA, 1999; Volume 2. [Google Scholar]
- Raes, D.; Lemmens, H.; Van Aelst, P.; Bulcke, M.V.; Smith, M. IRSIS—Irrigation Scheduling Information System; Reference Manual; Laboratory of land management, K.U. Leuven: Leuven, Belgium, 1988. [Google Scholar]
- Hobbs, R.J. Effects of landscape fragmentation on ecosystem processes in the Western Australian wheatbelt. Biol. Conserv. 1993, 64, 193–201. [Google Scholar] [CrossRef]
- Munroe, D.K.; Croissant, C.; York, A.M. Land use policy and landscape fragmentation in an urbanizing region: Assessing the impact of zoning. Appl. Geogr. 2005, 25, 121–141. [Google Scholar] [CrossRef]
- Nagendra, H.; Munroe, D.K.; Southworth, J. From pattern to process: Landscape fragmentation and the analysis of land use/land cover change. Agric. Ecosyst. Environ. 2004, 101, 111–115. [Google Scholar] [CrossRef]
- Dudley, N. Guidelines for Applying Protected Area Management Categories; IUCN: Gland, Switzerland, 2008. [Google Scholar]
- Gustafson, E.J.; Parker, G.R. Relationships between landcover proportion and indices of landscape spatial pattern. Landsc. Ecol. 1992, 7, 101–110. [Google Scholar] [CrossRef]
- Fuller, D.O. Forest fragmentation in Loudoun County, Virginia, USA evaluated with multitemporal Landsat imagery. Landsc. Ecol. 2001, 16, 627–642. [Google Scholar] [CrossRef]
- Taubenböck, H.; Wegmann, M.; Roth, A.; Mehl, H.; Dech, S. Urbanization in India—Spatiotemporal analysis using remote sensing data. Comput. Environ. Urb. Syst. 2009, 33, 179–188. [Google Scholar] [CrossRef]
- De Mendonça, R.A.M. The Use of Landscape Metrics on Multi-Temporal Forest-Non Forest Maps of Northeast Mato Grosso, Central Brazil. Master’s Thesis, University of Kingston, London, UK, September 2004. [Google Scholar]
- Turner, M.G. Landscape ecology: The effect of pattern on process. Annu. Rev. Ecol. Syst. 1989, 20, 171–197. [Google Scholar] [CrossRef]
- Cushman, S.A.; McGarigal, K.; Neel, M.C. Parsimony in landscape metrics: Strength, universality, and consistency. Ecol. Indic. 2008, 8, 691–703. [Google Scholar] [CrossRef]
- Saaty, T.L. The Analytic Hierarchy Process: Planning, Priority Setting, Resources Allocation; McGraw: New York, NY, USA, 1980. [Google Scholar]
- Saaty, T.L.; Vargas, L.G. Inconsistency and rank preservation. J. Math. Psychol. 1984, 28, 205–214. [Google Scholar] [CrossRef]
- Dolan, J.G.; Isselhardt, B.J.; Cappuccio, J.D. The Analytic Hierarchy Process in Medical Decision Making a Tutorial. Med. Decis. Mak. 1989, 9, 40–50. [Google Scholar] [CrossRef]
- Kosmas, C.; Danalatos, N.; Cammeraat, L.H.; Chabart, M.; Diamantopoulos, J.; Farand, R.; Gutierrez, L.; Jacob, A.; Marques, H.; Martinez-Fernandez, J.; et al. The effect of land use on runoff and soil erosion rates under Mediterranean conditions. Catena 1997, 29, 45–59. [Google Scholar] [CrossRef]
- Hernandez, M.; Kepner, W.G.; Semmens, D.J.; Ebert, D.W.; Goodrich, D.C.; Miller, S.N. Integrating a Landscape/Hydrologic Analysis for Watershed Assessment. In Proceedings of the First Interagency Conference on Research in the Watersheds, Agricultural Research Service, Benson, AZ, USA, 27–30 October 2003.
- McGarigal, K.; Cushman, S.A. Comparative evaluation of experimental approaches to the study of habitat fragmentation effects. Ecol. Appl. 2002, 12, 335–345. [Google Scholar] [CrossRef]
- Lindenmayer, D.B.; Fischer, J. Tackling the habitat fragmentation panchreston. Trends Ecol. Evol. 2007, 22, 127–132. [Google Scholar] [CrossRef] [PubMed]
© 2015 by the authors; licensee MDPI, Basel, Switzerland. This article is an open access article distributed under the terms and conditions of the Creative Commons Attribution license (http://creativecommons.org/licenses/by/4.0/).
Share and Cite
Albalawneh, A.; Chang, T.-K.; Huang, C.-W.; Mazahreh, S. Using Landscape Metrics Analysis and Analytic Hierarchy Process to Assess Water Harvesting Potential Sites in Jordan. Environments 2015, 2, 415-434. https://doi.org/10.3390/environments2030415
Albalawneh A, Chang T-K, Huang C-W, Mazahreh S. Using Landscape Metrics Analysis and Analytic Hierarchy Process to Assess Water Harvesting Potential Sites in Jordan. Environments. 2015; 2(3):415-434. https://doi.org/10.3390/environments2030415
Chicago/Turabian StyleAlbalawneh, Abeer, Tsun-Kuo Chang, Chun-Wei Huang, and Safa Mazahreh. 2015. "Using Landscape Metrics Analysis and Analytic Hierarchy Process to Assess Water Harvesting Potential Sites in Jordan" Environments 2, no. 3: 415-434. https://doi.org/10.3390/environments2030415
APA StyleAlbalawneh, A., Chang, T.-K., Huang, C.-W., & Mazahreh, S. (2015). Using Landscape Metrics Analysis and Analytic Hierarchy Process to Assess Water Harvesting Potential Sites in Jordan. Environments, 2(3), 415-434. https://doi.org/10.3390/environments2030415