Article

Effects of Reduced Seawater pH and Oil Contamination on Bacterial Communities and Biochemical Markers of Estuarine Animal Hosts

CESAM—Centre for Environmental and Marine Studies, Department of Biology, University of Aveiro, 3810-193 Aveiro, Portugal
*
Author to whom correspondence should be addressed.
Environments 2024, 11(2), 37; https://doi.org/10.3390/environments11020037
Submission received: 4 October 2023 / Revised: 31 January 2024 / Accepted: 9 February 2024 / Published: 17 February 2024

Abstract

:
Ecosystem functioning depends on complex interactions between microorganisms, hosts, and the environment. Changes in environmental conditions (e.g., ocean acidification) in combination with anthropogenic pollution have been shown to affect the composition and function of free-living microbial communities, but little is known about the effects these stressors on host-associated communities. This study aims to characterize the response of host-associated bacterial communities of the bottom-dwelling polychaete Hediste diversicolor and the epibenthic gastropod Peringia ulvae to oil contamination and reduced seawater pH. The independent and interactive effects of both stressors were simulated under controlled conditions. The response of host-associated bacterial communities was assessed using the high-throughput sequencing of the 16S rRNA gene and several biochemical markers related to host metabolic pathways, e.g., neurotransmission, anaerobic metabolism, biotransformation, oxidative stress, and energy consumption. In H. diversicolor, reduced seawater pH was associated with a high relative abundance of Cyanobacteria, while in P. ulvae oil contamination was associated with a reduction in the relative abundance of Chitinophagales. In P. ulvae, enrichment with oil hydrocarbon-degrading bacteria suggests a possible role of these organisms in the dispersion of oil hydrocarbon degraders. Furthermore, oil supplementation shifted some specific biochemical markers of gastropods related to oxidative stress and energy consumption, which suggests host stress. In general, the bacterial communities and biochemical markers of the gastropod were more affected by stressors than those of the polychaete. Overall, this study contributes to a better understanding of the response of host-associated bacterial communities of benthic macrofauna to anthropogenic contamination and environmental change.

1. Introduction

In recent decades, advances in DNA sequencing technologies have revealed the importance of host microbial communities on animal development, immunity, stress response, and overall health [1]. It is well known that changes in the associated microbiomes of animal hosts can produce effects that go beyond the host’s health: they can influence biogeochemical cycling, biodiversity, and, even, ecosystem processes [2]. One prime example of this is the microbiome–host–environment interaction that occurs in marine sponges: some of these organisms harbour among the densest microbial communities in the marine realm [3]. Sponges rely on this community for essential nutrients and defence, and, in return, their high cellular-turnover rates provide heterotrophic bacteria with a constant flow of nutrients and organic matter [4]. Altogether, this mutual exchange foments a highly diverse ecosystem in an otherwise oligotrophic and barren environment [4].
Currently, marine microbiome research seeks to understand the role that the interaction between host, microbiome, and environment has on the overall holobiont resilience [5]. Microorganisms can respond rapidly to environmental changes, suggesting that they may play a significant part in helping their hosts adapt to future climatic conditions and anthropogenic stressors [5,6]. Yet, few studies have until now analysed the combined effects of changing environmental conditions (e.g., reduced seawater pH and high temperatures) and pollution on both host health and their associated microbiomes. Previous studies have instead focused on characterizing the response of microbial communities from the surrounding environment (e.g., estuarine sediment and bacterioplankton) to these interactive effects [7,8,9,10].
Most current estimates indicate that atmospheric carbon dioxide partial pressure (pCO2) is more than 50 % higher in 2021 than in the pre-industrial era [11]. Although the rise has been attenuated by the ocean’s capacity to absorb about 30% of emitted CO2, it is not without a drawback. In seawater, absorbed CO2 alters the equilibrium of inorganic carbon ions, which reduces seawater pH [12]. Ocean pH has declined 0.017–0.027 units per decade since the late 1980s in >95% of the near-surface ocean [13], and some estimates expect it to further decline 0.3–0.4 units by 2100 [14]. Meanwhile, oil hydrocarbon detoxification in estuarine sediment has been shown to be affected by changes in seawater pH [7,9]. Specifically, it has been observed that reduced seawater pH conditions lower the abundance of certain sulphate-reducing bacteria, and this is associated with changes in xenobiotic toxicity and increased stress in benthic organisms, as, e.g., Hediste diversicolor and Peringia ulvae [9]. Changes in microbial communities were later found to be coupled with a reduction in specific archaeal groups and an increase in putative hydrocarbonoclastic fungi [7]. However, the impact of reduced seawater pH and oil contamination on the health of benthic macrofauna and associated microbial communities has yet to be fully investigated. Furthermore, the potentially deleterious effects of both factors (i.e., reduced seawater pH and oil contamination) at the biochemical level in the benthic macrofauna are seldom addressed in these types of studies, thus justifying their inclusion herein as a complementary (and therefore integrative) approach to gain a more comprehensive insight of the additional metabolic pathways triggered by the contemplated stressors.
Specifically, this study aims to investigate the independent and interactive effects of reduced seawater pH and oil contamination on both the associated bacterial communities and representative biochemical markers of two benthic organisms—the polychaete H. diversicolor and the gastropod P. ulvae—collected from an estuarine port sediment habitat. These species were chosen because they (1) are typically abundant in temperate coastal environments, including at the sampling site of this study; (2) are well-studied organisms in the Ria de Aveiro ecosystems having a vast publication record; and (3) represent individuals with two distinct benthic lifestyles, viz., sediment-dwelling (H. diversicolor) and epibenthic grazing (P. ulvae). These two organisms have different modes of life and distinct roles in the sediment. The polychaete H. diversicolor is a sediment-dwelling nereid polychaete from shallow marine and brackish ecosystems that creates and inhabits burrows; it is omnivorous and can act as a predator or deposit-feeder [15]. Its bioturbation activities are known to increase sediment oxygenation and promote the activity of aerobic hydrocarbonoclastic bacteria, thus influencing both qualitatively and quantitatively hydrocarbon biodegradation in sediments [15,16]. Furthermore, the transit of sediment through the digestive tracts of polychaetes can modulate sediment microbial assemblages and regulate biogeochemical cycling [17]. The gastropod P. ulvae grazes on microphytobenthos and periphyton in estuarine sediments [18]. Its activity primarily impacts superficial sediment through surface browsing and disruption, thus originating small sub-surface burrows [19]. As does H diversicolor, P. ulvae feeding behaviour can also modulate microbial assemblages and bacterial dispersion [20].
Under controlled microcosm conditions, numerous studies consistently demonstrated the sensitivity of H. diversicolor to changes in seawater pH [21,22,23,24]. Specifically, lower seawater pH values were observed to impact the osmotic regulation of the polychaete, augment its metabolic activity, and elevate oxidative stress biomarkers, thereby inducing cellular damage [24,25,26,27]. Furthermore, reduced seawater pH was also found to enhance the toxicity of certain xenobiotics, such as pharmaceuticals [22,24]. Although the impact of reduced seawater pH on P. ulvae remains unexplored, ocean acidification alters the marine carbonate chemistry, potentially diminishing calcification rates in shelled organisms. Notably, seawater pH has been demonstrated to exert a mild impact on the food consumption and survival of the marine gastropod Gibbula umbilicalis [28]. Despite their crucial roles in remediating polluted environments, both H. diversicolor and P. ulvae have exhibited susceptibility to the deleterious effects of oil hydrocarbon pollution, as documented in previous studies [28,29].

2. Materials and Methods

2.1. Microcosm Experiment

A microcosm experiment was carried out between May and July 2016 in an experimental life support system (ELSS). The ELSS maintains individual microcosms at a controlled temperature, by submersion in a water bath, while allowing for the simulation of a diurnal light and tidal cycle and the manipulation of seawater pH. The ELSS supports up to 32 microcosms in four independent modules, which allows for the testing of a total of eight different treatments (assuming four replicates each). More information regarding the architecture of the microcosm system can be found in Coelho et al., 2013 [21]
Sediment cores were collected at low neap tide on the 23 May 2016 at the Ílhavo channel of the Ria de Aveiro (40°38′42.5″ N 8°41′53.6″ W). The sampling site was a barren intertidal mudflat, briefly exposed during the low neap tide, and it was located in between various shipping harbours and adjacent to a fuel storage facility [22]. Sediment cores (≈13 cm high) were collected intact [following previously published guidelines [23]] and transferred to the ELSS. Photoperiod (14 h), salinity (32.6 ± 1.5 ppt), and temperature (19 ± 1.5 °C) were defined to simulate conditions recorded at the sampling location and kept constant. A factorial experiment was designed using sixteen microcosms (distributed throughout the four modules; see above) with four experimental treatments (Table S1): “Cont” (i.e., ‘control’; without oil and with normal pH), “OnpH” (i.e., ‘only pH’; without oil and with reduced seawater pH), “OnOi” (i.e., ‘only oil’; with oil and normal pH) and “pHOi” (i.e., ‘pH and oil’; with oil and reduced seawater pH). Each treatment had four replicates, one in each of the four ELSS modules. A stabilization period (with reduced and normal pH conditions in respective treatments) of 19 days was performed before oil contamination. This enabled the biological communities in the sediment cores to acclimatize to microcosm conditions. During this period, water pH in one of the two reservoirs was gradually decreased by 0.05 units daily, until it reached 7.16; this corresponded to a pH of ≈7.5 in the water columns of the individual microcosms. Water pH in reduced seawater pH reservoir was manipulated by bubbling CO2 [24]. This reservoir provided water to the microcosms with the reduced water pH treatments, while in the other reservoir, seawater pH was not manipulated and was the source of water to the microcosms with the normal pH treatments. Average seawater pH in tanks during the experimental period was 7.89 ± 0.13 for Cont, 7.52 ± 0.15 for OnpH, 7.91 ± 0.15 for OnOi, and 7.51 ± 0.18 for pHOi (average of all measurements of all replicates of each treatment during experimental period, i.e., after the acclimatization period). The difference between normal and reduced seawater pH microcosms (0.3–0.4) falls within the pH reduction predicted for the global sea surface in 2100 [14]. The experimental period began when the surface waters of the respective microcosms were contaminated with weathered Arabian Light Crude oil (provided by PETROGAL refinery; Matosinhos, Portugal). Oil (7.5 mL) was added to microcosms at 0.5% (Voil/Vwater) immediately following a simulated high tide (1500 mL), during five consecutive high tides. Previously, oil was allowed to evaporate in an aluminium tray, in a fume hood at ambient temperature, for 24 h to simulate atmospheric weathering. This weathering process reduced oil weight by 12.53% (w/w). The pH was monitored daily at the end of each low tide with a calibrated pH meter (Orion StarTM portable pH meter, Thermo Fisher Scientific Inc., Waltham, MA, USA). Detailed information regarding the microcosm experimental parameters and functioning can be found in the Supplementary Material and Methods section of the Supporting Information file.
This study focused on two aquatic organisms: the polychaete H. diversicolor and the gastropod P. ulvae. Seven and twenty organisms of H. diversicolor and P. ulvae, respectively, were collected at the same sampling site a day later and introduced in each microcosm. Details about organism collection can be found in the Supporting Information file. At the end of the experiment (i.e., 21 days after oil contamination), surviving individuals and sediment were collected for microbiological (organisms and sediment) and biochemical markers (only organisms) analyses. The organisms for DNA extraction were directly stored in absolute ethanol at −80 °C, whereas those for biochemical analyses were immediately frozen in liquid nitrogen and stored at −80 °C until processing. Sediment samples were collected by pooling the top centimetre of four mini-cores (ø 1.0 cm), creating one composite and homogeneous sample per microcosm. Sediment samples were stored at −80 °C until processing.
The experiment was designed to retrieve four independent replicates per treatment, with each microcosm module corresponding to a single replicate. However, due to high mortality caused by oil contamination in some treatments (OnOi and pHOi), the number of retrieved organisms (both H. diversicolor and P. ulvae) was few or none in some microcosms. Therefore, the number of microcosm replicates for DNA extraction was reduced to three for all combinations of treatments and organisms. Even then, P. ulvae individuals were only obtained in two out of the four replicates (tanks) of the pHOi treatment. Therefore, since this treatment lacked a minimum of three replicates, it was removed from the analysis (only for P. ulvae).

2.2. DNA Extraction

Samples for DNA extraction consisted of pools of 1–4 and 4–10 organisms per replicate for H. diversicolor and P. ulvae, respectively. Organisms were previously washed twice with a sterile saline solution to remove non-adherent bacteria before DNA extraction. A sediment subsample (0.5 g) was randomly weighed from the composite sample and used for the extraction. For all samples, DNA extraction was performed using FastDNATM Spin kit (MP Biomedicals, Santa Ana, California, USA) following the manufacturer’s instructions, except for P. ulvae samples, where bead-beating velocity was adjusted to 8 ms−1. A blank negative control with no sample was included.

2.3. Illumina MiSeq Sequencing and Sequence Analysis

The DNA extracted from organisms was analysed using high-throughput sequencing of the 16S rRNA gene. The V4/V5 region of the 16S rRNA gene was amplified by PCR using the primers 515F (5′-GTGYCAGCMGCCGCGGTAA-3′) and 926R (5′-CCGYCAATTYMTTTRAGTTT-3′), with the barcode on forward primer, and HotStarTaq Plus Master Mix Kit (Qiagen, Hilden, Germany). The PCR products were checked on a 2% agarose gel. Pooled samples were purified using calibrated Ampure XP beads. Library preparation and sequencing were performed at Molecular Research LP (Shallowater, TX, USA) on a MiSeq sequencing platform following standard Illumina protocols (Illumina, San Diego, CA, USA). The 16S rRNA gene amplicon libraries were analysed using QIIME2 [version 2020.8; [25]]. In most samples, it was not possible to join most forward and reverse reads and, since forward-read data (originating from the 515F end of the amplicon) had better quality, we carried out the analysis with forward-read data only. The DADA2 plugin [26] in QIIME2 was used to trim sequences (final length of approximately 250 nt), demultiplex samples, remove chimeras, and generate an amplicon sequence variant (ASV) abundance table.
Taxonomy was assigned to ASVs using a scikit-learn Naïve Bayes classifier based on the SILVA database of the 16S rRNA gene reference sequences at 99% similarity (version 138, released December 2019). The classifier was trained using the qiime feature-classifier algorithm in QIIME2 (version 2020.8) using reference sequences trimmed and truncated at the 515F and 926R regions. A unique number was assigned to each ASV. The ASVs that also occurred in the negative control were excluded from the table. Non-bacterial, mitochondrial, and chloroplast sequences were also removed. A list of removed sequences and their representative sequence are listed in the Supplementary Dataset S2 made available in Supplementary Materials.

2.4. Biochemical Markers Assay

A battery of biochemical markers related to neurotransmission (acetylcholinesterase, AChE), anaerobic metabolism (lactate dehydrogenase, LDH), biotransformation (glutathione S-transferase, GST), oxidative stress (catalase, CAT; lipid peroxidation, LPO) and energy consumption (total lipids, total carbohydrates, and total proteins, energy available—Ea, energy consumption—Ec, and cellular energy allocation—CEA) were determined. These biochemical markers were selected based on previous studies which showed that abiotic and/or chemical stressors induced significant effects, at the biochemical level, on either H. diversicolor [9,27] or P. ulvae [9]. For the biochemical markers assay, 3–8 and 5–20 organisms were used for each replicate of H. diversicolor and P. ulvae, respectively. In H. diversicolor, and because of oil, it was only possible to obtain one replicate for the OnOi and pHOi treatments. The biochemical markers’ analyses were performed in the whole-body (soft tissues) homogenates of both organisms.
After thawing on ice, all samples were homogenized with an ultrasonic homogenizer (Sonifier 250A, Branson Ultrasonics, Danbury, CT, USA) in specific homogenization buffers. Subsequently, an aliquot of 150 µL of the resulting homogenate was transferred to a microtube with 4 µL 2,6-Di-tert-butyl-4-methylphenol for LPO determination. The remaining homogenate was centrifuged at 10,000× g for 20 min at 4 °C to separate the post-mitochondrial supernatant. Then, this fraction was divided into aliquots and further diluted in each specific homogenization buffer whenever necessary for the subsequent quantification of each biochemical marker. All reactions were performed in 96-well microplates at 25 °C and determined spectrophotometrically in a microplate reader (Multiskan Spectrum, Thermo Fisher Scientific, Waltham, USA). The reagents for the determination of biochemical markers were of the highest available analytical grade quality (≥99%) and were purchased from Merck KGaA (Darmstadt, Germany), except the Bradford reagent (Bio-Rad, Munich, Germany). A detailed description of the methodologies used for the biochemical markers assay can be consulted in the Materials and Methods section i the Supplementary Materials file.

2.5. Data Analysis

A table containing the ASV counts per sample (Supplementary Dataset S1 in Supplementary Materials) was imported into R (version 4.1.0) and used to compare community diversity and composition, and assess the relative abundance of selected higher taxa. Richness, evenness (Pielou’s J), Fisher’s alpha, and Shannon’s H’ diversity indices were obtained using the rarefy() and diversity() functions in ‘vegan’ [28]. Diversity parameters and relative abundances of selected bacterial higher taxa, as well as the most abundant ASVs (50 most abundant) were tested for significant variation among categorical factors ‘oil’ and ‘pH’ and their interaction (‘oil’ * ’pH’) through a two-way ANOVA f-test. The anova() function in R was applied to generalized linear models (GLM) created using the glm() function in R [29]. Wilcoxon rank-sum test was used for pairwise comparison of diversity indexes between treatments through the pairwise.wilcox.test() algorithm in the ‘stats’ package in R with p-value correction using the less conservative false-discovery rate. Principal Coordinates Analysis (PCoA) ordinations, which were created for the full dataset and separately for each species, using Bray–Curtis dissimilarities of ASV composition and using the ordinate() function in ‘phyloseq’. Biplot ordinations were produced to visualize differences in community composition according to treatment using previous ordinations by using the plot_ordination() function with the type of argument set to ‘biplot’. Significant differences among factors and their interaction (’oil’ * ‘pH’) were determined using the adonis() function for permutational multivariate analysis of variance (PERMANOVA) in ‘vegan’ [28]. The BLAST search tool (http://www.ncbi.nlm.nih.gov/, assessed on 7 July 2021) was used to compare representative sequences of the top 50 most abundant ASVs of each organism with sequences in the NCBI nucleotide collection (nr/nt) database using standard parameter settings [30]. Sequences that exhibited the highest levels of similarity to our data were considered closely related organisms. A PERMANOVA was used to test for significant differences among factors for each biochemical marker using the adonis() function in the ‘vegan’ package [28]. Each biochemical marker was log (x + 1) transformed and a distance matrix was constructed using the Euclidean distance with the vegdist() function in the ‘vegan’ package. In the PERMANOVA, the Euclidean distance matrix was used as the response variable. A detailed description of the methodologies used for data analysis can be consulted in the Supplementary Materials and Methods section in Supplementary Materials. The ASV abundance table with taxonomic classification can be consulted in Supplementary Dataset S1 in Supplementary Materials.

2.6. Predictive Functional Profiles

Functional profiles based on the Kyoto Encyclopedia of Genes and Genomes (KEGG) orthologs were predicted for all samples using PICRUSt2 software (Phylogenetic Investigation of Communities by Reconstruction of Unobserved States version 2.3.0) [31]. The ASV table and representative sequences were used as inputs in the picrust2.pipeline.py algorithm with default arguments. The obtained KEGG ortholog abundance table was summarized into a 3-tier KEGG pathway abundance table based on KEGG pathway maps (https://www.genome.jp/kegg/pathway.html, assessed on 28 July 2020) in R and was analysed with default arguments using the LDA Effect Size (LEfSe) algorithm [32] made available at https://huttenhower.sph.harvard.edu/galaxy/ (assessed on 7 July 2021).

2.7. Denaturing Gradient Gel Electrophoresis (DGGE)

The bacterial communities from sediment and host-associated samples were analysed using DGGE. The 16S rRNA gene was amplified using a nested PCR approach. In the first PCR, the universal bacterial primers F-27 and R-1492 were used to amplify the c.1450 bp amplicon of the 16S rRNA gene [33]. The amplicons obtained from the first PCR were used as a template for a second PCR with bacterial DGGE primers F984-GC and R1378, and PCR was performed according to published guidelines [34], with the exception that only 25 cycles were carried out. The DGGE of the c. 473 bp-amplified rRNA gene sequences was performed using the Dcode System (Universal Mutation Detection System, Bio-Rad, Hercules, California, USA). Amplified bacterial 16S rRNA gene fragments were loaded onto a 40 to 60% denaturing gradient polyacrylamide gel. The run was performed in 1 × Tris-acetate-EDTA buffer at 60 °C, at a constant voltage of 80 V for 960 min. The DGGE gels were silver-stained according to published guidelines [34]. Silver-stained gels were digitalized using an EPSON Pro Scanner (Epson, Nagano, Japan).
The analysis of DGGE bacterial community profiles was performed using the software program BioNumerics version 7.6 (Applied Maths, Sint-Martens-Latem, Belgium) as previously described [35]. The background was subtracted using a rolling disk method with an intensity of 8 (relative units), and the lanes were normalized. Data was exported into R and differences among sediment and organisms associated with bacterial communities were assessed using a PCoA generated by the cmdscale() function in ‘stats’, with a Bray–Curtis distance matrix generated with the vegdist() function from ‘vegan’ [28] as input. A PERMANOVA was used to test for compositional differences between sediment- and organism-associated bacterial communities in R using the adonis() function from vegan [28].

3. Results and Discussion

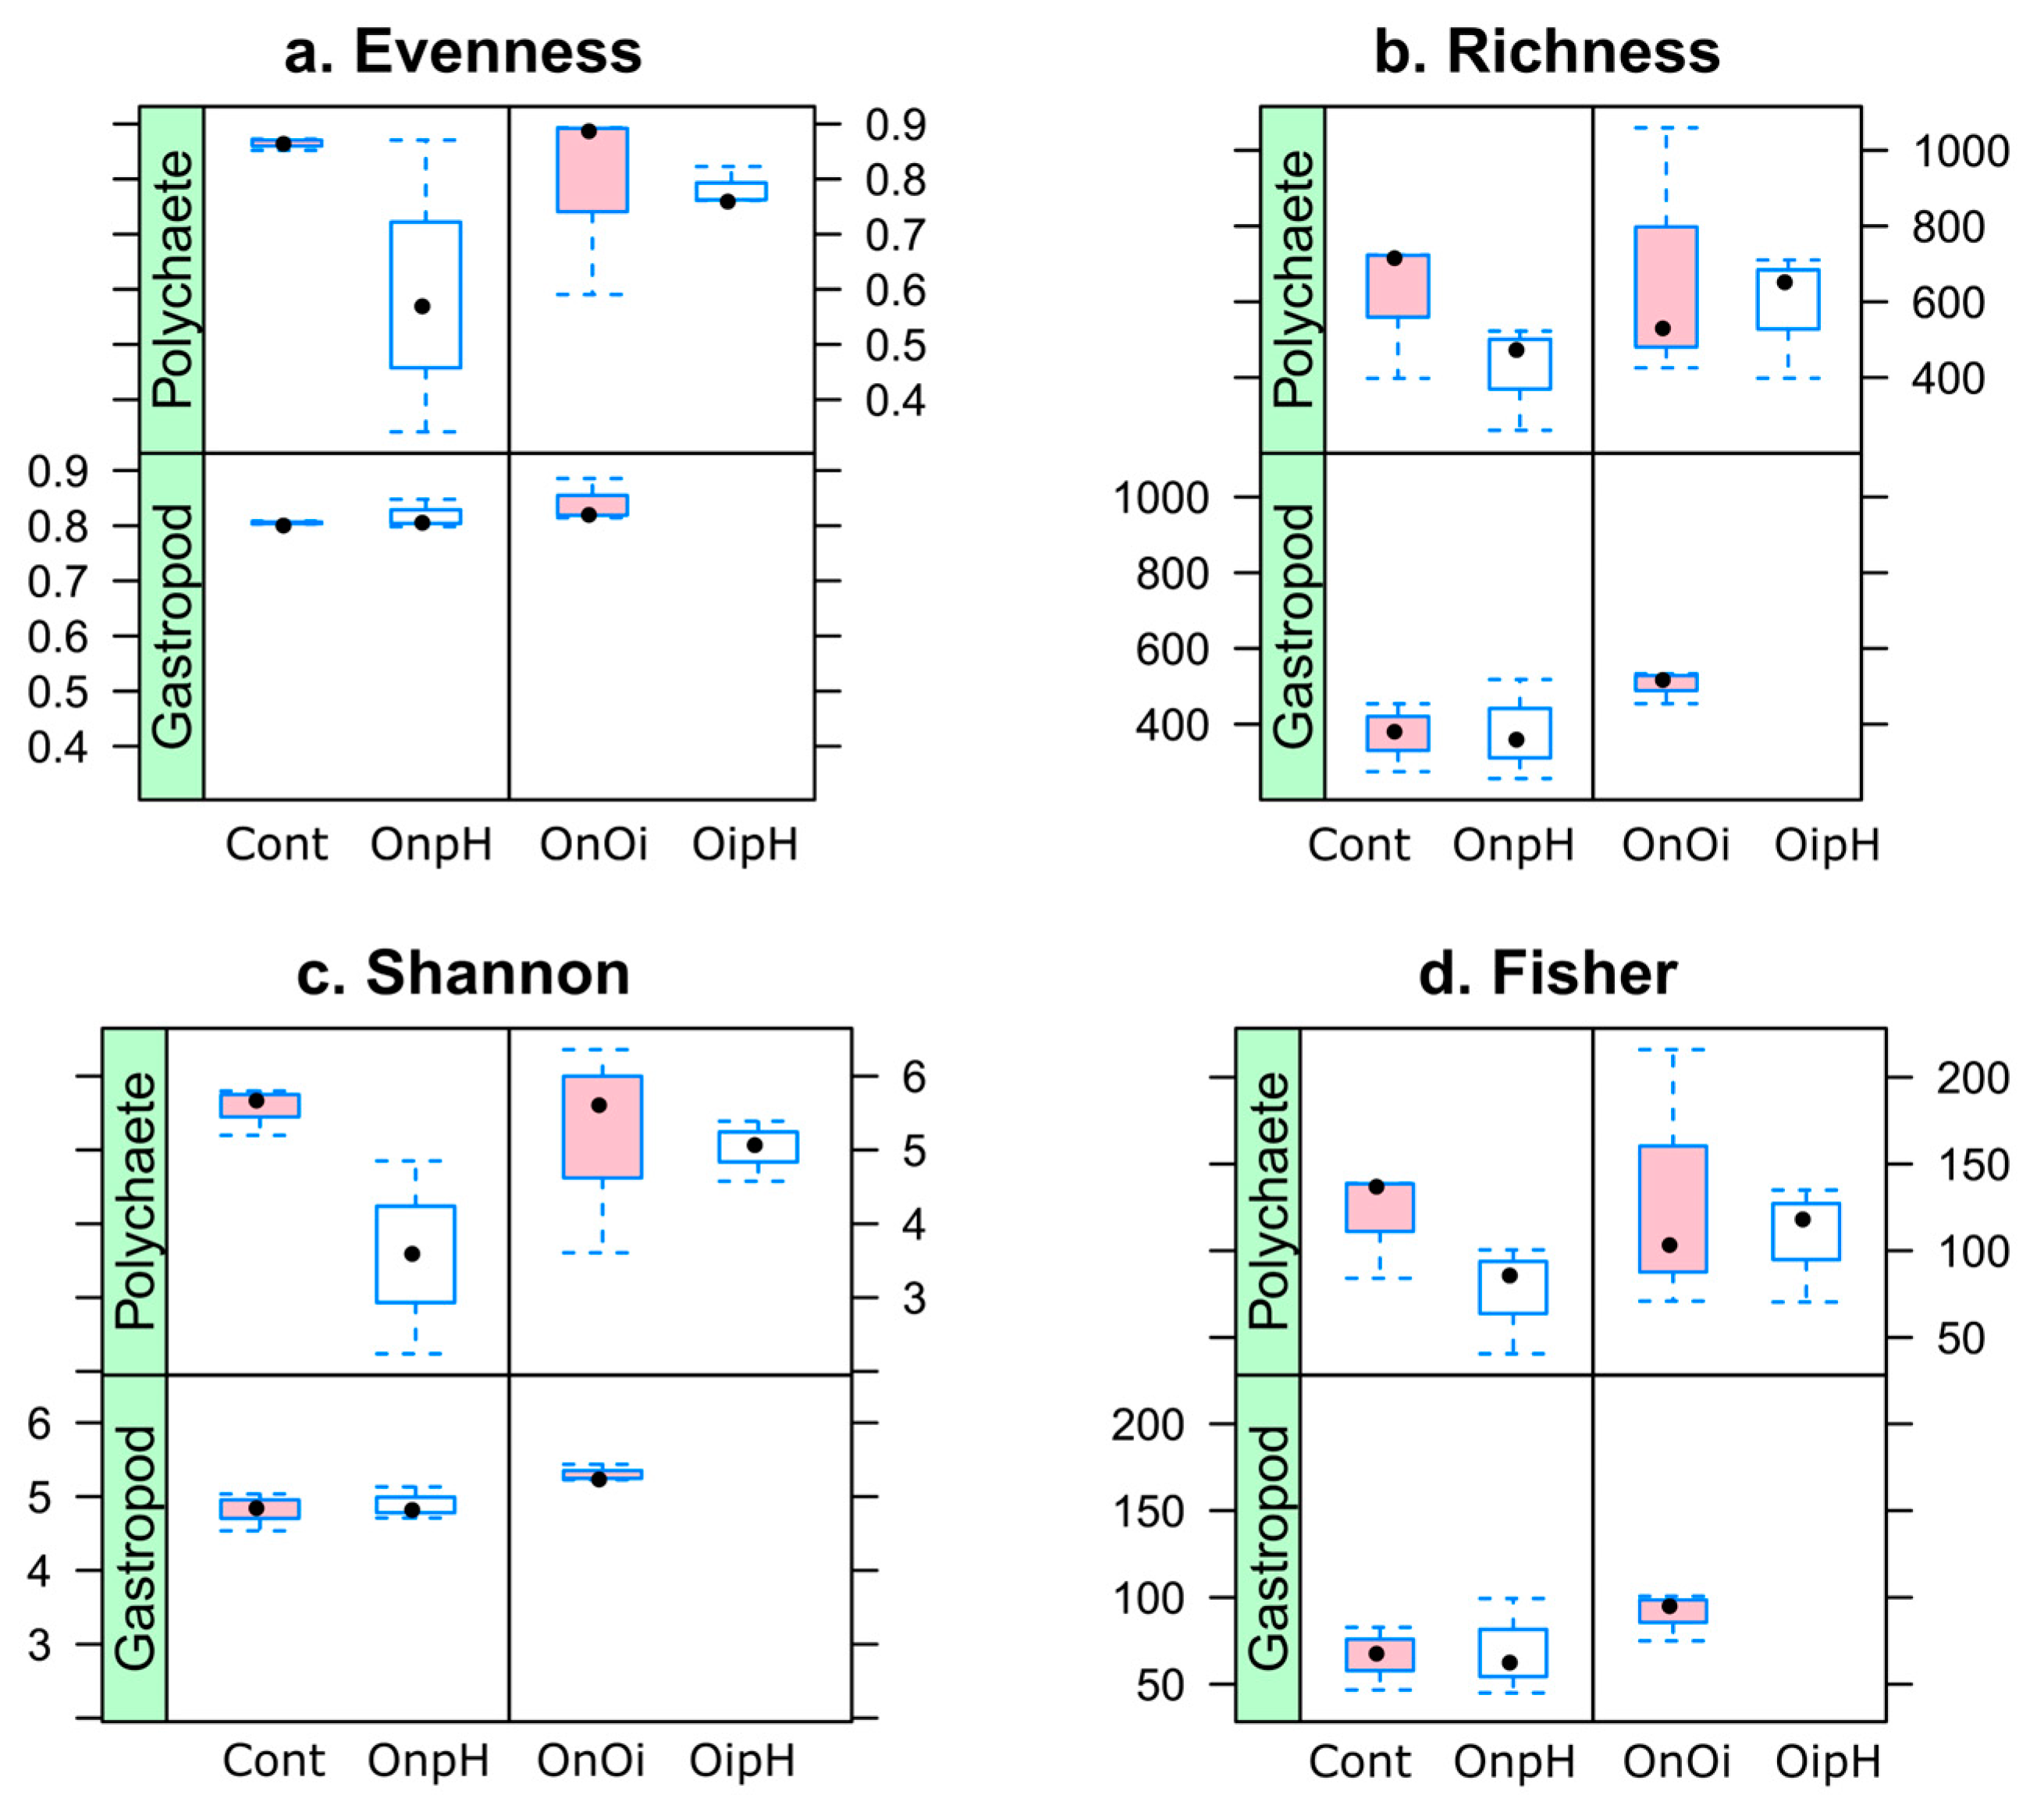
3.1. Diversity and Composition of H. diversicolor- and P. ulvae-Associated Bacterial Communities

After quality control, our dataset consisted of 844,190 sequences and 5734 ASVs. The factor ‘oil’ proved to be a significant predictor of variation in Shannon’s H’ diversity index of the gastropod P. ulvae (Figure 1c, Table S2). Samples exposed to oil contamination (OnOi) had higher values of Shannon’s diversity index than samples not exposed to oil contamination (Cont and OnpH). There were no other significant differences among factors in the diversity indices of both species (Figure 1; Tables S2 and S3). A pairwise comparison of diversity indexes among treatments revealed no significant differences between treatments (WILCOXON: p > 0.05). The PCoA ordination of the ASV composition clearly showed a separation between host-associated communities of the polychaete H. diversicolor and the gastropod P. ulvae along the first axis, with each organism forming a distinct cluster (Figure 2A). This separation was further confirmed by PERMANOVA (F1,19 = 9.5383, R2 = 0.33423, p = 0.001), indicating that the host is a major driver of community composition. A DGGE fingerprint analysis using sediment and host DNA samples was executed to determine the efficiency of the protocol in removing sediment-bound microbes from the host samples. The DGGE results revealed a clear separation between the bacterial communities from the sediment and both hosts (Figures S1 and S2), indicating that each benthic host possesses a unique bacterial signature that differs from their sediment habitat.
To understand the differences between treatments, separate PCoAs were conducted for each host. In the PCoA for the polychaete, only the OnpH samples appear to cluster together in the bottom half of the plot, yet PERMANOVA revealed that neither factor nor their interaction were significant predictors of dissimilarities between treatments (Figure 2C; Table S4). In contrast, the gastropod’s bacterial communities revealed clear separation based on the treatments. The first axis separated the Cont and OnpH samples from the OnOi samples while the second axis separated Cont and OnOi samples from those from the OnpH treatments (Figure 2B). The factor ‘oil’ proved to be a significant predictor of variation in ASV composition in the gastropod associated bacterial communities (PERMANOVA: F1,6 = 2.459, R2 = 0.244, p = 0.001; Table S4). For the polychaete, a greater variation in ASV composition was observed within treatments compared to the gastropod (Figure 2A,C). This could be attributed to the unique characteristics of the individual worm’s bacterial community. This feature appears to be supported by a previous study, which found a higher variation in the overall bacterial communities of the gut tracts of the polychaete H. diversicolor compared to individual burrow systems [17]. Hochstein et al., 2019, also found a similar trend in the polychaete Capitella teleta, with 66% of the identified OTUs from the gut being unique to the worm but displaying a high inter-individual variability [36]. Interestingly, in another study, when analysing the response of the bacterial community of C. teleta to fluoranthene (a polycyclic aromatic hydrocarbon; PAH), the authors could not find a significant effect in the associated bacterial community upon exposure to this xenobiotic [37]. Probably, the associated microbiome of C. teleta could play an important role in the metabolism and transformation of PAHs [36].

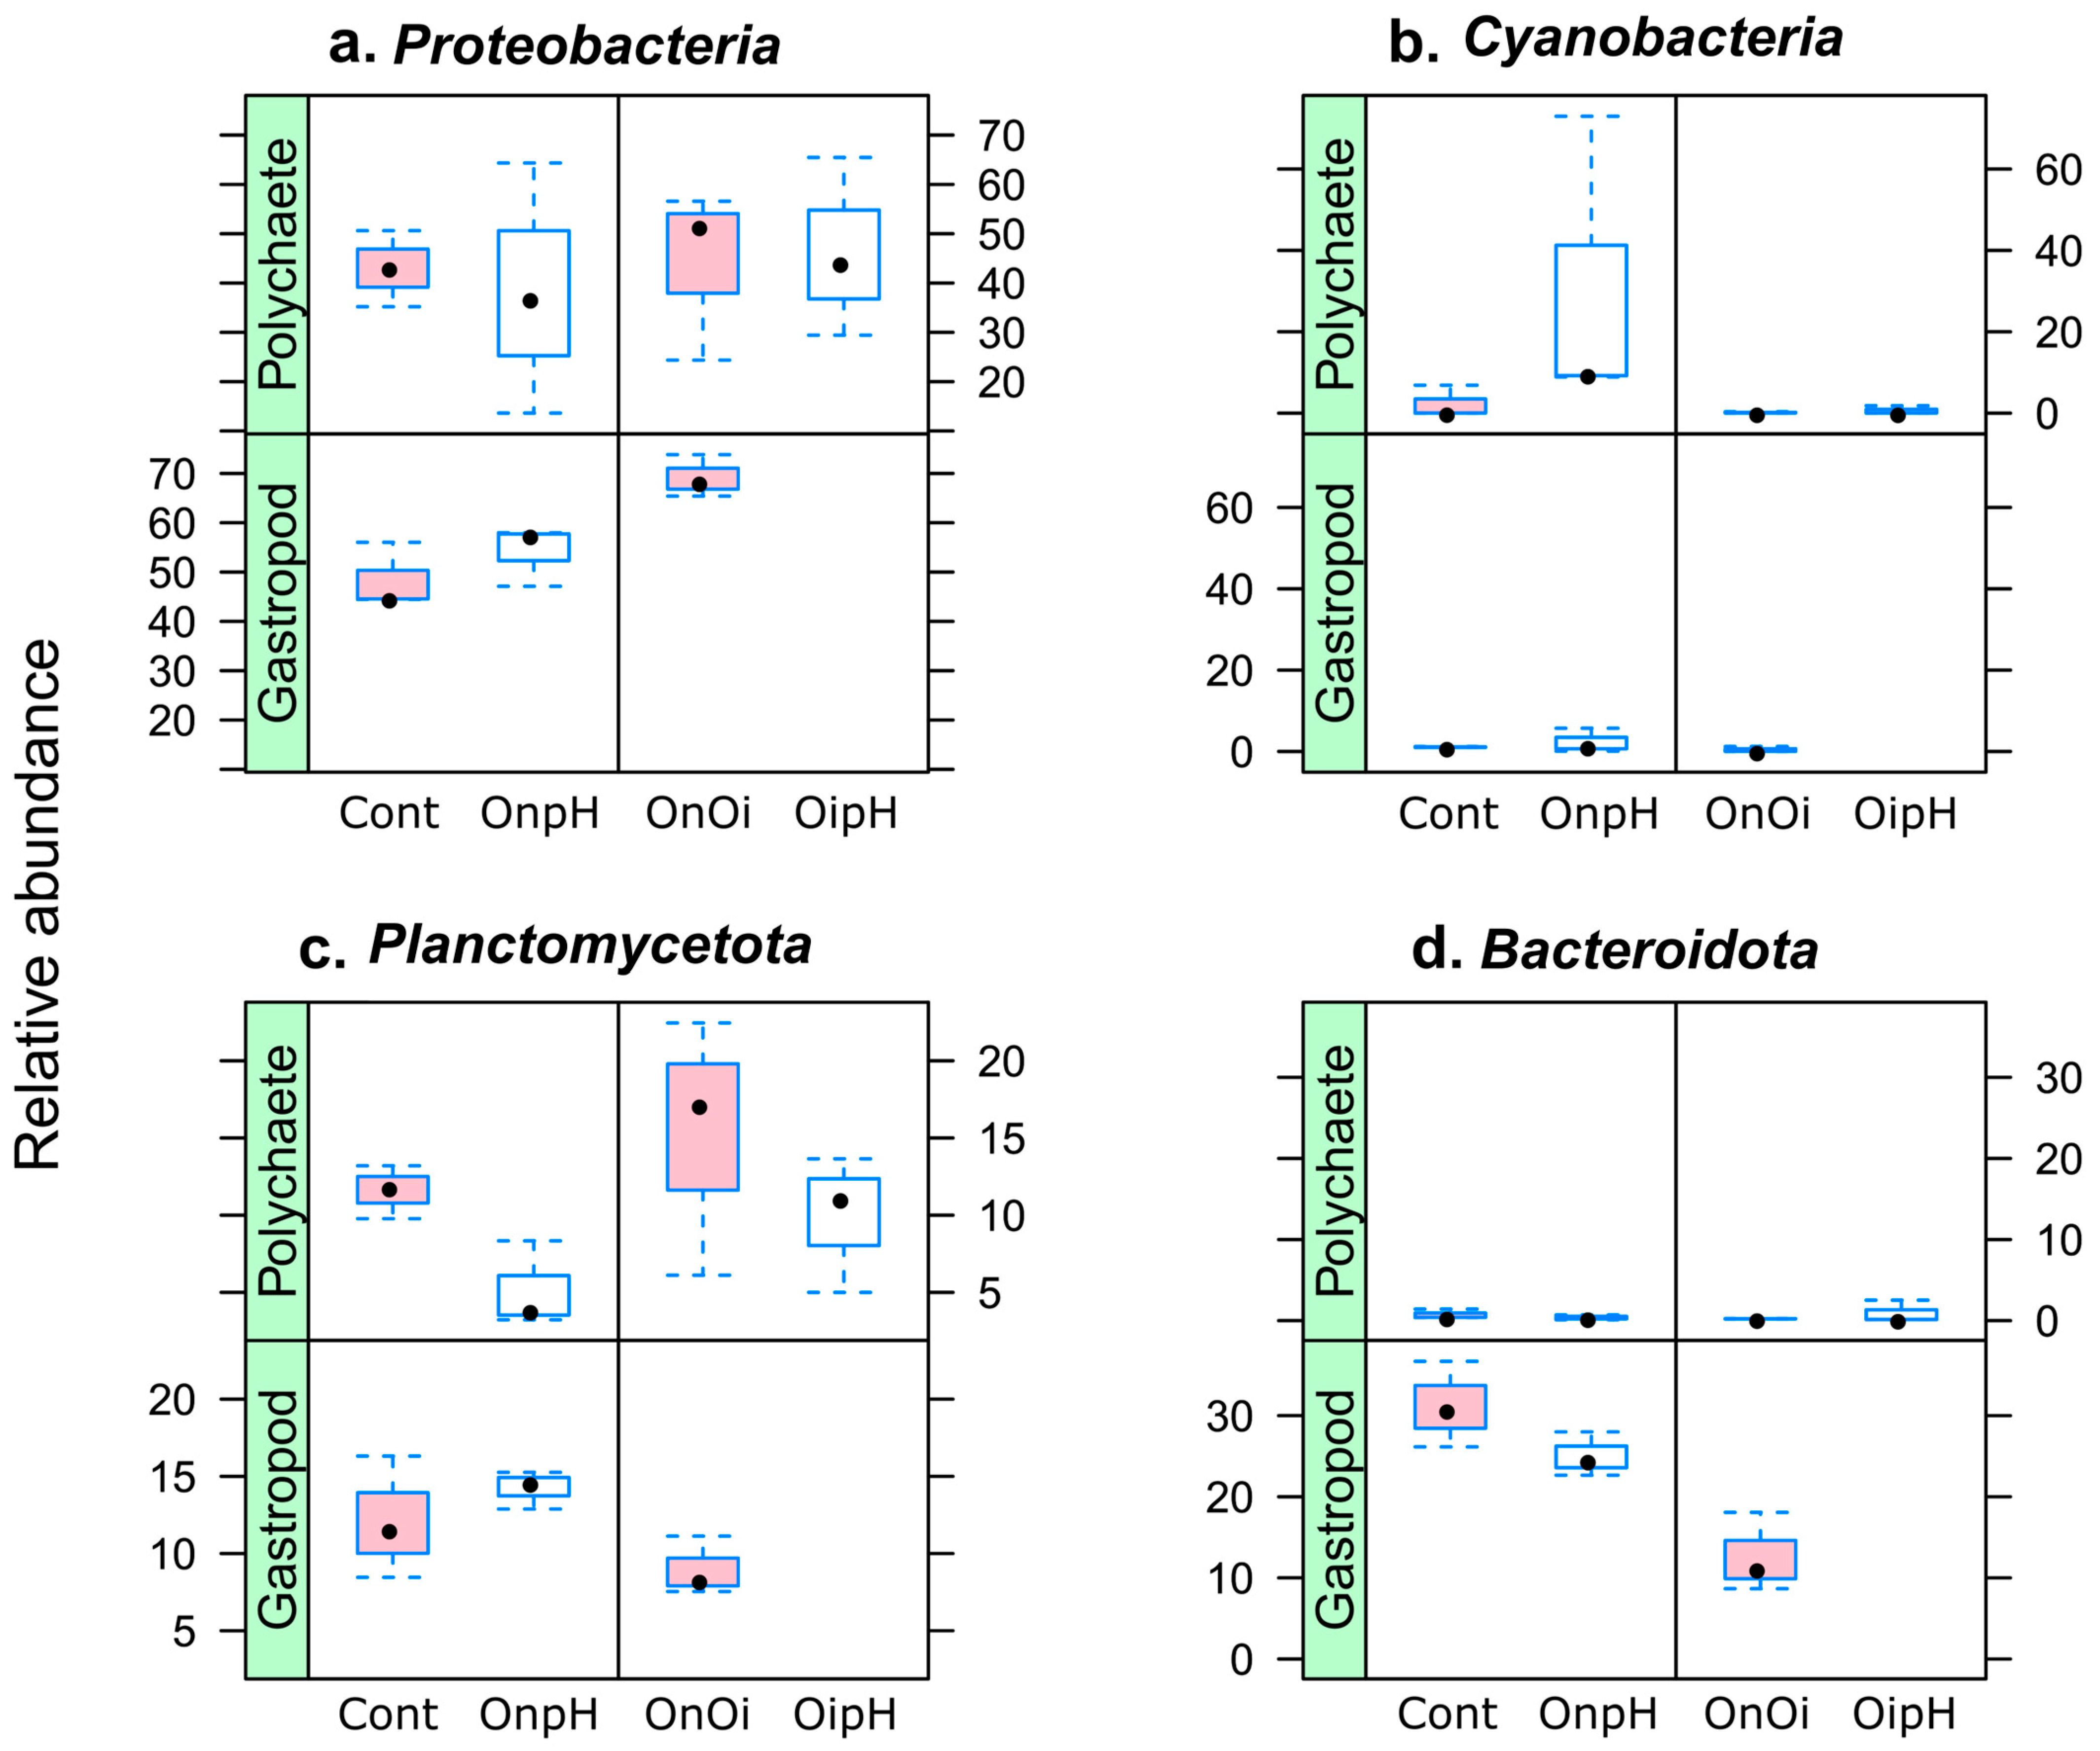
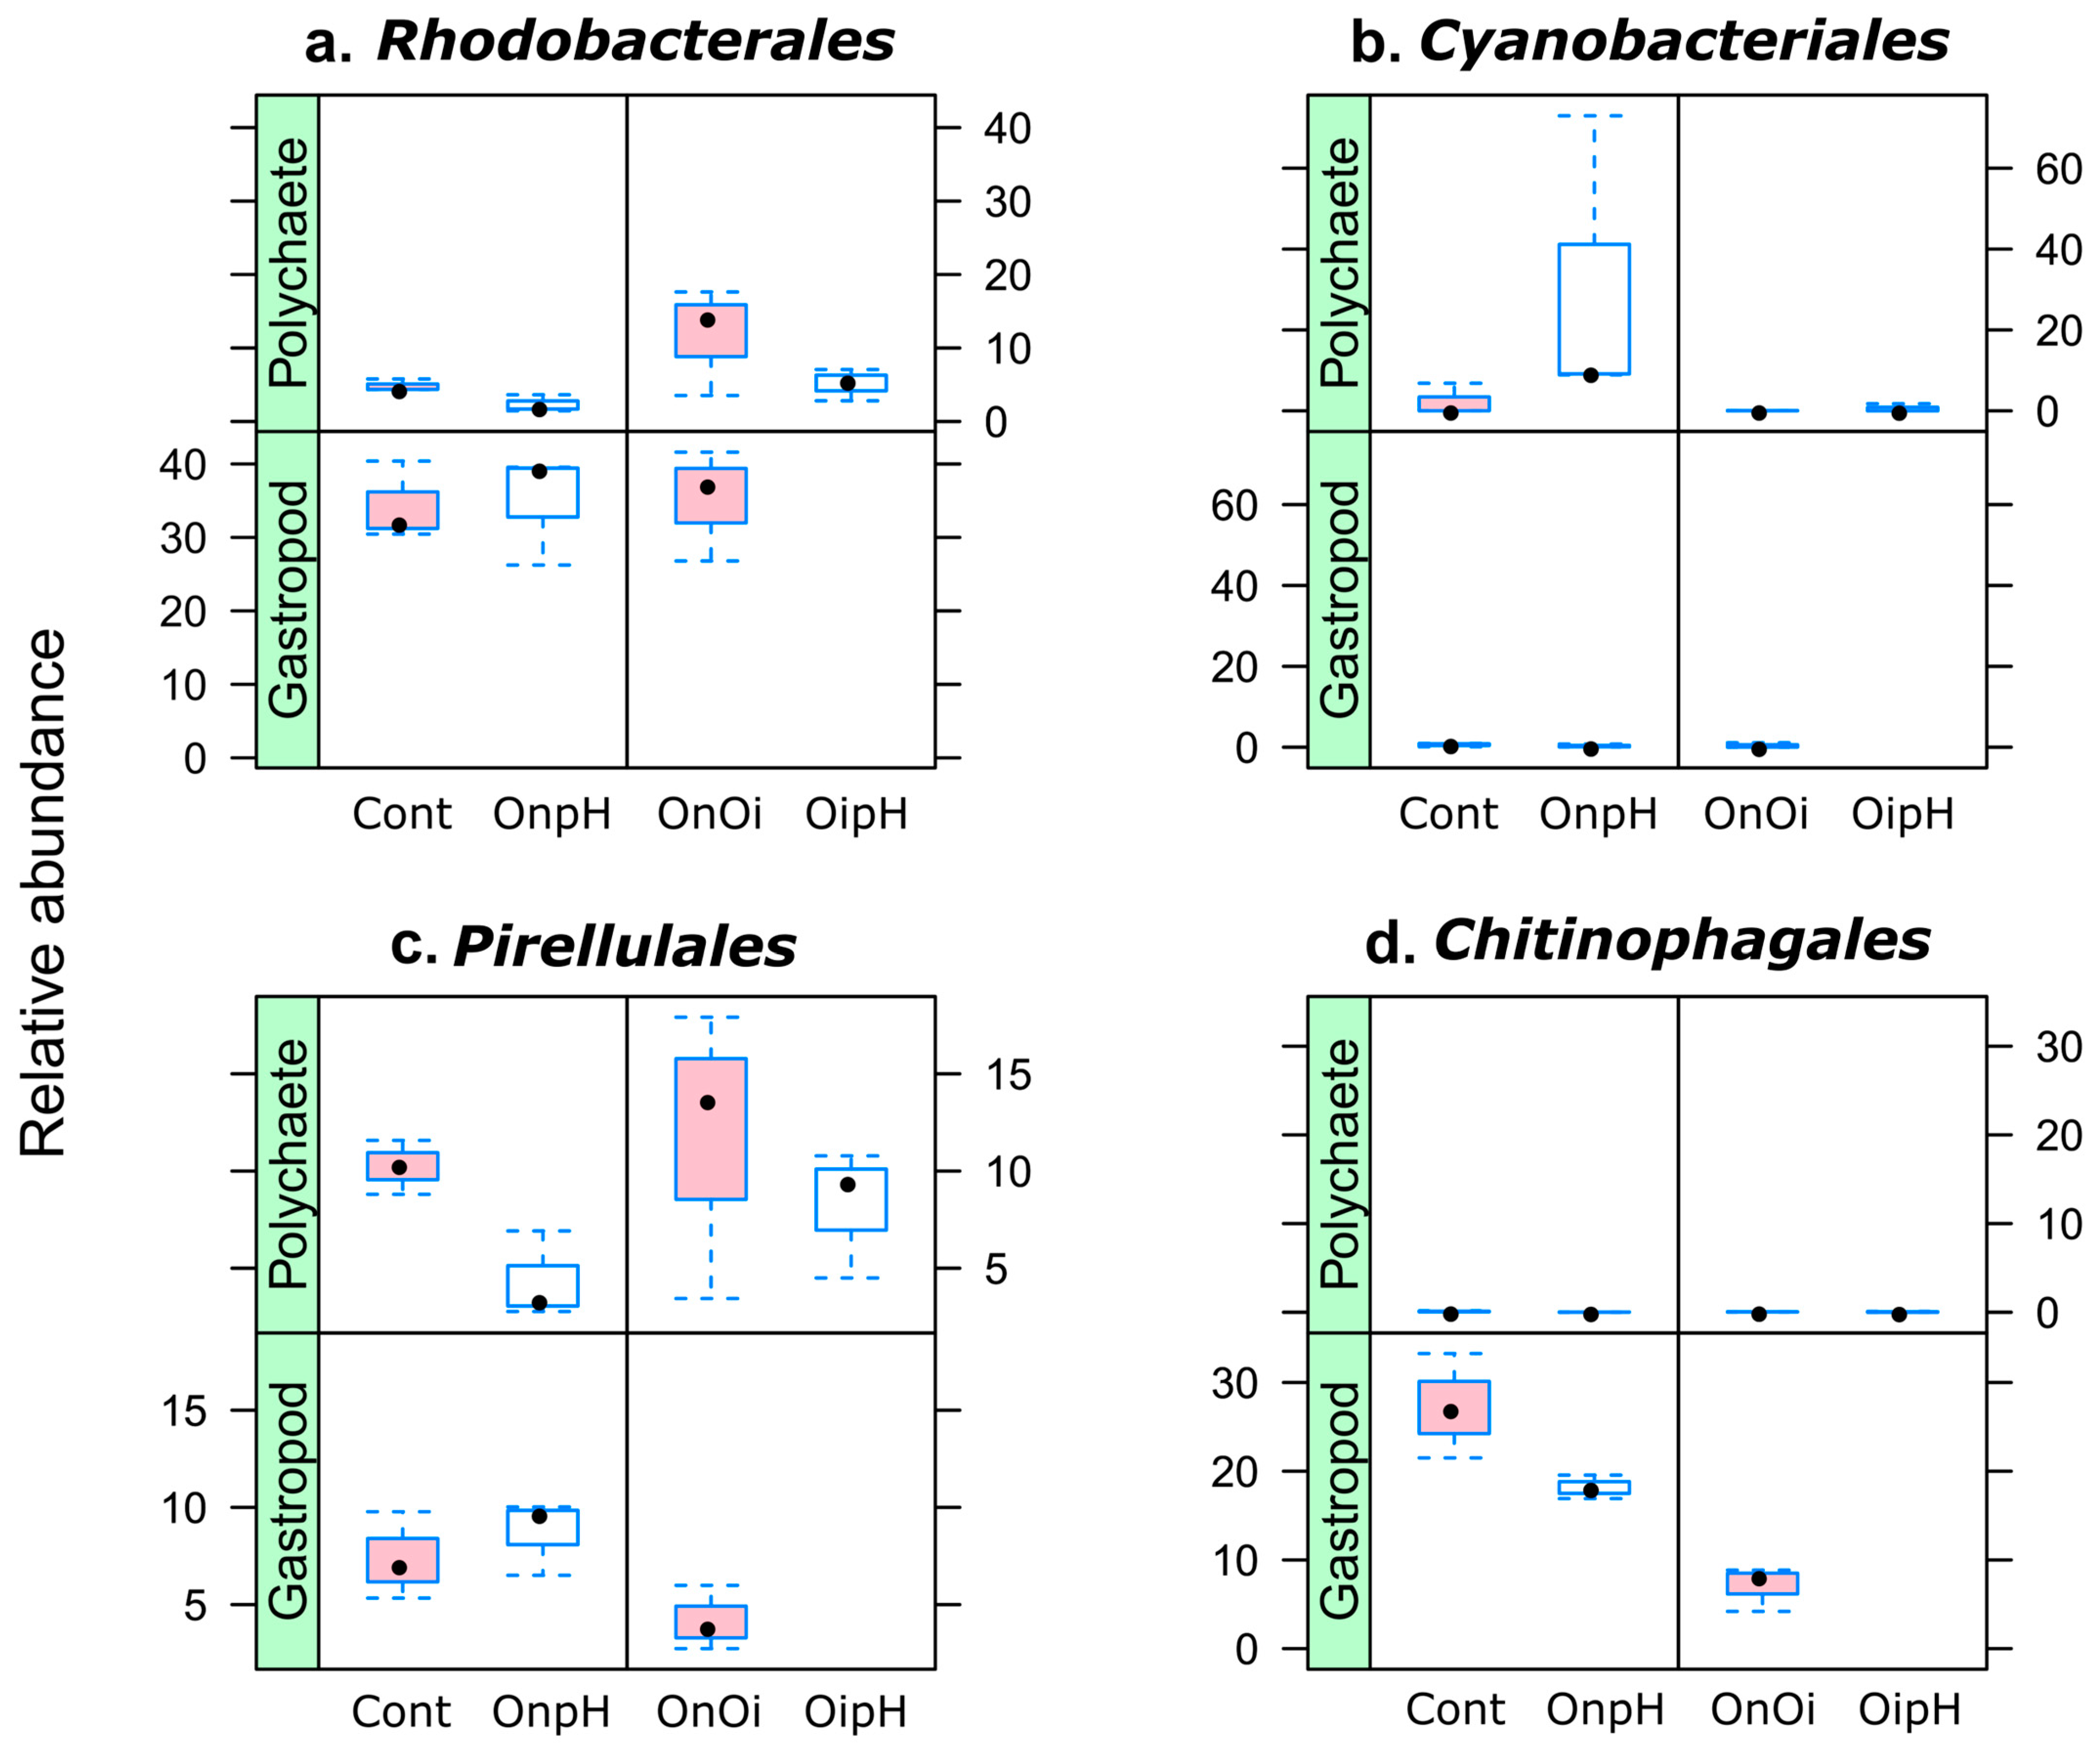
3.2. Taxonomic Composition of H. diversicolor- and P. ulvae-Associated Bacterial Communities

In our study, a taxonomic analysis of the bacterial composition of both invertebrates showed that Proteobacteria, Cyanobacteria, Planctomycetota, and Bacteroidota were the four most abundant phyla in the whole dataset (Figure 3; Table S5). At the order level, Rhodobacterales, Cyanobacteriales, Pirellulales, and Chitinophagales were the most abundant taxa overall (Figure 4). The taxonomic profiles evidence clear distinctions between the bacterial communities associated with both hosts. Despite both having similar abundances of proteobacterial ASV, cyanobacterial taxa were predominant in polychaete samples (mostly in the OnpH treatment), whereas Bacteroidota ASVs were predominant in the gastropod samples. As explained in the PCoA and in the alpha-diversity, the taxonomic composition of the polychaete bacterial community exhibited a higher variability among treatment replicates than that of the gastropod, and this is in line with previous studies [17,36,37,38].
A multiparametric statistical analysis revealed significant differences in relative abundances of relevant phyla and orders. For the polychaetes, both factors ‘pH’ and ‘oil’ were significant predictors of Cyanobacteria abundance (Figure 3b; Table S6). This phylum had a higher relative abundance in the OnpH treatment than all other treatments. At the order rank, both ‘oil’ and ‘pH’ were significant predictors of the relative abundances of Rhodobacterales and Cyanobacteriales (Figure 4a,b; Table S8), whereas the factor ‘oil’ was a significant sole predictor of Pirellulales abundance (Figure 4c; Table S8). Rhodobacterales’ abundance was lower in treatments with reduced seawater pH and higher when oil was present. Pirellulales had a higher relative abundance in oil-contaminated samples compared to those from uncontaminated treatments (Figure 4a).
In the bacterial community associated with the gastropod P. ulvae, the factor ‘oil’ was a significant predictor of the relative abundances of both the Proteobacteria and Bacteroidota phyla (Figure 3a and 3d; Table S7). The ASVs affiliated with the phylum Proteobacteria were more abundant in gastropods from the oil-contaminated treatments (OnOi) than in non-contaminated treatments (OnpH and Cont), while ASVs affiliated to the phylum Bacteroidota had an inverse trend, i.e., these were less abundant in oil-contaminated treatments than in non-contaminated ones. At the order level, the factor ‘oil’ was a significant predictor of variation in the relative abundance of Chitinophagales (Figure 4d; Table S9), with a lower relative abundance in the OnOi treatment than in the uncontaminated treatments (Cont and OnpH). Lower relative abundances of several ASVs classified within the Saprospiraceae family contributed to this result. Members of this family are known to degrade complex organic matter [39] and therefore constitute the core community of environments with high organic matter, such as wastewater-treatment plants [40]. These aerobe heterotrophs contain a variability of genes putatively involved in (i) the extracellular degradation of biological polymers (e.g., polysaccharides, proteins, and lipids) and (ii) the synthesis (and intracellular storage) of polymers as energy reserves (e.g., glycogen, polyphosphate, and polyhydroxyalkanoates). In the natural environment, these bacteria have been frequently found to be associated with algal abundance and are probably involved in the degradation of the polymeric carbon compounds produced by these algae [39,41,42].

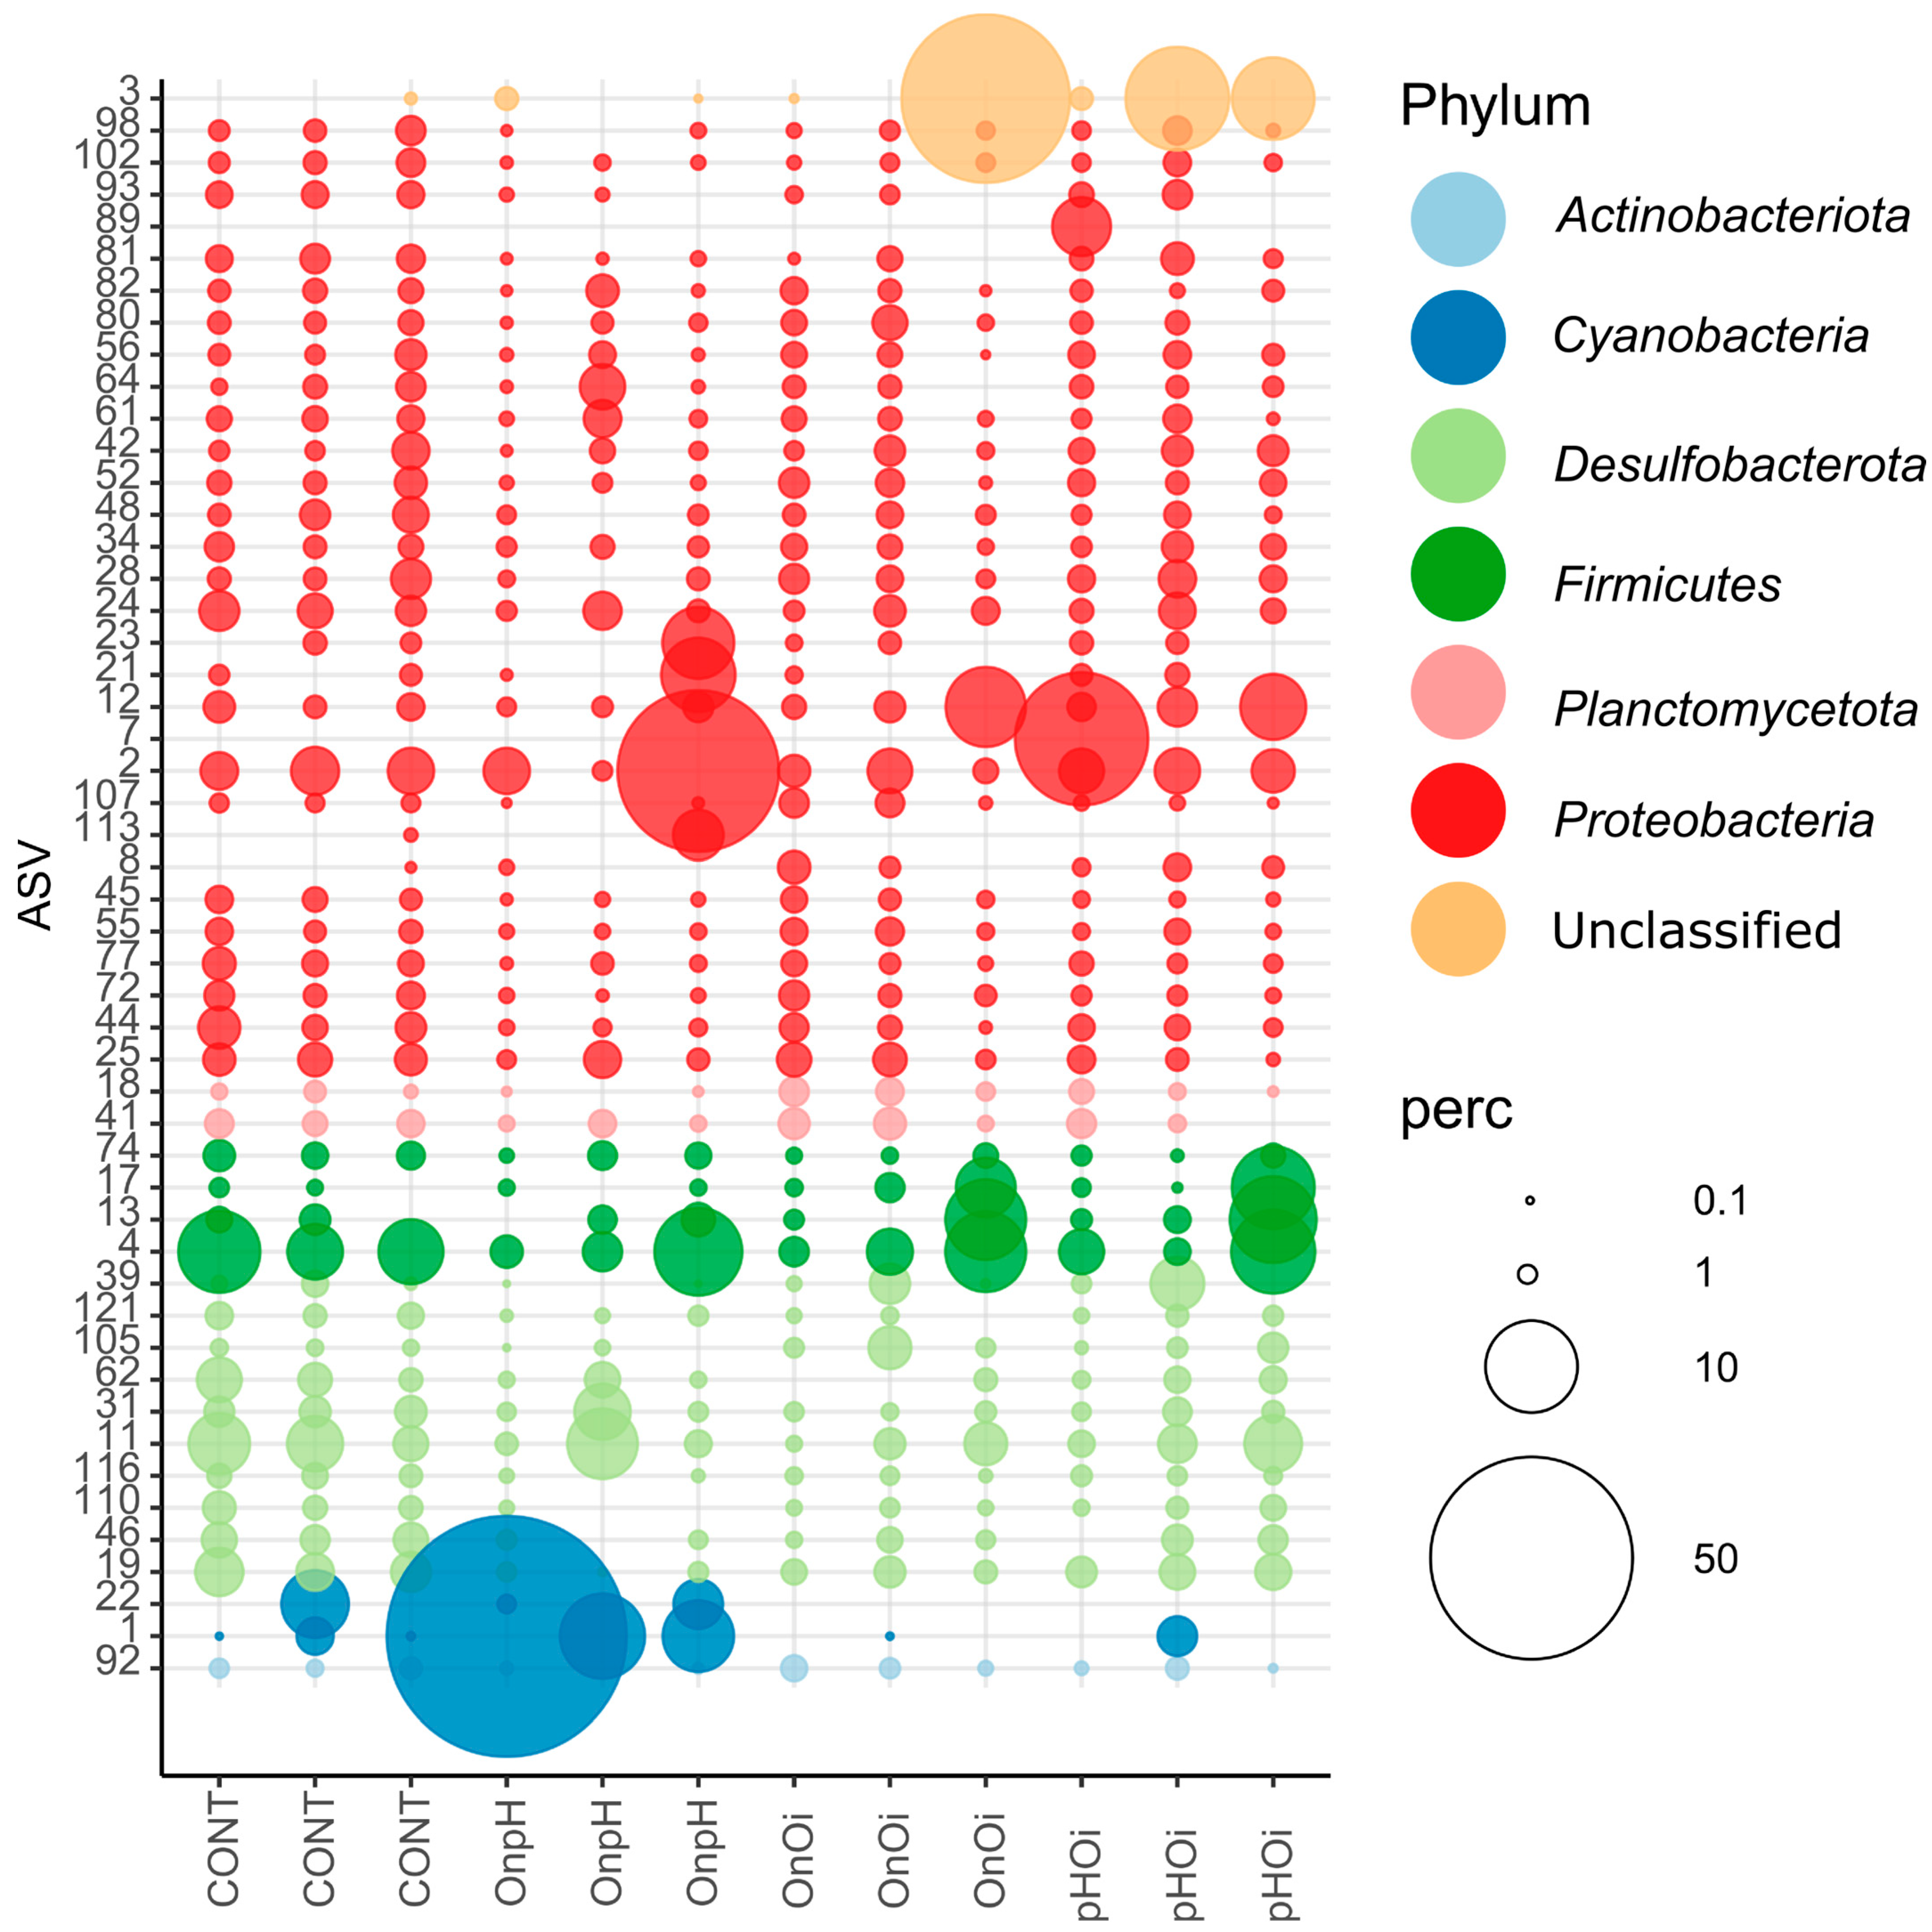
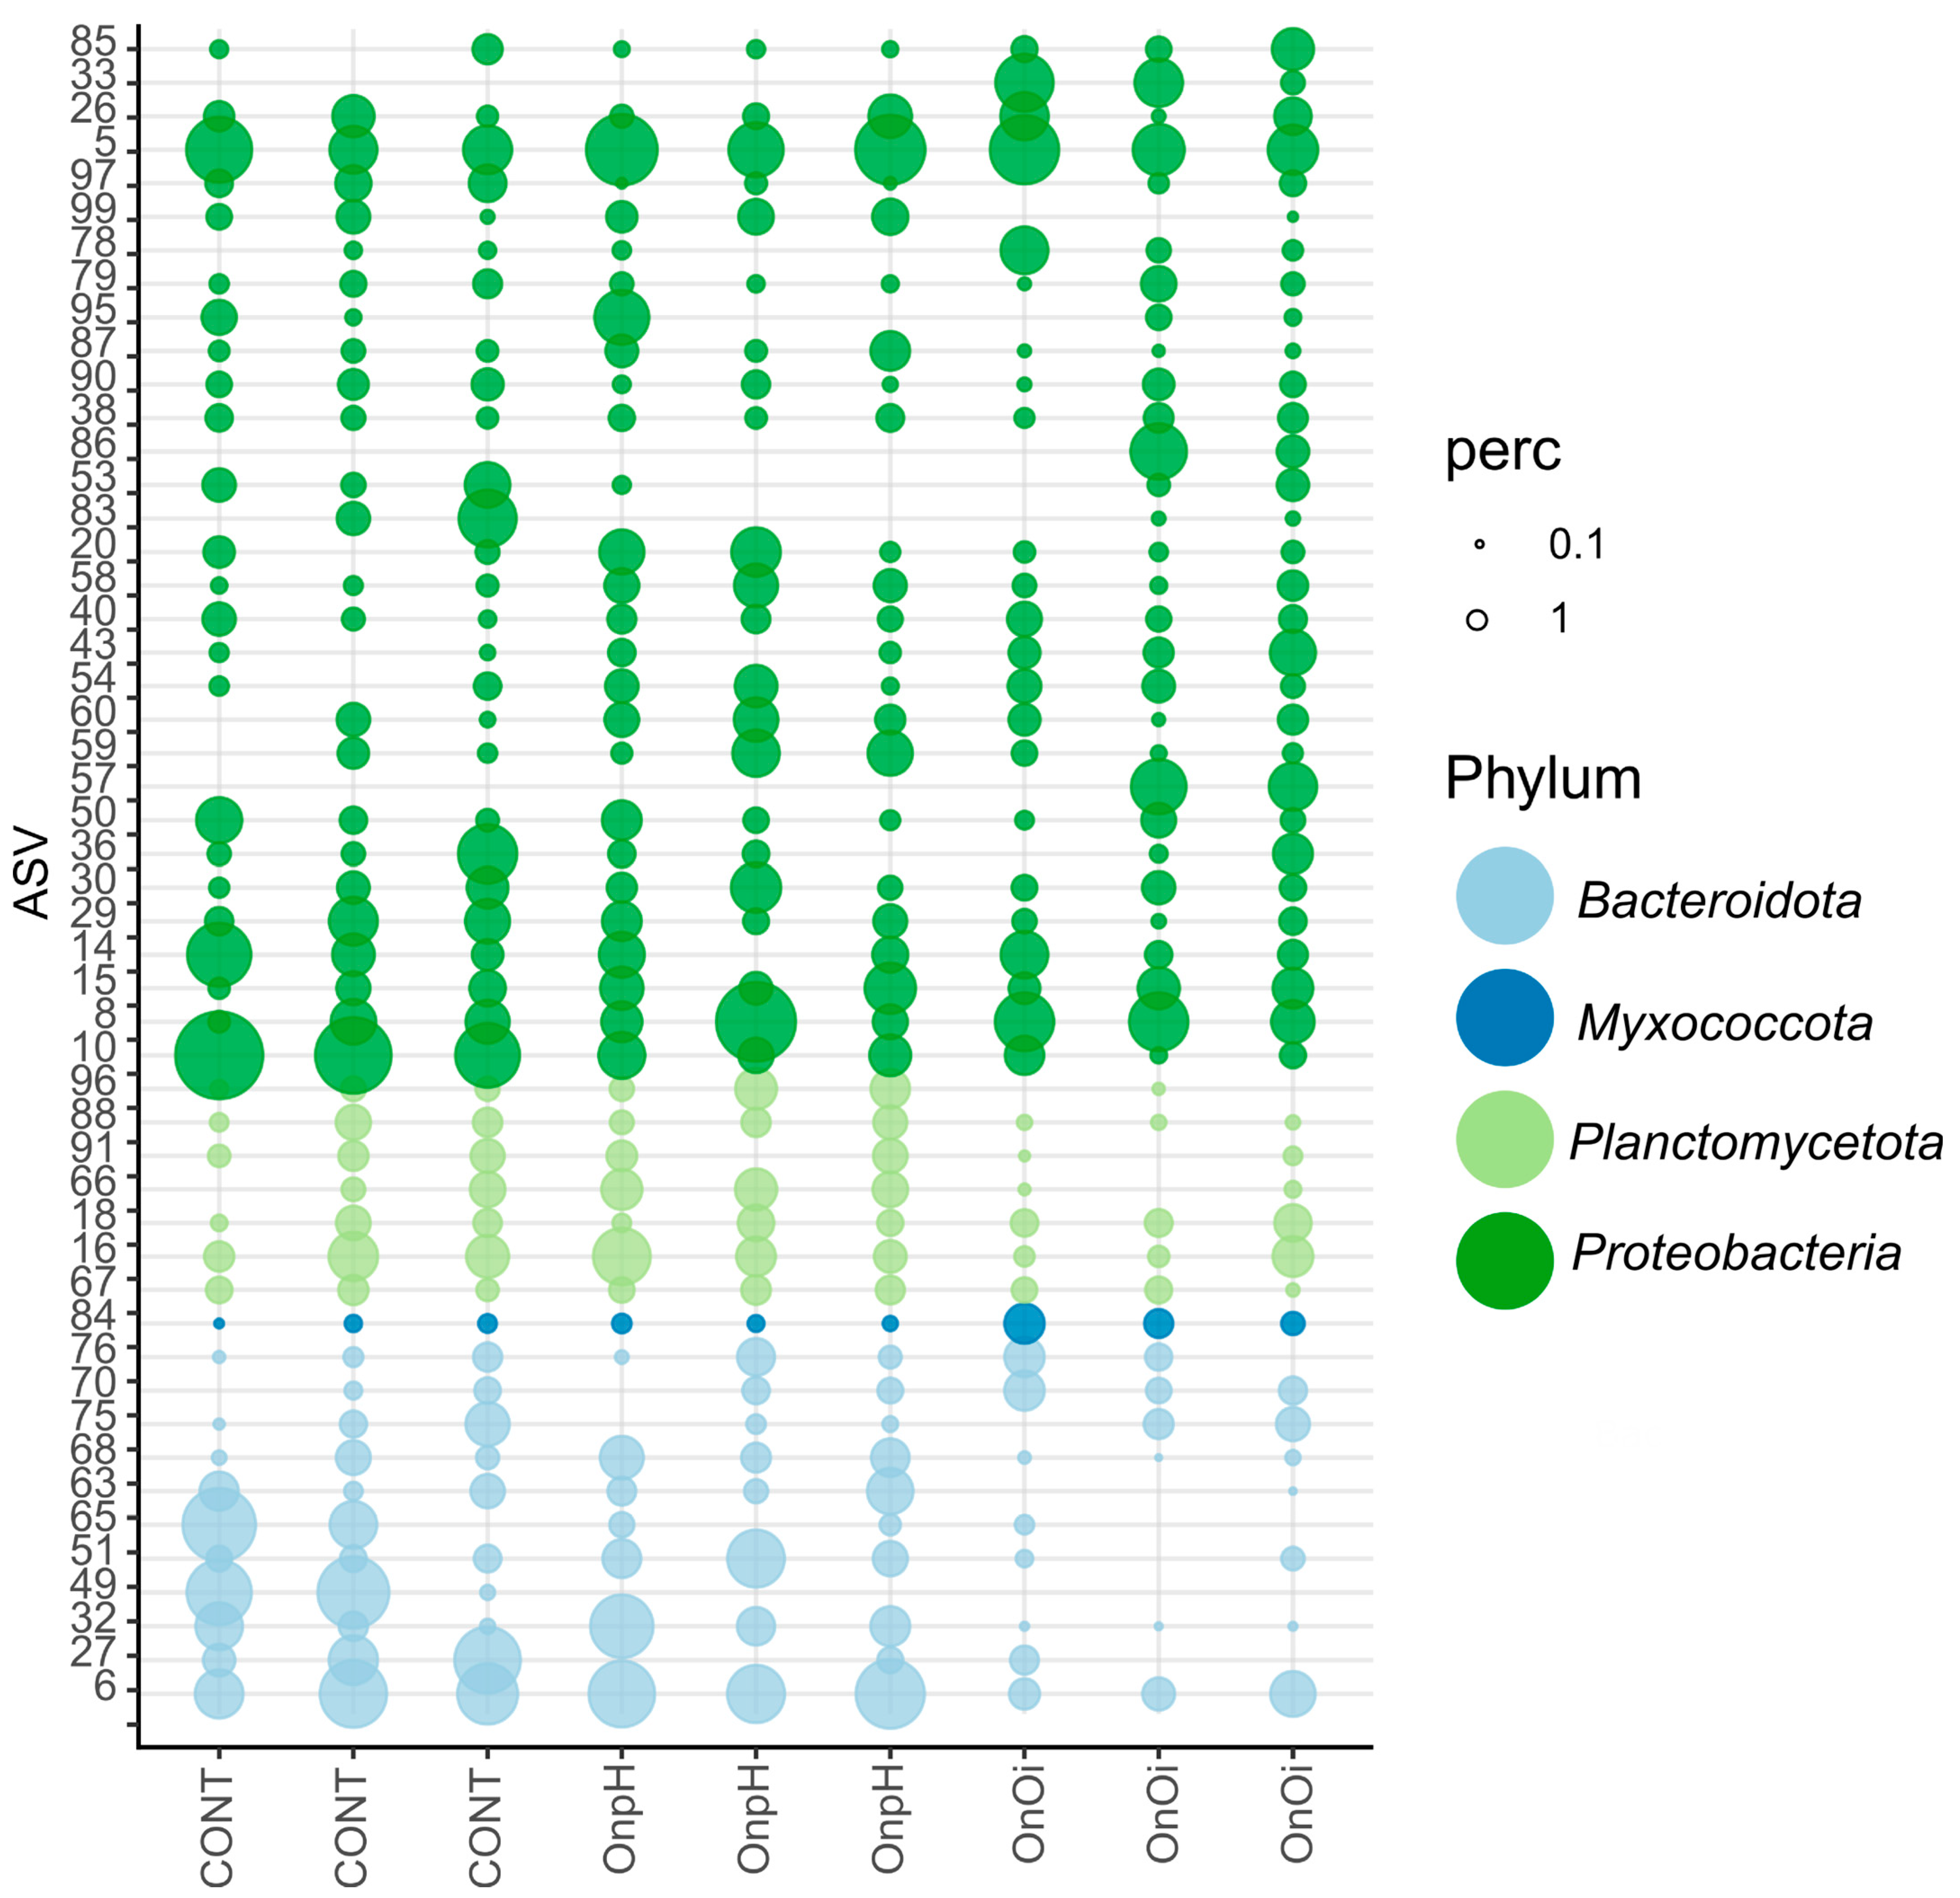
3.3. ASV Compositional Analysis

An in-depth analysis of the 50 most abundant ASVs in the associated bacterial community of the polychaete H. diversicolor (Figure 5; Table S10) and the gastropod P. ulvae (Figure 6; Table S11) was performed by comparing the representative sequences from each dataset to the NCBI’s nucleotide database. Although representative sequences had a length (≈250 nucleotides) in line with most studies in the field, it is worth noting that sometimes a precise taxonomic affiliation cannot be obtained from such short sequences. Notwithstanding, these 50 ASVs represented 53.89% and 46.69% of the total sequence reads retrieved for the polychaete and gastropod, respectively. In both organisms, several of the most abundant ASVs were linked to putative symbionts. This included ASVs classified to the Endozoicomonas genus (ASVs 2, 21, and 23) in the associated bacterial community of the polychaete H. diversicolor [43]. Members of the Endozoicomonas genus are known to live in association with a variety of marine hosts such as corals, sponges, and fish, but also worms, including the polychaete Hydroides elegans [44,45]. The gastropod P. ulvae harboured many ASVs with the highest similarity to organisms associated with marine algae (Table S11—e.g., ASVs 8, 16, 18, 36, and 49), corals (e.g., ASV 6), sponges (e.g., ASV 30), plants (e.g., ASV 29), and other invertebrates (e.g., ASV 10, 20, and 15). The predominance of algal symbionts in the gastropod P. ulvae is consistent with previous reports that indicate microphytobenthos as a preferred source of nutrition for P. ulvae [18]. In addition to putative symbionts, several of the most abundant detected ASVs were linked to hydrocarbon contamination. Many had the highest similarity to sequences from environments potentially contaminated with oil or other organic contaminants (e.g., ASV 1, 4, 12, 13, 28, 39, 42, 45, 48, 57, and 61), while others were affiliated with taxa previously found to be linked to oil-contaminated environments. For example, the ASVs 44 and 77 were classified into the genus Methyloceanibacter, a taxon that includes methylotrophic bacteria from oil-contaminated environments [46], ASV 45 to the Filomicrobium genus, previously detected in oil-contaminated environments [47], ASV 55 to Sulfitobacter, a genus that includes sulphite-oxidizing bacteria found in oil-contaminated environments [48], and ASV 33 to a hydrocarbon-degrading bacteria of the genus Alcanivorax [49]. Many ASVs related to the phylum Desulfobacterota (e.g., ASVs 11, 19, 31,39, and 46), involved in the anaerobic reduction of sulphate [50], were also detected in the bacterial community associated with the polychaete H. diversicolor, which is consistent with a burrowing lifestyle.
Overall, the most notable change detected among the most dominant ASVs of the studied polychaete was a significant and higher abundance of ASV 1 under reduced seawater pH conditions. This ASV was assigned to the family Cyanobacteriaceae (Figure 5; Table S12). Although some cyanobacteria are unicellular and free-living organisms from the photic zone, many members of this family are known to form symbioses with other marine organisms [51] and inhabit dark environments [52]. A well-described example of this type of symbiosis is the sponge–Cyanobacteria association, in which the marine sponge host provides nutrients and shelter, and the symbiont fixed carbon, nitrogen, and secondary metabolites [53]. Cyanobacteria have also been found to occur in association with echiuroid worms, but little is known about the nature of this association [54]. However, for nereid worms, no such association has yet been discovered. A recent study on the polychaete Nereis succinea (phylogenetically related to H. diversicolor) found that the gut bacterial community of this worm is dominated by a proteobacterial taxonomic unit, but no Cyanobacteria were significantly abundant [55]. The ASV 1 was by large the most abundant cyanobacterial ASV found in our dataset. A similarity search on an unfiltered NCBI nucleotide database revealed the highest similarity with uncultured sequences from obscured or low-light environments (Table S10), yet it had a very low similarity (<91%) with curated isolates of the same database, indicating that its functional role in the system is speculative. Nonetheless, the responses of planktonic cyanobacteria to changes in pCO2 and pH have been extensively studied under ocean acidification scenarios, and such responses varied according to the species [56]. However, within the context of host–symbiont associations, there is currently limited information. Interestingly, in natural volcanic CO2 seeps, the cyanobacterial genus Synechococcus was significantly more abundant in marine sponges collected from sites near the vents, as compared to sponges from control sites [57]. Based on these findings, it was speculated that cyanobacterial symbionts could confer low pH or high pCO2 tolerance to their hosts [57]. This could also be the case of the polychaete H. diversicolor, with an increase in Cyanobacteria conferring a higher tolerance to reduced seawater pH (Figure 5). Notwithstanding, the increase in Cyanobacteria under reduced seawater pH in the polychaete was not detected when oil was present; this could indicate that oil contamination reduced the tolerance of the polychaete to reduced seawater pH.
In addition to the cyanobacterial ASV, the polychaete microbiome contained several ASV related to sulphate-reducing bacteria of the family Desulfosarcinaceae (e.g., ASV 19, 110, and 116) that responded to the interaction between oil and pH (Table S12). One ASV in particular, ASV 110, had 100% similarity to the sulphate-reducing bacteria Desulfosarcina variabilis. These ASVs were less abundant in the reduced-pH treatment (OnpH) than in all other treatments (Figure 5). On the other hand, ASVs 13, 61, and 80, which had the highest similarity to sequences from organisms detected in contaminated environments, did not respond to oil contamination. The ASVs 61 and 80 were inclusively found to be most similar to organisms retrieved from an experiment that studied the effect of bioturbation by H. diversicolor on the bacterial communities of oil-contaminated sediment (Table S10; [58])
In the gastropod P. ulvae, most of the significant deviations reported here were related to the factor ‘oil’ and ASVs associated with sequences detected in contaminated environments (ASV 33 and 57; Figure 2B). The ASV 33 only occurred in the OnOi treatment and had a 100% similarity to the oil hydrocarbon-degrader Alcanivorax borkumensis, strain SK2 [59], while ASV 57 was most similar to an uncultured sequence from an oil-contaminated in vitro experiment (Tables S12 and S13). Alcanivorax borkumensis is a known hydrocarbonoclastic bacteria with a wide distribution in marine environments [59]. Furthermore, many bacteria from the Alcanivorax genus are considered to be obligate alkane-degraders [60], yet recent studies have found evidence of a possible symbiotic relationship between microalgae and some specific strains of Alcanivorax [61,62]. Here, in addition to the high similarity with the Alcanivorax borkumensis strain SK2, ASV 33 had a 100% similarity to an epiphytic organism retrieved from the marine macroalga Lessonia trabeculate growing in a non-contaminated environment. Some studies have suggested that marine algae are the natural niche of hydrocarbonoclastic bacteria in the absence of oil hydrocarbons [63,64]. This may indicate that this ASV was present in the gastropod’s microbiome due to its feeding behaviour and was enriched when exposed to oil contamination. Furthermore, hydrocarbonoclastic bacteria associated with animal hosts have been found to confer in hosts an improved resistance to oil contamination [65]. Nonetheless, ASV 33 was not detected in non-contaminated samples of this gastropod. Therefore, it is also reasonable to assume that the gastropod acquired this alkane-degrading bacteria from contaminated sediments during feeding. Notwithstanding, bacterial communities from the hosts had distinct bacterial profiles, which differed significantly from the sediment (Figure S2). Either way, it is plausible to speculate that the gastropod P. ulvae may be a seedbank and/or a vector of dispersion for these hydrocarbonoclastic bacteria in contaminated sediments.
Our results also revealed that several ASVs detected in the gastropod and assigned to the Saprospiraceae family (Chitinophagales order) either only occurred or were more abundant in treatments without oil contamination (Figure 6; Table S13). These included ASVs 6, 63, and 68, all related to coral, shrimp, or dinoflagellate symbionts (Table S11). Again, this effect could also be related to the feeding behaviour of the gastropod with oil hydrocarbon contamination, thus affecting its primary source of food, i.e., the microphytobenthos. No major results from the interaction effect between oil contamination and reduced seawater pH were observed for the gastropod P. ulvae due to the lack of replicates.

3.4. Predicted Functional Profiles

Differential features in the predicted functional metagenomes of the bacterial communities associated with the polychaete and gastropod are plotted in Figures S3 and S4. In the polychaete, the OnpH treatment was enriched in pathways related to photosynthesis and DNA repair in comparison to all other treatments (Figure S3). This was presumably related to the higher abundance of cyanobacterial ASVs detected in this treatment (Figure 3). As expected, the pathway directly related to xenobiotics degradation, i.e., “Benzoate degradation”, was enriched in the polychaete samples from oil-contaminated microcosms. There was also an increase in pathways related to the membrane transport system (e.g., “Transporters” and “ABC transporters”) in polychaetes from the OnOi treatment (Figure S3). Genes related to membrane transporter systems have been previously found to be enriched in the genome of hydrocarbon-degrading bacteria [66], and ABC transporter systems are associated with hydrocarbon metabolism [67]. In the gastropod P. ulvae, pathways related to xenobiotic degradation (i.e., “Toluene degradation”), motility (i.e., “Flagellar assembly”), and lipid and glycan biosynthesis (i.e., “Lipid biosynthesis metabolism”, “N-glycan biosynthesis”, and “Various types of N-glycan biosynthesis”) were enriched in the OnOi treatment (Figure S4), whereas the Cont treatment was only enriched with pathways related to carbohydrate metabolism. This last result was likely due to the high abundance of bacteria associated with algae, such as members of the Saprospiraceae and Rhodobacteraceae families in the Cont treatment.

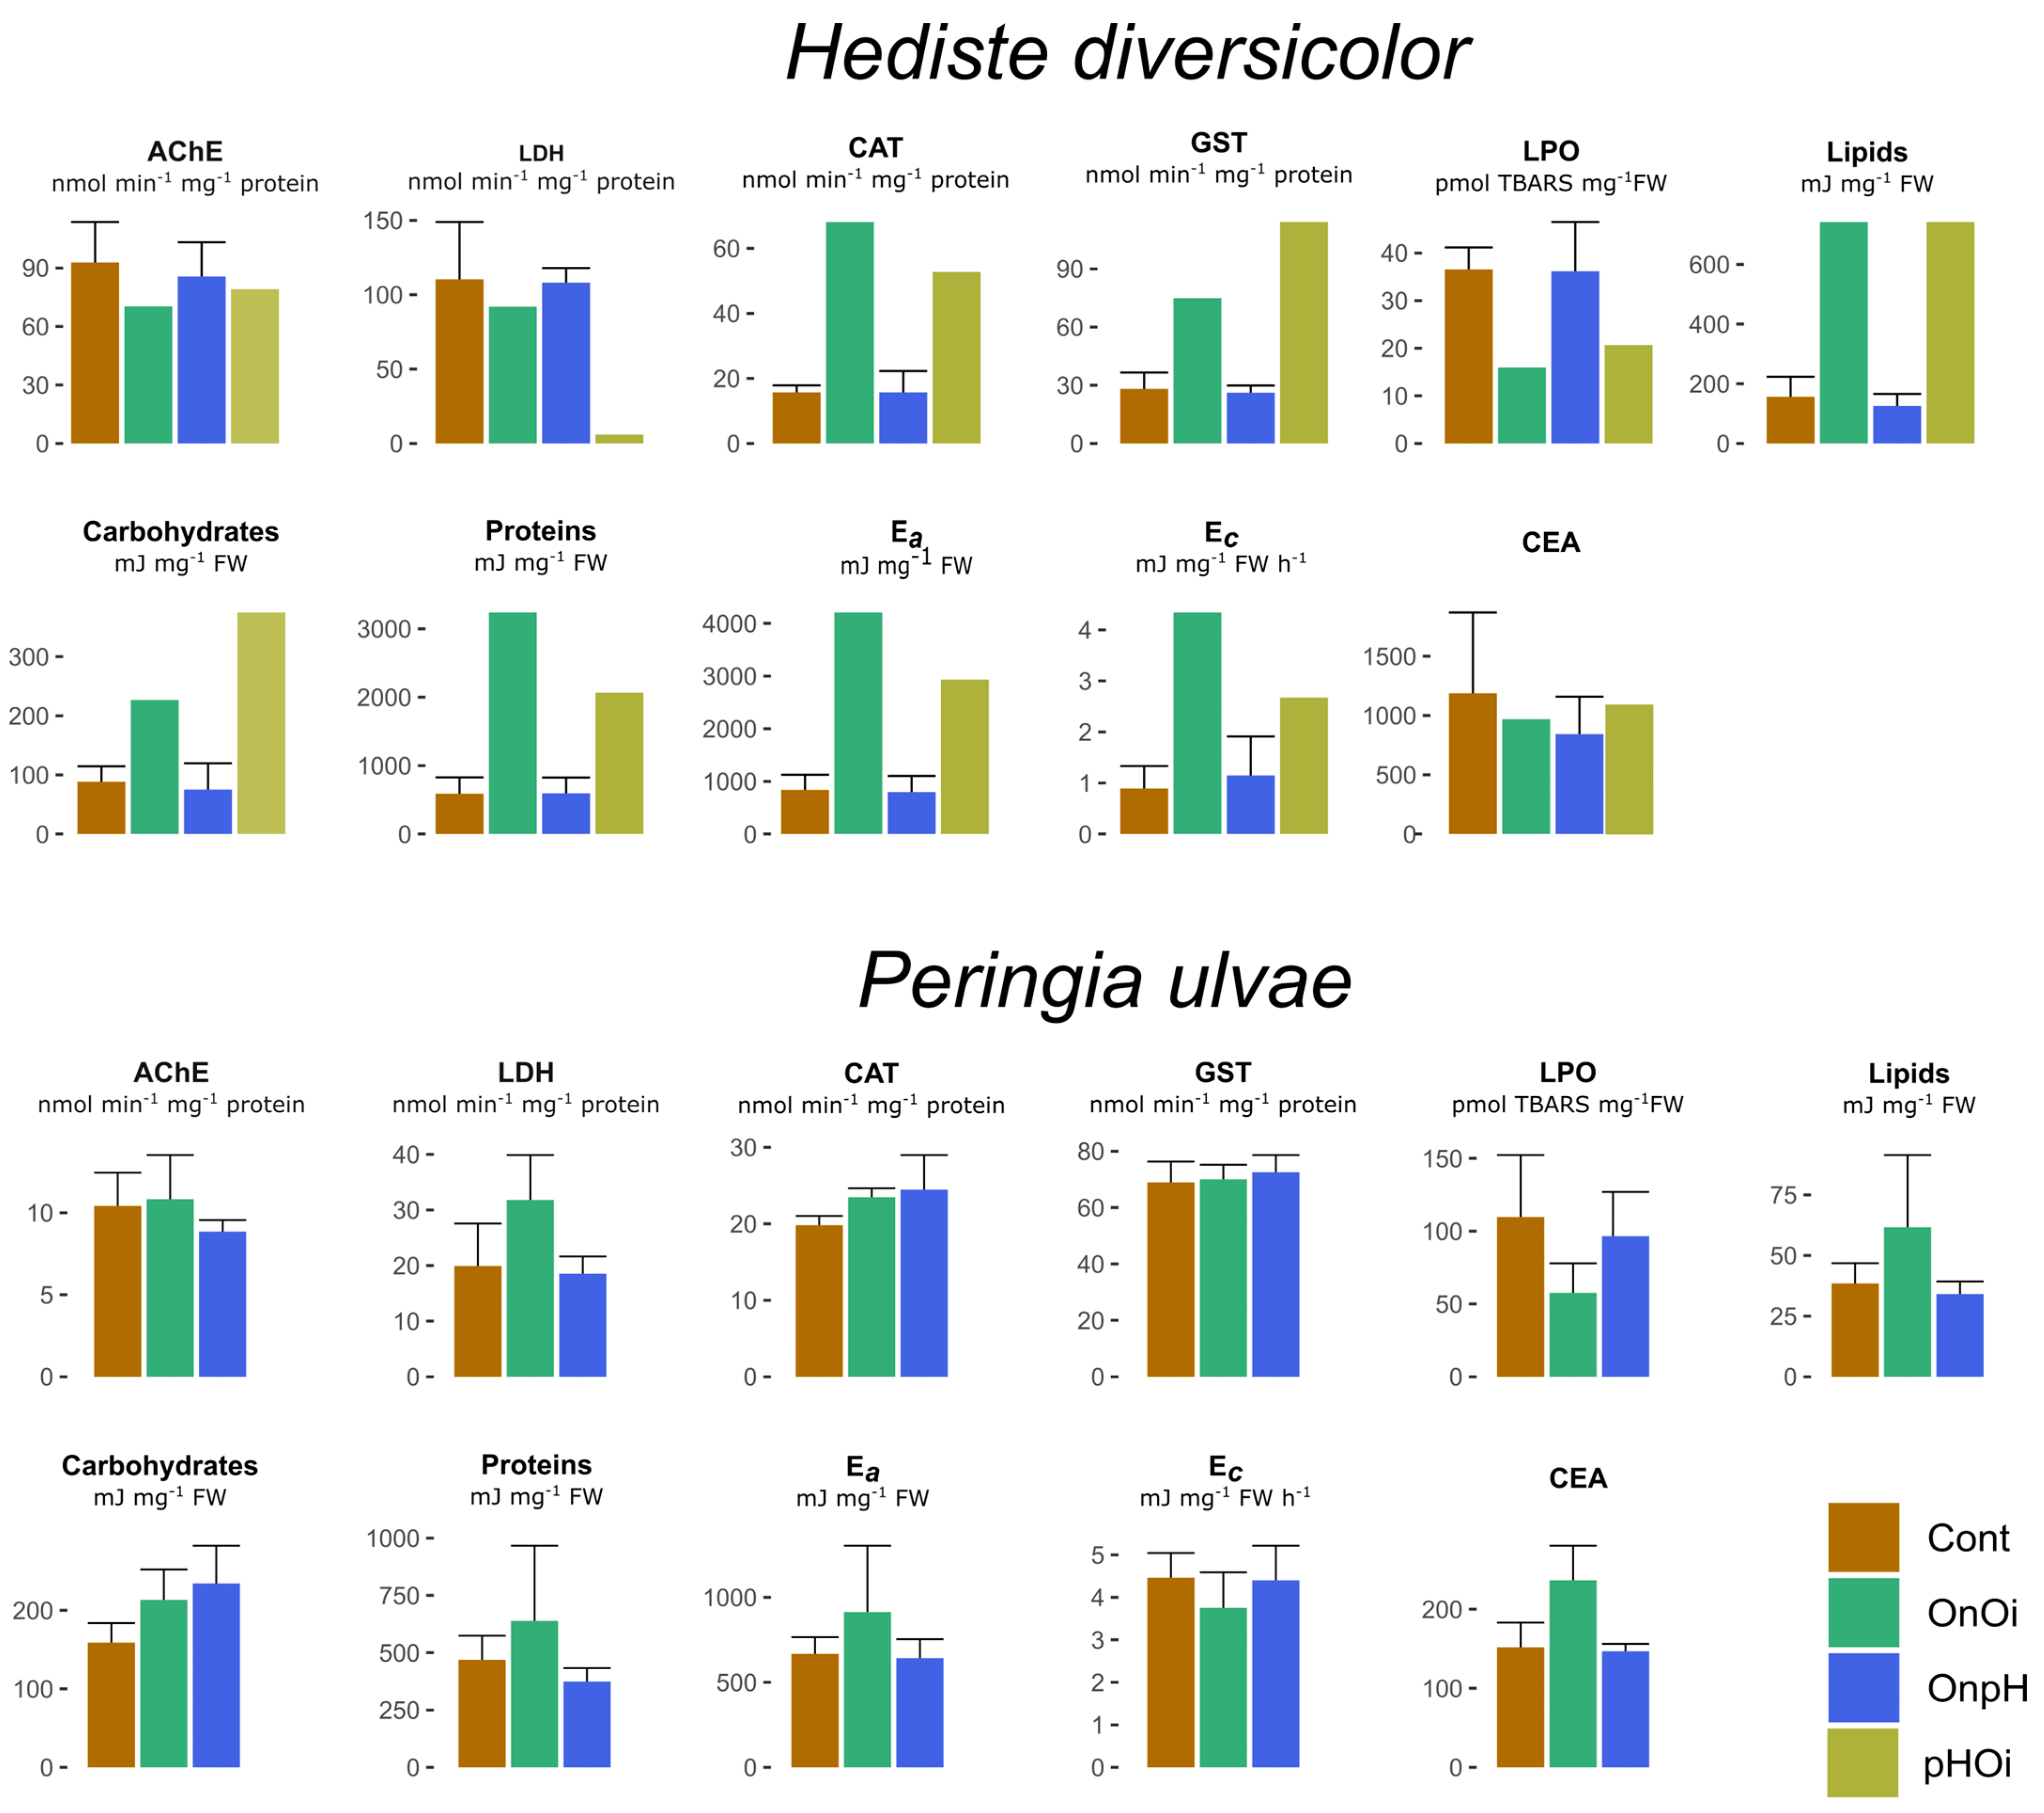
3.5. Biochemical Markers in the Polychaete Hediste diversicolor

A comprehensive set of biochemical markers were measured as indicators of host function at the biochemical level. At the individual level, oil contamination had a severe effect on polychaete survival, and this limited our ability to obtain living organisms for biochemical analyses in all oil-contaminated treatments. Therefore, the following discussion of data concerning the effects of oil-containing treatments on the polychaete should be interpreted with caution due to the lack of replicates of oil-exposed organisms. Taking this limitation into account, it was, nevertheless, possible to observe some trends in several biochemical parameters of animals with and without oil exposure. The activity of AChE was lower in polychaetes exposed to oil-contaminated sediments than those from uncontaminated sediments (Figure 7), and this is in line with a previous experiment in which H. diversicolor organisms were also exposed to oil contamination [9]. Oil hydrocarbons have been shown to reduce the activity of AChE in several aquatic species, including polychaetes [9,68], crustaceans [69], and fish [70]. Other biomarkers, such as the enzymatic activities of CAT and GST, energy reserves (total lipids, carbohydrates, and proteins), Ea, and Ec, were detected to be higher in polychaetes from oil-contaminated treatments, comparatively to treatments without oil (Figure 7; Table S14). The production of reactive oxygen species because of hydrocarbon biotransformation processes is well documented in the scientific literature for several aquatic species [71,72]. Therefore, the observed higher activities of CAT and GST in polychaetes exposed to oil was expected, since these enzymes participate in the antioxidant defence mechanisms and in the biotransformation processes of xenobiotics. This increased triggering of CAT and GST activities has already been reported for H. diversicolor exposed to sediments contaminated with these types of organic chemicals [9,73,74]. No significant effect of pH was detected in the biochemical parameters of the polychaete biochemical parameters, in line with other previous studies (Figure 7; Table S14, [72]).

3.6. Biochemical Markers in the Gastropod Peringia ulvae

In the gastropod, oil contamination had a significant effect on some of the analysed biochemical markers (Figure 7; Table S15): (i) LPO levels (lower relative to non-contaminated treatments); (ii) LDH activity (higher relative to non-contaminated treatments); (iii) total lipids (higher relative to non-contaminated treatments); and (iv) CEA (higher relative to non-contaminated treatments) (Figure 7; Table S15). Although oxidative stress is widely associated with a higher level of LPO in oil-exposed invertebrates, our results showed an opposite trend for the gastropod P. ulvae. The reduced levels of LPO in oil-exposed mudsnails compared to non-exposed organisms are indicative of an absence and/or reduction of lipid peroxidation. It is well known that oil hydrocarbons can alter the content of fatty acids in invertebrates [75], thus contributing to a reduction in the levels of highly polyunsaturated fatty acids, which are very prone to oxidative stress and damage [76,77]. Accordingly, the low levels of LPO in oil-exposed gastropods compared to non-exposed organisms might be explained by a reduction in the polyunsaturated fatty acid content. Still, additional studies are needed to ascertain this hypothesis.
The higher LDH activity detected in gastropods exposed to oil implies that oil exposure diverted the glycolytic pathway to compensate for the increase in the metabolic rate associated with other pathways (e.g., lipid biosynthesis). Coherently, the content of lipids measured in this organism was also significantly higher in the OnOi treatment (Figure 7). This significant increase in total lipids in oil-exposed gastropods could be a compensatory response to the stress inflicted by oil hydrocarbons. It is well known that the effect of oil spills on aquatic organisms is essentially caused by their exposure to organic hydrocarbons, which can be accumulated in the lipid-rich tissues of marine animals [75]. Interestingly, the predicted functional profiles of the associated bacterial community of P. ulvae also revealed a higher abundance of pathways related to both lipid and glycan biosynthesis in OnOi (Figure 7; Table S15). Significantly higher LDH activities compared to controls have previously been detected in the endobenthic bivalve Scrobicularia plana collected from an oil-contaminated estuary one month after a small oil spill [78]. Overall, these findings suggest that the observed increases in LDH activity as an effect of oil contamination may be related to the interference of these chemicals with energy production pathways and to an increase in the anaerobic metabolism.
Compared to normal pH samples, gastropods exposed to reduced seawater pH (OnpH) had significant and higher CAT activities (PERMANOVA: F1,9 = 6.441, R2 = 0.390, p = 0.025) and significant and higher contents of total carbohydrates (PERMANOVA: F1,9 = 8.34, R2 = 0.459, p = 0.034; Figure 7; Table S15). Given that CAT decomposes hydrogen peroxide (H2O2) into oxygen and water [9,79], a significant increase in the activity of this antioxidant enzyme may be indicative of an increase in produced hydrogen peroxide (H2O2), and this is probably due to the stress caused by the reduced seawater pH. Similar increases in CAT activity have been observed in brine shrimp (Artemia franciscana) exposed to reduced-pH conditions [80]. Yet, despite the increase in CAT activity, seawater pH had no significant effect on GST activity or lipid peroxidation in the gastropod (Figure 7; Table S15). The absence of significant levels of LPO could suggest that, despite the occurrence of alterations in some antioxidant biochemical markers (i.e., only CAT), gastropods were not prone to oxidative damage, thus reinforcing the effectiveness of suitable antioxidant defence mechanisms that were activated against the stress induced by the reduced seawater pH.
The significantly higher levels of total carbohydrates in gastropods exposed to reduced seawater pH might suggest a shift in the gastropod’s overall metabolism, with the exposed organisms presenting an increase in carbohydrate reserves through a higher energy intake, as a means of coping with stress caused by lower seawater pH. This contrasts with other studies with different species of marine invertebrates that pointed to a metabolic depression and/or a reduction of energy reserves under high seawater pCO2 levels (with the concomitant reduction of seawater pH), thus suggesting that the uncompensated extracellular pH might cause this metabolic impairment [81,82,83,84,85]. An increase in the levels of carbohydrates may result in larger animals, and therefore it can be hypothesized that organisms exposed to reduced-pH conditions might feed more compared to other treatments as a response to this stress [86]. Nonetheless, this hypothesis can only be applied to carbohydrate reserves, since in the results obtained herein, gastropods exposed to reduced seawater pH showed no changes in total lipids and protein reserves (Figure 7; Table S15). Identical results were obtained in a 56 d experiment with the bivalve Limecola balthica [87]. These authors observed lower carbohydrate and glycogen contents in the soft tissue of bivalves in the treatment with pH 7.0 compared to bivalves maintained at seawater pH of 6.3 and 7.7 [87].

4. Conclusions

Overall, the analysis of the independent effects of each stressor on the gastropod P. ulvae showed that oil contamination caused a reduction in the relative abundance of Chitinophagales and an increase in potential oil hydrocarbon-degrading bacteria. Members of the Chitinophagales are often associated with algae, suggesting a direct effect of oil in P. ulvae food resources that affects its associated bacterial communities. Interestingly, the enrichment in oil hydrocarbon-degrading bacteria suggests a possible role for this gastropod in influencing both the degradation of oil hydrocarbons and the dispersion of oil hydrocarbon-degrading bacteria in the superficial layers of the sediment. Even though the gastropod’s antioxidative stress enzymes (e.g., CAT, GST) were practically unaffected by oil during the exposure period, some relevant effects (e.g., on LPO levels, LDH activity, total lipids, and CEA) were observed. The higher CAT activity and higher content of total carbohydrates in the gastropods exposed to reduced seawater pH are indicative of increased levels of H2O2 in the host’s cells and a high energy demand by this organism to cope with this environmental stressor, respectively. In general, P. ulvae was more affected by oil contamination than H. diversicolor as accessed by both the microbiome analysis and biochemical markers. On the other side, for the polychaete H. diversicolor, the associated bacterial communities did not show significant structural changes in response to either the independent or interactive effects of reduced seawater pH and oil contamination. Interestingly, a similar response pattern or trend was also confirmed at the biochemical level, since it was shown that both stressors had no significant effects on the studied biomarkers. Notwithstanding, a more in-depth taxonomic analysis of the polychaetes revealed a significant response of cyanobacterial ASVs to reduced seawater pH and oil, but not to the interaction of both conditions. Furthermore, in these organisms, there was an enrichment of Cyanobacteria under reduced seawater pH, whereas a drastic reduction in cyanobacterial relative abundance occurred in oil-exposure conditions. Remarkably, Cyanobacteria were previously found to establish symbiotic relationships with other polychaetes [54] and to confer tolerance to low pH/high pCO2 in other marine invertebrates [57]. This finding is intriguing and raises the hypothesis of a similar mechanism in the polychaete H. diversicolor. If this hypothesis is correct, the lower abundance of Cyanobacteria due to oil contamination could potentially compromise the ability of H. diversicolor to thrive in oil-contaminated sediment in an ocean acidification scenario. Accordingly, future studies should address the potential symbiotic association of C. yanobacteria with H. diversicolor and the respective roles of each organism in the mechanistic responses of this type of symbiotic relationship in the presence of environmental stressors and/or contaminants.

Supplementary Materials

The following supporting information can be downloaded at: https://www.mdpi.com/article/10.3390/environments11020037/s1. Table S1: Description of the factorial treatments in the microcosm experiment. Table S2: Results of analysis of variance (ANOVA) of evenness, richness, Shannon, and Fisher diversity indices of the Peringia ulvae (gastropod)- associated bacterial communities. Coef: coefficient; Df: degrees of freedom; Resid.Df: residual degrees of freedom; Resid.Dev: residual deviance; F: f-value; P: p-value; Sig: significance. Note the absence of the pHOi treatment. Table S3: Results of analysis of variance (ANOVA) for evenness, richness, Shannon, and Fisher diversity indices of the Hediste diversicolor (polychaete)- associated bacterial communities. Coef: coefficient; Df: degrees of freedom; Resid.Df: residual degrees of freedom; Resid.Dev: residual deviance; F: f-value; P: p-value; Sig: significance. Table S4: Results of the PERMANOVA for polychaete (Hediste diversicolor)- and gastropod (Peringia ulvae)- associated bacterial communities. Coef: coefficient; Df: degrees of freedom; SumsOfSqs: sum of squares; MeanSqs: mean squares; F: f-value; P: p-value; Sig: significance. Table S5: Mean relative abundance and standard deviation of the four most abundant phyla and orders in the dataset. Control: control treatment, i.e., without oil and with normal pH; OnpH: only pH treatment, i.e., without oil and with reduced seawater pH; OnOi: only oil treatment, i.e., with oil and with normal seawater pH; pHOi: pH and oil treatment, i.e., with oil and with reduced seawater pH. Table S6: Results of the ANOVA of Proteobacteria, Cyanobacteria, Planctomycetota, and Bacteroidota abundances of the polychaete (Hediste diversicolor)- associated bacterial communities. Coef: coefficient; Df: degrees of freedom; Resid.Df: residual degrees of freedom; Resid.Dev: residual deviance; F: f-value; P: p-value; Sig: significance. Table S7: Results of the permutational analysis of variance (PERMANOVA) for Proteobacteria, Cyanobacteria, Planctomycetota, and Bacteroidota abundances of the gastropod (Peringia ulvae)- associated bacterial communities. Coef: coefficient; Df: degrees of freedom; Resid.Df: residual degrees of freedom; Resid.Dev: residual deviance; F: f-value; P: p-value; Sig: significance. Table S8: Results of analysis of variance (ANOVA) of Rhodobacterales, Cyanobacteriales, Pirellulales, and Chitinophagales abundances of the polychaete (Hediste diversicolor)- associated bacterial communities. Coef: coefficient; Df: degrees of freedom; Resid.Df: residual degrees of freedom; Resid.Dev: residual deviance; F: f-value; P: p-value; Sig: significance. Table S9: Results of analysis of variance (ANOVA) of Rhodobacterales, Cyanobacteriales, Pirellulales, and Chitinophagales abundances of the gastropod (Peringia ulvae)- associated bacterial communities. Coef: coefficient; Df: degrees of freedom; Resid.Df: residual degrees of freedom; Resid.Dev: residual deviance; F: f-value; P: p-value; Sig: significance. Table S10: List of the 50 most abundant bacterial amplicon sequence variants (ASVs) associated with the polychaete Hediste diversicolor. The table includes the ASV -numbers (ASV), and the taxonomic assignment at the family and genus levels was performed by using the SILVA database (version 138, released December 2019). Seq. ID: BLAST sequence ID of a close match with our ASV sequence; Seq. sim: sequence similarity; Source/Context: source of these organisms. Table S11: List of the 50 most abundant bacterial amplicon sequence variants (ASVs) associated with the gastropod Peringia ulvae. The table includes the ASV -numbers (ASV), and the taxonomic assignment at the family and genus levels was performed by using the SILVA database (version 138, released December 2019). Seq. ID: BLAST sequence ID of a close match with our ASV sequence; Seq. sim: sequence similarity; Source/Context: source of these organisms. Table S12: Results of analysis of variance (ANOVA) for the 50 most abundant amplicon sequence variants (ASV) of the Hediste diversicolor bacterial communities. Significant results (p < 0.01) are highlighted. Resid.Dev: residual deviance; F: f-value; Pr(>F): p-value. Table S13: Results of analysis of variance for the 50 most abundant amplicon sequence variants (ASVs) of the Peringia ulvae bacterial communities. Significant results (p < 0.01) are highlighted. Resid.Dev: residual deviance; F: f-value; Pr(>F): p-value. Table S14: Results of the permutational multivariate analysis of variance (PERMANOVA) for the polychaete (Hediste diversicolor) biochemical markers. Coef: coefficient; Df: degrees of freedom; SumsOfSqs: sum of squares; MeanSqs: mean squares; F: f-value; P: p-value; AChE: acetylcholinesterase; LDH: lactate dehydrogenase; CAT: catalase; GST: glutathione S-transferase; LPO: lipid peroxidation; Ea: Energy available; Ec: Energy consumption; CEA: cellular energy allocation. Table S15: Results of permutational multivariate analysis of variance (PERMANOVA) for the gastropod (Peringia ulvae) biochemical parameters. Coef: coefficient; Df: degrees of freedom; SumsOfSqs: sum of squares; MeanSqs: mean squares; F: f-value; P: p-value; AChE: acetylcholinesterase; LDH: lactate dehydrogenase; CAT: catalase; GST: glutathione S-transferase; LPO: lipid peroxidation; Ea: Energy available; Ec: Energy consumption; CEA: cellular energy allocation. Figure S1: Principal Coordinates Analysis (PCoA) of sediment and polychaete (Hediste diversicolor)- associated bacterial DGGE profiles. The first two explanatory axes are shown. Hed: polychaete H. diversicolor; Sed: Sediment; Control: control treatment, i.e., without oil and with normal pH; OnpH: only pH treatment, i.e., without oil and with reduced seawater pH; OnOi: only oil treatment, i.e., with oil and with normal seawater pH; pHOi: pH and oil treatment, i.e., with oil and with reduced seawater pH. The permutational multivariate analysis of variance (PERMANOVA) results of the comparison between sediment and polychaete DGGE profiles are shown above (F: f-value; P: p-value). Figure S2: Principal Coordinates Analysis (PCoA) of sediment and gastropod (Peringia ulvae)- associated bacterial DGGE profiles. The first two explanatory axes are shown. Gas: gastropod P. ulvae; Sed: Sediment; Control: control treatment, i.e., without oil and with normal pH; OnpH: only pH treatment, i.e., without oil and with reduced seawater pH; OnOi: only oil treatment, i.e., with oil and with normal seawater pH; pHOi: pH and oil treatment, i.e., with oil and with reduced seawater pH. The permutational multivariate analysis of variance (PERMANOVA) results of the comparison between sediment and gastropod DGGE profiles are shown above (F: f-value; P: p-value). Figure S3: Results from LefSe of predicted metagenome of bacterial communities associated with the polychaete Hediste diversicolor. Control: control treatment, i.e., without oil and with normal pH; OnpH: only pH treatment, i.e., without oil and with reduced seawater pH; OnOi: only oil treatment, i.e., with oil and with normal seawater pH. Figure S4: Results from LefSe of predicted metagenome of bacterial communities associated with the gastropod Peringia ulvae. Control: control treatment, i.e., without oil and with normal pH; OnpH: Only pH treatment, i.e., without oil and with reduced seawater pH; OnOi: only oil treatment, i.e., with oil and with normal seawater pH. Dataset S1: ASV abundance table and taxonomic classification based of SILVA database (version 138, released December 2019). ASVN: ASV numbers ascribed by authors; ASVH: ASV unique md5 hashes generated by the qiime2 algorithm. GAS: gastropod Peringia ulvae; HED: ploychaete Hediste diversicolor; In samples ‘C’ refers to Cont. (Control: control treatment, i.e., without oil and with normal pH samples), ‘O’ to OnOi samples (only oil treatment, i.e., with oil and with normal seawater pH), ‘P’ to OnpH samples (OnpH: only pH treatment, i.e., without oil and with reduced seawater pH) and ‘PO’ to pHOi (pH and oil treatment, i.e., with oil and with reduced seawater pH); Abun: Abundance—total counts per ASV. Dataset S2: List ASV (md5-hash) and their representative sequence that were deleted from the dataset. ASV that occurred in the negative control or were affiliated to non-bacterial, mitochondrial, and chloroplast sequences were excluded from the analysis [88,89,90,91,92,93,94,95,96,97,98,99].

Author Contributions

Experimental design: A.L., F.J.R.C.C., D.F.R.C. and N.C.M.G. Lab work: A.L., V.G. and F.L. Data analysis: A.L., V.G., D.F.R.C. and F.J.R.C.C. Writing: A.L., V.G., D.F.R.C., F.J.R.C.C., I.L. and N.C.M.G. All authors have read and agreed to the published version of the manuscript.

Funding

Work funded by FCT/MCTES through project HumicOil (DOI: 10.54499/2022.03081.PTDC). We also acknowledge the financial support for CESAM of FCT/MCTES (UIDP/50017/2020+UIDB/50017/2020+LA/P/0094/2020) through national funds. The ELSS construction was financed by European funds through COMPETE (FCOMP-01-0124-FEDER-008657) and by national funds through FCT within project PTDC/AAC-CLI/107916/2008. VG was funded by national funds (OE) through FCT, Portugal, in the scope of the framework contract foreseen in the numbers 4, 5, and 6 of the Article 23, of the Decree-Law57/2016, of August 29, changed by Law 57/2017, of July 19. The research contract of FJRCC was funded by national funds through FCT—Fundação para a Ciência e a Tecnologia, I.P., under the Scientific Employment Stimulus—Individual Call—reference DOI 10.54499/CEECIND/00070/2017/CP1459/CT0002.

Data Availability Statement

Data Availability Sequences used in this study were uploaded to the NCBI ShortRead Archive (BioProject PRJNA761554).

Conflicts of Interest

The authors have no relevant financial or non-financial interests to disclose.

References

  1. Robinson, C.J.; Bohannan, B.J.M.; Young, V.B. From Structure to Function: The Ecology of Host-Associated Microbial Communities. Microbiol. Mol. Biol. Rev. 2010, 74, 453–476. [Google Scholar] [CrossRef] [PubMed]
  2. Wilkins, L.G.E.; Leray, M.; O’Dea, A.; Yuen, B.; Peixoto, R.S.; Pereira, T.J.; Bik, H.M.; Coil, D.A.; Duffy, J.E.; Herre, E.A.; et al. Host-Associated Microbiomes Drive Structure and Function of Marine Ecosystems. PLoS Biol. 2019, 17, e3000533. [Google Scholar] [CrossRef] [PubMed]
  3. Hentschel, U.; Piel, J.; Degnan, S.M.; Taylor, M.W. Genomic Insights into the Marine Sponge Microbiome. Nat Rev Microbiol 2012, 10, 641–654. [Google Scholar] [CrossRef] [PubMed]
  4. De Goeij, J.M.; Van Oevelen, D.; Vermeij, M.J.A.; Osinga, R.; Middelburg, J.J.; de Goeij, A.F.P.M.; Admiraal, W. Surviving in a Marine Desert: The Sponge Loop Retains Resources within Coral Reefs. Science 2013, 342, 108–110. [Google Scholar] [CrossRef] [PubMed]
  5. Trevathan-Tackett, S.M.; Sherman, C.D.H.; Huggett, M.J.; Campbell, A.H.; Laverock, B.; Hurtado-McCormick, V.; Seymour, J.R.; Firl, A.; Messer, L.F.; Ainsworth, T.D.; et al. A Horizon Scan of Priorities for Coastal Marine Microbiome Research. Nat. Ecol. Evol. 2019, 3, 1509–1520. [Google Scholar] [CrossRef] [PubMed]
  6. Peixoto, R.S. A, Rosado AS, Bourne DG. 2017. Beneficial microorganisms for corals (BMC): Proposed mechanisms for coral health and resilience. Front. Microbiol. 2017, 8, 341. [Google Scholar]
  7. Coelho, F.J.R.C.; Cleary, D.F.R.; Costa, R.; Ferreira, M.; Polónia, A.R.M.; Silva, A.M.S.; Simões, M.M.Q.; Oliveira, V.; Gomes, N.C.M. Multitaxon Activity Profiling Reveals Differential Microbial Response to Reduced Seawater PH and Oil Pollution. Mol. Ecol. 2016, 25, 4645–4659. [Google Scholar] [CrossRef]
  8. Louvado, A.; Coelho, F.J.R.C.; Gomes, H.; Cleary, D.F.R.; Cunha, Â.; Gomes, N.C.M. Independent and Interactive Effects of Reduced Seawater PH and Oil Contamination on Subsurface Sediment Bacterial Communities. Environ. Sci. Pollut. Res. 2018, 25, 32756–32766. [Google Scholar] [CrossRef]
  9. Coelho, F.J.R.C.; Cleary, D.F.R.; Rocha, R.J.M.; Calado, R.; Castanheira, J.M.; Rocha, S.M.; Silva, A.M.S.; Simões, M.M.Q.; Oliveira, V.; Lillebø, A.I. Unraveling the Interactive Effects of Climate Change and Oil Contamination on Laboratory-simulated Estuarine Benthic Communities. Glob. Chang. Biol. 2015, 21, 1871–1886. [Google Scholar] [CrossRef]
  10. Baltar, F.; Palovaara, J.; Vila-Costa, M.; Salazar, G.; Calvo, E.; Pelejero, C.; Marrasé, C.; Gasol, J.M.; Pinhassi, J. Response of Rare, Common and Abundant Bacterioplankton to Anthropogenic Perturbations in a Mediterranean Coastal Site. FEMS Microbiol. Ecol. 2015, 91, fiv058. [Google Scholar] [CrossRef]
  11. Friedlingstein, P.; O’sullivan, M.; Jones, M.W.; Andrew, R.M.; Gregor, L.; Hauck, J.; Le Quéré, C.; Luijkx, I.T.; Olsen, A.; Peters, G.P. Global Carbon Budget 2022. Earth Syst. Sci. Data 2022, 14, 4811–4900. [Google Scholar] [CrossRef]
  12. Doney, S.C.; Busch, D.S.; Cooley, S.R.; Kroeker, K.J. The Impacts of Ocean Acidification on Marine Ecosystems and Reliant Human Communities. Annu. Rev. Environ. Resour. 2020, 45, 83–112. [Google Scholar] [CrossRef]
  13. Bindoff, N.L.; Cheung, W.W.L.; Kairo, J.G.; Arístegui, J.; Guinder, V.A.; Hallberg, R.; Hilmi, N.; Jiao, N.; Karim, M.S.; Levin, L. Changing Ocean, Marine Ecosystems, and Dependent Communities; Cambridge University Press: Cambridge, UK, 2019. [Google Scholar]
  14. Caldeira, K.; Wickett, M.E. Anthropogenic Carbon and Ocean PH. Nature 2003, 425, 365. [Google Scholar] [CrossRef]
  15. Militon, C.; Atkinson, A.; Michotey, V.; Jeziorski, C.; Cravo-Laureau, C.; Duran, R.; Bonin, P.; Cuny, P. Metatranscriptomes of Oil-Contaminated Marine Coastal Sediment Affected by Oil Addition and/or by the Bioturbating Activity of the Marine Polychaete Hediste Diversicolor: Who Are the Microbial Players? Mar. Genom. 2016, 29, 55–59. [Google Scholar] [CrossRef] [PubMed]
  16. Stauffert, M.; Cravo-Laureau, C.; Duran, R. Dynamic of Sulphate-Reducing Microorganisms in Petroleum-Contaminated Marine Sediments Inhabited by the Polychaete Hediste Diversicolor. Environ. Sci. Pollut. Res. 2015, 22, 15273–15284. [Google Scholar] [CrossRef] [PubMed]
  17. Dale, H.; Solan, M.; Lam, P.; Cunliffe, M. Sediment Microbial Assemblage Structure Is Modified by Marine Polychaete Gut Passage. FEMS Microbiol. Ecol. 2019, 95, fiz047. [Google Scholar] [CrossRef] [PubMed]
  18. Araújo, C.V.M.; Moreira-Santos, M.; Patrício, J.; Martins, I.; Moreno-Garrido, I.; Blasco, J.; Marques, J.C.; Ribeiro, R. Feeding Niche Preference of the Mudsnail Peringia Ulvae. Mar. Freshw. Res. 2015, 66, 573–581. [Google Scholar] [CrossRef]
  19. Hale, R.; Mavrogordato, M.N.; Tolhurst, T.J.; Solan, M. Characterizations of How Species Mediate Ecosystem Properties Require More Comprehensive Functional Effect Descriptors. Sci. Rep. 2014, 4, 6463. [Google Scholar] [CrossRef]
  20. Ulvae, P. Dietary bioavailability of cadmium presented to the gastropod Peringia ulvae as quantum dots and in ionic form. Environ. Toxicol. Chem. 2013, 32, 2621–2629. [Google Scholar]
  21. Coelho, F.J.R.C.; Santos, A.L.; Coimbra, J.; Almeida, A.; Cunha, Â.; Cleary, D.F.R.; Calado, R.; Gomes, N.C.M. Interactive Effects of Global Climate Change and Pollution on Marine Microbes: The Way Ahead. Ecol. Evol. 2013, 3, 1808–1818. [Google Scholar] [CrossRef]
  22. Louvado, A.; Coelho, F.J.R.C.; Oliveira, V.; Gomes, H.; Cleary, D.F.R.; Simões, M.M.Q.; Cunha, A.; Gomes, N.C.M. Microcosm Evaluation of the Impact of Oil Contamination and Chemical Dispersant Addition on Bacterial Communities and Sediment Remediation of an Estuarine Port Environment. J. Appl. Microbiol. 2019, 127, 134–149. [Google Scholar] [CrossRef]
  23. Cravo-Laureau, C.; Jézéquel, R.; Gilbert, F.; Cuny, P.; Duran, R. Mudflat Benthic Spill Simulations BT—Hydrocarbon and Lipid Microbiology Protocols: Meso- and Microcosms; McGenity, T.J., Timmis, K.N., Nogales, B., Eds.; Springer Berlin Heidelberg: Berlin, Heidelberg, 2017; pp. 79–89. ISBN 978-3-662-53108-2. [Google Scholar]
  24. Gattuso, J.-P.; Lavigne, H. Technical Note: Approaches and Software Tools to Investigate the Impact of Ocean Acidification. Biogeosciences 2009, 6, 2121–2133. [Google Scholar] [CrossRef]
  25. Bolyen, E.; Rideout, J.R.; Dillon, M.R.; Bokulich, N.A.; Abnet, C.C.; Al-Ghalith, G.A.; Alexander, H.; Alm, E.J. Reproducible, Interactive, Scalable and Extensible Microbiome Data Science Using QIIME 2. Nat. Biotechnol. 2019, 1, 852–857. [Google Scholar] [CrossRef]
  26. Callahan, B.J.; McMurdie, P.J.; Rosen, M.J.; Han, A.W.; Johnson, A.J.A.; Holmes, S.P. DADA2: High-Resolution Sample Inference from Illumina Amplicon Data. Nat. Methods 2016, 13, 581–583. [Google Scholar] [CrossRef]
  27. Coelho, F.J.R.C.; Rocha, R.J.M.; Pires, A.C.C.; Ladeiro, B.; Castanheira, J.M.; Costa, R.; Almeida, A.; Cunha, Â.; Lillebø, A.I.; Ribeiro, R. Development and Validation of an Experimental Life Support System for Assessing the Effects of Global Climate Change and Environmental Contamination on Estuarine and Coastal Marine Benthic Communities. Glob. Chang. Biol. 2013, 19, 2584–2595. [Google Scholar] [CrossRef]
  28. Oksanen, J.; Blanchet, F.G.; Kindt, R.; Legendre, P.; Minchin, P.R.; O’hara, R.B.; Simpson, G.L.; Solymos, P.; Stevens, M.H.H.; Wagner, H. Vegan: Community Ecology Package, R Package Version 2.2-1. 2015.
  29. R. Core Team. R: A Language and Environment for Statistical Computing (Version 2.12. 0); R Foundation for Statistical Computing: Vienna, Austria, 2012. [Google Scholar]
  30. Madden, T. The BLAST Sequence Analysis Tool. In The NCBI Handbook; The National Library of Medicine: Bethesda, MD, USA, 2003. [Google Scholar]
  31. Langille, M.G.I.; Zaneveld, J.; Caporaso, J.G.; McDonald, D.; Knights, D.; Reyes, J.A.; Clemente, J.C.; Burkepile, D.E.; Thurber, R.L.V.; Knight, R. Predictive Functional Profiling of Microbial Communities Using 16S RRNA Marker Gene Sequences. Nat. Biotechnol. 2013, 31, 814–821. [Google Scholar] [CrossRef] [PubMed]
  32. Segata, N.; Izard, J.; Waldron, L.; Gevers, D.; Miropolsky, L.; Garrett, W.S.; Huttenhower, C. Metagenomic Biomarker Discovery and Explanation. Genome Biol. 2011, 12, R60. [Google Scholar] [CrossRef] [PubMed]
  33. Weisburg, W.G.; Barns, S.M.; Pelletier, D.A.; Lane, D.J. 16S Ribosomal DNA Amplification for Phylogenetic Study. J. Bacteriol. 1991, 173, 697–703. [Google Scholar] [CrossRef] [PubMed]
  34. Heuer, H.; Wieland, G.; Schönfeld, J.; Schönwälder, A.; Gomes, N.C.M.; Smalla, K. Bacterial Community Profiling Using DGGE or TGGE Analysis. Environ. Mol. Microbiol. Protoc. Appl. 2001, 9, 177–190. [Google Scholar]
  35. Smalla, K.; Wieland, G.; Buchner, A.; Zock, A.; Parzy, J.; Kaiser, S.; Roskot, N.; Heuer, H.; Berg, G. Bulk and Rhizosphere Soil Bacterial Communities Studied by Denaturing Gradient Gel Electrophoresis: Plant-Dependent Enrichment and Seasonal Shifts Revealed. Appl. Environ. Microbiol. 2001, 67, 4742–4751. [Google Scholar] [CrossRef] [PubMed]
  36. Hochstein, R.; Zhang, Q.; Sadowsky, M.J.; Forbes, V.E. The Deposit Feeder Capitella Teleta Has a Unique and Relatively Complex Microbiome Likely Supporting Its Ability to Degrade Pollutants. Sci. Total Environ. 2019, 670, 547–554. [Google Scholar] [CrossRef]
  37. Zbinden, M.; Pailleret, M.; Ravaux, J.; Gaudron, S.M.; Hoyoux, C.; Lambourdiere, J.; Waren, A.; Lorion, J.; Halary, S.; Duper-ron, S. Bacterial communities associated with the wood-feeding gastropod Pectinodonta sp. (Patellogastropoda, Mollusca). FEMS 2010, 74, 450–463. [Google Scholar] [CrossRef]
  38. Chung, H.C.; Lee, O.O.; Huang, Y.L.; Mok, S.Y.; Kolter, R.; Qian, P.Y. Bacterial community succession and chemical profiles of subtidal biofilms in relation to larval settlement of the polychaete Hydroides elegans. ISME J. 2010, 4, 817–828. [Google Scholar] [CrossRef]
  39. McIlroy, S.J.; Nielsen, P.H. The Family Saprospiraceae BT—The Prokaryotes: Other Major Lineages of Bacteria and The Archaea; Rosenberg, E., DeLong, E.F., Lory, S., Stackebrandt, E., Thompson, F., Eds.; Springer: Berlin/Heidelberg, Germany, 2014; pp. 863–889. ISBN 978-3-642-38954-2. [Google Scholar]
  40. Kondrotaite, Z.; Valk, L.C.; Petriglieri, F.; Singleton, C.; Nierychlo, M.; Dueholm, M.K.D.; Nielsen, P.H. Diversity and Ecophysiology of the Genus OLB8 and Other Abundant Uncultured Saprospiraceae Genera in Global Wastewater Treatment Systems. Front. Microbiol. 2022, 13, 917553. [Google Scholar] [CrossRef]
  41. Lu, C.; Zhang, Q.; Huang, Q.; Wang, S.; Qin, X.; Ren, T.; Xie, R.; Su, H. Significant Shifts in Microbial Communities Associated with Scleractinian Corals in Response to Algae Overgrowth. Microorganisms 2022, 10, 2196. [Google Scholar] [CrossRef]
  42. Sun, L.; Gao, P.; Li, Y.; Wang, C.; Ding, N.; Chen, J.; Song, Y.; Liu, C.; Song, L.; Wang, R. Microbial Community Coexisting with Harmful Alga Karenia Mikimotoi and Microbial Control of Algal Bloom in Laboratory. J. Oceanol. Limnol. 2022, 40, 1027–1038. [Google Scholar] [CrossRef]
  43. Bowman, J.P.; Nowak, B. Salmonid Gill Bacteria and Their Relationship to Amoebic Gill Disease. J. Fish. Dis. 2004, 27, 483–492. [Google Scholar] [CrossRef]
  44. Vijayan, N.; Lema, K.A.; Nedved, B.T.; Hadfield, M.G. Microbiomes of the Polychaete Hydroides Elegans (Polychaeta: Serpulidae) across Its Life-History Stages. Mar. Biol. 2019, 166, 19. [Google Scholar] [CrossRef]
  45. Neave, M.J.; Michell, C.T.; Apprill, A.; Voolstra, C.R. Endozoicomonas Genomes Reveal Functional Adaptation and Plasticity in Bacterial Strains Symbiotically Associated with Diverse Marine Hosts. Sci. Rep. 2017, 7, 40579. [Google Scholar] [CrossRef] [PubMed]
  46. Michas, A.; Vestergaard, G.; Trautwein, K.; Avramidis, P.; Hatzinikolaou, D.G.; Vorgias, C.E.; Wilkes, H.; Rabus, R.; Schloter, M.; Schöler, A. More than 2500 Years of Oil Exposure Shape Sediment Microbiomes with the Potential for Syntrophic Degradation of Hydrocarbons Linked to Methanogenesis. Microbiome 2017, 5, 118. [Google Scholar] [CrossRef]
  47. Wu, X.-L.; Yu, S.-L.; Gu, J.; Zhao, G.-F.; Chi, C.-Q. Filomicrobium Insigne Sp. Nov., Isolated from an Oil-Polluted Saline Soil. Int. J. Syst. Evol. Microbiol. 2009, 59, 300–305. [Google Scholar] [CrossRef] [PubMed]
  48. Kostka, J.E.; Prakash, O.; Overholt, W.A.; Green, S.J.; Freyer, G.; Canion, A.; Delgardio, J.; Norton, N.; Hazen, T.C.; Huettel, M. Hydrocarbon-Degrading Bacteria and the Bacterial Community Response in Gulf of Mexico Beach Sands Impacted by the Deepwater Horizon Oil Spill. Appl. Environ. Microbiol. 2011, 77, 7962–7974. [Google Scholar] [CrossRef] [PubMed]
  49. Yakimov, M.M.; Golyshin, P.N.; Lang, S.; Moore, E.R.B.; Abraham, W.-R.; Lunsdorf, H.; Timmis, K.N. Alcanivorax Borkumensis Gen. Nov., Sp. Nov., a New, Hydrocarbon-Degrading and Surfactant-Producing Marine Bacterium. Int. J. Syst. Bacteriol. 1998, 48, 339–348. [Google Scholar] [CrossRef] [PubMed]
  50. Ward, L.M.; Bertran, E.; Johnston, D.T. Expanded Genomic Sampling Refines Current Understanding of the Distribution and Evolution of Sulfur Metabolisms in the Desulfobulbales. Front. Microbiol. 2021, 12, 666052. [Google Scholar] [CrossRef]
  51. Thompson, A.W.; Foster, R.A.; Krupke, A.; Carter, B.J.; Musat, N.; Vaulot, D.; Kuypers, M.M.M.; Zehr, J.P. Unicellular Cyanobacterium Symbiotic with a Single-Celled Eukaryotic Alga. Science 2012, 337, 1546–1550. [Google Scholar] [CrossRef]
  52. Puente-Sánchez, F.; Arce-Rodríguez, A.; Oggerin, M.; García-Villadangos, M.; Moreno-Paz, M.; Blanco, Y.; Rodríguez, N.; Bird, L.; Lincoln, S.A.; Tornos, F.; et al. Viable Cyanobacteria in the Deep Continental Subsurface. Proc. Natl. Acad. Sci. 2018, 115, 10702–10707. [Google Scholar] [CrossRef]
  53. Thacker, R.W. Impacts of Shading on Sponge-Cyanobacteria Symbioses: A Comparison between Host-Specific and Generalist Associations1. Integr. Comp. Biol. 2005, 45, 369–376. [Google Scholar] [CrossRef]
  54. Carpenter, E.J.; Foster, R.A. Marine Cyanobacterial Symbioses. In Cyanobacteria in symbiosis; Springer: Berlin/Heidelberg, Germany, 2002; pp. 11–17. [Google Scholar]
  55. Wang, D.; Ren, J.; Tan, Z.; You, J. Gut Microbial Profiles in Nereis Succinea and Their Contribution to the Degradation of Organic Pollutants. Environ. Sci. Technol. 2020, 54, 6235–6243. [Google Scholar] [CrossRef]
  56. Sandrini, G.; Ji, X.; Verspagen, J.M.H.; Tann, R.P.; Slot, P.C.; Luimstra, V.M.; Schuurmans, J.M.; Matthijs, H.C.P.; Huisman, J. Rapid Adaptation of Harmful Cyanobacteria to Rising CO2. Proc. Natl. Acad. Sci. 2016, 113, 9315–9320. [Google Scholar] [CrossRef]
  57. Morrow, K.M.; Bourne, D.G.; Humphrey, C.; Botté, E.S.; Laffy, P.; Zaneveld, J.; Uthicke, S.; Fabricius, K.E.; Webster, N.S. Natural Volcanic CO2 Seeps Reveal Future Trajectories for Host–Microbial Associations in Corals and Sponges. ISME J. 2015, 9, 894–908. [Google Scholar] [CrossRef]
  58. Stauffert, M.; Cravo-Laureau, C.; Jézéquel, R.; Barantal, S.; Cuny, P.; Gilbert, F.; Cagnon, C.; Militon, C.; Amouroux, D.; Mahdaoui, F.; et al. Impact of Oil on Bacterial Community Structure in Bioturbated Sediments. PLoS ONE 2013, 8, e65347. [Google Scholar] [CrossRef] [PubMed]
  59. Martins dos Santos, V.; Sabirova, J.; Timmis, K.N.; Yakimov, M.M.; Golyshin, P.N. Alcanivorax Borkumensis BT—Handbook of Hydrocarbon and Lipid Microbiology; Timmis, K.N., Ed.; Springer: Berlin/Heidelberg, Germany, 2010; pp. 1265–1288. ISBN 978-3-540-77587-4. [Google Scholar]
  60. Yakimov, M.M.; Timmis, K.N.; Golyshin, P.N. Obligate Oil-Degrading Marine Bacteria. Curr. Opin. Biotechnol. 2007, 18, 257–266. [Google Scholar] [CrossRef] [PubMed]
  61. Chernikova, T.N.; Bargiela, R.; Toshchakov, S.V.; Shivaraman, V.; Lunev, E.A.; Yakimov, M.M.; Thomas, D.N.; Golyshin, P.N. Hydrocarbon-Degrading Bacteria Alcanivorax and Marinobacter Associated With Microalgae Pavlova Lutheri and Nannochloropsis Oculata. Front. Microbiol. 2020, 11, 2650. [Google Scholar] [CrossRef] [PubMed]
  62. Bolch, C.J.S.; Bejoy, T.A.; Green, D.H. Bacterial Associates Modify Growth Dynamics of the Dinoflagellate Gymnodinium Catenatum. Front. Microbiol. 2017, 8, 670. [Google Scholar] [CrossRef] [PubMed]
  63. Green, D.H.; Llewellyn, L.E.; Negri, A.P.; Blackburn, S.I.; Bolch, C.J.S. Phylogenetic and Functional Diversity of the Cultivable Bacterial Community Associated with the Paralytic Shellfish Poisoning Dinoflagellate Gymnodinium Catenatum. FEMS Microbiol. Ecol. 2004, 47, 345–357. [Google Scholar] [CrossRef] [PubMed]
  64. Amin, S.A.; Green, D.H.; Hart, M.C.; Küpper, F.C.; Sunda, W.G.; Carrano, C.J. Photolysis of Iron–Siderophore Chelates Promotes Bacterial–Algal Mutualism. Proc. Natl. Acad. Sci. 2009, 106, 17071–17076. [Google Scholar] [CrossRef]
  65. Shaikhulova, S.; Fakhrullina, G.; Nigamatzyanova, L.; Akhatova, F.; Fakhrullin, R. Worms Eat Oil: Alcanivorax Borkumensis Hydrocarbonoclastic Bacteria Colonise Caenorhabditis Elegans Nematodes Intestines as a First Step towards Oil Spills Zooremediation. Sci. Total Environ. 2021, 761, 143209. [Google Scholar] [CrossRef]
  66. Pal, S.; Kundu, A.; Banerjee, T.D.; Mohapatra, B.; Roy, A.; Manna, R.; Sar, P.; Kazy, S.K. Genome Analysis of Crude Oil Degrading Franconibacter Pulveris Strain DJ34 Revealed Its Genetic Basis for Hydrocarbon Degradation and Survival in Oil Contaminated Environment. Genomics 2017, 109, 374–382. [Google Scholar] [CrossRef]
  67. Sierra-García, I.N.; Correa Alvarez, J.; Pantaroto de Vasconcellos, S.; Pereira de Souza, A.; dos Santos Neto, E.V.; de Oliveira, V.M. New Hydrocarbon Degradation Pathways in the Microbial Metagenome from Brazilian Petroleum Reservoirs. PLoS ONE 2014, 9, e90087. [Google Scholar] [CrossRef]
  68. Bouraoui, Z.; Banni, M.; Ghedira, J.; Clerandeau, C.; Narbonne, J.F.; Boussetta, H. Evaluation of Enzymatic Biomarkers and Lipoperoxidation Level in Hediste Diversicolor Exposed to Copper and Benzo [a] Pyrene. Ecotoxicol. Environ. Saf. 2009, 72, 1893–1898. [Google Scholar] [CrossRef]
  69. Rodrigues, A.P.; Lehtonen, K.K.; Guilhermino, L.; Guimarães, L. Exposure of Carcinus Maenas to Waterborne Fluoranthene: Accumulation and Multibiomarker Responses. Sci. Total Environ. 2013, 443, 454–463. [Google Scholar] [CrossRef]
  70. Olivares-Rubio, H.F.; Espinosa-Aguirre, J.J. Acetylcholinesterase Activity in Fish Species Exposed to Crude Oil Hydrocarbons: A Review and New Perspectives. Chemosphere 2021, 264, 128401. [Google Scholar] [CrossRef]
  71. Ansaldo, M.; Najle, R.; Luquet, C.M. Oxidative Stress Generated by Diesel Seawater Contamination in the Digestive Gland of the Antarctic Limpet Nacella Concinna. Mar. Environ. Res. 2005, 59, 381–390. [Google Scholar] [CrossRef]
  72. Sazykin, I.S.; Sazykina, M.A.; Khmelevtsova, L.E.; Seliverstova, E.Y.; Karchava, K.S.; Zhuravleva, M. V Antioxidant Enzymes and Reactive Oxygen Species Level of the Achromobacter Xylosoxidans Bacteria during Hydrocarbons Biotransformation. Arch. Microbiol. 2018, 200, 1057–1065. [Google Scholar] [CrossRef]
  73. Solé, M.; Kopecka-Pilarczyk, J.; Blasco, J. Pollution Biomarkers in Two Estuarine Invertebrates, Nereis Diversicolor and Scrobicularia Plana, from a Marsh Ecosystem in SW Spain. Environ. Int. 2009, 35, 523–531. [Google Scholar] [CrossRef] [PubMed]
  74. Moreira, S.M.; Lima, I.; Ribeiro, R.; Guilhermino, L. Effects of Estuarine Sediment Contamination on Feeding and on Key Physiological Functions of the Polychaete Hediste Diversicolor: Laboratory and in Situ Assays. Aquat. Toxicol. 2006, 78, 186–201. [Google Scholar] [CrossRef]
  75. Nechev, J.T.; Khotimchenko, S.V.; Ivanova, A.P.; Stefanov, K.L.; Dimitrova-Konaklieva, S.D.; Andreev, S.; Popov, S.S. Effect of Diesel Fuel Pollution on the Lipid Composition of Some Wide-Spread Black Sea Algae and Invertebrates. Z. Für Naturforschung C 2002, 57, 1–5. [Google Scholar] [CrossRef]
  76. Carvalho, R.N.; Burchardt, A.D.; Sena, F.; Mariani, G.; Mueller, A.; Bopp, S.K.; Umlauf, G.; Lettieri, T. Gene Biomarkers in Diatom Thalassiosira Pseudonana Exposed to Polycyclic Aromatic Hydrocarbons from Contaminated Marine Surface Sediments. Aquat. Toxicol. 2011, 101, 244–253. [Google Scholar] [CrossRef] [PubMed]
  77. Grilo, T.F.; Lopes, A.R.; Sampaio, E.; Rosa, R.; Cardoso, P.G. Sex Differences in Oxidative Stress Responses of Tropical Topshells (Trochus Histrio) to Increased Temperature and High PCO2. Mar. Pollut. Bull. 2018, 131, 252–259. [Google Scholar] [CrossRef] [PubMed]
  78. Boldina-Cosqueric, I.; Amiard, J.-C.; Amiard-Triquet, C.; Dedourge-Geffard, O.; Métais, I.; Mouneyrac, C.; Moutel, B.; Berthet, B. Biochemical, Physiological and Behavioural Markers in the Endobenthic Bivalve Scrobicularia Plana as Tools for the Assessment of Estuarine Sediment Quality. Ecotoxicol. Environ. Saf. 2010, 73, 1733–1741. [Google Scholar] [CrossRef] [PubMed]
  79. Sui, Y.; Hu, M.; Shang, Y.; Wu, F.; Huang, X.; Dupont, S.; Storch, D.; Pörtner, H.-O.; Li, J.; Lu, W. Antioxidant Response of the Hard Shelled Mussel Mytilus Coruscus Exposed to Reduced PH and Oxygen Concentration. Ecotoxicol. Environ. Saf. 2017, 137, 94–102. [Google Scholar] [CrossRef] [PubMed]
  80. Thangal, S.H.; Nivetha, M.; Muttharasi, C.; Anandhan, K.; Muralisankar, T. Effects of Acidified Seawater on Biological and Physiological Responses of Artemia Franciscana. Mar. Pollut. Bull. 2021, 169, 112476. [Google Scholar] [CrossRef] [PubMed]
  81. Freitas, R.; Pires, A.; Moreira, A.; Wrona, F.J.; Figueira, E.; Soares, A.M.V.M. Biochemical Alterations Induced in Hediste Diversicolor under Seawater Acidification Conditions. Mar. Environ. Res. 2016, 117, 75–84. [Google Scholar] [CrossRef] [PubMed]
  82. Lee, Y.H.; Jeong, C.-B.; Wang, M.; Hagiwara, A.; Lee, J.-S. Transgenerational Acclimation to Changes in Ocean Acidification in Marine Invertebrates. Mar. Pollut. Bull. 2020, 153, 111006. [Google Scholar] [CrossRef] [PubMed]
  83. Navarro, J.M.; Torres, R.; Acuña, K.; Duarte, C.; Manriquez, P.H.; Lardies, M.; Lagos, N.A.; Vargas, C.; Aguilera, V. Impact of Medium-Term Exposure to Elevated PCO2 Levels on the Physiological Energetics of the Mussel Mytilus Chilensis. Chemosphere 2013, 90, 1242–1248. [Google Scholar] [CrossRef] [PubMed]
  84. Michaelidis, B.; Ouzounis, C.; Paleras, A.; Pörtner, H.O. Effects of Long-Term Moderate Hypercapnia on Acid–Base Balance and Growth Rate in Marine Mussels Mytilus Galloprovincialis. Mar. Ecol. Prog. Ser. 2005, 293, 109–118. [Google Scholar] [CrossRef]
  85. Freitas, R.; De Marchi, L.; Bastos, M.; Moreira, A.; Velez, C.; Chiesa, S.; Wrona, F.J.; Figueira, E.; Soares, A.M.V.M. Effects of Seawater Acidification and Salinity Alterations on Metabolic, Osmoregulation and Oxidative Stress Markers in Mytilus Galloprovincialis. Ecol. Indic. 2017, 79, 54–62. [Google Scholar] [CrossRef]
  86. Silva, C.S.E.; Novais, S.C.; Lemos, M.F.L.; Mendes, S.; Oliveira, A.P.; Gonçalves, E.J.; Faria, A.M. Effects of Ocean Acidification on the Swimming Ability, Development and Biochemical Responses of Sand Smelt Larvae. Sci. Total Environ. 2016, 563, 89–98. [Google Scholar] [CrossRef]
  87. Sokołowski, A.; Brulińska, D. The Effects of Low Seawater PH on Energy Storage and Heat Shock Protein 70 Expression in a Bivalve Limecola Balthica. Mar. Environ. Res. 2018, 140, 289–298. [Google Scholar] [CrossRef]
  88. Altschul, S.F.; Gish, W.; Miller, W.; Myers, E.W.; Lipman, D.J. Basic Local Alignment Search Tool. J. Mol. Biol. 1990, 215, 403–410. [Google Scholar] [CrossRef]
  89. Bradford, M.M. A rapid and sensitive method for the quantitation of microgram quantities of protein utilizing the principle of protein-dye binding. Anal. Biochem. 1976, 72, 248–254. [Google Scholar] [CrossRef] [PubMed]
  90. Clairborne, A. Catalase activity. In Handbook of Method for Oxygen Radical Research; Greenwald, R.A., Ed.; CRC Press: Boca Raton, FL, USA, 1985. [Google Scholar]
  91. De Coen, W.M.; Janssen, C.R. The missing biomarker link: Relationships between effects on the cellular energy allocation biomarker of toxicant-stressed Daphnia magna and corresponding population characteristics. Environ. Toxicol. Chem. Int. J. 2003, 22, 1632–1641. [Google Scholar]
  92. Diamantino, T.C.; Almeida, E.; Soares, A.M.V.M.; Guilhermino, L. Lactate dehydrogenase activity as an effect criterion in toxicity tests with Daphnia magna straus. Chemosphere 2001, 45, 553–560. [Google Scholar] [CrossRef] [PubMed]
  93. Dunn, P.K. Tweedie: Evaluation of Tweedie Exponential Family Models, R Packag. Version 2. 2017.
  94. Ellman, G.L.; Courtney, K.D.; Andres Jr, V.; Featherstone, R.M. A new and rapid colorimetric determination of acetylcholinesterase activity. Biochem. Pharmacol. 1961, 7, 88–95. [Google Scholar] [CrossRef]
  95. Habig, W.H.; Pabst, M.J.; Jakoby, W.B. Glutathione S-transferases: The first enzymatic step in mercapturic acid formation. J. Biol. Chem. 1974, 249, 7130–7139. [Google Scholar] [CrossRef]
  96. McMurdie, P.J.; Holmes, S. phyloseq: An R package for reproducible interactive analysis and graphics of microbiome census data. PLoS ONE 2013, 8, e61217. [Google Scholar] [CrossRef]
  97. Ohkawa, H.; Ohishi, N.; Yagi, K. Assay for lipid peroxides in animal tissues by thiobarbituric acid reaction. Anal. Biochem. 1979, 95, 351–358. [Google Scholar] [CrossRef]
  98. Vassault, A. Lactate dehydrogenase, UV-method with pyruvate and NADH. Methods Enzym. Anal. 1983, 3, 118. [Google Scholar]
  99. Verslycke, T.; Vercauteren, J.; Devos, C.; Moens, L.; Sandra, P.; Janssen, C.R. Cellular energy allocation in the estuarine mysid shrimp Neomysis integer (Crustacea: Mysidacea) following tributyltin exposure. J. Exp. Mar. Bio. Ecol. 2003, 288, 167–179. [Google Scholar] [CrossRef]
Figure 1. Boxplots of (a) evenness (Pielou’s J), (b) richness, (c) Shannon’s H’ and (d) Fisher’s alpha diversity indices for each bacterial host (gastropod and polychaete). The following treatments are represented in the X-axis: Cont—control; OnpH—reduced seawater pH; OnOi—oil-contaminated; pHOi—reduced seawater pH and oil-contaminated.
Environments 11 00037 g001
Figure 2. Ordination showing the first two axes of the principal coordinates analysis (PCoA) of ASV composition of (A) both polychaete Hediste diversicolor and gastropod Peringia ulvae; (B) only the polychaete; and (C) only the gastropod. Symbols are color-coded and represent samples from the different treatments as shown in the legend on the right side of the plots: Cont—control; OnpH—reduced seawater pH; OnOi—oil-contaminated; pHOi—reduced seawater pH and oil-contaminated. Grey symbols represent weighted average scores for ASVs. The symbol size is proportional to abundance (number of sequences reads).
Environments 11 00037 g002
Figure 3. Boxplots of the relative abundances of (a) Proteobacteria, (b) Cyanobacteria, (c) Planctomycetota, and (d) Bacteroidota for each host (gastropod Peringia ulvae and polychaete Hediste diversicolor). The following treatments are represented in the X-axis: Cont—control; OnpH—reduced seawater pH; OnOi—oil-contaminated; pHOi—reduced seawater pH and oil-contaminated.
Environments 11 00037 g003
Figure 4. Boxplots of the relative abundances of (a) Rhodobacterales, (b) Cyanobacteriales, (c) Pirellulales, and (d) Chitinophagales for the gastropod Peringia ulvae- and the polychaete Hediste diversicolor-associated bacterial communities. The following treatments are represented in the X-axis: Cont—control; OnpH—reduced seawater pHreduced seawater pH; OnOi—oil-contaminated; pHOi—reduced seawater pH and oil-contaminated.
Environments 11 00037 g004
Figure 5. Relative abundance of the most abundant ASVs in the associated bacterial communities of the polychaete Hediste diversicolor. Circles arecolor-coded according to prokaryotic phylum and their size is proportional to the mean percentage (perc) of sequences per sample, as indicated by the symbol legend in the upper right corner of the figure below the phylum assignment legend. The following treatments are represented in the X-axis: CONT—control; OnpH—reduced seawater pH; OnOi—oil-contaminated; pHOi—reduced seawater pH and oil-contaminated.
Environments 11 00037 g005
Figure 6. Relative abundance of the most abundant ASVs in the gastropod Peringia ulvae-associated bacterial communities and color-coded according to prokaryotic phylum. The circle size of the ASV is proportional to the mean percentage (perc) of sequences per treatment as indicated by the symbol legend in the upper right corner of the figure below the phylum assignment legend. The following treatments are represented in the X-axis: CONT—control; OnpH—reduced seawater pH; OnOi—oil-contaminated; pHOi—reduced seawater pH and oil-contaminated.
Environments 11 00037 g006
Figure 7. Effect of the four experimental treatments (Cont—control; OnpH—reduced seawater pH; OnOi—oil-contaminated; pHOi—reduced seawater pH and oil-contaminated) on the enzymatic activities of acetylcholinesterase (AChE), lactate dehydrogenase (LDH), catalase (CAT), and glutathione S-transferase (GST), lipid peroxidation (LPO), and energy-related parameters (total lipids, total carbohydrates, total proteins, Ea—energy available; Ec—energy consumption; and CEA—cellular energy allocation) in the whole body (soft tissues) of the polychaete Hediste diversicolor (top panels) and the gastropod Peringia ulvae (bottom panels) after 21 d of exposure. TBARS—thiobarbituric acid-reactive substances; FW—fresh weight. Bars represent means ± SE. Note the lack of replicates in OnOi and pHOi treatments in H. diversicolor.
Environments 11 00037 g007
Disclaimer/Publisher’s Note: The statements, opinions and data contained in all publications are solely those of the individual author(s) and contributor(s) and not of MDPI and/or the editor(s). MDPI and/or the editor(s) disclaim responsibility for any injury to people or property resulting from any ideas, methods, instructions or products referred to in the content.

