
Celerity of Ice Breakup Front in the Regulated Peace River, Canada, and Implications for the Recharge of the Peace–Athabasca Delta

Watershed Hydrology and Ecology Research Division, Environment and Climate Change Canada, Canada Centre for Inland Waters, 867 Lakeshore Rd., Burlington, ON L7S 1A1, Canada
Environments 2024, 11(2), 28; https://doi.org/10.3390/environments11020028
Submission received: 28 November 2023
/
Revised: 10 January 2024
/
Accepted: 17 January 2024
/
Published: 1 February 2024
Abstract
:Timely release of flow from upstream hydropower generation facilities on the Peace River can enhance potential ice-jam flooding near the drying Peace–Athabasca Delta (PAD), a Ramsar wetland of international importance and homeland to Indigenous Peoples. An important consideration in deciding whether and when to commence a release is the celerity of the breakup front as it advances along the Peace River. Relevant historical data for a key stretch of the river are analyzed to determine average celerities, which can vary by an order of magnitude from year to year. Seven breakup events are identified that might have been candidates for a release, and the predictability of associated celerities is explored in terms of antecedent hydroclimatic variables, including cumulative winter snowfall, snow water equivalent on 1 April, ice cover thickness, coldness of the winter, and freezeup level. It is shown that celerity can be predicted to within a factor of two or less, with the freezeup level giving the best results. Three of the seven “promising” events culminated in PAD floods and were associated with the three highest celerities. The empirical findings are shown to generally align with physical understanding of breakup driving and resisting factors.
Keywords:
breakup; celerity; dam; driving factors; flood; ice front; ice jam; Peace–Athabasca Delta; regulation; resisting factors1. Introduction
The Peace–Athabasca Delta (PAD) in northern Alberta is one of the world’s largest inland freshwater deltas and is home to large populations of waterfowl, muskrat, beaver, and free-ranging wood bison. The delta region has been designated a Ramsar wetland of international importance and is largely located within the Wood Buffalo National Park (WBNP), a UNESCO World Heritage Site [1]. Moreover, the delta is a homeland for the Indigenous Peoples of the region. During the past five decades or so, this complex and dynamic delta has, in-between rare overland flooding events, experienced prolonged dry periods and considerable reduction in the area covered by the myriad of lakes, ponds, and wetlands (basins) that provide habitat for aquatic life [2,3,4,5,6,7,8,9,10]. Regulation of Peace River began with construction (1968), reservoir-filling (1968–1971), and operation (1972 onwards) of the W.A.C. Bennett hydroelectric dam in British Columbia, located some 1200 km upstream of the PAD (Figure 1). The Peace Canyon dam, located 23 km downstream of the Bennett dam, was completed in 1980. The Site-C dam (to be completed in 2025) and the proposed Dunvegan damsite are located ~105 and ~280 km downstream of the Bennett dam, respectively [11].
Overland flooding events in the Peace sector of the PAD (Peace Delta) are less frequent during the regulation period than before regulation [12,13]. Such events are caused by major spring ice jams that occasionally form in the lower ~50 km of Peace River and the upper ~10 km of the Slave River. Concern over the long-term health and sustenance of PAD ecosystems is underscored by changing climatic conditions and the future construction of dams. As a result of a UNESCO Reactive Monitoring Mission [14], prompted by a petition from Indigenous Peoples, Canadian federal and provincial authorities commissioned a strategic environmental assessment [15] of WBNP. This assessment culminated in development of the WBNP Action Plan [1], which incorporated Indigenous knowledge, to address several recommendations towards preserving the ecological integrity of this important World Heritage Site.
Among other remedial measures, the Action Plan proposes development of a Protocol for timely spring flow enhancement at the outlet of the Peace Canyon dam in years when the early evolution of the spring breakup event indicates that a major ice jam might form in the PAD reach of Peace River. Specifically, the Action Plan states:
“Establish protocols for, and identify circumstances under which, a strategic release of water from the Williston Reservoir behind the W.A.C Bennet Dam could enhance an ice jam flood event within WBNP to encourage flooding of the PAD, including its perched basins, while minimizing unwanted upstream and downstream risks.”
An important consideration in deciding whether and when to implement a release, is the need to forecast when and for how long an ice jam may form in the PAD area of Peace River given that the early progression of the breakup shows potential for an ice-jam flood (IJF). Of course, a release will be delayed or not implemented if there is potential for adverse impacts on downstream communities and infrastructure. The effectiveness of a release will depend on the rate of advance, or celerity, of the breakup front as it moves along the Peace River in the spring. Consequently, the objectives of this study are to (a) quantify the celerity of the breakup front, as is revealed in historical observation reports contributed over the years by various agencies, and (b) examine whether this celerity can be predicted in terms of hydroclimatic variables that will be known at the time of decision-making regarding a release.
2. Background Information
2.1. Spring Flow Releases
A timely increase in flow being released at the farthest downstream dam (Site-C dam in the near future) can augment the discharge in the PAD reach during the “residence” of an ice jam and increase the volume of water entering various Peace Delta basins if a flood does occur. In the present context, the term “release” will be used to denote the increment in flow, over and above what would be released under typical conditions, which do not involve potential for major ice-jam formation in the PAD area.
The feasibility of this approach was tested in the spring of 1996 [5]. Pre-breakup indicators such as winter precipitation and flow in the Smoky River were favourable, while ice thickness was about average. Following the passage of the breakup front past Fort Vermilion, a release of an extra 500 m3/s at the Peace Canyon dam was implemented between 25 April and 3 May. This operation resulted in a 6% increase in flow when it reached the lower Peace near the PAD and partly overlapped with the duration of a major ice jam that was already causing widespread flooding. Via numerical hydrodynamic and ice-jam modelling, it was estimated that this flow increase began to be felt in the PAD reach on 1 May, generating a maximum stage increase of 0.27 m on 3 May; the jam released between reconnaissance flights on May 3 and 4. Hydrodynamic modelling was later applied [16] to study the propagation and effects of spring flow releases, not only near the delta but also at populated sites between the dam and the delta, such as the town of Peace River (TPR) and Fort Vermilion (Figure 1). The smaller communities of Fox Lake and Garden River are located at ~ kms 940 and 990 in Figure 1, respectively. There are also several homes at Peace Point, which may or may not be occupied during the spring breakup of any one year.
It is not known at present whether the additional flow might be enough to bring about dislodgment of the jam and thence reduce the duration of flooding. In the case of the 1996 event, the jam released at about the estimated time when the full effect of the flow enhancement would have reached the delta. Consequently, one cannot preclude the possibility that it contributed to the jam release. In general, it can be expected that the chance of jam dislodgment will increase with the magnitude of the release relative to the unenhanced flow in the PAD reach. However, it is not possible at present to quantify such eventualities. More can be learned in the future via thorough monitoring, modelling, and analysis of ice conditions in the PAD area, following implementation of spring flow releases.
2.2. Ice Cover Formation in the Regulated Peace River
There is very little information on how freezeup, winter ice growth, and breakup unfolded in the Peace River prior to regulation. Since the construction of the W.A.C. Bennett dam (1968) and completion of the reservoir-filling process (1971), systematic observational programs were initiated by BC Hydro and Alberta Environment to address concerns regarding potential ice-jam flooding and associated hazards. Initially, the scope of observations only extended not far beyond the TPR; over time, this scope increased to include the entire length of Peace River, with participation of additional agencies.
Regulated freezeup flows and associated freezeup levels are generally enhanced over natural values [12,13]. Observed post-regulation freezeup processes [11,17,18,19] indicate that ice-cover initiation (“lodgment”) locations can vary from year to year. Typically, a large hanging dam forms near Vermilion Chutes (Figure 1), on occasion completely submerging them. Thick freezeup jams occasionally form by collapse and consolidation (“shoving”) of initial surface juxtapositions of ice floes, raising associated water surface elevations. The thickness of the solid-ice layer on top of a consolidation cover may be greater than in reaches where there has been no shoving because the freezing front descends into a porous medium that contains a sizeable portion of frazil ice and ice blocks [20,21].
The occurrence of shoving is primarily controlled by air temperature, flow magnitude, and water surface slope [22]. Other factors being equal, large flows, large river slopes, and moderate winter temperatures promote shoving. Consolidations tend to be relatively rare downstream of Manning (~km 500 in Figure 1) due to the very mild river slopes; between Manning and Taylor (~km 120), where the channel slopes are higher, either a juxtaposed or a consolidated ice cover can form [17]. During the winter, the upstream end of the ice cover (ice front) generally advances in the upstream direction; its farthest upstream location in any one year ranges from ~100 to ~400 km downstream of the Bennett dam (per minima of the various curves in Figure 2).
2.3. Ice Cover Breakup in the Regulated Peace River
With the approach of spring, the ice front begins to recede in thermal fashion, responding to the increasing temperature of the open water reach between the front and the dam. Local conditions typically involve low or moderate flow, increased solar radiation, and positive air temperatures. Once the front goes past the TPR, the breakup may continue to advance by thermal attrition, or it may revert to mechanical and even dynamic mode.
In the purely thermal case, the rate of advance of the breakup front can be calculated as follows [23]:
in which TW = temperature of the water just upstream of the edge of the ice cover; Q = river discharge arriving at the ice edge; Cp = specific heat of water (4220 J/kg °C at 0 °C); η = thickness of the ice cover (m); ρ = density of water (1000 kg/m3); ρi = density of freshwater ice (916 kg/m3); LF = latent heat of fusion (3.34 × 10⁵ J/kg); and Wm = width of that portion of the ice cover that is subjected to melt. Equation (1) applies to sheet ice covers but can easily be adjusted for consolidated ones, using the thickness and the porosity of the submerged ice accumulation. For a large river like the Peace, Wm will be very nearly equal to the channel width at the prevailing water level. The water temperature TW will generally increase over time as a result of the increasing length of the upstream open-water reach, increased solar radiation, and generally warming weather. In turn, thermally advancing fronts are expected to accelerate over time, consistent with the concave shapes of the post-minimum portions of the curves shown in Figure 2.
Equation (1) indicates that flow and water temperature are the factors that drive the thermal front, while ice cover thickness and width are resisting factors. For typical Peace River values of 600 m and 0.8 m for Wm and η, Cmelt varies with Tw and Q as shown in Figure 3. The indicated temperature range of the x-axis envelops typical measured values of 2 and 3 °C along the study reach of Peace River (M. Jasek, pers. comm. October 2023). In this range, the calculated rates of advance range from ~10 to ~40 km/day, being comparable to rates exhibited by most of the curves in Figure 2. Of course, Cmelt will initially be much smaller than these values because TW will be only slightly above 0 °C.
While the front is advancing at thermal pace, the ice cover in the last ~100 km of Peace River decays thermally and minimal, if any, jamming occurs (e.g., 2019 and 2023 breakups). This is primarily caused by the low local river slope (~0.05 m/km; [11]): the tractive forces that are applied on the ice cover by the gradually increasing, runoff-generated flow, are not enough to mechanically dislodge the winter ice cover, except for improbable combinations of extreme flow and low freezeup level [24].
A change to mechanical and even dynamic breakup conditions is occasionally facilitated by the arrival of sharp waves generated by ice-jam releases (also termed “javes”) and accompanying ice runs from the Smoky River, a major tributary that joins the Peace just upstream of the TPR [25,26,27,28]. A sizeable ice jam may then form in Peace River, often near Sunny Valley (~ km 490 in Figure 1); upon release of this jam, the resulting jave dislodges, mobilizes, and breaks the ice cover for a certain distance before the ensuing ice run is arrested, forming a new jam (javes amplify the tractive forces that are applied on the ice cover by the flow [29,30]). The process then repeats and can eventually deliver large volumes of ice rubble to the PAD reach of Peace River, where resulting major jams can generate ecologically beneficial overbank flooding. A good example of this type of breakup is the 2014 event (Figure 2), which advanced much faster than it did in most other years and eventually produced the last known IJF as of the time of writing (November 2023).
In the present context, an IJF is an event that causes extensive overland flooding and corresponds to a “magnitude-3 breakup flood” [31] or a “large ice-jam flood” [32]. Dynamic breakups can advance at rates of hundreds of km/day. On occasion, javes may fail to dislodge a particularly resistant ice cover segment but resume their ice-breaking action farther downstream; this may then result in simultaneous presence of more than one ice jam along the river. There can be variations to this general pattern, as evidenced by the unusual 2022 breakup, which is described in Section 7.
Figure 4 shows the lower reach of Peace River and the upper reach of the Slave River, where major ice jams are known to occur. In the PAD reach (begins at ~Sweetgrass Landing), common ice-jam lodgment sites (“toes”) include the upstream end of Moose Island, the sharp bend at Rocky Point, the mouth of Peace River (MOP), and a pronounced constriction located ~10 km into the Slave River; released upstream ice jams often re-form at this site, which is known locally as “(intersection with the) 30th baseline”. Farther upstream, jams very often form near the sharp bend at Boyer Rapids and, infrequently, at sharp bends between Peace Point and Moose Island.
3. Driving and Resisting Factors of Dynamic Breakup Advance
As noted in the preceding section, thermal breakup is driven by flow magnitude and water temperature and resisted by ice cover thickness and channel width. The situation is more complex for mechanical/dynamic breakup events, which are of primary interest herein because they have potential to generate IJFs. In this case, the ice cover is first lifted and detached from the channel boundaries, then dislodged and mobilized by the jave; the advancing breakup front is followed by large channel-wide ice sheets that quickly break down into ice slabs and blocks by ice-to-ice and ice-to-channel boundary collisions. This sequence has been termed a “sheet ice front” (SIF) and observed in sizeable rivers [27,33], in which the ice cover is floating on the water surface (different breakup modes may occur in small, steep streams that form discontinuous ice covers, which may be partly or fully grounded). SIFs have also been observed by the writer and repeatedly captured in 1 min time lapse imagery on the lower Peace and Athabasca Rivers (Beltaos, Russell, and Carter, unpublished data 2014–2022). The SIF process was included in a recent (2021) application of the River1d model [30].
Driven by the jave, the breaking front advances faster than the ice sheets behind it because rising-limb jave celerities typically exceed water speeds [33]. The progressive mobilization of the ice cover releases water from active storage, reinforcing the jave and potentially forming a “self-sustaining wave” that does not attenuate or decelerate as it propagates downstream. This effect was first identified in [34] and later studied in [35,36].
Where the jave cannot dislodge highly resistant ice cover, the moving ice sheets collide with the stationary ice cover edge, leading to formation of a rubble front. Rubble fronts may advance slowly by incorporating newly formed rubble [33] but usually come to a halt, becoming the toes of new jams. Once a new jam forms, the dynamic effects of the jave upstream of the toe dissipate, and the flow returns to values associated with the runoff-generated hydrograph (“carrier” flow). Downstream of the toe, the jave keeps advancing and typically attenuates and slows down under the stationary ice cover; if ice breaking resumes, however, attenuation may be suppressed by the release of active storage.
With this background, it was noted [37] that the primary driver of dynamic breakup is the tractive stress ϖi that is applied on the ice cover:
in which ρ = density of water; g = gravitational acceleration; Sw = water surface slope; η = sheet ice thickness at the time when breakup is initiated at a particular location, generally less than the end-of-winter thickness, owing to pre-breakup melt; si = specific gravity of ice; and p and ηp = porosity and thickness of any slush accumulation that may be present under the sheet ice cover. Ccalculation of Sw and τi (and thence ϖi) is relatively simple under mildly unsteady flow conditions that do not involve javes. Their amplified values during the passage of javes cannot be computed without application of a numerical hydrodynamic model, as was done in [30]. Other factors being equal, the larger the carrier flow under an ice jam, the greater will be the water level increase upstream of its toe; and thence, the greater the height and driving force of the subsequent jave. Historical flows reported by the Water Survey of Canada (WSC) at various hydrometric gauges (https://wateroffice.ec.gc.ca/, accessed on 9 November 2023) represent daily mean values, which can be influenced by the passage of a jave but largely quantify carrier flows.
In addition to anthropogenic factors (e.g., bridge piers), the resistance of the ice cover to dislodgment and mobilization comprises both geomorphic factors (bends, islands, constrictions) and ice cover characteristics (thickness, strength, width). Ice thickness attains a maximum towards the end of the winter; with the approach of mild weather and even before air temperatures exceed the freezing point, ice thinning begins and is, to some extent, predictable [38,39]. Ice strength decline during the pre-breakup period is far more complex, as it involves melting at crystal boundaries by absorbed solar radiation once the ice cover has attained an isothermal state at 0 °C [23]. Though the key processes causing ice strength reduction are understood, its prediction in practical applications remains intractable because some of the relevant controlling factors are difficult to predict or measure (e.g., changing albedo of the snow cover, changing crystal structure of ice cover, light extinction coefficient of the ablating ice cover). Direct measurement of ice strength during this time is also problematic because the decaying ice cover becomes increasingly unsafe for access.
The width of the ice cover affects the “clearance” that is available between the channel banks to permit ice cover movement at a given water level. This clearance is the difference between the channel width at the prevailing water level and the width of the ice cover; increasing clearance facilitates the mobilization of the ice cover and vice versa. The prevailing water level is related to river discharge, a driving factor. Conversely, the width of the ice cover is a resisting factor. This width can be indexed by the freezeup level (HF), which has been defined as the maximum 7-day running average water surface elevation during fall and early winter. It follows that HF is also a resisting factor, consistent with extensive empirical findings on various rivers [40]. For Peace River, the significance of HF has been disputed via logistic regression [41] and reinforced via updated logistic analysis [42]. Historical Peace River data indicate that IJFs are more likely to occur in years with low or moderate freezeup levels [13,43].
4. Flow Release Considerations—Importance of Breakup Front Celerity
Figure 2 shows that the downstream advance of the ice front is well underway by the end of March. At that time, a preliminary assessment of IJF potential can be made in terms of November–March snowfall accumulation at Grande Prairie (Figure 4, lower panel), the site of an index climate station for snowmelt runoff in the key Smoky River sub-basin of the Peace [12]. A similar index is the average snow water equivalent (SWE) over the Smoky River basin on 1 April, which is determined by Alberta Environment and Protected Areas (AEPA). In both instances, no IJFs have occurred when the respective index is less than a specific value; however, exceedance of this value does not guarantee IJF occurrence.
The progression of the breakup front is initially monitored by AEPA and BC Hydro staff, at least as far downstream as the Vermilion Chutes (Figure 1); once the front approaches the delta, observations are also carried out by Parks Canada, Indigenous agencies, and ECCC (Environment and Climate Change Canada). If early developments in April are encouraging (sizeable flow at the TPR and dynamic breakup near Sunny Valley), a release may be considered once it is ascertained that it will not negatively affect riverside communities. Ideally, the timing/duration of the release should be such that the extra flow will arrive in the PAD reach when the hoped-for jam is in place. Unlike the travel time of the released flow to the PAD (~7+ days [12]), the travel time of the breakup front is unknown. Historical data indicate that travel times can vary widely from year to year. For example, known values of the time required for the front to advance from ~Sunny Valley to ~the mouth of Peace River range from 3 to 32 days. Knowledge of the average breakup celerity, CB, can help predict the time of the front’s arrival at the MOP. It can also furnish a clue as to the likelihood of the hoped-for IJF actually occurring, because IJFs are likely to be associated with large CBs [37,42]. In the following sections, available observational and ancillary data are used to calculate breakup celerities and interpret their variability from year to year.
5. Data Sources
5.1. Ice Front Advance Data
The primary sources of observational data pertaining to the advance of breakup fronts along the Peace and into the Slave River are reports produced by AEPA, BC Hydro, Parks Canada, and ECCC. These reports provide detailed information on the progression of the breakup front and associated jamming events based on aerial reconnaissance, satellite imagery, and local resident accounts [24,25,26,27,28,44,45,46,47]. In addition, archived ice observation reports prepared by AEPA staff during each ice season can be viewed at https://rivers.alberta.ca/ (accessed on 9 November 2023), starting with the 2006–2007 season. In all, breakup progression data that extend to near, or beyond, the MOP have been garnered for the following years: 1996, 1997, 2003, 2004, 2007, and 2014 to 2022.
5.2. Snowpack and Ice Thickness Data
The previously mentioned Grande Prairie meteorological station (Climate ID: 3072921) records total snow (cm), total rain (mm), and total precipitation (mm). Fall–winter precipitation maps and snow course data are produced and updated frequently by AEPA (https://rivers.alberta.ca/, accessed on 9 November 2023).
Under the recently initiated Community Based Monitoring (CBM) program, the thickness of the winter ice cover is measured at numerous locations along the delta reach of Peace River and the first ~10 km of the Slave River [48]. Farther upstream, sporadic thickness information can be gleaned from occasional winter flow measurements by WSC near flow-reporting hydrometric gauges, such as at Fort Vermilion and Peace Point. A proxy for the end-of-winter ice thickness, a resistance factor, is the “coldness of the winter”, which is expressed by the accumulated degree-days of frost (DDF). Records of meteorological stations at Fort Vermilion and Fort Chipewyan (Figure 4, lower panel) were used in [41] to compute DDF. Plots of ice thickness data versus DDF indicate large scatter [42], a common feature of such plots, primarily owing to snow cover effects [39].
5.3. Flow Data
There are many hydrometric gauges that report flow along the regulated Peace River and its tributaries. Of particular interest to the present study are the gauges located at the TPR, Fort Vermilion and Peace Point (Table 1). The Smoky River gauge at Watino essentially captures the flow that enters Peace River some 70 km farther downstream (Figure 1) and provides valuable information on conditions that may lead to a dynamic Peace River breakup. Table 1 summarizes salient features of these gauges.
6. Results
The instantaneous rate of advance of the breakup front can vary widely during any breakup event. Thermal advance starts out very slowly because the temperature of the water upstream of the front is not much above 0 °C. It subsequently accelerates to tens of km/day (Figure 3), owing to the lengthening of the open upstream reach, the increased solar radiation, the rising flow, and the warming weather. Even more extreme variability in the rate of progression of the front occurs during events that become dynamic at some point along their way to the PAD. While the ice cover is being dislodged by a jave, the rate of advance can amount to hundreds of km/day because it is similar to the celerity of the jave’s leading edge, potentially exceeding 5 m/s (or 430 km/day) on large rivers like the Peace [24,29]. The front’s advance rate decreases to, and remains at, zero when an ice jam forms and remains in place.
The front celerity (CB), as defined herein, is an overall average rate calculated for the ~750 km stretch of river between ~Sunny Valley and ~MOP (km 1243). For dynamic events, CB depends on both the intensity of the javes and the frequency and persistence of various ice jams that may form along the way; it should not be confused with the rate of advance of the front during the ice-breaking action of a single jave. As noted earlier, dynamic breakups typically begin near Sunny Valley, while IJFs are caused by jams lodged at the MOP or at the 30th baseline (km 1252). In years when the passage of the front by either one of these sites was not observed, the closest observed locations were used. From all available observational data, CB values have been calculated for different years and are summarized in Table 2. The quantity Qmax represents the highest daily mean flow reported by WSC for the Peace Point gauge before the onset of open-water conditions. This variable will not be known at the time when a flow release may be contemplated but is of interest for post-event assessments.
For thermal events, such as those of 2004, 2015–2017, 2019, and 2021, CB typically ranges between 20 and 30 km/day. On certain occasions, thermal events are not sequential throughout the reach of interest. The ice cover in the general vicinity of Peace Point may linger on, even while the river is open upstream and downstream. In such instances, CB may be undefined or exceed 30 km/day because thermal decay is occurring simultaneously upstream and downstream of this ice cover segment. Thermal events are of little interest in the context of strategic flow releases because they can easily be recognized as unpromising candidates for an IJF. Data for the 2023 breakup have not yet been processed, but it is known to have been a thermal event.
More interesting, are events that become dynamic at some time during the advance of the ice front, typically near Sunny Valley. These are accompanied by sizeable river flows, which can initially be assessed at the TPR and/or Fort Vermilion gauges (No. 07HA001 and/or 07HF001 in Table 1). Such “promising” events may continue being dynamic until the PAD reach (e.g., 2014) or may become thermal at some point along the way (e.g., 2003 [46]). Examination of all available data, including day-by-day observations of ice front locations, revealed seven breakup events in Table 2 with apparent potential for an IJF by the time when the ice front went past Sunny Valley or past Fort Vermilion: 1996, 1997, 2003, 2007, 2014, 2018, and 2020. Notably, these events correspond to the seven highest Peace Point flows; although these flows will not be known at the decision-making time, this correspondence further corroborates the beneficial effect of the flow magnitude on the chances of IJF occurrence. Table 2 indicates a fivefold variability in the celerity of promising events, translating to travel times of ~3 to ~14 days between ~500 and 1243 km.
Next, one may consider the possibility of reducing this variability by relating CB to hydroclimatic indicators that will be available at the time when an event is identified as promising. Typically, the decision-making time for a release occurs in mid- to late-April; therefore, one can consider driving and resisting factors, or their proxies, that will be known by then. These include: accumulated November to March snowfall at Grande Prairie; average SWE over the Smoky River basin on April 1; end-of-winter ice thickness; DDF at Fort Vermilion or at Fort Chipewyan (located on the northern shore of L. Athabasca near its western end, lower panel of Figure 4); and freezeup level at the Peace Point gauge, for which there is an adequate historical record (1959 and later). Table 3 summarizes these parameters for promising breakups, along with corresponding celerities.
The following five figures illustrate how each antecedent variable may influence the breakup celerity CB. In what follows, the focus is on promising years, but data from thermal (unpromising) events are included for completeness. Figure 5 and Figure 6 display the expected positive correlations between the plotted variables, given that both winter precipitation indices are considered driving factors for the breakup. There is considerable scatter in both graphs, signifying that other factors are also at work in controlling the value of CB. In Figure 5, the 1996 data point appears to be “anomalous” in that the least snow accumulation among promising events is associated with the largest CB. Flow records for the Wabasca River (WSC gauge No. 07JD002), a sizeable tributary that joins the Peace between Fort Vermilion and Vermilion Chutes, indicate unremarkable spring flow contributions, which might have otherwise helped explain the “anomaly”.
Large scatter is also evident in Figure 7, in which it is difficult to even discern whether ice thickness, considered a resisting factor, has a positive or negative effect on CB. On the other hand, Figure 8 suggests a positive effect of the coldness of the winter (DDF), evaluated at Fort Chipewyan; though not shown herein, there is a good correlation between Fort Vermilion and Fort Chipewyan DDFs, indicating that a cold winter in the middle portion of the study reach is usually also a cold winter in the lower portion. The trend of the data points in Figure 8 is contrary to expectation, given that DDF is considered a resisting factor. However, it has been determined [41] that colder winters tend to bring more snow in that part of Alberta, so the positive trend could merely reflect the positive influence of snowfall, a driving factor.
Figure 9 exhibits the least scatter and accords with the expected trend since HF is considered a resisting factor. This finding also aligns with results presented in [37], which showed a similar trend in the average speed of the breakup front between ~Sunny Valley and ~Vermilion Chutes for notable recent events.
The graphs of Figure 5, Figure 6, and Figure 8 suggest that promising-year CB can generally be predicted to within a factor of two, in terms of winter precipitation and coldness of the winter. The freezeup level appears to provide even better prediction potential (Figure 9). In addition to the segment between Sunny Valley and MOP, one can calculate celerities for shorter segments, such as Fort Vermilion to MOP or Vermilion Chutes to MOP. This was done for the latter segment, and the results are similar to those described in Figure 5, Figure 6, Figure 7, Figure 8 and Figure 9.
7. Discussion
The preceding results provide a basis for anticipating the time when an ice jam may form near the MOP in years when the early breakup progression shows potential for an IJF. At the same time, decision makers need to be aware that, in addition to antecedent conditions, CB also depends on weather conditions that prevail during the advance of the ice front. The temporal gradient of the carrier flow during the front’s advance is also a factor: when the front is at the toe of a jam, its release will be facilitated by an increasing carrier flow; if the carrier flow is decreasing, the release will be delayed until thermal effects can sufficiently degrade the ice cover that holds the jam in place. The effects of such factors are not predictable at present and introduce a random dimension to the progression of breakup. For this reason, it is best to work with the longest reach for which there are data on promising events, i.e., ~Sunny Valley to ~MOP. Caution: use of the average celerity to estimate front arrival times at intermediate sites can only provide crude answers because the celerity varies with time and distance travelled. Continued monitoring of the progression of breakup in future years, increasingly facilitated by satellite applications, can help to enhance understanding of the entire process.
An important feature of Table 3 is that not all promising events culminate in IJFs, which seem to be associated with the higher CB values. Conversely, the no-flood events are associated with the lower CBs. This delineation aligns with physical understanding: other factors being equal, high celerities allow little time for ice cover deterioration in the PAD area or for melting of incoming ice rubble, ensuring that there is good jamming potential.
Figure 9 empirically suggests that the freezeup level is a resisting factor in the case of promising breakups, independently of any physical mechanisms that may be postulated to explain its effect. According to the boundary constraint criterion for the onset of a breakup [40], which has been tested at several sites along Canadian rivers, including the Peace [30], the effects of ice thickness and freezeup level can be combined into a single variable, the resistance component Rtf, which is defined as follows [37]:
in which ηo = end-of-winter ice thickness; WR = channel width at a user-selected elevation, HR, which exceeds all known HF values; and Wi = width of the ice cover = channel width at elevation HF minus side strips created by near-bank hinge cracks (assuming that the river is not so narrow as to form a single, mid-channel crack [40]). It has been shown [37] that Rtf is primarily controlled by HF and secondarily by ice thickness, as illustrated in Figure 10: the known range of HFs involves a large variation of Rtf, while thickness variability accounts for the relatively small scatter associated with any one value of HF. This feature is consistent with the clear effect of HF on CB in Figure 9, as well as with the ambiguous influence of ice thickness in Figure 7.
The persistence of jamming near the MOP is also an important factor influencing the planned duration and effectiveness of any release from the Peace Canyon dam (Site-C dam in the future). The limited relevant information (Table 2) indicates that jams that caused IJFs in the past ~30 years lasted for 7 to 8 days. For the extreme 1974 IJF, it has been reported that the inundation of the delta lasted for 10 to 14 days [6]; the duration of the 1974 jam may have been longer because jams often become shorter over time and flooding may cease before the jam releases. Lesser jams, such as those of 2007, 2020, and 2022 were less persistent. Ideally, the duration of flow increase should be such that the enhanced flow at the PAD lasts for as long as the jam is in place, taking into account the expected arrival times of the breakup front and of the released flow from the Peace Canyon dam (or from the Site-C dam in the future). The travel time of spring floods between Hudson Hope and Peace Point (Figure 4) has been estimated as 7 days [12]; it may be slightly greater for the segment Peace Canyon dam to MOP and about the same for the segment Site-C dam to MOP.
The flow increase may or may not enhance the value of CB in “promising” years, depending on whether the extra flow can overtake the front before the latter arrives at the MOP. As the front will have a head start of at least a few days, the effect of the extra flow on CB, if any, will only be “felt” over the lower part of the reach from Sunny Valley to MOP. Moreover, the total flow issuing from the Peace Canyon dam is subject to the operational limit of the turbines (~2000 m3/s; or ~2500 m3/s for Site-C; [49]). The extra flow release can only be a fraction of this figure, e.g., in the ballpark of 1000 m3/s. This amount is small relative to unenhanced, lower Peace River flows associated with promising events (Table 2), which exceed 5000 m3/s. Consequently, the effect of the release on CB is expected to be small and within the scatter ranges of Figure 5, Figure 6, Figure 7, Figure 8 and Figure 9.
The front of the highly unusual breakup of 2022 was observed near Sunny Valley on 6 April and advanced thermally until 4 May, when it was at ~km 975 and preceded by a 12 km jam. Farther downstream, the ice cover was visibly deteriorated. The 4 May jam released on 5 May, causing a jave that easily dislodged the remaining Peace River ice cover, forming a new jam at the 30th baseline. This jam lasted for 4 days and attained a length of ~21 km but did not raise upstream water levels to the height of the riverbanks. The large rate of breakup advance on 5 May is consistent with the celerity of the jave and with the deteriorated state of the dislodged ice cover. The formation of the 4 May jam likely resulted from a large increase in carrier flow from tributaries downstream of Fort Vermilion, as is suggested by provisional WSC discharge data at Fort Vermilion and Peace Point; however, vetted hydrometric data are not yet available to confirm the magnitude of this flow increase.
A question of practical significance pertains to the role of the Smoky River in triggering the transition from thermal to dynamic breakup downstream of the TPR. Among the seven promising events analyzed herein (Table 3), there is observational evidence suggesting that this was the case in 2014, 2018, and 2020, but not in 2007. There is not sufficient information to decide one way or the other for the remaining three events of Table 3 (1996, 1997, and 2003). Under regulated conditions, IJFs also occurred in 1972 and 1974 [31]. The Smoky River did play a role in the 1974 breakup [50], while there is no relevant information for 1972. It appears that, if not altogether necessary, Smoky River “assistance” is very often instrumental in triggering dynamic breakup of the regulated Peace River. Caution: this statement may or may not apply to the pre-regulation period because of different winter flows, freezeup levels, and ice cover conditions (Section 2.2).
8. Summary and Conclusions
The effectiveness of strategic flow releases from hydropower facilities to enhance ice-jam flooding of the Peace Delta depends in part on a capability to anticipate the time when the breakup front is likely to arrive at or near the mouth of the regulated Peace River. In turn, such capability is linked to knowledge of the average celerity, CB, of the front between Sunny Valley (or other fixed location) and the river mouth. Observational data suggest that CB can vary by an order of magnitude from year to year. This variability is reduced to 5-fold if low-celerity thermal events are excluded, and attention is confined to those breakups that would be deemed to have ice-jam flood potential at an early stage of their evolution. Uncertainty is further reduced to 2-fold or less by considering how CB correlates with each of several antecedent hydroclimatic factors like snowpack runoff potential, coldness of the winter, ice thickness, and freezeup level, which yields the least scatter. These empirical findings generally align with physical understanding of breakup driving and resisting factors. Not all “promising” events culminate in ice-jam floods, which are associated with the highest celerities. Known durations of four major ice jams near the mouth of Peace River amounted to 7 days or more.
Funding
This research received no external funding.
Data Availability Statement
Acknowledgments
This study was conducted as part of Environment and Climate Change Canada’s contribution to the Wood Buffalo National Park World Heritage Site Action Plan. The writer thanks M. Jasek of BC Hydro for making available observational and hydroclimatic data that were contributed towards the development of a flow release Protocol; Philip Halteman of Compass Resource Management for a compilation of observed ice front locations since 2003 using observational data supplied by BC Hydro or published by Alberta Environment and Protected Areas; and Stefan Emmer and Nadia Kovachis Watson of Alberta Environment and Protected Areas for Smoky basin SWE data, and for pre-2003 unpublished ice front advance data.
Conflicts of Interest
The author declares no conflicts of interest.
References
- WBNP. Development of a Multi-Jurisdiction Action Plan to Protect the World Heritage Values of Wood Buffalo National Park; WBNP: Fort Smith, NT, Canada, 2019; ISBN R64-546/2019E-PDF. Available online: https://publications.gc.ca/site/eng/9.866972/publication.html (accessed on 19 January 2024).
- Peace-Athabasca Delta Project Group. The Peace-Athabasca Delta, A Canadian Resource; Summary Report; Governments of Saskatchewan: Saskatoon, SK, Canada, 1972; 144p. [Google Scholar]
- Peace-Athabasca Delta Project Group. Peace-Athabasca Delta Project; Technical Report; Governments of Saskatchewan: Saskatoon, SK, Canada, 1973; 176p. [Google Scholar]
- Prowse, T.D.; Aitken, B.; Demuth, M.N.; Peterson, M. Strategies for restoring spring flooding to a drying northern delta. Regul. Rivers: Res. Manag. 1996, 12, 237–250. [Google Scholar] [CrossRef]
- Prowse, T.D.; Peters, D.; Beltaos, S.; Pietroniro, A.; Romolo, L.; Toyra, J.; Leconte, R. Restoring ice-jam floodwater to a drying delta ecosystem. Water Int. 2002, 27, 58–69. [Google Scholar] [CrossRef]
- Peters, D.L. Controls on the Persistence of Water in Perched Basins of the Peace-Athabasca Delta, Northern Canada. Ph.D. Thesis, Trent University, Peterborough, ON, Canada, 2003. [Google Scholar]
- Peters, D.L.; Prowse, T.D.; Pietroniro, A.; Leconte, R. Flood Hydrology of the Peace-Athabasca Delta, Northern Canada. Hydrol. Process. 2006, 20, 4073–4096. [Google Scholar] [CrossRef]
- Ward, E.M.; Gorelick, S.M. Drying drives decline in muskrat population in the Peace-Athabasca Delta, Canada. Environ. Res. Lett. 2018, 13, 124026. [Google Scholar] [CrossRef]
- Ward, E.M.; Wysong, K.; Gorelick, S.M. Drying landscape and interannual herbivory-driven habitat degradation control semiaquatic mammal population dynamics. Ecohydrology 2020, 13, e2169. [Google Scholar] [CrossRef]
- Ward, E.M.; Solari, K.A.; Varudkar, A.; Gorelick, S.M.; Hadly, E.A. Muskrats as a bellwether of a drying delta. Nat. Commun. Biol. 2021, 4, 750. [Google Scholar] [CrossRef] [PubMed]
- Jasek, M.; Pryse-Phillips, A. Influence of the proposed site C hydroelectric project on the ice regime of the Peace River. Can. J. Civ. Eng. 2015, 42, 645–655. [Google Scholar] [CrossRef]
- Prowse, T.D.; Conly, F.M. Effects of climatic variability and flow regulation on ice-jam flooding of a northern delta. Hydrol. Process. 1998, 12, 1589–1610. [Google Scholar] [CrossRef]
- Beltaos, S.; Peters, D.L. Naturalizing the freezeup regimes of regulated rivers and exploring implications to spring ice-jam flooding. Hydrol. Process. 2021, 35, e14321. [Google Scholar] [CrossRef]
- UNESCO. Reactive Monitoring Mission (RMM) to Wood Buffalo National Park, Canada. Mission Report March 2017. UNESCO World Heritage Centre—WHC International Union for Conservation of Nature (IUCN). 2017. Available online: http://whc.unesco.org/en/documents/156893 (accessed on 25 July 2023).
- Independent Environmental Consultants (IEC). Strategic Environmental Assessment of Potential Cumulative Impacts of All Developments on the World Heritage Values of Wood Buffalo National Park; Volume 1: Final SEA Report; Independent Environmental Consultants: Markham, ON, Canada, 2018; 247p. [Google Scholar]
- Rokaya, P.; Wheater, H.; Lindenschmidt, K.-E. Promoting sustainable ice-jam flood management along the Peace River and Peace-Athabasca Delta. J. Water Resour. Plan. Manag. 2018, 145, 04018085. [Google Scholar] [CrossRef]
- Andres, D.; Van der Vinne, G.; Johnson, W.; Fonstad, G. Ice consolidation on the Peace River: Release patterns and downstream surge characteristics. In Proceedings of the (CD-ROM) 12th Workshop on the Hydraulics of Ice Covered Rivers, Edmonton, AB, Canada, 19–20 June 2003. CGU-HS CRIPE. [Google Scholar]
- Andres, D.; Jasek, M.; Fonstad, G. Field and theoretical study of the Toe Region of a consolidated ice cover. In Proceedings of the 13th Workshop on the Hydraulics of Ice Covered Rivers, Hanover, NH, USA, 15–16 September 2005. [Google Scholar]
- Emmer, S.; Nafziger, J.; Kovachis Watson, N.; Trevor, B. Freeze-up on the lower Peace River 2015–2017: Processes, anomalies, and implications for breakup. In Proceedings of the CGU HS Committee on River Ice Processes and the Environment 20th Workshop on the Hydraulics of Ice Covered Rivers, Ottawa, ON, Canada, 14–16 May 2019. [Google Scholar]
- Calkins, D.J. Accelerated Ice Growth in Rivers; USACE CRREL Report 79–14; US Army Corps of Engineers: Hanover, NH, USA, 1979; 4p. [Google Scholar]
- Wazney, L.; Clark, S.P.; Malenchak, J. Laboratory investigation of the consolidation resistance of a rubble river ice cover with a thermally grown solid crust. Cold Reg. Sci. Technol. 2019, 157, 86–96. [Google Scholar] [CrossRef]
- Andres, D. The effects of freezing on the stability of a juxtaposed ice cover. In Proceedings of the 10th Workshop on River Ice, CGU-HS CRIPE, Winnipeg, MB, Canada, 8–11 June 1999; pp. 209–222. [Google Scholar]
- Hicks, F.; Cui, W.; Ashton, G. Heat transfer and ice cover decay. In River Ice Breakup; Beltaos, S., Ed.; Water Resources Publications: Highlands Ranch, CO, USA, 2008; Chapter 4; pp. 67–123. [Google Scholar]
- Beltaos, S. The role of waves in ice-jam flooding of the Peace-Athabasca Delta. Hydrol. Process. 2007, 21, 2548–2559. [Google Scholar] [CrossRef]
- Emmer, S.; Kovachis Watson, N.; Nafziger, J. A Tale of Two Basins: The 2020 river ice breakup in northern Alberta, Part II: The Peace River. In Proceedings of the CGU HS Committee on River Ice Processes and the Environment 21st Workshop on the Hydraulics of Ice Covered Rivers, Saskatoon, SK, Canada and Online, 29 August–1 September 2021. [Google Scholar]
- Jasek, M. Peace River 2014 Break-up Sequence that led to the Ice Jam Flooding of the Peace-Athabasca Delta. In Proceedings of the CGU HS Committee on River Ice Processes and the Environment 19th Workshop on the Hydraulics of Ice Covered Rivers, Whitehorse, YT, Canada, 9–12 July 2017. 34p. [Google Scholar]
- Jasek, M. An emerging picture of Peace River break-up types that influence ice jam flooding of the Peace-Athabasca Delta part 1: The 2018 Peace River break-up. In Proceedings of the 20th Workshop on the Hydraulics of Ice Covered Rivers, Ottawa, ON, Canada, 14–16 May 2019. 31p. [Google Scholar]
- Jasek, M. An emerging picture of Peace River break-up types that influence ice jam flooding of the Peace-Athabasca Delta part 2: Insights from the comparison of the 2014 and 2018 break-ups. In Proceedings of the 20th Workshop on the Hydraulics of Ice Covered Rivers, Ottawa, ON, Canada, 14–16 May 2019. 24p. [Google Scholar]
- Beltaos, S. Hydrodynamic characteristics and effects of river waves caused by ice jam releases. Cold Reg. Sci. Technol. 2013, 85, 42–55. [Google Scholar] [CrossRef]
- Ye, Y.; She, Y. A systematic evaluation of criteria for river ice breakup initiation using River1D model and field data. Cold Reg. Sci. Technol. 2021, 189, 103316. [Google Scholar] [CrossRef]
- Peterson, M. Peace–Athabasca Flood History Study. In Peace–Athabasca Delta Technical Studies, Task F.1—Flood History; Peace–Athabasca Delta Technical Studies, Communications: Fort Chipewyan, AB, Canada, 1995; 32p. [Google Scholar]
- Timoney, K.P. Three centuries of change in the Peace–Athabasca Delta, Canada. Clim. Chang. 2009, 93, 485–515. [Google Scholar] [CrossRef]
- Jasek, M.; Beltaos, S. Chapter 8. Ice-jam release: Javes, ice runs and breaking fronts. In River Ice Breakup; Water Resources Publications: Highlands Ranch, CO, USA, 2008; pp. 247–303. [Google Scholar]
- Ferrick, M.G.; Mulherin, N.D. Framework for control of dynamic ice breakup by river regulation. J. Regul. Rivers Res. Manag. 1989, 3, 79–92. [Google Scholar] [CrossRef]
- Jasek, M.; Ashton, G.; Shen, H.T.; Chen, F. Numerical Modeling of Storage Release during Dynamic River Ice Break-up. In Proceedings of the (CD-ROM) 13th Workshop on the Hydraulics of Ice Covered Rivers, Hanover, NH, USA, 15–16 September 2005; CGU-HS Committee on River Ice Processes and the Environment: Edmonton, AB, Canada, 2005; pp. 421–439. [Google Scholar]
- Beltaos, S. Hydrodynamics of storage release during river ice breakup. Cold Reg. Sci. Technol. 2017, 139, 36–50. [Google Scholar] [CrossRef]
- Beltaos, S. Resistance of river ice covers to mobilization and implications for breakup progression in Peace River, Canada. Hydrol. Process. 2023, 37, e14850. [Google Scholar] [CrossRef]
- Bilello, M.A. Maximum Thickness and Subsequent Decay of Lake, River and Fast Sea Ice in Canada and Alaska; Report 80–86; U.S. Army, Cold Regions Research and Engineering Laboratory: Hanover, NH, USA, 1980; 160p. [Google Scholar]
- Ashton, G.D. River and lake ice thickening, thinning, and snow ice formation. Cold Reg. Sci. Technol. 2011, 68, 3–19. [Google Scholar] [CrossRef]
- Beltaos, S. Chapter 6: Onset of breakup. In River Ice Breakup; Beltaos, S., Ed.; Water Resources Publications: Highlands Ranch, CO, USA, 2008; pp. 167–206. [Google Scholar]
- Lamontagne, J.R.; Jasek, M.; Smith, J.D. Coupling physical understanding and statistical modeling to estimate ice jam flood frequency in the northern Peace-Athabasca Delta under climate change. Cold Reg. Sci. Technol. 2021, 192, 103383. [Google Scholar] [CrossRef]
- Beltaos, S. Using Logistic Regression to Identify the Key Hydrologic Controls of Ice-Jam Flooding near the Peace–Athabasca Delta: Assessment of Uncertainty and Linkage with Physical Process Understanding. Water 2023, 15, 3825. [Google Scholar] [CrossRef]
- Beltaos, S.; Carter, T. Minor 2020 ice jamming in lower Peace River despite extreme breakup flows: Assessment of hydroclimatic controls. In Proceedings of the CGU HS Committee on River Ice Processes and the Environment 21st Workshop on the Hydraulics of Ice Covered Rivers, Saskatoon, SK, Canada, 29 August–1 September 2021. [Google Scholar]
- Giroux, S. 1996 Peace–Athabasca Delta Flood Report; Wood Buffalo National Park: Fort Chipewyan, AB, Canada, 1997; 30p. [Google Scholar]
- Giroux, S. 1997 Peace–Athabasca Delta Flood Report; Wood Buffalo National Park: Fort Chipewyan, AB, Canada, 1997; 31p. [Google Scholar]
- Beltaos, S.; Carter, T. Field studies of ice breakup and jamming in lower Peace River, Canada. Cold Reg. Sci. Technol. 2009, 56, 102–114. [Google Scholar] [CrossRef]
- Straka, J.; Gray, Q. WBNP Flood Monitoring Report: Flood Extent, May 2014; Parks Canada: Fort Smith, NWT, Canada, 2014; 17p. [Google Scholar]
- Maclean, B.; Bampfylde, C.; Lepine, M.; Tssessaze, L. Towards a Rights-Based Ice Monitoring Trigger. In Proceedings of the CGU HS Committee on River Ice Processes and the Environment 21st Workshop on the Hydraulics of Ice Covered Rivers Saskatoon, Saskatoon, SK, Canada, 29 August–1 September 2021; Available online: https://cripe.ca/publications/proceedings/workshop-21 (accessed on 19 January 2024).
- Nistor, C.; Martin, V. Site C hydroelectric project: Predicted changes in Peace River morphology and sediment transport. In Proceedings of the 85th Annual Meeting of International Commission on Large Dams, Prague, Czech Republic, 3–7 July 2017. 11p. [Google Scholar]
- Gerard, R. Preliminary Observations of Spring Ice Jams in Alberta. In Proceedings of the Third International Symposium on Ice Problems, Hanover, NH, USA, 18–21 August 1975; Frankenstein, G.E., Ed.; IAHR: Vienna, Austria, 1975; pp. 261–277. [Google Scholar]
Figure 1.
Plan view of Peace River and Peace–Athabasca Delta (showing only the northern portion of the Athabasca River). River distance from the W.A.C. Bennett Dam is marked at 100 km intervals. The Slave River begins at the MOP and flows in a generally northward direction. From [11], with changes.
Figure 1.
Plan view of Peace River and Peace–Athabasca Delta (showing only the northern portion of the Athabasca River). River distance from the W.A.C. Bennett Dam is marked at 100 km intervals. The Slave River begins at the MOP and flows in a generally northward direction. From [11], with changes.

Figure 2.
Observed locations of Peace River ice front downstream of Bennett Dam. From Alberta Environment archived material, 1973–2014, with changes. https://rivers.alberta.ca/apps/Basins/data/figures/river/abrivers/RFSPubArchive/RiverIce/pubs/2013-2014_Peace_River_Ice_Obs_Rpr_No46.pdf (accessed on 4 October 2023).

Figure 3.
Thermal advance of the breakup front as a function of flow and upstream water temperature (Equation (1)) for a 600 m wide rectangular channel, assuming 0.8 m thick sheet ice cover.
Figure 3.
Thermal advance of the breakup front as a function of flow and upstream water temperature (Equation (1)) for a 600 m wide rectangular channel, assuming 0.8 m thick sheet ice cover.

Figure 4.
Plan view of lower Peace River and Peace–Athabasca Delta (upper panel) and Peace–Athabasca–Slave River basin (lower panel).
Figure 4.
Plan view of lower Peace River and Peace–Athabasca Delta (upper panel) and Peace–Athabasca–Slave River basin (lower panel).
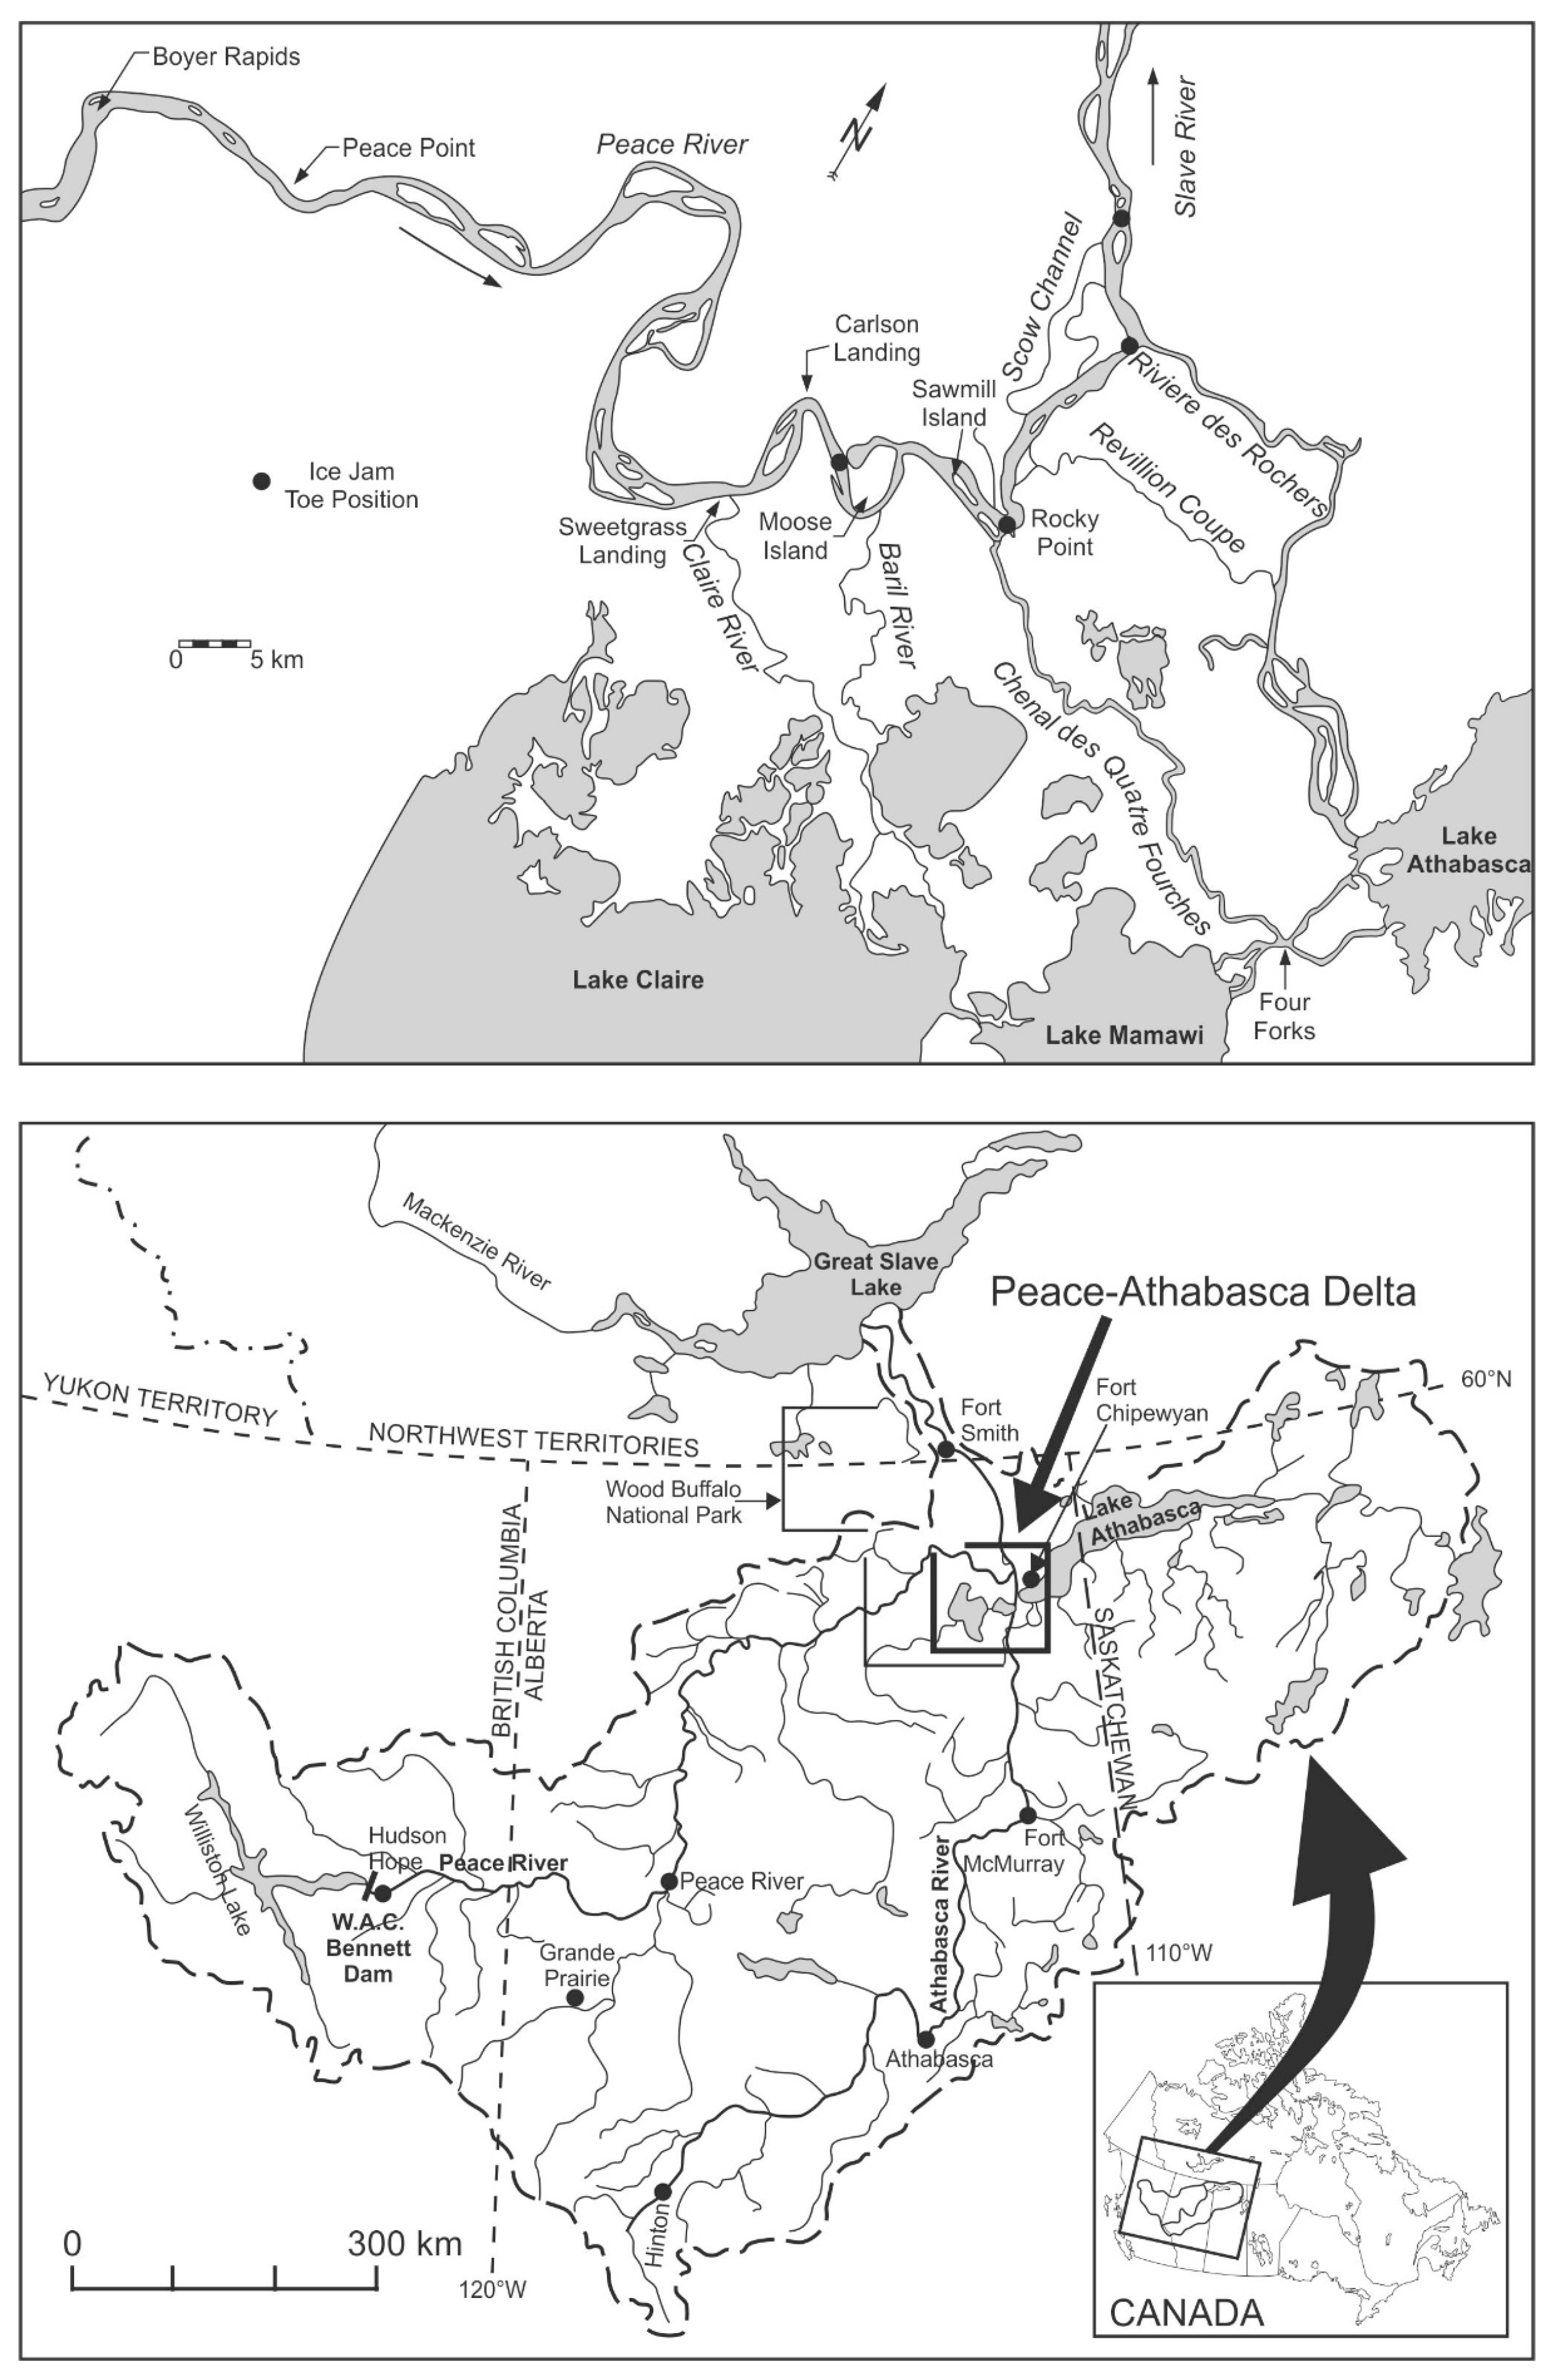
Figure 5.
Celerities of promising and unpromising events plotted versus April 1 average snow water equivalent over the Smoky River basin. Data source: Alberta Environment and Protected Areas.
Figure 5.
Celerities of promising and unpromising events plotted versus April 1 average snow water equivalent over the Smoky River basin. Data source: Alberta Environment and Protected Areas.

Figure 6.
Celerities of promising and unpromising events plotted versus November–March accumulated snowfall at Grande Prairie, expressed as water equivalent.
Figure 6.
Celerities of promising and unpromising events plotted versus November–March accumulated snowfall at Grande Prairie, expressed as water equivalent.

Figure 7.
Celerities of promising and unpromising events plotted versus ice cover thickness at Peace Point.
Figure 7.
Celerities of promising and unpromising events plotted versus ice cover thickness at Peace Point.

Figure 8.
Celerities of promising and unpromising events plotted versus cumulative degree-days of frost at Fort Chipewyan.
Figure 8.
Celerities of promising and unpromising events plotted versus cumulative degree-days of frost at Fort Chipewyan.

Figure 9.
Celerities of promising and unpromising events plotted versus freezeup level at Peace Point. In 2020, the freezeup level may have been as high as 215.5 m, moving the plotted point “eastward”.
Figure 9.
Celerities of promising and unpromising events plotted versus freezeup level at Peace Point. In 2020, the freezeup level may have been as high as 215.5 m, moving the plotted point “eastward”.

Figure 10.
Variation of the resistance component Rtf with the freezeup level for the vicinity of the Peace Point hydrometric gauge, 1962 to 2020 data. For Peace Point, the highest known HF is ~215.9 m; HR is taken as 216.0 m.
Figure 10.
Variation of the resistance component Rtf with the freezeup level for the vicinity of the Peace Point hydrometric gauge, 1962 to 2020 data. For Peace Point, the highest known HF is ~215.9 m; HR is taken as 216.0 m.


Table 1.
Flow reporting hydrometric stations used in present study; all operated by WSC.
| Station Name | Gauge Number and Period of Record | Gross Drainage Area (km2) |
|---|---|---|
| Peace R. at Peace River (TPR) | 07H001 1915–2023 (with gaps) | 194,000 |
| Smoky R. at Watino | 07GJ002 1915–2023 (with gaps) | 50,300 |
| Peace River at Fort Vermilion | 07HF001 1915–2023 (with gaps) | 227,000 |
| Peace R. at Peace Point | 07KC001 1959–2023 | 293,000 |
Table 2.
Calculated ice front celerity and ancillary information. Shading denotes IJF years.
| Year | CB ~Sunny Valley to ~MOP (km/day) | River Segment (km) | Dates | Jam Near MOP? | Qmax at Peace Point (m3/s) | Notes |
|---|---|---|---|---|---|---|
| 1996 | 240.3 | 497–1243 | 23 April–26 April | Yes | 5800 | Jam lasted for ~8 days |
| 1997 | 121.9 | 512–1243 | 22 April–28 April | Yes | 9160 | Jam lasted for ~7 days |
| 2003 | 47.6 | 494–1124 | 19 April–2 May | No | 5770 | No front observations beyond km 1124 |
| 2004 | 25.3 | 489–1121 | 10 April–5 May | No | 3880 | No front observations beyond km 1121 |
| 2007 | 114.6 | 440–1252 | 23 April–30 April | Yes | 6950 | Jam lasted for ~5 days |
| 2014 | 158.8 | 502–1243 | 26 April–1 May | Yes | 6450 | Jam lasted for ~8 days |
| 2015 | 37.3 (approx.) | 505–1250 | 9 April–29 April | No | 3620 | Time of front arrival at km 1250 is approximate |
| 2016 | 23.5 | 499–1250 | 31 March–2 May | No | 2270 | |
| 2017 | 27.9 (approx.) | 501–1286 | 10 April–8 May | No | 2730 | Time of front arrival at km 1250 is approximate |
| 2018 | 92.0 | 510–1325 (1) | 25 April–4 May | No | 5530 (2) | A jam formed in the Slave River ~80 km from the PAD |
| 2019 | Undefined | NA | NA | No | 2500 | Melt out conditions; multiple simultaneous fronts |
| 2020 | 55.4 | 491–1252 | 21 April–5 May | Yes | 8600 | Jam lasted for ~1.5 days |
| 2021 | 28.3 | 491–1340 | 9 April–9 May | No | 4360 | |
| 2022 | 25.2 (3) | 501–1252 | 6 April–6 May | Yes | >5000? | Jam lasted for ~4 days; vetted flows not yet available |
(1) Ice cover in PAD reach disintegrated before the arrival of upstream ice rubble; jam eventually formed in the Slave River, ~80 km from the PAD. (2) Flow may have been higher. (3) Mostly thermal advance but very rapid in last ~270 km of Peace River (see details in Section 7).
Table 3.
Antecedent conditions and celerities of promising breakup events. Shading denotes IJF years.
Table 3.
Antecedent conditions and celerities of promising breakup events. Shading denotes IJF years.
| Year | November to March Snowfall at Grande Prairie (mm) (1) | Smoky R. Basin SWE on 1 April (mm) | End-of-Winter Ice Thickness at Peace Point (m) | DDF at Fort Chipewyan (°C-days) | HF at Peace Point, (m, CGVD28) | CB ~Sunny Valley to ~MOP (km/day) |
|---|---|---|---|---|---|---|
| 1996 | 171.6 | 83.2 | 0.87 | 3116 | 212.38 | 240.3 |
| 1997 | 147.8 | 117.4 | 0.85 | 2905 | 214.22 | 121.9 |
| 2003 | 113.5 | 117.8 | 1.23 | 2720 | 215.22 | 47.6 |
| 2007 | 131.5 | 166.2 | 0.86 | 2569 | 213.62 | 114.6 |
| 2014 | 185.0 | 131.1 | 0.92 | 3290 | 213.64 | 158.8 |
| 2018 | 177.6 | 133.5 | 0.81 | 2807 | 214.71 | 92.0 |
| 2020 | 104.1 | 102.4 | 0.75 | 2648 | 214.9 to 215.5 | 55.4 |
(1) Snowfall is calculated as total precipitation minus total rain and is expressed in mm.
Disclaimer/Publisher’s Note: The statements, opinions and data contained in all publications are solely those of the individual author(s) and contributor(s) and not of MDPI and/or the editor(s). MDPI and/or the editor(s) disclaim responsibility for any injury to people or property resulting from any ideas, methods, instructions or products referred to in the content. |
© 2024 by the author. Licensee MDPI, Basel, Switzerland. This article is an open access article distributed under the terms and conditions of the Creative Commons Attribution (CC BY) license (https://creativecommons.org/licenses/by/4.0/).
Share and Cite
MDPI and ACS Style
Beltaos, S. Celerity of Ice Breakup Front in the Regulated Peace River, Canada, and Implications for the Recharge of the Peace–Athabasca Delta. Environments 2024, 11, 28. https://doi.org/10.3390/environments11020028
AMA Style
Beltaos S. Celerity of Ice Breakup Front in the Regulated Peace River, Canada, and Implications for the Recharge of the Peace–Athabasca Delta. Environments. 2024; 11(2):28. https://doi.org/10.3390/environments11020028
Chicago/Turabian StyleBeltaos, Spyros. 2024. "Celerity of Ice Breakup Front in the Regulated Peace River, Canada, and Implications for the Recharge of the Peace–Athabasca Delta" Environments 11, no. 2: 28. https://doi.org/10.3390/environments11020028
Note that from the first issue of 2016, this journal uses article numbers instead of page numbers. See further details here.