
Effect of Bark Biochars on Properties of Steam-Activated Carbons


1
Forest Research Centre, Terra Associated Laboratory, School of Agriculture, University of Lisbon, Tapada da Ajuda, 1349-017 Lisbon, Portugal
2
VALORIZA—Research Center for Endogenous Resource Valorization, Politechnic Institute of Portalegre, Campus Politécnico 10, 7300-555 Portalegre, Portugal
3
CeFEMA, Higher Technical Institute, University of Lisbon, Avenida Rovisco Pais, 1049-001 Lisbon, Portugal
4
Mechanical Engineering and Resource Sustainability Center, Department of Chemistry, Faculty of Sciences and Technology, NOVA University of Lisbon, Campus de Caparica, 2829-516 Caparica, Portugal
*
Author to whom correspondence should be addressed.
Environments 2024, 11(1), 2; https://doi.org/10.3390/environments11010002
Submission received: 18 August 2023
/
Revised: 15 December 2023
/
Accepted: 18 December 2023
/
Published: 20 December 2023
Abstract
:Bark is a heterogeneous solid material comprising mainly of phloem and cork fractions. These fractions differ in chemical composition and anatomical structure, and value-added activated carbons produced from these fractions have different surface properties. Low-temperature pyrolysis was shown to be a promising method for producing activated carbon precursors from bark fractions at higher yields than conventional slow pyrolysis. Here, we produced mesoporous activated carbons (ACs) from cork and phloem fractions of Quercus cerris bark by low-temperature pyrolysis followed by steam activation at 900 °C. The results showed steam-activation of biochars from Q. cerris bark fractions yielded ACs with acceptable surface properties. The ACs contained 9.9% and 23.3% ash content, and specific surface areas of 201 m2 g−1 and 512 m2 g−1 for cork and phloem fractions, respectively. Calcium was the principal inorganic component of ACs, followed by potassium, silicon, and iron. Surface functional groups of bark fractions and biochars were lost during steam activation, as evidenced by FT-IR spectroscopy. The burnout temperatures of cork and phloem ACs were 726 °C and 736 °C, respectively. The ACs showed a high methylene blue and methyl orange adsorption capacity, with the removal of 80% and 90% of methylene blue and 58% and 68% of methyl orange after 48 h for cork and phloem ACs, respectively.
1. Introduction
Fossil fuels such as coal, crude oil, and natural gas were major material and energy resources in the last century, processed by an array of chemical unit operations designated as refineries. However, in recent years, this trend has started to change because of the environmental and economic consequences of using fossil fuels such as depletion of resources, environmental pollution, and global warming [1]. Alternative renewable fuels, circular economy, and biorefineries have become important topics with the goal of producing renewable and environmentally-friendly fuels and materials while reducing or eliminating waste [2,3,4,5].
Tree barks are among the important forestry byproducts with an estimated global production of over 400 million cubic meters annually [6]. Except for certain species such as cork oak, birch, wattle, etc. that have a valued utilization for their barks, tree barks are usually treated as a waste stream and used mainly for fuel in domestic heating. However, barks are interesting solid materials with a rich chemical composition including polysaccharides, lignin, and suberin, and they have high extractives and inorganic content [7]. Thus, barks may be screened for relevant properties and converted via a cascade biorefinery process to produce value-added products [8].
Among the value-added biomass biorefinery products are activated carbons (ACs) which are carbon-based materials with well-developed internal pore structures [9,10]. ACs are currently being used in a number of applications such as adsorbents in water, purification, and air filtration, catalyst supports, or high-performance electrode materials [11]. These applications require a high specific surface area, and the specific surface area of ACs is reported to range between 250 and 2400 m2 g−1 [12]. Commercial ACs are currently prepared from coal, wood, or coconut shells [13,14], with highly variable specific surface areas usually ranging between 600 and 1500 m2 g−1 [13,15] and used principally for water purification [9].
Quercus cerris (Turkey oak) bark is a potential raw material for a biorefinery because it contains a substantial amount of cork (27% of the bark) that may be fractionated and used similarly to Quercus suber cork, while the phloem-containing cork and phloem may be converted into value-added products and chemicals such as composites, adsorbents, triterpenoids, and polyphenols [16,17,18,19]. The production of ACs is another possible conversion route for Q. cerris bark valorization in a biorefinery scheme since our previous results showed ACs with acceptable instant methylene blue adsorption properties (similar to those of commercial activated carbon) could be produced from low-temperature biochars of waste cork and phloem fractions of Q. cerris bark by using a single-step steam activation [20]. The promising results of that study suggest the activation process may be optimized either by using different chemical activation agents since enhanced specific surface areas are usually obtained with lignocellulosic biomass by chemical activation [21] or by modifying the precursor (biochar) preparation [22]. High-temperature torrefaction or low-temperature pyrolysis at temperatures around 300 °C seem to be feasible methods for producing biochar precursors to obtain activated carbons with acceptable surface properties while keeping the biochar yield relatively high (60–70% for Q. cerris phloem and cork, respectively) [20] when compared to traditional carbonization at approximately 500 °C which results in lower biochar yields (approximately 35% for Q. cerris phloem) [15,23,24]. The biochar yield is an important parameter in the process economy of activated carbon production particularly when using physical activation. In fact, for the same biochar, the activated carbon yield is lower with physical activation than with chemical activation because of the applied higher temperatures which lead to greater degradation of ACs [21].
It is expected cork and phloem biochars result in ACs with different properties because of the natural variability of the precursor regarding chemical composition and structure in agreement with other carbonaceous materials [25]. Cork is a porous solid material with high suberin content, while phloem is an amorphous material with high polysaccharide and ash content. Thus, they have a different chemical composition from that of wood with their notable suberin (cork) and ash (phloem) contents and with their lower polysaccharide content (cork and phloem). Our previous results revealed waste Q. cerris phloem had a promising potential for producing biochar precursors for the production of activated carbons by moderate-temperature carbonizations at 400–600 °C followed by a steam activation by which specific surface areas between 262 m2 g−1 and 318 m2 g−1 were obtained [24]. The potential of waste cork fraction of Q. cerris bark in the production of ACs is currently not known. This study is set up to fill this knowledge gap because the knowledge of the properties of activated carbons of waste cork and phloem biochars is crucial for the valorization of these materials in value-added applications such as hydrogen storage [26], CO2 capture [26], high-temperature catalyst supports [27], and removal of heavy metals from wastewaters [28], as well as for the optimization of the activation process by biochar production, or by application of a chemical activation.
To optimize the activation process, the first step is to perform a thorough characterization of the produced activated carbons. This study also aims to provide a basis for tailoring the properties of waste cork and phloem ACs for selected applications. ACs were produced via a steam-activation process of low-temperature (200–350 °C) slow pyrolysis biochars of Q. cerris cork and phloem, and characterized by scanning electron microscopy (SEM), nitrogen porosimetry, X-ray fluorescence analysis, infra-red spectroscopy, thermogravimetric analysis, as well as methylene blue and methyl orange adsorption.
2. Materials and Methods
2.1. Materials
Bark samples of Quercus cerris trees were collected in the south of Turkey, near Hatay city. The samples were reduced into 5–8 mm particles by mechanical grinding and shipped to Portugal to perform a pilot-scale separation and fractionation of cork and phloem tissues aiming at separating a good-grade cork fraction [16]. The pilot-scale operation also yielded waste cork and phloem fractions that were used to produce low-temperature biochars at temperatures between 200 °C and 350 °C (which included torrefaction and low-temperature pyrolysis temperature zones) in glass reactors under oxygen-limited conditions. The detailed biochar production process can be consulted in our previous article [20].
2.2. Production of Activated Carbons
Steam activation of low-temperature cork and phloem biochar mixtures was carried out under oxygen-limited (no additional oxygen was introduced during the high-temperature activation) conditions at 900 °C and 7-min reaction time on previously ground and 1 h water-soaked cork and phloem biochars (mass ratio 1:2 (w/w) for biochar and deionized water, respectively). During the activation process, the biochars were sealed in ceramic crucibles which allowed devolatilization but prevented oxidation. These conditions were selected for their simplicity, rapidness, and industrial production suitability [20].
2.3. Scanning Electron Microscopy (SEM)
Surface properties of activated carbons are among the most important parameters for their application. The surface properties of the precursors and the activated carbons were analyzed to observe the effects of high-temperature activation. Thus, scanning electron microscopy (SEM) analyses were performed on cork, phloem, cork biochar, phloem biochar, cork-activated carbon, and phloem-activated carbon samples using a Hitachi S2400 electron microscope under an accelerating voltage of 20.0 kV.
2.4. Nitrogen Physisorption
The physical adsorption of nitrogen is the most-used method for the characterization of surface area and porosity of solid materials, in particular of activated carbons (ACs). The surface area and porosity of the cork and phloem ACs indicate the validity of the activation process and allow comparison to surface properties of different ACs. The nitrogen physical adsorption analysis of the cork and phloem ACs was performed in a Micromeritics porosimeter (ASAP 2010, Norcross, GA, USA) at 77 °K, after pre-treatment at 150 °C for at least 12 h. The surface area of activated phloem was determined using the BET model (Brunauer-Emmett-Teller). BJH (Barrett-Joyner-Halenda) model was used for determining pore size distribution.
2.5. X-ray Fluorescence Analysis (XRF)
The mineral composition of ACs contributes to their thermochemical reactivity and adsorption properties. Therefore, the mineral composition of the ACs is important to evaluate their use in adsorption and thermochemical reactions. The mineral composition in the ash fraction of cork, phloem, cork biochar, phloem biochar, cork-activated carbon, and phloem-activated carbon was determined through an X-ray fluorescence analyzer (Niton XL 3t, Thermofisher Scientific, Waltham, MA, USA). All the XRF tests were conducted in triplicate, and the results presented as average values.
2.6. Fourier Transform Infrared Spectroscopy (FT-IR)
Another factor that determines the thermochemical reactivity and adsorption properties of ACs is the surface functional groups. The surface functional groups of precursors and the ACs were determined via Fourier transform infrared spectroscopy (FT-IR). Cork, phloem, cork biochar, phloem biochar, cork-activated carbon, and phloem-activated carbon samples (particles under 180 μm) were oven-dried at 105 °C during 1 h before experiments. The samples were placed on the diamond (ATR-FTIR) and the reflectance spectra were acquired with a Perkin Elmer Spectrum Two mid-infrared FT-IR spectrometer (Rodgau, Germany) in the range of 4000–400 cm−1 with a spectral resolution of 8 cm−1 and an average of 32 scans.
2.7. Thermogravimetric Analysis (TGA)
The thermal degradation of ACs is an important parameter for high-temperature applications. The thermal degradation of ACs was evaluated in the most severe (oxidizing) conditions. The combustion experiments of the cork and phloem ACs were performed using a thermogravimetric analyzer with a differential scanning calorimetry sensor, alumina pans, and an airflow rate of 48 mL min−1. Approximately 5 mg of activated carbon samples were used with the following linear heating program: isothermal at 40 °C for 5 min; a linear heating step till 800 °C with a heating rate of 10 °C min−1, and a final cooling step of 50 °C min−1. For comparison, a commercial activated carbon (Panreac, CAS Number: 7440-44-0) was also analyzed under the same conditions. The burnout temperature of ACs was calculated at 99% conversion [29]. The ash content of ACs was considered as the residual mass.
2.8. Methylene Blue and Methyl Orange Adsorption
The adsorption properties are the most important properties of ACs because they are primarily used for adsorption purposes for the removal of a high number of pollutants including dyes, heavy metals, and organic pollutants. The adsorption properties of cork and phloem ACs were evaluated by using adsorption tests with cationic and anionic, methylene blue (MB) and methyl orange (MO) dyes, respectively between instant (5 min), 24 h, and 48 h, time intervals. Approximately, 25 mg of activated carbon sample was placed in a test tube, and 5 mL of an MB or MO aqueous solution was added. The tube was shaken for 3 s (Heidolph REAX top shaker, Heidolph Instruments GmbH & Co. KG, Schwabach, Germany) and the mixture was centrifuged at 5000× g rpm for 5 min (Hettich EBA 20, Andreas Hettich GmbH & Co.KG, Tuttlingen, Germany) before the adsorption tests after the adsorption time interval. The MB or MO concentration in the solution was determined using UV–vis spectrophotometry (Novaspec II, Pharmacia LKB Biotechnology, Uppsala, Sweden) at 664 nm or at 463 nm for MB and MO, respectively.
2.9. Statistical Analysis
A paired t-test was performed at 0.05 level to determine if there was a significant difference between the adsorption properties (instant, 24 h, and 48 h methylene blue and methyl orange adsorption) of cork and phloem-activated carbons.
3. Results and Discussion
3.1. Surface Structure
The surface of bark fractions, biochars, and ACs were analyzed to understand the effect of temperature and steam in the activation process [14]. The surface morphology of the cork fraction in Q. cerris bark, as exemplified in Figure 1a, shows a typical cork structure in a tangential section [30]. Low-temperature pyrolysis does not alter the cork structure, as shown in Figure 1b exemplifying a non-tangential section, but the cork cell wall thickness is slightly reduced and pyrolysis products are deposited on the inner cell walls. The activation of the cork biochar clearly impacts the cellular structure, as shown in Figure 1c: the cork cells expand substantially, the cell walls straighten and becomes thinner, and mesopores are formed in the cork cell walls by occasional wall rupture. This effect of high temperature steaming of cork has been similarly reported for the production of expanded cork [31,32].
The phloem has a cellular structure with different types of cells, as exemplified in Figure 2a, with cells larger than those in cork and higher solid proportion. Phloem biochar retained its cellular structure, but the cell wall material was disorganized and built up a heterogeneous mass of fragments, as exemplified in Figure 2b. Pores were also formed in the phloem-activated carbon (Figure 2c).
Q. cerris phloem contains a high amount of inorganic material, predominantly calcium oxalate crystals that appear within cells [16]. These crystals largely remain in the biochar and in the activated carbon and can be observed in the phloem-activated carbon, as shown in Figure 3. The presence of a substantial inorganic fraction in the phloem possibly prevents the achievement of greater surface areas during steam activation compared to chemical activation [13], as it is discussed in the following sections.
3.2. Specific Surface Area of Activated Carbons
The performance of an activated carbon largely depends on its specific surface area and porosity characteristics. The nitrogen adsorption and desorption isotherms of cork and phloem-activated carbons are represented in Figure 4a,b, showing type IV isotherms, according to the IUPAC classification, which are found in mesoporous sorbents such as ACs [11,33]. Phloem ACs have much higher adsorption capacity than cork-activated carbon. It is likely higher lignin (and therefore carbon) content and lower porosity of phloem and phloem biochars are the major factors for this difference [25,34].
The surface properties of cork and phloem ACs are shown in Table 1. The BET surface area (SBET) of cork-activated carbon (201 m2 g−1) was near the lower range of ACs while the surface area of phloem-activated carbon (512 m2 g−1) was in the range of commercial ACs. The total pore volume was higher in phloem AC than in cork AC. The average pore diameter was in the range of mesoporous adsorbents in both ACs (2.0 nm vs. 2.2 nm, for cork and phloem ACs, respectively). This pore structure implies both cork and phloem ACs are suitable for water purification [33,35], hydrogen storage, and CO2 capture [26].
Comparing biochar activation processes and the achieved surface areas is crucial in improving and tuning the activated carbon properties of Quercus cerris bark biochars. Therefore, the results of the current study were compared with previous reports that applied similar biomass types under different activation conditions (Table 2). Chemical activation results in a larger specific surface area compared to physical activation in the different bark fractions, with the KOH activation method seemingly producing the highest surface areas in bark-based ACs.
Pine and cork oak bark ACs had the highest specific surface areas which may principally be ascribed to their low ash content (3.5% and 1%, respectively) [38,47] as well as to the differences in their chemical (cellulose, hemicelluloses, and lignin) and structural (textural) composition [48,49]. The high ash-containing barks result in lower surface areas via steam activation, possibly because inorganic compounds block the pore entrances [50]. On the other hand, a chemical activation involving a basic leaching step may create a larger specific surface area than in steam activation by removing inorganic compounds during the activation and acid-washing steps [26], in a similar way to rice husk ACs with 14.3% ash content [51]. The chemical and structural compositions of the activated carbon precursors determine the available carbon content and accessibility of the activation agent. High-lignin-containing and porous precursors such as pine and oak barks seem to produce larger specific surface areas [38,40] (Table 2). The results of cork and phloem activation are thus encouraging and suggest the process may be further improved by applying a chemical activation.
3.3. Inorganic Elemental Composition
The results of the inorganic analysis of cork, phloem, biochars, and ACs are shown in Figure 5. Both cork and phloem are rich sources of calcium, which is enriched in the ACs. In cork, potassium content increased in biochar and activated carbon while silicon content was reduced. In phloem, potassium and manganese contents increased, while iron and silicon contents remained the same or slightly increased (Figure 5). All the tested materials also contained, in smaller amounts, trace elements such as titanium, scandium, and strontium (Table 3).
The elemental analysis results indicated cork and biochars had similar inorganic compositions. Calcium, potassium, and silicon were present in both cork and phloem biochars in similar ratios, but phloem contained them in a higher amount. Phloem biochars additionally contained iron and manganese. The mineral content and composition of biochars may contribute to the steam activation of biochars by catalytic action, leading to a higher specific surface area and the development of porous structures. Thus, the higher specific surface areas of phloem ACs compared to cork ACs may be linked with their higher ash content and ash composition.
3.4. Surface Functional Groups
The surface functional groups of cork, phloem, biochars, and ACs as observed by FTIR spectroscopy are shown in Figure 6a,b. Cork and phloem exhibited distinct IR absorption bands in relation to their different chemical composition. The peak at 3300 cm−1 is assigned to stretching of the O-H group due to moisture content and decreases after pyrolysis. The bands at 2919 cm−1 and 2851 cm−1 assigned to the C-H stretching of suberin, and the peak at 1735 cm−1, to the C=O stretching of suberin, were more prominent in cork than in phloem due to its elevated suberin content. The decreased intensity of these peaks in biochars indicates a degradation in the suberin content of cork. The peaks at 1613 cm−1, 1314 cm−1, 780 cm−1, and 511 cm−1 are assigned to C-O stretching and C-O bending of calcium oxalate minerals [52]. The intensity of these peaks increased after pyrolysis with the enrichment of ash content. The peak at 1033 cm−1, assigned to C-O stretching and C-O bending in polysaccharides of cork and phloem, significantly decreased after pyrolysis, indicating degradation of their polysaccharide fraction. The peaks at 1159 cm−1 and at 1259 cm−1, assigned to C-O stretching of lignin, also reduced significantly after biochar production.
Interestingly, the IR spectrum of cork and phloem ACs did not show apparent peaks like those of untreated biomass and biochars (Figure 6b), indicating the loss of surface functional groups. This result is in agreement with a previous work of biomass with physical activation [53] and suggests a lower adsorption capacity compared to chemical-activated carbons. The weak signals at 1409 cm−1 and 874 cm−1 in cork and phloem ACs are assigned to C=O and C-O vibrations due to the presence of CaO and CaCO3 minerals [54], which are in agreement with the results of the mineral composition. The minor peaks at 550 cm−1 and 790 cm−1 are assigned to the presence of silica (SiO2) in the samples [11].
3.5. Thermogravimetric Analysis of Activated Carbons
The results of the thermogravimetric analysis of cork and phloem ACs and commercial activated carbon are shown in Figure 7. All analyzed ACs had similar mass loss curves until 450 °C, which is in agreement with previous studies [14,55]. After 450 °C, the ACs had a faster mass loss, which was possibly linked with their oxidation and devolatilization of residual volatile matter [14]. The thermal degradation rate was highest in the commercial-activated carbon, followed by the cork and phloem ACs. The commercial-activated carbon had the lowest ash content (near zero), while cork and phloem ACs had a substantial amount of ash (9.9% and 23.3%, respectively) (Table 4). Such high ash content of cork ACs is comparable to that of ACs produced from waste newspapers [33] and coconut shells [56], while the ash content of phloem-activated carbon is comparable to low-rank coal ACs [57].
The principal thermal degradation interval was between 400 and 650 °C, where ACs lost between approximately 60% and 90% of their mass. This result is similar to the thermal decomposition of rice husk-activated carbon [11]. The mass loss was lower in phloem AC, possibly due to its highest ash content. The burnout temperatures of cork and phloem ACs were significantly higher than those of the commercial-activated carbon, with approximately 100 °C difference (Table 4). This result suggests cork and phloem ACs are particularly suitable for high-temperature applications because of their favorable thermal stability [27]. Thus, they may be used as catalyst supports for hydrogenation reactions [27] or for the production of vinyl chloride via acetylene hydrochlorination [58,59].
3.6. Methylene Blue and Methyl Orange Adsorption
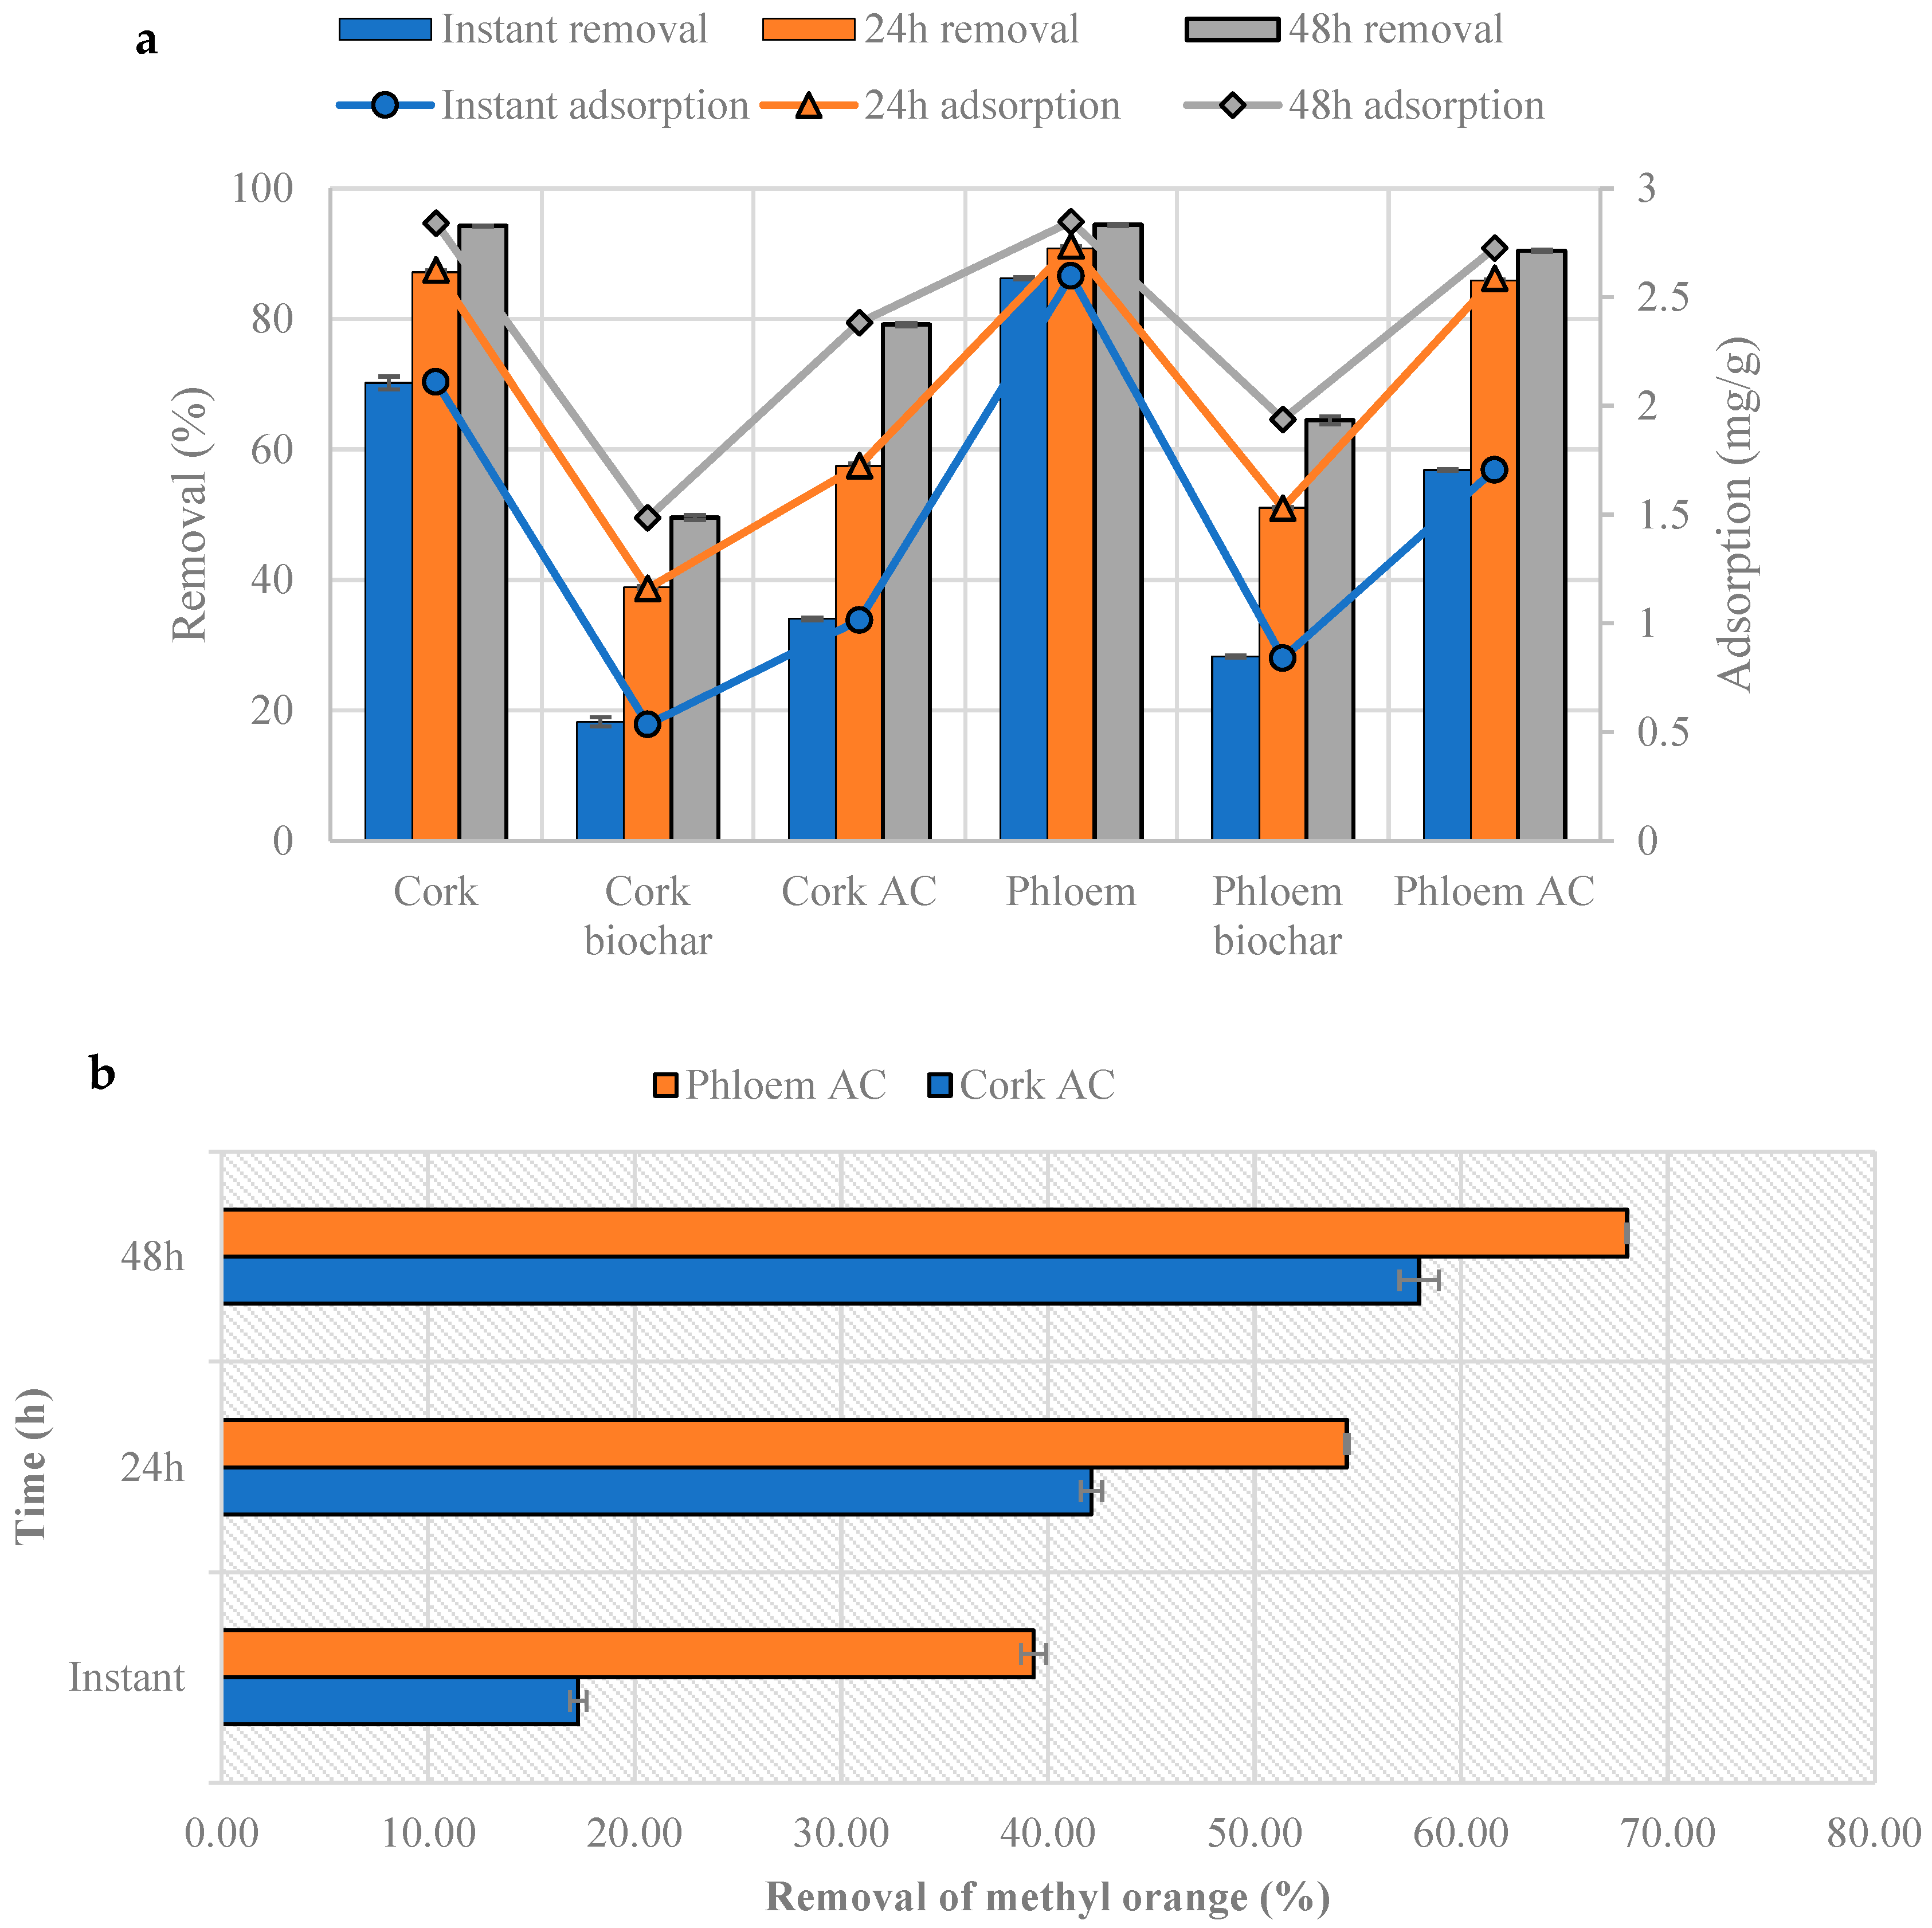
The results of methylene blue adsorption are shown in Figure 8a. Untreated cork and phloem showed the highest adsorption of methylene blue (94% after 48 h) and biochars showed the lowest adsorption (50–65% after 48 h). This result is related to the surface properties of the adsorbents and the mechanism of the methylene blue adsorption. Previous studies indicated methylene blue adsorption occured predominantly as chemisorption [60] and electrostatic attractions, hydrogen bonding, and π-π stacking interactions taking place during the adsorption [57]. Thus, acidic surface groups of cork and phloem favor the adsorption of methylene blue. These groups were possibly destroyed during biochar production, and therefore, methylene blue adsorption was lower in biochars. However, the methylene blue adsorption in ACs was higher than in biochars, implying intra-particle diffusion was the rate-limiting step in methylene blue adsorption [61]. Thus, under prolonged time conditions, methylene blue adsorption by ACs reached a higher value (80–90%). This result was in agreement with our previous findings with phloem-activated carbon [24]. In the second stage, phloem ACs adsorb a higher amount of methylene blue than cork ACs due to their bigger specific surface area.
Methyl orange adsorption, on the other hand, showed a different trend. Cork, phloem, cork biochar, and phloem biochar did not adsorb methyl orange even after 48 h. This result is possibly related to the acidic character of methyl orange dye. On the contrary, ACs adsorbed methyl orange (Figure 8b). As expected, phloem ACs adsorbed a greater amount of methyl orange due to their larger specific surface area. This result also suggests the adsorption of methyl orange occurs as chemisorption and intra-particle diffusion is the rate limiting step [62].
Both adsorption tests suggest cork and phloem ACs may be used as powdered activated carbon (PAC) adsorbents for the adsorption of different materials with variable acidic or basic character. However, the adsorption process seems to be slow for dyes, and possibly a week of adsorption time is necessary for complete removal of these materials from aqueous solutions. The larger surface area of phloem AC is possibly responsible for its higher dye adsorption properties compared to cork AC. Interestingly, the high ash content of cork and particularly of phloem AC may be advantageous in adsorption. Calcium and iron were reported to improve adsorption of ionic compounds [14]. Removal of heavy metals such as arsenic from aqueous solutions seems to be a promising option for cork and phloem ACs since arsenic sorption was shown to be enhanced by high-ash-containing and iron-rich ACs [28,63]. The contribution of the surface chemical groups in ACs is limited as they are largely lost during thermal activation. However, porous structures develop in activated carbons, and the adsorption occurs mainly through pore diffusion, which is a slower process than surface reaction.
3.7. Statistical Analysis
The paired t-test results of adsorption tests indicate cork and phloem-activated carbons are significantly different (Table 5) with p value smaller than 0.05 and absolute value of t stat bigger than t critical value. This result confirms the effect of the precursor on the properties of activated carbons. The overall results imply phloem AC is a better adsorbent than cork AC for the removal of dyes and should therefore be used primarily for adsorption.
4. Conclusions
Waste cork and phloem fractions of Q. cerris bark were converted to high-ash containing activated carbons via low-temperature pyrolysis followed by one-step steam activation at 900 °C. The mesoporous surface properties of cork and phloem ACs are comparable with those of commercial activated carbon. The phloem fraction produced an AC with a larger specific surface area than the cork fraction (512 m2 g−1 and 201 m2 g−1, respectively). Cork and phloem ACs are highly stable at high temperatures. Further research will be undertaken with Q. cerris cork and phloem biochars regarding chemical activation, determination of the catalytic action, and hydrogen storage.
Author Contributions
U.Ş., M.G. and H.P.; methodology, C.N. and M.M.; investigation, U.Ş. and M.G.; resources, U.Ş., C.N. and M.M.; writing—original draft preparation, U.Ş.; writing—review and editing, U.Ş. C.N., M.M., M.G. and H.P.; visualization, H.P.; supervision, H.P. All authors have read and agreed to the published version of the manuscript.
Funding
This work was supported by FCT—Fundação para a Ciência e a Tecnologia within the R and D Units funding to the Mechanical Engineering and Resource Sustainability Center, MEtRICs (UIDP/04077/2020), and the Forest Research Centre, CEF, (UIDB/00239/2020). A.U. Sen acknowledges support from FCT through a research contract (DL 57/2016).
Data Availability Statement
Data are contained within the article.
Acknowledgments
The authors thank Nuno Costa and Carla Rodrigues from LAQV Requimte of NOVA University of Lisbon for Nitrogen porosimetry determinations, Francisco Lemos from Instituto Superior Técnico for thermogravimetric analysis, Isabel Nogueira from Instituto Superior Técnico for scanning electron microscopy analysis and Jose Condeço from Instituto Superior Técnico for FT-IR analysis.
Conflicts of Interest
The authors declare no conflict of interest.
References
- Christensen, C.H.; Rass-Hansen, J.; Marsden, C.C.; Taarning, E.; Egeblad, K. The renewable chemicals industry. ChemSusChem Chem. Sustain. Energy Mater. 2008, 1, 283–289. [Google Scholar] [CrossRef] [PubMed]
- Hassan, S.S.; Williams, G.A.; Jaiswal, A.K. Lignocellulosic biorefineries in Europe: Current state and prospects. Trends Biotechnol. 2019, 37, 231–234. [Google Scholar] [CrossRef] [PubMed]
- Kumar, B.; Verma, P. Biomass-based biorefineries: An important architype towards a circular economy. Fuel 2021, 288, 119622. [Google Scholar] [CrossRef]
- Velvizhi, G.; Balakumar, K.; Shetti, N.P.; Ahmad, E.; Pant, K.K.; Aminabhavi, T.M. Integrated biorefinery processes for conversion of lignocellulosic biomass to value added materials: Paving a path towards circular economy. Bioresour. Technol. 2022, 343, 126151. [Google Scholar] [CrossRef] [PubMed]
- Nobre, C.; Alves, O.; Durão, L.; Şen, A.; Vilarinho, C.; Gonçalves, M. Characterization of hydrochar and process water from the hydrothermal carbonization of Refuse Derived Fuel. Waste Manag. 2021, 120, 303–313. [Google Scholar] [CrossRef] [PubMed]
- Şen, A.U.; Pereira, H. State-of-the-art char production with a focus on bark feedstocks: Processes, design, and applications. Processes 2021, 9, 87. [Google Scholar] [CrossRef]
- Fengel, D.; Wegener, G. Wood: Chemistry, Ultrastructure Reactions; Walter de Gruyter: Berlin, Germany; New York, NY, USA, 1984. [Google Scholar]
- Rasi, S.; Kilpeläinen, P.; Rasa, K.; Korpinen, R.; Raitanen, J.-E.; Vainio, M.; Kitunen, V.; Pulkkinen, H.; Jyske, T. Cascade processing of softwood bark with hot water extraction, pyrolysis and anaerobic digestion. Bioresour. Technol. 2019, 292, 121893. [Google Scholar] [CrossRef]
- Bhatnagar, A.; Hogland, W.; Marques, M.; Sillanpää, M. An overview of the modification methods of activated carbon for its water treatment applications. Chem. Eng. J. 2013, 219, 499–511. [Google Scholar] [CrossRef]
- Bläker, C.; Muthmann, J.; Pasel, C.; Bathen, D. Characterization of activated carbon adsorbents–state of the art and novel approaches. ChemBioEng Rev. 2019, 6, 119–138. [Google Scholar] [CrossRef]
- Le Van, K.; Thi, T.T.L. Activated carbon derived from rice husk by NaOH activation and its application in supercapacitor. Prog. Nat. Sci. Mater. Int. 2014, 24, 191–198. [Google Scholar] [CrossRef]
- Ioannidou, O.; Zabaniotou, A. Agricultural residues as precursors for activated carbon production—A review. Renew. Sustain. Energy Rev. 2007, 11, 1966–2005. [Google Scholar] [CrossRef]
- Schröder, E.; Thomauske, K.; Weber, C.; Hornung, A.; Tumiatti, V. Experiments on the generation of activated carbon from biomass. J. Anal. Appl. Pyrolysis 2007, 79, 106–111. [Google Scholar] [CrossRef]
- Julien, F.; Baudu, M.; Mazet, M. Relationship between chemical and physical surface properties of activated carbon. Water Res. 1998, 32, 3414–3424. [Google Scholar] [CrossRef]
- Nachenius, R.W.; Ronsse, F.; Venderbosch, R.H.; Prins, W. Biomass pyrolysis. In Advances in Chemical Engineering; Elsevier: Amsterdam, The Netherlands, 2013; Volume 42, pp. 75–139. ISBN 0065-2377. [Google Scholar]
- Şen, A.; Leite, C.; Lima, L.; Lopes, P.; Pereira, H. Industrial valorization of Quercus cerris bark: Pilot scale fractionation. Ind. Crops Prod. 2016, 92, 42–49. [Google Scholar] [CrossRef]
- Şen, A.; Miranda, I.; Esteves, B.; Pereira, H. Chemical characterization, bioactive and fuel properties of waste cork and phloem fractions from Quercus cerris L. bark. Ind. Crops Prod. 2020, 157, 112909. [Google Scholar] [CrossRef]
- Pasztory, Z.; Mohácsiné, I.R.; Gorbacheva, G.; Börcsök, Z. The utilization of tree bark. BioResources 2016, 11, 7859–7888. [Google Scholar] [CrossRef]
- Silva, S.P.; Sabino, M.A.; Fernandes, E.M.; Correlo, V.M.; Boesel, L.F.; Reis, R.L. Cork: Properties, capabilities and applications. Int. Mater. Rev. 2005, 50, 345–365. [Google Scholar] [CrossRef]
- Şen, A.U.; Nobre, C.; Durão, L.; Miranda, I.; Pereira, H.; Gonçalves, M. Low-temperature biochars from cork-rich and phloem-rich wastes: Fuel, leaching, and methylene blue adsorption properties. Biomass Convers. Biorefin. 2022, 12, 3899–3909. [Google Scholar] [CrossRef]
- Rafatullah, M.; Ahmad, T.; Ghazali, A.; Sulaiman, O.; Danish, M.; Hashim, R. Oil palm biomass as a precursor of activated carbons: A review. Crit. Rev. Environ. Sci. Technol. 2013, 43, 1117–1161. [Google Scholar] [CrossRef]
- Zhang, S.; Hu, B.; Zhang, L.; Xiong, Y. Effects of torrefaction on yield and quality of pyrolysis char and its application on preparation of activated carbon. J. Anal. Appl. Pyrolysis 2016, 119, 217–223. [Google Scholar] [CrossRef]
- Ronsse, F.; Van Hecke, S.; Dickinson, D.; Prins, W. Production and characterization of slow pyrolysis biochar: Influence of feedstock type and pyrolysis conditions. GCB Bioenergy 2013, 5, 104–115. [Google Scholar] [CrossRef]
- Şen, U.; Longo, A.; Gonçalves, M.; Miranda, I.; Pereira, H. The potential of waste phloem fraction of Quercus cerris bark in biochar production. Environments 2023, 10, 71. [Google Scholar] [CrossRef]
- Lillo-Ródenas, M.A.; Marco-Lozar, J.P.; Cazorla-Amorós, D.; Linares-Solano, A. Activated carbons prepared by pyrolysis of mixtures of carbon precursor/alkaline hydroxide. J. Anal. Appl. Pyrolysis 2007, 80, 166–174. [Google Scholar] [CrossRef]
- Liou, T.-H. Development of mesoporous structure and high adsorption capacity of biomass-based activated carbon by phosphoric acid and zinc chloride activation. Chem. Eng. J. 2010, 158, 129–142. [Google Scholar] [CrossRef]
- Lam, E.; Luong, J.H.T. Carbon materials as catalyst supports and catalysts in the transformation of biomass to fuels and chemicals. ACS Catal. 2014, 4, 3393–3410. [Google Scholar] [CrossRef]
- Lorenzen, L.; Van Deventer, J.S.J.; Landi, W.M. Factors affecting the mechanism of the adsorption of arsenic species on activated carbon. Miner. Eng. 1995, 8, 557–569. [Google Scholar] [CrossRef]
- Lu, J.-J.; Chen, W.-H. Investigation on the ignition and burnout temperatures of bamboo and sugarcane bagasse by thermogravimetric analysis. Appl. Energy 2015, 160, 49–57. [Google Scholar] [CrossRef]
- Pereira, H.; Rosa, M.E.; Fortes, M.A. The cellular structure of cork from Quercus suber L. IAWA J. 1987, 8, 213–218. [Google Scholar] [CrossRef]
- Pereira, H.; Ferreira, E. Scanning electron microscopy observations of insulation cork agglomerates. Mater. Sci. Eng. A 1989, 111, 217–225. [Google Scholar] [CrossRef]
- Pereira, H.; Baptista, C. Influence of raw-material quality and process parameters in the production of insulation cork agglomerates. Eur. J. Wood Wood Prod. 1993, 51, 301–308. [Google Scholar] [CrossRef]
- Shimada, M.; Iida, T.; Kawarada, K.; Chiba, Y.; Mamoto, T.; Okayama, T. Porous structure of activated carbon prepared from waste newspaper. J. Mater. Cycles Waste Manag. 2000, 2, 100–108. [Google Scholar]
- Yeganeh, M.M.; Kaghazchi, T.; Soleimani, M. Effect of raw materials on properties of activated carbons. Chem. Eng. Technol. Ind. Chem. Equip. Process Eng. 2006, 29, 1247–1251. [Google Scholar] [CrossRef]
- Tamai, H.; Kakii, T.; Hirota, Y.; Kumamoto, T.; Yasuda, H. Synthesis of extremely large mesoporous activated carbon and its unique adsorption for giant molecules. Chem. Mater. 1996, 8, 454–462. [Google Scholar] [CrossRef]
- Mestre, A.S.; Pires, R.A.; Aroso, I.; Fernandes, E.M.; Pinto, M.L.; Reis, R.L.; Andrade, M.A.; Pires, J.; Silva, S.P.; Carvalho, A.P. Activated carbons prepared from industrial pre-treated cork: Sustainable adsorbents for pharmaceutical compounds removal. Chem. Eng. J. 2014, 253, 408–417. [Google Scholar] [CrossRef]
- Atanes, E.; Nieto-Márquez, A.; Cambra, A.; Ruiz-Pérez, M.C.; Fernández-Martínez, F. Adsorption of SO2 onto waste cork powder-derived activated carbons. Chem. Eng. J. 2012, 211, 60–67. [Google Scholar] [CrossRef]
- Sessa, F.; Merlin, G.; Canu, P. Pine bark valorization by activated carbons production to be used as VOCs adsorbents. Fuel 2022, 318, 123346. [Google Scholar] [CrossRef]
- Novais, R.M.; Caetano, A.P.F.; Seabra, M.P.; Labrincha, J.A.; Pullar, R.C. Extremely fast and efficient methylene blue adsorption using eco-friendly cork and paper waste-based activated carbon adsorbents. J. Clean. Prod. 2018, 197, 1137–1147. [Google Scholar] [CrossRef]
- Wang, Q.; Luo, C.; Lai, Z.; Chen, S.; He, D.; Mu, J. Honeycomb-like cork activated carbon with ultra-high adsorption capacity for anionic, cationic and mixed dye: Preparation, performance and mechanism. Bioresour. Technol. 2022, 357, 127363. [Google Scholar] [CrossRef]
- Carvalho, A.P.; Cardoso, B.; Pires, J.; Brotas de Carvalho, M. Preparation of activated carbons from cork waste by chemical activation with KOH. Carbon 2003, 41, 2873–2876. [Google Scholar] [CrossRef]
- Cardoso, B.; Mestre, A.S.; Carvalho, A.P.; Pires, J. Activated carbon derived from cork powder waste by KOH activation: Preparation, characterization, and VOCs adsorption. Ind. Eng. Chem. Res. 2008, 47, 5841–5846. [Google Scholar] [CrossRef]
- Ochai-Ejeh, F.O.; Bello, A.; Dangbegnon, J.; Khaleed, A.A.; Madito, M.J.; Bazegar, F.; Manyala, N. High electrochemical performance of hierarchical porous activated carbon derived from lightweight cork (Quercus suber). J. Mater. Sci. 2017, 52, 10600–10613. [Google Scholar] [CrossRef]
- Carvalho, A.P.; Gomes, M.; Mestre, A.S.; Pires, J.; de Carvalho, M.B. Activated carbons from cork waste by chemical activation with K2CO3: Application to adsorption of natural gas components. Carbon 2004, 42, 672–674. [Google Scholar] [CrossRef]
- Patnukao, P.; Pavasant, P. Activated carbon from Eucalyptus camaldulensis Dehn bark using phosphoric acid activation. Bioresour. Technol. 2008, 99, 8540–8543. [Google Scholar] [CrossRef] [PubMed]
- Lütke, S.F.; Igansi, A.V.; Pegoraro, L.; Dotto, G.L.; Pinto, L.A.A.; Cadaval, T.R.S., Jr. Preparation of activated carbon from black wattle bark waste and its application for phenol adsorption. J. Environ. Chem. Eng. 2019, 7, 103396. [Google Scholar] [CrossRef]
- Pereira, H. Cork: Biology, Production and Uses; Elsevier: Amsterdam, The Netherlands, 2007; ISBN 978-0-444-52967-1. [Google Scholar]
- Gergova, K.; Petrov, N.; Eser, S. Adsorption properties and microstructure of activated carbons produced from agricultural by-products by steam pyrolysis. Carbon 1994, 32, 693–702. [Google Scholar] [CrossRef]
- Gupta, V.K.; Carrott, P.J.M.; Singh, R.; Chaudhary, M.; Kushwaha, S. Cellulose: A review as natural, modified and activated carbon adsorbent. Bioresour. Technol. 2016, 216, 1066–1076. [Google Scholar]
- Yun, C.H.; Park, Y.H.; Oh, G.H.; Park, C.R. Contribution of inorganic components in precursors to porosity evolution in biomass-based porous carbons. Carbon 2003, 41, 2009–2012. [Google Scholar] [CrossRef]
- Zhang, Y.; Song, X.; Zhang, P.; Gao, H.; Ou, C.; Kong, X. Production of activated carbons from four wastes via one-step activation and their applications in Pb2+ adsorption: Insight of ash content. Chemosphere 2020, 245, 125587. [Google Scholar] [CrossRef]
- Asyana, V.; Haryanto, F.; Fitri, L.A.; Ridwan, T.; Anwary, F.; Soekersi, H. Analysis of urinary stone based on a spectrum absorption FTIR-ATR. In Proceedings of the Journal of Physics: Conference Series; IOP Publishing: Yogyakarta, Indonesia, 2016; Volume 694, pp. 1–5. [Google Scholar]
- Siipola, V.; Tamminen, T.; Källi, A.; Lahti, R.; Romar, H.; Rasa, K.; Keskinen, R.; Hyväluoma, J.; Hannula, M.; Wikberg, H. Effects of biomass type, carbonization process, and activation method on the properties of bio-based activated carbons. BioResources 2018, 13, 5976–6002. [Google Scholar] [CrossRef]
- Zhou, S.; Brown, R.C.; Bai, X. The use of calcium hydroxide pretreatment to overcome agglomeration of technical lignin during fast pyrolysis. Green Chem. 2015, 17, 4748–4759. [Google Scholar] [CrossRef]
- Yang, J.; Qiu, K. Development of high surface area mesoporous activated carbons from herb residues. Chem. Eng. J. 2011, 167, 148–154. [Google Scholar] [CrossRef]
- Moreno-Piraján, J.C.; Garcia-Cuello, V.S.; Giraldo, L. The removal and kinetic study of Mn, Fe, Ni and Cu ions from wastewater onto activated carbon from coconut shells. Adsorption 2011, 17, 505–514. [Google Scholar] [CrossRef]
- Jawad, A.H.; Ismail, K.; Ishak, M.A.M.; Wilson, L.D. Conversion of Malaysian low-rank coal to mesoporous activated carbon: Structure characterization and adsorption properties. Chin. J. Chem. Eng. 2019, 27, 1716–1727. [Google Scholar] [CrossRef]
- Johnston, P.; Carthey, N.; Hutchings, G.J. Discovery, development, and commercialization of gold catalysts for acetylene hydrochlorination. J. Am. Chem. Soc. 2015, 137, 14548–14557. [Google Scholar] [CrossRef] [PubMed]
- Zhao, J.; Xu, J.; Xu, J.; Ni, J.; Zhang, T.; Xu, X.; Li, X. Activated-carbon-supported gold–cesium (I) as highly effective catalysts for hydrochlorination of acetylene to vinyl chloride. Chempluschem 2015, 80, 196–201. [Google Scholar] [CrossRef]
- Chojnacka, K.; Chojnacki, A.; Gorecka, H. Biosorption of Cr3+, Cd2+ and Cu2+ ions by blue–green algae Spirulina sp.: Kinetics, equilibrium and the mechanism of the process. Chemosphere 2005, 59, 75–84. [Google Scholar] [CrossRef] [PubMed]
- Suteu, D.; Malutan, T. Industrial Cellolignin Wastes as Adsorbent for Removal of Methylene Blue Dye from Aqueous Solutions. BioResources 2013, 8, 427–446. [Google Scholar] [CrossRef]
- Hoseini, S.J.; Kokhdan, S.; Ghaedi, A.; Moosavian, S. Comparison of multiwalled carbon nanotubes and activated carbon for efficient removal of methyl orange: Kinetic and thermodynamic investigation. Fresenius Environ. Bull. 2011, 20, 219–234. [Google Scholar]
- Huang, C.P.; Fu, P.L.K. Treatment of arsenic (V)-containing water by the activated carbon process. J. Water Pollut. Control Fed. 1984, 56, 233–242. [Google Scholar]
Figure 1.
SEM micrographs of Quercus cerris cork (a), cork biochar produced at 325 °C (b), and cork-activated carbon (c). Black regions in the cell walls of cork-activated carbon are pores. SE: Secondary electron, MAG: magnification, HV: High voltage (kV).
Figure 1.
SEM micrographs of Quercus cerris cork (a), cork biochar produced at 325 °C (b), and cork-activated carbon (c). Black regions in the cell walls of cork-activated carbon are pores. SE: Secondary electron, MAG: magnification, HV: High voltage (kV).

Figure 2.
SEM micrographs of Quercus cerris phloem (a), phloem biochar produced at 325 °C (b), and phloem-activated carbon (c). Black regions in the cell walls of phloem-activated carbon are pores. SE: Secondary electron, MAG: magnification, HV: High voltage (kV).
Figure 2.
SEM micrographs of Quercus cerris phloem (a), phloem biochar produced at 325 °C (b), and phloem-activated carbon (c). Black regions in the cell walls of phloem-activated carbon are pores. SE: Secondary electron, MAG: magnification, HV: High voltage (kV).

Figure 3.
Calcium crystals in Quercus cerris phloem-activated carbon. SE: Secondary electron, MAG: magnification, HV: High voltage (kV).
Figure 3.
Calcium crystals in Quercus cerris phloem-activated carbon. SE: Secondary electron, MAG: magnification, HV: High voltage (kV).
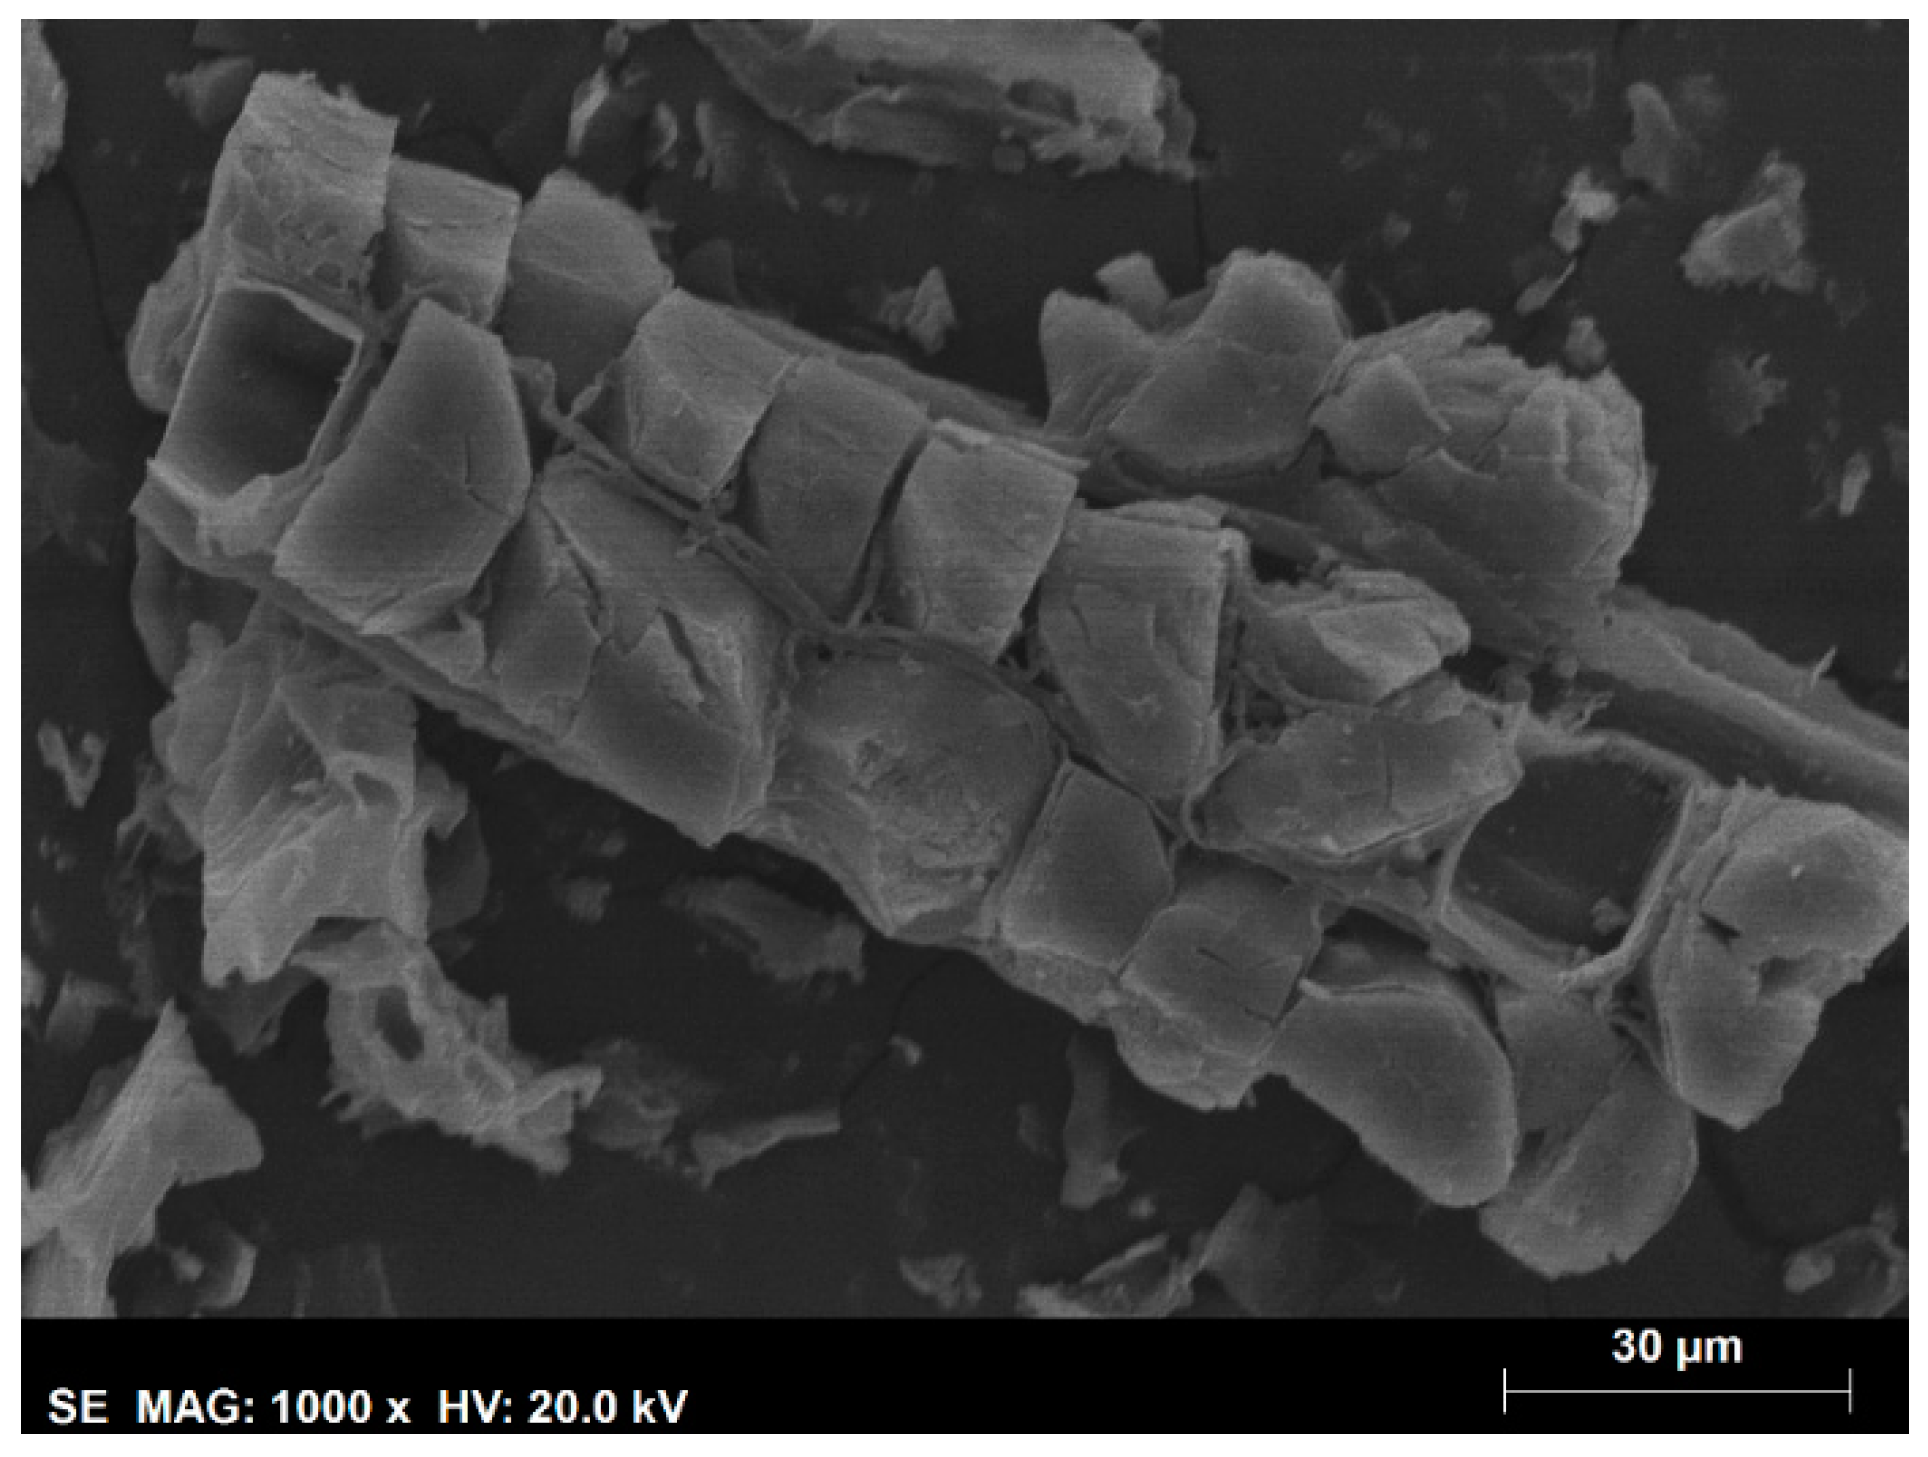
Figure 4.
(a) Nitrogen adsorption-desorption isotherms of Quercus cerris cork-activated carbon and (b) Nitrogen adsorption-desorption isotherms of Quercus cerris phloem-activated carbon.
Figure 4.
(a) Nitrogen adsorption-desorption isotherms of Quercus cerris cork-activated carbon and (b) Nitrogen adsorption-desorption isotherms of Quercus cerris phloem-activated carbon.
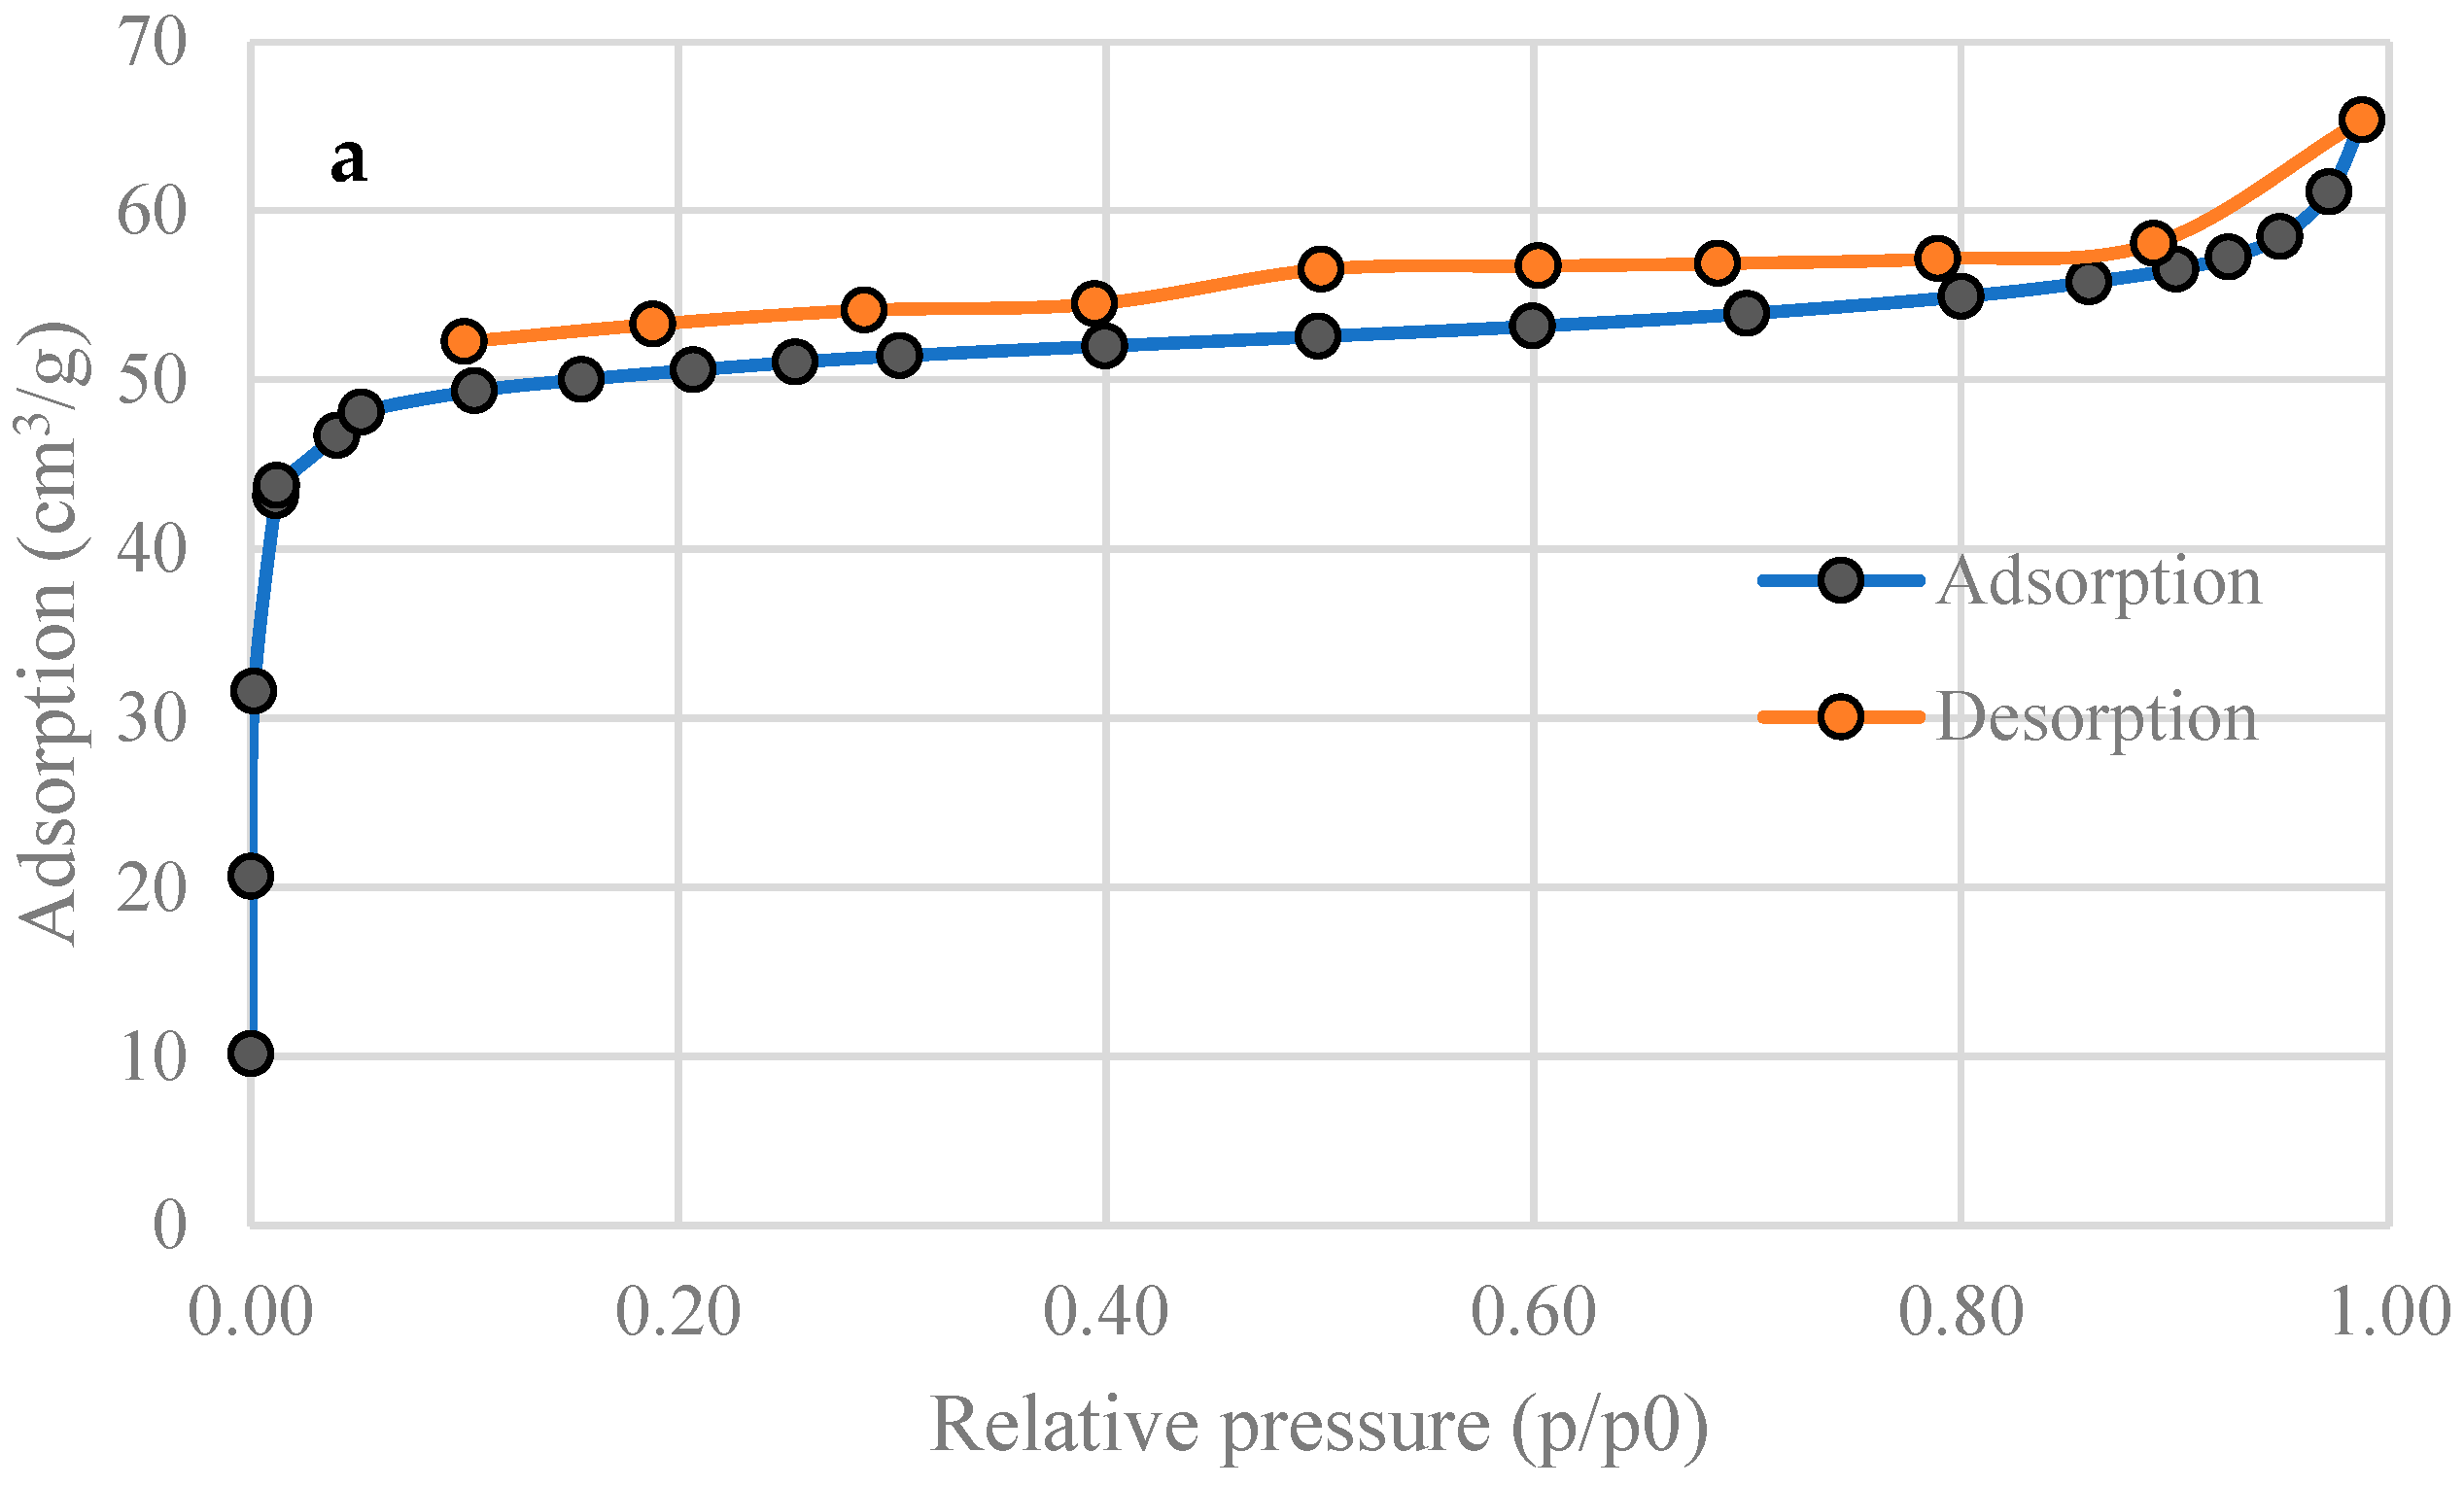
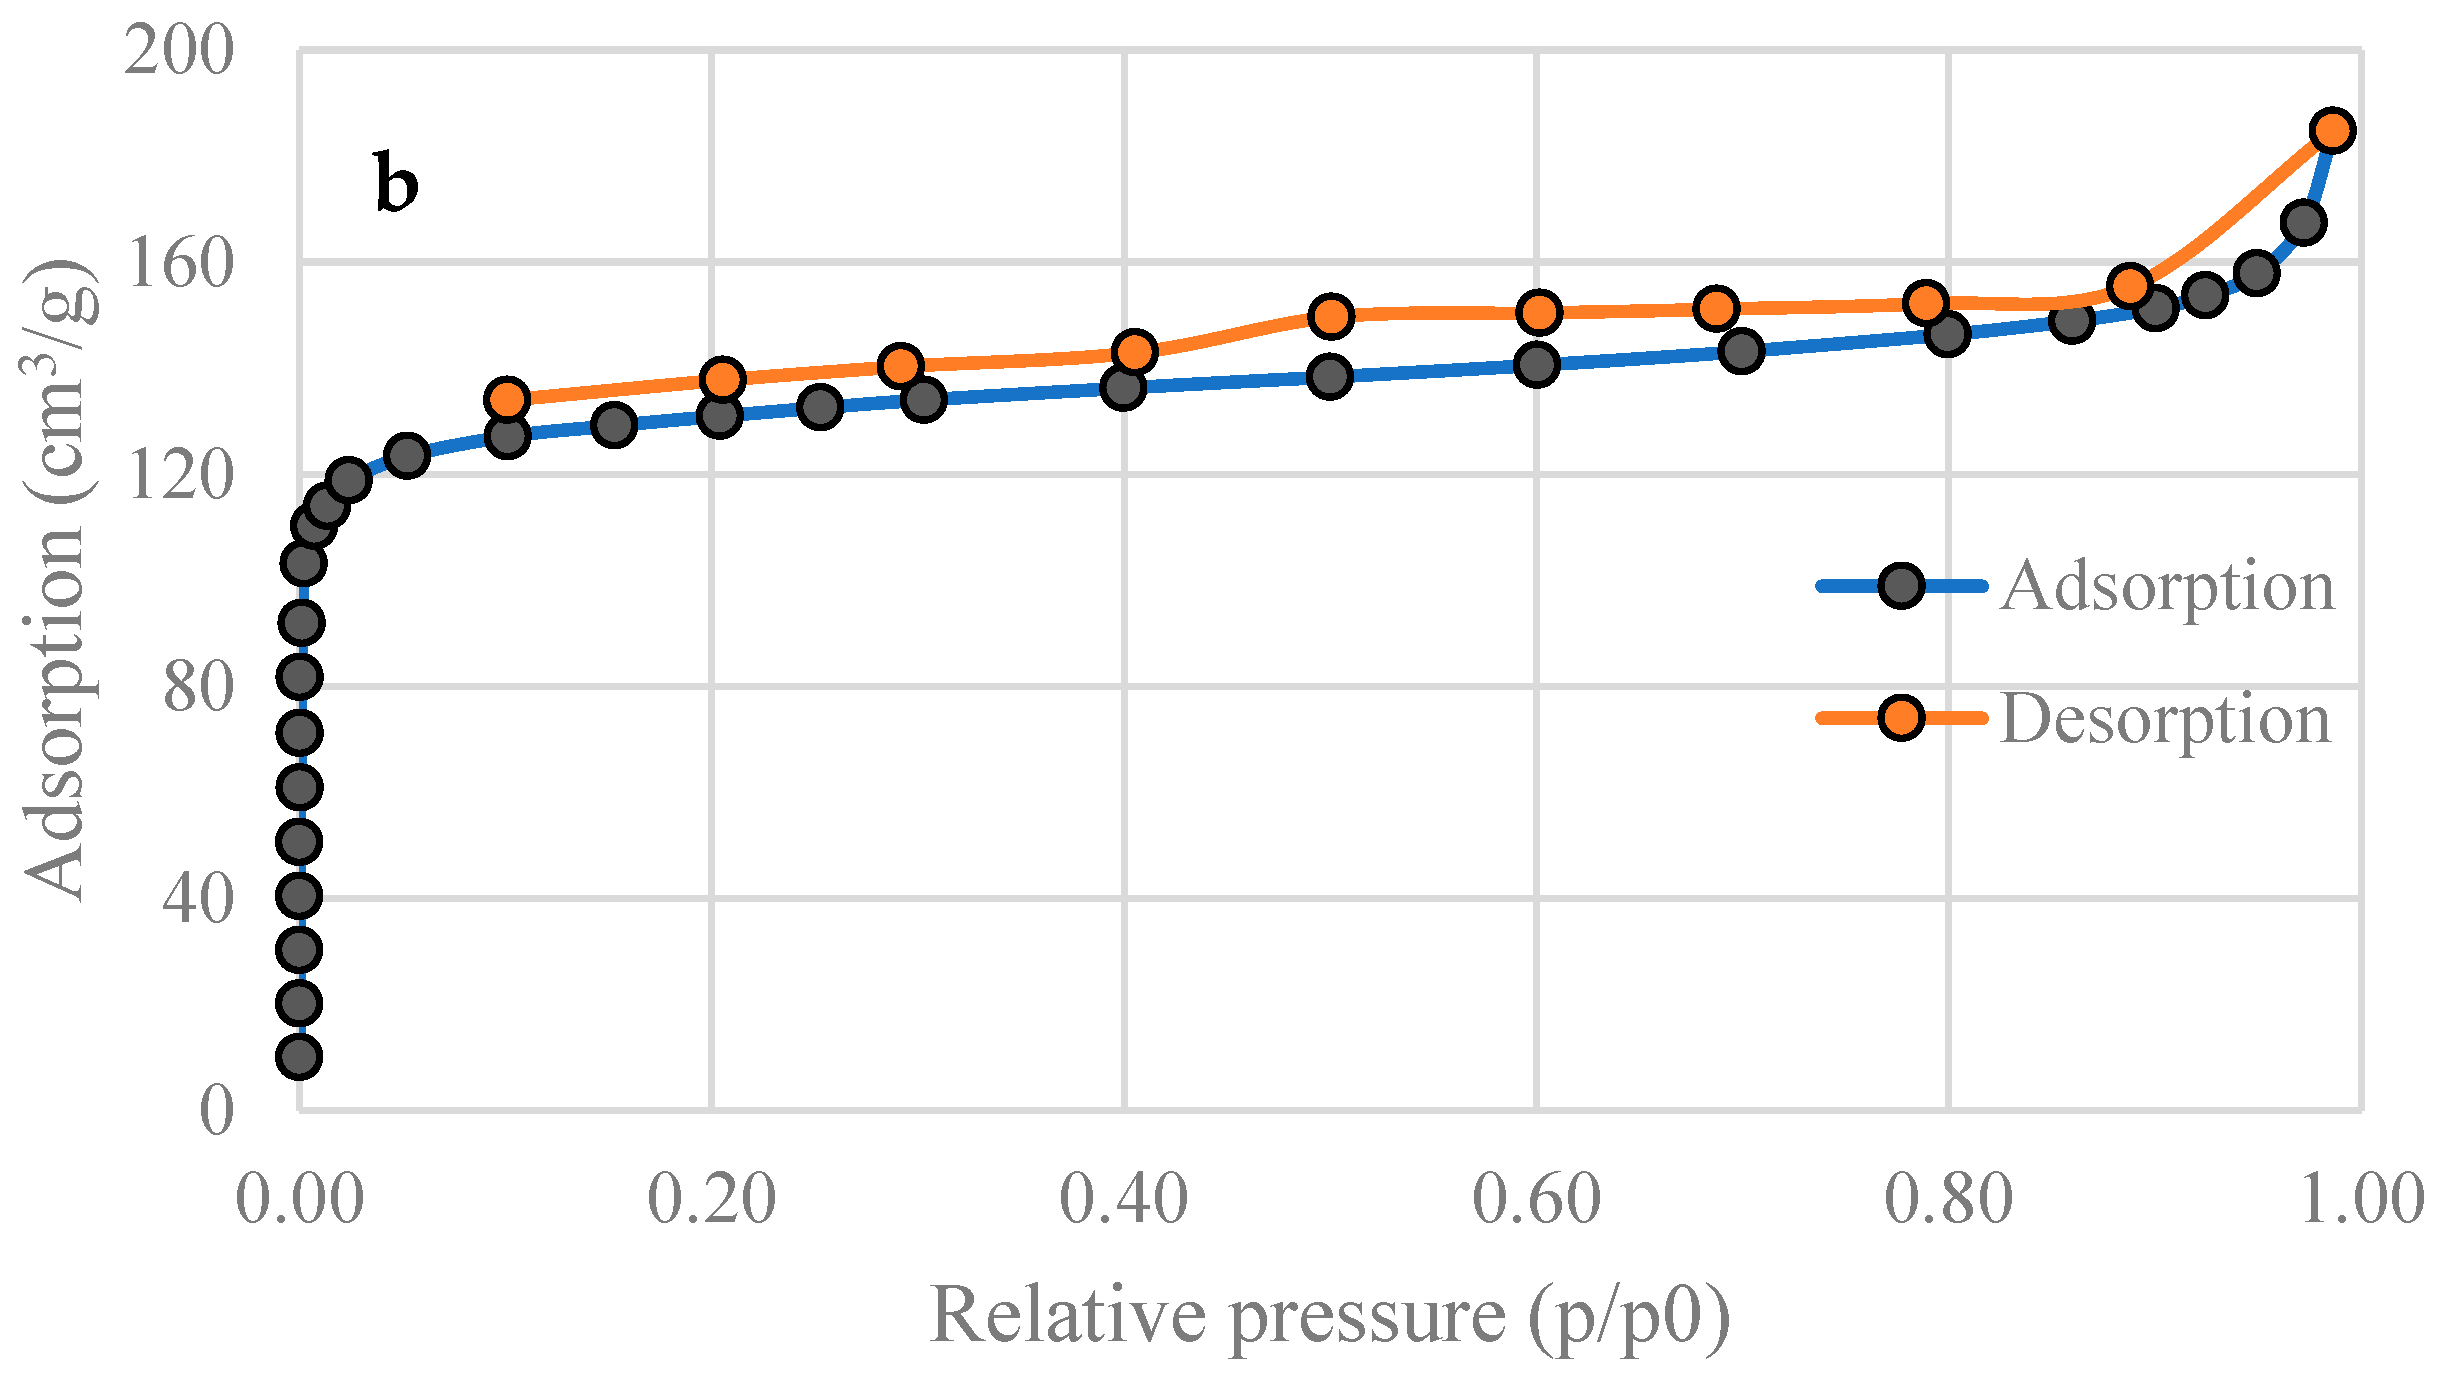
Figure 5.
Major elements detected in the inorganic fraction of raw cork and phloem, cork and phloem biochars, and cork and phloem-activated carbons (AC).
Figure 5.
Major elements detected in the inorganic fraction of raw cork and phloem, cork and phloem biochars, and cork and phloem-activated carbons (AC).

Figure 6.
FT-IR spectra of: (a) cork, phloem, cork biochar, and phloem biochar; and (b) cork-activated carbon and phloem-activated carbon (AC).
Figure 6.
FT-IR spectra of: (a) cork, phloem, cork biochar, and phloem biochar; and (b) cork-activated carbon and phloem-activated carbon (AC).
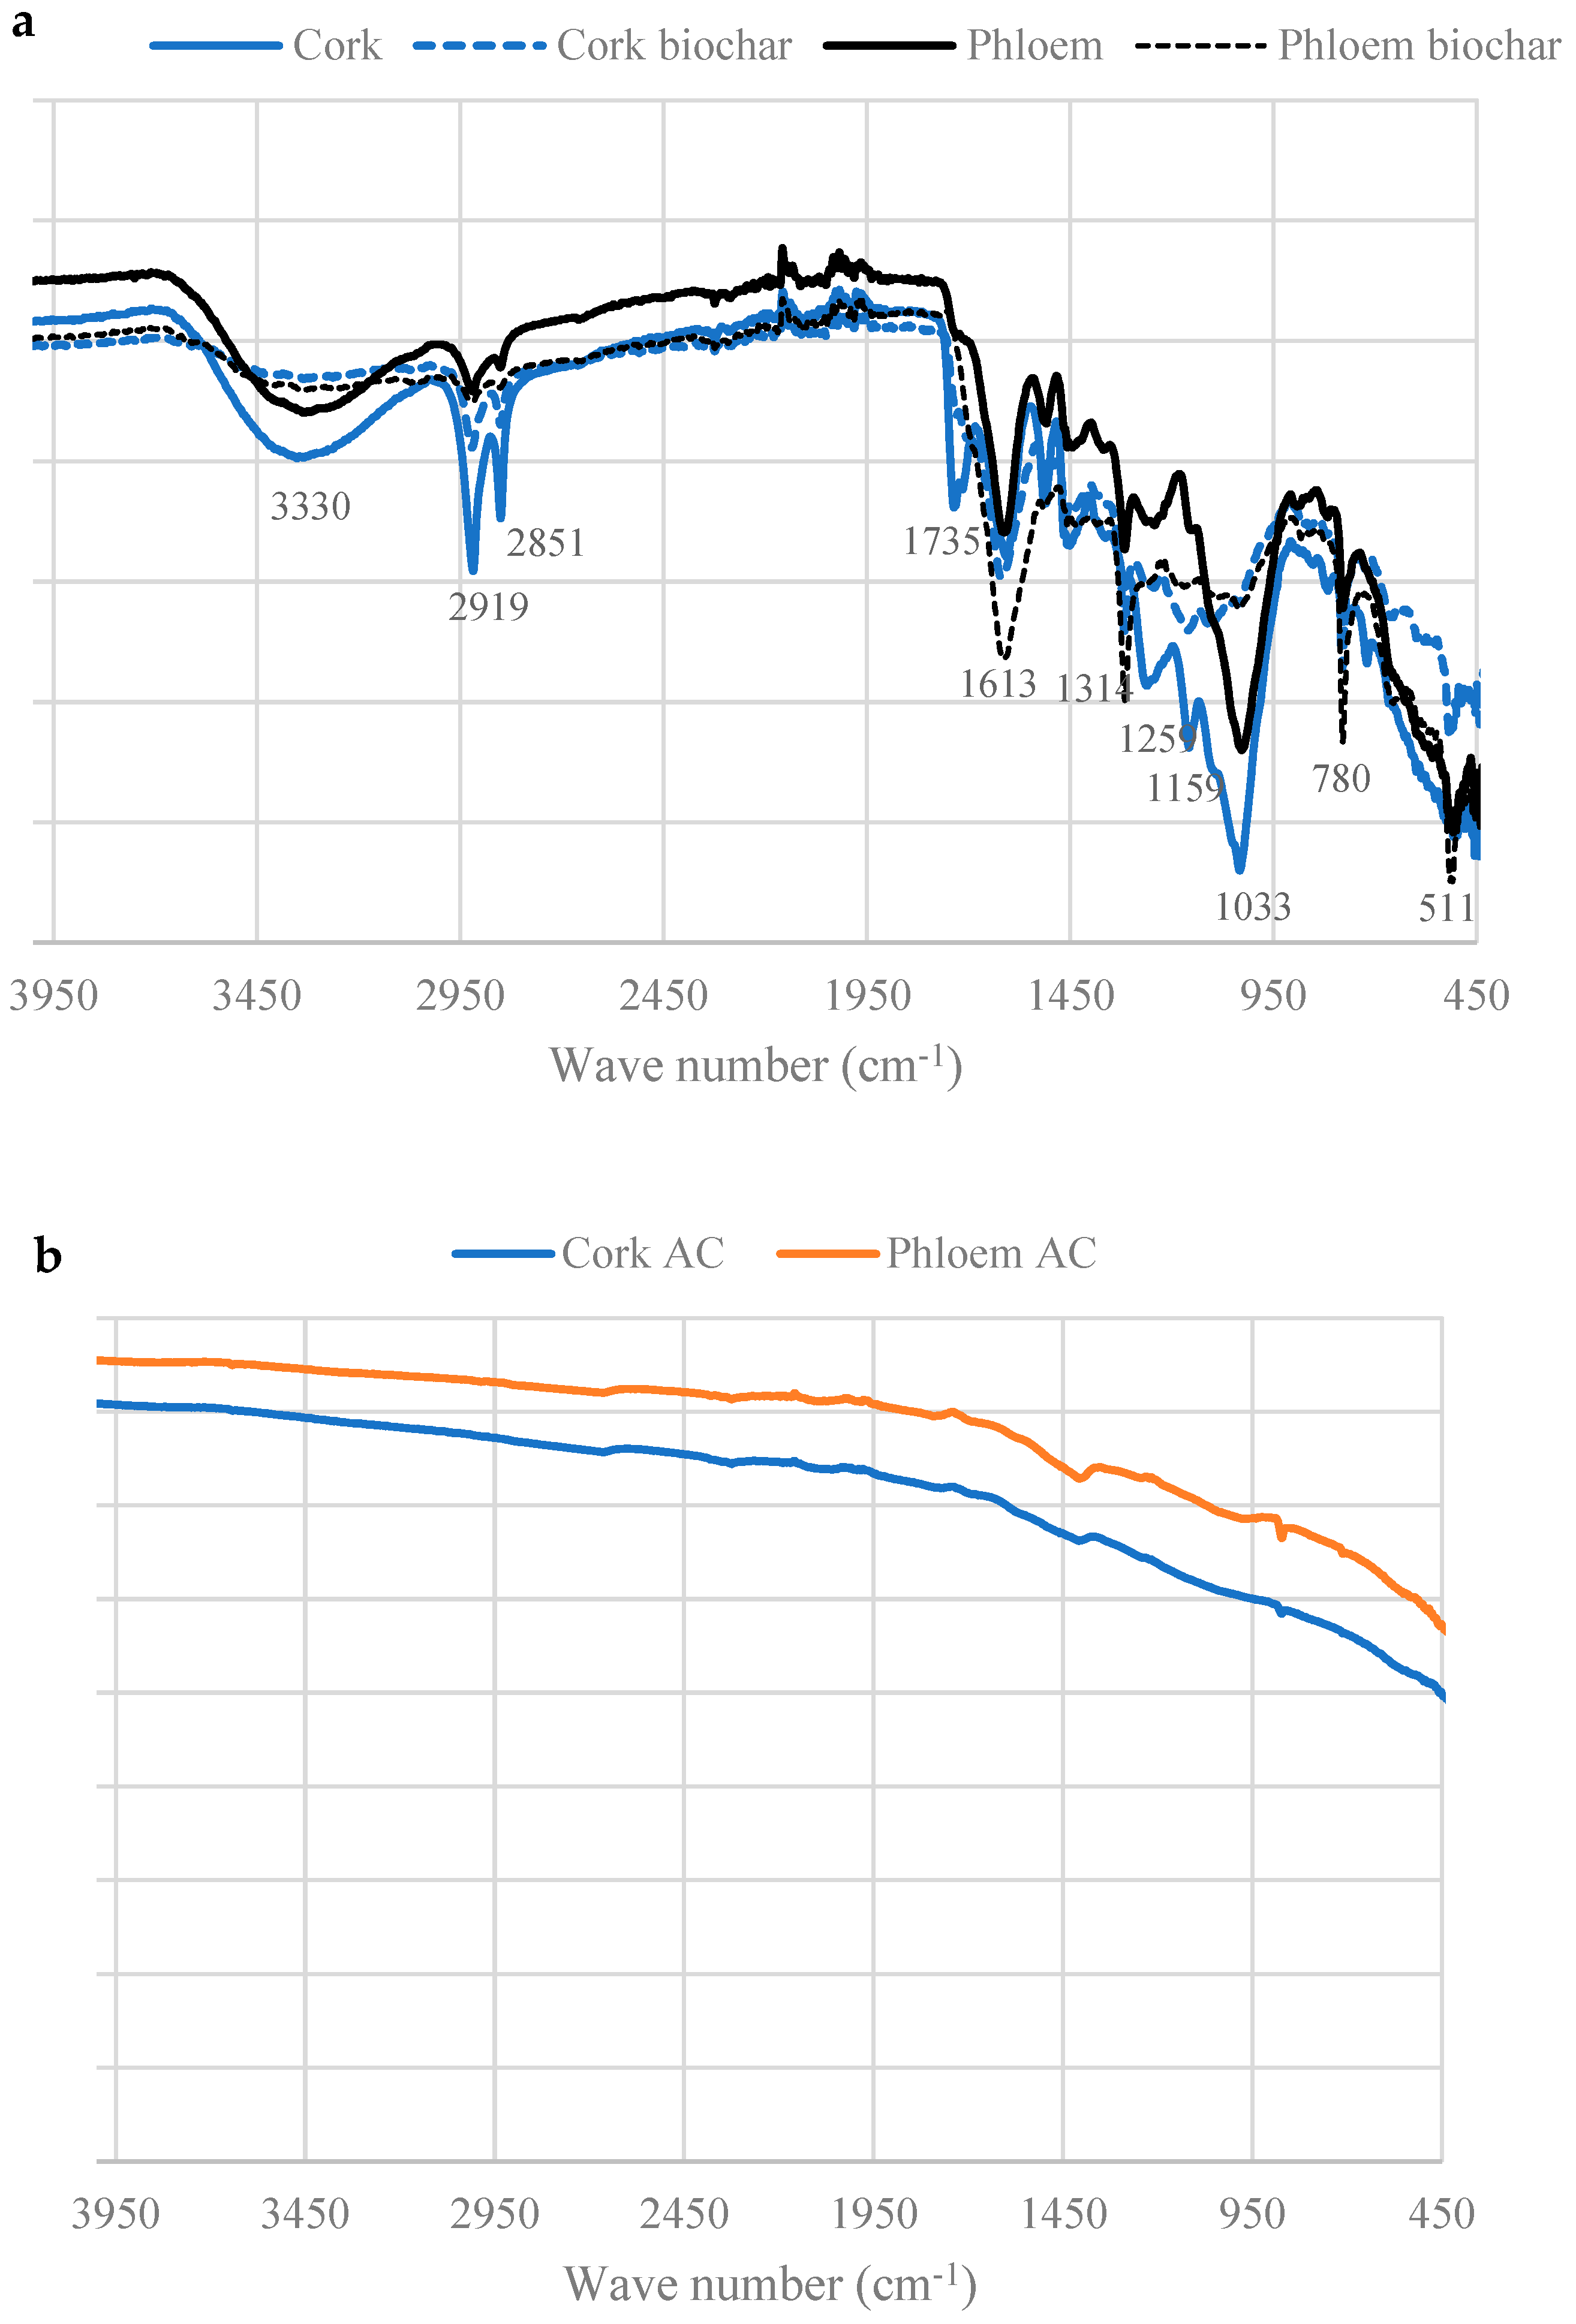
Figure 7.
Comparison of combustion of cork and phloem-activated carbons and commercial-activated carbon (Panreac AC). Heating rate:10 °C/min.
Figure 7.
Comparison of combustion of cork and phloem-activated carbons and commercial-activated carbon (Panreac AC). Heating rate:10 °C/min.
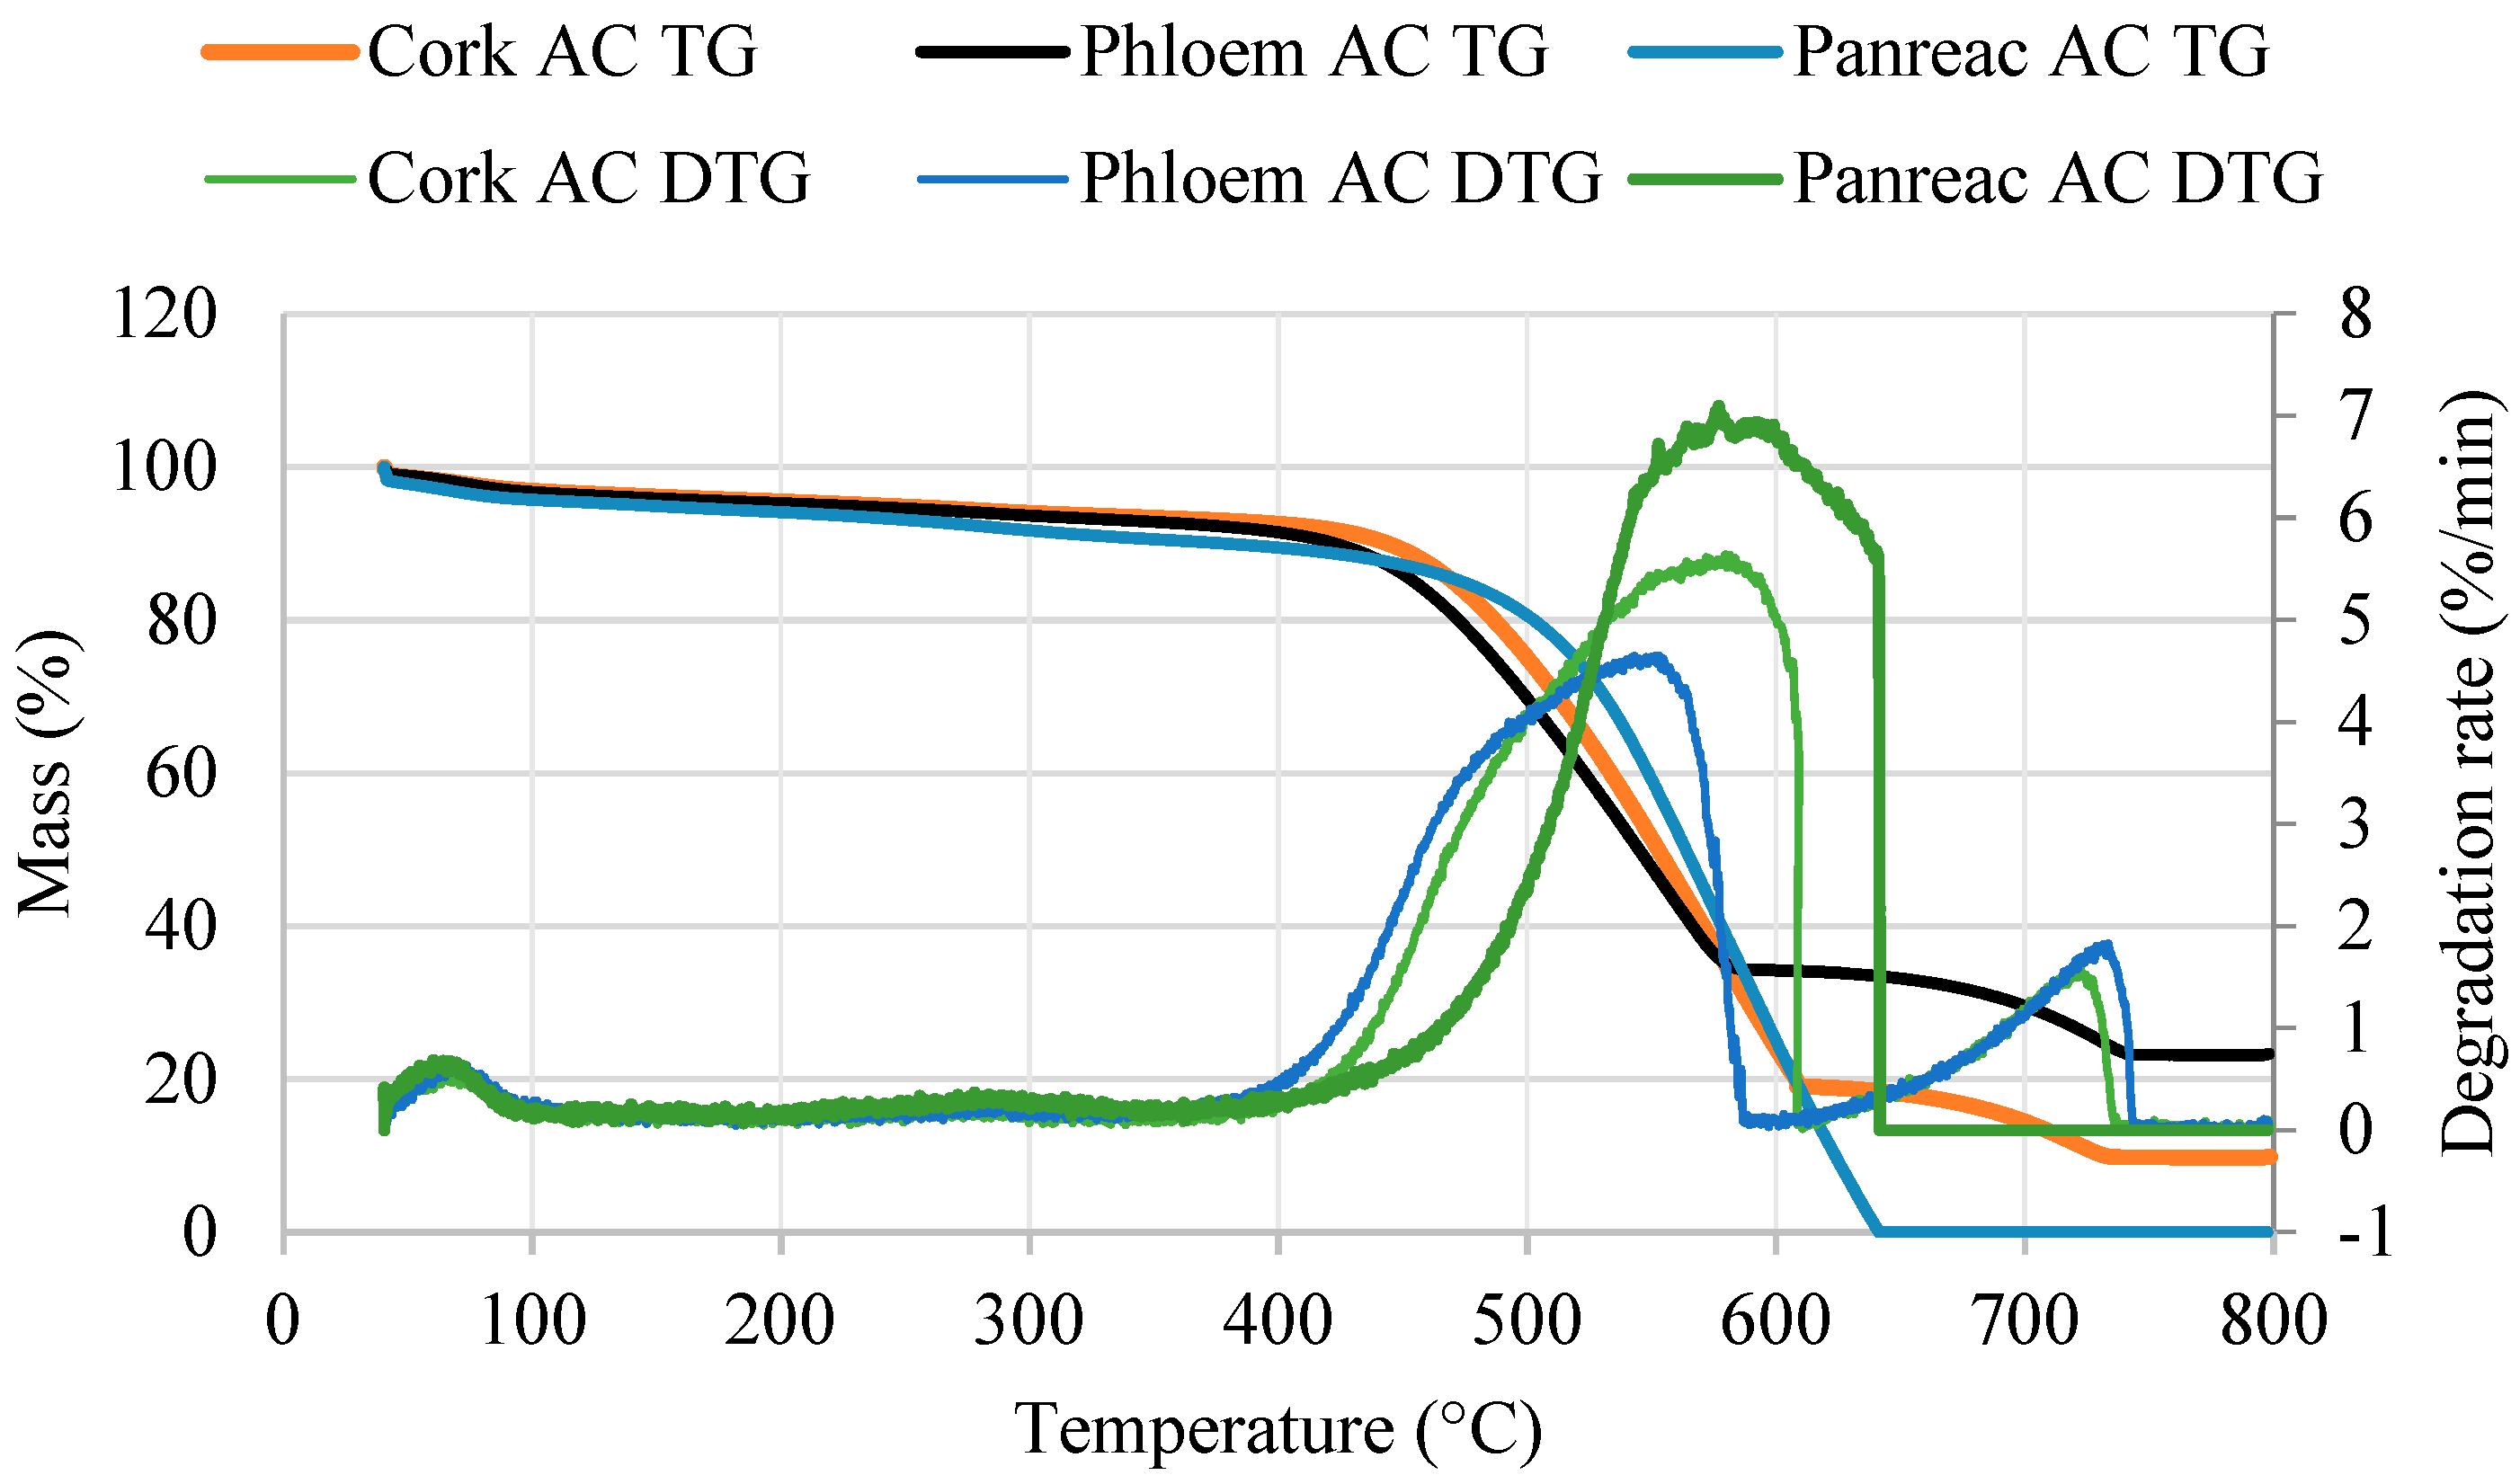
Figure 8.
(a) Methylene blue adsorption and desorption of cork, cork biochar, cork-activated carbon (Cork AC), phloem, phloem biochar, and phloem-activated carbon (Phloem AC) at three times (instant, 24 h, 48 h), (b) Comparison of methyl orange removal of cork and phloem-activated carbons (AC).
Figure 8.
(a) Methylene blue adsorption and desorption of cork, cork biochar, cork-activated carbon (Cork AC), phloem, phloem biochar, and phloem-activated carbon (Phloem AC) at three times (instant, 24 h, 48 h), (b) Comparison of methyl orange removal of cork and phloem-activated carbons (AC).

Table 1.
Surface properties of Quercus cerris cork and phloem-activated carbons (AC).
| Cork AC | Phloem AC | |
|---|---|---|
| SBET (m2 g−1) | 201 | 515 |
| Total pore volume (Adsorption, cm3 g−1) | 0.101 | 0.285 |
| Total pore volume (Desorption, cm3 g−1) | 0.101 | 0.285 |
| Average pore diameter (nm) | 2.00 | 2.22 |
Table 2.
Comparison of activation types and the resulting surface areas of different barks or bark fractions.
Table 2.
Comparison of activation types and the resulting surface areas of different barks or bark fractions.
| Whole Bark/Bark Fraction | Activation Method | BET Surface Area of Activated Carbon (m2 g−1) | Reference | ||
|---|---|---|---|---|---|
| Material | Species | Activation Type | Activation Agent | ||
| Cork | Quercus cerris | Physical | H2O | 201 | This work |
| Phloem | Quercus cerris | Physical | H2O | 515 | This work |
| Cork | Quercus suber | Physical | H2O | 750 | [36] |
| Cork | Quercus suber | Physical | CO2 | 76 | [37] |
| Bark | Pine | Physical | CO2 | 868 | [38] |
| Cork | Quercus suber | Chemical | NaOH (alkaline wastewater) | 1670 | [39] |
| Cork | Quercus suber | Chemical | KOH | 3403 | [40] |
| Cork | Quercus suber | Chemical | KOH | 251–1336 | [41] |
| Cork | Quercus suber | Chemical | KOH | 584 | [37] |
| Cork | Quercus suber | Chemical | KOH | 948 | [36] |
| Cork | Quercus suber | Chemical | KOH | 1336 | [42] |
| Cork | Quercus suber | Chemical | KOH | 1081 | [43] |
| Cork | Quercus suber | Chemical | K2CO3 | 907 | [36] |
| Cork | Quercus suber | Chemical | K2CO3 | 1279 | [44] |
| Bark | Pine | Chemical | K2CO3 | 1499 | [38] |
| Bark | Eucalyptus camaldulensis | Chemical | H3PO4 | 1239 | [45] |
| Bark | Pine | Chemical | H3PO4 | 3342 | [38] |
| Bark | Acacia mearnsii | Chemical | ZnCl2 | 414 | [46] |
Table 3.
Minor elements (ppm) detected in raw cork and phloem biomass, biochars, and activated carbons (AC).
Table 3.
Minor elements (ppm) detected in raw cork and phloem biomass, biochars, and activated carbons (AC).
| Elements | Cork | Cork Biochar | Cork AC | Phloem | Phloem Biochar | Phloem AC |
|---|---|---|---|---|---|---|
| Mo | 8.7 | 8.4 | 8.3 | 8.2 | 7.9 | 9.6 |
| Zr | 8.4 | 4.8 | 0 | 8.2 | 10.9 | 15.4 |
| Sr | 68.4 | 115.8 | 213.9 | 95.9 | 162.5 | 268.6 |
| U | 6.2 | 6.3 | 4.2 | 4.7 | 5.8 | 1.4 |
| Rb | 3.8 | 4.3 | 4.4 | 6.3 | 8.5 | 9.7 |
| Zn | 0 | 0 | 28.7 | 66.1 | 32.9 | 52.4 |
| W | 38.8 | 39.2 | 10.5 | 35.3 | 0 | 18.6 |
| Cu | 45.9 | 39.9 | 41.3 | 21.9 | 24.4 | 35.1 |
| Ni | 0 | 0 | 0 | 0 | 0 | 33.5 |
| Cr | 0 | 0 | 0 | 31.7 | 0 | 162.9 |
| V | 12.0 | 8.4 | 0 | 77.0 | 72.5 | 9.9 |
| Ti | 2799.1 | 255.3 | 295.9 | 409.9 | 359.1 | 766.7 |
| Sc | 218.3 | 398.1 | 568.3 | 299.2 | 438.6 | 510.4 |
| Ba | 0 | 0 | 0 | 0 | 0 | 15.0 |
| Sn | 16.9 | 4.0 | 0 | 3.5 | 15.3 | 0 |
| Cd | 20.0 | 20.9 | 16.4 | 20.8 | 21.2 | 20.4 |
| Pd | 7.7 | 8.1 | 6.4 | 8.1 | 7.8 | 6.7 |
| Ag | 13.2 | 5.4 | 6.0 | 6.1 | 3.9 | 7.2 |
| Nb | 12.1 | 11.3 | 9.9 | 10.3 | 10.0 | 11.2 |
Table 4.
Mass loss for different temperature intervals, burnout temperature, and ash content of cork and phloem-activated carbons, and of a commercial-activated carbon (AC).
Table 4.
Mass loss for different temperature intervals, burnout temperature, and ash content of cork and phloem-activated carbons, and of a commercial-activated carbon (AC).
| Cork AC | Phloem AC | Commercial AC | |
|---|---|---|---|
| Ash content (%) | 9.9 | 23.3 | 0 |
| Burnout temperature (°C) | 725.8 | 735.8 | 639.7 |
| Mass loss (%) | |||
| 100–400 °C | 4.3 | 5.3 | 6.3 |
| 400–650 °C | 74.4 | 58.3 | 89.4 |
| 650–750 °C | 8.3 | 9.9 | 0 |
Table 5.
Results of paired two sample for means for methylene blue and methyl orange adsorption.
| Cork AC | Phloem AC | |
|---|---|---|
| Mean removal (%) | 47.99 | 65.82 |
| Variance | 466.70 | 385.41 |
| Observations | 6 | 6 |
| Pearson correlation | 0.94 | |
| Hypothesized mean difference | 0 | |
| df | 5 | |
| t Stat | −5.76 | |
| P(T ≤ t) one-tail | 0.0011 | |
| t Critical one-tail | 2.0150 | |
| P(T ≤ t) two-tail | 0.0022 | |
| t Critical two-tail | 2.5706 |
Disclaimer/Publisher’s Note: The statements, opinions and data contained in all publications are solely those of the individual author(s) and contributor(s) and not of MDPI and/or the editor(s). MDPI and/or the editor(s) disclaim responsibility for any injury to people or property resulting from any ideas, methods, instructions or products referred to in the content. |
© 2023 by the authors. Licensee MDPI, Basel, Switzerland. This article is an open access article distributed under the terms and conditions of the Creative Commons Attribution (CC BY) license (https://creativecommons.org/licenses/by/4.0/).
Share and Cite
MDPI and ACS Style
Şen, U.; Nobre, C.; Martins, M.; Gonçalves, M.; Pereira, H. Effect of Bark Biochars on Properties of Steam-Activated Carbons. Environments 2024, 11, 2. https://doi.org/10.3390/environments11010002
AMA Style
Şen U, Nobre C, Martins M, Gonçalves M, Pereira H. Effect of Bark Biochars on Properties of Steam-Activated Carbons. Environments. 2024; 11(1):2. https://doi.org/10.3390/environments11010002
Chicago/Turabian StyleŞen, Umut, Catarina Nobre, Marta Martins, Margarida Gonçalves, and Helena Pereira. 2024. "Effect of Bark Biochars on Properties of Steam-Activated Carbons" Environments 11, no. 1: 2. https://doi.org/10.3390/environments11010002
Note that from the first issue of 2016, this journal uses article numbers instead of page numbers. See further details here.