Article

Bioaccumulation of Selenium, Heavy Metals and Rare Earth Elements with Different Rice Cultivars Grown on Seleniferous Soils in Lianchen County, Fujian Province, China

1
Fujian Province Key Laboratory of Agro-Ecological Processes in Hilly Red Soil, Institute of Agricultural Ecology, Fujian Academy of Agricultural Sciences, No. 247, Wusi Road, Fuzhou 350013, China
2
Station of Soil and Fertilizer, Agricultural and Rural Bureau of Liancheng County, No. 55, Beidadong Road, Lianchen 66200, China
3
Institute of Soil and Fertilizer, Fujian Academy of Agricultural Sciences, No. 247, Wusi Road, Fuzhou 350013, China
4
Fujian Province Institute of Testing Technology, No. 61, Beihuangzhong Road, Fuzhou 350003, China
5
Department of Agricultural Chemistry, National Taiwan University, No. 1, Sec. Roosevelt Road, Taipei 10617, Taiwan
*
Authors to whom correspondence should be addressed.
Environments 2023, 10(7), 114; https://doi.org/10.3390/environments10070114
Submission received: 10 May 2023 / Revised: 16 June 2023 / Accepted: 27 June 2023 / Published: 3 July 2023

Abstract

:
Seleniferous red soils cover a large area in the southern part of China. These agricultural soils are enriched in selenium (Se), heavy metals, and rare earth elements and have been cultivated for more than 1000 years for rice production without any consideration of the effects of selenium, heavy metals, and rare earth element bioaccumulation in the food plants produced. To address this knowledge gap, this study focuses on the investigation of Se, heavy metals, and rare earth elements within soils and plants in the region. The rice (Oryza spp.) plants studied were grown in the Gutian (GT), Gechuan (GC), and Pengkou (PK) villages in Lianchen (LC) County, Fujian Province. The surface soils and harvested rice tissues were collected to determine the Se, Cd, Zn, Pb, La, Ce, and Nd concentrations in the soils and plant tissues. Different rice cultivars possessed various potentials for elemental accumulation. Generally, rice plant tissues accumulated certain amounts of these elements; however, the elemental concentrations found in rice grain were within the acceptable ranges stipulated by the National Security Standard of Food. The Hongbaoshi (HBS) Indica red rice produced in the PK village accumulated more selenium, heavy metals, and rare earth elements than those in the plant tissues of the Xinyinzhan (XYZ) and Wushansimiao (WSSM) rice cultivars because HBS had more root hairs and finer root distribution. Thus, in the interest of food safety, increased attention needs to be given to the careful selection of the optimum crop species planted in these types of seleniferous red soils.

1. Introduction

Although selenium (Se) is not considered to be an essential element for plant growth, it is an important element for animal and human nutrition [1]. Research on plant and soil science has noted that a certain amount of Se is part of the essential nutrition provided by plants as a part of animal diets. However, in some locations, native crops contain Se levels that are toxic to animals. Conversely, in other areas, feeds can be deficient in Se, negatively affecting animal health. Selenium levels in plants have received considerable attention from animal, plant, and soil scientists since the early 1930s [2,3,4].
Selenium occurs in nearly all materials of the Earth’s crust and is present in magmatic rocks at concentrations generally less than 0.05 mg Se kg−1. The concentrations of Se are usually higher in sedimentary rocks where it is associated with clay fractions, and thus larger Se concentrations are found in shales than in limestones or sandstones. Even in shales, the Se concentrations are seldom greater than 500 mg Se kg−1 [5]. These shales are the parent materials for much of the seleniferous soil in the northern Great Plains of the United States of America and the Prairie region of Canada. These seleniferous soils can have higher Se concentrations in the subsoil because of the chemical weathering of the exposed topsoil layers. Shales are also the principal sources of Se-toxic soil in Ireland, Australia, Israel, and several other countries [2,3,4].
On average, the concentration of Se in most soils lies within the range of 0.01 to 2 μg Se kg−1 [6,7]. Higher concentrations of up to 1200 mg Se kg−1 total and 38 mg Se kg−1 as water-soluble selenate have been reported in seleniferous areas of the world [8]. Soils developed from the Cretaceous shales of South Dakota, Montana, Wyoming, Nebraska, Kansas, Utah, Colorado, and New Mexico in the United States of America tend to have high Se values ranging from 1 to 10 mg Se kg−1 [7,9,10], but these high levels are usually associated with the presence of uranium (U).
Elevated accumulation of heavy metals in soils as a consequence of anthropogenic activities and wastewater output from mining operations represents a range of risks to human and ecosystem health, including contamination of biological and water resources. Risks to human health can occur due to excessive exposure to heavy metals either via the food chain, through direct exposure by dermal contact, or ingestion of soil-borne heavy metals. It is widely accepted that the risk of heavy metal contamination in the environment increases where higher concentrations are present in underlying soils. The solubility and bioavailability of the heavy metal element depend upon its form or chemical species, which are controlled by several factors, including soil pH, organic matter concentration, substrate texture, sesquioxides, and redox potential, especially in rice growth in waterlogged paddy soils. These factors are key parameters in controlling heavy metal solubility, the partitioning between the solid and solution phases, and the distribution of heavy metals among various soil fractions [11,12].
According to the International Union of Pure and Applied Chemistry, rare earth elements (REEs) consist of 15 lanthanides and scandium and yttrium from the IIIB group in the periodic table. For the systematic and convenient examination of the geochemical behaviour of REEs, there are two subgroups commonly recognized as light REEs (LREEs; Z = 57–64) and heavy REEs (HREEs; Z = 21, 39, 65–71). The total concentration of REEs in soils is mainly dependent on their parent materials [13,14,15].
Cao et al. and Chen reported that the major rare earth elements found in the soils of southern China were non-water-soluble and nonexchangeable La, Ce, Nd, and cadmium (Cd), which caused more concern because they were capable of producing toxicity in brown rice [16,17]. The bioaccumulation of Cd, Zn, and Pb in the human food chain poses a serious threat to human health because of the high trophic position of humans within the food chain [18]. Daily ingestion of rice containing a high level of Cd, Zn, and Pb could result in serious illnesses, such as itai-itai disease [19,20,21,22,23,24,25].
Seleniferous red soils cover large areas of agricultural land in the southern part of China (personal communication), which is different from the views of Roman and Yang et al. [10,26]. These soils contain high concentrations of Se, rare earth elements, and heavy metals, and have been used to cultivate different crops for food production for more than 1000 years; however, little information is available regarding the uptake of Se, heavy metals, and rare earth elements by comestible crops.
Low concentrations of Se in drinking water and food can be beneficial to human health, but high concentrations of Se can cause acute or chronic intoxication [9,10,27]. The accumulated concentrations of Se, heavy metals, and rare earth elements in edible brown rice and their effects on human health remain poorly understood. Several different rice cultivars (Oryza spp.) planted in Lianchen (LC) County, Fujian Province, southeast China, were selected for the field experiments (Figure 1). The Gutian (GT), Gechuan (GC), and Pengkou (PK) villages in LC County were the selected agricultural soils for rice growth in the field tests (Figure 1C). In this study, particular attention was given to the capability of each rice cultivar to maintain the optimum Se concentration of 0.04–0.3 mg Se kg−1 with low amounts of La, Ce, and Nd and a specific Cd concentration (i.e., 0.2 mg kg−1 in brown rice), as specified in the national standards of food safety (Maximum levels of contaminants in foods in National Food Safety Standard, GB 2762–2022). The aims of this study focus on investigating Se, heavy metal (i.e., Cd, Zn, and Pb), and rare earth element (i.e., La, Ce, and Nd) concentrations in seleniferous paddy soils and rice (Oryza spp.) plant tissues in LC County.

2. Materials and Methods

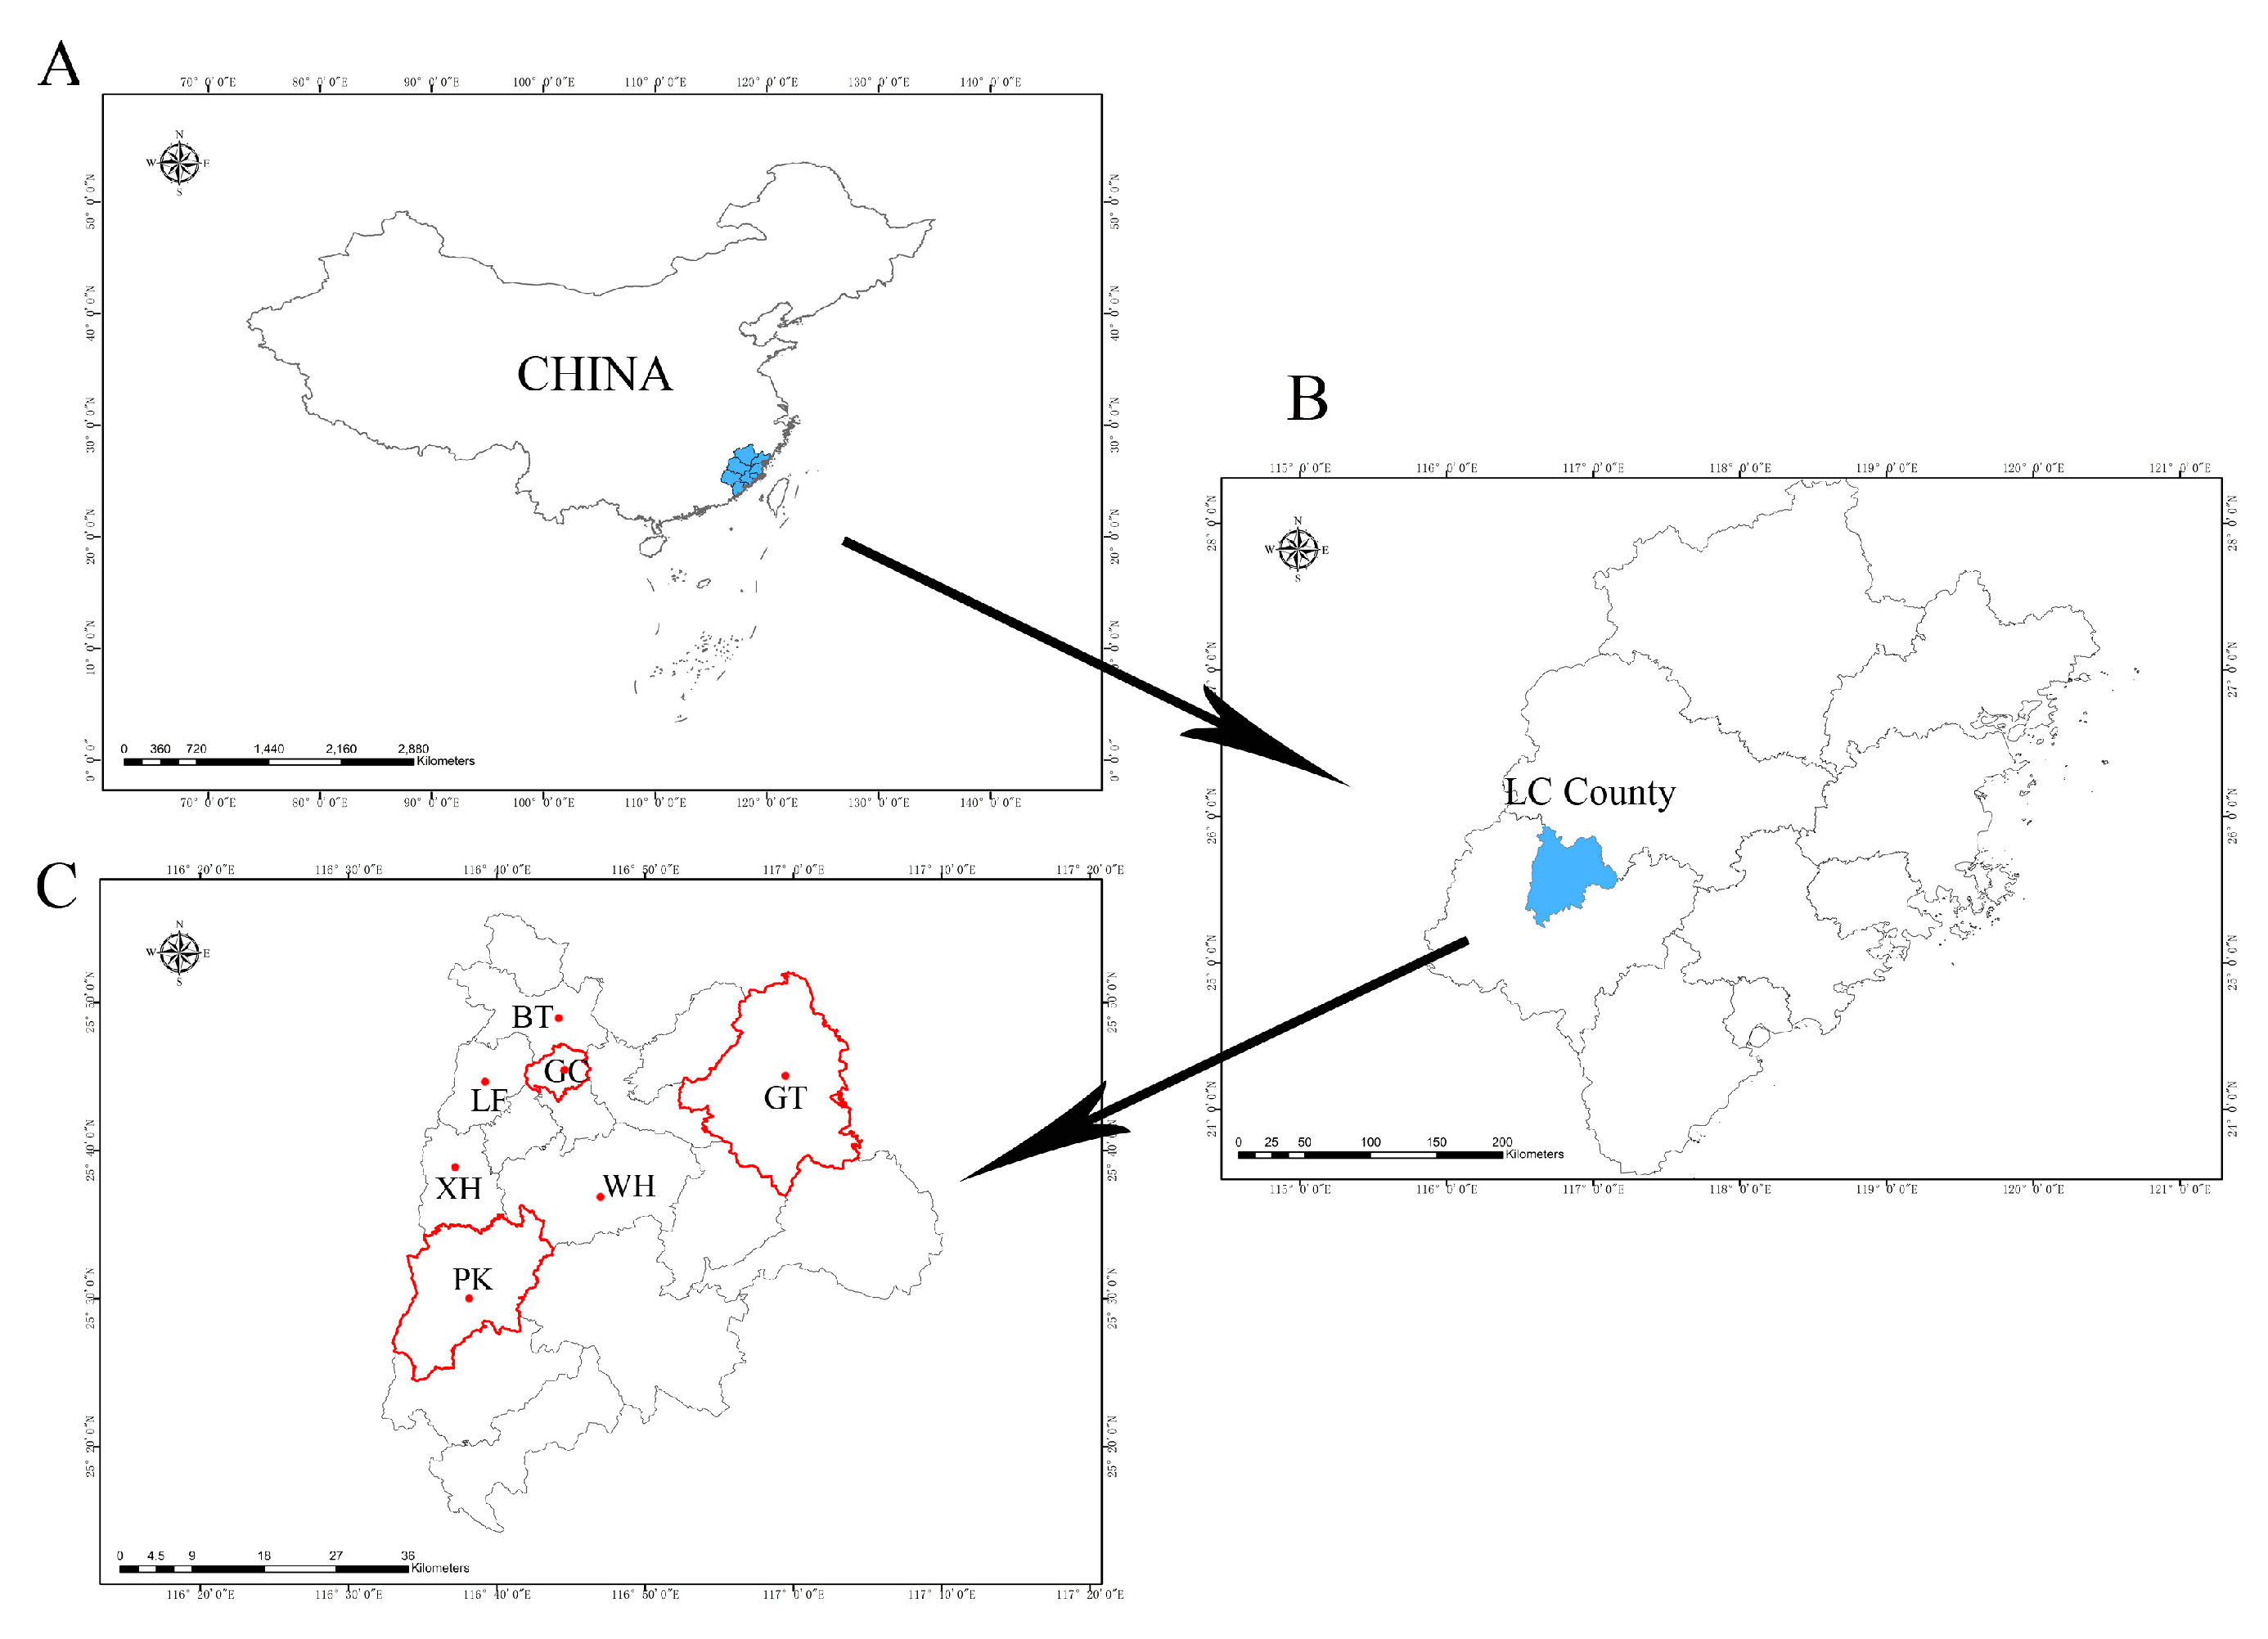
2.1. Geological Descriptions of Lianchen (LC) County

The weathering crust of the Sanming and Longyan palaeogulfs developed yellow–red and calcareous soils. Carbon dating by 14C indicated that the soils originated between 140 and 275 million years ago (MYA), and they contained high amounts of Ca and Mg. The calcareous layers of the deeper weathering crust were dated to 275–330 MYA. LC County is located in southwestern Fujian Province (Figure 1B,C, 25°13′–25°56′ N and 116°32′–117°99′ E) with a total area of 2571.4 km2. The mean summer and winter temperatures are 37 °C and 3–4 °C, respectively, with an annual precipitation of 1700 mm. Connecting the southern part of the Wuyisan and Poping Mountains, there is a mountain valley, which was created by the uptrend of the Minjiang and Saxi Rivers. The basin of Beituan (BT) faces north and forms a mountain valley of agricultural land. These agricultural soils are predominantly covered by Saxian (SX) purple–red soils, containing high amounts of selenium, rare earth elements, and some heavy metals. The hydrological regime is largely mesic, although the area is prone to some drought events. The Gutian (GT) and Quxi (QX) townships, located on the slopes of the Saxi River valley, benefit from precipitation during the monsoon season. However, the western part of Fujian Province, the Meihuasan natural conservation district, is covered by Hetian (HT) red soils, containing approximately 35% quartz sand. Thus, soil erosion is a serious issue in this district [28]. In LC County, agricultural production is the major economic activity.

2.2. Rice Cultivation Trial Design

2.2.1. Cultivars

Seven commonly planted rice varieties (Oryza sativa L.) were used, including one hybrid Indica cultivar of Jinliangyou 289 (JLY289) and six Indica conventional rice cultivars, Xinyinzhan (XYZ), Wushansimiao (WSSM), Hongbaoshi (HBS) (red rice), Huanhuazhan (HHZ), Yuxiangzhan (YXZ), and Jinnon 313 (JN313).

2.2.2. Main Cultivar Field Trial

The field study was conducted in cooperation with local farmers. In LC County, three main rice cultivars were selected and planted in three different villages: XYZ in the GT village (25°42.475′ N, 116°57.374′ E), WSSM in the GC village (25°45.261′ N 116°44.916′ E), and HBS in the PK village (25°33.856′ N 116°39.17′ E) (Figure 1). Each test field was 2 acres or approximately 0.133 ha in triplicate. The basic agricultural farming system in this region is a crop rotation of tobacco and rice.
Rice seedlings were grown to a size of 20 cm × 23 cm and then transplanted into farms in July and harvested at the end of October and beginning of November 2013. At the booting stage (25–35 days (d) after transplanting) and the filling stage (90–125 d after transplanting), five samples of growing crops were collected in each field for chemical analysis. Soil samples (0–20 cm) were collected before the transplanting of rice seedlings and after the harvest in five pots for each field, and their Se, heavy metal (Cd, Zn, and Pb), and rare earth element (La, Ce, and Nd) concentrations were analysed. All experiments were performed in triplicate.
A total of 9.47 kg ha−1 NH4HCO3 (approximately 60% of N), 6.67 kg ha−1 superphosphate (approximately 100% of P2O5), and 0.40 kg ha−1 KCl (approximately 50% of K2O) were applied as base fertilizers. In addition, 0.29 kg ha−1 urea (approximately 20% of N) and 0.40 kg ha−1 KCl were applied during the filling stage, and 0.29 kg ha−1 urea was used during the earing stage as an additional fertilizer. The resultant N:P:K ratio was 1:0.3:0.7.

2.2.3. Verify Trial

For checking the bioaccumulation differences of Se, heavy metals, and rare earth elements between brown rice and husk, the samples of harvest husk, brown rice, and surface soils (0–20 cm) were also collected from different farmers in rice growth locations for comparison, as follows: at BT village, (a) JLY289, (b) HHZ; at the GT village, (c) HBS; at the GC village, (d) XYZ, (e) YXZ, (f) WSSM, (g) JN313; and at the PK village, (h) XYZ. All experiments were carried out in triplicate. Sampling and element analysis methods were the same as in Section 2.2.2. The bioaccumulation factor of elements between plant tissue (husk and brown rice) and soil was calculated as (elemental concentrations in plant tissue)/(elemental concentrations in soil).

2.3. Laboratory Analyses

2.3.1. Harvest and Analysis of Rice Plant Tissues

Rice plants that were planted at the booting and filling stages were separated into roots, stems, leaves, husks, and brown rices. Plants were thoroughly washed in double deionized water (DDW), and after drying at 70 °C for three days, the dry weights of the aerial portion of the five plants in each field were measured.
The plant tissues were pulverized into a powder, and a sample of each different rice plant tissue (0.1–0.2 g) was digested in HNO3/hydrogen peroxide (H2O2) in heating blocks [29]. Before digestion, the acidic suspension was incubated overnight at 25 °C. After digestion, the sample solution was dried and dissolved in 0.5 M HNO3, filtered through a Millipore filter (0.22 μm), and then stored in plastic bottles for subsequent analysis. The digested solutions were used to determine the concentration of Se, heavy metals (Cd, Zn, Pb), and rare earth elements (La, Ce, and Nd) via inductively coupled plasma–optical emission spectrometry (ICP–OES, Perkin Elmer, Optima 2000DV, New York, NY, USA). A certified reference material of the plant sample (CRM, NSC DC 73349) was used to verify the accuracy of the digestion methods and elemental analysis. All elemental analyses were performed in triplicate.

2.3.2. Soil Analyses

Surface paddy soils (0–20 cm) were air-dried, ground, and passed through a 2 mm sieve and stored in plastic bottles for further studies. Soil pH was measured via a Thermo Orion pH meter (Model 868) with a combined glass electrode at a soil-to-water ratio of 1:10. The cation-exchange capacity (CEC) of the tested soils was determined using the ammonium acetate method buffered at a pH of 7 [30]. Exchangeable K, Na, Ca, and Mg and available N, P, and K were determined according to the Jackson method [31]. Soil organic matter was determined via the K2Cr2O7 wet oxidation method [32]. The soil particle-size (<2 mm fractions) distribution was determined via the pipette method after hydrogen peroxide treatments [33]. One gram of soil was digested by aqua regia solution (3:1 concentrated HCl/HNO3 solution), and the concentrations of Se, the heavy metals (i.e., Pb, Zn, and Cd), and the rare earth elements (i.e., La, Ce, and Nd) were determined via ICP–OES. A soil sample with certified concentrations of Cd, Pb, and Zn (GBW07407) was provided by the China National Center for Standard Materials and used as a reference for quality control. The Cd, Pb, and Zn recoveries of the reference soils were between 93 and 108, 82 and 120, and 90 and 115%, respectively.

2.3.3. Sequential Extraction of Soil Se, Heavy Metals and Rare Earth Elements

The procedures of sequential extraction were established by Tessier et al. [34]. Their technique was used with modifications to determine the distributions of Se, the heavy metals (Cd, Zn, and Pb), and the rare earth elements (La, Ce, and Nd) in different soil fractions. Soil samples (2.00 g) contaminated with Se, heavy metals (Cd, Zn, and Pb), and rare earth elements (La, Ce, and Nd) were placed in 50 mL centrifuge tubes, and 20 mL of the extraction reagents were added sequentially. Continuous agitation was maintained throughout the appropriate time intervals. Between each successive extraction step, the solution was separated from the solid phase by high-speed centrifugation (10,000 rpm, 30 min) and then filtered through 0.45 μm filter paper (Whatman 42). The residue was washed with 10 mL of DDW and then used for the subsequent extraction steps. The washes were collected, centrifuged, and analysed with supernatant from the previous fraction. Extracts were stored in a refrigerator at 4 °C until analysis. Since some Se, heavy metals (Cd, Zn, and Pb), and rare earth elements (La, Ce, and Nd) (extracted in F1 and F2) are relatively more mobile, the “available” form discussed later provides information on the potential mobility as well as the availability of Se, heavy metals (Cd, Zn, and Pb), and rare earth elements (La, Ce, and Nd). The concentrations of available Se, heavy metals (Cd, Zn, and Pb), and rare earth elements (La, Ce, and Nd) are equal to the sum of F1 and F2 (Table 1). The extractants of sequential fractions of F3, F4, F5, and F6 are shown as the procedure by Tessier et al. [34] (Table 1).

2.4. Statistical Analyses

Differences in the values of these parameters between different experiments were tested using one-way analysis of variance (ANOVA), Pearson relation analysis, and the least significant difference (LSD) test. The Se, Cd, Zn, Pb, La, Ce, and Nd concentrations in plant tissues and soils were determined using the statistical program SPSS 18.0. Differences among treatments were separated by the LSD test at the p < 0.05 level.

3. Results

3.1. Total Soil Se, Heavy Metals, and Rare Earth Elements

The soil pH of GT, GC, and PK ranged from 5.3 to 6.3, and the moist soil colour ranged from 2.5YR4/1 to 5YR6/2 [35] (Table 2). The range of cation-exchange capacity (CEC) and base saturation was from 6.9 to 8.8 cmol kg−1 and 28.4 to 47.8%, respectively. The soil organic matter (OM) and total nitrogen (TN) concentrations ranged from 32.0 to 43.5 g kg−1 and 1.6 to 2.1 g kg−1, respectively. The soil textures were categorized as silty loam and silty clay loam and classified as mesic, thermic, mixed, loamy, and Typic Hapludox [36].
The total soil Se, Cd, Zn, Pb, La, Ce, and Nd concentrations are summarized in Table 3. The selenium concentrations of the soils were in the following range: GC ≥ GT ≥ PK. The cadmium (Cd) concentrations of the soils showed the following trend: GT = GC ≥ PK. However, the Zn, Pb, La, Ce, and Nd concentrations of the soils showed the following trend: GT > PK > GC.

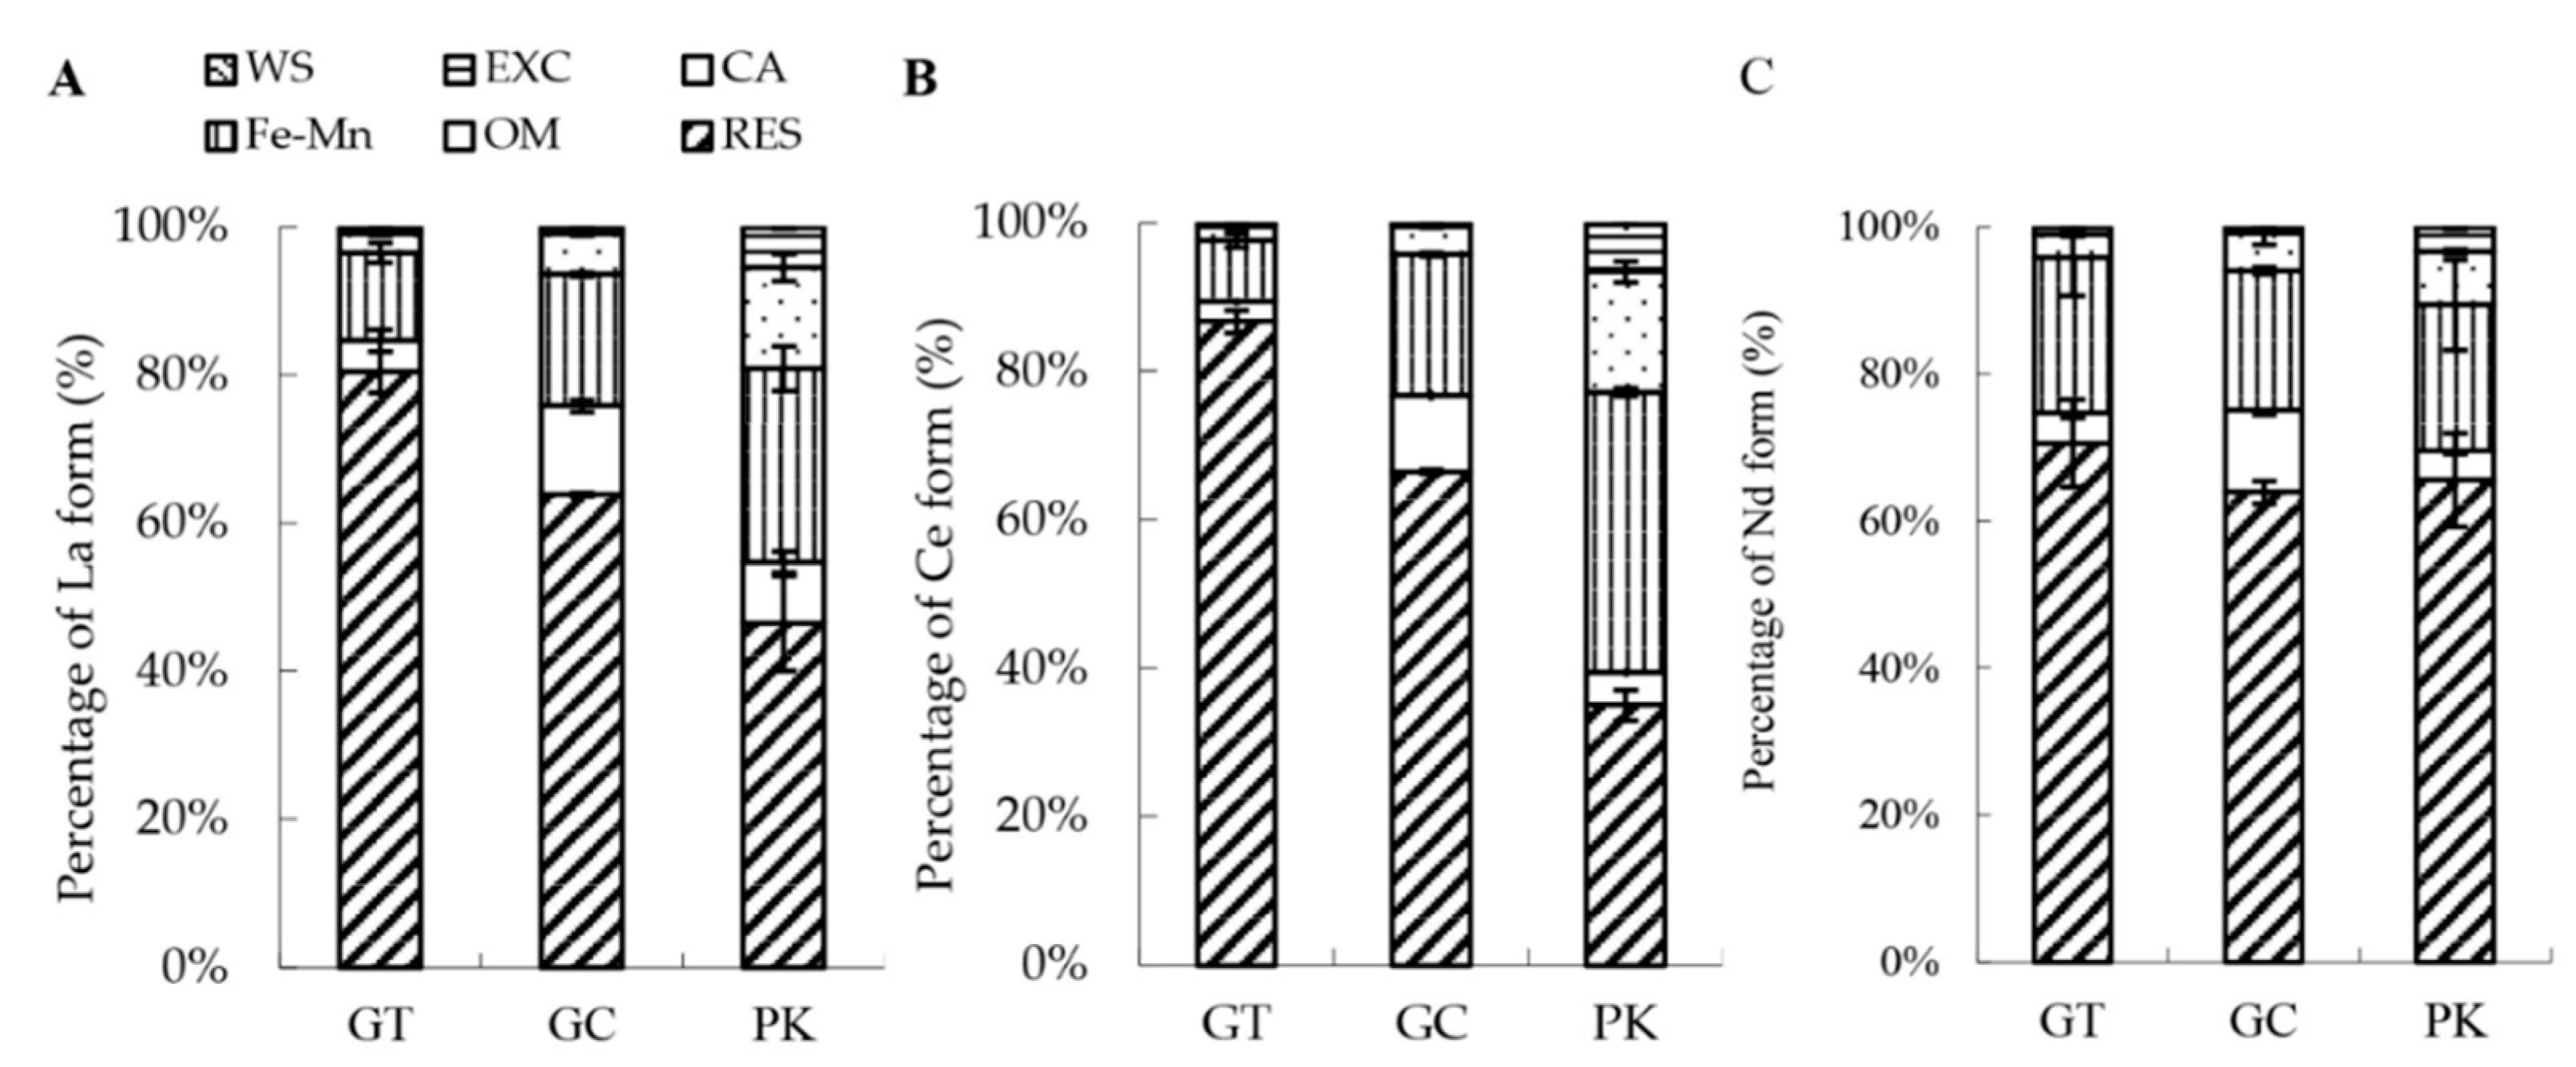
3.2. Sequential Extraction of Soil Se, Heavy Metals, and Rare Earth Elements

In general, sequential extraction of Zn, Pb, La, Ce, and Nd in soil showed the following trend: F6 > F4 >F5 F3 > F2 > F1 with different soils (i.e., GT, GC, and PK villages) (Figure 2). The sequential fraction of the BT village soil displayed a similar trend. The residual portions (F6%, percentage of elements to their total elemental concentrations) were the dominant fractions for Zn, Pb, and the rare earth elements. The water-soluble (F1%, i.e., < 0.186% Zn, < 0.561 Pb, < 0.127% La, < 0.228% Ce, < 0.118% Nd) and exchangeable fractions (F2%, <1.068% Zn, < 0.859% Pb, < 0.462% La, < 6.690% Ce, < 2.564% Nd) were the lower content fractions. The behaviour of Cd was similar to that of calcium. Cadmium distribution with sequential extraction did not follow the trend of the other heavy metals and rare earth elements and showed random distribution under paddy soil conditions. Since water-soluble and exchangeable Cd forms (i.e., F1%, < 12.905 and F2%, < 23.645%) are relatively more mobile, the “available” form provides information on the potential mobility as well as the availability of Cd.

3.3. Se, Heavy Metals, and Rare Earth Elements in the Rice Tissues

The rice root Se concentrations ranged from 0.2 to 0.5 mg kg−1, with a significantly higher HBS Se concentration in the filling stage than those in the other cultivars or stages (Table 4). The rice stem Se concentration ranged from 0.2 to 0.4 mg kg−1, with a significantly higher WSSM Se concentration in the booting stage than those in the other cultivars or stages. The rice leaf Se concentration and husk Se concentration ranged from 0.2 to 0.3 mg kg−1. However, the brown rice Se concentration performed 0.0 mg kg−1, which was significantly lower than those in other tissues.
For heavy metals, Cd, Zn, and Pb concentrations, the following trend was shown: root > stem > leaf > husk > brown rice, with the exception of the Cd concentrations in HBS, which showed the following trend: stem > root > leaf > husk > brown rice. Brown rice Cd, Zn, and Pb concentrations ranged from 0.0–0.2, 7.5–20.7, and 0.0–1.0 mg kg−1, respectively; these values were lower than the Chinese food safety standard (CFSS).
For the rare earth elements, La, Ce, and Nd concentrations ranged as root > stem = leaf = husk > brown rice, and La, Ce, and Nd concentrations of rice tissues in the filling stage differed by location as PK > GT > GC (Table 4). However, the La, Ce, and Nd concentrations in the soil ranged from GT > PK > GC (Table 3). Overall, the concentrations of the rice cultivars differed; the brown rice La, Ce, and Nd concentrations of HBS in PK were under the minimum detected limit, the brown rice Nd concentrations of the three locations were under the minimum detected limit, and the brown rice La and Ce concentrations of JZY in GT and WSSM in GC were 0.0 mg kg−1 (Table 4).

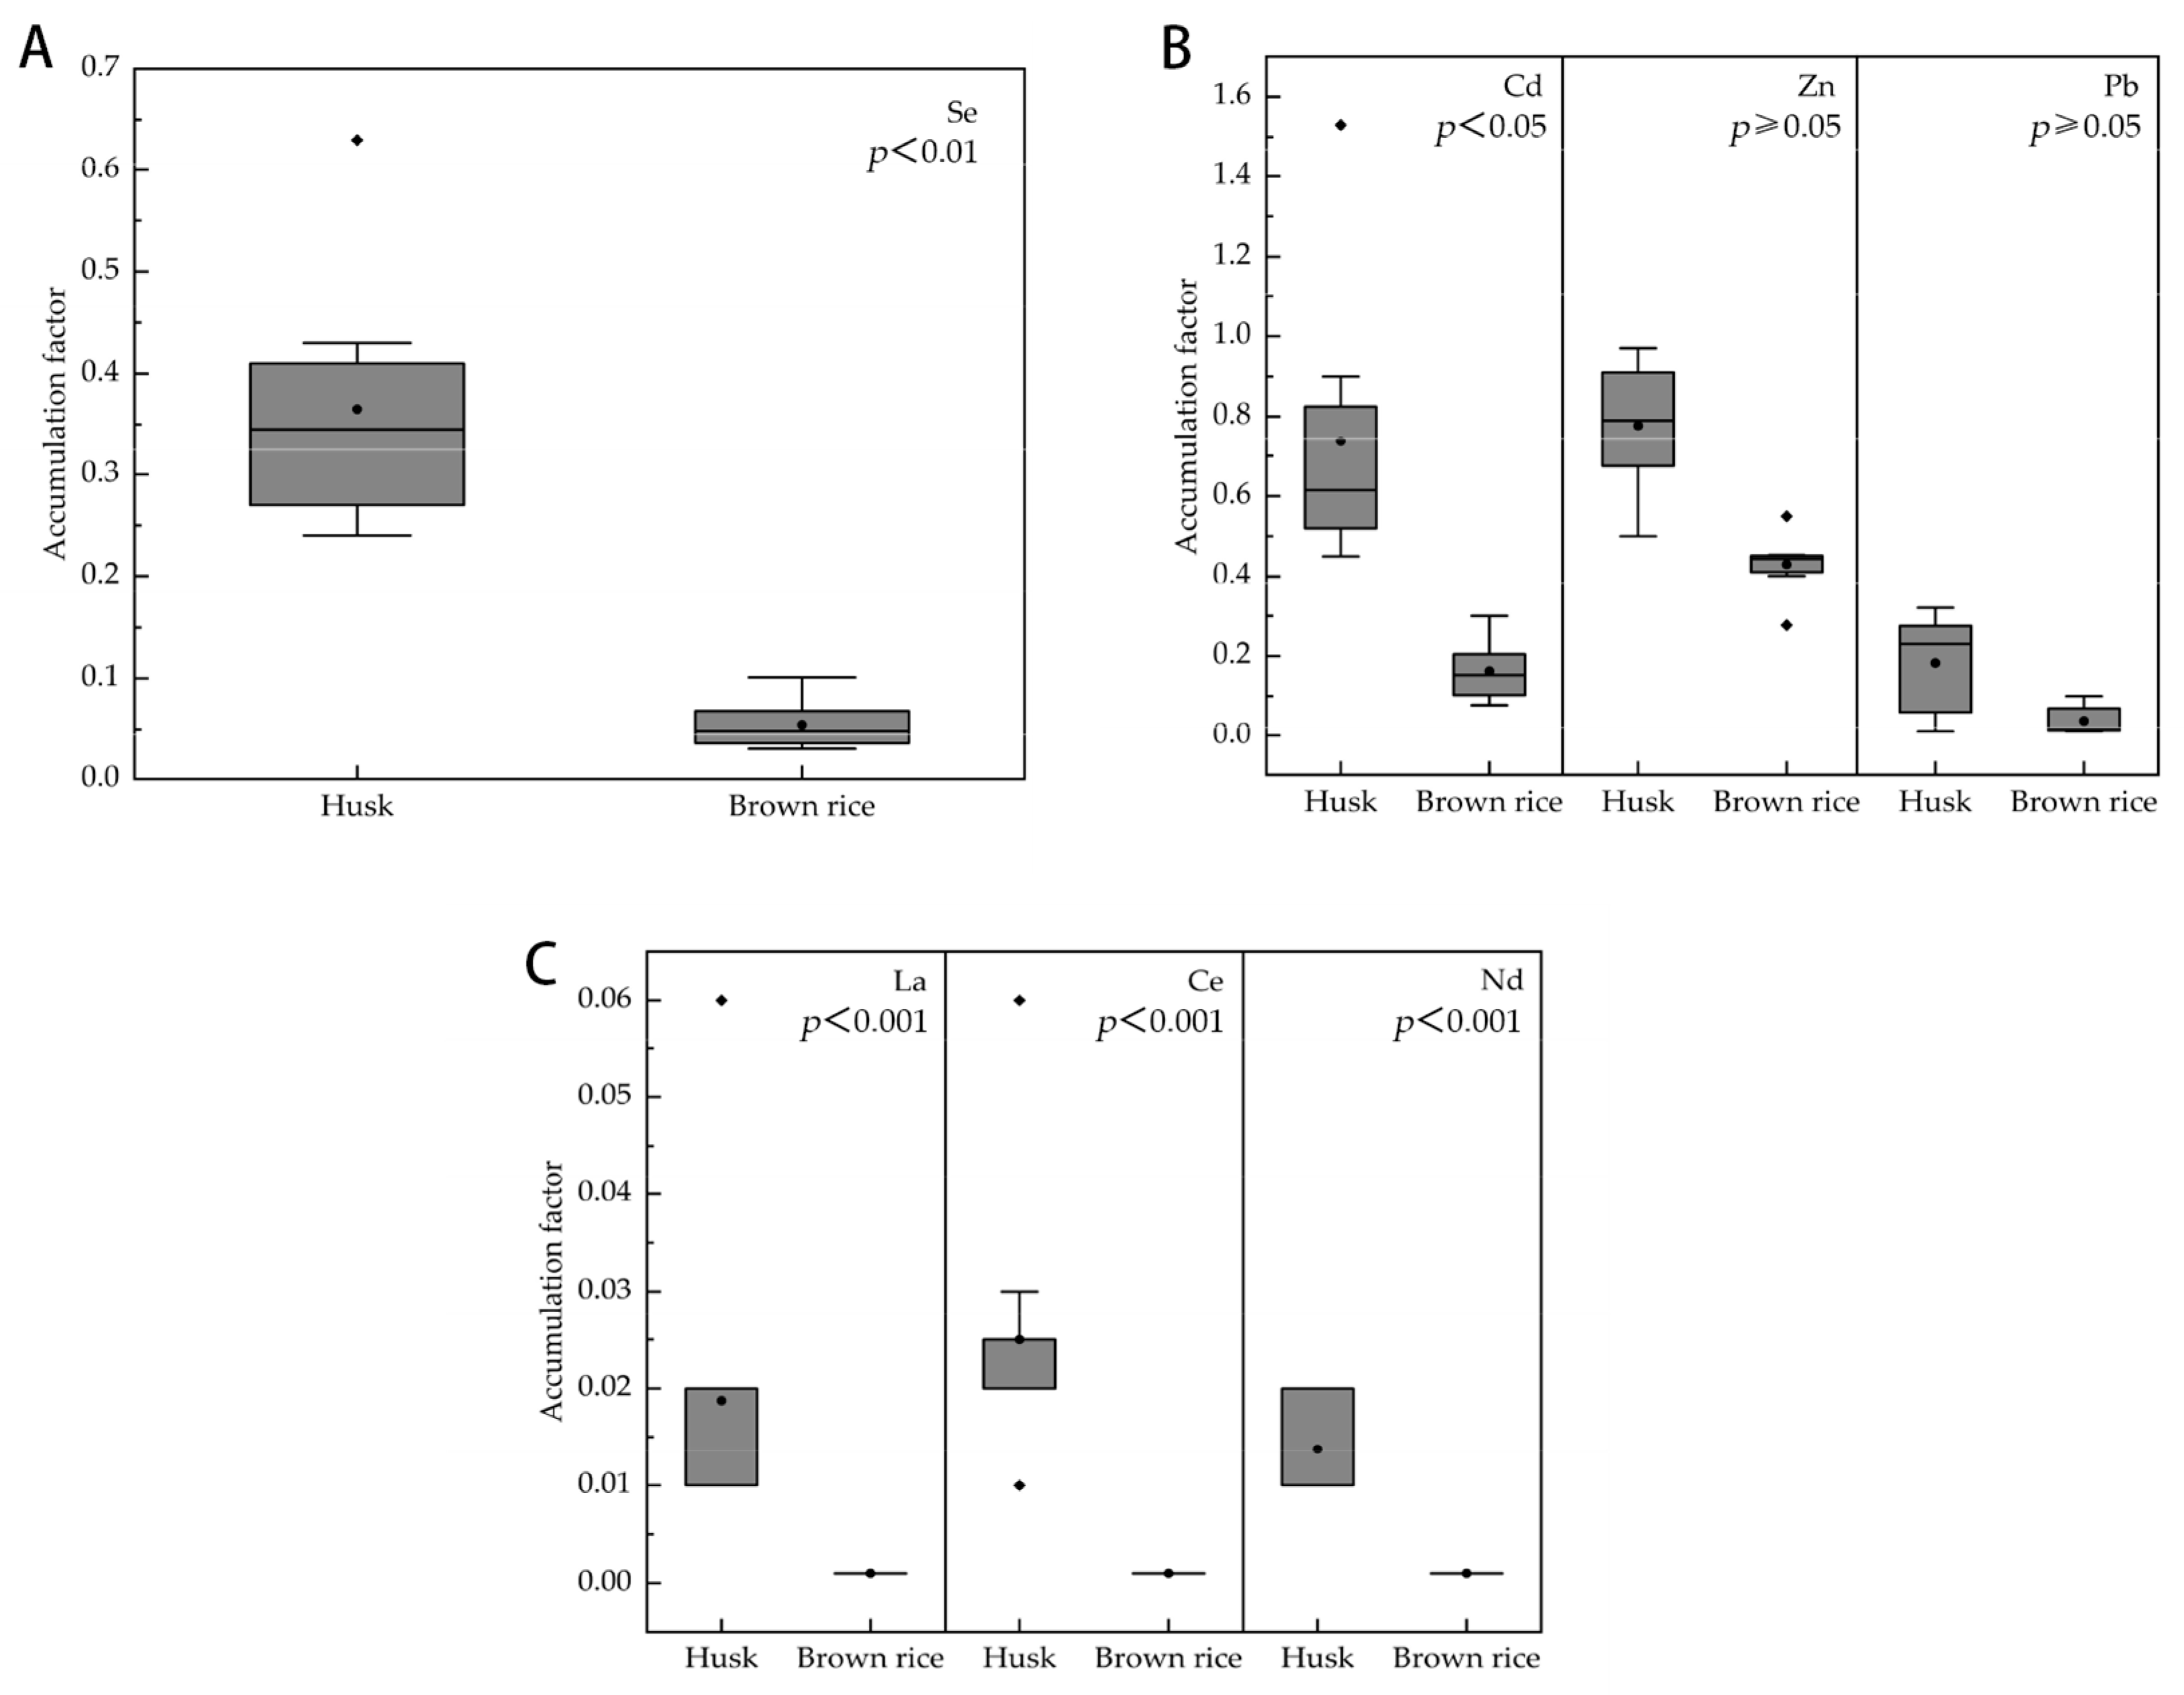
3.4. Accumulation of Se, Heavy Metals, and Rare Earth Elements in the Rice Tissues

The accumulation factors of Se in rice roots, stems, leaves, and husks ranged from 0.19 to 0.68, which was higher than that in brown rice (0.02–0.04), with significant differences in tissues (p < 0.01) (Figure 3 and Table 5). The accumulation factors of Cd in rice roots, stems, leaves, and husks ranged from 0.26 to 4.96, which was higher than those of brown rice (0.07–0.39). Notably, the Cd accumulation factor in brown rice was significantly lower than that in husks (p < 0.05) (Figure 4). The accumulation factors of Zn in rice roots, stems, leaves, and husks were in the range of 0.31 to 3.28, which was higher than those in brown rice (0.01–0.42). In addition, the accumulation factors of Pb in rice roots, stems, leaves, and husks ranged from 0.01 to 1.50, which was higher than those in brown rice (0.01–0.05), with significant differences in tissues (p < 0.05). However, the accumulation factors of rare earth elements (La, Ce, Nd) in brown rice were below the minimum detected limit (MDL, 0.001 mg kg−1) and were significantly lower than those in other tissues (i.e., p < 0.05 or p < 0.001) (Figure 3). The accumulation of heavy metals and rare earth elements in brown rice were prevented in the husks (Figure 4).
Accumulation factors differed concerning different cultivars and locations. The Se, Pb, La, Ce, and Nd bioaccumulation factors of the HBS at PK were higher than those of WSSM at GC and XYZ at GT. Characteristically, during rice plant growth, the HBS rice cultivar produced more root hairs and had finer roots than the WSSM and XYZ rice cultivars. However, more Cd and Zn was accumulated in WSSM at GC than those of XYZ at GT areas.

4. Discussion

4.1. Se, Cd, Zn, Pb, La, Ce, and Nd Concentrations in Soils and Plant Tissues

These agricultural soils were predominantly covered by the SX purple red soils, containing high amounts of selenium, rare earth elements, and some heavy metal elements, and belonged to the HT red soils [28]. Rice cultivars grew normally; the seasonal yield of the XYZ rice cultivar planted in the GT village was 6226 kg ha−1, and the yields of the WSSM planted in the GC village and HBS planted in the PK village were 6140 and 5334 kg ha−1, respectively.
In LC County, Se coexisted with the highly toxic heavy metals and rear earth elements. For example, Fan et al. found that Se coexisted with Cd in paddy soil with a significant positive correlation in southern Jiangsu Province, China [37], and Gao et al. found that Cd had an antagonistic effect with Se [38]. Thus, similar Cd concentration ranges in our study have been reported in the paddy soil (mean value of 0.4 mg kg−1) in Hubei, with higher concentrations than those in Hunan and Jiangxi, China [39]. Furthermore, the total concentration of La, Ce, and Nd in soils was 33.4–483.1 mg kg−1 in LC county (Table 3), with approximately 70% of the total concentration of all rare earth elements (TREEs); these were higher amounts than those of schist-derived soils in China [40], andesite-derived soils in Puerto Rico [41], and shale-derived soils in China [42]. The highest ΣREEs were observed in the schist pedon (253–319 mg kg−1), followed by the andesite pedon (239–277 mg kg−1), mafic pedon (243–254 mg kg−1), and shale pedon (195–222 mg kg−1) in Taiwan [15]. Thus, it is important to maintain a healthy concentration of Se and avoid toxic concentrations of heavy metals and rare earth elements.
In general, Zn, Pb, La, Ce, and Nd uptake by plant tissues was ranked as root > stem > leaf > husk > brown rice in both the booting and filling stages, with the exception of Se and Cd (Figure 3). Overall, all the elemental concentrations of brown rice were much lower than those of other tissues. However, Kong et al. found that although the heavy metal content in paddy soil exceeded the acceptable levels, the heavy metal content of brown rice did not exceed that of the CFSS [43].
There were differences in the bioaccumulation factor of rice cultivars at the locations; the GC village of WSSM rice accumulated more Cd and Zn than those of the GT XYZ cultivar areas potentially due to the ionic radii of the elements and their forms that exist in the soils (Table 4). Thus, the rice cultivar XZY planted in the GT area accumulated lower elemental concentrations than the other cultivars (Table 5). Accumulation factors of heavy metals differed in the rice cultivars in the study by Yan et al. [44]. Bioaccumulation of Cd in the GT (XYZ) and GC (WSSM) rice cultivars followed the order of root > stem > leaf > husk > brown rice, with the exception of the PK (HBS cultivar) rice. Research by Wu et al. showed that Cd in rice had a higher carcinogenic risk to adults and children than other heavy metals in the Wanjiang economic zone, Anhui Province [45].
Brown rice contains low amounts of Se, heavy metals, and rare earth elements, and these elements accumulate on the husk (Table 6 and Figure 4), which differed from the results of Shen et al. [46]. Bioaccumulation of the total heavy metals and rare earth elements during rice growth at the filling stage was greater than that at the booting stage, except for Se (Figure 3). The selenium concentrations in the brown rice were 0.0 mg kg−1; however, Cd concentrations in the brown rice ranged from 0.0 to 0.2 mg kg−1. The PK (HBS cultivar) rice (husk + brown rice) took up the highest amounts of Se (2.3 mg kg−1), and the GT (XYZ) rice cultivar accumulated the lowest amounts of Se (0.2 mg kg−1). On the other hand, the brown rice of the GC (WSSM cultivar) contained the lowest amounts of Cd (0.0 mg kg−1), and the brown rice of the PK (HBS) rice cultivars accumulated the highest amounts of Cd (0.2 mg kg−1). Although the Se and Cd concentrations in brown rice were below the levels stipulated by the National Food Security for brown rice (i.e., < 0.03 mg kg−1 for Se; < 0.20 mg kg−1 for Cd), the HBS rice cultivar (red rice) accumulated higher amounts of Se and Cd than the other rice cultivars because the HBS rice cultivar produced more root hairs and had finer roots. Almost no traces of rare earth elements were found in the brown rice, although the soil samples contained high amounts of the rare earth elements La, Ce, and Nd. The high atomic numbers of rare earth elements have a large ionic radius, and the substances could not be transferred into brown rice and accumulate in the husk except at a low accumulation level. Brown rice did contain certain amounts of Zn and low quantities of Pb.
The selenium (Se), heavy metal (Cd, Zn, Pb), and rare earth element (La, Ce, Nd) concentrations in husks, brown rice, and soils planted in different soils with various rice cultivars are shown in Table 6. All elemental concentrations in the soils and plant tissues showed large-scale spatial and temporal variation, even within the same cultivar planted at different locations. For example, the XYZ rice cultivar planted in the GC and PK villages accumulated different amounts of elements in its plant tissues (Table 6). The Pearson correlations of Se between soils and rice plant tissues in the booting and filling stages are listed in Table 7. Soil Se correlated with the Se levels found in the root, stem, leaf, husk, and brown rice, and in the filling stage, a significant negative correlation was observed. However, only strong negative correlations with root and stem tissues were observed in the booting stage. The selenium concentrations in the leaves of the booting stage plants showed a poor correlation with different rice plant tissues in the filling stage.
Bioaccumulation levels of Se, heavy metals, and rare earth elements are also related to the physiology of different rice cultivars. Selenium is a metalloid element, and Se(0), Se(IV), Se(VI), and organic-bound Se of different valences show different distribution amounts of Se within different plant tissues and not in a systematic order. This phenomenon governs the soil redox potential, pH, and the form of Se species in the soil, as well as field conditions and plant species. Under submerged conditions, a reduced type of Se was the predominant species. Table 6 also shows that the different rice cultivars accumulated different amounts of Se, heavy metals, and rare earth elements in the husk and brown rice, showing a biodiversity effect.

4.2. Bioaccumulation of Se, Cd, Zn, Pb, La, Ce, and Nd within Different Plants and Soils

The highest accumulation of these elements occurred in the grain husk or vegetable peels. The accumulation factor of rare earth elements was low in all plants due to their large ionic radii, their insolubility, and being in their exchangeable forms in the soils of China [17]. All Se concentrations in the irrigation water were less than 0.005 mg L−1.
Since the seleniferous red soils in this southern part of China also contain heavy metals and rare earth elements, the optimum selection of crops planted in these types of seleniferous paddy soils is necessary for food safety. Edible crops of the Cruciferous (i.e., broccoli, onion, garlic, and mustard) have high Se and sulfur requirements, tend to absorb large amounts of Se or heavy metals and/or rare earth elements [9,47], and are not recommended for cultivation in these types of seleniferous paddy soils. Moreover, most heavy metals and rare earth elements accumulated in the rice roots, stems, leaves, and husk, with the exception of brown rice, supporting the research of Kong et al. [43]; this result was potentially due to their large ionic radii, their lower water solubility and being in exchangeable phases in soils. Beyond rice growth, the selection of optimum crop cultivars (i.e., tea, flowers, fruit with peel or a shell) is recommended for planting in these seleniferous agricultural lands. Further detailed studies are needed for peanut and yam.

4.3. Sequential Extraction of Soil Se, Heavy Metals, and Rare Earth Elements

In general, sequential extraction of soil Zn, Pb, La, Ce, and Nd showed the following trend: F6 > F4 >F5 F3 > F2 > F1 with different soils (i.e., GT, GC, and PK villages) (Figure 2). The sequential fraction of the BT village soil displayed a similar trend. The F6 of residual portions (%, percentage of elements to their total elemental concentrations) were the dominant fractions for Zn, Pb, and rare earth elements. The water-soluble (F1%, i.e., <0.186% Zn, <0.561 Pb, <0.127% La, <0.228% Ce, <0.118% Nd) and exchangeable fractions (F2%, <1.0675% Zn, <0.859% Pb, <0.462% La, <6.69% Ce, <2.564% Nd) were the lower content fractions. The behaviour of Cd was similar to that of calcium. Cadmium distribution with sequential extraction did not follow the trend of the other heavy metals and rare earth elements and showed random distribution under paddy soil conditions. Since water-soluble and exchangeable Cd forms (i.e., F1%, <12.905 and F2%, <23.645%) are relatively more mobile, the “available” form could provide information on the potential mobility as well as the availability of Cd. Cadmium in soils and sediments could readily form CdCO3 and CdS precipitates [19,21] and was easily bound with Fe-Mn-oxide (F4) fractions. On the other hand, the Cd, Zn, Pb, La, Ce, and Nd concentrations of postharvest soils were lower than those of the original soil samples due to the plant tissue uptake of the elements.
Although the original total soil Se concentrations ranged at 0.8 mg kg−1 in GT, GC, and PK soil (Table 3), there were trace amounts of Se in the F1-F6 fractions with a minimum detected limit (i.e., 0.001 mg kg−1) determined via ICP–OES analysis. This result indicated that the Tessier sequential extraction method [34], suitable for metals but not for oxyanions [48], was not capable of fractionating soil Se. Arsenic (As) and selenium (Se) are metalloid elements. A sequential extraction procedure for As is being created [49,50,51], and further study is needed to determine whether that technique is applicable in Se sequential extraction.
Bioavailability is important to regulate the passage of potentially toxic elements from the soil to the food chain. Furthermore, research into Se compounds in foods, including Se(IV), Se(VI), selenomethionine (SeMet), selenocysteine (SeCys), and se-(methyl) selenocysteine (Se-MeSeCys), needs to be thoroughly analysed by using ion-pair reversed-phase and anion-exchange chromatography ICP–MS and ESI–MS, and the determination of the potential bioavailability of Se with a different method, such as Wenzel extraction [49], would be a good addition.
There are a number of reports concerning the alleviation of abiotic stresses with biochar and silicon amendments during rice growth [52,53,54]. Further studies in these seleniferous red soils in regard to food security and risk assessments are merited.

5. Conclusions

The accumulation factors of Se, Cd, Zn, and Pb in rice roots, stems, leaves, and husks were higher than those in brown rice. Furthermore, the accumulation factors of the rare earth elements (La, Ce, Nd) in brown rice were under the minimum detected limit and were significantly lower than those in other tissues. Evidently, the Se, heavy metal, and rare earth element transit paths of rice husk and brown rice were different. Our study provides guidance for research on transshipment and segmentation carriers.
Hongbaoshi (HBS) of conventional Oryza sativa L. ssp. Indica rice grown in the PK village can accumulate more Se, heavy metals, and rare earth elements in their plant tissues than the Xinyinzhan (XYZ) and Wushansimiao (WSSM) rice cultivars; thus, the Hongbaoshi (HBS) rice cultivar is not recommended for cultivation in these seleniferous soils.
Under flooded conditions during rice growth and through the drainage of the flooded fields during the rice harvest, the wetting and drying cycles caused and exchanged the soil element concentrations between the fractions of F1, F2, F3, F4, F5 and F6.

Author Contributions

Conceptualization, M.W., M.C. and J.C.; methodology, M.W.; rice cultivation and sample collection, M.C., and J.C.; sampling test, X.L. (Xianyong Lu); data analysis and figure revision, X.L. (Xuhui Luo) and H.W.; writing—original draft preparation, M.W.; writing—review and editing, X.L. (Xuhui Luo) and M.W.; project administration, M.W. and X.L. (Xuhui Luo). All authors have read and agreed to the published version of the manuscript.

Funding

This study was supported by innovation team founation of Fujian Academy of Agriculture Sciences (CXTD2021009-1), central government links to promote the rural revitalization subsidy (202204) and financial support of grant MinFinIndex (2013) 1464.

Data Availability Statement

The datasets generated and analysed during the current study are available from the corresponding author upon reasonable request.

Conflicts of Interest

The authors declare no conflict of interest.

References

  1. Anderson, M.S.; Lakin., H.W.; Beeson, K.C.; Smith, F.F.; Thacker, E. Selenium in agriculture. In USDA Agric. Handbook 200; US Gov. Print Office: Washington, DC, USA, 1961. [Google Scholar]
  2. Carey, A.M.; Lombi, E.; Donner, E.; De Jonge, M.D.; Punshon, T.; Jackson, B.P.; Guerinot, M.L.; Price, A.H.; Meharg, A.A. A review of recent developments in the speciation and location of arsenic and selenium in rice grain. Analy. Bioanaly. Chem. 2012, 402, 3275–3286. [Google Scholar] [CrossRef] [PubMed]
  3. Carey, A.M.; Scheckel, K.G.; Lombi, E.; Newville, M.; Choi, Y.S.; Noron, G.J.; Price, A.H.; Meharg, A.A. Grain accumulation of selenium species in rice (Oryza sativa L.). Environ. Sci. Technol. 2012, 46, 5546–5557. [Google Scholar] [CrossRef] [PubMed]
  4. Dhillon, K.S.; Dhillon, S.K. Selenium accumulation by sequentially grown wheat and rice as influenced by gypsum application in a seleniferous soil. Plant. Soil. 2000, 227, 243–248. [Google Scholar] [CrossRef]
  5. National Academy of Science-National Research Council (NAS-NRC). Selenium Assembly of Life Sciences; NAS-NRC: Washington, DC, USA, 1983. [Google Scholar]
  6. Malik, J.A.; Goel, S.; Kaur, N.; Sharma, S.; Singh, I.; Nayyar, H. Selenium antagonises the toxic effects of arsenic on mungbean (Phaseolus aureus Roxb.) plants by restricting its uptake and enhancing the antioxidative and detoxification mechanisms. Environ. Exp. Bot. 2012, 77, 242–248. [Google Scholar] [CrossRef]
  7. Fordyce, F.M. Selenium Deficiency and Toxicity in the Environment. In Essentials of Medical Geology; Springer: Berlin, Germany, 2013; pp. 375–416. [Google Scholar]
  8. Fordyce, F.M. Selenium geochemistry and health. Ambio 2007, 36, 94–97. [Google Scholar] [CrossRef] [Green Version]
  9. Shahid, M.; Niazi, N.K.; Khalid, S.; Murtaza, B.; Bibi, I.; Rashid, M.I. A critical review of selenium biogeochemical behavior in soil-plant system with an inference to human health. Environ. Pollut. 2018, 234, 915–934. [Google Scholar] [CrossRef]
  10. Yang, H.; Yang, X.; Ning, Z.; Kwon, S.Y.; Li, M.; Tack, F.M.G.; Kwon, E.E.; Rinklebe, J.; Yin, R. The beneficial and hazardous effects of selenium on the health of the soil-plant-human system: An overview. J. Hazard. Mater. 2022, 422, 126876. [Google Scholar] [CrossRef]
  11. Hooda, P.S. Assessing bioavailability of soil trace elements. In Trace Elements in Soils; Chapter 11; Hooda, P.S., Ed.; John Wiley and Sons Ltd. Publication: Wiltshire, UK, 2010; pp. 229–265. [Google Scholar]
  12. Luo, J.M.; Ye, Y.J.; Gao, Z.G.; Wang, Y.J.; Wang, W.F. Trace element (Pb, Cd and As) contamination in the sediments and organisms in Zhalong Wetland, Northeastern China. Soil. Sedim. Contamin. 2016, 25, 395–407. [Google Scholar] [CrossRef]
  13. Mihajlovic, J.; Bauriegel, A.; Stark, H.J.; Roßkopf, N.; Zeitz, J.; Milbert, G.; Rinklebe, J. Rare earth elements in soil profiles of various ecosystems across Germany. Appl. Geochem. 2019, 102, 197–217. [Google Scholar] [CrossRef]
  14. Feitosa, M.M.; da Silva, Y.J.A.B.; Biondi, C.M.; Alcantara, V.A.; do Nascimento, C.W.A. Rare Earth elements in rocks and soil profiles of a tropical volcanic archipelago in the Southern Atlantic. Catena 2020, 194, 104674. [Google Scholar] [CrossRef]
  15. Wu, C.; Hseu, Z. Pedochemical behaviors of rare earth elements in soil profiles along a lithosequence in eastern Taiwan. Catena 2023, 225, 107047. [Google Scholar] [CrossRef]
  16. Cao, X.; Wang, X.R.; Zhao, G.W. Assessment of the bioavailability of rare earth elements in soils by chemical fractionation and multiple regression analysis. Chemosphere 2000, 40, 23–28. [Google Scholar] [PubMed]
  17. Chen, H.M. Behavior of Chemical Matter and Environmental Mass of Soils; Scientific Publishers: Beijing, China, 2002; p. 663, (In Chinese with English abstract). [Google Scholar]
  18. Zhao, F.J.; Ma, Y.B.; Zhu, Y.G.; Tang, Z.; McGrath, S.P. Soil contamination in China: Current status and mitigation strategies. Environ. Sci. Technol. 2015, 49, 750–759. [Google Scholar] [CrossRef] [PubMed]
  19. Alloway, B.J. Soil processes and the behavior of metals. In Heavy Metals in Soils; Alloway, B.J., Ed.; Blackie Academic and Professional: Glasgow, UK, 1990; pp. 11–37. [Google Scholar]
  20. Huang, J.H.; Wang, S.L.; Lin, J.H.; Chen, Y.M.; Wang, M.K. Dynamics of cadmium concentration in contaminated rice paddy soils with submerging time. Paddy Water Environ. 2013, 11, 483–491. [Google Scholar] [CrossRef]
  21. Krishnamuri, G.S.R.; McArthur, D.E.F.; Wang, M.K.; Kozak, L.M.; Huang, P.M. Biogeochemistry of soil cadmium and the impact on terrestrial food chain contamination. In Biogeochemistry of Trace Elements in the Rhizosphere; Chapter, 7; Huang, P.M., Gobran, G., Eds.; Elsevier: Amsterdam, The Netherlands, 2005; pp. 197–257. [Google Scholar]
  22. Kuwada, T.; Suzuku, S. A review on the cadmium content of rice, daily cadmium intake, and accumulation on the kidneys. J. Occup. Health 1998, 40, 264–269. [Google Scholar] [CrossRef] [Green Version]
  23. Rodda, M.S.; Li, G.; Reid, R.J. The timing of grain Cd accumulation in rice plants: The relative importance of remobilization within the plant and root Cd uptake post-flowering. Plant Soil. 2011, 347, 105–114. [Google Scholar] [CrossRef]
  24. Zeng, F.R.; Ali, S.F.; Zhang, H.T.; Ouyang., Y.N.; Qju, B.Y.; Wu, F.B. The influence of pH and organic matter content in paddy soil on heavy metal availability and their uptake by rice plants. Environ. Pollut. 2011, 159, 84–91. [Google Scholar] [CrossRef]
  25. Zhao, K.; Liu, X.M.; Xu, J.M.; Selim, H.M. Heavy metal contaminations in soil-rice system: Identification of spatial dependence in relation to soil properties of paddy fields. J. Hazard. Mater. 2010, 181, 778–787. [Google Scholar] [CrossRef]
  26. Roman, M. Selenium: Properties and determination. In Encyclopedia of Food and Health; Caballero, B., Finglas, P.M., Toldra, F., Eds.; Academic Press: Oxford, UK, 2016; pp. 734–743. [Google Scholar]
  27. James, L.F.; Panter, K.E.; Mayland, H.F.; Miller, M.R.; Baker, D.C. Selenium poisoning in livestock: A review and Progress. In Selenium in Agriculture and the Environment; Chapter, 7; Jacobs, L.W., Chang, A.C., Sommers, L.E., Dowdy, R.H., Volk, V.V., Severson, R.C., Eds.; Soil Science Society of America, Inc.: Madison, WI, USA, 1989; pp. 123–131. [Google Scholar]
  28. Zhuan, W.M. Map of Fujian Province; Map Publisher: Fuzhou, China, 2008. [Google Scholar]
  29. Meharg, A.A.; Rahman, M. Arsenic contamination of Bangladesh paddy soils: Implications for rice contribution to arsenic consumption. Environ. Sci. Technol. 2003, 37, 220–234. [Google Scholar] [CrossRef]
  30. Rhoades, J.D. Cation-exchange capacity. In Methods of Soil Analysis. Part 2—Chemical and Microbiological Properties; Page, M., Keeney, D.R., Eds.; Soil Science Society of America, Inc.: Madison, WI, USA, 1982; pp. 149–157. [Google Scholar]
  31. Jackson, M.L. Soil Chemical Analysis; Course, A., Ed.; University of Wisconsin: Madison, WI, USA, 1979. [Google Scholar]
  32. Nelson, D.W.; Sommers, L.E. Total carbon, organic carbon, and organic matter. In Methods of Soil Analysis: Part 2—Chemical and Microbiological Properties; Sparks, D.L., Page, A.L., Helmke, P.A., Loeppert, R.H., Soltanpour, P.N., Tabatabai, M.A., Johnston, C.T., Sumner, M.E., Eds.; Soil Science Society of America, Inc.: Madison, WI, USA, 1982; pp. 539–579. [Google Scholar]
  33. Gee, G.W.; Bauder, J.W. Particle-size analysis. In Methods of Soil Analysis: Part 1—Physical and Mineralogical Methods; Klute, A., Ed.; Soil Science Society of America, Inc.: Madison, WI, USA, 1986; pp. 383–412. [Google Scholar]
  34. Tessier, A.; Cambell, P.G.C.; Bisson, M. Sequential extraction procedure for the speciation of particulate trace metals. Anal. Chem. 1979, 51, 844–851. [Google Scholar] [CrossRef]
  35. Munsell Soil Color Charts. Macbeth; Division of Kollmorgen Instruments Corp.: New York, NY, USA, 1952. [Google Scholar]
  36. Soil Survey Staff. Keys to Soil Taxonomy, 12th ed.; United States Department of Agriculture and Natural Resources Conservation Service: Washington, DC, USA, 2014. [Google Scholar]
  37. Fan, J.; Ren, J.; Liao, Q.; Ge, L.; Xu, H.; Cui, X.; Li, W.; Wang, Z. Antagonism between Se and Cd in typical farmland soil in southern Jiangsu Province. Soils 2021, 53, 1023–1032. [Google Scholar] [CrossRef]
  38. Gao, M.; Zhou, J.; Liu, H.; Zhang, W.; Hu, Y.; Liang, J.; Zhou, J. Foliar spraying with silicon and selenium reduces cadmium uptake and mitigates cadmium toxicity in rice. Sci. Total Environ. 2018, 631–632, 1100–1108. [Google Scholar] [CrossRef] [PubMed]
  39. Liu, Z.; Zhang, Q.; Han, T.; Ding, Y.; Sun, J.; Wang, F.; Zhu, C. Heavy metal pollution in a soil-rice system in the Yangtze River Region of China. Int. J. Environ. Res. Public Health 2016, 13, 63. [Google Scholar] [CrossRef] [PubMed] [Green Version]
  40. Miao, L.; Ma, Y.; Xu, R.; Yan, W. Environmental biogeochemical characteristics of rare earth elements in soil and soil-grown plants of the Hetai goldfield, Guangdong Province, China. Environ. Earth Sci. 2011, 63, 501–511. [Google Scholar] [CrossRef]
  41. Chapela, L.M.; Buss, H.L.; Pett-Ridge, J.C. The effects of lithology on trace element and REE behavior during tropical weathering. Chem. Geol. 2018, 500, 88–102. [Google Scholar] [CrossRef] [Green Version]
  42. Ling, S.; Wu, X.; Ren, Y.; Sun, C.; Liao, X.; Li, X.; Zhu, B. Geochemistry of trace and rare earth elements during weathering of black shale profiles in Northeast Chongqing, Southwestern China: Their mobilization, redistribution, and fractionation. Geochemistry 2015, 75, 403–417. [Google Scholar] [CrossRef]
  43. Kong, X.; Liu, T.; Yu, Z.; Chen, Z.; Lei, D.; Wang, Z.; Zhang, H.; Li, Q.; Zhang, S. Heavy metal bioaccumulation in rice from a high geological background area in Guizhou province, China. Int. J. Environ. Res. Public Health 2018, 15, 2281. [Google Scholar] [CrossRef] [Green Version]
  44. Yan, J.; Chen, X.; Zhu, T.; Zhang, Z.; Fan, J. Effects of Selenium Fertilizer Application on Yield and Selenium Accumulation Characteristics of Different Japonica Rice Varieties. Sustainability 2021, 13, 10284. [Google Scholar] [CrossRef]
  45. Wu, D.; Liu, H.; Wu, J.; Gao, X.; Nyasha, N.K.; Cai, G.; Zhang, W. Bi-directional pollution characteristics and ecological health risk assessment of heavy metals in soil and crops in Wanjiang economic zone, Anhui province, China. Int. J. Environ. Res. Public Health 2022, 19, 9669. [Google Scholar] [CrossRef]
  46. Shen, J.; Jiang, C.; Yan, Y.; Zu, C. Selenium distribution and translocation in rice (Oryza sativa L.) under different naturally seleniferous soils. Sustainability 2019, 11, 520. [Google Scholar] [CrossRef] [Green Version]
  47. Jacobs, L.W.; Chang, A.C.; Sommers, L.E.; Dowdy, R.H.; Volk, V.V.; Severson, R.C. Selenium in Agriculture and the Environment; Soil Science Society of America, Inc.: Madison, WI, USA, 1989; p. 233. [Google Scholar]
  48. Fedotov, P.S.; Savonina, E.Y.; Spivakov, B.Y.; Wennrich, R. Possibilities for the harmonization of methods of the dynamic fractionation of elements in soils and bottom sediments. J. Anal. Chem. 2012, 67, 851–861. [Google Scholar] [CrossRef]
  49. Wenzel, W.W.; Kirchbaumer, N.; Prohaska, T.; Stingeder, G.; Lombi, E.; Adriano, D.C. Arsenic fractionation in soil using an improved sequential extraction procedure. Anal. Chim. Acta 2001, 436, 309–323. [Google Scholar] [CrossRef]
  50. Yocubal, L.; Akyol, N.H. Adsorption and transport of arsenate in carbonate-rich soils: Coupled effects of nonlinear and rate–limited sorption. Chemosphere 2008, 73, 1300–1307. [Google Scholar] [CrossRef] [PubMed]
  51. Chiang, K.Y.; Lin, K.C.; Lin, S.C.; Chang, T.K.; Wang, M.K. Arsenic and lead (beudantite) contamination of agricultural rice soils in the Guandu Plain of northern Taiwan. J. Hazard. Mater. 2010, 181, 1066–1071. [Google Scholar] [CrossRef]
  52. Liang, Y.C.; Sun, W.C.; Zhu, Y.G.; Christie, P. Mechanisms of silicon-mediated alleviation of abiotic stresses in higher plants: A review. Environ. Pollut. 2007, 147, 422–428. [Google Scholar] [CrossRef] [Green Version]
  53. Adrees, M.; Ali, S.; Rizwan, M.; Zia-Ur-Rehman, M.; Ibrahim, M.; Abbas, F.; Farid, M.; Qayyum, M.F.; Irshed, M.K. Mechanisms of silicon-mediated alleviation of heavy metal toxicity in plants: A review. Ecotoxicol. Environ. Safe 2015, 119, 186–197. [Google Scholar] [CrossRef]
  54. Li, H.H.; Liu, Y.T.; Chen, Y.H.; Wang, S.L.; Wang, M.K.; Xie, T.H.; Wang, G. Biochar amendment immobilizes lead in rice paddy soils and reduces its phytoavailability. Sci. Rep. 2016, 6, 31616. [Google Scholar] [CrossRef]
Figure 1. (A) Location of Fujian Province, China, (B) location of Lianchen (LC) County, and (C) locations of Gutian (GT), Gechuan (GC), and Pengkou (PK) villages.
Environments 10 00114 g001
Figure 2. Sequential extraction of soil (A) La, (B) Ce, and (C) Nd distribution at Gutian (GT), Gechuan (GC), and Pengkou (PK) villages. WS: water soluble; EXC: exchangeable; CA: bound to carbonate and weakly specifically adsorbed; Fe-Mn: bound to Fe- and Mn-oxides; OM: bound to organic matter; RES: Residual (±SE, n = 5).
Environments 10 00114 g002
Figure 3. Accumulation factors of (A) Se, (B) Cd, (C) Zn, (D) Pb, (E) La, (F) Ce, and (G) Nd in rice root, stem, leaf, husk, and brown rice based on samples from the GT, GC, and PK villages in Lianchen (LC) County (±SE, n = 3). p represents the significant difference between tissues by one-way analysis of variance (ANOVA).
Environments 10 00114 g003
Figure 4. Accumulation factors of (A) Se, (B) heavy metals, and (C) rare earth elements in the husk and brown rice based on the samples from the BT, GT, GC, and PK villages in Lianchen (LC) County. p represents a significant difference between husk and brown rice by one-way analysis of variance (ANOVA).
Environments 10 00114 g004
Table 1. Sequential extraction procedures.
Elemental FormDissolventDisposal Method
F1: Water soluble (WS)Deionized water1 h shaking, 20 °C
F2: Exchangeable (EXC)1 mol L−1 NH4OAc (pH = 7.0)2 h shaking, 20 °C
F3: Bound to carbonate and weakly specifically adsorbed (CA)1 mol L−1 NaOAc (adjusted to pH = 5.0 with HOAc)2 h shaking, 20 °C
F4: Bound to Fe–Mn oxides (Fe-Mn)0.04 mol L−1 NH2OH·HCl in 25% HOAc (v/v)6 h shaking, water bath, 60 °C
F5: Bound to organic matter (OM)15 mL 30% H2O2 (adjusted to pH = 2.0 with HNO3); after cooling, 5 mL 3.2 mol L−1 NH4OAc in 20% (v/v) HNO3, diluted to 20 mL5.5 h shaking, 80 °C
F6: Residual (RES)9 mL HNO3 and 3 mL HClO40.5 h shaking, microwave digestion
Table 2. Soil’s physical and chemical properties.
SampleSoil ColourpHOMTNC/NCEC
(g kg−1)(g kg−1)(cmol kg−1)
GT2.5YR 4/16.1 ± 0.043.5 ± 0.12.1 ± 0.012.2 ± 0.08.8 ± 0.0
GC5YR 6/26.3 ± 0.033.3 ± 0.01.6 ± 0.012.3 ± 0.28.3 ± 0.0
PK2.5YR 5/45.3 ± 0.032.0 ± 0.01.7 ± 0.011.0 ± 0.06.9 ± 0.0
SampleExchangeable CationBase SaturationTexture
KNaCaMg
(mmol kg1)(%)
GT9.1 ± 0.00.7 ± 0.026.3 ± 0.04.4 ± 0.046.2 ± 0.8Silty loam
GC7.5 ± 0.00.8 ± 0.025.8 ± 0.75.6 ± 0.247.8 ± 0.8Silty clay loam
PK3.8 ± 0.00.4 ± 0.012.6 ± 0.02.8 ± 0.028.4 ± 0.2Silty loam
Data are presented as the mean values in triplicate ± SD. GT, GC, and PK represent Gutian, Gechuan, and Pengkou villages in Lianchen (LC) County, respectively. OM: Organic matter; TN: Total nitrogen; CEC: Cation-exchange capacity.
Table 3. Selenium, heavy metal (Cd, Zn, Pb), and rare earth element (La, Ce, Nd) concentrations in soils (mg kg−1).
LocationSeCdZnPbLaCeNd
GT0.8 ± 0.10.5 ± 0.176.9 ± 4.653.8 ± 3.4320.0 ± 10.3187.0 ± 55.2438.1 ± 8.2
GC0.8 ± 0.10.5 ± 0.048.3 ± 0.120.3 ± 2.340.2 ± 0.233.4 ± 0.169.8 ± 0.1
PK0.8 ± 0.10.4 ± 0.052.6 ± 1.729.0 ± 3.795.5 ± 4.297.2 ± 4.8187.9 ± 10.4
Data are presented as the mean values in triplicate ± SD.
Table 4. Selenium, heavy metal (Cd, Zn, Pb), and rare earth element (La, Ce, Nd) concentrations in rice plant tissues (mg kg−1).
Location
/Cultivar
Stage
/Plant Tissue
SeCdZnPbLaCeNd
GT/JZYBooting stage/Root0.2 ± 0.1 cd0.7 ± 0.0 c60.2 ± 2.0 b21.4 ± 2.0 a60.6 ± 4.1 a43.8 ± 4.2 a74.0 ± 5.6 a
/Stem0.3 ± 0.0 d2.3 ± 0.0 e37.6 ± 2.7 c4.3 ± 0.1 e7.1 ± 0.1 c4.9 ± 0.0 c8.9 ± 0.1 c
/Leaf0.3 ± 0.1 bc0.3 ± 0.1 e24.1 ± 1.5 d3.0 ± 0.0 e1.5 ± 0.0 d0.8 ± 0.0 d2.4 ± 1.4 de
Filling stage/Root0.2 ± 0.0 cd1.2 ± 0.1 f59.4 ± 6.6 ef24.4 ± 1.8 b33.0 ± 2.6 b31.9 ± 2.5 b62.9 ± 5.3 b
/Stem0.2 ± 0.1 de0.3 ± 0.0 if52.0 ± 0.4 f2.8 ± 0.3 f2.4 ± 0.1 e1.9 ± 0.1 e3.7 ± 0.2 de
/Leaf0.2 ± 0.0 cd0.2 ± 0.0 ijk32.3 ± 2.1 h2.3 ± 0.1 fg1.4 ± 0.1 efg0.9 ± 0.0 efg1.3 ± 0.1 ef
/Husk0.2 ± 0.0 cd0.1 ± 0.0 jk23.6 ± 1.0 ij1.1 ± 0.0 ghi0.8 ± 0.0 fg0.5 ± 0.0 fg0.7 ± 0.0 f
/Brown rice0.0 ± 0.0 e0.1 ± 0.0 k19.8 ± 0.1 j0.6 ± 0.0 hi0.0 ± 0.0 g0.0 ± 0.0 g<0.001
GC
/WSSM
Booting stage/Root0.3 ± 0.0 bc1.8 ± 0.4 a101.7 ± 3.0 a15.4 ± 1.6 b3.0 ± 0.1 e2.5 ± 0.1 c7.5 ± 0.1 c
/Stem0.4 ± 0.1 a0.7 ± 0.0 bc60.1 ± 10.1 b8.9 ± 0.0 d1.0 ± 0.0 d0.7 ± 0.0 de2.8 ± 0.6 de
/Leaf0.3 ± 0.0 abc0.3 ± 0.0 de36.2 ± 1.0 c4.1 ± 0.0 e1.1 ± 0.0 d0.7 ± 0.0 de2.2 ± 0.0 de
Filling stage/Root0.5 ± 0.2 a2.3 ± 0.0 b158.4 ± 3.3 a18.3 ± 2.5 c9.7 ± 0.1 c7.4 ± 0.1 c18.0 ± 0.8 c
/Stem0.3 ± 0.0 b2.1 ± 0.0 c134.2 ± 6.2 b14.4 ± 0.0 d1.2 ± 0.1 efg0.8 ± 0.0 efg1.7 ± 0.4 ef
/Leaf0.3 ± 0.0 b1.4 ± 0.2 e61.0 ± 1.7 e4.5 ± 0.0 e1.0 ± 0.0 efg0.7 ± 0.0 fg0.6 ± 0.0 f
/Husk0.3 ± 0.0 b0.7 ± 0.2 h29.1 ± 0.3 hi2.0 ± 0.0 fgh0.6 ± 0.0 fg0.6 ± 0.0 fg0.6 ± 0.0 f
/Brown rice0.0 ± 0.0 e0.0 ± 0.0 i20.7 ± 1.6 j1.0 ± 0.0 ghi0.0 ± 0.0 g0.0 ± 0.0 g<0.001
PK
/HBS
Booting stage/Root0.3 ± 0.1 bc0.7 ± 0.0 c59.6 ± 1.9 b16.0 ± 0.0 b17.0 ± 0.9 b15.9 ± 0.8 b31.9 ± 2.6 b
/Stem0.3 ± 0.0 bc1.0 ± 0.2 b57.0 ± 0.9 b16.7 ± 0.6 b2.6 ± 0.1 d2.2 ± 0.1 d5.4 ± 0.2 cd
/Leaf0.2 ± 0.0 cd1.3 ± 0.3 cd39.5 ± 0.1 c14.2 ± 0.2 c1.3 ± 0.0 d1.1 ± 0.0 e1.5 ± 0.1 e
Filling stage/Root0.5 ± 0.1 a0.7 ± 0.0 a103.9 ± 1.8 a44.3 ± 1.6 a62.4 ± 2.6 a42.0 ± 1.2 a80.4 ± 2.8 a
/Stem0.3 ± 0.0 cd2.0 ± 0.3 d79.4 ± 10.3 d5.3 ± 0.0 e5.4 ± 0.7 d3.7 ± 0.4 d6.6 ± 1.0 d
/Leaf0.2 ± 0.0 cd1.0 ± 0.0 g42.1 ± 9.4 g4.8 ± 0.4 e2.1 ± 0.0 ef1.4 ± 0.0 ef1.9 ± 0.0 ef
/Husk0.2 ± 0.0 cd0.6 ± 0.0 h22.1 ± 3.4 ij0.4 ± 0.0 i0.0 ± 0.0 g0.3 ± 0.0 fg0.0 ± 0.0 f
/Brown rice0.0 ± 0.0 e0.2 ± 0.0 ijk7.5 ± 0.1 k0.0 ± 0.0 i<0.001 #<0.001<0.001
Data in the plant tissues are the mean values in triplicate ± SD. The results are presented as the mean of 3 replicates. The superscript letter (a–k) denote a significant difference with a 5% significance level. # symbol denotes under the minimum detected limit (MDL) (<0.001 mg kg−1). GT, GC, and PK represent Gutian, Gechuan, and Pengkou villages in Lianchen County, respectively. JZY, WSSM, and HBS represent the rice cultivars Xinyinzhan, Wushansimiao, and Hongbaoshi, respectively.
Table 5. Accumulation factors of selenium, heavy metals (Cd, Zn, Pb), and rare earth elements (La, Ce, Nd) in rice plant tissues to soils.
Location
/Cultivar
Stage
/Plant Tissue
SeCdZnPbLaCeNd
GT/JZYBooting stage/Root0.291.380.780.400.190.260.18
/Stem0.344.850.490.490.020.030.02
/Leaf0.430.640.310.050.050.040.06
Filling stage/Root0.282.600.770.450.100.170.14
/Stem0.190.600.680.050.080.010.01
/Leaf0.250.400.420.040.050.050.03
/Husk0.190.260.310.020.230.030.05
/Brown rice0.040.130.260.01<0.001 #<0.001<0.001
GC/WSSMBooting stage/Root0.404.002.110.760.070.070.01
/Stem0.481.501.250.440.030.020.03
/Leaf0.390.700.750.200.030.020.03
Filling stage/Root0.594.963.280.900.240.220.25
/Stem0.354.492.780.710.030.020.02
/Leaf0.343.091.260.220.020.020.09
/Husk0.361.520.600.100.020.020.02
/Brown rice0.020.070.420.05<0.001<0.001<0.001
PK/HBSBooting stage/Root0.411.551.130.540.180.160.17
/Stem0.412.201.080.560.020.020.03
/Leaf0.322.860.750.480.010.010.01
Filling stage/Root0.681.551.971.500.630.430.43
/Stem0.344.501.510.180.060.040.04
/Leaf0.322.200.800.160.020.020.01
/Husk0.311.300.420.01<0.001<0.001<0.001
/Brown rice0.040.390.010.02<0.001<0.001<0.001
Data are the mean values of selenium, heavy metal (Cd, Zn, Pb), and rare earth element (La, Ce, Nd) concentrations in the plant tissues in triplicate/mean values of corresponding indices in the soil location in triplicate. GT, GC, and PK represent Gutian, Gechuan, and Pengkou villages in Lianchen County, respectively. JZY, WSSM, and HBS represent the rice cultivars Xinyinzhan, Wushansimiao, and Hongbaoshi, respectively. # symbol denotes accumulation factor could not be caculated for concentrations of under the minimum detected limit (MDL) (<0.001 mg kg−1).
Table 6. Selenium (Se), heavy metal (Cd, Zn, Pb), and rare earth element (La, Ce, Nd) concentrations in husks, brown rice, and soils of different rice cultivars (mean value, mg kg−1).
Cultivar
/Location
TissueSeCdZnPbLaCeNd
JLY289/BTHusk0.24 0.2346.050.330.580.600.86
Brown rice0.020.0522.690.300.03<0.001 #0.01
HHZ/BTHusk0.410.2543.548.160.560.581.16
Brown rice0.020.0627.610.410.03<0.001<0.001
HBS/GTHusk0.190.2838.824.850.580.580.93
Brown rice0.050.0421.330.840.02<0.0010.13
XYZ/GCHusk0.210.2532.506.150.670.6510.74
Brown rice0.040.0421.700.980.02<0.0010.04
YXZ/GCHusk0.320.1843.535.050.590.600.75
Brown rice0.060.1220.292.030.03<0.0010.22
WSSM/GCHusk0.270.6134.496.490.570.610.59
Brown rice0.030.0721.900.410.03<0.001<0.001
JN313/GCHusk0.240.3646.554.520.590.591.34
Brown rice0.380.1719.351.860.02<0.0010.10
XYZ/PKHusk0.320.3335.777.160.570.600.56
Brown rice0.080.1023.020.340.02<0.0010.12
Soil/Location
/BT 0.650.4650.2330.8440.8434.73116.60
/GT 0.800.4776.8753.81319.98187.01438.08
/GC 0.830.4648.2520.2940.8033.3669.78
/PK 0.740.4452.6129.6395.4797.17187.88
Data in the plant tissues and soil samples are the mean values in triplicate. # Symbol denotes under the minimum detected limit (MDL) (<0.001 mg kg−1). JLY289, HHZ, HBS, XYZ, YXZ, WSSM, and JN313 represent the rice cultivars Jinliangyou 289, Huanhuazhan, Hongbaoshi, Xinyinzhan, Yuxiangzhan, Wushansimiao, and Jinnon 313, respectively. BT, GT, GC, and PK are located in Beituan, Gutian, Gechuan, and Pengkou, respectively.
Table 7. Pearson correlation of Se between the soils and rice plant tissues at the booting and filling stages.
IndexSoilBooting StageFilling Stage
RootStemLeafRootStemLeafHuskBrown Rice
Soil1.00−0.93−0.900.00−1.00 **−0.98 *−0.95 *−0.85−0.87
Booting stageRoot 1.001.00 **0.360.910.99 *1.00 **0.98 *−0.99 *
Stem 1.000.430.870.97 *0.99 *0.99 **−1.00 **
Leaf 1.00−0.060.200.300.53−0.50
Filling stageRoot 1.000.97 *0.930.81−0.83
Stem 1.000.99 **0.94−0.95
Leaf 1.000.97 *−0.98 *
Husk 1.00−1.00 **
Brown rice 1.00
* Indicates a significant difference at the 0.05 level, ** indicates a significant difference at the 0.01 level.
Disclaimer/Publisher’s Note: The statements, opinions and data contained in all publications are solely those of the individual author(s) and contributor(s) and not of MDPI and/or the editor(s). MDPI and/or the editor(s) disclaim responsibility for any injury to people or property resulting from any ideas, methods, instructions or products referred to in the content.

