
Simulating Gibberellic Acid Effect on Pasture Yield on Naturally Deposited and Fixed Area Urine
by
 , and
, and
Dumsane Themba Matse
1,
Fernando Avendano
1,
Peter Bishop
1,
Paramsothy Jeyakumar
1,* and
Geoff Bates
2 1
Environmental Science Group, School of Agriculture and Environment, Massey University, Private Bag 11 222, Palmerston North 4442, New Zealand
2
Pastoral Robotics Limited, Auckland 1052, New Zealand
*
Author to whom correspondence should be addressed.
Environments 2023, 10(7), 112; https://doi.org/10.3390/environments10070112
Submission received: 23 May 2023
/
Revised: 29 June 2023
/
Accepted: 29 June 2023
/
Published: 2 July 2023
Abstract
:Nitrate (NO3−-N) leaching from urine patches is a serious environmental concern in dairy pastoral systems. In our previous research, we established that application of a plant growth hormone, gibberellic acid (GA), can potentially reduce NO3−-N leaching in urine patches; however, this was investigated in two locations in New Zealand. The performance of GA in influencing pasture nitrogen (N) uptake and NO3−-N leaching needs to be undertaken in multi-locations to draw conclusions. However, multi-location studies are a challenge due to a lack of funding and time constraints, so models such as the agricultural production systems simulator (APSIM) have been used. Therefore, field studies were conducted to determine whether APSIM can be used to quantify and simulate the effect of GA on NO3−-N leaching and pasture yield in three experimental sites known as Ashburton, Stratford, and Rotorua in New Zealand. Treatments examined were control (no urine applied), urine at 600 kg N ha−1, urine + GA at 8 g ha−1. The observed data was used to calibrate and validate the model. APSIM simulated that application of GA reduced NO3−-N leaching (relative to urine treatment) by 4.6, 5.1, and 8.8 kg NO3−-N ha−1 in Ashburton, Stratford, and Rotorua, respectively. APSIM reliably simulated pasture dry matter yield, and this was confirmed by the coefficient of determination ranging from R2 = 0.8562 to 0.995 in all treatments and experimental sites. This study demonstrated that APSIM can effectively be used to simulate the effect of GA application on NO3−-N leaching and pasture yield. Therefore, APSIM can be applied in other areas to simulate NO3−-N leaching and pasture yield.
1. Introduction
White clover (Trifolium repens L.) and perennial ryegrass (Lolium perenne L.)-based pastoral farming is the dominant farming system in New Zealand. The mixture of clover and ryegrass has been used because of their complementary benefits to each other, with clover fixing up to 250 kg N ha−1 yr−1 and growing well in summer dry conditions, while ryegrass gives strong winter growth rates [1]. To meet livestock food demand, this system mostly benefits from the application of synthetic fertilizers (100–190 kg N ha−1 yr−1) and some dairy effluent to promote pasture ryegrass production [2]. The main challenge in dairy-grazed pasture is the oversupply of dietary N, which results in a high percentage being excreted in urine, resulting in urine patches ranging between 200 and 2000 kg N ha−1 [3]. In these urine patches, the N concentration may exceed the pasture N requirement; therefore, a higher proportion of the unutilized N becomes susceptible to leaching via nitrate (NO3−-N) during drainage events [4,5]. Urine patches are a major source of NO3−-N leaching/losses in dairy-grazed pasture. To date, there is no fully adopted N mitigation practice that is aimed at reducing N losses from urine patches. Therefore, there is an urgent need to develop strategies that can reduce nitrogen (N) leaching from urine patches in dairy pasture systems.
One approach to the mitigation of NO3−-N leaching in dairy-grazed pasture is to increase pasture N uptake during growing periods susceptible to N leaching. Increasing plant N use efficiency can potentially reduce N loss during drainage events. Several studies have proposed that external application of plant growth stimulants such as gibberellic acid (GA) can help increase plant N uptake during periods of low plant N uptake due to cool temperatures [6,7]. However, the performance of GA in increasing plant N uptake can be influenced by several growing conditions, such as soil moisture and different climatic conditions. To provide conclusive results, the performance of GA in influencing pasture N uptake needs to be undertaken in multi-locations. This is limited by time, high cost, and a lack of technical skills for multi-location studies. To overcome these challenges, crop simulation models such as the agricultural production systems simulator (APSIM) have been utilized as tools for generating data for assessing current and future scenarios.
The APSIM model has been developed to simulate crop responses in complex farming systems under diverse environmental conditions. Several studies have extensively employed APSIM in different management scenarios to monitor either crop (such as maize or sorghum) or pasture (such as lucerne or plantain) responses under short- or long-term management [8,9,10]. APSIM has been extensively used to simulate pasture growth under different N application and grazing scenarios [9]. Despite the extensive use of APSIM in agriculture, there are no studies that have simulated the effect of GA on influencing pasture (white clover-ryegrass) herbage dry matter (DM) yield.
This study aims to investigate the effect of GA application on pasture DM yield using the APSIM model and compare it to in situ results. This study will use climate and soil data and a management script to run in the APSIM engine to simulate the pasture DM matter yield and possible N leaching in different experimental sites as influenced by GA application. The simulated pasture DM results will be validated using observed field experimental results. We hypothesize that the APSIM model can be used to simulate the effect of GA on pasture DM yield and further simulate the potential mineral N leaching. This study’s results will demonstrate whether the APSIM model can be used to simulate the use of GA in different climatic conditions.
2. Materials and Methods
2.1. Sites and Soils
Field experiments were established at three sites (Figure 1) during the late-autumn period (2021/2022 season). The three sites were Ashburton site (−43.754178, 171.594126) in the North Island of New Zealand, Stratford site (−39.335865, 174.305819) in the South Island of New Zealand, and Rotorua site (−38.009071, 176.179708) in the South Island of New Zealand (Figure 1).
2.2. Experimental Design and Treatments
This field experiment used an established pasture composed of a mixture of perennial ryegrass and white clover at all experimental sites. Each experimental site had small plots measuring 1 m2, and in each small plot, urine was applied to cover 0.2 m2 of the area, which simulated a typical cow urine patch area in dairy grazed pastures [3], resulting in 600 kg N ha−1 in the patches and 120 kg N ha−1 over the 1 m2.
The treatments applied at each site are outlined in Table 1. Synthetic urine prepared as reported by Bishop and Jeyakumar [4] was used. Before synthetic urine application, the herbage in the plots was cut to a uniform height of 50 mm, which simulated grazing by dairy cows. Retention rings were used to reduce urine lateral movement. Treatment (GA) was applied as a spray treatment around the urine-treated area 24 h following urine application at a rate of 12.5 mL. Treatments were applied in a completely randomized block design and replicated five times each. Table 2 shows the treatment application and harvesting dates for each experimental site.
2.3. Herbage Sampling
The timing of herbage harvest from the field was based on regional grazing practices. During harvest, the entire herbage was cut from each urine patch area (0.2 m2) to a height of 50 mm, and dry weight was recorded after samples were oven-dried at 65 ℃ for a week.
2.4. Soil Sampling and Analysis
Three soil cores in each 0.2 m2 urine patch were collected to 30 cm depth during harvesting at each experimental site using a stainless-steel corer with an internal diameter of 3 cm. Field moist soil cores from each treatment were composited and mixed manually before a 5 g sub-sample was extracted using 30 mL of 2 M KCl for mineral N (NH4+-N and NO3−-N) analysis on an end-over shaker for 1 h [11]. Extractants were analyzed for mineral N using the Technicon autoanalyzer [12]. The autoanalyzer’s functioning and chemicals used are explained by Matse et al. [11]. In this study, soil mineral N refers to the sum of NH4+-N and NO3−-N.
2.5. Model Description
The agriculture production systems simulator (APSIM) is a point-scale model that simulates the production outputs of the management of a single homogenous field for a specified time period [13]. This model comprises modules that can be sub-divided into biological (crop), environmental (water balance, organic matter, C/N ratio, carbon, N residue), and management (fertilizer application, irrigation, grazing, and so on). The APSIM model can be used to simulate the pasture DM yield and predict the influence of GA application based on the climatic conditions, soil moisture, and solar radiation at each site. APSIM has been extensively used to simulate pasture and crop growth at field level [14,15].
2.6. Simulation
The weather (MET), pasture (SCRUM), soil (SoilWat), and management (scripts) were run in the APSIM engine to simulate the DM matter yield and N leaching. For accuracy of the results, the APSIM model was first run using weather and pasture DM yield results collected in-situ during the 2022 growing season. Thereafter, the model was run against the observed results during the 2022 pasture growing season in Ashburton, Stratford, and Rotorua (April–November 2022). In the Rotorua simulations, due to higher-than-expected mineralization of N, fertilizer (23 kg N ha−1 on the 10 July 2022, for the 3rd plot trial) was applied artificially in the model to provide sufficient N for DM production without impacting significantly on NO3−-N leaching levels.
2.6.1. APSIM-MET
The APSIM MET files were created from daily weather data sourced from the NIWA (National Institute of Water and Atmosphere) climate data base (cliflo.niwa.co.nz (accessed on 25 January 2023)). The weather stations at each site were located less than 2 km from each experimental site. Daily weather included the maximum (Tmax) and minimum (Tmin) air temperatures (°C), solar radiation (Rad, Mj/m2), rainfall (mm), and soil moisture (%). The weather data was based on each site treatment application date (Figure 2).
2.6.2. APSIM-Soil
The soil parameters used in the APSIM module were based on in situ data analyzed before the beginning of the experiment. The parameters included soil physical and chemical properties (Table 3 and Table 4) and effective rooting depth for each site. The solute movement to simulate drainage was based on water balance parameters including soil bulk density, hydraulic conductivity, volumetric water content at field capacity, permanent wilting point, and saturation.
2.6.3. Model Evaluation
To ensure accuracy, the model pasture DM yield results were compared to the pasture DM yield recorded in the field during the 2022 growing season. The statistical coefficient (R2) between observed and simulated results was used to evaluate APSIM’s performance.
2.7. Statistical Analysis
Statistical analyses were done using Minitab (Version 19. Minitab Inc., Sate college, PA, USA). The treatment comparison effects on the observed DM yield results were analyzed using the ANOVA, and significant (p < 0.05) differences between means were determined using the Tukey post-hoc test. This was done to find out whether the GA had any influence on the pasture DM yield relative to the urine-only treatment on the observed DM results.
3. Results
3.1. Soil Moisture
The soil moisture for the Ashburton and Rotorua sites was 20–30% between April and May. In contrast, the soil moisture at the Stratford site was slightly higher, ranging between 20 and 40%. The soil moisture increased in both Ashburton and Rotorua from June to September, increasing to about 50% in Ashburton and reaching about 60% in Stratford. The simulated soil moisture data showed a similar trend to the observed soil moisture data (Figure 3).
3.2. Drainage
The field drainage data at all sites was simulated using the climate data presented in Figure 2 and the soil properties in Table 3. The drainage simulations for all experimental sites are shown in Figure 4. In all experimental sites, the cumulative drainage increased significantly between early June and September. The Ashburton site cumulative drainage was 150.3 mm, compared to 682.5 mm and 557.98 mm cumulative drainage for the Stratford and Rotorua sites, respectively.
3.3. Drainage vs. Nitrate-N Leaching
In all experimental sites, the simulation results showed that the NO3−-N leaching in the control treatment was relatively low, averaging 31.60 kg NO3−-N ha−1. The maximum cumulative NO3−-N leaching from the urine treatment was recorded for a cumulative drainage of 150.3 mm in Ashburton, with rates of 255.5 kg NO3−-N ha−1. Application of urine + GA treatment in the Ashburton site reduced cumulative NO3−-N leaching by 4.6 kg NO3−-N ha−1 relative to urine treatment (Figure 5). In the Stratford site, the cumulative NO3−-N leaching in the urine treatment was 196.2 kg NO3−-N ha−1 compared to 191.1 kg NO3−-N ha−1 in the urine + GA treatment. The application of urine + GA resulted to in reduction of 5.1 kg NO3−-N ha−1 leaching from the soil system. Similarly, in the Rotorua site, application of urine + GA treatment reduced cumulative NO3−-N leaching by 8.8 kg NO3−-N ha−1 relative to urine treatment (Figure 5).
3.4. Pasture DM Yield
The observed pasture DM yield in this study showed that there was no significant difference between urine only and urine + GA treatments in all three experimental sites (Figure 6). The APSIM model was able to simulate the pasture DM yield reasonably well at all experimental sites. This was confirmed by the R2 values for each treatment, which are shown in Table 5. In terms of the APSIM simulated results, application of urine + GA treatment in the Ashburton site increased pasture DM yield by an average of 257.9 kg DM ha−1 relative to urine treatment across sampling periods (Figure 6). Similarly, the urine + GA treatment in the Stratford and Rotorua sites, increased pasture DM yield by average values of 216.3 and 201.2 kg DM ha−1, respectively, compared to the urine treatment (Figure 6).
4. Discussion
4.1. Nitrate-N Leaching
Results from the simulation of NO3−-N leaching in both experimental sites showed that NO3−-N was the main form of N leached. A high mass of NO3−-N in both experimental sites occurred between the end of May and the end of July. These high leaching events corresponded with the increase in the daily rainfall pattern outlined in Figure 2. For example, Figure 2 showed that in Ashburton, high rainfall events occurred around early July, whereas in Stratford and Rotorua, high rainfall events occurred around mid-May. The low leaching events between March and early May were also confirmed by the high soil residual mineral N at the first herbage cuts in all experimental sites (Table 6) in the urine treatments. At both experimental sites, the mineral N in the soil during the first herbage harvesting was still relatively high, indicating that there was low leaching. For example, the mineral N in the urine treatments was 495 kg N ha−1 for Ashburton, 345 kg N ha−1 for Stratford, and 254 kg N ha−1 for Rotorua in the first harvest (Table 6). However, between June and September, the soil residual mineral N was relatively low at all sites. This is associated with the high mineral N leaching, as demonstrated by the cumulative drainage results.
In this study, GA was applied to improve plant growth, which can help improve pasture DM yield during winter conditions, thus reducing mineral N leaching. According to the APSIM simulation results, application of GA in this current study reduced cumulative NO3−-N leaching by average values of 1.8, 2.5, and 2.7% in the Ashburton, Stratford, and Rotorua sites, respectively. The results demonstrate that there was a potential for GA application to reduce NO3−-N leaching relative to urine-only treatment in all experimental sites. However, the GA’s effectiveness may have been reduced by several environmental conditions in this study. Firstly, the high soil water deficit (Figure 3) after the first treatment application at all sites may have influenced the mechanism of GA in this study. On the other hand, the high rainfall events and intensity between June and September may have leached the GA into the soil. Similar results of GA showing a nominal reduction in NO3−-N leaching have been reported in other studies [11,16]. The authors demonstrated that application of urine + GA alone in mid-winter did not induce a significant reduction in mineral N leaching in lysimeter studies. In order to increase GA’s effectiveness in reducing mineral N leaching, Matse et al. [11] proposed that GA must be applied together with an inhibitor. Similarly, Woods et al. [7] reported that the application of GA to different forage species induced a nominal reduction in NO3−-N leaching.
4.2. Herbage DM Yield
The herbage DM yield was higher in Ashburton than in the other two sites. Several factors apparent at the two sites can explain this. The air temperature results illustrated in Figure 2 showed that the Ashburton site had nominally higher air temperatures compared to the Stratford and Rotorua sites. The warm temperature might have increased pasture growth in Ashburton relative to Stratford and Rotorua. Further, the drainage results showed that the Ashburton site had low cumulative drainage (150 mm) compared to Stratford (683 mm) and Rotorua (558.0 mm). The lower leaching might have increased the proportion of applied urine N to be utilized by the pasture for growth compared to the other two sites.
Further, the APSIM simulation results showed that the application of urine + GA treatment increased pasture DM yield (relative to urine only treatment) by average values of 6.1, 11.9, and 9.1% in the Ashburton, Stratford, and Rotorua sites, respectively. The results demonstrate that the nominal reduction in NO3−-N leaching induced by the application of GA can be linked to the increased pasture DM yield. The lack of significant effectiveness of GA in all experimental sites may be associated with the dry conditions, especially on the first treatment application dates. The dry soil conditions and slightly higher temperatures might have accelerated the degradation of GA in the soil. Alexopoulos et al. [17] reported that the major drawback of GA is that it is only effective for a short period due to rapid degradation in the soil.
The use of the APSIM model in this study showed satisfactory results, as has been reported in other studies [18,19]. In the simulation of pasture ryegrass DM yield, the model showed a similar trend to the observed results. A discrepancy between results was only observed in the control treatment at the last harvesting in all experimental sites. According to the model predictions, the applied N fertilizer at the beginning of the study was depleting as the experimental period progressed, thus showing a lower herbage DM yield. Results in the initial soil mineral N for the third application provide strong evidence that there was high mineralization in the soil, which might have supported the high pasture growth in the control during the last cut (Table 7). The APSIM model is limited in its ability to efficiently simulate the soil mineralization, thus the discrepancy between observed and simulated results in the third application (Figure 6).
5. Conclusions
The results shown in this current study demonstrate the potential use of the APSIM model to simulate the leaching and DM yield in the three experimental sites (Ashburton, Stratford, and Rotorua) used in this research. Application of GA reduced cumulative NO3−-N leaching by an average of 1.8, 2.5, and 2.7% and increased pasture DM yield by an average of 6.1, 9.1, and 11.9% in Ashburton, Stratford, and Rotorua, respectively. Even though it was not significant, the results demonstrated that the timing of GA applications is important. Gibberellic acid application between March and April showed potential to increase pasture DM yield more than when applied in June.
The use of APSIM to predict NO3−-N leaching in pastoral soils in New Zealand proved to be an efficient tool. The development of such an efficient model can help reduce time spent on the field and funds spent on undertaking experiments at different sites. The wide use of the APSIM model can improve the management of dairy pastoral soils in relation to reducing NO3−-N leaching.
Future work can be conducted on the use of the APSIM model to simulate the influence of GA on pasture growth in different locations with contrasting management practices to demonstrate the application of this model. Further, different N loss pathways, such as pasture N uptake and nitrous oxide emissions as a result of GA application, can also be incorporated into the model. Apart from the model, future work must be conducted on the changes in soil chemical composition and microbial communities due to the use of GA in pastoral systems.
Author Contributions
All authors contributed to the study’s concept and design. Data analysis and first draft writing by D.T.M. Data analysis, the APSIM Model, and review were done by F.A. Conducting the experiment, data collection, resource mobilization, and methodology were done by P.B. Supervision, review and editing, monitoring progress, Funding acquisition, and project administration were done by P.J. Review and editing were done by G.B. All authors have read and agreed to the published version of the manuscript.
Funding
This research was funded by Pastoral Robotics Limited, grant number NZBN 9429030118034.
Data Availability Statement
The analyzed data during this current study is available from the corresponding author upon reasonable request.
Acknowledgments
We are thankful to Janani Palihakkara for the review support she provided for this manuscript. We further extend our gratitude to Pastoral Robotics for supporting the research with resources to be able to travel to all the research sites.
Conflicts of Interest
The authors declare no conflict of interest.
References
- Vibart, R.E.; Vogeler, I.; Dodd, M.; Koolaard, J. Simple versus Diverse Temperate Pastures: Aspects of Soil–Plant–Animal Interrelationships Central to Nitrogen Leaching Losses. Agron. J. 2016, 108, 2174–2188. [Google Scholar] [CrossRef]
- Ministry for the Environment. Nitrogen Cap Guidance for Dairy Farms; Ministry for the Environment: Wellington, New Zealand, 2021; pp. 6–10.
- Selbie, D.R.; Buckthought, L.E.; Shepherd, M.A. The challenge of the urine patch for managing nitrogen in grazed pasture systems. In Adv. Agron. 2015, 129, 229–292. [Google Scholar]
- Bishop, P.; Jeyakumar, P. A comparison of three nitrate leaching mitigation treatments with dicyandiamide using lysimeters. N. Z. J. Agric. Res. 2022, 65, 547–560. [Google Scholar] [CrossRef]
- Woods, R.R.; Cameron, K.C.; Edwards, G.R.; Di, H.J.; Clough, T.J. Reducing nitrogen leaching losses in grazed dairy systems using an Italian ryegrass-plantain-white clover forage mix. Grass Forage Sci. 2018, 73, 878–887. [Google Scholar] [CrossRef]
- Parsons, A.J.; Rasmussen, S.; Liu, Q.; Xue, H.; Ball, C.; Shaw, C. Plant growth—Resource or strategy limited: Insights from responses to gibberellin. Grass Forage Sci. 2013, 68, 577–588. [Google Scholar] [CrossRef]
- Woods, R.R.; Cameron, K.C.; Edwards, G.R.; Di, H.J.; Clough, T.J. Effects of forage type and gibberellic acid on nitrate leaching losses. Soil Use Manag. 2016, 32, 565–572. [Google Scholar] [CrossRef]
- Bahri, H.; Annabi, M.; Cheikh M’Hamed, H.; Frija, A. Assessing the long-term impact of conservation agriculture on wheat-based systems in Tunisia using APSIM simulations under a climate change context. Sci. Total Environ. 2019, 692, 1223–1233. [Google Scholar] [CrossRef] [PubMed]
- Bosi, C.; Sentelhas, P.C.; Huth, N.I.; Pezzopane, J.R.M.; Andreucci, M.P.; Santos, P.M. APSIM-Tropical Pasture: A model for simulating perennial tropical grass growth and its parameterisation for palisade grass (Brachiaria brizantha). Agric. Syst. 2020, 184, 102917. [Google Scholar] [CrossRef]
- Briak, H.; Kebede, F. Wheat (Triticum aestivum) adaptability evaluation in a semi-arid region of Central Morocco using APSIM model. Sci. Rep. 2021, 11, 23173. [Google Scholar] [CrossRef] [PubMed]
- Matse, D.T.; Jeyakumar, P.; Bishop, P.; Anderson, C.W.N. Nitrate Leaching Mitigation Options in Two Dairy Pastoral Soils and Climatic Conditions in New Zealand. Plants 2022, 11, 2430. [Google Scholar] [CrossRef] [PubMed]
- Blakemore, L.C. Methods for chemicalanalysis of soils. N. Z. Soil Bur. Sci. Rep. 1987, 80, 72–76. [Google Scholar]
- Chimonyo, V.G.P.; Modi, A.T.; Mabhaudhi, T. Simulating yield and water use of a sorghum–cowpea intercrop using APSIM. Agric. Water Manag. 2016, 177, 317–328. [Google Scholar] [CrossRef]
- Ebrahimi-Mollabashi, E.; Huth, N.I.; Holzwoth, D.P.; Ordóñez, R.A.; Hatfield, J.L.; Huber, I.; Castellano, M.J.; Archontoulis, S.V. Enhancing APSIM to simulate excessive moisture effects on root growth. Field Crops Res. 2019, 236, 58–67. [Google Scholar] [CrossRef]
- Yang, X.; Brown, H.E.; Teixeira, E.I.; Moot, D.J. Development of a lucerne model in APSIM next generation: 1 phenology and morphology of genotypes with different fall dormancies. Eur. J. Agron. 2021, 130, 126372. [Google Scholar] [CrossRef]
- Matse, D.T.; Jeyakumar, P.; Bishop, P.; Anderson, C.W.N. Nitrification rate in dairy cattle urine patches can be inhibited by changing soil bioavailable Cu concentration. Environ. Pollut. 2023, 320, 121107. [Google Scholar] [CrossRef] [PubMed]
- Alexopoulos, A.A.; Akoumianakis, K.A.; Olympios, C.M.; Passam, H.C. The effect of the time and mode of application of gibberellic acid and inhibitors of gibberellin biosynthesis on the dormancy of potato tubers grown from true potato seed. J. Sci. Food Agric. 2007, 87, 1973–1979. [Google Scholar] [CrossRef]
- O’Leary, G.J.; Liu, D.L.; Ma, Y.; Li, F.Y.; McCaskill, M.; Conyers, M.; Dalal, R.; Reeves, S.; Page, K.; Dang, Y.P.; et al. Modelling soil organic carbon 1. Performance of APSIM crop and pasture modules against long-term experimental data. Geoderma 2016, 264, 227–237. [Google Scholar] [CrossRef]
- Watt, L.J.; Bell, L.W.; Pembleton, K.G. A forage brassica simulation model using APSIM: Model calibration and validation across multiple environments. Eur. J. Agron. 2022, 137, 126517. [Google Scholar] [CrossRef]
Figure 1.
The experimental sites (Ashburton, Stratford, and Rotorua) location in New Zealand. The (*) in the map represent the experimental sites used in this experiment.
Figure 1.
The experimental sites (Ashburton, Stratford, and Rotorua) location in New Zealand. The (*) in the map represent the experimental sites used in this experiment.
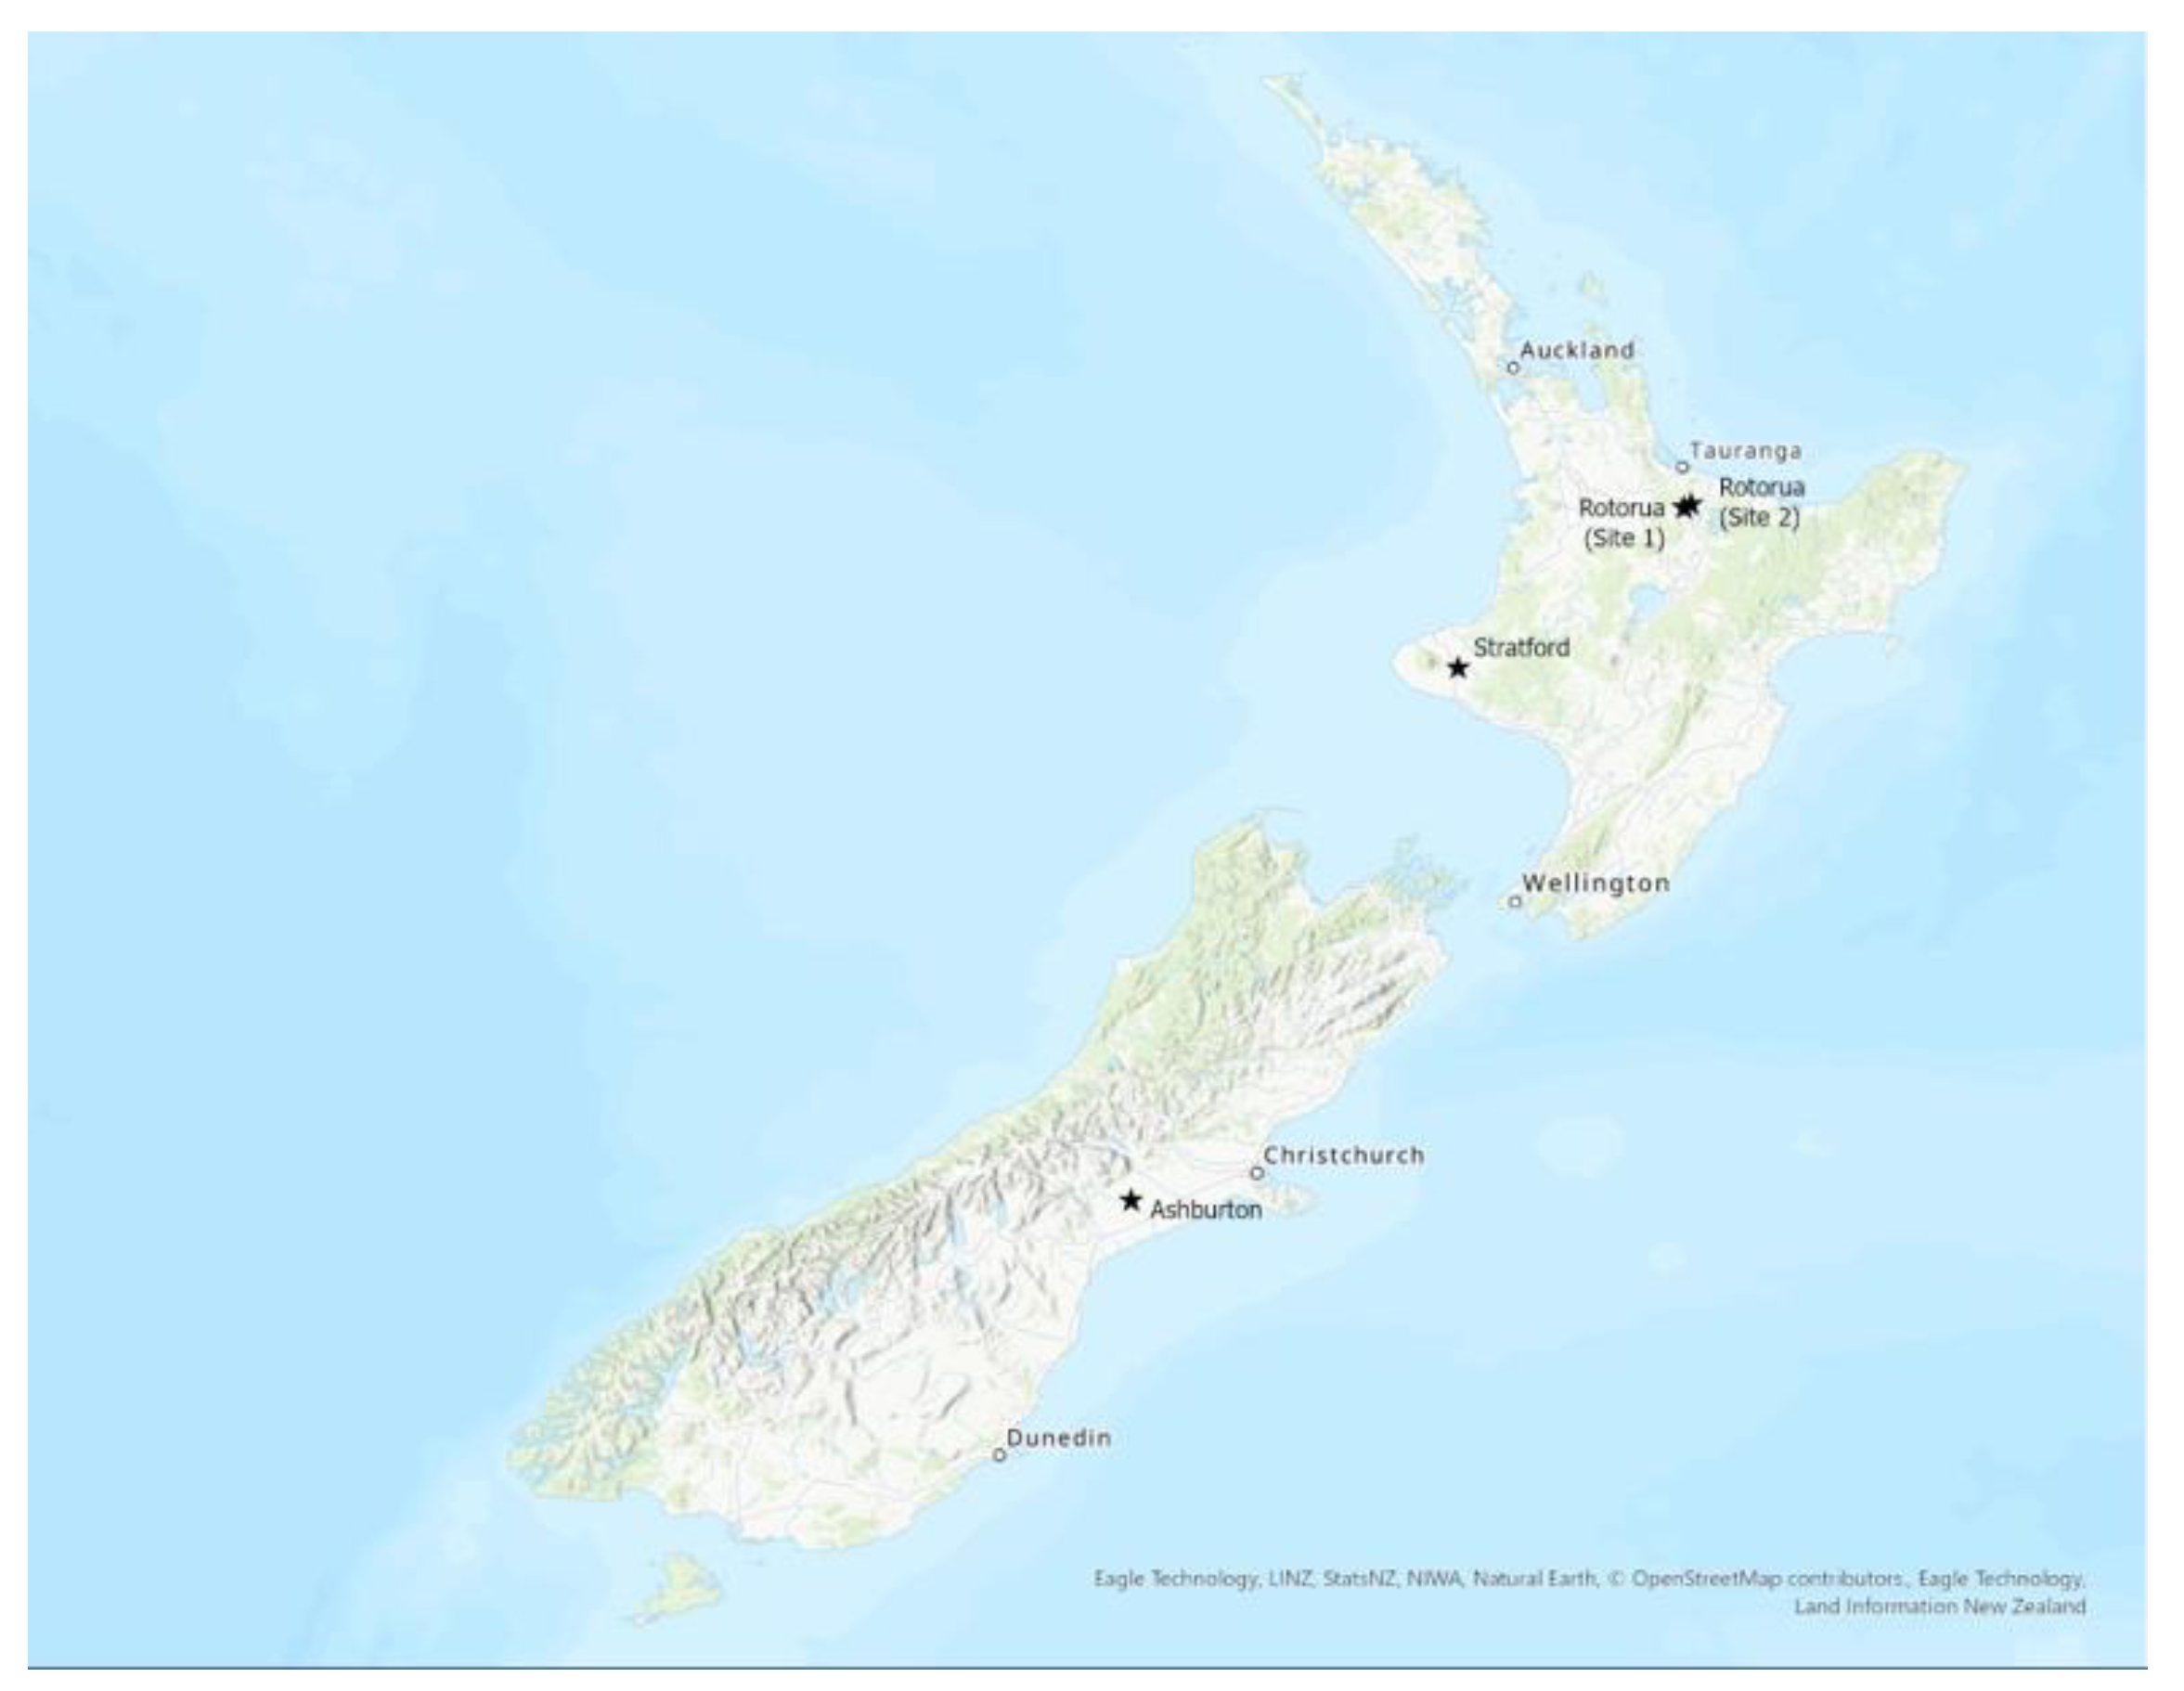
Figure 2.
Climate data for each experimental site was further used in the model simulations. Note: Max. Temp = maximum temperature and Min. Temp = minimum temperature.
Figure 2.
Climate data for each experimental site was further used in the model simulations. Note: Max. Temp = maximum temperature and Min. Temp = minimum temperature.
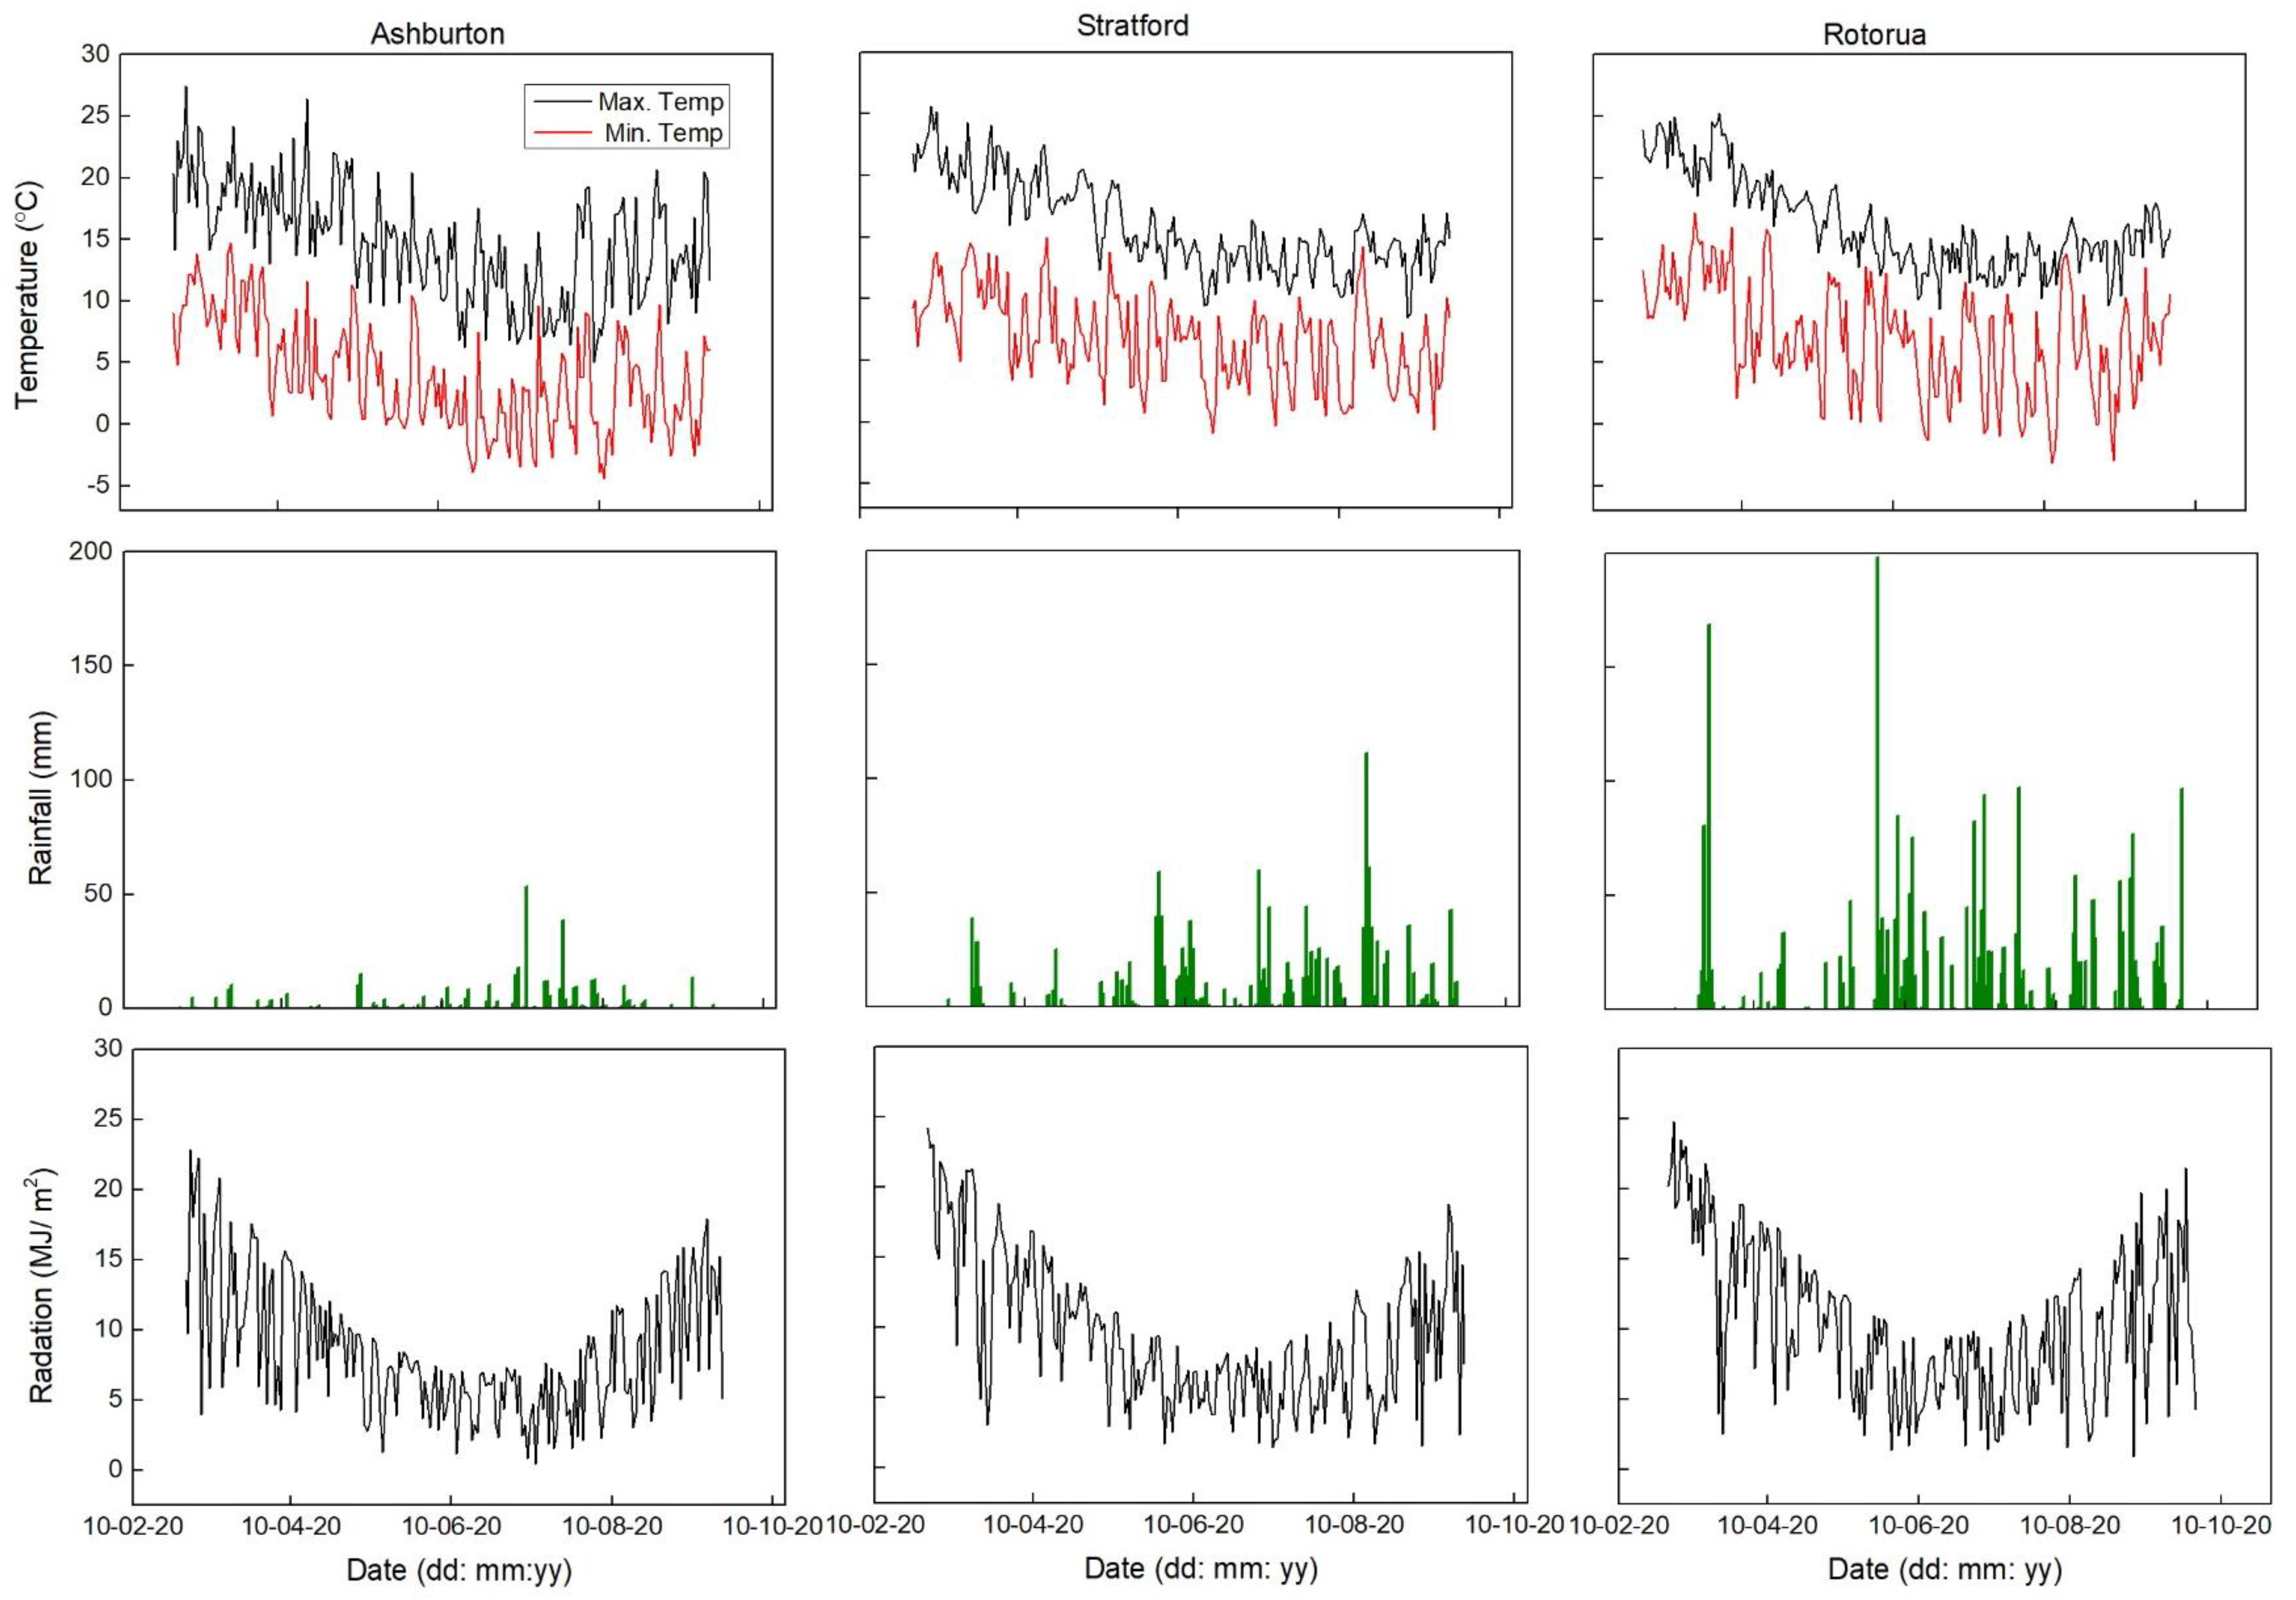
Figure 3.
The observed and simulated soil moisture data for Ashburton, Stratford, and Rotorua sites from 1 March 2022 to 29 September 2022.
Figure 3.
The observed and simulated soil moisture data for Ashburton, Stratford, and Rotorua sites from 1 March 2022 to 29 September 2022.

Figure 4.
Cumulative drainage for Ashburton, Stratford, and Rotorua simulated from 1 March 2022 to 29 September 2022.
Figure 4.
Cumulative drainage for Ashburton, Stratford, and Rotorua simulated from 1 March 2022 to 29 September 2022.
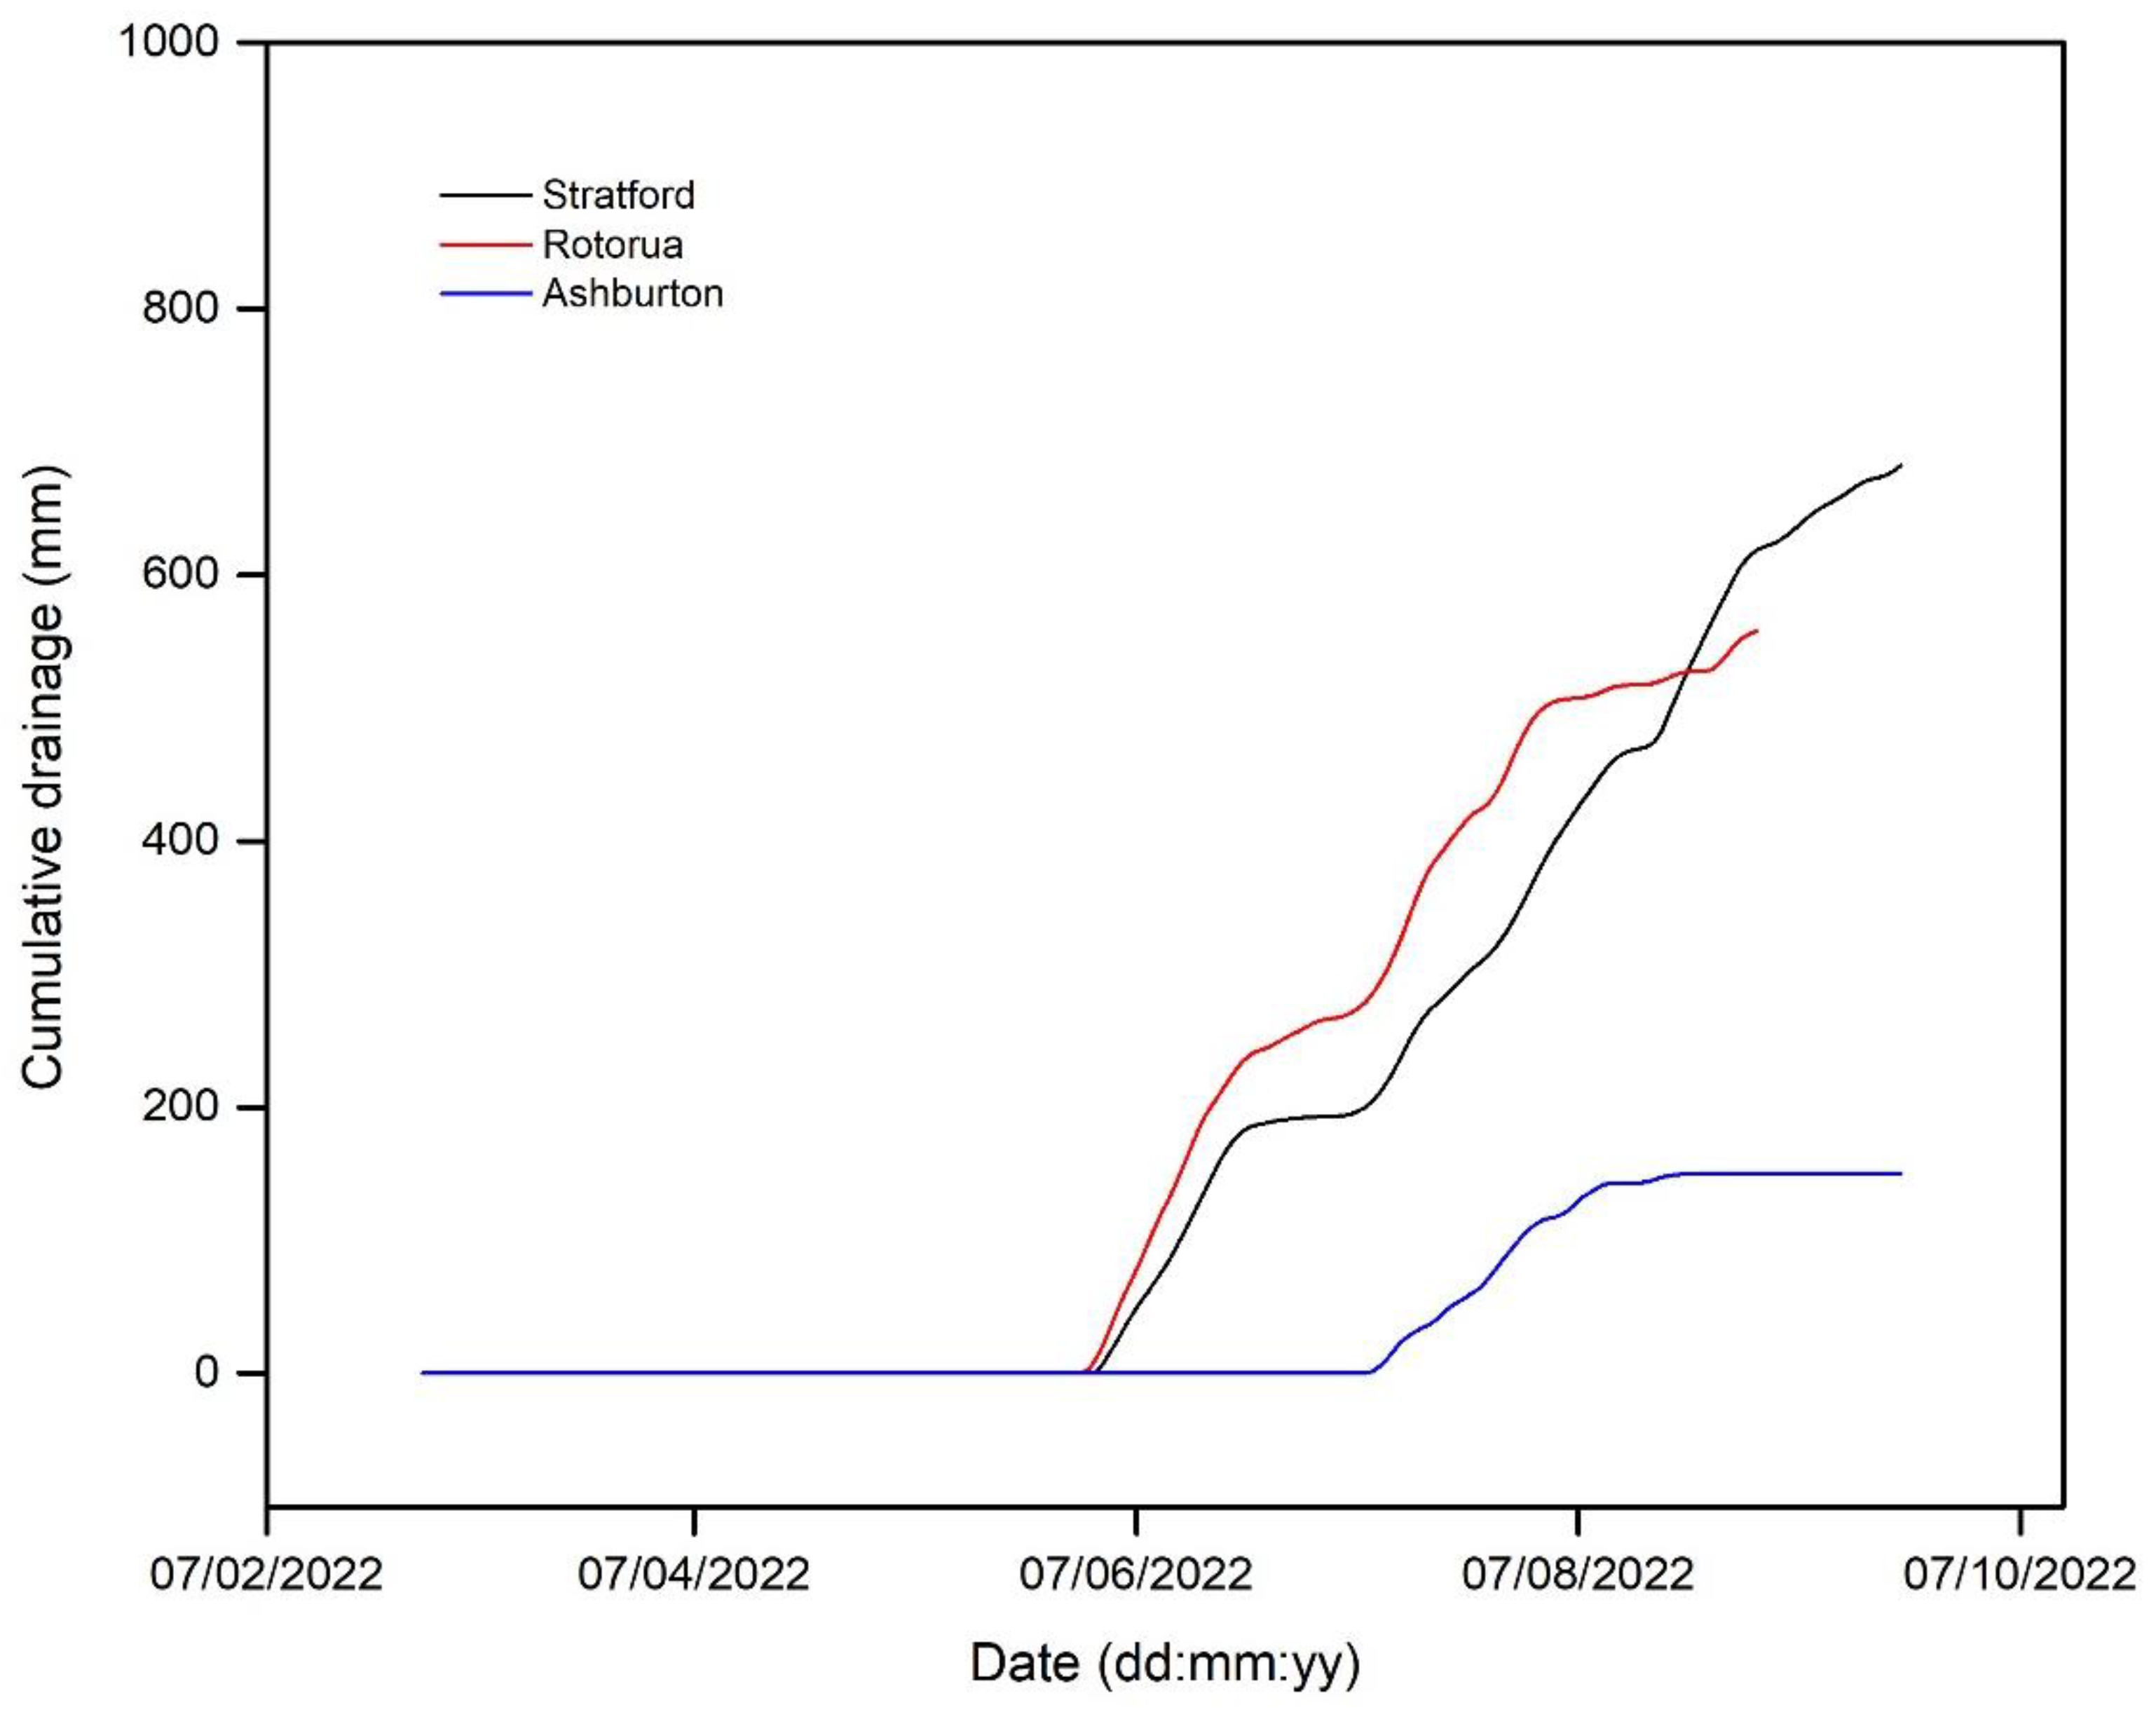
Figure 5.
APSIM simulated cumulative NO3−-N leaching in the Ashburton, Stratford, and Rotorua from the control, urine, and urine + GA treatments.
Figure 5.
APSIM simulated cumulative NO3−-N leaching in the Ashburton, Stratford, and Rotorua from the control, urine, and urine + GA treatments.
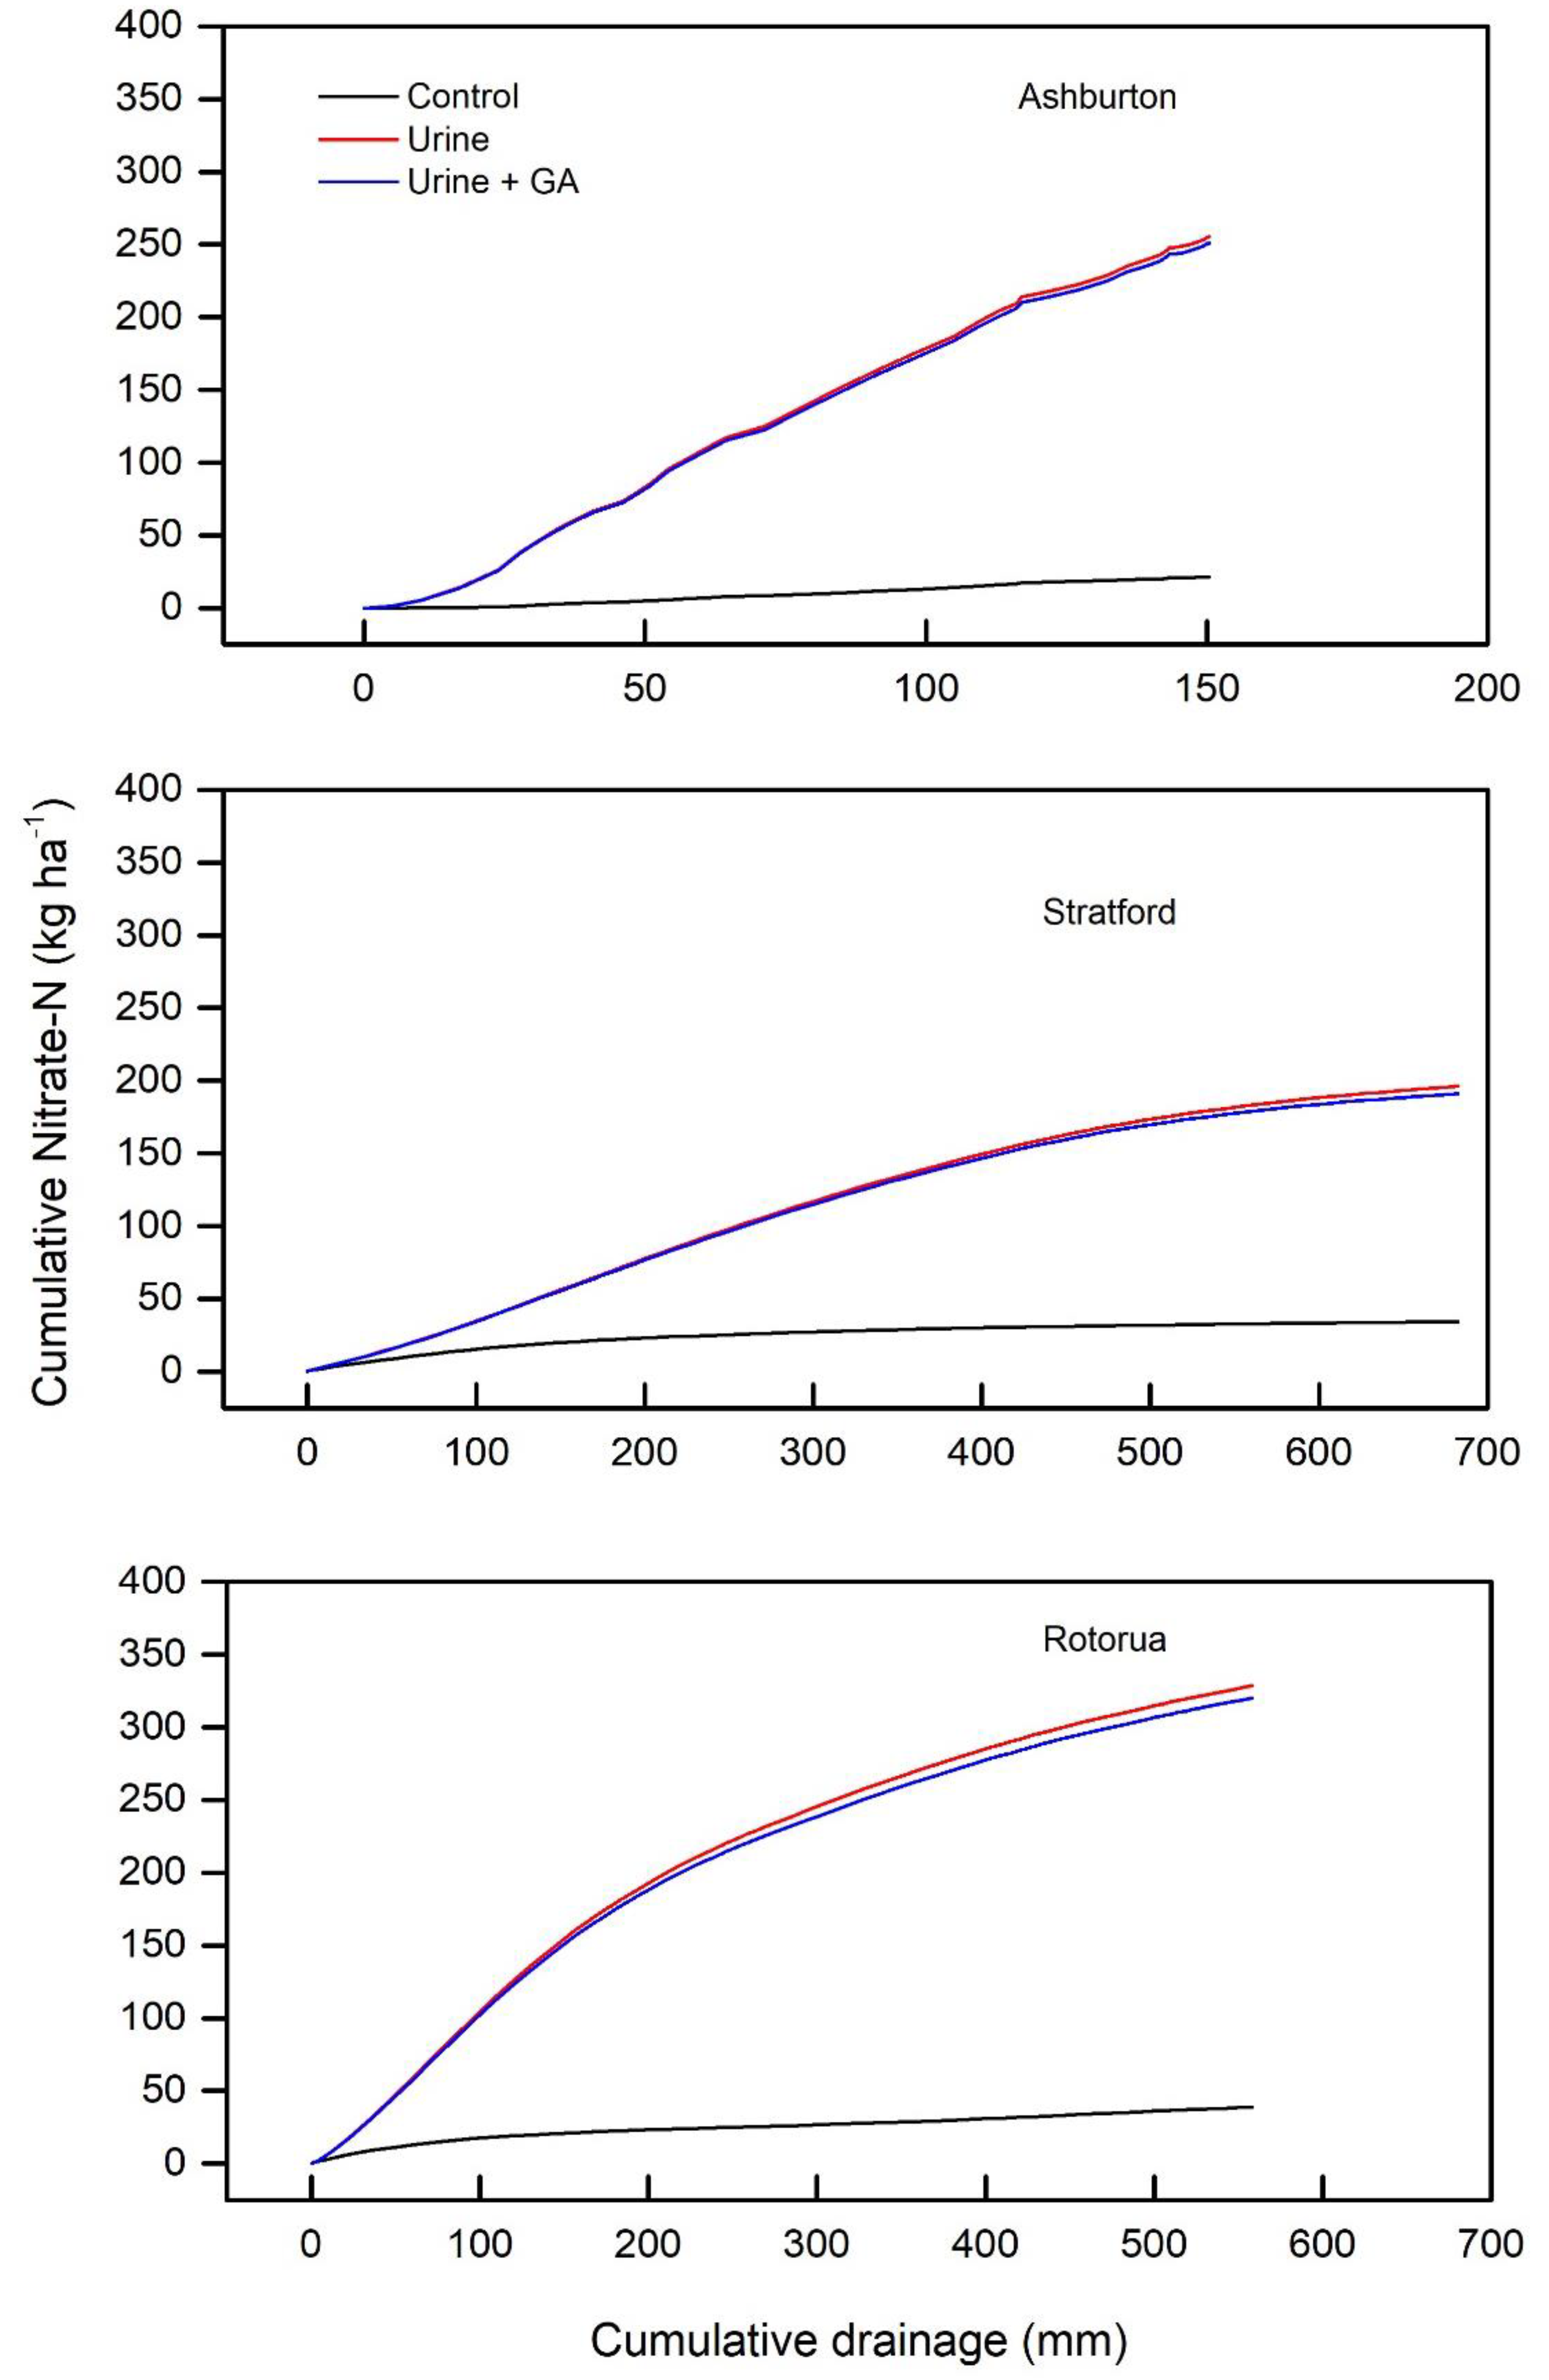
Figure 6.
Observed and simulated herbage DM matter yield results in the different treatments in Ashburton, Stratford, and Rotorua experimental sites.
Figure 6.
Observed and simulated herbage DM matter yield results in the different treatments in Ashburton, Stratford, and Rotorua experimental sites.


Table 1.
Description of treatments used in this experiment.
| No. | Treatments | Urine Application Rate (kg N ha−1) | Replicates |
|---|---|---|---|
| 1. | Control | Nil urine (only water) | 5 |
| 2. | Urine | 600 kg N ha−1 | 5 |
| 3. | Urine + ProGibb® SG (GA) at 8 g h−1 | 600 kg N ha−1 | 5 |
Table 2.
The treatments application dates and harvesting dates for each experimental site.
| Experimental Site | Application and Harvesting Dates | ||
|---|---|---|---|
| Application | Harvesting | ||
| Ashburton | 1st | 9 March 2022 | 11 April 2022 |
| 2nd | 11 April 2022 | 13 June 2022 | |
| 3rd | 10 May 2022 | 13 September 2022 | |
| Stratford | 1st | 1 April 2022 | 1 May 2022 |
| 2nd | 1 May 2022 | 20 June 2022 | |
| 3rd | 3 June 2022 | 4 September 2022 | |
| 1st | 5 April 2022 | 1 May 2022 | |
| Rotorua | 2nd | 4 May 2022 | 28 June 2022 |
| 3rd | 5 June 2022 | 28 September 2022 | |
Table 3.
Soil bulk density (BD), volumetric water content at saturation (SAT), drained upper limit (DUL), and lower limit at 15 metric bar pressure (LL15) used in APSIM for simulations in the three experimental sites.
Table 3.
Soil bulk density (BD), volumetric water content at saturation (SAT), drained upper limit (DUL), and lower limit at 15 metric bar pressure (LL15) used in APSIM for simulations in the three experimental sites.
| Soil Layer (cm) | BD (g cm−3) | SAT (mm mm−1) | DUL (mm mm−1) | LL15 (mm mm−1) | ||||||||
|---|---|---|---|---|---|---|---|---|---|---|---|---|
| Ashb | Strat | Roto | Ash | Strat | Roto | Ashb | Strat | Roto | Ashb | Strat | Roto | |
| 0–10 | 1.01 | 0.67 | 0.85 | 0.62 | 0.61 | 0.56 | 0.32 | 0.48 | 0.28 | 0.15 | 0.31 | 0.08 |
| 10–20 | 1.35 | 0.81 | 0.85 | 0.45 | 0.61 | 0.56 | 0.29 | 0.48 | 0.28 | 0.18 | 0.26 | 0.08 |
| 20–40 | 1.11 | 0.75 | 0.85 | 0.34 | 0.57 | 0.50 | 0.29 | 0.45 | 0.18 | 0.14 | 0.30 | 0.05 |
| 40–55 | 0.77 | 1.01 | 0.85 | 0.20 | 0.56 | 0.50 | 0.16 | 0.44 | 0.18 | 0.10 | 0.28 | 0.05 |
| 55–75 | 0.60 | 1.04 | 0.85 | 0.18 | 0.55 | 0.50 | 0.10 | 0.43 | 0.18 | 0.06 | 0.28 | 0.05 |
| 75–100 | 0.48 | 1.05 | 0.85 | 0.19 | 0.55 | 0.50 | 0.06 | 0.43 | 0.18 | 0.02 | 0.28 | 0.05 |
Note: Ashb = Ashburton; Strat = Stratford; Roto = Rotorua.
Table 4.
Soil organic carbon (OC), soil C/N ratio, and initial soil N used in APSIM for simulations in the three experimental sites.
Table 4.
Soil organic carbon (OC), soil C/N ratio, and initial soil N used in APSIM for simulations in the three experimental sites.
| Soil Layer (cm) | OC (%) | Soil C/N Ratio (g g−1) | Initial Soil N (mg kg−1) | ||||||
|---|---|---|---|---|---|---|---|---|---|
| Ashb | Strat | Roto | Ash | Strat | Roto | Ashb | Strat | Roto | |
| 0–10 | 4.8 | 12.3 | 7.30 | 10 | 15 | 10 | 4.5 | 5.0 | 21.0 |
| 10–20 | 4.8 | 12.3 | 7.30 | 10 | 15 | 10 | 3.0 | 5.0 | 11.0 |
| 20–40 | 4.8 | 4.0 | 5.00 | 10 | 15 | 10 | 3.0 | 5.0 | 6.0 |
| 40–55 | 0.8 | 3.1 | 3.43 | 10 | 15 | 10 | 3.0 | 5.0 | 4.0 |
| 55–75 | 0.6 | 2.8 | 3.07 | 10 | 15 | 10 | 3.0 | 5.0 | 4.0 |
| 75–100 | 0.5 | 2.7 | 2.82 | 10 | 15 | 10 | 3.0 | 5.0 | 4.0 |
Note: Ashb = Ashburton; Strat = Stratford; Roto = Rotorua.
Table 5.
Values for the coefficient of determination (R2) between modelled and measured herbage DM yield for each treatment.
Table 5.
Values for the coefficient of determination (R2) between modelled and measured herbage DM yield for each treatment.
| Treatment | Ashburton | Stratford | Rotorua |
|---|---|---|---|
| R2 | R2 | R2 | |
| Control | 0.9064 | 0.8562 | 0.9948 |
| Urine | 0.9384 | 0.9950 | 0.9845 |
| Urine + GA | 0.8920 | 0.9585 | 0.9660 |
Table 6.
Measured soil mineral N (NH4+-N + NO3−-N) (kg ha−1) at 0–30 cm depth during pasture harvest from each experimental site.
Table 6.
Measured soil mineral N (NH4+-N + NO3−-N) (kg ha−1) at 0–30 cm depth during pasture harvest from each experimental site.
| Treatments | Ashburton | Stratford | Rotorua | ||||||
|---|---|---|---|---|---|---|---|---|---|
| 11 April 2022 | 13 June 2022 | 13 September 2022 | 1 May 2022 | 20 June 2022 | 4 September 2022 | 1 May 2022 | 28 June 2022 | 28 September 2022 | |
| Control | 49 | 255 | 53 | 72 | 90 | 49 | 85 | 180 | 57 |
| Urine | 493 | 218 | 29 | 345 | 87 | 67 | 254 | 119 | 75 |
| Urine-Control | 445 | −37 | −24 | 273 | −3 | 18 | 169 | −61 | 18 |
Table 7.
The initial soil mineral N (NH4+-N + NO3−-N) (kg ha−1) in each site before urine application.
Table 7.
The initial soil mineral N (NH4+-N + NO3−-N) (kg ha−1) in each site before urine application.
| Treatments | Ashburton | Stratford | Rotorua | ||||||
|---|---|---|---|---|---|---|---|---|---|
| 9 March 2022 | 11 April 2022 | 10 May 2022 | 1 April 2022 | 1 May 2022 | 3 June 2022 | 4 April 2022 | 4 May 2022 | 5 June 2022 | |
| Control | 40 | 49 | 109 | 80 | 62 | 119 | 101 | 87 | 213 |
Disclaimer/Publisher’s Note: The statements, opinions and data contained in all publications are solely those of the individual author(s) and contributor(s) and not of MDPI and/or the editor(s). MDPI and/or the editor(s) disclaim responsibility for any injury to people or property resulting from any ideas, methods, instructions or products referred to in the content. |
© 2023 by the authors. Licensee MDPI, Basel, Switzerland. This article is an open access article distributed under the terms and conditions of the Creative Commons Attribution (CC BY) license (https://creativecommons.org/licenses/by/4.0/).
Share and Cite
MDPI and ACS Style
Matse, D.T.; Avendano, F.; Bishop, P.; Jeyakumar, P.; Bates, G. Simulating Gibberellic Acid Effect on Pasture Yield on Naturally Deposited and Fixed Area Urine. Environments 2023, 10, 112. https://doi.org/10.3390/environments10070112
AMA Style
Matse DT, Avendano F, Bishop P, Jeyakumar P, Bates G. Simulating Gibberellic Acid Effect on Pasture Yield on Naturally Deposited and Fixed Area Urine. Environments. 2023; 10(7):112. https://doi.org/10.3390/environments10070112
Chicago/Turabian StyleMatse, Dumsane Themba, Fernando Avendano, Peter Bishop, Paramsothy Jeyakumar, and Geoff Bates. 2023. "Simulating Gibberellic Acid Effect on Pasture Yield on Naturally Deposited and Fixed Area Urine" Environments 10, no. 7: 112. https://doi.org/10.3390/environments10070112
Note that from the first issue of 2016, this journal uses article numbers instead of page numbers. See further details here.