Article

Export Coefficient Modelling of Nutrient Neutrality to Protect Aquatic Habitats in the River Wensum Catchment, UK

School of Environmental Sciences, University of East Anglia, Norwich Research Park, Norwich NR4 7TJ, UK
*
Author to whom correspondence should be addressed.
Environments 2023, 10(10), 168; https://doi.org/10.3390/environments10100168
Submission received: 16 August 2023 / Revised: 20 September 2023 / Accepted: 23 September 2023 / Published: 27 September 2023
(This article belongs to the Special Issue Groundwater Quality in the UK; a Continuing Challenge)

Abstract

:
The pressure of nutrient pollution derived from wastewater treatment works and agricultural runoff is a reason for the decline in the ecological health of aquatic habitats. Projected residential development in catchments creates further nutrient loading that can be offset by nutrient management solutions that maintain ‘nutrient neutrality’ either onsite or elsewhere within the same catchment. This study developed an export coefficient model in conjunction with detailed farm business data to explore a nature-based solution to nutrient neutrality involving seven scenarios of crop conversion to mixed woodland or grazing grass in an area of intensive arable cultivation in the groundwater-fed Blackwater sub-catchment of the River Wensum, UK. When compared with the monitored riverine export of nutrients, the calculated nitrogen (N) and phosphorus (P) inputs under current land use showed that subsurface denitrification is removing 48–78% of the leached N and that P is accumulating in the field soils. The addition of 235 residential homes planned for 2018–2038 in the Blackwater will generate an additional nutrient load of 190 kg N a−1 and 4.9 kg P a−1. In six of the seven scenarios, the modelled fractions of crop conversion (0.02–0.21) resulted in the required reduction in P loading and more than sufficient reduction in N loading (196–1874 kg a−1 for mixed woodland and 287–2103 kg a−1 for grazing grass), with the additional reduction in N load above the requirement for nutrient neutrality potentially contributing to further improvement in water quality. The cost of land conversion is modelled in terms of crop gross margins and nutrient credits generated in the form of 0.1 kg units of N or P. For the range of scenarios considered, the annual cost per credit ranged from GBP 0.78–11.50 for N for mixed woodland (GBP 0.74–7.85 for N for grazing grass) and from GBP 160–782 for P for both scenarios. It is concluded that crop conversion is a viable option to achieve nutrient neutrality in arable catchments in eastern England when considered together with other nutrient management solutions.

1. Introduction

Elevated nutrient levels in the environment can cause eutrophication, hypoxia events, loss of biodiversity, and habitat degradation in freshwater and coastal ecosystems [1,2,3,4,5]. A major cause of the decline in the ecological health of aquatic environments is the pressure of nutrient pollution derived from wastewater treatment works and agricultural runoff [6,7,8]. In the UK, under the Habitats Regulations [9], local planning authorities and the Environment Agency in England and Wales must assess the environmental impacts of planning applications that affect protected habitat sites [10]. For sites in unfavourable condition due to excess nutrient pollution, the intention is that development plans can only proceed if the increase in wastewater that is produced by the projected population increase will not cause additional pollution, in other words, by maintaining ‘nutrient neutrality’.
Nutrient neutrality involves mitigating the nutrient load from a new development either onsite or elsewhere within the same catchment as the protected habitat. Potential nutrient management options include agricultural runoff management solutions (for example, retiring agricultural land to reduce fertiliser and manure applications and the use of post-harvest cover crops to reduce residual nutrient losses); nature-based solutions (for example, reforesting marginal, often unprofitable cropland, creating new wetlands to strip nutrients from water, and creating nutrient buffer zones along rivers and other watercourses); wastewater management solutions (for example, improving existing wastewater treatment infrastructure and upgrading existing private sewage systems); and demand management solutions (for example, retrofitting water-saving measures in existing properties) [5,11,12,13,14,15,16,17].
Nutrient neutrality, an example of water quality trading, is an economical and efficient mechanism for controlling excess nutrient loads in catchments through the generation of ‘credits’ from nutrient management solutions that are sold to buyers facing restrictions imposed by environmental quality standards [18,19]. Various models in support of water quality trading have been developed to simulate the behaviour of non-point (diffuse) and point source pollution to predict the water quality impact of a proposed set of trades where the credit will be needed [18]. Additionally, the application of optimisation models can manage the complications that arise in nutrient trading, for example, multiple types of pollutants, different attenuation rates in surface water and groundwater bodies, and catchment-specific environmental constraints [19]. Transaction costs associated with water quality trading are often assumed to be low (as assumed in this study), resulting in wide participation, but it is recognised that the reasons for the failure of nutrient trading schemes are often high transaction costs, few participants, and over-restrictive trading rules [20,21].
Water quality trading schemes often apply several types of trading ratios to accommodate uncertainty, particularly if diffuse sources of pollution are involved, and to ensure protection of water quality. Typically, various ratios account for the loss (natural attenuation) of a pollutant during its transport from its source to the receiving water body or to accommodate uncertainty in a nutrient management solution. Of the types of trading ratio that can be applied, a ‘delivery ratio’ applies a discount factor to compensate for the distance travelled by a pollutant, based on the concept that the greater the distance travelled, the greater the pollutant attenuation [22]. Ratios are expressed as percentages when they indicate less than one full credit or offset value. Alternatively, numeric ratios (for example, 2:1, 1:1) are used when trading partners buy or sell more than one full credit or offset [18]. For example, over 50 km, a 1% km−1 factor would result in 50% attenuation, equal to a 2:1 credit trading ratio.
The research reported in this study derives from the Demonstration Test Catchment (DTC) research platform, a UK government initiative established in 2010 by the Department for Environment, Food and Rural Affairs that worked in four English catchments to evaluate the extent to which on-farm mitigation measures could cost-effectively reduce the impacts of agricultural water pollution on river ecology while maintaining food production capacity [23]. Each DTC focused on a different type of farming system, for example, intensive arable cultivation in the River Wensum DTC in Norfolk, eastern England. The central components of the DTC platform were the establishment of a comprehensive network of automated web-based sensor technologies to generate high-temporal resolution empirical datasets of the surface water, soil water, groundwater, and meteorological parameters, as well as the collection of farm business data relating to cropping patterns, fertiliser applications, and crop yields.
Focusing on the evidence collected by the River Wensum DTC in the upper Blackwater sub-catchment, and with the aim of exploring nutrient neutrality in support of development plans, this paper (i) compares nutrient inputs calculated from farm business data with exported nutrient loads obtained from high-temporal resolution monitoring of nitrogen (N) and phosphorus (P) for a three-year period (2011–2014) to investigate the natural attenuation potential in the sub-catchment; (ii) applies an export coefficient model to explore the changes in land use necessary to mitigate additional nutrient inputs arising from an increase in residential housing in the sub-catchment; and (iii) translates the required changes in land use necessary to achieve nutrient neutrality into N and P credits and their associated costs. Although examples of water quality trading schemes date back to at least the 1980s in the US [18,19], there are fewer programmes in other countries [24,25,26], and such schemes are only now in development in the UK [27,28,29]. Hence, the study presented here, which is informed by the scheme currently in development by local planning authorities in support of the Wensum Special Area of Conservation [30], is one of the first to be reported in the literature for the UK. The study is novel in combining high-temporal resolution catchment data and detailed farm business data to provide insight into the sources and processes affecting nutrient runoff in an arable system and the potential mitigation measures, including their cost, to reduce nutrient concentrations as a result of urban development.

2. Study Area and Experimental Methods
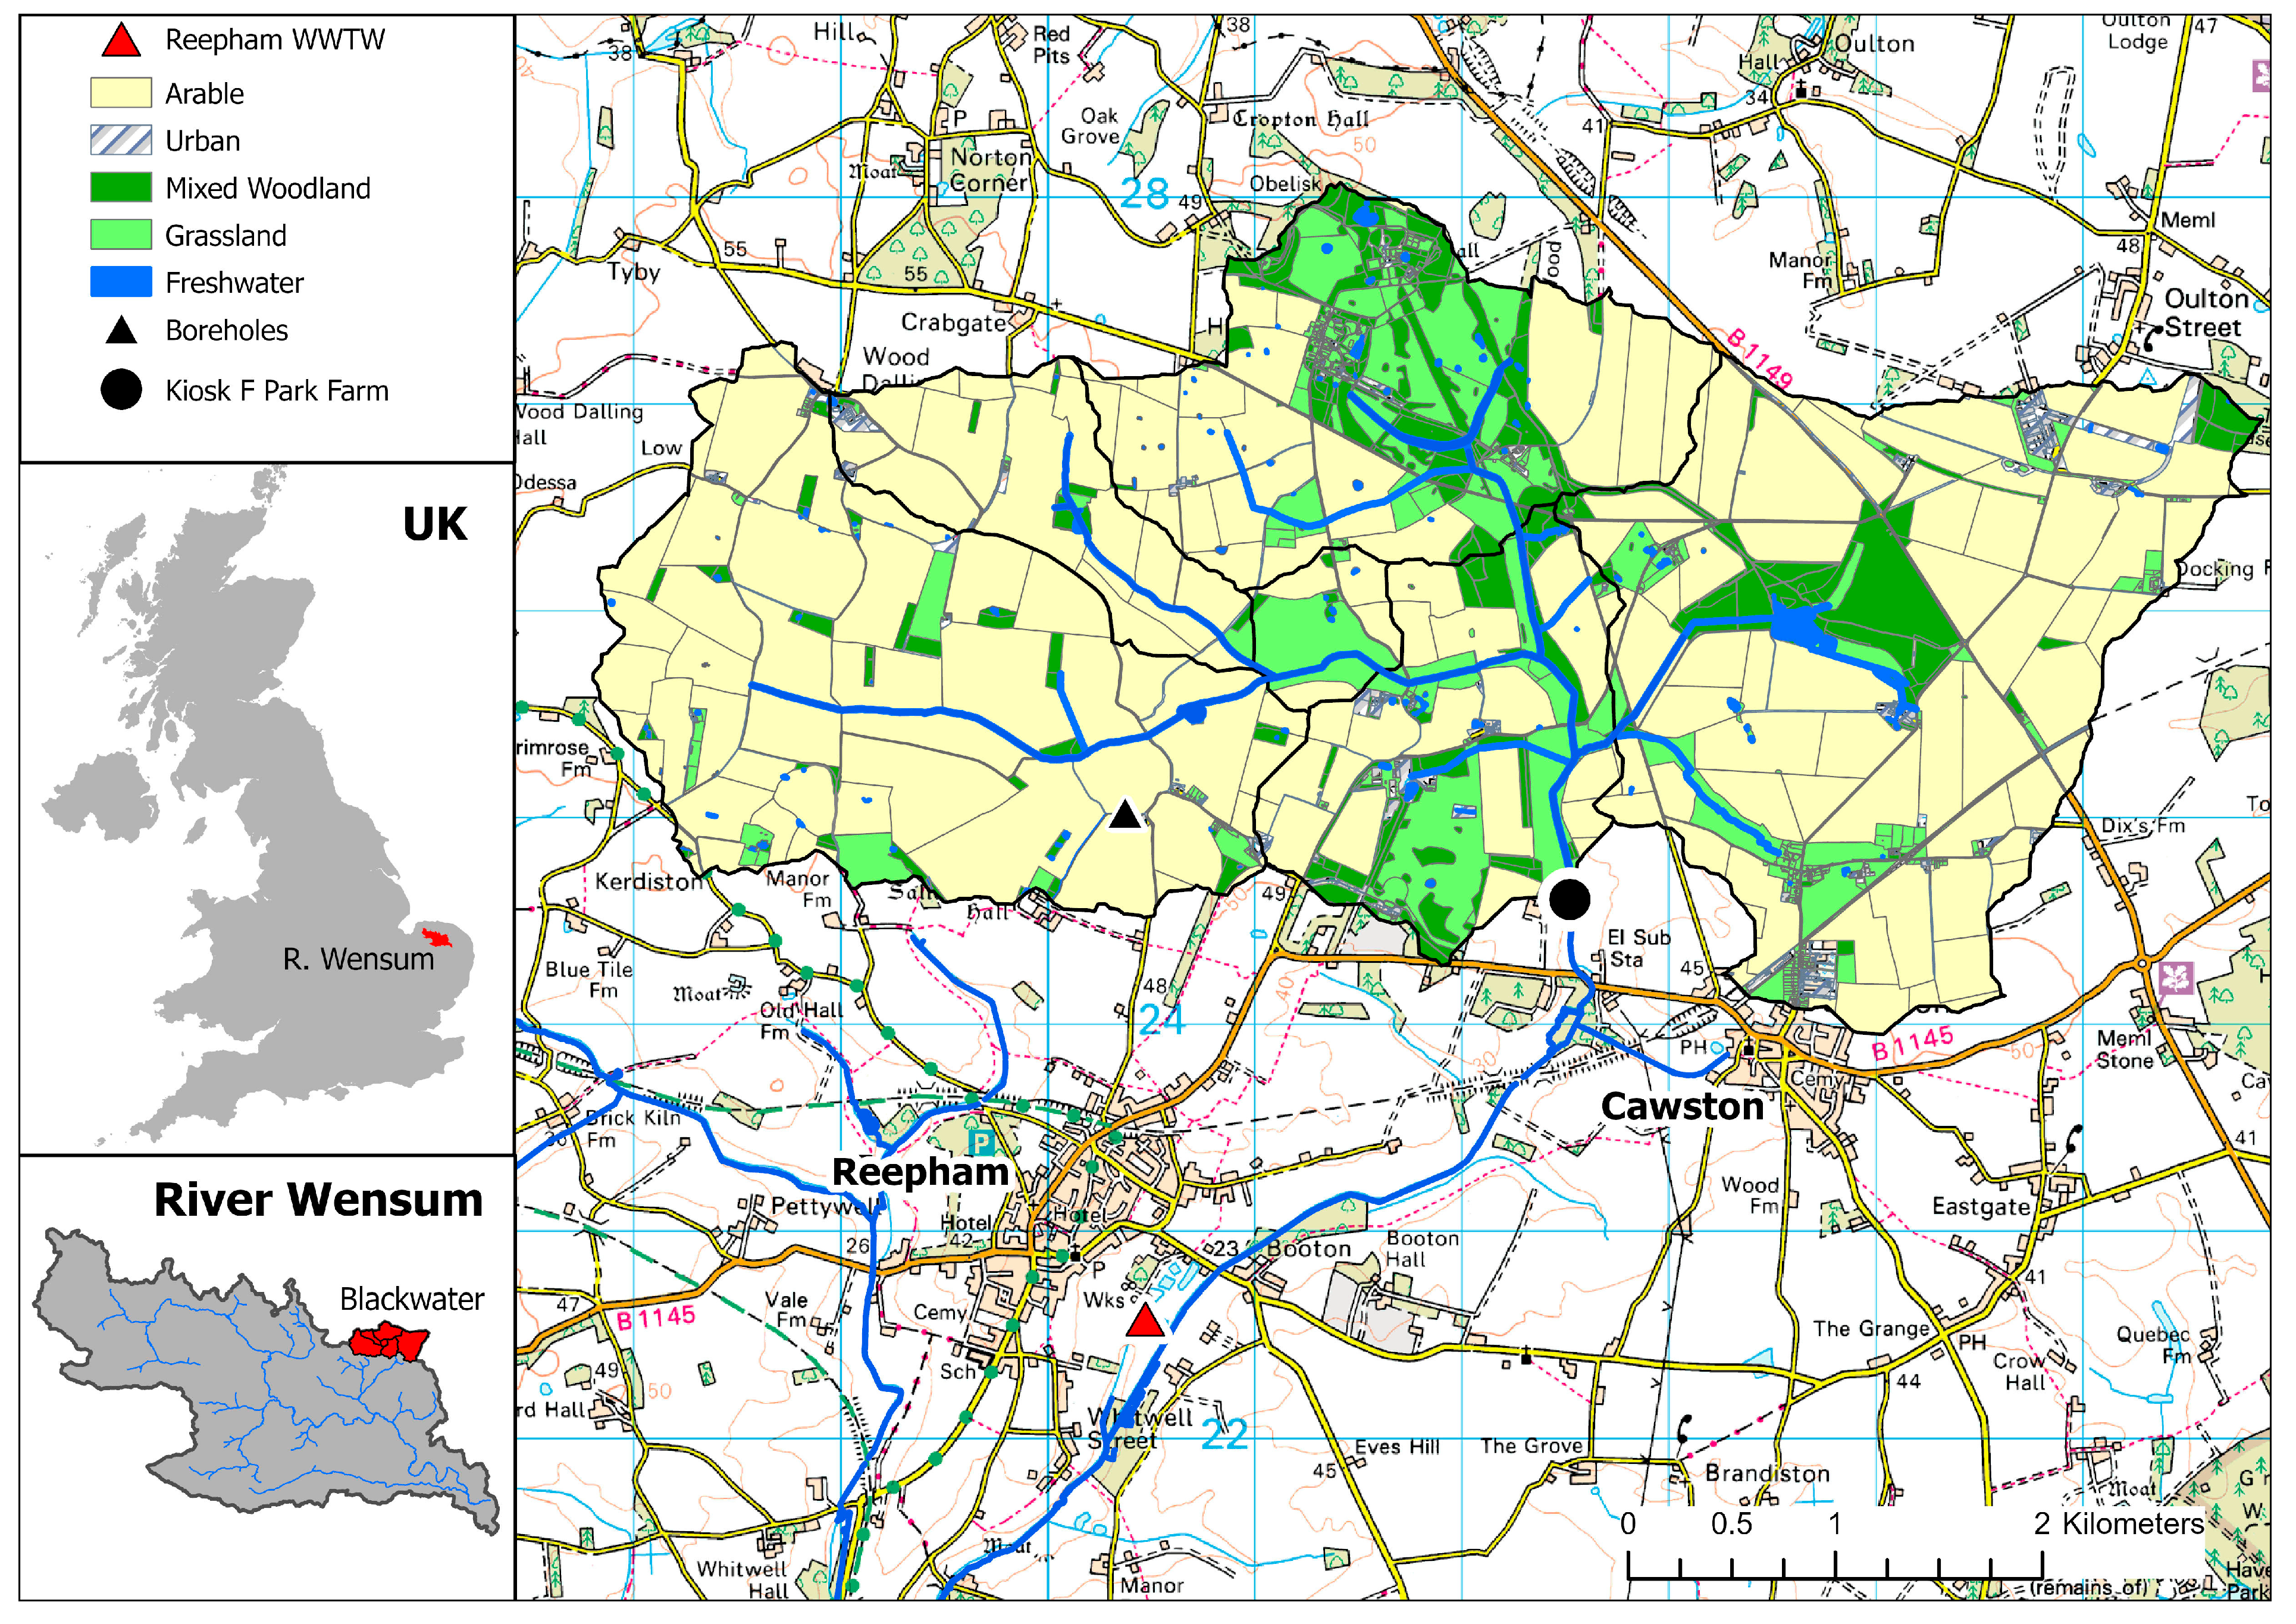
2.1. Study Area

The River Wensum is a 78 km long, lowland calcareous river in Norfolk, with a catchment area of 660 km2 (52°47′09″ N, 01°07′00″ E) (Figure 1). This groundwater-dominated catchment has a mean annual discharge of 4.1 m3 s−1 near its outlet [31] and annual baseflow indices (BFIs) ranging from 0.75 in the lower part of the catchment, where the underlying Cretaceous Chalk aquifer is confined by superficial Pleistocene glacial deposits, to 0.82 in the upper part of the catchment, where the Chalk outcrops.
In 1993, a 71 km stretch of the River Wensum was designated a whole-river Site of Special Scientific Interest (SSSI) in recognition of it being one of the best examples of a lowland calcareous river system in the UK [33]. In 2001, the Wensum was given further European Special Area of Conservation (SAC) status due to the diversity of its internationally important flora and invertebrate fauna. However, the ecological condition of the Wensum has declined, with 99.4% of the protected habitat considered to be in an unfavourable or declining state, due primarily to excessive sediment and nutrient loadings from agriculture and sewage treatment works [33,34,35]. Changes in winter (+13%) and summer (−7%) river discharge over the past two decades have increased the risk of diffuse pollution mobilisation and reduced the dilution of point source pollutants, respectively [34]. By 2022, EU Water Framework Directive compliance fell to just 46% for P and 1.8% for N [34].
The Wensum catchment is divided into 20 sub-catchments, including the 19.7 km2 upper Blackwater sub-catchment. The mean slope in the sub-catchment is 1.2°, with minimum and maximum topographic elevations of 25.3 m and 70.2 m above sea level, respectively. The area experiences a temperate maritime climate, with a mean annual temperature of 10.5 °C and a mean annual precipitation total of 684 mm (1991–2020) [36].
The bedrock geology in the Blackwater sub-catchment is Cretaceous Chalk (>20 m thickness) and Pleistocene Wroxham Crag (sand and gravel; 0–23.5 m thickness) overlain by a variable succession of superficial deposits comprising Mid-Pleistocene chalky, flint-rich, argillaceous glacial tills of the Sheringham Cliffs Formation (Bacton Green Till Member; 22 m maximum thickness) and Lowestoft Formation (Lowestoft Till Member; 38 maximum thickness), with interdigitated bands of glaciofluvial and glaciolacustrine sands and gravels [37,38]. Soils developed on the glacial deposits are predominantly clay loam to sandy clay loam (<0.5 m depth) of the argillic brown earths (Freckenham series) and stagnogley (Beccles series) groups which, together with the argillaceous tills, result in moderately impeded drainage conditions. Much of the western part of the sub-catchment with clay loam soils is extensively under-drained by a dense network of agricultural tile drains installed at depths of 100–160 cm below ground level. Measured drain discharges are typically less than 0.2 L s−1, although they can be as high as 10 L s−1 during the winter and dry up entirely during the summer (June–September), with discharge also varying greatly depending upon depth, catchment area, and antecedent moisture conditions [39]. The eastern part is more freely draining, comprised of glacial sands and gravels with relatively well-drained sandy loam soils.
Land use in the upper Blackwater sub-catchment remains relatively unchanged in the last decade and is predominantly arable (75%), with some improved grassland and fresh water (13%), mixed woodland (10%), and urban settlements (2%) (Figure 1) [32,40]. Typical arable crops grown in rotation include winter wheat, winter and spring barley, winter oilseed rape, sugar beet, spring beans, and potatoes. Key trends in arable farming in the last decade include less winter oilseed rape because of flea beetle damage [41], particularly in southern England, more barley, and fewer sugar beet crops. Sugar beet has tended to become restricted to farms that grow this crop successfully and are near one of the four processing factories, as is the case for farms in upper Blackwater.
The main settlements are Cawston and Reepham in the lower Blackwater sub-catchment, with a combined population of 3426 recorded at the time of the 2021 national population census [42]. Development plans for Cawston and Reepham include 235 new houses to be built between 2018 and 2038 [43,44]. With an average occupancy of 2.24 persons per household in the local administrative district of Broadland [42], the additional development represents a population increase of 527, with projected average water use of 110 L person−1 day−1, as required for new houses [45]. Cawston and Reepham are served by a wastewater treatment works (Figure 1) that currently discharges treated wastewater with mean nutrient concentrations of 25.0 mg N L−1 and 0.83 mg P L−1 to the Blackwater, with a reduction to 9.0 mg N L−1 and 0.23 mg P L−1 following the current upgrading of the plant, to be completed by April 2024 [30,46].

2.2. Experimental Design

The experimental design comprised two approaches. First, and to assess the possibility of natural attenuation of nutrients in catchment runoff, high-temporal resolution datasets of N and P concentrations for the upper Blackwater for the hydrological years 2011–2014 were used to calculate the export of nutrients from the sub-catchment for comparison with N and P inputs calculated using farm business data for the same three-year period. Second, and with the purpose of investigating the extent of changes in land use necessary to mitigate the impact of urban development on the overall catchment nutrient budget, an export coefficient model was developed to test seven arable crop conversion scenarios for the farm business year 2013–2014, with the results being expressed as the number of credits and associated annual costs to achieve nutrient neutrality. However, the model does not include consideration of the administrative, legal, and practical costs to convert land use or the costs of monitoring nutrient management solutions.
The scenarios considered arable land conversion to mixed woodland, for example, extending woodland in the riparian zone on less productive agricultural land or on less accessible areas such as field corners that are more difficult to cultivate. Creation of woodlands can offer a lasting outcome for nutrient mitigation, and such woodlands will, in most cases, be in place for the lifetime of a proposed development, generally interpreted to be 80–125 years. A second option of arable land conversion to grazing grass was also considered. While such a mitigation measure may be established more quickly to reduce nutrient loads, it may not provide as lasting an outcome, unless secured in perpetuity, but may provide short-term mitigation before alternative, longer-term measures become effective [16].

2.3. Field Methods

At the outlet of the upper Blackwater sub-catchment (Site F, Figure 1), an installed bankside monitoring kiosk recorded semi-continuous measurements of river water quality parameters at 30 min resolution. The monitoring station measured nitrate-N (Nitratax SC optical probe, Hach Lange Ltd., Manchester, UK), total P, and total reactive P (Hach Lange Sigmatax SC combined with a Phosphax Sigma) [47]. The river stage at the monitoring station was measured using a pressure transducer housed in a stilling well (Impress IMSL Submersible Level Transmitter, RS Hydro Ltd., Bromsgrove, UK) and converted into river discharge via stage-discharge rating curves constructed from manual flow gauging with an open-channel EM flow meter [47,48]. A set of boreholes located in the west of the sub-catchment were drilled to depths of 50, 15, 12, and 6 m into the Chalk, Lowestoft Till clay silt, Sheringham Cliffs glacial sands, and Bacton Green chalk-rich till, respectively (Figure 1). Each borehole was equipped with a pressure transducer (Mini-Diver, Schlumberger, Houston, TX, USA), which recorded temperature and pressure every 15 min. Data were barometrically compensated by linear interpolation using a barometer located at the borehole set (BARO, Schlumberger) [47]. A summary of the hydrometric data collected for the hydrological years 2012−2014 is provided in Table 1.

2.4. Export Coefficient Modelling

The export coefficient model presented in this study was constructed in Microsoft Excel (Microsoft Corporation, Redmond, Washington, DC, USA) and is based on the premise that the nutrient load exported from a catchment equals the sum of the losses from individual sources, an approach that has been used successfully in many studies with reliable accuracy [49,50,51,52,53,54,55]. The model equations and modelling procedures account for several nutrient export factors, such as the inputs of N and P to the catchment, human settlements, land management practices, and livestock [49,56]. The model equation is as follows:
L = i = 1 n E i × A i × I i + p
where L = mass of nutrient leached (kg); E = export coefficient for nutrient source, i; A = catchment area (ha) occupied by a specific land use/crop type, or number of livestock or people; I = input of nutrients to source, i (kg ha−1); and p = input of nutrients from precipitation (kg ha−1). The export coefficients are based on both the intrinsic nutrient retention and export capacity of each crop and the applied land management practice. For livestock and humans, the export coefficient expresses the proportion of waste released that is subsequently returned to the catchment as either an organic manure fertiliser or through a wastewater treatment works.
The export coefficients adopted in this study, including nutrient inputs for grazing grass, mixed woodland, and rural settlements, were derived from published studies in areas of England with similar physical conditions, such as soil type, topography, and nutrient management practices [49,57]. N and P inputs for rainfall were based on concentration data, respectively, for a rain gauge in the Blackwater sub-catchment for samples collected from April–June 2012 (volume weighted mean NO3–N = 0.17 mg L−1, n = 20) [58] and at a coastal site in northern Germany for samples collected from 1995–2017 (median PO4–P = 0.016 mg L−1, n = 2235) [59]. Rainfall volumes measured in the Blackwater sub-catchment during the three hydrological years 2011–2012, 2012–2013, and 2013–2014 were, respectively, 683, 633, and 706 mm. During these years, a notably dry autumn (September–November) was experienced in 2011 (46% of long-term average rainfall), and a wet spring and summer (March–August) in 2012 (160% of long-term average rainfall).
The export coefficient model developed for the upper Blackwater sub-catchment used detailed farm business data collected as part of the Wensum DTC from landowners for the farm business years 2011–2014. The spatial distribution of arable crop types in these three years and their associated fertiliser N and P applications are shown in Figure 2. As well as crop type, data collected for farm holdings included the timing and type of in-field operations, fertiliser products and application rates, harvest dates, and crop yields.
The base model was adapted to consider whether the additional loading of nutrients from the projected housing development in the urban settlements of Cawston and Reepham in the lower Blackwater sub-catchment could be compensated by changes in land use in the upper Blackwater sub-catchment. Changes in land use and the associated costs were investigated for the 2013–2014 harvest year using crop enterprise data [60].

3. Results and Discussion

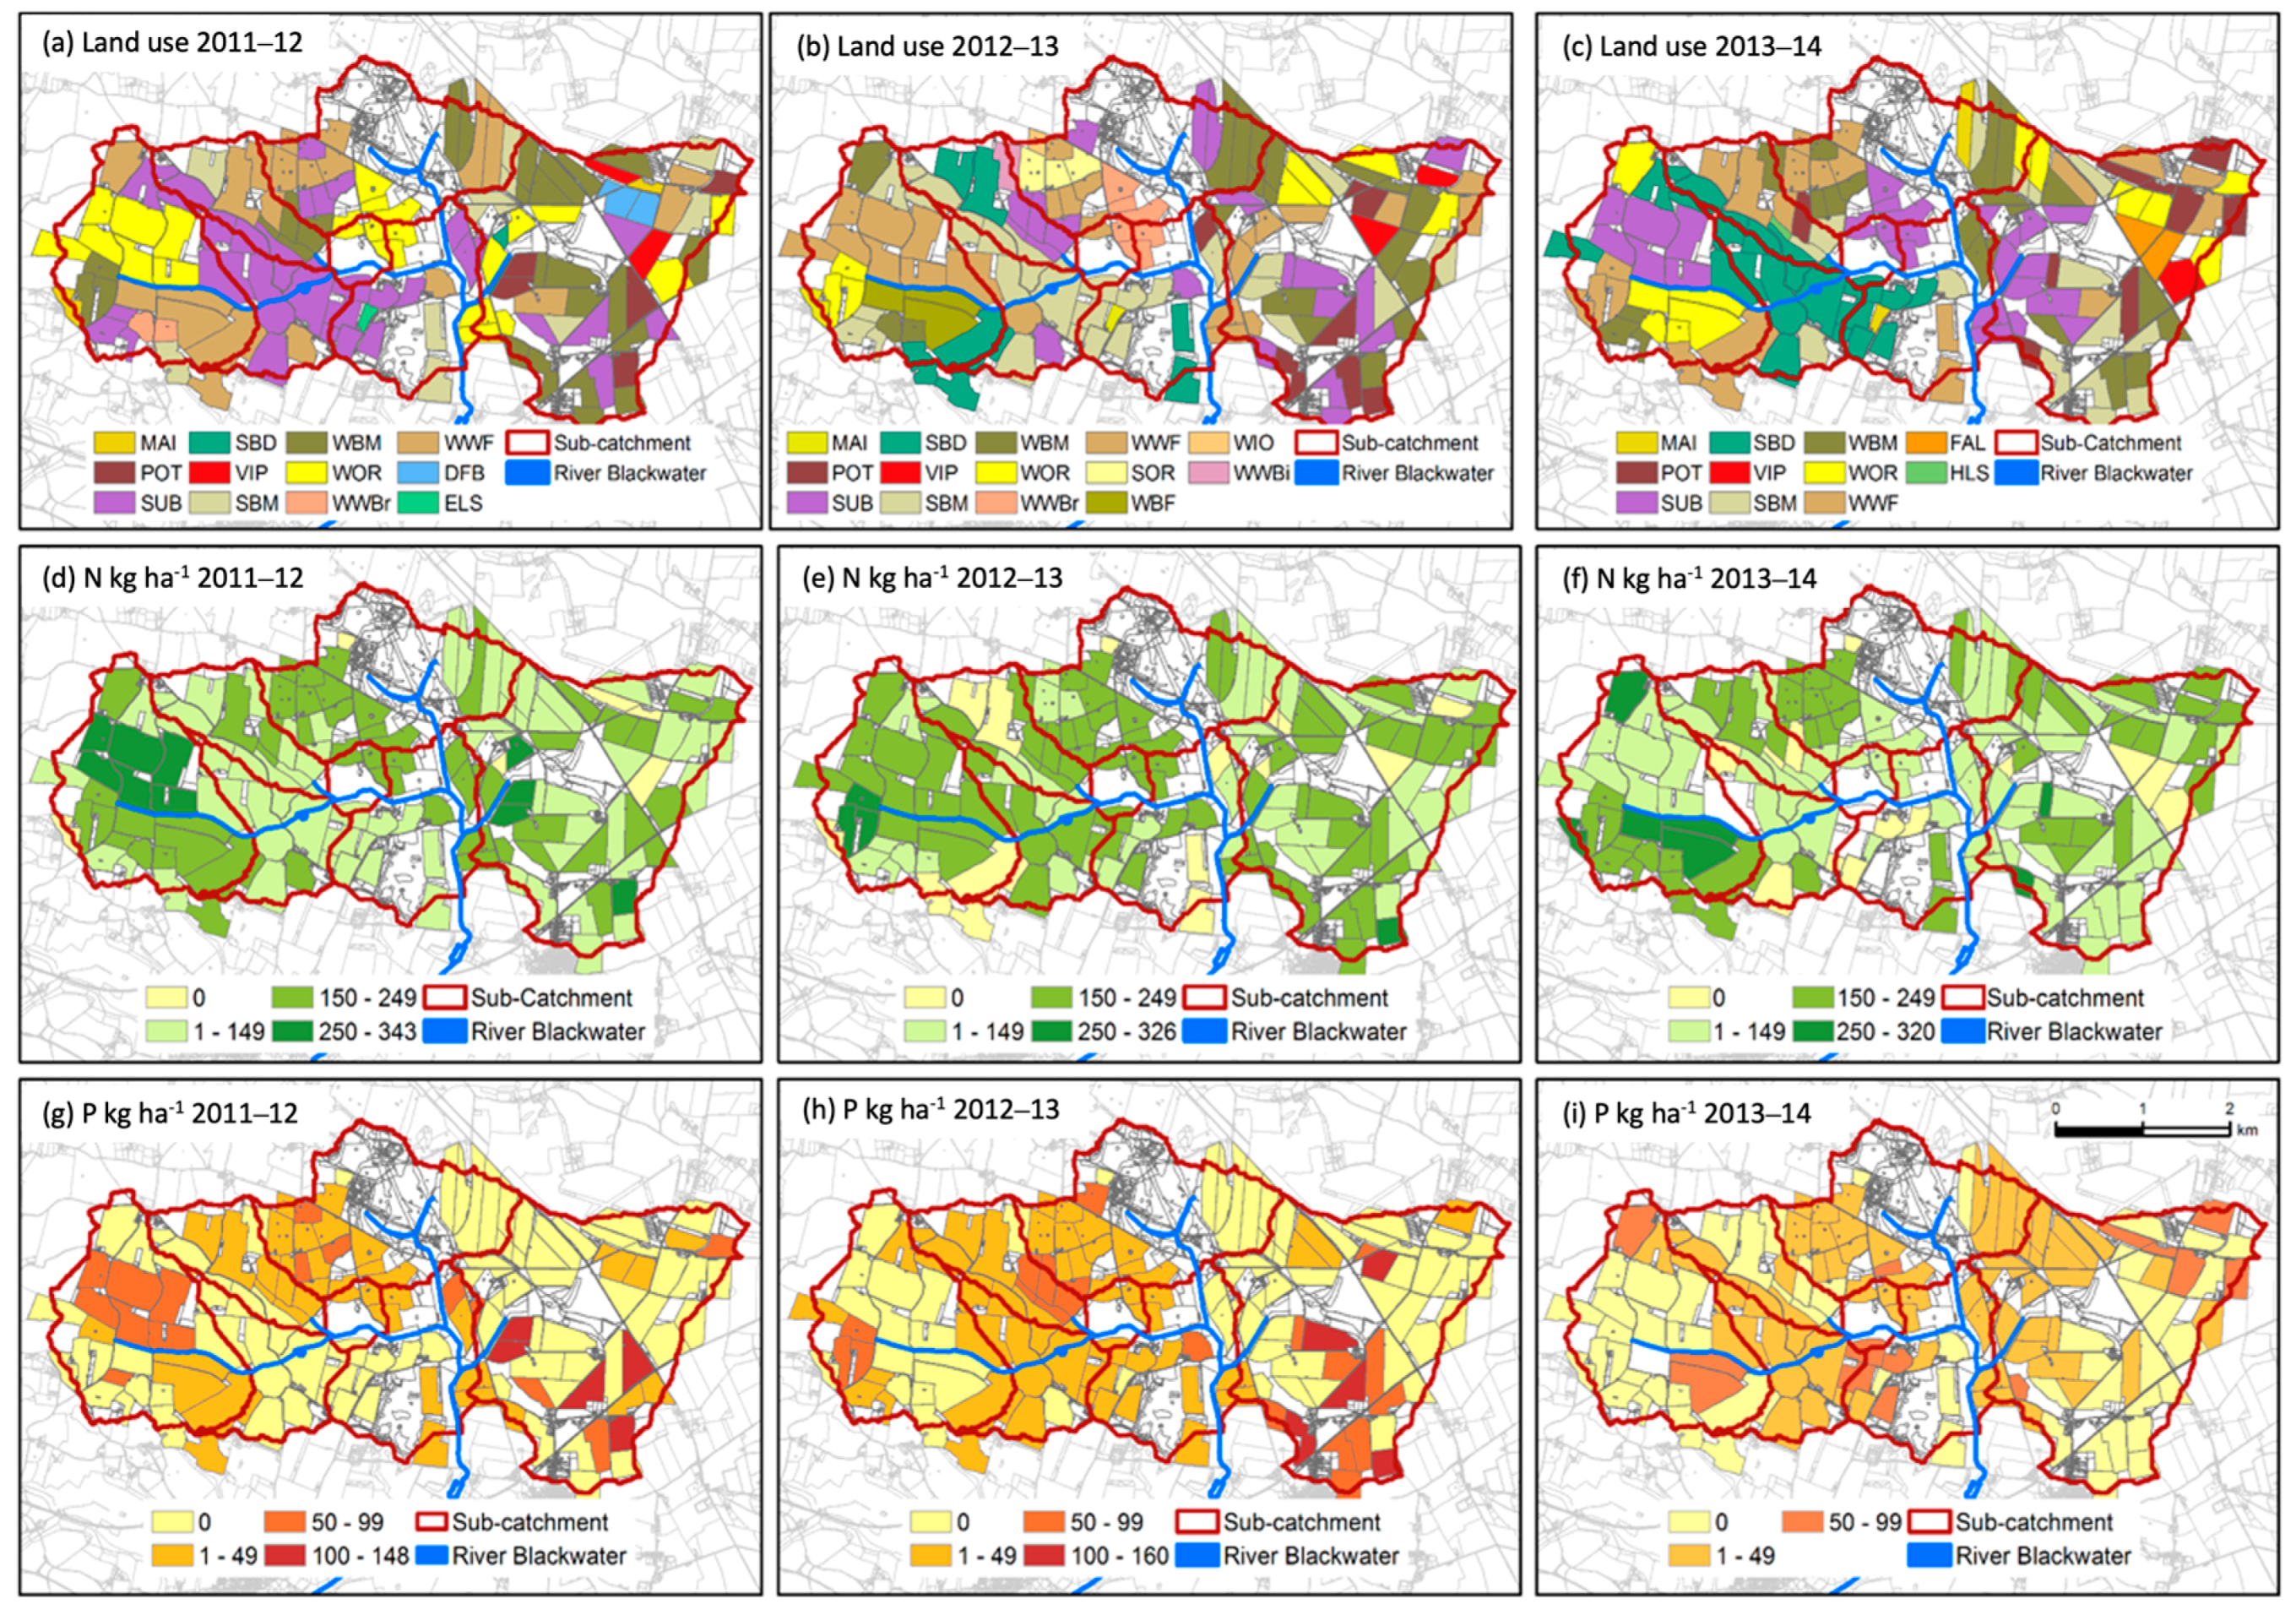
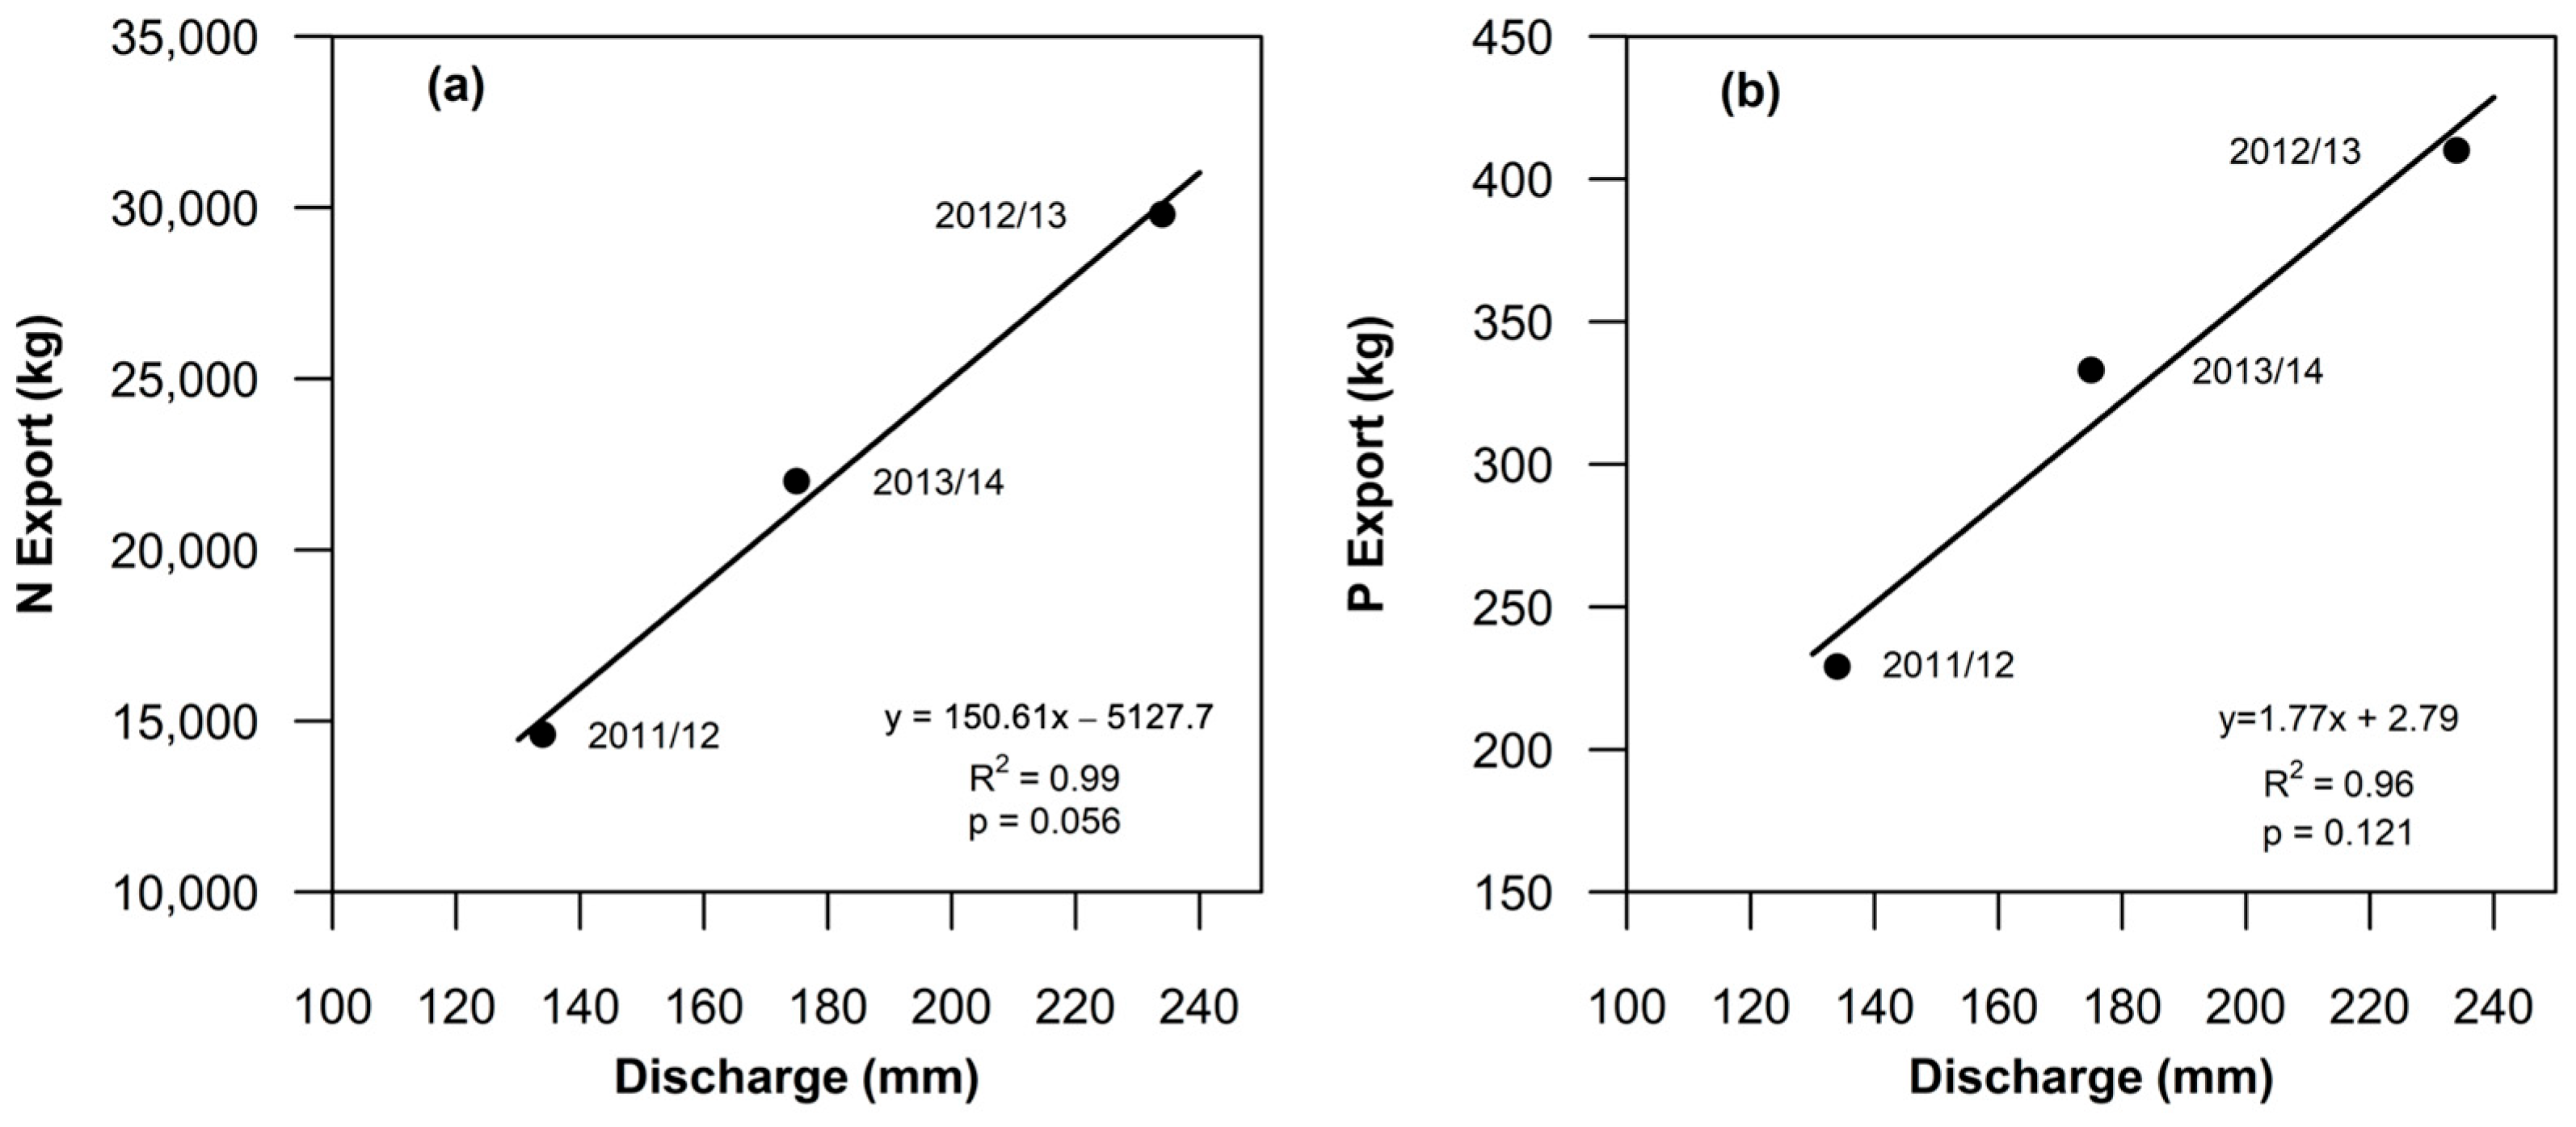
3.1. Nutrient Inputs and Exported Nutrient Loads

Table 2 presents the calculated values of N and P leached from the various crop types and land uses in the upper Blackwater sub-catchment in the three-year period of 2011–2014. Spring barley (malt), winter oilseed rape, and winter wheat (feed) accounted for the largest amount of leached N, ranging from 5466 to 22,408 kg N a−1 at rates of 44.4–103.7 kg N ha−1 a−1. The smallest amounts of leached N are associated with the area of maize grown as game cover (105–454 kg N a−1 at a rate of 10.5–26.7 kg N ha−1 a−1), human waste from rural settlements (233 kg N a−1 at a rate of 3.9 kg N ha−1 a−1), and rainfall (392–436 kg N a−1 at a rate of 0.22–0.24 kg N ha−1 a−1). The total amount of N leached to the sub-catchment varies from 55,759 to 66,394 kg N a−1, equivalent to 31–36 kg N ha−1 a−1.
The amounts of leached P greater than 50 kg P a−1 in any of the three years from 2011 to 2014 are recorded for potatoes, sugar beet, spring beans (dried), spring barley (malt), winter oilseed rape, and human waste from rural settlements. A maximum value of 152 kg P was recorded for sugar beet in 2012–2013 at a rate of 0.80 kg P ha−1 a−1, and a value of 50 kg P was recorded for potatoes in 2011–2012 at a rate of 1.05 kg P ha−1 a−1. For the crop rotation practised in the Blackwater sub-catchment, sugar beet and potatoes consistently contributed a loading of >50 kg P a−1. Rural settlements contributed a constant rate of 69 kg P a−1 (1.16 kg P ha−1 a−1). The total amount of P leached to the sub-catchment varied from 309 to 490 kg P a−1, equivalent to 0.17–0.27 kg P ha−1 a−1.
The annual riverine export, or load, of N and P as measured at the sub-catchment outlet (Site F) is calculated as follows:
L r = i = 1 n Q i × C i × 1800 10 6
where Lr is the riverine nutrient export (kg); Qi is the instantaneous discharge (L s−1); and Ci is the instantaneous concentration of N or P (mg L−1), with i representing a 30 min (1800 s) time-step [48]. A comparison of the annual riverine export with annual flow volume provides insight into catchment runoff processes. A linear regression of annual riverine export of N and P (Table 3) against annual flow volume (Table 1) reveals a positive relationship (r2 = 0.99 (p = 0.06) and 0.96 (p = 0.12), respectively), with the smallest riverine discharge and riverine loads in 2011–2012 and the largest in 2012–2013 (Figure 3).
Table 3 shows that the riverine N export ranged from 14,600 kg N to 29,800 kg N in the three-year period of 2011–2014, equivalent to a range in mean concentration of 5.5–6.5 mg N L−1, representing a poor to moderate condition compared with EU Water Framework Directive (WFD) environmental quality standards [61]. Compared to the greater amount of N leached to the catchment in this period (55,759–66,394 kg N), the quantity exported represents 0.22–0.52 (mean = 0.38) of the inputs, suggesting that between 0.48 and 0.78 of the leached N is naturally attenuated. The amount of leached N is sensitive to the amount of winter oilseed rape grown, given its large fertiliser requirement (~240 kg N ha−1) and high export coefficient (0.42), particularly in 2011–2012, when 216 ha of the crop were cultivated.
Even allowing for variations in crop fertiliser inputs, the results indicate that nitrate attenuation, most likely by denitrification, is occurring in the sub-catchment, especially in the western area where clay loam soils create favourable conditions of high soil moisture content and low oxygen concentrations in the subsurface. Evidence in support of this finding includes high dissolved nitrous oxide concentrations (mean = 5.3 μg N L−1, n = 2290) [38], an intermediate product of denitrification, and enriched δ15NNO3 values indicative of fractionation by denitrification (range = +4.1 to +22.7‰, n = 63) [62] in field drainage in the western part of the sub-catchment. At the catchment scale, and using a similar methodological approach, 15–30% of N is estimated to be removed by denitrification in the Wensum catchment within extensive glacial deposits, through which Chalk groundwater discharges to the main river channel [63]. Thus, it is likely that approximately 50% of N leached from the soil zone in the Blackwater sub-catchment is naturally attenuated by subsurface denitrification prior to riverine export, representing an approximately 2:1 credit trading ratio.
Considering P transport in the sub-catchment, Table 3 shows that the riverine P export ranged from 229 kg P to 410 kg P in the three-year period of 2011–2014, equivalent to a range in mean concentration of 0.09–0.10 mg P L−1, representing a moderate quality compared with EU WFD environmental quality standards [61]. Compared to the greater amount of P leached to the catchment in this period (309–490 kg P), the quantity exported represents 0.74–0.84 (mean = 0.80) of the inputs. The contribution of human wastes from rural settlements is the least well-constrained variable in the calculation of the amount of leached P. Reducing this contribution by 50% changes the ratio of riverine P export to the amount of P leached to between 0.83 and 0.90 (mean = 0.87).
The relationship between crop type and annual P input is less clear because P applications depend on soil type and soil P-index values (a field-scale assessment ranking the vulnerability of fields as sources of P loss in runoff [64]), with the timing and application rate in relation to crop growth phases of less importance than for N applications. In the Blackwater, P applications for all crops are relatively low due to the high soil P indices (1–4) in the catchment.
A lack of dilution in total riverine P concentrations during storm events suggests the dominance of diffuse sources of P, as opposed to point source inputs from rural septic systems [48]. Clockwise hysteresis loops indicate that the source of P is typically mobilised close to the river network and easily exhausted by individual events [48]. Further research in the upper Blackwater sub-catchment found that suspended particulate matter mobilised during storm events can transport up to 0.02 kg P ha−1 in particulate form [65]. Given the high P-index values, it is apparent that the crops are not utilising all the applied P, with build-up occurring in the soil at a sub-catchment scale. Therefore, the lack of removal (attenuation) of the P source input translates to a 1:1 credit trading ratio.

3.2. Export Coefficient Modelling to Achieve Nutrient Neutrality

The additional nutrient load to the Blackwater sub-catchment from the projected residential housing development in Cawston and Reepham is shown in Table 4, calculated using the following equation:
L h = n h × O h × U p × C w × 365 10 6
where Lh is the annual nutrient load from new houses (kg); nh is the number of new houses; Oh is the average occupancy per house; Up is the water use per person (L day−1); and Cw is the wastewater treatment works N or P discharge concentration (mg L−1).
Based on the current N and P discharge levels from the local wastewater treatment works, an additional 529 kg N a−1 and 17.6 kg P a−1 will be exported to the river because of the development, equivalent to riverine concentrations of less than 0.20 mg N L−1 and 0.007 mg P L−1. Compared with the calculated amounts of nutrients leached from land use in the upper Blackwater sub-catchment in 2011–2014 (Table 3), the additional export represents between 0.8 and 0.9% of the total N leached and 3.6–5.7% of the total P leached.
As a first step in mitigating the additional nutrient loading from new housing, the improvement in nutrient discharges from the municipal wastewater treatment works to 9.0 mg N L−1 and 0.23 mg P L−1 following upgrading of the plant reduces the nutrient load from the new development to 190 kg N a−1 and 4.9 kg P a−1 (representing savings of 338 kg N a−1 and 12.7 kg P a−1 compared with current discharge levels). Hence, this remaining load sets the target reductions to be met by further mitigation measures, such as land use change, to achieve nutrient neutrality.
Table 5 shows the results from the application of the export coefficient model to seven land use scenarios to mitigate the additional nutrient load (190 kg N a−1 and 4.9 kg P a−1) from the planned housing development in the lower Blackwater sub-catchment. Each scenario considers a reduction in arable cropping and conversion to mixed woodland, with associated export leaching coefficients of 10 kg N ha−1 a−1 and 0.02 kg P ha−1 a−1. In the case of Scenario 1, although unlikely to be workable in practice, crop conversion is applied to the six crop types that receive a P fertiliser application of >10 kg a−1 (Table 2). As a modelling target, the export coefficient model calculates the fraction of crop conversion resulting in the required reduction in P load of 4.9 kg a−1. In all cases except Scenario 4 (spring beans), and considering the cropping history for 2013–2014, the modelled fractions of crop conversion resulted in a more than sufficient reduction in N loading (196–1874 kg a−1). In the case of spring beans (Scenario 4), a leguminous crop that does not typically require a N fertiliser application, the model results in an increase in N loading of 24 kg a−1 with the conversion to mixed woodland.
Excluding Scenario 4, the required area of land conversion ranges from 8 ha (Scenario 2, potatoes) to 46 ha (Scenario 7, winter wheat) depending on the individual crop P fertiliser requirements. If minimising the area of land conversion is the main decision criterion, then Scenario 2 achieves the required outcome, with a modelled N reduction of 53 kg ha−1 a−1 and P reduction of 0.61 kg ha−1 a−1 (Table 5) for a land conversion of 8 ha. In terms of meeting the required nutrient reduction targets of 190 kg N a−1 and 4.9 kg P a−1, Scenario 3 (sugar beet) gives the closest result, with a land conversion of 18 ha with modelled reductions of 11 kg N ha−1 a−1 and 0.27 kg P ha−1 a−1.
The modelled scenarios demonstrate that arable land use conversion will generate N mitigation above that required for nutrient neutrality, thus potentially contributing to an improvement in the EU WFD environmental quality standards. In the case of Scenarios 6 and 7 (winter oilseed rape and winter wheat), both of which have high N fertiliser requirements, the additional saving is 944 kg N a−1 and 1684 kg N a−1, respectively, equivalent to a reduction in riverine N concentrations of 0.27 mg L−1 and 0.49 mg L−1, respectively, for the hydrological year 2013–2014. The monitored mean riverine N concentration in this year was 6.4 mg L−1 (Table 3), equating to a poor environmental quality standard designation. Therefore, a reduction in N concentration through reducing the area of winter oilseed rape or winter wheat would lead to an improvement towards a moderate environmental quality standard (threshold = 5.6 mg N L−1).
An alternative model, with the conversion of arable land to grazing grass, produces the same results for the seven scenarios for the reduction in P leaching (Table 5), given that the model export coefficients for grazing grass and mixed woodland are the same, at 0.02 kg ha−1 a−1 (Table 2). In the case of N, the export coefficient of 5 kg ha−1 a−1 for grazing grass (Table 2) is half the value for mixed woodland. This difference results in further reductions in N loading (Table 5), ranging from 40 kg N a−1 for Scenario 2 (potatoes) to 229 kg N a−1 for Scenario 7 (winter wheat), thus providing further environmental benefits.
The export coefficient model presented here was developed for an arable system in eastern England that experiences a temperate maritime climate. Although the methodology is transferable to other catchments, a different set of export coefficients is likely to apply in other climatic zones. A limitation of this study is that the export coefficient values applied to the study area were based on values for England. For improved model accuracy, refinement of the export coefficients for local conditions with the elicitation of a range of expert opinion is desirable to reduce model uncertainty [66,67].

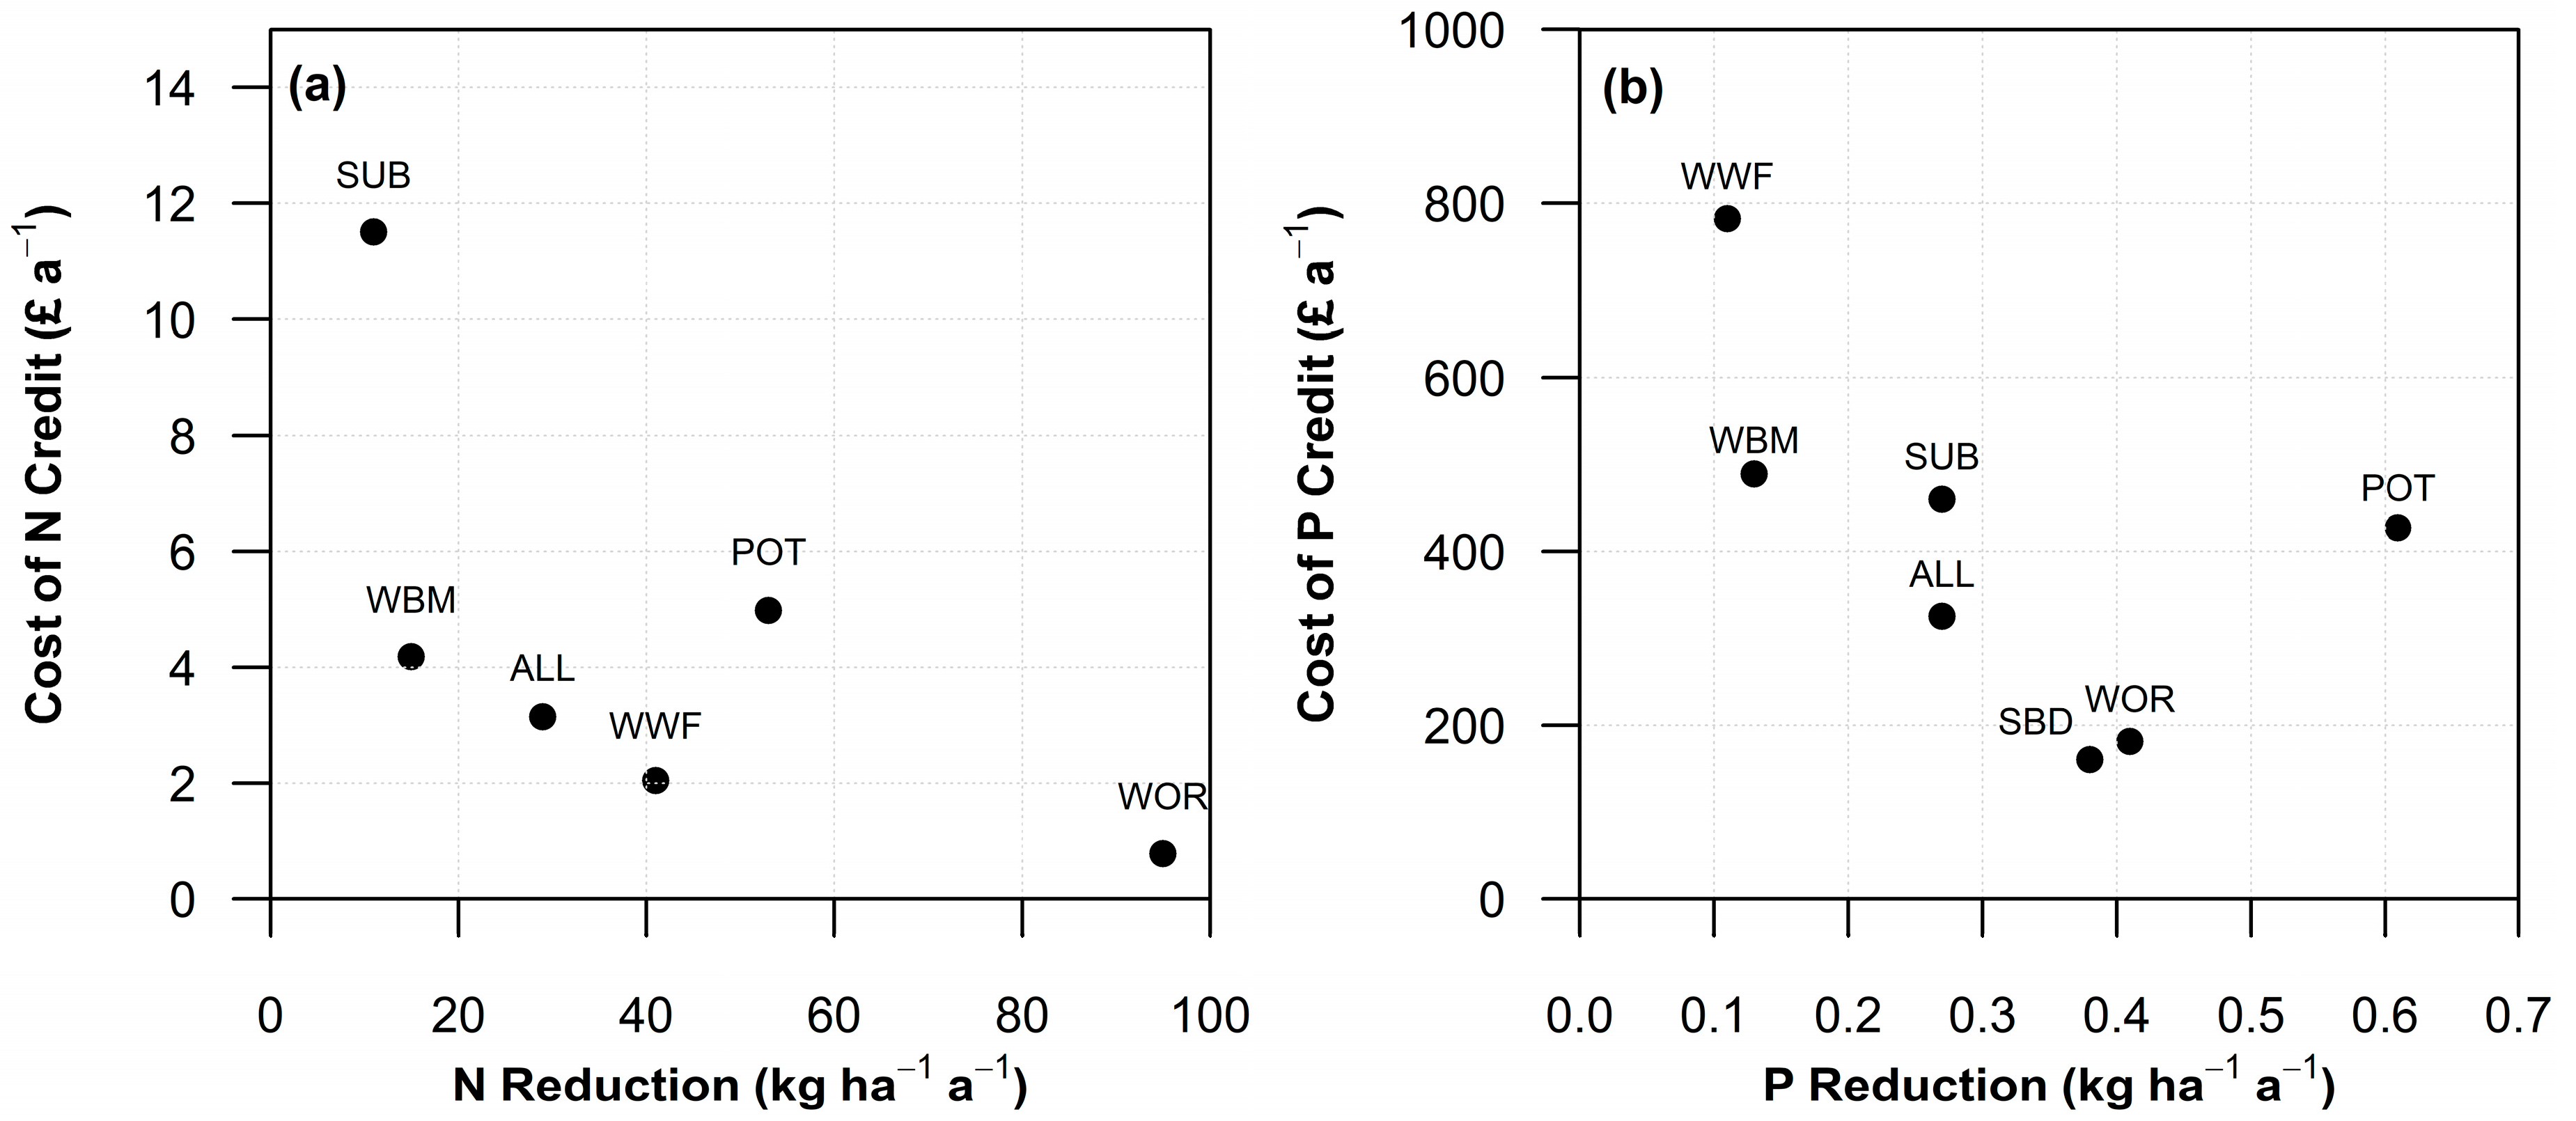
3.3. Nutrient Neutrality Credits and Associated Costs

The economic cost of achieving nutrient neutrality in terms of the number and value of N and P credits is shown in Table 6, based on gross margins (market value of the crop minus variable costs such as seed, fertiliser, and sprays) for the farm year 2013–2014 [60]. The number of credits shown is calculated from the achievable nutrient load reduction (kg) given in Table 5 divided by the unit value of a credit (0.1 kg). The annual cost of a nutrient credit is then calculated using the following equation:
C o s t   o f   n u t r i e n t   c r e d i t   ( £ ) = A c o n v × G M c o s t n c
where Aconv is the area of arable land converted to woodland or grass (ha); GMcost is the gross margin cost (GBP ha−1) as a measure of the income foregone in converting arable land to woodland or grass; and nc is the number of N or P credits generated by the arable land conversion.
Disregarding Scenario 4, which does not achieve the required reduction in N loading, Scenario 7 (winter wheat) resulted in the highest total cost (GBP 38,318 a−1), while Scenario 6 (winter oilseed rape) resulted in the lowest total cost (GBP 8880 a−1). Gross margins vary depending on market conditions, which in turn influence farmer decision making. For illustration, and relative to winter wheat (feed), gross margins for winter oilseed rape in the period 2010–2021 ranged from 0.84 to 1.06 based on Nix Farm Management Pocketbook data. For potatoes, with the greatest variation in gross margins relative to winter wheat (feed), the range was 2.25–5.80. In addition, for all scenarios (2013–2014), typical establishment costs for farm woodland over 3 ha were GBP 5000 ha−1 plus maintenance costs of GBP 40–80 ha-1 a−1, depending on the size of the plantation and the complexity of management. For low-input pastures (grazing grass), the costs of seed, fertiliser, and sprays were GBP 93 ha−1 a−1 [60].
Assuming a nutrient credit value of 0.1 kg of N or P [30], the least expensive N credit, at GBP 0.78 a−1, is obtained for Scenario 6 (winter oilseed rape), and the highest, at GBP 11.50 a−1, is for Scenario 3 (sugar beet). The least expensive P credit (excluding Scenario 4), at GBP 181 a−1, is again obtained for Scenario 6 (winter oilseed rape), and the highest, at GBP 782 a−1, is for Scenario 7 (winter wheat), given the comparatively large area (46 ha) required to achieve the required P mitigation. The range in the cost of a nutrient credit to mitigate 1 kg of N (GBP 7.80 a−1 to 115 a−1) with conversion of arable land to woodland compares with the current cost of GBP 1825 given for the River Tees catchment in northeast England [68], with the difference reflecting the higher cost of delivering the chosen mitigation measures and the associated costs of monitoring, maintenance, and administration.
Figure 4 compares the cost of nutrient credits with the rate of nutrient removal for given land use change scenarios. Scenario 6 (winter oilseed rape) offers the best solution for the achievement of nutrient neutrality for both N and P in respect of the lowest cost of credits (GBP 0.78 a−1 and 181 a−1, respectively) and the high rates of reduction in nutrient loading (95 and 0.41 kg ha−1 a−1, respectively). Less desirable outcomes when considering both N and P loadings are represented by Scenarios 3, 5, and 7 (sugar beet, winter barley, and winter wheat), which impact high-value crops and result in a high cost of nutrient credits for P (>GBP 460 a−1) for comparatively low rates of reduction in nutrient loadings (<41 kg N ha−1 a−1 and <0.27 kg P ha−1 a−1). If a reduction in N loading only is considered, reducing the area of winter wheat (Scenario 7) results in a medium outcome in terms of the cost of credits (GBP 2.04 a−1) and a reduced rate of N loading (41 kg ha−1 a−1). If a reduction in P loading only is considered, reducing the area of spring beans (Scenario 4) results in a favourable outcome in terms of the cost of a nutrient credit (GBP 160 a−1) and a reduced rate of P loading (0.38 kg ha−1 a−1). However, this scenario would have a negative impact on N fixation and, thus, is not a desirable solution.
If improvements in environmental quality standards are considered in addition to achieving nutrient neutrality, Scenario 6 (winter oilseed rape) is again favourable in presenting the greatest reduction in N loading (95 kg ha−1 a−1) and the second highest reduction in P loading (0.41 kg ha−1 a−1). Further to this scenario, potatoes are modelled to give reductions in N and P loading of 53 kg ha−1 a−1 and 0.61 kg ha−1 a−1, respectively, for a moderate cost of nutrient credits (GBP 4.98 for N a−1 and 427 for P a−1).
The alternative model of arable crop conversion to grazing grass results in the same outcome in terms of the number and cost of P credits, given the application of the same model export coefficient to both grazing grass and mixed woodland (0.02 kg ha−1; Table 2). For N, the model results in an increased number of N credits of between 400 for Scenario 2 (potatoes) and 2290 for Scenario 7 (winter wheat) (Table 6), given the smaller applied model export coefficient for grazing grass (5 kg N ha−1; Table 2). These additional credits reduce the cost of N credits to GBP 4.55 a−1 for Scenario 2 and GBP 1.82 a−1 for Scenario 7, representing savings of GBP 0.43 a−1 and 0.22 a−1, respectively, compared with conversion to mixed woodland.

4. Conclusions and Further Work Recommendations

The key findings of this research are summarised as follows:
  • Denitrification in the Blackwater sub-catchment in areas of clay loam soils underlain by glacial till deposits accounts for approximately 50% of N leached from the soil profile prior to riverine export, representing a 2:1 credit trading ratio.
  • Given the high soil P-index values, crops in the sub-catchment are not utilising all the applied P, with build-up occurring in the soil, representing a 1:1 credit trading ratio.
  • The application of export coefficient modelling in combination with farm business data provides a useful approach for examining nutrient management solutions in support of residential housing development.
  • In areas of intensive arable agriculture, conversion of arable crops to a low-intensity land use such as mixed woodland is a viable nature-based nutrient management solution, depending on the farm business.
  • For the environmental and cropping conditions in the River Wensum catchment in 2013–2014, the conversion of winter oilseed rape produced a favourable mitigation option in terms of the limited area of land conversion for the farmer and the low cost of nutrient credits for the housing developer.
  • High-value crops such as sugar beet, winter barley, and winter wheat are less likely to be considered viable as a nutrient neutrality option given the relatively high cost of nutrient credits.
  • Additional environmental benefits in terms of reduced riverine nutrient concentrations are associated with the conversion of winter oilseed rape and potatoes for both N and P at a relatively affordable cost in terms of nutrient credits.
  • Changes in land use should be considered as part of a package of nutrient neutrality measures that includes the upgrading of wastewater treatment works, agricultural runoff solutions such as the use of cover crops, and demand management measures such as retrofitting water-saving measures in existing properties.
  • Further work to improve the export coefficient model to reduce model uncertainty includes an improved representation of rural septic systems and other organic inputs such as manure applications, and refinement of the applied export coefficients through an expert elicitation process with stakeholders.
  • Further refinement of the cost of nutrient credits, in which an export coefficient model is part of a decision-support system, could include testing additional nature-based solutions, such as creating new wetlands, and a fuller consideration of the administrative, legal, and practical costs of mitigation and the associated monitoring and maintenance costs.

Author Contributions

Conceptualisation, K.M.H.; methodology, K.M.H., R.J.C. and A.A.L.; formal analysis, K.M.H., A.A.L., R.J.C. and G.S.; investigation, K.M.H., R.J.C. and A.A.L.; data curation, R.J.C. and G.S.; writing—original draft preparation, K.M.H.; writing—review and editing, K.M.H., R.J.C. and A.A.L.; visualisation, K.M.H. and R.J.C.; funding acquisition, K.M.H. and A.A.L. All authors have read and agreed to the published version of the manuscript.

Funding

The River Wensum Demonstration Test Catchment project was funded by the Department for Environment, Food and Rural Affairs (Defra) under projects WQ0212 and LM0304.

Data Availability Statement

The data presented in this study are available on request from the corresponding author.

Acknowledgments

We are grateful to Salle Farms Co., Salle, UK, the Heydon Estate, Heydon, UK, and other farms in upper Blackwater for hosting monitoring equipment, granting access, and supplying land use data. We thank Simon Ellis, Jenny Stevenson, John Brindle, and Tom Howson for fieldwork support and Liz Rix, Alina Mihailova, Kim Goodey, Tony Hinchliffe, Graham Chilvers, and Andy Hind for laboratory support. We are grateful to the three reviewers who provided constructive comments, which greatly helped to improve this paper.

Conflicts of Interest

The authors declare no conflict of interest. The views presented is this paper for the purposes of this study are entirely those of the authors.

References

  1. Steffen, W.; Richardson, K.; Rockström, J.; Cornell, S.E.; Fetzer, I.; Bennett, E.M.; Biggs, R.; Carpenter, S.R.; de Vries, W.; de Wit, C.A.; et al. Planetary boundaries: Guiding human development on a changing planet. Science 2015, 347, 1259855. [Google Scholar] [CrossRef] [PubMed]
  2. Wurtsbaugh, W.A.; Paerl, H.W.; Dodds, W.K. Nutrients, eutrophication and harmful algal blooms along the freshwater to marine continuum. WIREs Water 2019, 6, e1373. [Google Scholar] [CrossRef]
  3. Sekar, S.; Perumal, M.; Roy, P.D.; Ganapathy, M.; Senapathi, V.; Chung, S.Y.; Elzain, H.E.; Duraisamy, M.; Kamaraj, J. A review on global status of fresh and saline groundwater discharge into the ocean. Environ. Monit. Assess. 2022, 194, 915. [Google Scholar] [CrossRef]
  4. Zhang, A.; Lei, K.; Lang, Q.; Yi, L. Identification of nitrogen sources and cycling along freshwater river to estuarine water continuum using multiple stable isotopes. Sci. Total Environ. 2022, 851, 158136. [Google Scholar] [CrossRef] [PubMed]
  5. Luna Juncal, M.J.; Masino, P.; Bertone, E.; Stewart, R.A. Towards nutrient neutrality: A review of agricultural runoff mitigation strategies and the development of a decision-making framework. Sci. Total Environ. 2023, 874, 162408. [Google Scholar] [CrossRef] [PubMed]
  6. Zhang, Y.; Collins, A.L.; Murdoch, N.; Lee, D.; Naden, P.S. Cross sector contributions to river pollution in England and Wales: Updating waterbody scale information to support policy delivery for the Water Framework Directive. Environ. Sci. Policy 2014, 42, 16–32. [Google Scholar] [CrossRef]
  7. Lintern, A.; McPhillips, L.; Winfrey, B.; Duncan, J.; Grady, C. Best management practices for diffuse nutrient pollution: Wicked problems across urban and agricultural watersheds. Environ. Sci. Technol. 2020, 54, 9159–9174. [Google Scholar] [CrossRef]
  8. Nikolaidis, N.P.; Phillips, G.; Poikane, S.; Várbíro, G.; Bouraoui, F.; Malagó, A.; Lilli, M.A. River and lake nutrient targets that support ecological status: European scale gap analysis and strategies for the implementation of the Water Framework Directive. Sci. Total Environ. 2022, 813, 151898. [Google Scholar] [CrossRef]
  9. UK Statutory Instruments. The Conservation of Habitats and Species Regulations 2017. UK Statutory Instruments No. 1012. Available online: https://www.legislation.gov.uk/uksi/2017/1012/contents/made (accessed on 12 July 2023).
  10. Department for Environment, Food and Rural Affairs. Policy Paper: Nutrient Pollution: Reducing the Impact on Protected Sites. Available online: https://www.gov.uk/government/publications/nutrient-pollution-reducing-the-impact-on-protected-sites/nutrient-pollution-reducing-the-impact-on-protected-sites#supporting-nutrient-neutrality (accessed on 2 June 2023).
  11. Rasouli, S.; Whalen, J.K.; Madramootoo, C.A. Review: Reducing residual soil nitrogen losses from agroecosystems for surface water protection in Quebec and Ontario, Canada: Best management practices, policies and perspectives. Can. J. Soil Sci. 2014, 94, 109–127. [Google Scholar] [CrossRef]
  12. Jamshidi, S.; Niksokhan, M.H.; Ardestani, M. Wastewater reuse, an opportunity to expand nitrogen discharge permit markets. J. Environ. Stud. 2016, 42, 40–42. [Google Scholar]
  13. Cooper, R.J.; Hama-Aziz, Z.; Hiscock, K.M.; Lovett, A.A.; Dugdale, S.J.; Sünnenberg, G.; Noble, L.; Beamish, J.; Hovesen, P. Assessing the farm-scale impacts of cover crops and non-inversion tillage regimes on nutrient losses from an arable catchment. Agric. Ecosyst. Environ. 2017, 237, 181–193. [Google Scholar] [CrossRef]
  14. Keller, A.A.; Fox, J. Giving credit to reforestation for water quality benefits. PLoS ONE 2019, 14, e0217756. [Google Scholar] [CrossRef] [PubMed]
  15. Cooper, R.J.; Hawkins, E.; Locke, J.; Thomas, T.; Tosney, J. Assessing the environmental and economic efficacy of two integrated constructed wetlands at mitigating eutrophication risk from sewage effluent. Water Environ. J. 2020, 34, 669–678. [Google Scholar] [CrossRef]
  16. Natural England. Nutrient Neutrality and Mitigation: A summary Guide and Frequently Asked Questions (NE776). Available online: https://publications.naturalengland.org.uk/publication/6248597523005440 (accessed on 2 June 2023).
  17. Bowskill, V.; Bhagwat, S.; Gowing, D. Depleting soil nutrients through frequency and timing of hay cutting on floodplain meadows for habitat restoration and nutrient neutrality. Biol. Conserv. 2023, 283, 110140. [Google Scholar] [CrossRef]
  18. Keller, A.A.; Chen, X.; Fox, J.; Fulda, M.; Dorsey, R.; Seapy, B.; Glenday, J.; Bray, E. Attenuation coefficients for water quality trading. Environ. Sci. Technol. 2014, 48, 6788–6794. [Google Scholar] [CrossRef]
  19. Raffensperger, J.F.; Ranga Prabodanie, R.A.; Kostel, J.A. A smart market for nutrient credit trading to incentivize wetland construction. J. Hydrol. 2017, 546, 248–261. [Google Scholar] [CrossRef]
  20. McGartland, A. A comparison of two marketable discharge permits systems. J. Environ. Econ. Manag. 1988, 15, 35–44. [Google Scholar] [CrossRef]
  21. Hoag, D.A.; Hughes-Popp, J.S. Theory and practice of pollution credit trading in water quality management. Rev. Agric. Econ. 1997, 19, 252–262. [Google Scholar] [CrossRef]
  22. Wiedeman, A.; Trask, J. Chesapeake Bay Program Nutrient Trading Fundamental Principles and Guidelines; Chesapeake Bay Program: Annapolis, Maryland, 2001; 69p. [Google Scholar]
  23. McGonigle, D.F.; Burke, S.P.; Collins, A.L.; Gartner, R.; Haft, M.R.; Harris, R.C.; Haygarth, P.M.; Hedges, M.C.; Hiscock, K.M.; Lovett, A.A. Developing Demonstration Test Catchments as a platform for transdisciplinary land management research in England and Wales. Environ. Sci. Process. Impacts 2014, 16, 1618–1628. [Google Scholar] [CrossRef]
  24. Cason, T.N.; Gangadharan, L.; Duke, C. Market power in tradable emission markets: A laboratory testbed for emission trading in Port Phillip Bay, Victoria. Ecol. Econ. 2003, 46, 469–491. [Google Scholar] [CrossRef]
  25. Wang, X.; Zhang, W.; Huang, Y.; Li, S. Modeling and simulation of point-non-point source effluent trading in Taihu lake area: Perspective of non-point sources control in China. Sci. Total Environ. 2004, 325, 39–50. [Google Scholar] [CrossRef] [PubMed]
  26. Cox, T.J.; Rutherford, J.C.; Kerr, S.C.; Smeaton, D.C.; Palliser, C.C. An integrated model for simulating nitrogen trading in an agricultural catchment with complex hydrogeology. J. Environ. Manag. 2013, 127, 268–277. [Google Scholar] [CrossRef] [PubMed]
  27. Partnership for South Hampshire. Nutrient Mitigation for New Housing Development. Available online: https://www.push.gov.uk/work/nitrate-mitigation/ (accessed on 3 August 2023).
  28. Somerset Council. Phosphate Nutrient Credit Scheme Approved. Available online: https://www.somerset.gov.uk/phosphate-nutrient-credit-scheme-approved/ (accessed on 3 August 2023).
  29. Middlesborough Council. Planning policy: Nutrient Neutrality. Available online: https://www.middlesbrough.gov.uk (accessed on 18 September 2023).
  30. Norfolk Environmental Credits. Nutrient Neutral Development. Available online: https://www.norfolkenvironmentalcredits.co.uk/buying/ (accessed on 2 June 2023).
  31. CEH. National River Flow Archive. UK Centre for Ecology and Hydrology. Available online: https://nrfa.ceh.ac.uk/data (accessed on 2 August 2023).
  32. Rowland, C.S.; Morton, R.D.; Carrasco, L.; McShane, G.; O’Neil, A.W.; Wood, C.M. Land Cover Map 2015 (25m raster, GB), NERC Environmental Information Data Centre: Lancaster, UK, 2017. [CrossRef]
  33. Sear, D.A.; Newson, M.; Old, J.C.; Hill, C. Geomorphological Appraisal of the River Wensum Special Area of Conservation; English Nature Research Reports, No. 685; English Nature: Peterborough, UK, 2006; 78p. [Google Scholar]
  34. Cooper, R.J.; Hiscock, K.M. Two decades of the EU Water Framework Directive: Evidence of success and failure from a lowland arable catchment (River Wensum, UK). Sci. Total Environ. 2023, 869, 161837. [Google Scholar] [CrossRef] [PubMed]
  35. Grieve, N.; Clarke, S.; Caswell, B. Macrophyte Survey of the River Wensum SAC; Centre for Aquatic Plant Management, English Nature: Peterborough, UK, 2002. [Google Scholar]
  36. Meteorological Office. UK Climate Averages: Coltishall 1991–2020. Meteorological Office, Exeter. Available online: https://www.metoffice.gov.uk/research/climate/maps-and-data/uk-climate-averages/u12unggmv (accessed on 2 August 2023).
  37. Lewis, M.A. Borehole drilling and sampling in the Wensum Demonstration Test Catchment. Br. Geol. Surv. Comm. Rep. 2014, CR/11/162, 44. [Google Scholar]
  38. Cooper, R.J.; Hiscock, K.M.; Lovett, A.A.; Dugdale, S.J.; Sünnenberg, G.; Garrard, N.L.; Outram, F.N.; Hama-Aziz, Z.Q.; Noble, L.; Lewis, M.A. Application of high-resolution telemetered sensor technology to develop conceptual models of catchment hydrogeological processes. J. Hydrol. X 2018, 1, 100007. [Google Scholar] [CrossRef]
  39. Hama-Aziz, Z.Q.; Hiscock, K.M.; Cooper, R.J. Dissolved nitrous oxide (N2O) dynamics in agricultural field drains and headwater streams in an intensive arable catchment. Hydrol. Process. 2017, 31, 1371–1381. [Google Scholar] [CrossRef]
  40. Department for Environment, Food and Rural Affairs. Agriculture in the United Kingdom Data Sets. Available online: https://www.gov.uk/government/statistical-data-sets/agriculture-in-the-united-kingdom (accessed on 19 September 2023).
  41. Farmers Weekly. OSR Growers Could Lose 20% of Crop Due to Flea Beetle Damage. Available online: https://www.fwi.co.uk/arable/crop-management/pests/osr-growers-could-lose-20-of-crop-due-to-flea-beetle-damage (accessed on 19 September 2023).
  42. Office for National Statistics. Census 2021. Available online: https://census.gov.uk (accessed on 1 June 2023).
  43. Greater Norwich Development Partnership. Greater Norwich Local Plan: Cawston, Brandiston and Swannington. Available online: https://www.gnlp.org.uk/regulation-19-publication-part-2-sites-6-broadland-village-clusters/cawston-brandiston-and (accessed on 2 June 2023).
  44. Greater Norwich Development Partnership. Greater Norwich Local Plan: Reepham (Including Booton, Guestwick, Heydon, Salle and Wood Dalling). Available online: https://www.gnlp.org.uk/regulation-19-publication-part-2-sites-5-key-service-centre/reepham-including-booton-guestwick (accessed on 2 June 2023).
  45. Greater Norwich Growth Board. Water Efficiency Advice Note—October 2015. Available online: https://www.southnorfolkandbroadland.gov.uk/downloads/file/270/joint-core-strategy-water-efficiency-advice-note (accessed on 28 July 2023).
  46. Anglian Water. Anglian Water Upgrades Infrastructure in Reepham to Protect River Wensum. Available online: https://www.anglianwater.co.uk/news/anglian-water-upgrades-infrastructure-in-reepham-to-protect-river-wensum/ (accessed on 1 June 2023).
  47. Outram, F.N.; Lloyd, C.E.M.; Jonczyk, J.; Benskin, C.M.H.; Grant, F.; Perks, M.T.; Deasy, C.; Burke, S.P.; Collins, A.L.; Freer, J.; et al. High-frequency monitoring of nitrogen and phosphorus response in three rural catchments to the end of the 2011–2012 drought in England. Hydrol. Earth Syst. Sci. 2014, 18, 3429–3448. [Google Scholar] [CrossRef]
  48. Outram, F.N.; Cooper, R.J.; Sünnenberg, G.; Hiscock, K.M.; Lovett, A.A. Antecedent conditions, hydrological connectivity and anthropogenic inputs: Factors affecting nitrate and phosphorus transfers to agricultural headwater streams. Sci. Total Environ. 2016, 545–546, 184–199. [Google Scholar] [CrossRef]
  49. Johnes, P.J. Evaluation and management of the impact of land use change on the nitrogen and phosphorus load delivered to surface waters: The export coefficient modelling approach. J. Hydrol. 1996, 183, 323–349. [Google Scholar] [CrossRef]
  50. Worrall, F.; Burt, T.P. The impact of land-use change on water quality at the catchment scale: The use of export coefficient and structural models. J. Hydrol. 1999, 221, 75–90. [Google Scholar] [CrossRef]
  51. Liu, R.-M.; Yang, Z.-F.; Shen, Z.-Y.; Yu, S.L.; Ding, X.-W.; Wu, X.; Liu, F. Estimating nonpoint source pollution of the Upper Yangtze river using the export coefficient model, remote sensing, and geographical information system. J. Hydraul. Eng. 2009, 135, 698–704. [Google Scholar] [CrossRef]
  52. Wu, L.; Gao, J.-E.; Ma, X.-Y.; Li, D. Application of modified export coefficient method on the load estimation of non-point source nitrogen and phosphorus pollution of soil and water loss in semiarid regions. Environ. Sci. Pollut. Res. 2015, 22, 10647–10660. [Google Scholar] [CrossRef] [PubMed]
  53. Cheng, X.; Chen, L.; Sun, R.; Jing, Y. An improved export coefficient model to estimate non-point source phosphorus pollution risks under complex precipitation and terrain conditions. Environ. Sci. Pollut. Res. 2018, 25, 20946–20955. [Google Scholar] [CrossRef] [PubMed]
  54. Zhang, B.-L.; Cui, B.-H.; Zhang, S.-M.; Wu, Q.-Y.; Yao, L. Source apportionment of nitrogen and phosphorus from non-point source pollution in Nansi Lake Basin, China. Environ. Sci. Pollut. Res. 2018, 25, 19101–19113. [Google Scholar] [CrossRef] [PubMed]
  55. Wang, M.; Duan, L.; Bai, Y.; Peng, J.; Wang, Y.; Zheng, B. Improved export coefficient model for identification of watershed environmental risk areas. Environ. Sci. Pollut. Res. 2023, 30, 34649–34668. [Google Scholar] [CrossRef]
  56. Johnes, P.J. Quantifying the non-point source contribution to nutrient loading on freshwaters in 32 UK catchments. Verhandlungen Int. Ver. Fur Theor. Und Angew. Limnol. 2000, 27, 1306–1309. [Google Scholar] [CrossRef]
  57. Zhang, H.; Hiscock, K.M. Modelling the effect of forest cover in mitigating nitrate contamination of groundwater: A case study of the Sherwood Sandstone aquifer in the East Midlands, UK. J. Hydrol. 2011, 399, 212–225. [Google Scholar] [CrossRef]
  58. Howson, T.J. Hydrograph Separation Using Stable Isotopes: An Assessment of Flow Contributions in the Blackwater Catchment. Master’s Thesis, University of East Anglia, Norwich, UK, 2012; 87p. [Google Scholar]
  59. Berthold, M.; Wulff, R.; Reiff, V.; Karsten, U.; Nausch, G.; Schumann, R. Magnitude and influence of atmospheric phosphorus deposition on the southern Baltic Sea coast over 23 years: Implications for coastal waters. Environ. Sci. Eur. 2019, 31, 27. [Google Scholar] [CrossRef]
  60. Nix, J. Farm Management Pocketbook, 44th ed. 2014; Agro Business Consultants Ltd.: Melton Mowbray, UK, 2013; 284p. [Google Scholar]
  61. WISE-Freshwater. Freshwater Information System for Europe. Available online: https://water.europa.eu/freshwater (accessed on 31 July 2023).
  62. Garrard, N.L. A Stable Isotope and Hydrochemical Approach to Examining Denitrification along a Shallow Groundwater–Surface Water Continuum in an Agriculturally-Impacted Catchment. Ph.D. Thesis, University of East Anglia, Norwich, UK, 2018; 268p. [Google Scholar]
  63. Wexler, S.K.; Hiscock, K.M.; Dennis, P.F. Microbial and hydrological influences on nitrate isotopic composition in an agricultural lowland catchment. J. Hydrol. 2012, 468–469, 85–93. [Google Scholar] [CrossRef]
  64. The Potash Development Association. Leaflet 24: Soil Analysis—Key to Nutrient Management Planning 2011, 12p. Available online: https://www.pda.org.uk (accessed on 18 September 2023).
  65. Cooper, R.J.; Krueger, T.; Hiscock, K.M.; Rawlins, B.G. High-temporal resolution fluvial sediment source fingerprinting with uncertainty: A Bayesian approach. Earth Surf. Process. Landf. 2015, 40, 78–92. [Google Scholar] [CrossRef]
  66. McMillan, H.; Krueger, T.; Freer, J. Benchmarking observational uncertainties for hydrology: Rainfall, river discharge and water quality. Hydrol. Process. 2012, 26, 4078–4111. [Google Scholar] [CrossRef]
  67. Krueger, T.; Page, T.; Hubacek, K.; Smith, L.; Hiscock, K. The role of expert opinion in environmental modelling. Environ. Model. Softw. 2012, 36, 4–18. [Google Scholar] [CrossRef]
  68. Natural England. How to Apply for Nutrient Mitigation Credits from Natural England. Available online: https://www.gov.uk/government/publications/natural-englands-nutrient-mitigation-scheme-for-developers/ (accessed on 18 September 2023).
Figure 1. Location of the upper Blackwater sub-catchment of the River Wensum showing main land use types (LCM2015, [32]), monitoring infrastructure (kiosk Site F and boreholes), and the location of the wastewater treatment works (WWTW) for the urban areas of Cawston and Reepham in the lower Blackwater sub-catchment. Based upon Land Cover Map 2015 © UKCEH 2017. Contains Ordnance Survey data © Crown Copyright 2007, Licence number 100017572.
Environments 10 00168 g001
Figure 2. Land use and fertiliser application in the upper Blackwater sub-catchment during the three-year monitoring period of 2011–2014 [48]. (ac) Land use (MAI = maize; POT = potatoes; SUB = sugar beet; SBD = spring beans (dried); VIP = vining peas; SBM = spring barley (malt); WBM = winter barley (malt); WOR = winter oilseed rape; WWF = winter wheat (feed); WWBr = winter wheat (bread); WWBi = winter wheat (biscuits); SOR = spring oilseed rape; DFB = dwarf French beans; WBF = winter barley (feed); WIO = winter oats; FAL = fallow; HLS and ELS = higher- and entry-level-scheme environmental stewardship); (df) inorganic and organic nitrogen fertiliser application rate; and (gi) inorganic and organic phosphorus fertiliser application rate.
Environments 10 00168 g002
Figure 3. Linear regression of riverine nutrient export against catchment discharge for (a) N and (b) P for the upper Blackwater sub-catchment for the period 2011–2014.
Environments 10 00168 g003
Figure 4. Comparison of the cost of nutrient credits (Table 6) and the associated nutrient reductions (Table 5) for (a) N and (b) P achieved for various scenarios of arable land use conversion to mixed woodland. Abbreviations: ALL, all crops with a P requirement >10 kg ha−1 a−1; POT, potatoes; SBD, spring beans (dried); SUB, sugar beet; WBM, winter barley (malt); WOR, winter oilseed rape; WWF, winter wheat (feed).
Environments 10 00168 g004
Table 1. Annual summary of meteorological, hydrological, and hydrogeological characteristics of the upper Blackwater sub-catchment for the hydrological years 2011–2014. Groundwater levels are shown as metres above sea level (m asl). Standard deviation is in parentheses.
Year
2011/122012/132013/14
Rainfall683633706
River discharge (mm)134234175
River discharge volume (×106 m3)2.644.613.45
River discharge (m3 s−1)0.0840.1460.109
Annual runoff coefficient0.200.370.25
Baseflow volume (×106 m3)1.953.192.49
Baseflow index (BFI)0.740.690.72
Mean groundwater level (6 m depth) (m asl)41.1 (0.9)41.7 (0.5)41.5 (0.5)
Mean groundwater level (50 m depth) (m asl)39.5 (0.3)40.4 (0.5)40.1 (0.3)
Table 2. Land use in 2011–2014 in the upper Blackwater sub-catchment and the associated N and P inputs and leaching rates for arable crops, other land uses, and rainfall.
Land UseArea
(ha)
N Exp CoeffP Exp CoeffN Input
(kg ha−1)
P Input
(kg ha−1)
Mass Leached N
(kg)
Mass Leached P
(kg)
N Leaching Rate
(kg ha−1)
P Leaching Rate
(kg ha−1)
2011
/12
2012
/13
2013
/14
2011
/12
2012
/13
2013
/14
2011
/12
2012
/13
2013
/14
2011
/12
2012
/13
2013
/14
2011
/12
2012
/13
2013
/14
2011
/12
2012
/13
2013
/14
2011
/12
2012
/13
2013
/14
Maize1110170.300.01 3589 105454 10.526.7
Potatoes4865870.390.0126619516112210355498049435463508554103.776.162.81.051.310.62
Sugar beet3411902210.170.01150198122256325869663954584731526225.533.720.70.210.800.28
Spring beans (dried)51142410.480.01 17 2534 1967 3692 8.2 0.320.38
Vining peas2121170.480.01
Spring barley
(malt)
1122731370.400.011221371229184546614,9606686963648.854.848.80.080.230.05
Winter barley
(malt)
2491901820.200.011231081264 136125410445869 2724.621.625.20.03 0.15
Winter barley
(feed)
50 0.200.01 152 1520 30.4
Spring oilseed
rape
26 0.420.01 120 26 1310 50.4
Winter oilseed
rape
216721480.420.0124724424224383622,408737915,043443560103.7102.5101.60.210.480.41
Winter wheat
(bread)
1237 0.230.01202199 16 5581693 8 46.545.8 0.20
Winter wheat
(feed)
2832492550.230.0119319422116101112,56211,11012,96239323244.444.650.80.140.130.12
Winter wheat
(biscuit)
13 0.230.01 198
Dwarf French
beans
22 0.480.01151 29 1595 5 72.5 0.25
Grazing grass236236236 5550.020.020.021181118111815555.05.05.00.020.020.02
Mixed
woodland
217217217 1010100.020.020.0221662166216644410.010.010.00.020.020.02
Rural
settlements
595959 3.93.93.91.161.161.162332332336969693.93.93.91.161.161.16
Rainfall1832182218170.200.011.161.081.200.110.100.114253924362220.230.220.240.0010.0010.001
Total183218221817 66,39457,49355,75930949041336.231.630.70.170.270.23
Table 3. Comparison of monitored riverine N and P export with calculated N and P leached from land use in the upper Blackwater sub-catchment in 2011–2014. Standard deviation is in parentheses.
Year
2011/122012/132013/14
Mean riverine N concentration (mg L−1)5.5 (1.6)6.5 (1.3)6.4 (1.7)
Mean riverine P concentration (mg L−1)0.09 (0.04)0.09 (0.03)0.10 (0.04)
Riverine N export (kg)14,60029,80022,000
Riverine P export (kg)229410333
Calculated N leached (kg)66,39457,49355,759
Calculated P leached (kg)309490413
Riverine N export/N leached0.220.520.39
Riverine P export/P leached0.740.840.81
Table 4. Comparison of additional N and P load at Reepham wastewater treatment works (WWTW) from forecast residential housing development (2018–2038), with calculated N and P leached from land use in the upper Blackwater sub-catchment (2011–2014). Also shown are the equivalent riverine N and P concentrations associated with the housing development.
Year
2011/122012/132013/14
Riverine N concentration (mg L−1)0.200.110.15
Riverine P concentration (mg L−1)0.0070.0040.005
TN load from new houses (kg)529529529
TP load from new houses (kg)17.617.617.6
Calculated N leached (kg)66,39457,49355,759
Calculated P leached (kg)309490413
TN load from new houses/N leached0.0080.0090.009
TP load from new houses/P leached0.0570.0360.043
Assumptions: Number of new houses = 235; average occupancy per house = 2.24; water use per person = 110 L day−1; WWTW N discharge concentration = 25.0 mg L−1; WWTW P discharge concentration = 0.83 mg L−1.
Table 5. Scenarios of arable crop conversion to mixed woodland and grazing grass to achieve target nutrient neutrality reductions of 190 kg N a−1 and 4.9 kg P a−1. Scenarios are based on 2013–2014 cropping history and show N and P mass load reductions and rates.
ScenarioCrop AreaCrop Conversion
Fraction
Area ConvertedN Load Reduction
(Woodland)
N Load Reduction
(Grass)
P Load Reduction
(Woodland/Grass)
(ha) (ha)(kg a−1)(kg ha−1 a−1)(kg a−1)(kg ha−1 a−1)(kg a−1)(kg ha−1 a−1)
1 All crops a11340.0161852229611344.90.27
2 Potatoes870.091842053460584.90.61
3 Sugar beet2210.0831819611287164.90.27
4 Spring beans, dried2410.05513(24)-4134.90.38
5 Winter barley, malt1820.2073857315762204.90.13
6 Winter oilseed rape1480.0841211349511961004.90.41
7 Winter wheat, feed2550.180461874412103464.90.11
Note: a For crops with a P requirement of >10 kg a−1.
Table 6. Number and cost of individual N and P credits for scenarios of arable crop conversion to mixed woodland and grazing grass to achieve nutrient neutrality reductions of 190 kg N a−1 and 4.9 kg P a−1. Scenarios are based on 2013–2014 cropping history and gross margin values.
ScenarioArea Converted
(ha)
Gross Margin
(GBP ha−1)
Cost of Conversion
(GBP)
Number of N Credits
(Woodland)
Number of N Credits
(Grass)
Number of P Credits
(Woodland/Grass)
Cost of N Credit (Woodland)
(GBP a−1)
Cost of N Credit (Grass)
(GBP a−1)
Cost of P Credit
(Woodland/Grass)
(GBP a−1)
1 All crops a18911 b16,39452206110493.142.68335
2 Potatoes8261420,91242004600494.984.55427
3 Sugar beet18125222,536196028704911.507.85460
4 Spring beans, dried136027826--49--160
5 Winter barley, malt3863123,97857307620494.183.15489
6 Winter oilseed rape12740888011,34011,960490.780.74181
7 Winter wheat, feed4683338,31818,74021,030492.041.82782
Notes: a For crops with a P requirement of >10 kg a−1. b Crop conversion area-weighted average.
Disclaimer/Publisher’s Note: The statements, opinions and data contained in all publications are solely those of the individual author(s) and contributor(s) and not of MDPI and/or the editor(s). MDPI and/or the editor(s) disclaim responsibility for any injury to people or property resulting from any ideas, methods, instructions or products referred to in the content.

