Possible Sediment Mixing and the Disparity between Field Measurements and Paleolimnological Inferences in Shallow Iowa Lakes in the Midwestern United States


Abstract
:1. Introduction
2. Materials and Methods
2.1. Limnological Measurements
2.2. Independent Estimates of Soil Erosion
2.3. Paleolimnological Data
2.4. Carbon and Dry Matter Sedimentation Rates by Decade
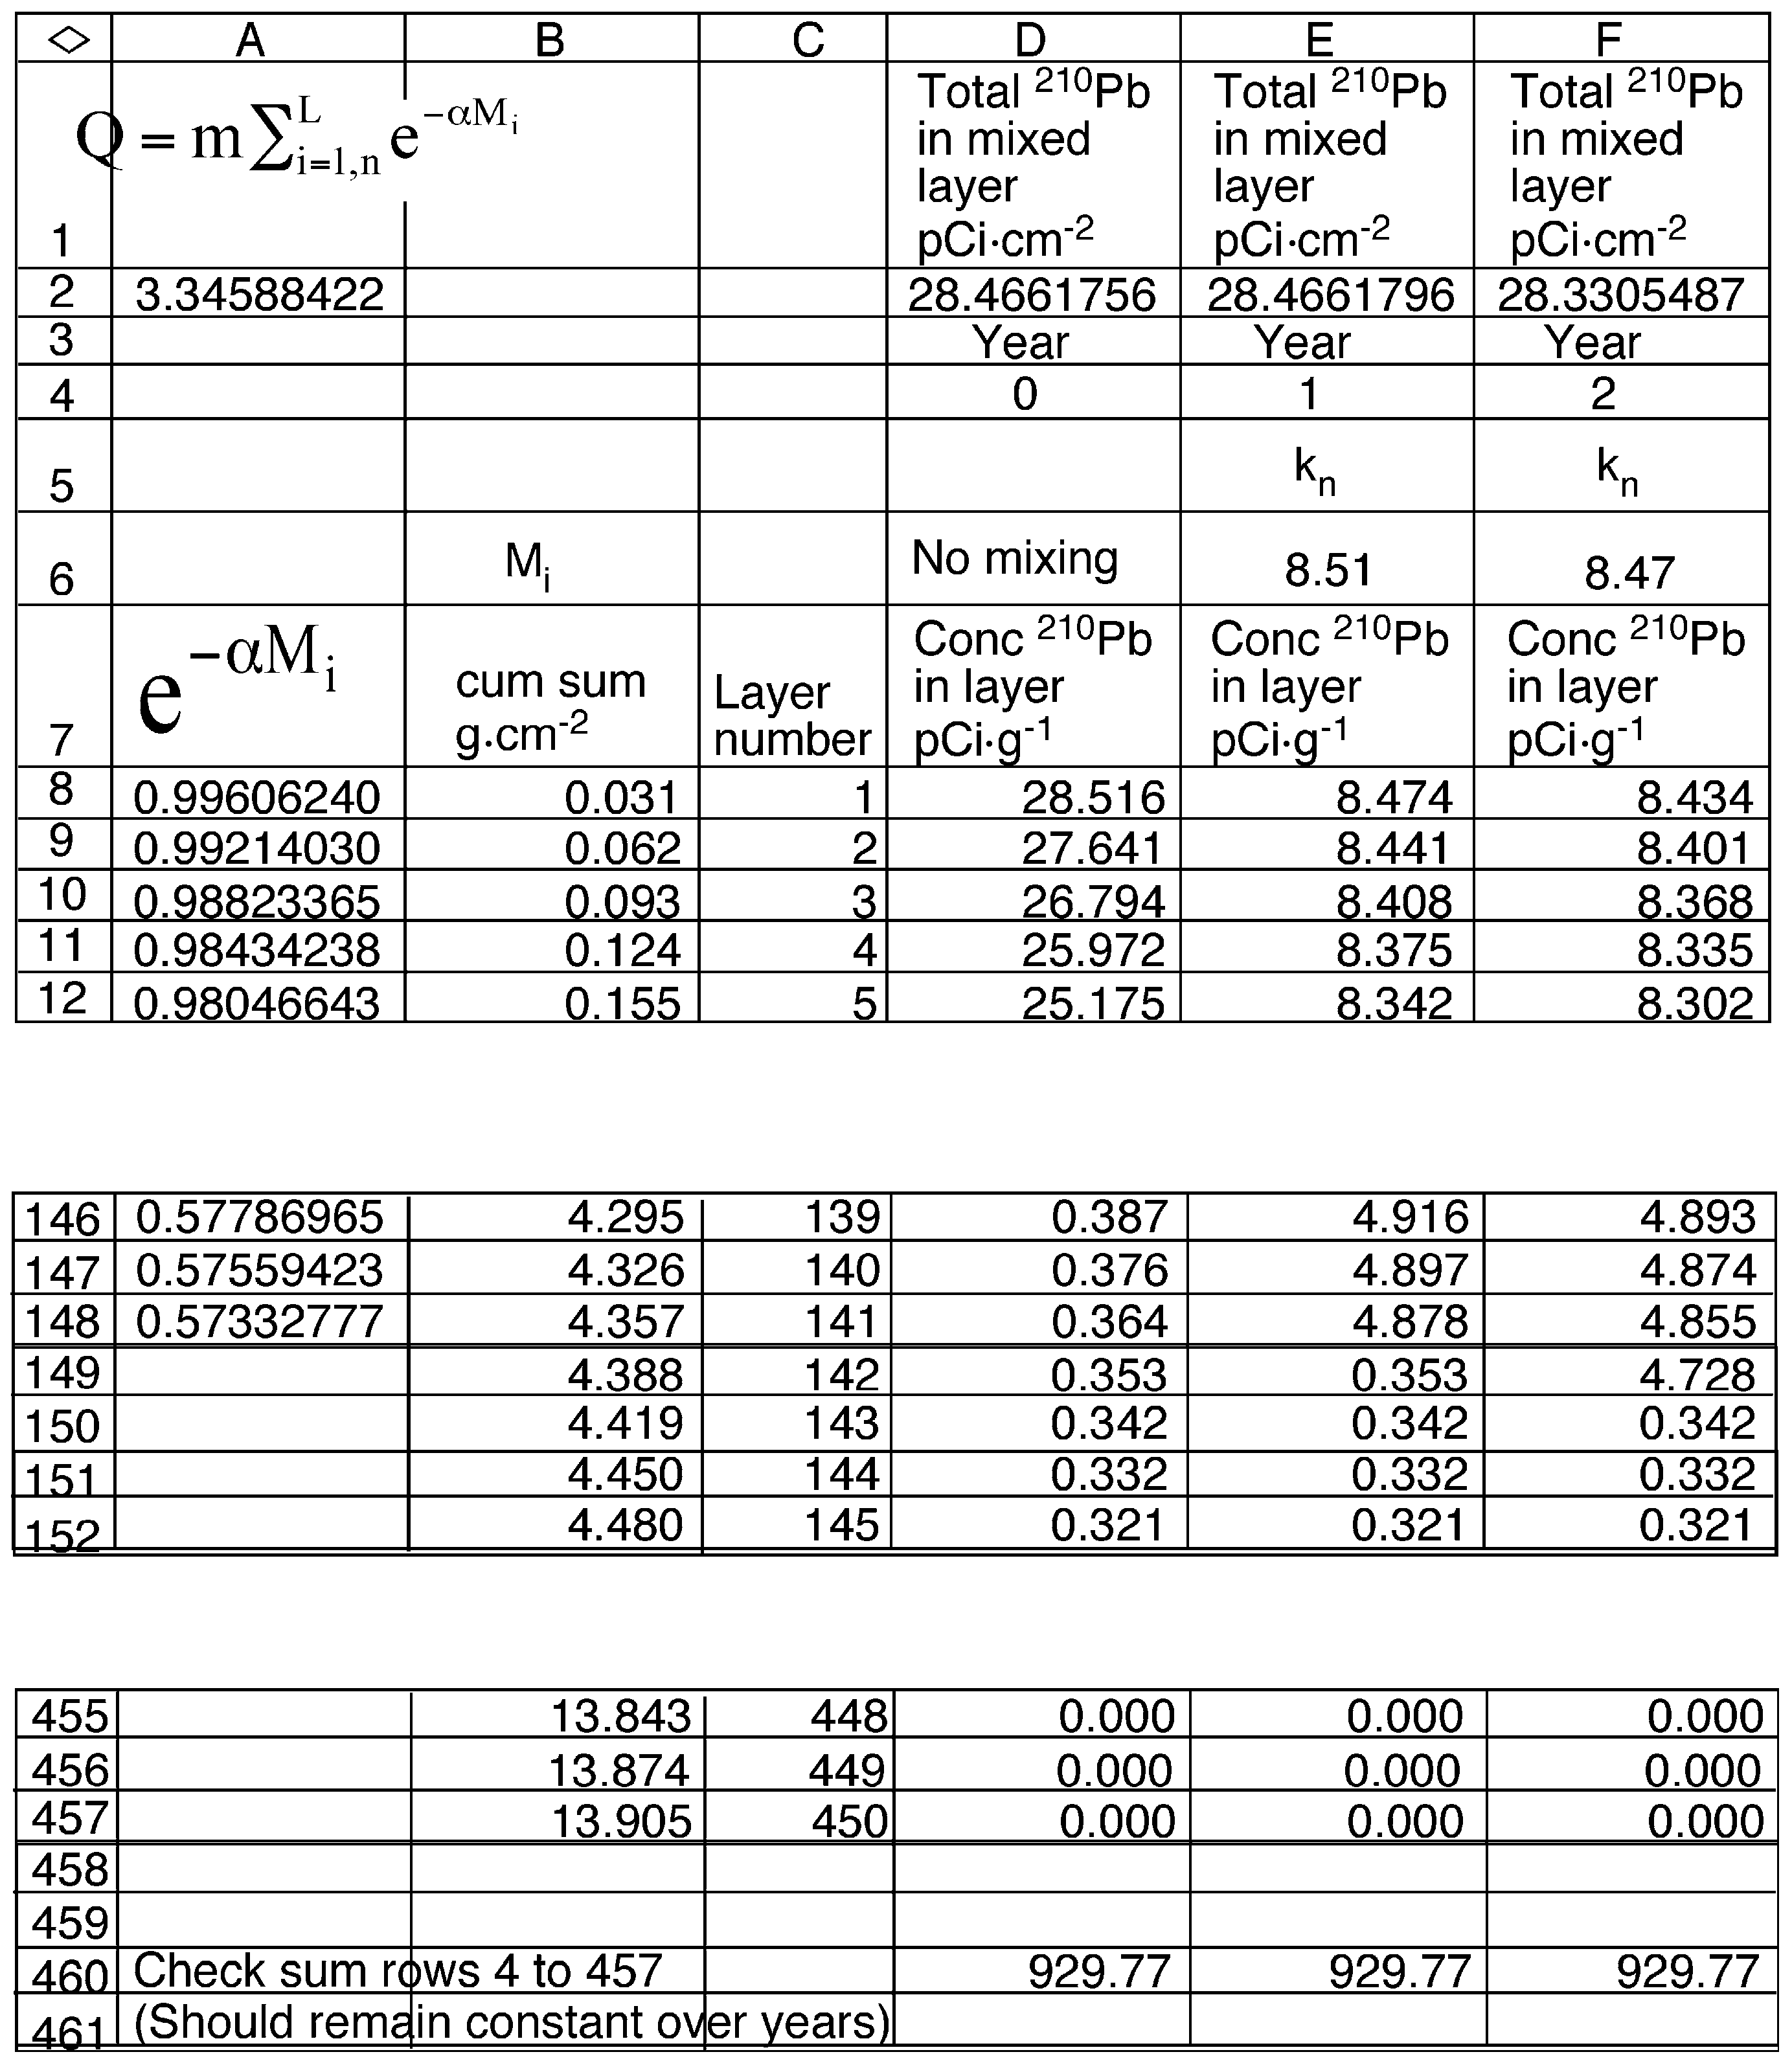
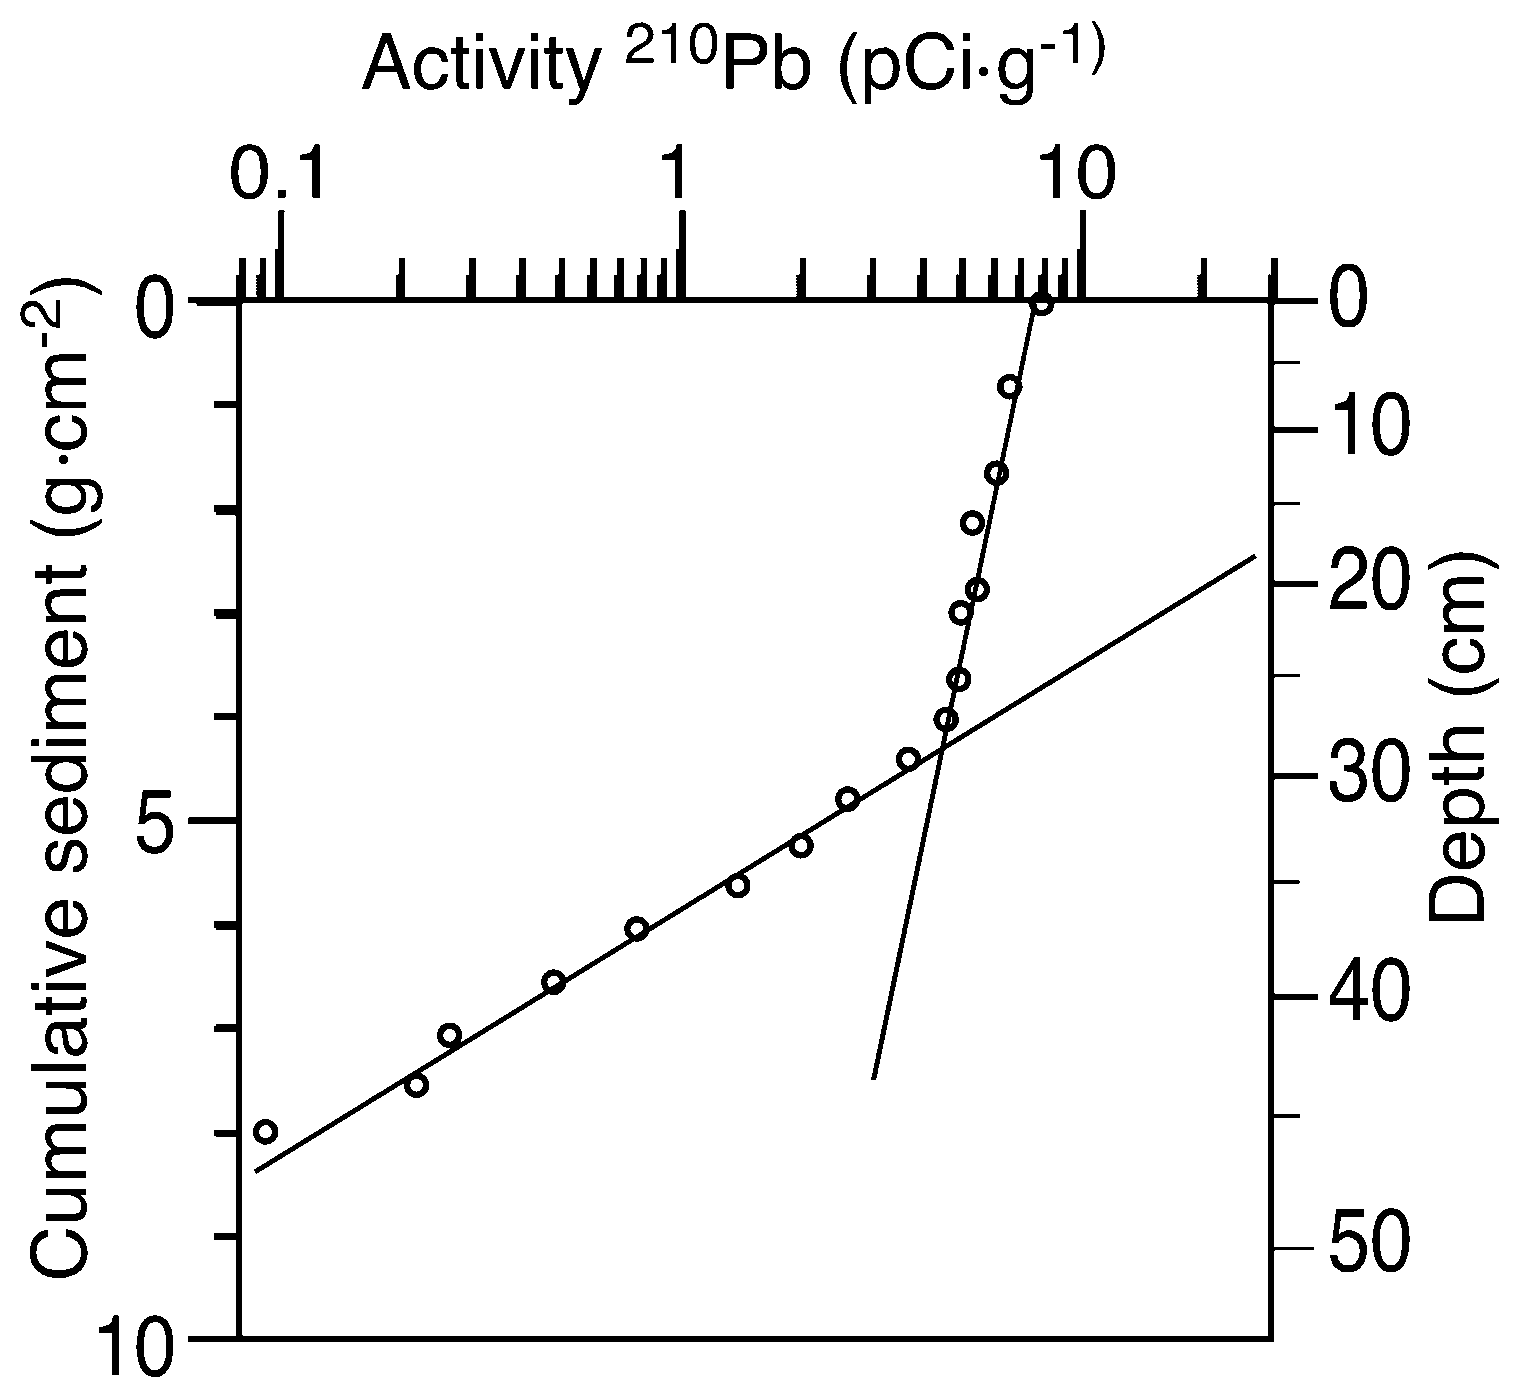
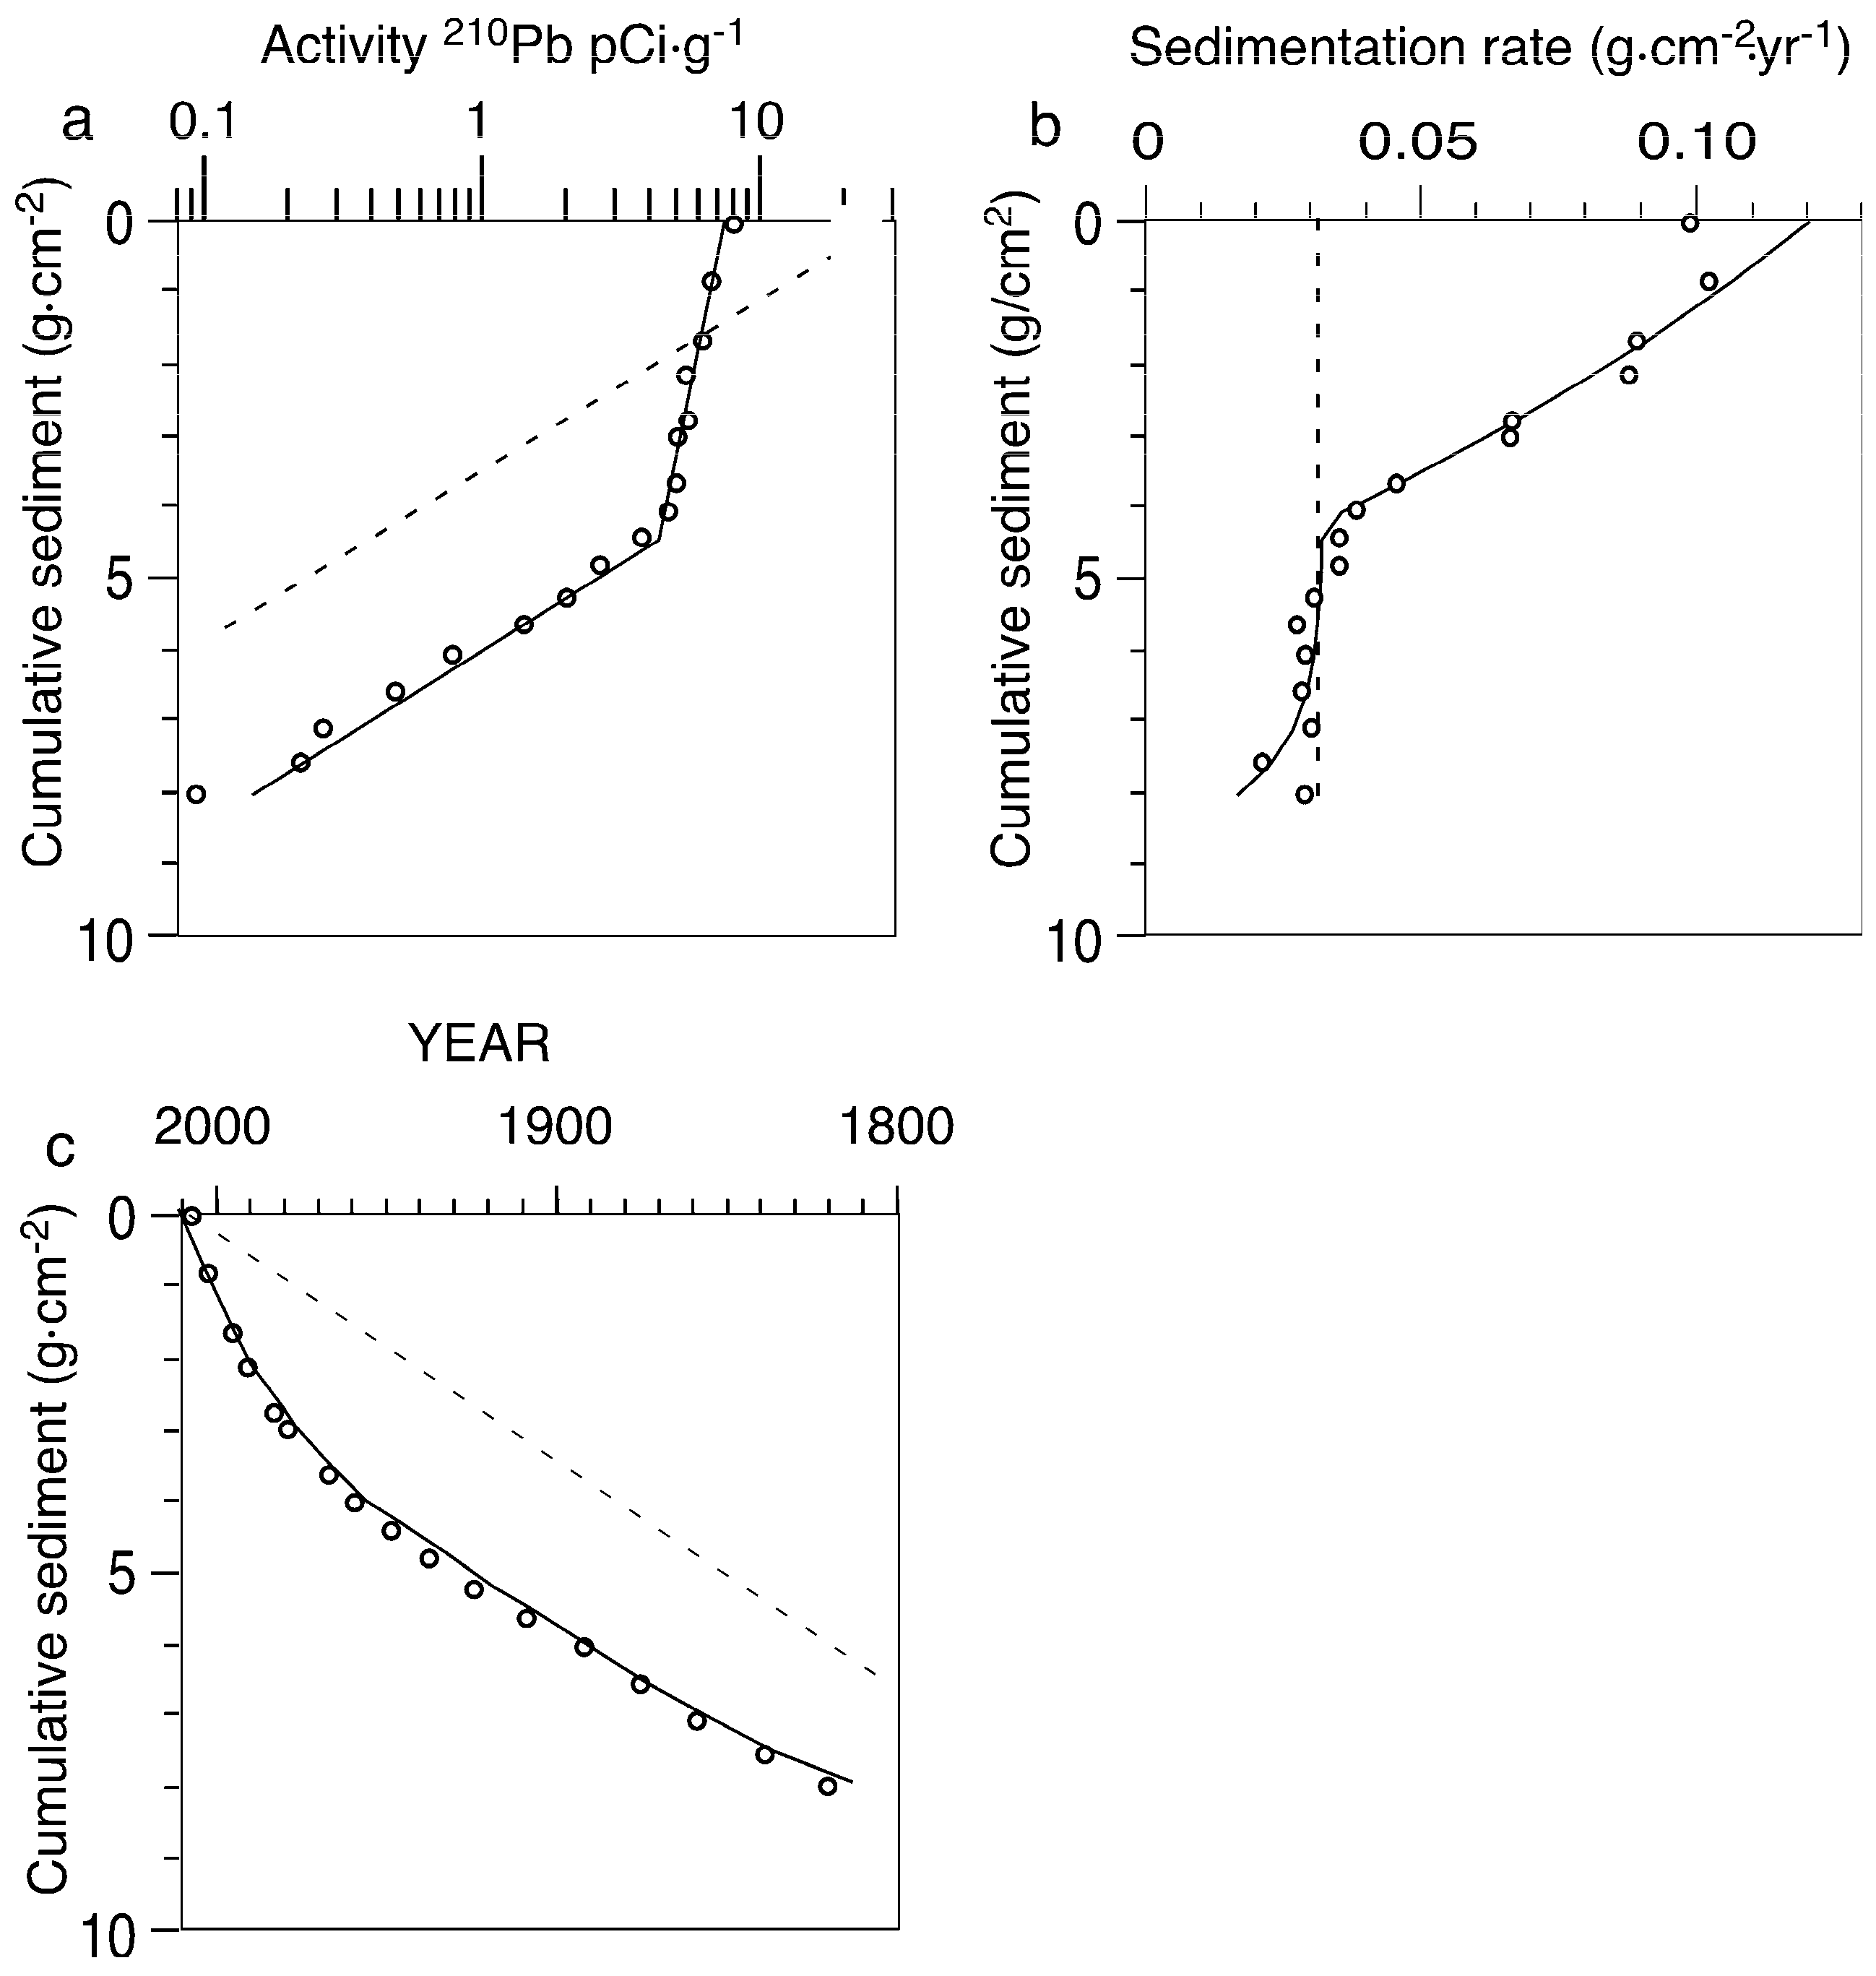
2.5. Alternative Interpretation of 210Pb Profiles
2.6. Model Development
3. Results
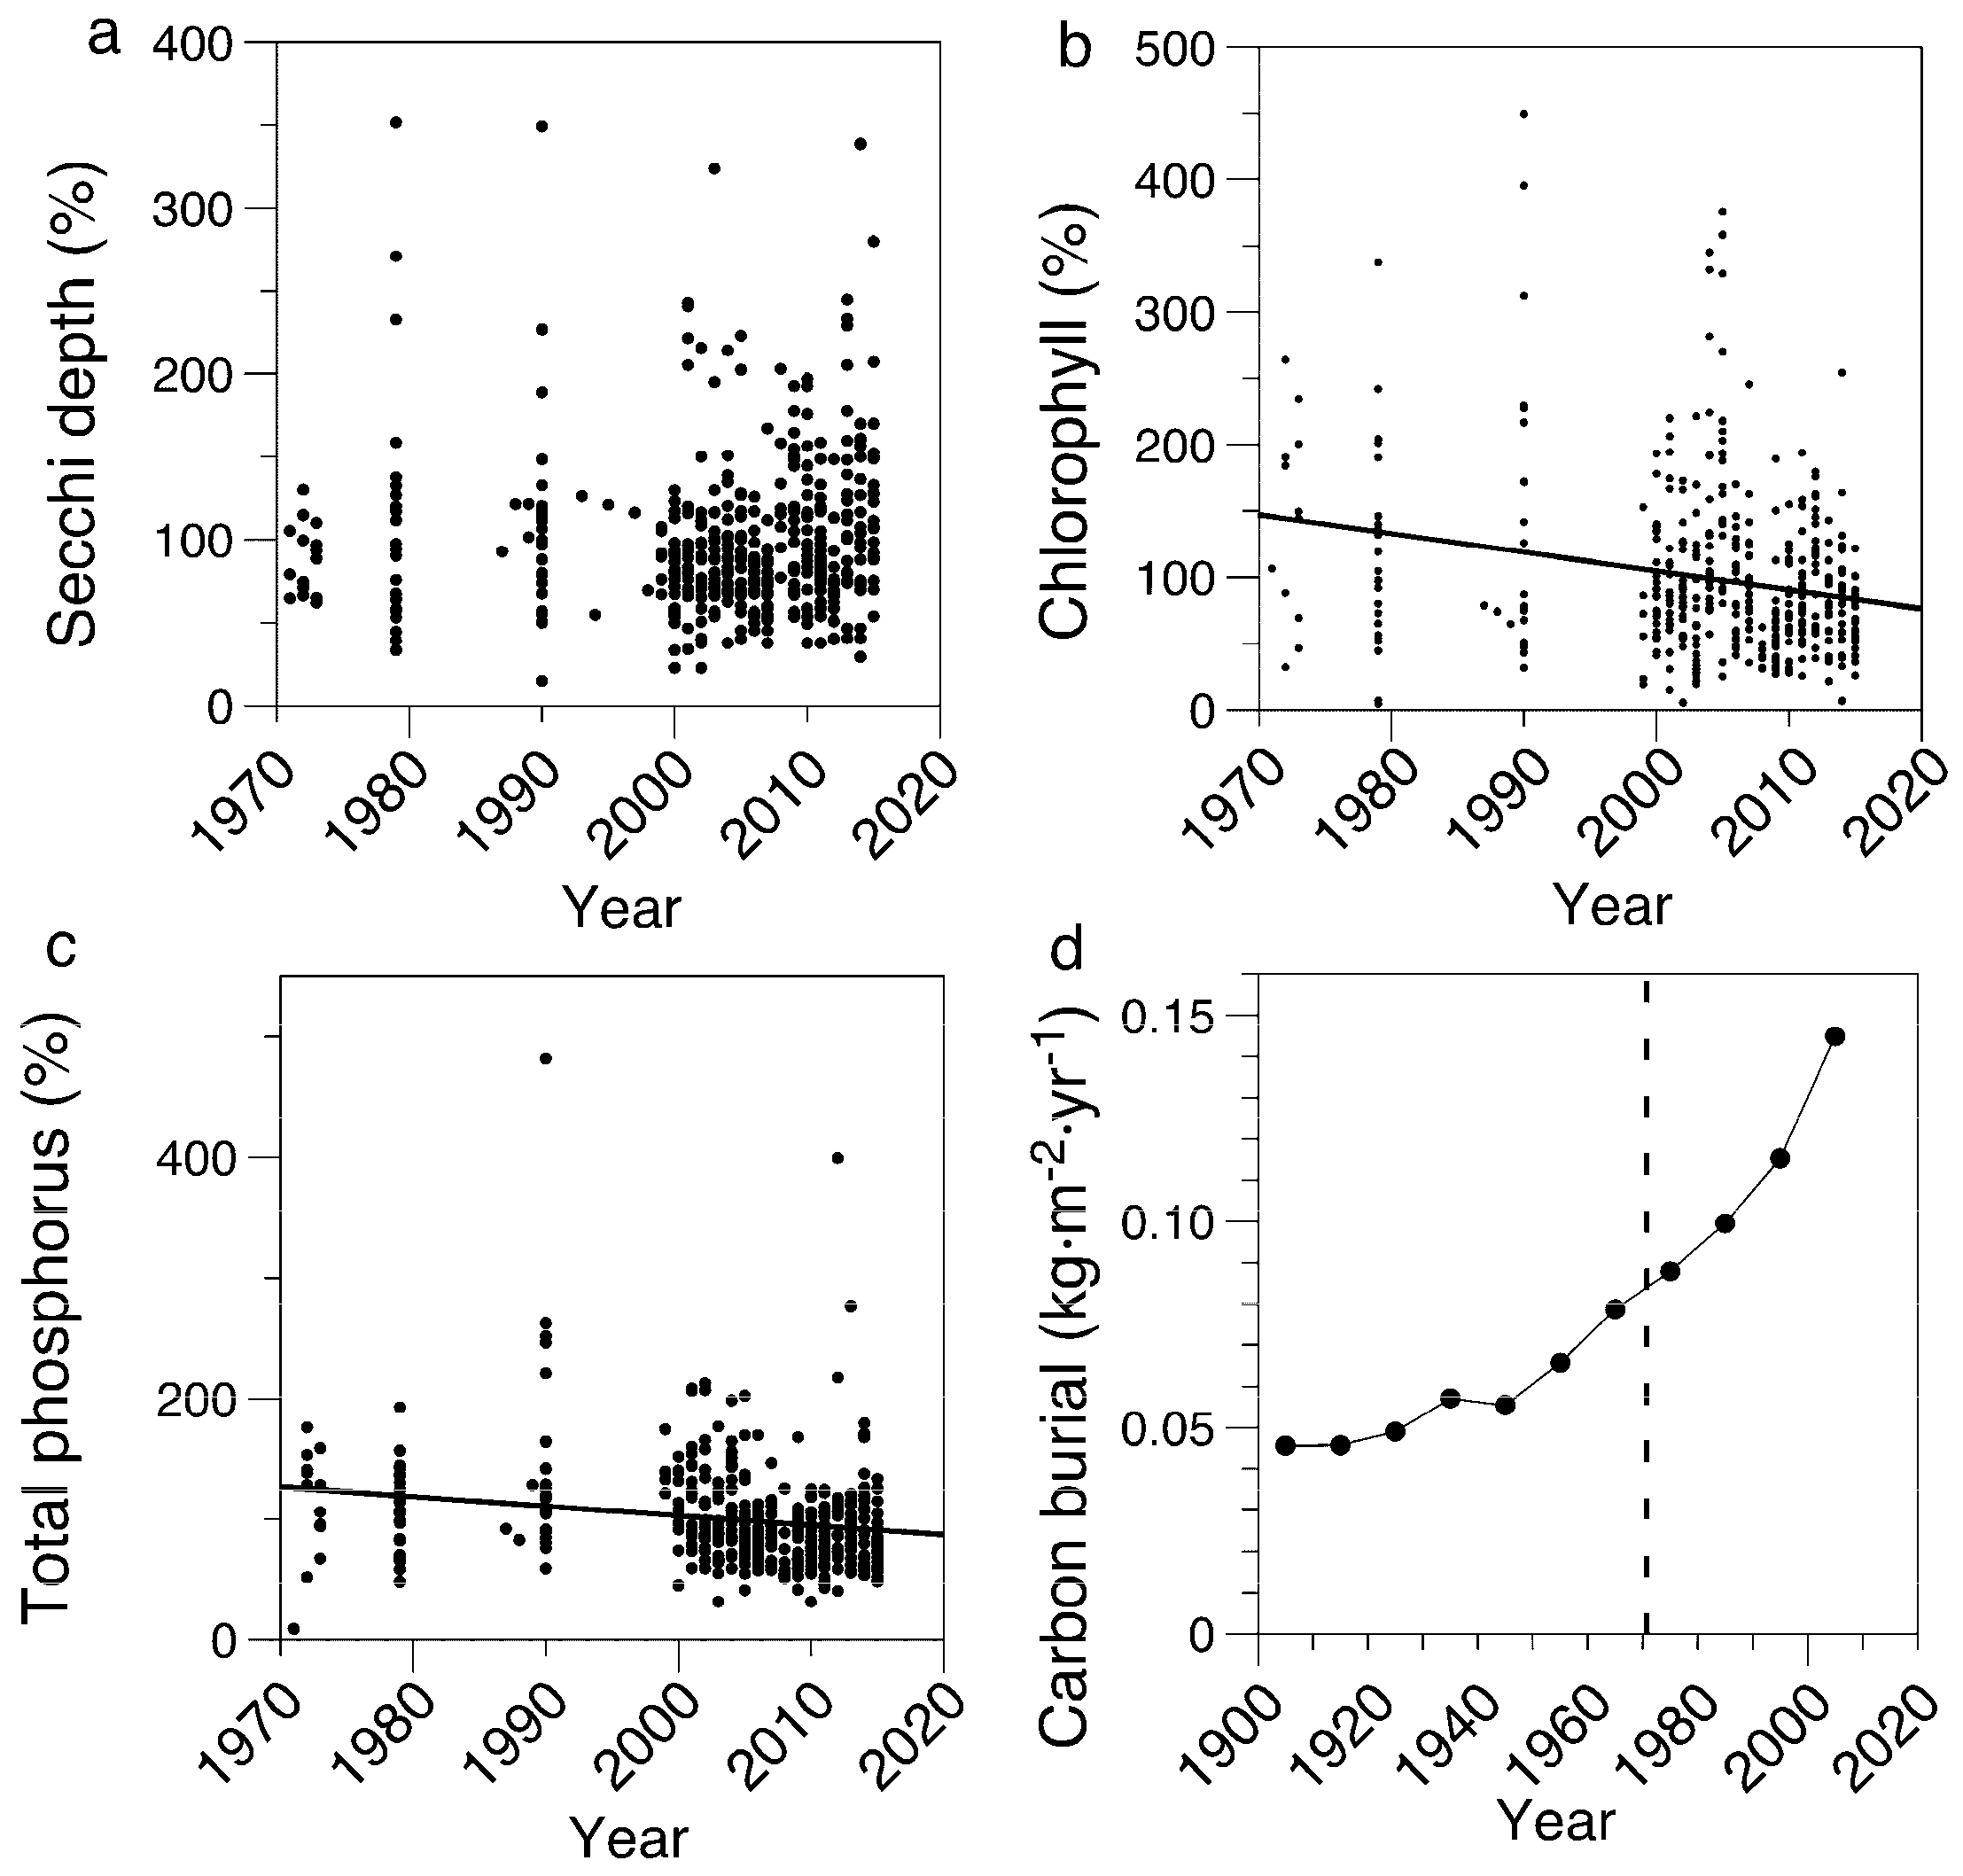
3.1. Limnological Measurements
3.2. Paleolimnological Results
3.3. Independent Estimates of Soil Erosion Rates in Iowa
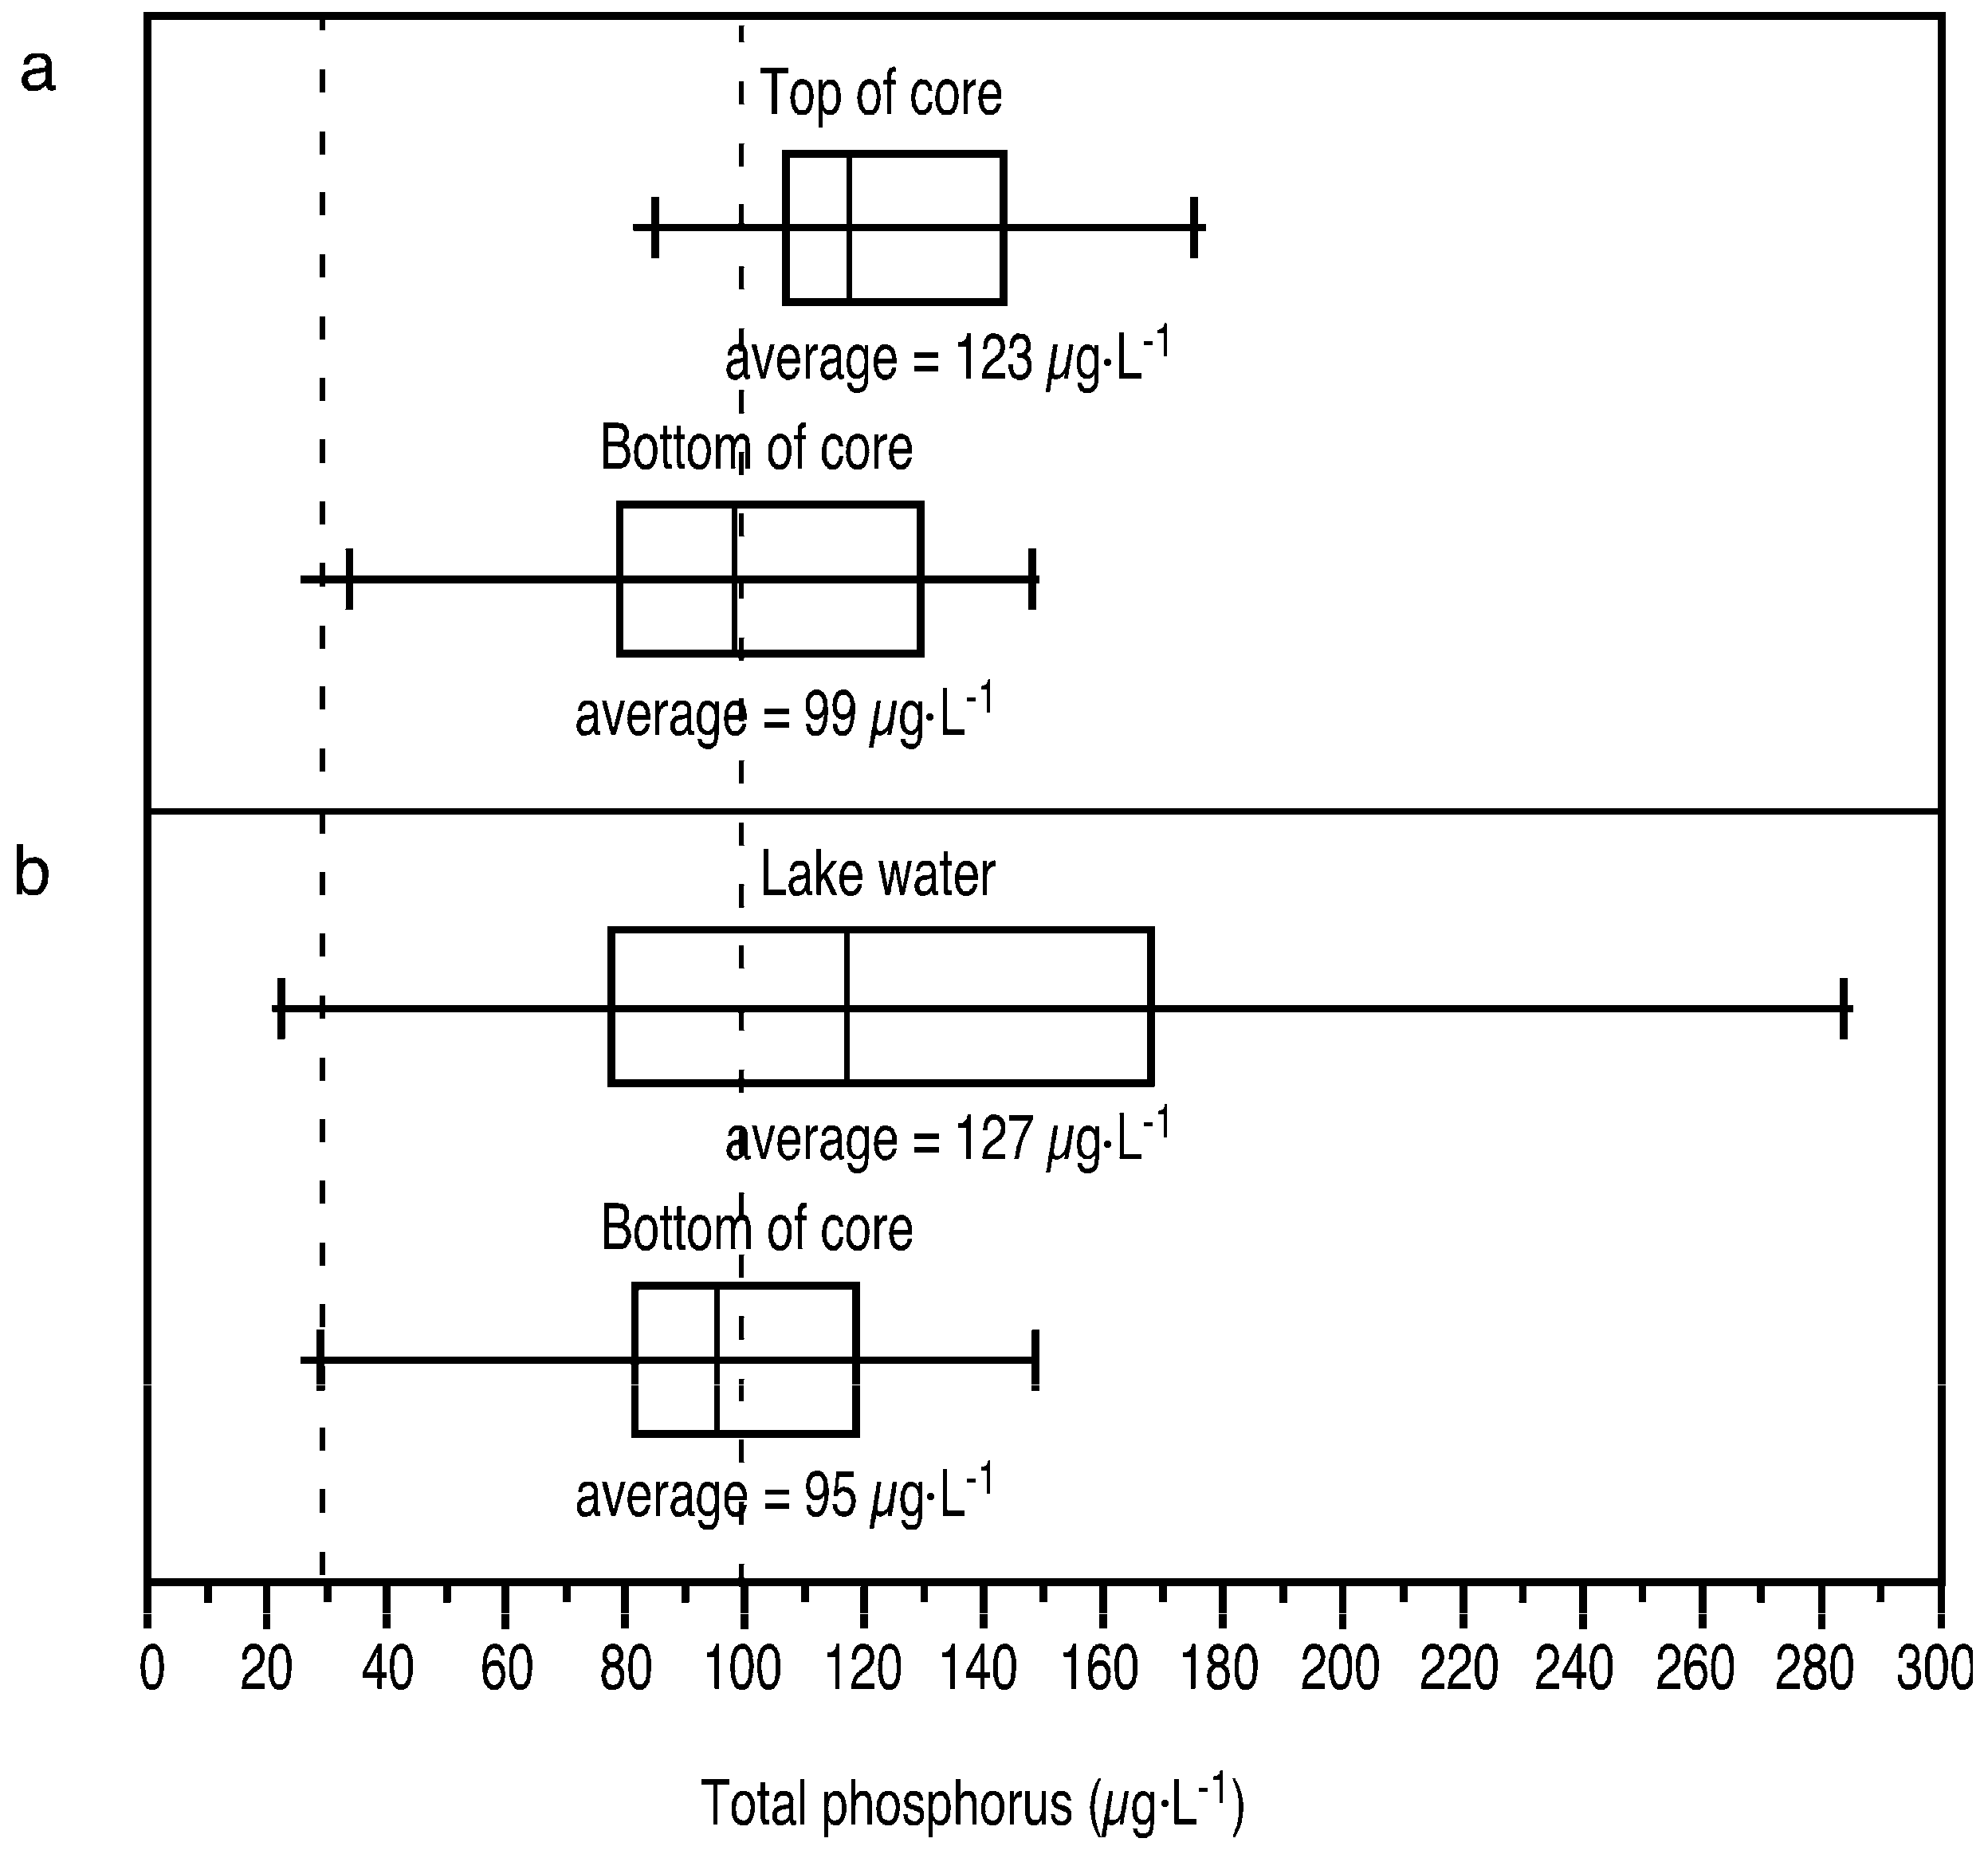
3.4. Diatom-Inferred Concentrations of Total Phosphorus
3.5. Sediment Organic Matter and Chlorophyll Concentrations
3.6. Mixing Models
4. Discussion
4.1. Field Measurements Versus Paleolimnological Inferences
4.2. Problems with Sediment Dating
4.3. Estimate of Extent of Eutrophication
5. Conclusions
Supplementary Materials
Acknowledgments
Author Contributions
Conflicts of Interest
Appendix A

References
- Naumann, E. Some Aspects of the Ecology of the Limnoplankton, with Special Reference to the Phytoplankton. Available online: http://aquaticcommons.org/4819/1/49_1919_naum_some.pdf (accessed on 22 November 2017).
- Arbuckle, K.E.; Downing, J.A. The influence of watershed land use on lake N: P in a predominantly agricultural landscape. Limnol. Oceanogr. 2001, 46, 970–975. [Google Scholar] [CrossRef]
- Heathcote, A.J.; Downing, J.A. Impacts of eutrophication on carbon burial in freshwater lakes in an intensively agricultural landscape. Ecosystems 2012, 15, 60–70. [Google Scholar] [CrossRef]
- Bachmann, R.W.; Hoyer, M.V.; Canfield, D.E., Jr. The extent that natural lakes in the United States of America have been changed by cultural eutrophication. Limnol. Oceanogr. 2013, 58, 945–950. [Google Scholar] [CrossRef]
- Bachmann, R.W.; Hoyer, M.V.; Canfield, D.E., Jr. Response to comments: Quantification of the extent of cultural eutrophication of natural lakes in the United States. Limnol. Oceanogr. 2014, 59, 2231–2239. [Google Scholar] [CrossRef]
- United States Environmental Protection Agency. National Lakes Assessment: A Collaborative Survey of the Nation’s Lakes; U.S. Environmental Protection Agency: Washington, DC, USA, 2010. [Google Scholar]
- McDonald, C.P.; Lottig, N.R.; Stoddard, J.K.; Herlihy, A.T.; Lehmann, S.; Paulsen, S.G.; Peck, D.V.; Pollard, A.I.; Stevenson, J.R. Comment on Bachman et al. (2013): A non-representative sample cannot describe the extent of cultural eutrophication of natural lakes in the United States. Limnol. Oceanogr. 2014, 59, 2226–2230. [Google Scholar] [CrossRef]
- Smith, V.H.; Dodds, W.K.; Havens, K.E.; Engstrom, D.R.; Paerl, H.W.; Moss, B.; Likens, G.E. Comment: Cultural eutrophication of natural lakes in the United States is real and widespread. Limnol. Oceanogr. 2014, 59, 2217–2225. [Google Scholar] [CrossRef]
- Heathcote, A.J.; Filstrup, C.T.; Downing, J.A. Historic Water Quality Conditions in Iowa Natural Lakes. Available online: http://limnology.eeob.iastate.edu/doc/historicwaterquality.pdf (accessed on 22 November 2017).
- Heathcote, A.J.; Filstrup, C.T.; Downing, J.A. Watershed sediment losses to lakes accelerating despite agricultural soil conservation efforts. PLoS ONE 2013, 8. [Google Scholar] [CrossRef] [PubMed]
- Heathcote, A.J.; Hobbs, J.M.R.; Anderson, N.J.; Frings, P.; Engstrom, D.R.; Downing, J.A. Diatom floristic change and lake paleoproduction as evidence of recent eutrophication in shallow lakes of the midwestern USA. J. Paleolimnol. 2015, 53, 17–34. [Google Scholar] [CrossRef]
- Schelske, C.L.; Stoermer, E.F.; Conley, D.J.; Robbins, J.A.; Glover, R.M. Early eutrophication in the Lower Great Lakes: New evidence from biogenic silica in sediments. Science 1983, 222, 320–322. [Google Scholar] [CrossRef] [PubMed]
- Appleby, P.G.; Oldfield, F. The calculation of lead-210 dates assuming a constant rate of supply of unsupported 210Pb to the sediment. Catena 1978, 5, 1–8. [Google Scholar] [CrossRef]
- Lick, W.; Lick, J.; Ziegler, C.K. The resuspension and transport of fine-grained sediments in Lake Erie. J Great Lakes Res. 1994, 20, 599–612. [Google Scholar] [CrossRef]
- Robbins, J.A. Stratigraphic and dynamic effects of sediment reworking by Great Lakes zoobenthos. In Sediment/Freshwater Interaction; Springer: Berlin, Germany, 1982; pp. 611–622. [Google Scholar]
- Huser, B.J.; Bajer, P.G.; Chizinski, C.J.; Sorensen, P.W. Effects of common carp (Cyprinus carpio) on sediment mixing depth and mobile phosphorus mass in the active sediment layer of a shallow lake. Hydrobiologia 2016, 763, 23–33. [Google Scholar] [CrossRef]
- Oldfield, F.; Appleby, P.G. Empirical testing of 210Pb-dating models for lake sediments. In Lake Sediments and Environmental History: Studies in Paleolimnology and Paleoecology in Honour of Winifred Tutin; University of Minnesota Press: Minneapolis, MN, USA, 1984; pp. 93–124. [Google Scholar]
- Bachmann, R.W.; Jones, J.R. Water Quality in the Iowa Great Lakes. A Report to the Iowa Great Lakes Water Quality Control Plan; Iowa State University Library: Ames, IA, USA, 1974. [Google Scholar]
- Canfield, D.E., Jr.; Jones, J.R.; Bachmann, R.W. Sedimentary losses of phosphorus in some natural and artificial Iowa lakes. Hydrobiologia 1982, 87, 65–67. [Google Scholar] [CrossRef]
- Jones, C.S.; Schilling, K.E. From agricultural intensification to conservation: Sediment transport in the Raccoon River, Iowa, 1916–2009. J. Environ. Qual. 2011, 40, 1911–1923. [Google Scholar] [CrossRef] [PubMed]
- United States Department of Agriculture. Summary Report: 2012 National Resources Inventory. Available online: https://www.nrcs.usda.gov/Internet/FSE_DOCUMENTS/nrcseprd396218.pdf (accessed on 22 November 2017).
- Jones, J.R.; Bachmann, R.W. A survey of water transparency in Iowa lakes. Proc. Iowa Acad. Sci. 1978, 85, 6–9. [Google Scholar]
- Bachmann, R.W. Climatic influences on annual variations in water transparency in Lake West Okoboji. J. Iowa Acad. Sci. 1990, 97, 142–145. [Google Scholar]
- Jones, J.R.; Bachmann, R.W. Limnological features of some northwestern Iowa lakes. Proc. Iowa Acad. Sci. 1974, 81, 158–163. [Google Scholar]
- Jones, J.R.; Bachmann, R.W. Trophic status of Iowa lakes in relation to origin and glacial geology. Hydrobiologia 1978, 56, 267–273. [Google Scholar] [CrossRef]
- Iowa Lake Information System. Available online: http://limnology.eeob.iastate.edu/lakereport/chemical_report.aspx?lake_id=001&ryear (accessed on 22 November 2017).
- Benjamini, Y.; Hochberg, Y. Controlling the false discovery rate: A practical and powerful approach to multiple testing. J. R. Stat. Soc. B. 1995, 57, 289–300. [Google Scholar]
- Schilling, K.E.; Zhang, Y.K.; Hill, D.R.; Jones, C.S.; Wolter, C.F. Temporal variations of Escherichia coli concentrations in a large Midwestern river. J. Hydrol. 2009, 365, 79–85. [Google Scholar] [CrossRef]
- Schrage, L.J.; Downing, J.A. Pathways of increased water clarity after fish removal from Ventura Marsh; a shallow, eutrophic wetland. Hydrobiologia 2004, 511, 215–231. [Google Scholar] [CrossRef]
- Robbins, J.A.; Herche, L.R. Models and uncertainty in 210Pb dating of sediments. Verh int. Ver. Limnol. 1993, 25, 217–222. [Google Scholar] [CrossRef]
- Abril, J.M. Constraints on the use of 137Cs as a time-marker to support CRS and SIT chronologies. Environ. Pollut. 2004, 129, 31–37. [Google Scholar] [CrossRef] [PubMed]
- Kumar, A.; Rout, S.; Singhal, R.K.; Ravi, P.M.; Tripathi, R.M. Sediment accumulation and bio-diffusion mixing rates derived from excess 210Pb. J. Coast. Conserv. 2016, 20, 289–297. [Google Scholar] [CrossRef]
- Robbins, J.A.; Krezoski, J.R.; Mozley, S.C. Radioactivity in sediments of the Great Lakes: Post-depositional redistribution by deposit-feeding organisms. Earth Planet. Sc. Lett. 1977, 36, 325–333. [Google Scholar] [CrossRef]
- Anderson, R.F.; Schiff, S.L.; Hesslein, R.H. Determining sediment accumulation and mixing rates using 210Pb, 137Cs, and other tracers: Problems due to postdepositional mobility or coring artifacts. Can. J. Fish. Aquat. Sci. 1987, 44, s231–s250. [Google Scholar] [CrossRef]
- Binford, M.W. Calculation and uncertainty analysis of 210Pb dates for PIRLA project lake sediment cores. J. Paleolimnol. 1990, 3, 253–267. [Google Scholar] [CrossRef]
- Ramstack, J.M.; Fritz, S.C.; Engstrom, D.R. Twentieth century water quality trends in Minnesota lakes compared with presettlement variability. Can. J. Fish. Aquat. Sci. 2004, 61, 561–576. [Google Scholar] [CrossRef]
- Dixit, S.S.; Smol, J.P.; Charles, D.F.; Hughes, R.M.; Paulsen, S.G.; Collins, G.B. Assessing water quality changes in the lakes of the northeastern United States using sediment diatoms. Can. J. Fish. Aquat. Sci. 1999, 56, 131–152. [Google Scholar] [CrossRef]
- United States Environmental Protection Agency. National Lakes Assessment: Technical appendix: Data Analysis Approach. Available online: https://www.epa.gov/sites/production/files/2013-11/documents/nla_technical_appendix.pdf (accessed on 22 November 2017).
- Saulnier-Talbot, É. Overcoming the disconnect: Are paleolimnologists doing enough to make their science accessible to aquatic managers and conservationists? Front. Ecol. Evol. 2015, 3. [Google Scholar] [CrossRef]
- Wang, C.; Chan, K.S.; Schilling, K.E. Total phosphorus concentration trends in 40 Iowa Rivers, 1999 to 2013. J. Environ. Qual. 2016, 45, 1351–1358. [Google Scholar] [CrossRef] [PubMed]
- Lottig, N.R.; Wagner, T.; Henry, E.N.; Cheruvelil, K.S.; Webster, K.E.; Downing, J.A.; Stow, C.A. Long-term citizen-collected data reveal geographical patterns and temporal trends in lake water clarity. PLoS ONE 2014, 9. [Google Scholar] [CrossRef] [PubMed]
- Oliver, S.K.; Collins, S.M.; Soranno, P.A.; Wagner, T.; Stanley, E.H.; Jones, J.R.; Stow, C.A.; Lottig, N.R. Unexpected stasis in a changing world: Lake nutrient and chlorophyll trends since 1990. Glob. Chang. Biol. 2017, 23, 5455–5467. [Google Scholar] [CrossRef] [PubMed]
- Smith, J.N. Why should we believe 210Pb sediment geochronologies? J. Environ. Radioactiv. 2001, 55, 121–123. [Google Scholar] [CrossRef]
- Rose, E.T.; Moen, T. The increase in game-fish populations in East Okoboji Lake, Iowa, following intensive removal of rough fish. Trans. Amer. Fish. Soc. 1953, 82, 104–114. [Google Scholar] [CrossRef]
- Harlan, J.R.; Speaker, E.B.; Bailey, R.M. Iowa Fish and Fishing; State Conservation Commission: Des Moines, IA, USA, 1951; 377p. [Google Scholar]
- Jackson, Z.J.; Quist, M.C.; Downing, J.A.; Larscheid, J.G. Common carp (Cyprinus carpio), sport fishes, and water quality: Ecological thresholds in agriculturally eutrophic lakes. Lake Reserv. Manag. 2010, 26, 14–22. [Google Scholar] [CrossRef]
- Sibbing, F.A.; Osse, J.W.; Terlouw, A. Food handling in the carp (Cyprinus carpio): Its movement patterns, mechanisms and limitations. J. Zool. 1986, 210, 161–203. [Google Scholar] [CrossRef]


| Constants | Description |
| α | The slope of the regression of the natural log of 210Pb vs cumulative sediment mass in the mixed region of the sediment core (0.1277 g−1·cm2). |
| β | The slope of the regression of the natural log of 210Pb vs cumulative sediment mass below the mixed region of the sediment core (1.008 g−1·cm2 ). |
| λ | The decay constant for 210Pb (0.03114 yr−1). |
| ρ | Density of sediments (0.17 g·cm−3) |
| A∞ | The total inventory of 210Pb in the sediment core (28.40 pCi·cm−2). |
| Db | The apparent diffusion coefficient in the mixed layer (cm−2·yr−1). |
| i | Index value for the annual sediment layer below the surface. |
| m | The mass of dry sediment in an annual layer (0.031 g·cm−2). |
| ML | The depth of mixed sediments (4.36 g·cm−2). |
| n | Index value for the number of years since the start of mixing |
| L | Layer number of the deepest mixed layer in year n (141). |
| F | The annual flux of 210Pb to the sediment surface (0.884 pCi·cm−2·yr−1). |
| R | The sediment accumulation rate (0.031 g·cm−2·yr−1). |
| Q | A constant equal to (3.46 g·cm−2) |
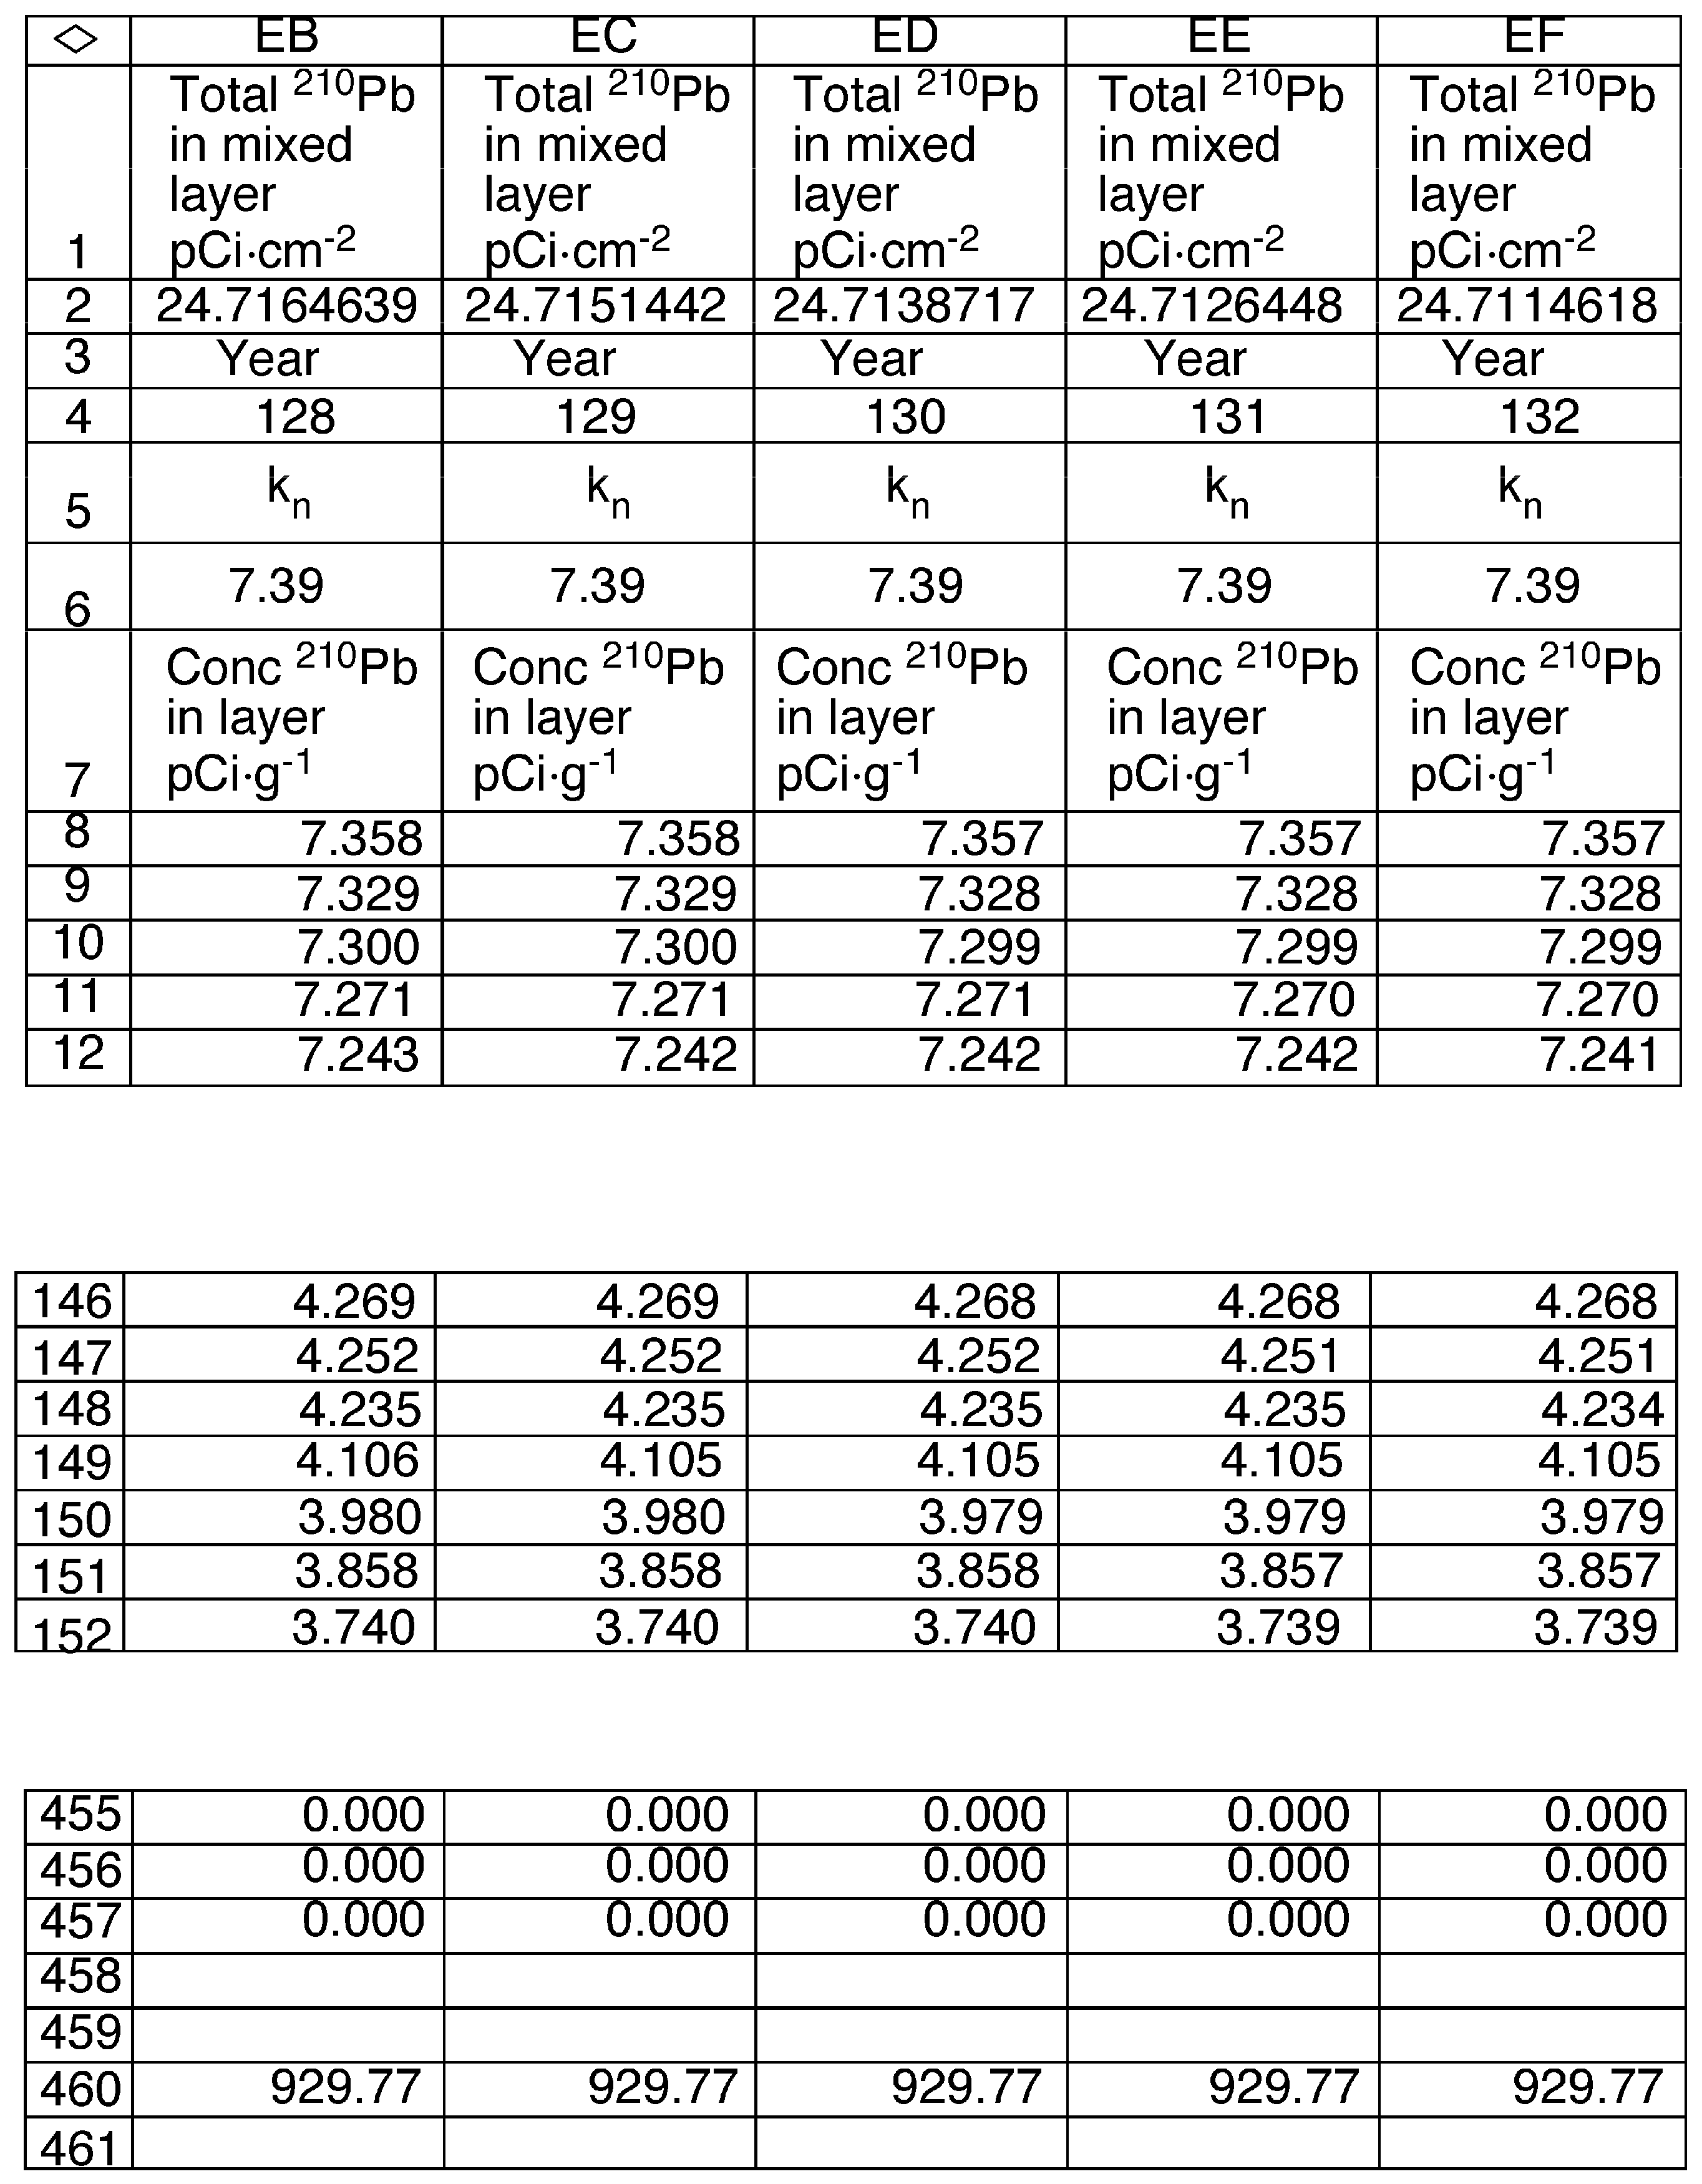
| Variables | Description |
| AL,n | The 210Pb content of the mixed layer in year n (pCi·cm−2) |
| Ci,n | The concentration of 210Pb in layer i in year n (pCi·g−1). |
| Mi | The cumulative mass of sediments for layer i in year n (g·cm−2). |
| Kn | Ratio AL,n /Q (pCi·g−1) |
| Lake | Secchi Depth | Chlorophyll | Total Phosphorus |
|---|---|---|---|
| Big Spirit | NS | NS | NS |
| Black Hawk | +R2 = 0.25 p = 0.04 | −R2 = 0.27 p = 0.03 | NS |
| Center | NS | NS | NS |
| Clear | NS | −R2 = 0.58 p < 0.001 | −R2 = 0.65 p = 0.001 |
| Cornelia | NS | NS | −R2 = 0.46 p = 0.003 |
| Crystal | NS | NS | NS |
| East Okoboji | NS | −R2 = 0.30 p = 0.009 | NS |
| Five Island | −R2 = 0.39 p = 0.008 | NS | −R2 = 0.29 p = 0.03 |
| Ingham | −R2 = 0.45 p = 0.003 | NS | NS |
| Iowa | NS | NS | NS |
| Little Spirit | NS | NS | NS |
| Little Wall | −R2 = 0.59 p = 0.003 | NS | NS |
| Lost Island | NS | −R2 = 0.27 p = 0.03 | NS |
| Lower Gar | NS | NS | NS |
| Minnewashta | NS | NS | −R2 = 0.45 p < 0.001 |
| North Twin | NS | NS | NS |
| Silver (Dickinson) | NS | NS | NS |
| Silver (Palo Alto) | NS | NS | NS |
| Silver (Worth) | NS | NS | NS |
| Storm | NS | −R2 = 0.34 p = 0.014 | NS |
| Trumbull | NS | NS | NS |
| Tuttle | NS | NS | NS |
| Upper Gar | +R2 = 0.31 p = 0.008 | −R2 = 0.40 p = 0.003 | −R2 = 0.38 p = 0.003 |
| West Okoboji | +R2 = 0.22 p = 0.009 | NS | −R2 = 0.36 p = 0.021 |
| Year | Cultivated Cropland | All Cropland | Pastureland |
|---|---|---|---|
| 1977 | 2.29 | 2.22 | 0.63 |
| 1982 | 1.84 | 1.79 | 0.36 |
| 1987 | 1.57 | 1.52 | 0.38 |
| 1992 | 1.35 | 1.30 | 0.36 |
| 1997 | 1.17 | 1.14 | 0.34 |
| 2002 | 1.30 | 1.26 | 0.34 |
| 2007 | 1.32 | 1.28 | 0.29 |
| 2012 | 1.37 | 1.32 | 0.29 |
| Lake Region | R2boot | RMSEPboot | Reference |
|---|---|---|---|
| Minnesota lakes | 0.68 | 0.25 | [36] |
| Iowa lakes | 0.61 | 0.30 | [9] |
| Northeastern US lakes | 0.59 | 0.34 | [37] |
| United States lakes | 0.67 | 0.36 | [38] |
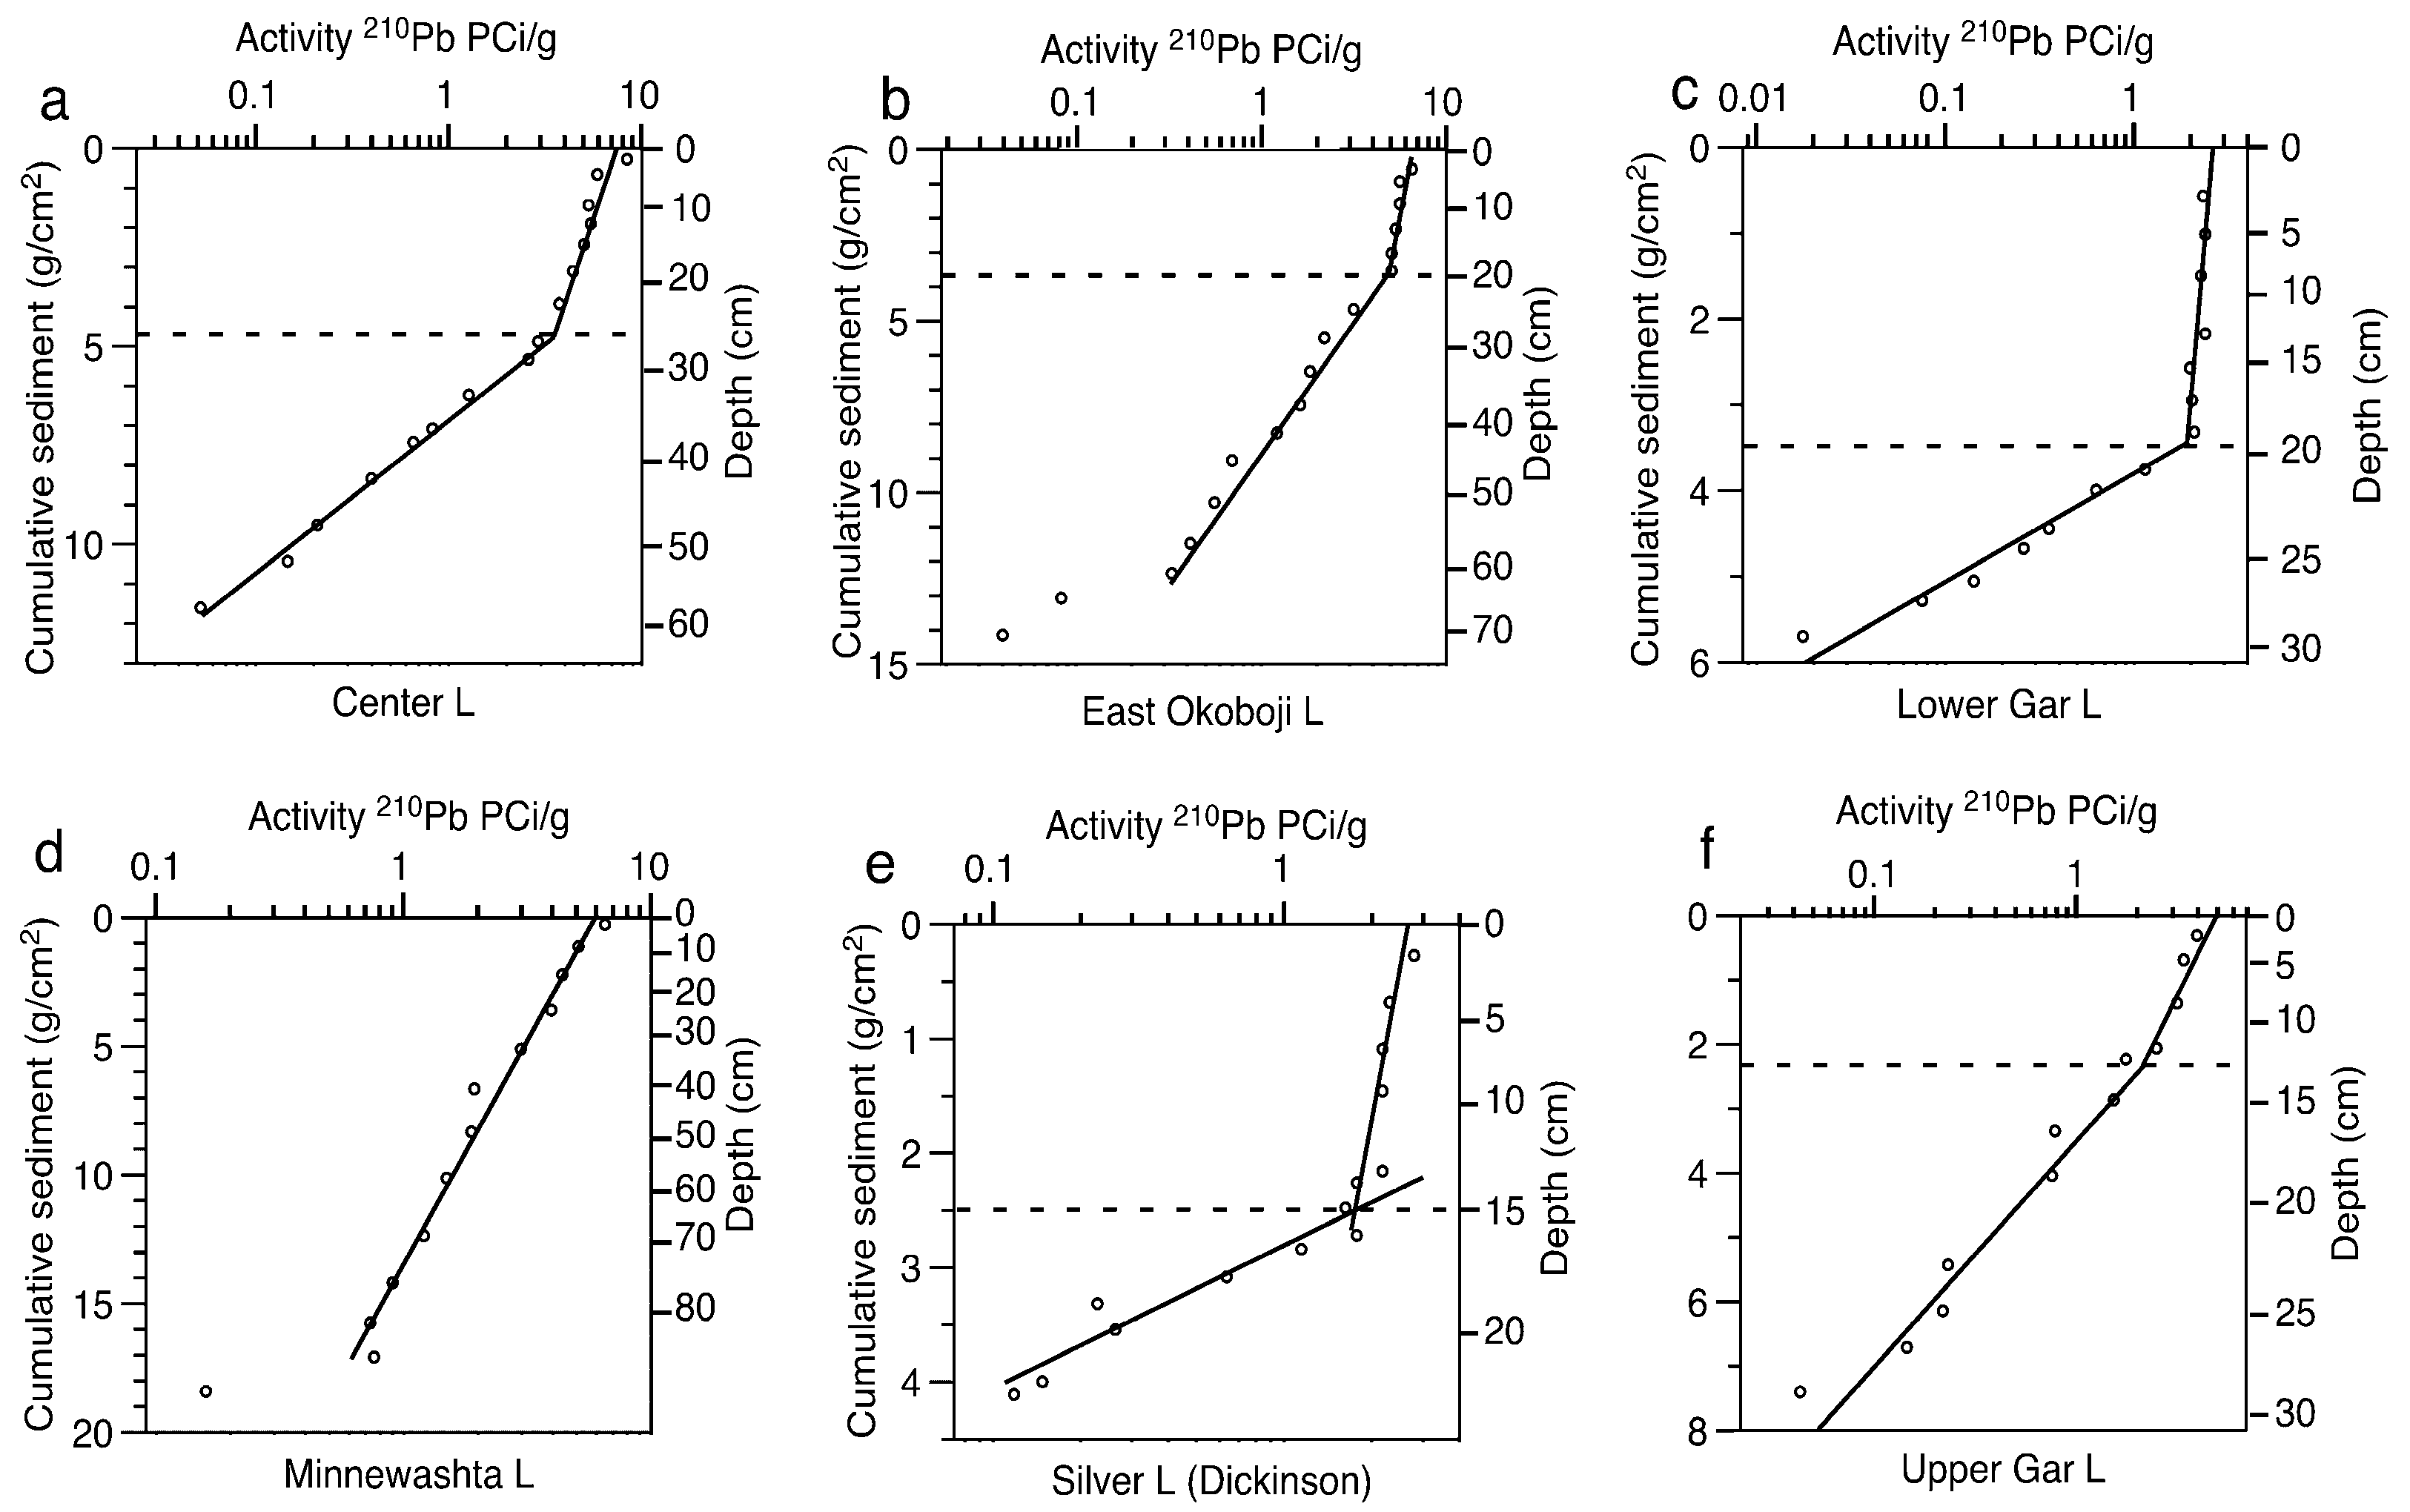
| Lake | Sediment Accumulation Rate (g·cm−2·yr−1) | Mixed Layer Depth (g·cm−2) | Mixed Layer Depth (cm) | Years of Sediment in Mixed Layer |
|---|---|---|---|---|
| Center | 0.05 | 4.87 | 26 | 91 |
| East Okoboji | 0.10 | 2.97 | 18 | 28 |
| Lower Gar | 0.02 | 3.52 | 20 | 222 |
| Minnewashta | 0.24 | NA | NA | NA |
| Silver (Dickinson) | 0.02 | 2.50 | 15 | 142 |
| Upper Gar | 0.05 | 2.26 | 13 | 48 |
| West Okoboji | 0.03 | 4.36 | 29 | 141 |
© 2018 by the authors. Licensee MDPI, Basel, Switzerland. This article is an open access article distributed under the terms and conditions of the Creative Commons Attribution (CC BY) license (http://creativecommons.org/licenses/by/4.0/).
Share and Cite
Bachmann, R.W.; Hoyer, M.V.; Canfield, D.E. Possible Sediment Mixing and the Disparity between Field Measurements and Paleolimnological Inferences in Shallow Iowa Lakes in the Midwestern United States. Geosciences 2018, 8, 40. https://doi.org/10.3390/geosciences8020040
Bachmann RW, Hoyer MV, Canfield DE. Possible Sediment Mixing and the Disparity between Field Measurements and Paleolimnological Inferences in Shallow Iowa Lakes in the Midwestern United States. Geosciences. 2018; 8(2):40. https://doi.org/10.3390/geosciences8020040
Chicago/Turabian StyleBachmann, Roger W., Mark V. Hoyer, and Daniel E. Canfield. 2018. "Possible Sediment Mixing and the Disparity between Field Measurements and Paleolimnological Inferences in Shallow Iowa Lakes in the Midwestern United States" Geosciences 8, no. 2: 40. https://doi.org/10.3390/geosciences8020040