Melt Reintegration Modelling: Testing against a Subsolidus Reference Assemblage
by
 ,
,
Kiara L. Alessio
1,* ,
,
Martin Hand
1,
Laura J. Morrissey
1,2,
David E. Kelsey
1 and
Justin L. Payne
1,2 1
Department of Earth Sciences, University of Adelaide, Adelaide, SA 5005, Australia
2
School of Natural and Built Environments, University of South Australia, GPO Box 2471, Adelaide, SA 5001, Australia
*
Author to whom correspondence should be addressed.
Geosciences 2017, 7(3), 75; https://doi.org/10.3390/geosciences7030075
Submission received: 13 July 2017
/
Revised: 16 August 2017
/
Accepted: 23 August 2017
/
Published: 29 August 2017
(This article belongs to the Special Issue Metamorphic Geology and Phase Equilibrium Modeling in the 21st Century)
Abstract
:Phase equilibria modelling incorporating melt reintegration offers a methodology to create hypothetical rock compositions that may have existed prior to melt loss, allowing the potential prograde evolution of rocks to be explored. However, melt reintegration modelling relies on assumptions concerning the volume of melt that was lost and is generally restricted by the absence of direct constraints on the pre-anatectic mineral assemblages. Mg-rich granulite in the 514–490 Ma Delamerian Orogen in southern Australia contains spinel–cordierite symplectic intergrowths that surround rare, coarse blocky domains of sillimanite. These sillimanite cores, as well as the widespread presence of andalusite in lower grade areas of the southern Delamerian Orogen, suggest that the subsolidus precursor to the granulite contained andalusite. This provides the opportunity to test if melt reintegration modelling of the granulite predicts subsolidus andalusite. Stepwise down-temperature melt reintegration modelling produces a water-saturated solidus after the addition of 12 mol% melt. When modelled at subsolidus conditions, the resulting rock composition produces andalusite-bearing assemblages with andalusite modes similar to the abundance of the sillimanite-cored spinel–cordierite intergrowths. The modelling results from this case study suggest that melt reintegration modelling is a valid method to recreate prograde subsolidus bulk rock compositions.
1. Introduction
Melting and melt loss during granulite facies metamorphism is a fundamental process that differentiates the continental crust and causes chemical depletion in the residual material [1,2,3]. Advances in thermodynamic modelling of mineral assemblages have enabled quantitative phase equilibria modelling of the melting processes operating in partially molten siliciclastic rocks in increasingly complex chemical systems [4,5,6,7,8,9,10,11]. These models have been used to investigate the effects of melting and melt loss on crustal rheology, composition and the preservation of geochronometers e.g., [1,5,12,13,14,15]. However, the application of these models has been limited to theoretical situations, as in almost all real cases there is little information about the composition of the rock prior to melting cf. [11]. This lack of information about the likely protolith composition also means that it is essentially impossible to determine the prograde P–T evolution of a granulite facies rock, because the composition of the rock in which prograde minerals developed has been irrevocably modified [16]. For this reason, quantitative petrological interpretation of mineral inclusions captured within prograde minerals is difficult and often impossible. In trying to reconstruct potential prograde bulk compositions, metamorphic petrologists approach the problem via melt reintegration modelling, in which theoretical compositions of melt are integrated into a rock composition in order to create a hypothetical “protolith” bulk composition. A recent study by Bartoli [17] has shown that a number of methods of melt reintegration modelling, including the stepwise method used here, are able to produce plausible subsolidus bulk rock compositions. However, significant underestimations of melt productivity may still occur, as exact protolith compositions are unknown in most cases. While useful, this process relies on assumptions regarding the prograde metamorphic path and volume of melt that has been lost and is commonly done up to a point at which a water-saturated solidus is achieved [18,19]. The determination of a final composition is unconstrained, as the prograde compositions often no longer exist for comparison, except in some rare cases e.g., [20,21]. However, one way to assess the viability of melt reintegration modelling as a means of determining a reasonable prograde rock composition is to choose a granulite facies sample where the prograde subsolidus mineralogy is relatively well constrained.
The aim of this study is to use melt reintegration to reproduce the original bulk composition of a residual granulite facies rock from the Delamerian Orogen in southern Australia. The existence of andalusite in the subsolidus assemblage provides a test to see whether melt reintegration P–T modelling of the reintegrated bulk composition stabilises the observed modal abundance of subsolidus andalusite, giving some constraints on the validity of model-generated subsolidus bulk compositions.
2. Geological Setting
The footprint of the 514–490 Ma Delamerian Orogeny has a north–south extent from the Peake and Denison Inliers in the far north of South Australia, to the western tip of Kangaroo Island in the south (Figure 1). It extends to the east into western New South Wales, Victoria and Tasmania. The Antarctic continuation of the orogen is the Ross Orogen [22,23], which formed along the same paleo-continental margin but largely predates the Delamerian Orogeny. In South Australia, Victoria, western New South Wales and Tasmania, the Delamerian Orogen is primarily composed of Late Neoproterozoic and Early Cambrian sedimentary rocks that were deposited in a passive margin setting. In South Australia, the Early Cambrian sequences comprise the basal Normanville and overlying Kanmantoo Groups that were deposited in the Stansbury Basin [24,25,26].
The early compressional stages of the Delamerian Orogeny involved west-vergent thrusting (D1) and the development of a low-angle fabric (S1), which was overprinted by two phases of tight to open upright folds during D2 and D3 [28,29,30]. The early stages of the event were synchronous with granitic magmatism throughout the region, with the earliest syntectonic granite intruded during the onset of orogenic crustal shortening at 514 ± 4 Ma [31]. Increasingly mantle-derived magmatism marked the end of the orogenic event (c. 490 Ma) and continued into the Early Ordovician [32,33,34]. Following the Delamerian Orogeny, an extensional setting was re-established and post-orogenic magmatism resulted in the intrusion of rhyolite and diorite dikes [27]. Within the Kanmantoo Group, Delamerian-aged metamorphism is characterised by mostly amphibolite facies low-pressure–high-temperature metamorphism, resulting in the formation of andalusite- to sillimanite-bearing assemblages in aluminous rocks [31,35]. Metamorphic grade increases in proximity to the late-tectonic granitic intrusives, culminating in extensive partial melting [27,36,37].
The Kanmantoo Group metasedimentary rocks at Reedy Creek consist primarily of extensively migmatised metapsammitic lithologies interlayered with thin discontinuous layers of metapelite. The hosting metapsammitic lithologies are primarily composed of quartz–plagioclase–cordierite–biotite ± sillimanite. The sequence contains a pervasive biotite-bearing foliation that is parallel to and cross-cut by migmatitic segregations. Abundant partial melting has resulted in the segregation of leucosome and melanosome. Thin leucosomes (<2 cm wide) have been folded with the original foliation, suggesting that some melting occurred in the early stages of the Delamerian Orogeny. However, some leucosomes are only slightly deformed and others cross-cut the original foliation, suggesting that melting continued throughout the whole event. The migmatitic rocks were intruded by the Reedy Creek Granodiorite and associated diorites at 492.6 ± 1.1 Ma [27]. The granodiorite is weakly foliated parallel to the fabric in the migmatitic metasediments. Within the metasediments, decimetre-scale bodies of diorite have been converted to hornblende-bearing migmatites that contain K–feldspar-bearing melts.
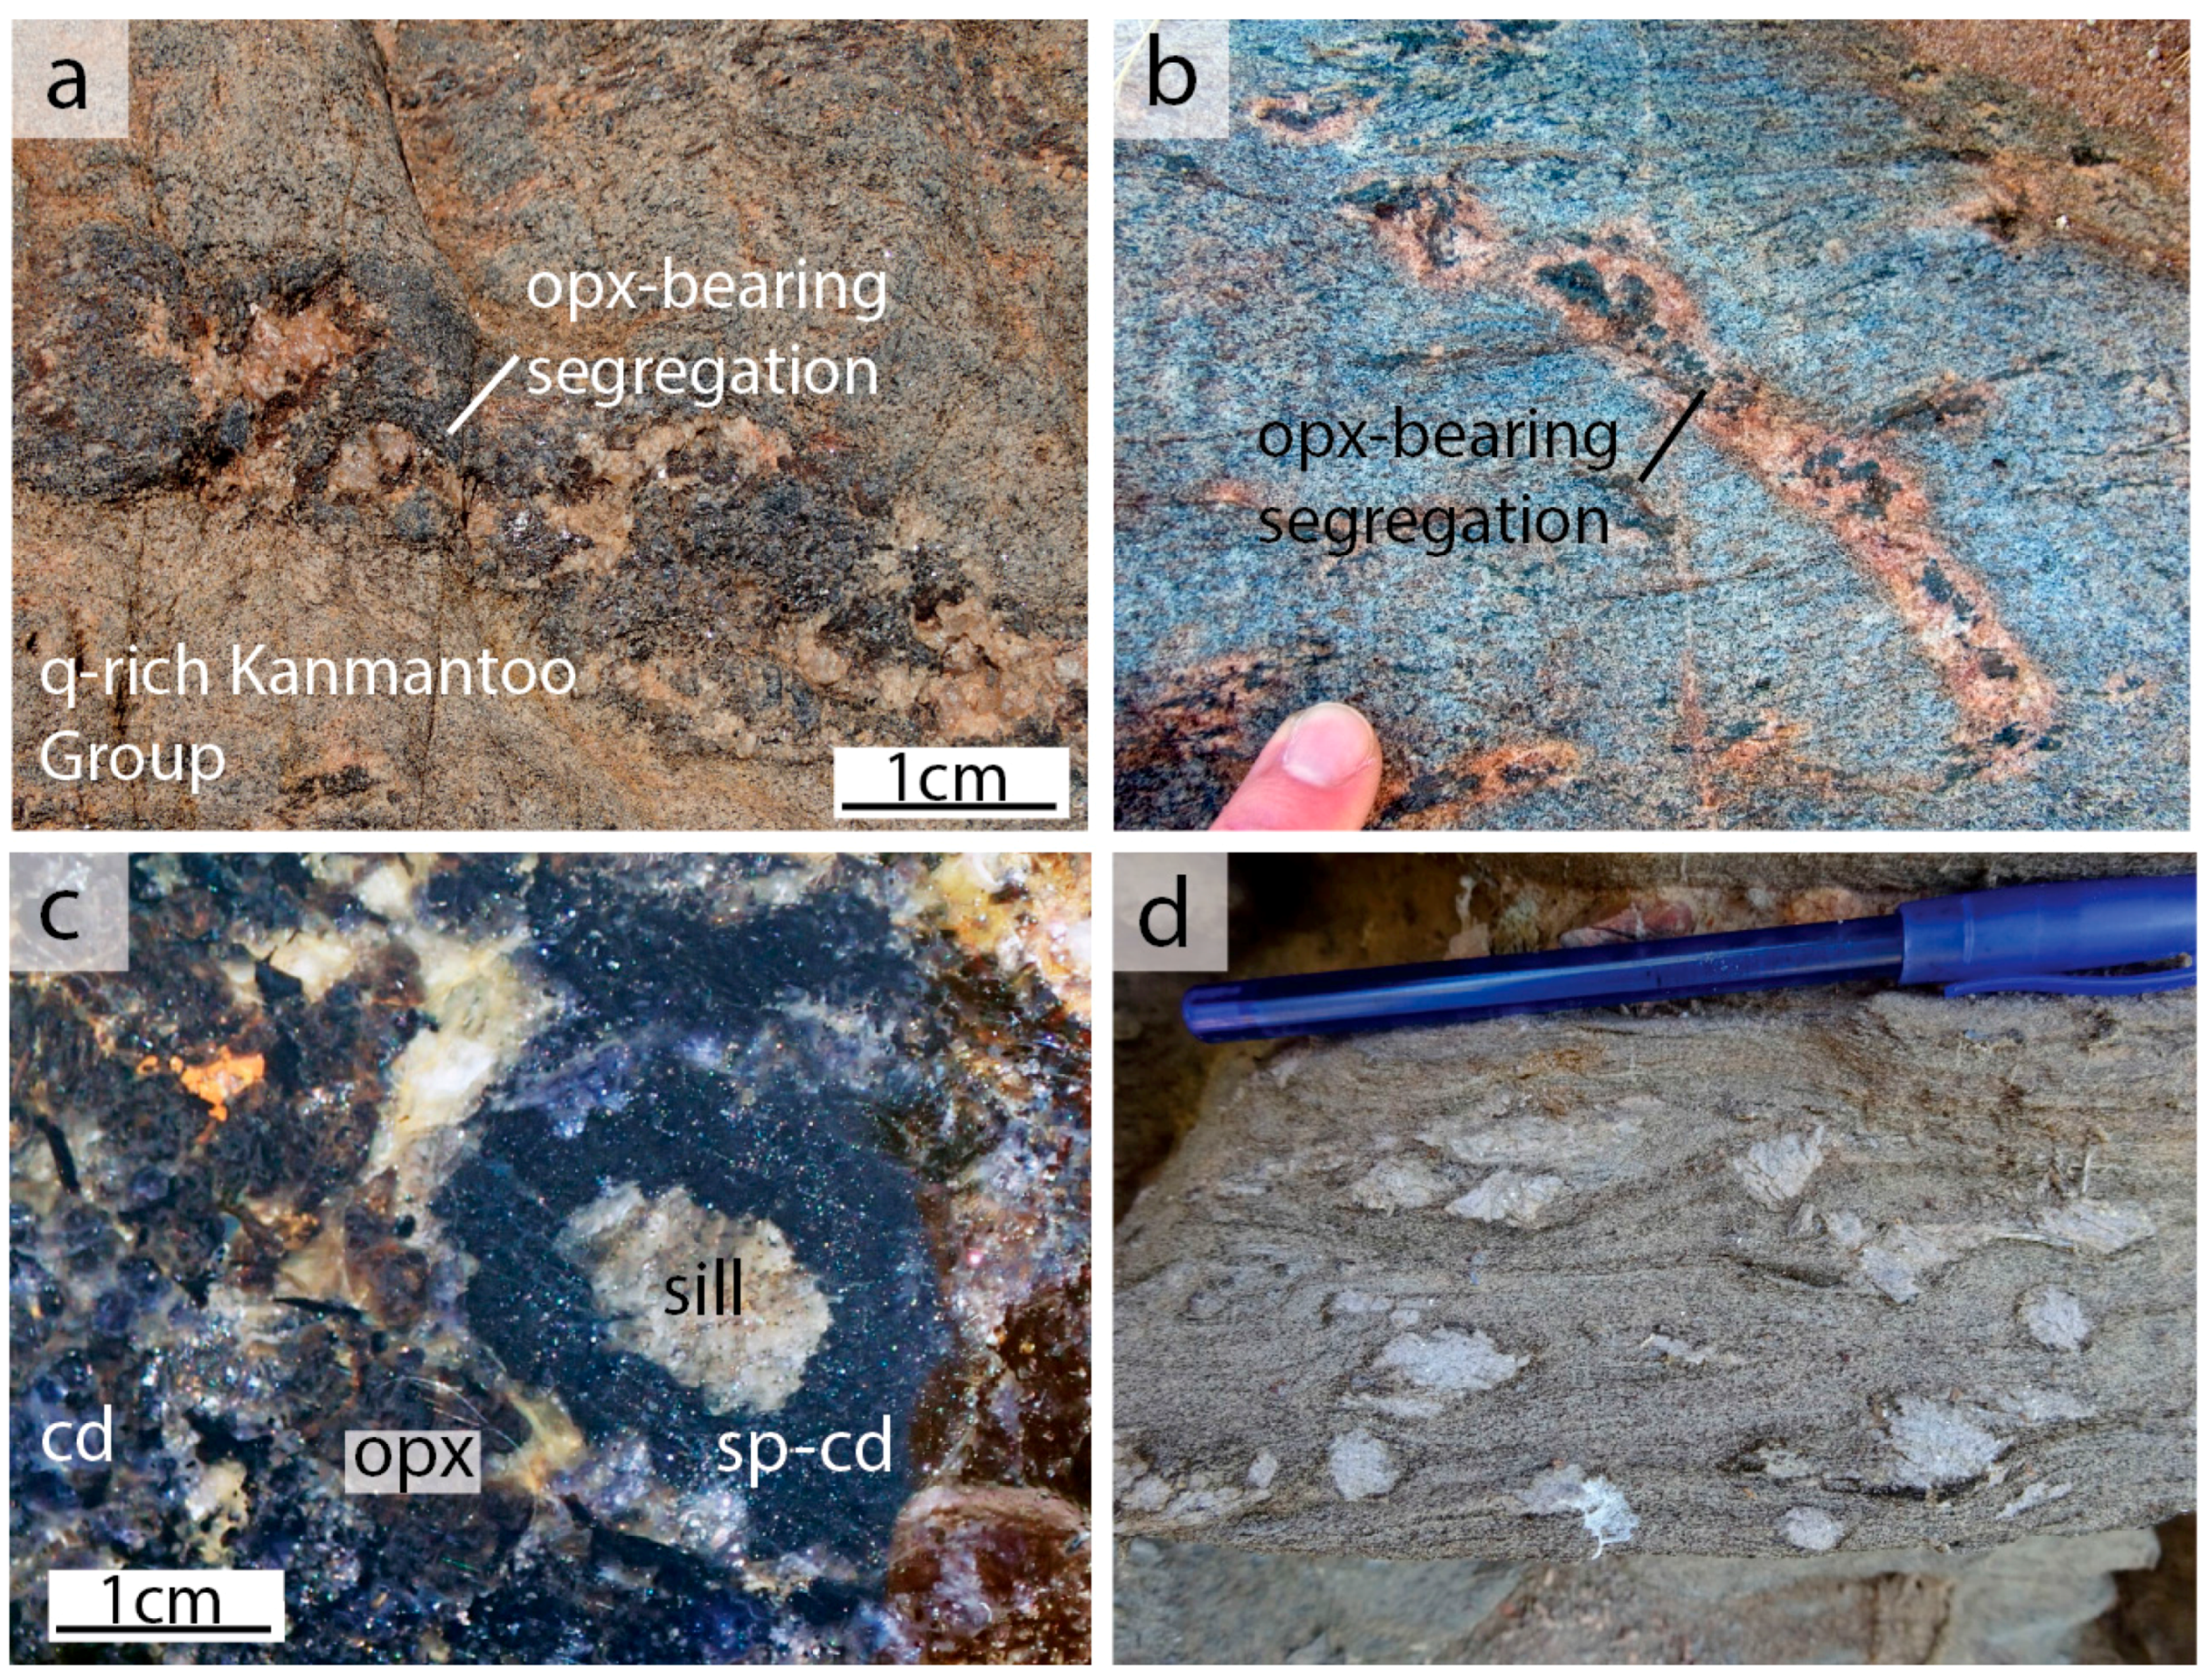
Although the bulk of the metasedimentary sequence consists of metapsammitic lithologies with thermodynamically insensitive bulk compositions, thin discontinuous layers of cordierite-dominated Mg-rich (MgO/(MgO+FeO) = 0.66) metapelite—that were likely to have been mud layers in the original sequence—form sensitive mineral assemblages that can be used to investigate the P–T evolution of the sequence. The discontinuous metapelite layers contain domains that are dominantly composed of orthopyroxene–biotite–cordierite–plagioclase (Figure 2a,b). Locally, these domains contain cordierite–spinel symplectites that rarely surround coarse/blocky aggregates of sillimanite (Figure 2c). In adjacent psammitic layers, cordierite occurs as porphyroblasts within felsic segregations and veins. We interpret the orthopyroxene and cordierite-bearing metapelitic layers to represent residual domains that have lost melt. These layers do not contain assemblages or chemistry typical of granitic compositions that would form leucosomes, due to their high Mg content and abundant orthopyroxene and cordierite. The peritectic mineral assemblages preserved in these layers are very fresh and relatively unretrogressed, indicating that melt has been drained from these layers [38]. Blocky, porphyroblastic aggregates of sillimanite surrounded by cordierite–spinel symplectites (up to 3 cm by 1 cm) (Figure 2c) in the pelite layers are interpreted to reflect the former presence of andalusite, based on the extensive presence of andalusite in lower grade areas of the Kanmantoo Group (Figure 2d) [29,30,39]. Therefore, we infer the prograde sequence to have contained andalusite. Despite the intensity of the deformation, there is no evidence for distributed sillimanite within the foliation, suggesting that the proportion of blocky sillimanite aggregates represents the approximate proportion of andalusite in the protolith. Layers containing these sillimanite aggregates are relatively rare in the Kanmantoo Group sequence, but in the cordierite-dominated Mg-rich layers they comprise around 5% of the current rock volume.
Samples and Petrography
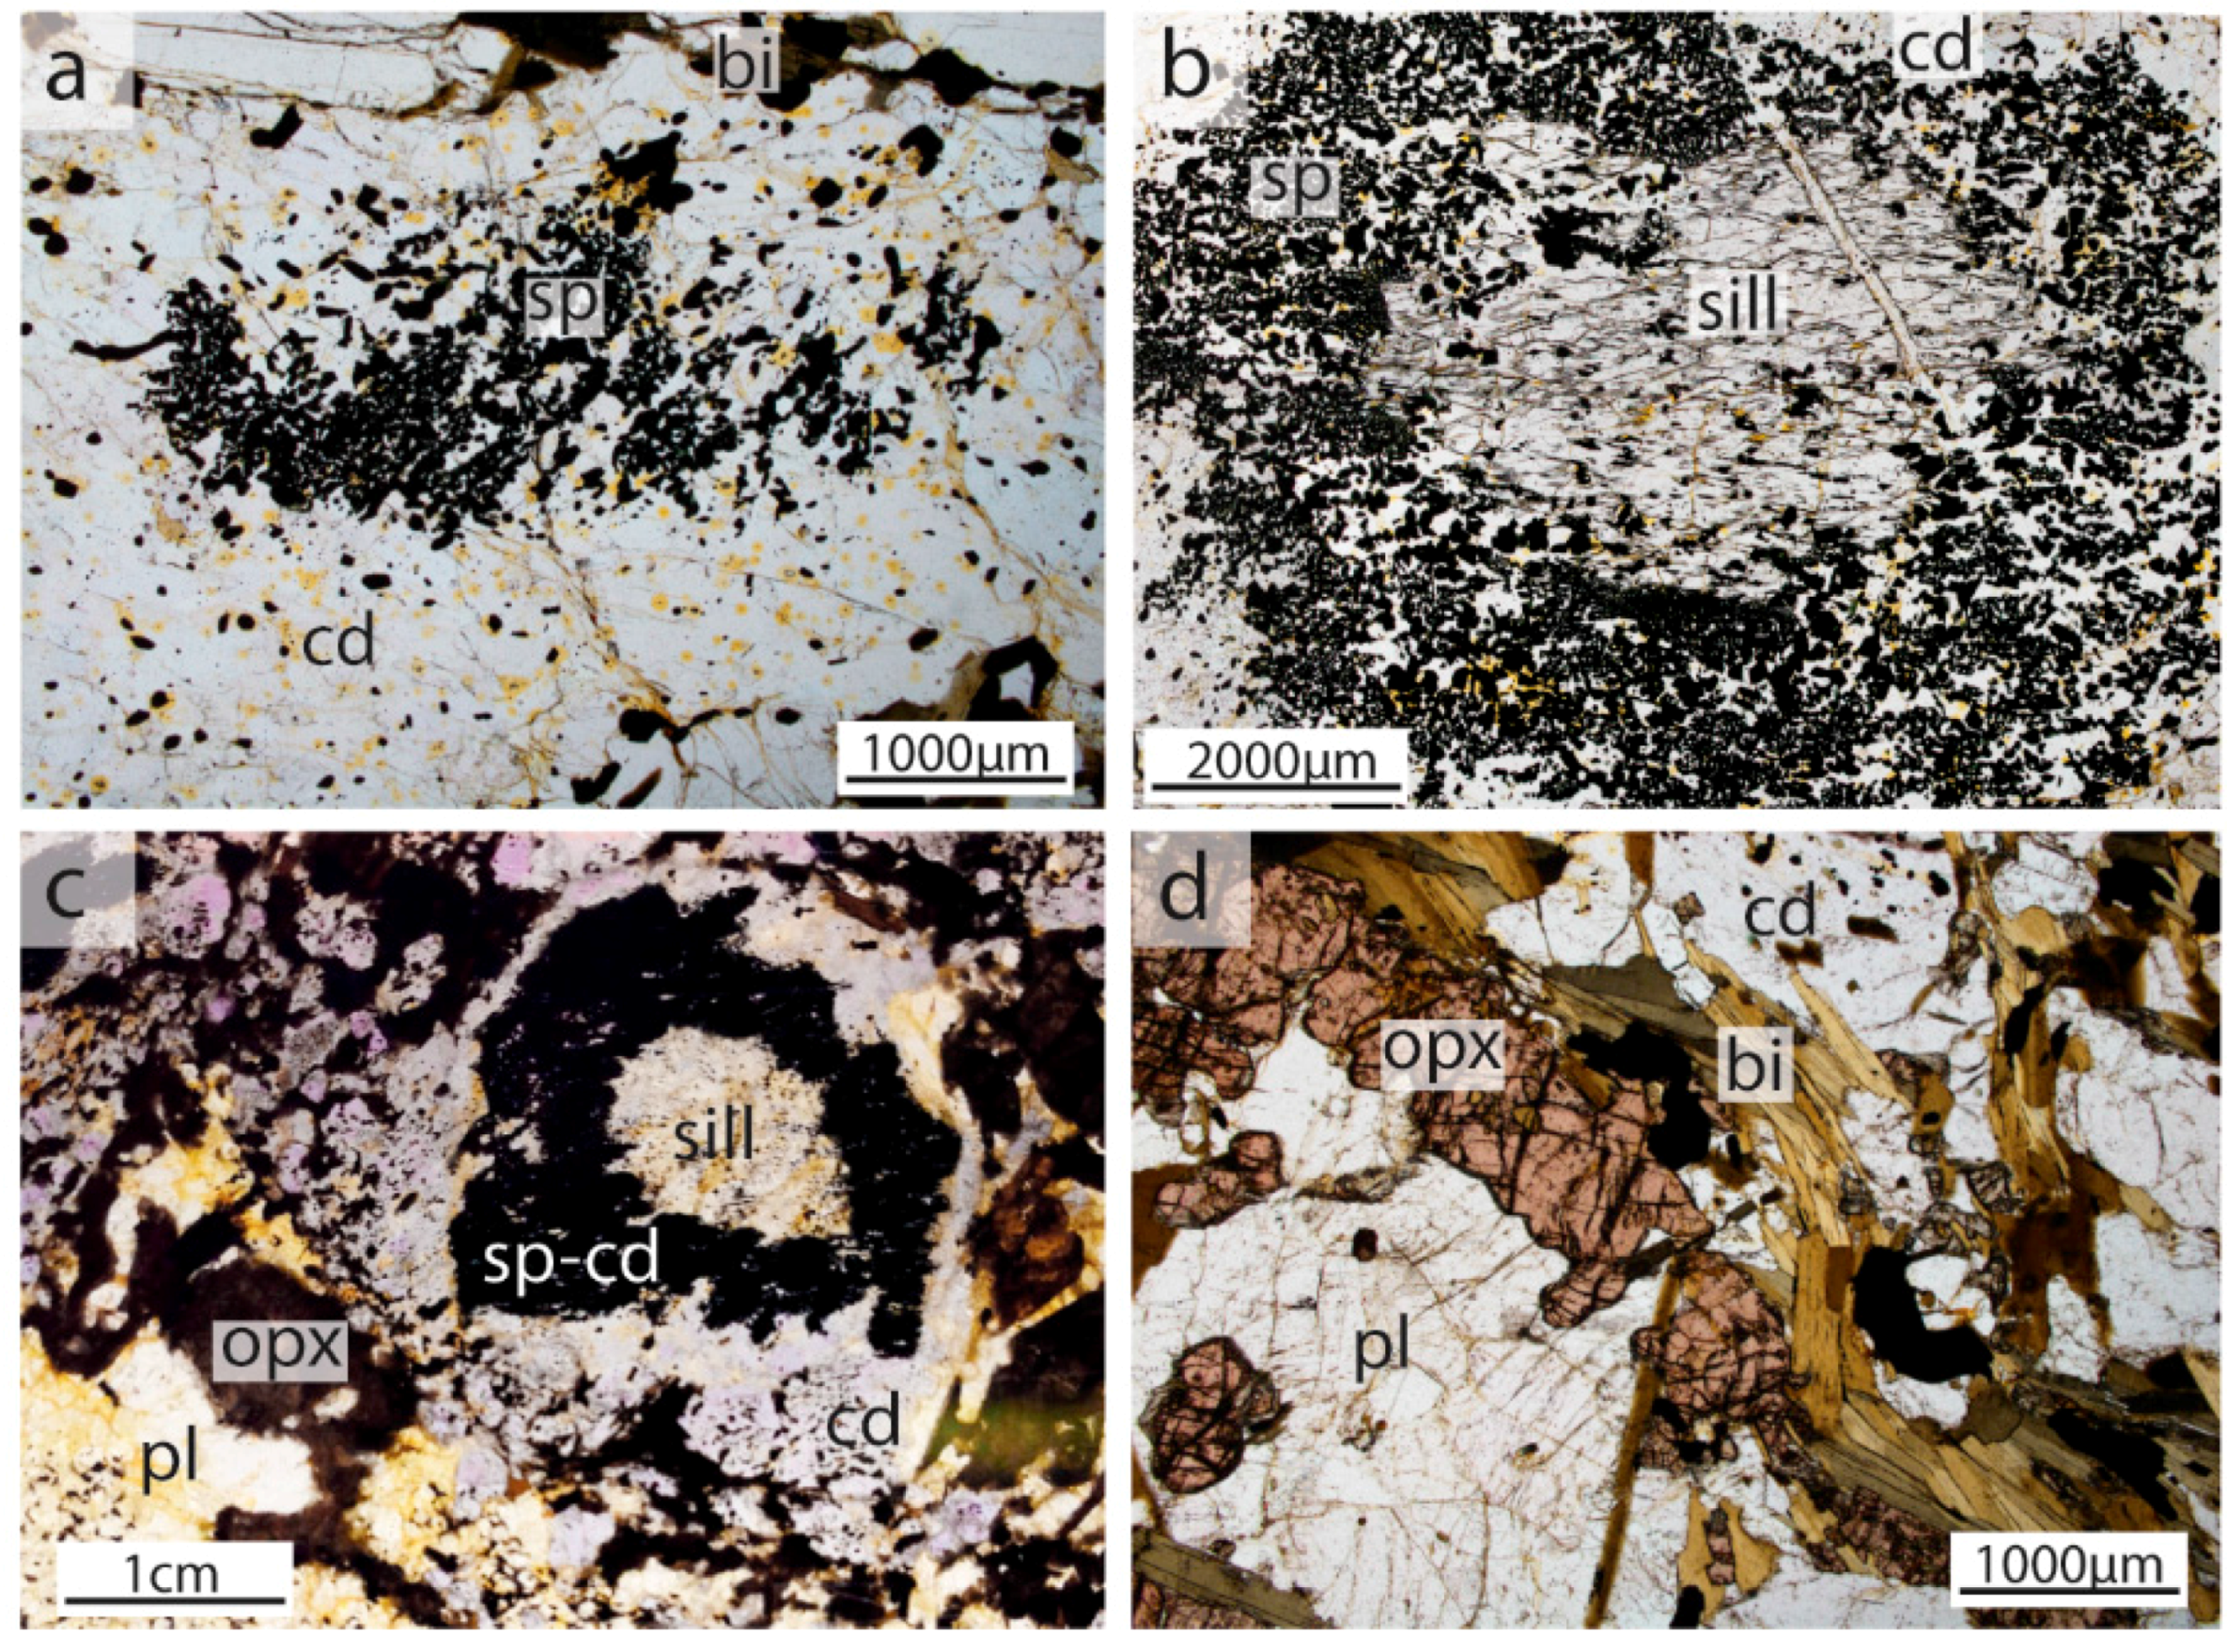
The sample used in this study (sample 14-RDC-04) was taken from a thin metapelitic layer (>10 cm in width), within thick metapsammitic layers in Reedy Creek (Figure 1 and Figure 2a,b). Sample 14-RDC-04 contains orthopyroxene, biotite, cordierite, spinel, plagioclase, magnetite, ilmenite and minor sillimanite. Coarse-grained (1–6 mm) euhedral grains of orthopyroxene are common throughout the leucosomes and contain inclusions of biotite, ilmenite and magnetite. Coarse-grained, poikiloblastic cordierite (1–6 mm) contains inclusions of biotite, plagioclase, magnetite and ilmenite. Symplectites of spinel and cordierite (in patches 4–10 mm in diameter) are common (Figure 3a). In rare instances, these cordierite–spinel symplectites surround aggregates of sillimanite grains (3–6 mm; Figure 3b,c). Orthopyroxene grains occur in direct contact with biotite and are surrounded by cordierite and plagioclase (Figure 3d). There are two morphologies of biotite. Some biotite grains are aligned and define a weak foliation, whereas other biotite is randomly oriented. Biotite adjacent to cordierite occurs as ragged anhedral grains. No biotite is present in the areas immediately adjacent to the cordierite–spinel symplectites (Figure 3a,c). Cordierite–spinel symplectites and sillimanite grains do not show any orientation and no foliation is observed in the biotite-absent regions. We interpret the peak assemblage present in this sample to be plagioclase + biotite + orthopyroxene + cordierite + spinel + magnetite + ilmenite. The rare, coarse-grained domains of sillimanite enclosed within spinel–cordierite symplectites are interpreted to be textural relics from replacement of prograde andalusite. Although sillimanite and orthopyroxene are in close proximity (Figure 3d), we do not interpret them to represent former stable coexistence.
3. Materials and Methods
The pelitic orthopyroxene-bearing domains that make up sample 14-RDC-04 are thin and irregularly shaped, meaning that rock slabs cut for whole rock geochemistry contain a mixture of residual pelite and the surrounding wall rock, and thus may not provide a valid composition for the purposes of phase equilibria modelling. Instead, a chemical composition of the orthopyroxene-bearing domains was determined by combining average measured mineral chemistry and density with estimates of mineral proportions in these domains. In the domain used for the determination of mineral modal abundances, sillimanite is almost completely replaced by blocky aggregates of cordierite–spinel, so was not considered as part of the composition. Estimations of the proportions of minerals present in the sample were determined by pixel counting minerals in thin section images using Adobe Photoshop. The area of thin section used for pixel counting was quite large, at approximately 7.5 × 3.5 cm (26.25 cm2). As the domains that were sampled were quite thin, we believe that this 2D area is representative of the equilibrium volume. The use of individual mineral chemistry to determine a bulk composition is a relatively common practice e.g., [40,41]; however, it should be noted that this method may produce different results than compositions acquired using XRF (X-ray Fluorescence), see [42]. Mineral chemical analyses were obtained using a Cameca SXFive electron microprobe at Adelaide Microscopy, with standard operating procedures. The mineral modes and average mineral chemical analyses and densities used for the determination of the residual pelite composition are provided in Table 1.
One of the uncertainties of pseudosection modelling is determining the bulk composition that relates to the formation of the peak metamorphic mineral assemblage, particularly the amount of H2O and Fe2O3. P–MO, P–MH2O and T–MH2O sections (where the oxidation state (MO) or amount of water (MH2O) is varied as a function of pressure (P) or temperature (T); Appendix A were calculated to assess the sensitivity of the compositions of the sample to changing H2O content and oxidation state (O), and determine appropriate values for the domain composition. The P–MO and P–MH2O sections were drawn at a constant temperature of 750 °C, which was chosen based on a first pass estimate of the likely metamorphic conditions of the suprasolidus assemblage and the assumed sensitivity of the assemblage to pressure. A T–MH2O section was modelled after the P–MH2O to better assess the H2O content of the sample due to the greater sensitivity of H2O-dependent equilibria to temperature. The T–MH2O section was calculated at a fixed pressure of 4.2 kbar, which was chosen based on the pressure of the peak field on the P–MO and P–MH2O sections. Maximum H2O values used on the x-axis of P–MH2O and T–MH2O sections were chosen to be 1.5 wt %. Compositions chosen along the x-axis from the peak fields of P–X and T–X diagrams for P–T modelling were selected based on modal proportions of minerals that best suited the estimated modes. Further information on the methods for the selection of compositions from these diagrams can be found in Appendix B.
Phase equilibria models were calculated for sample 14-RDC-04 using THERMOCALC 3.40 [43,44] in the chemical system MnO–Na2O–CaO–K2O–FeO–MgO–Al2O3–SiO2–H2O–TiO2–O (MnNCKFMASHTO), where ”O” is a proxy for Fe2O3, using the internally-consistent thermodynamic dataset ds62’ [43] and activity–composition models reparametrised for Mn [8,9,10]. Completed pseudosections were contoured for the modal proportions of minerals using TCInvestigator [45]. The chemical composition of the discontinuous orthopyroxene-bearing pelitic layers (sample 14-RDC-04, see Figure 4) was used to constrain the peak metamorphic conditions at Reedy Creek.
Melt reintegration was undertaken after calculation of the P–T pseudosection using the original residual composition (Figure 4a) as a starting point, following the method of Korhonen, Brown, Clark and Bhattacharya [18]. This stepwise melt reintegration method is now well-established and has been used to remove melt or to rebuild protolith compositions in numerous studies e.g., [11,12,17,18,19]. This method adds 6 mol% melt to the system when the modal proportion of melt in the initial composition reaches 1 mol%, equivalent to the 7% melt connectivity transition (MCT) of [46]. This 7% threshold is interpreted as the point at which there is enough melt present in the rock to create a connected grain boundary network, resulting in the rapid decrease of rock strength and likely melt loss [47]. The composition of the melt that is reintegrated back into the rock corresponds to the composition of the 1% melt contour, which is interpreted to be the amount of melt remaining on grain boundaries after a melt loss event. The resulting composition is then normalised and can be used to calculate further P–T pseudosections until the composition produces a wet solidus. It is assumed that as a rock crosses the solidus any remaining free H2O will be immediately used up during production of the first vestiges of melt. Therefore, melt reintegration modelling aims to reintegrate melt until the solidus is just H2O-saturated, to model the point at which a subsolidus composition would begin to melt. The P–T path during the Delamerian Orogeny is not well constrained. Therefore, for the purpose of simplifying melt reintegration modelling, an isobaric heating path of 3.5 kbar was assumed, based on the peak pressures inferred from the P–T pseudosection, the presence of andalusite pseudomorphs in the Reedy Creek area and the metamorphic pressures that are recorded elsewhere in the Delamerian Orogen e.g., [35,47,48].
4. Results
4.1. Peak P–T Conditions
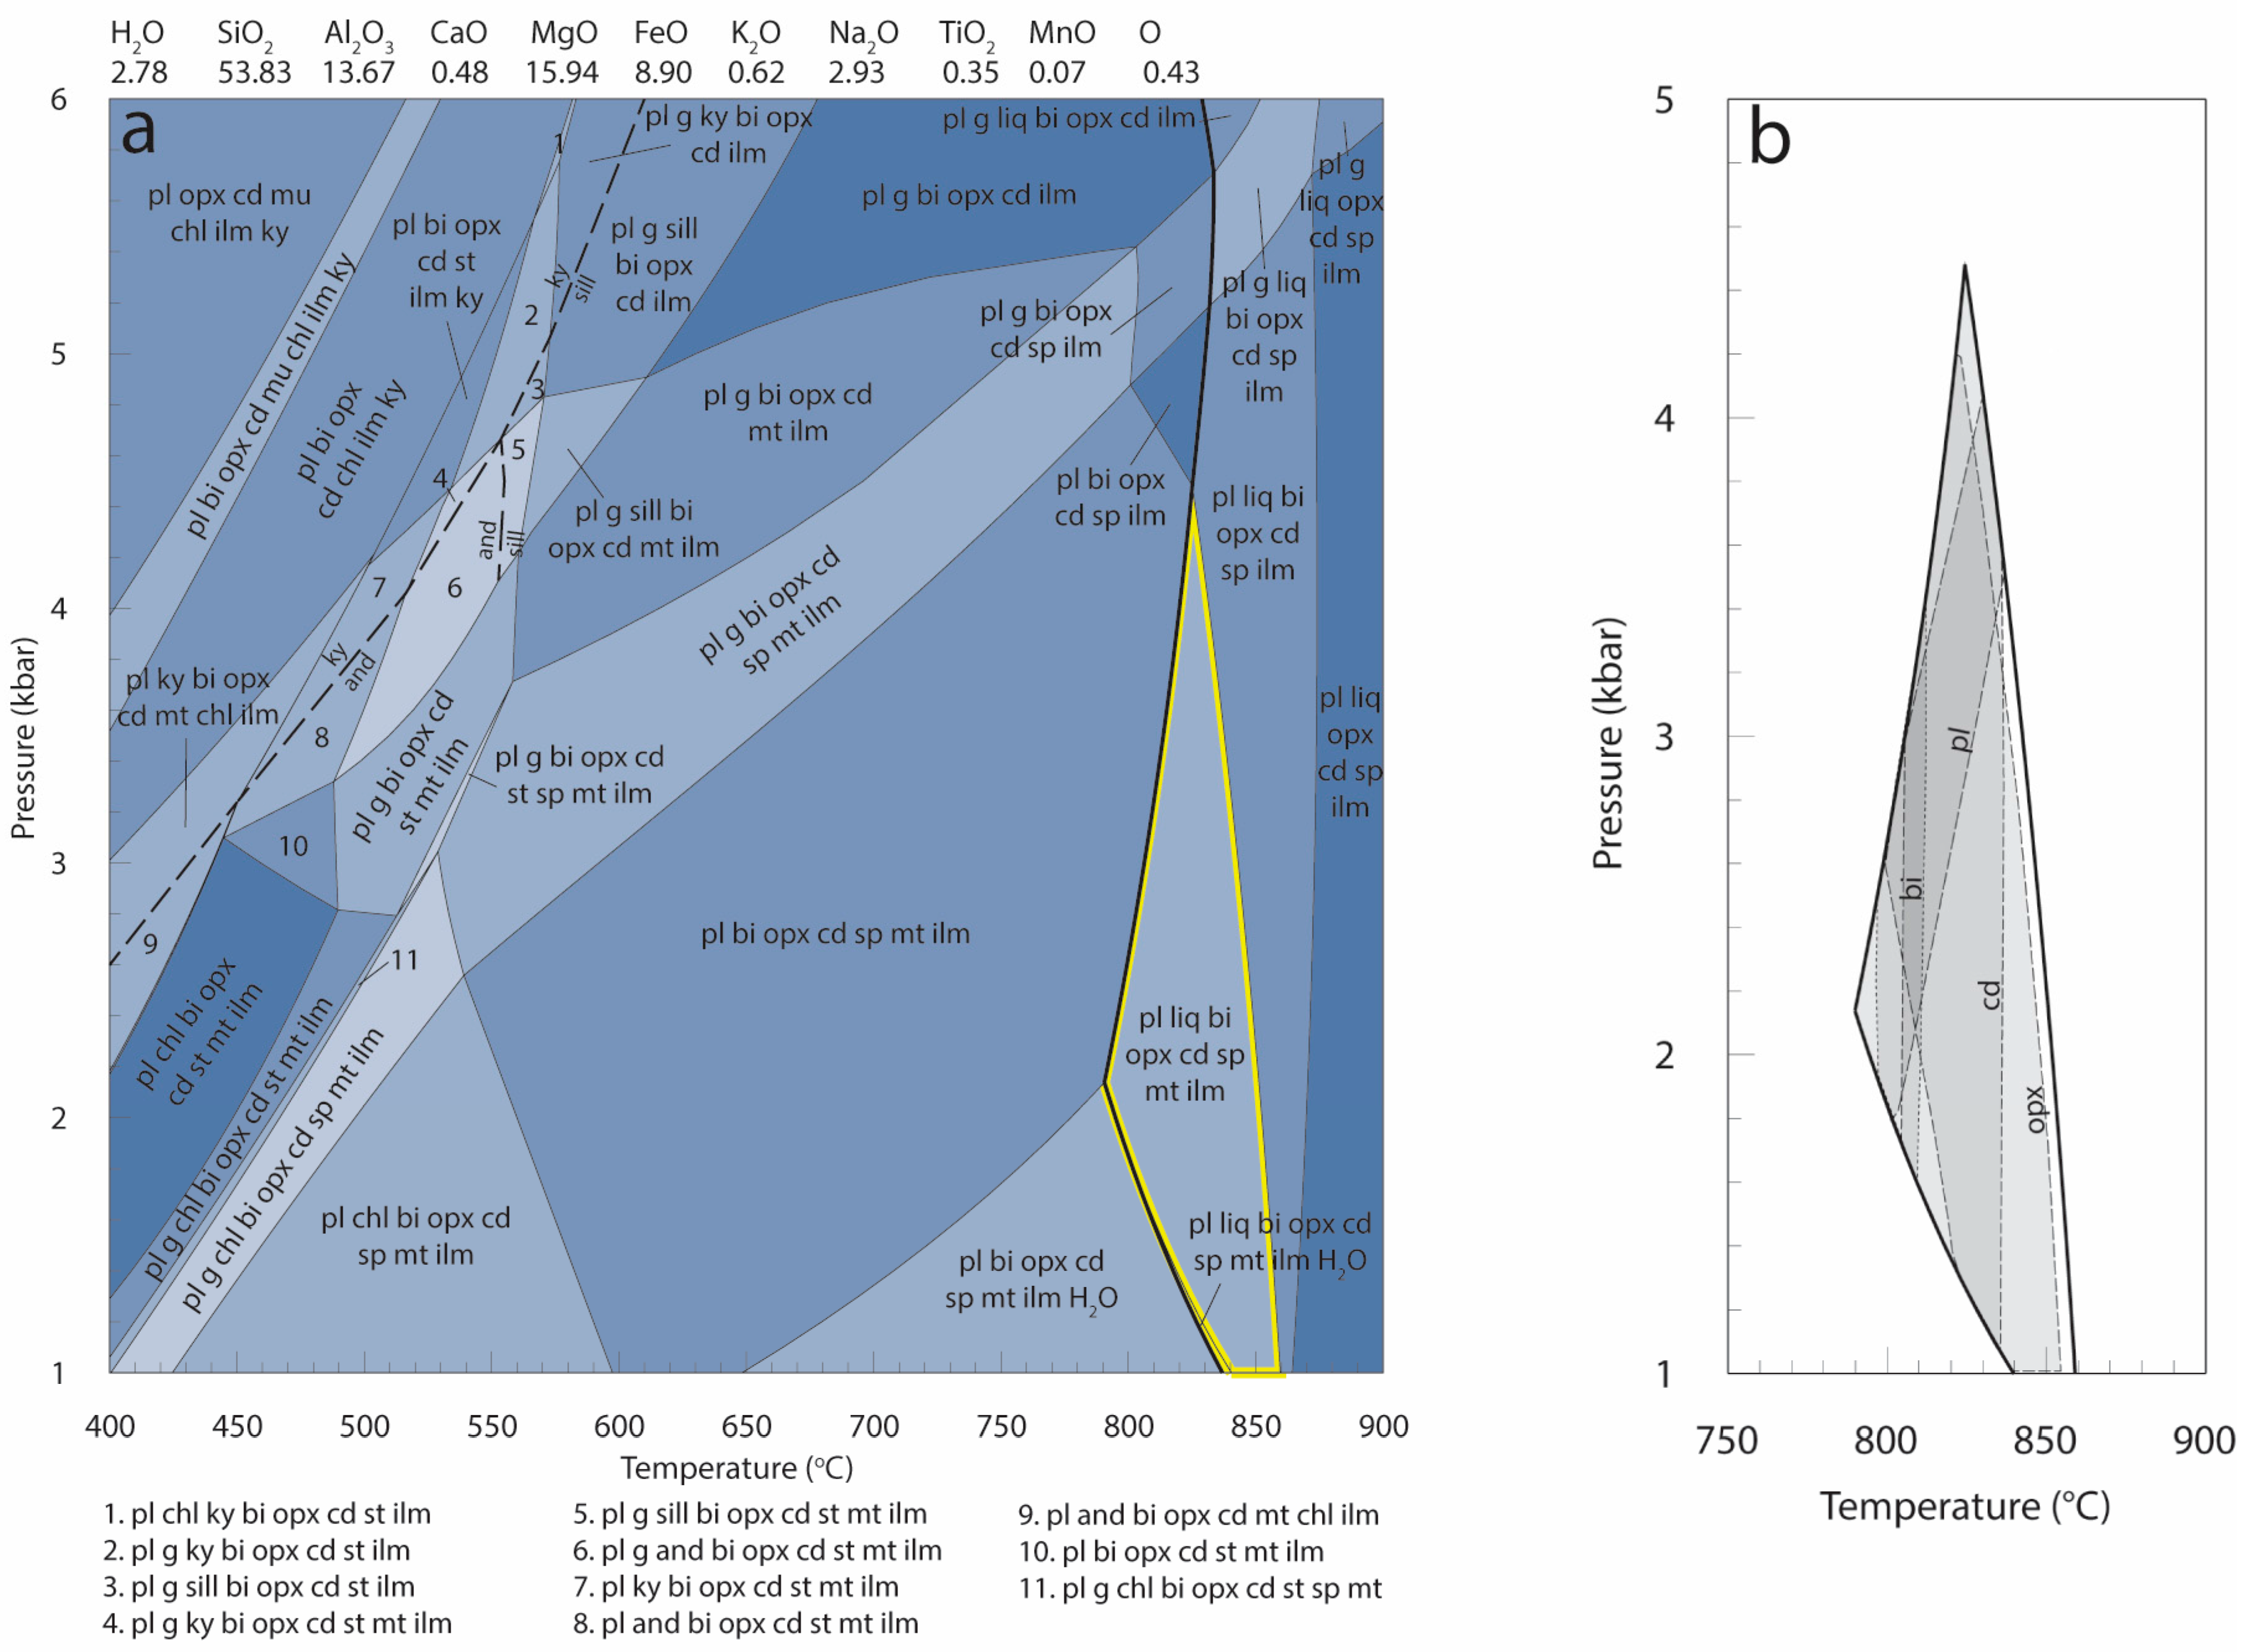
The peak assemblage in sample 14-RDC-04 of plagioclase + biotite + orthopyroxene + cordierite + spinel + magnetite + ilmenite occurs at conditions of 1.0–4.4 kbar and 790–860 °C (Figure 4a). Mineral abundance contouring of this pseudosection indicates that peak P–T conditions would have likely occurred between 2–4 kbar, where the modelled mineral modal abundance contours best correspond to the observed mineral abundances in thin section (Figure 4b). Observed abundances of minerals in thin section (determined through point counting) are provided in Table 1.
4.2. Melt Reintegration
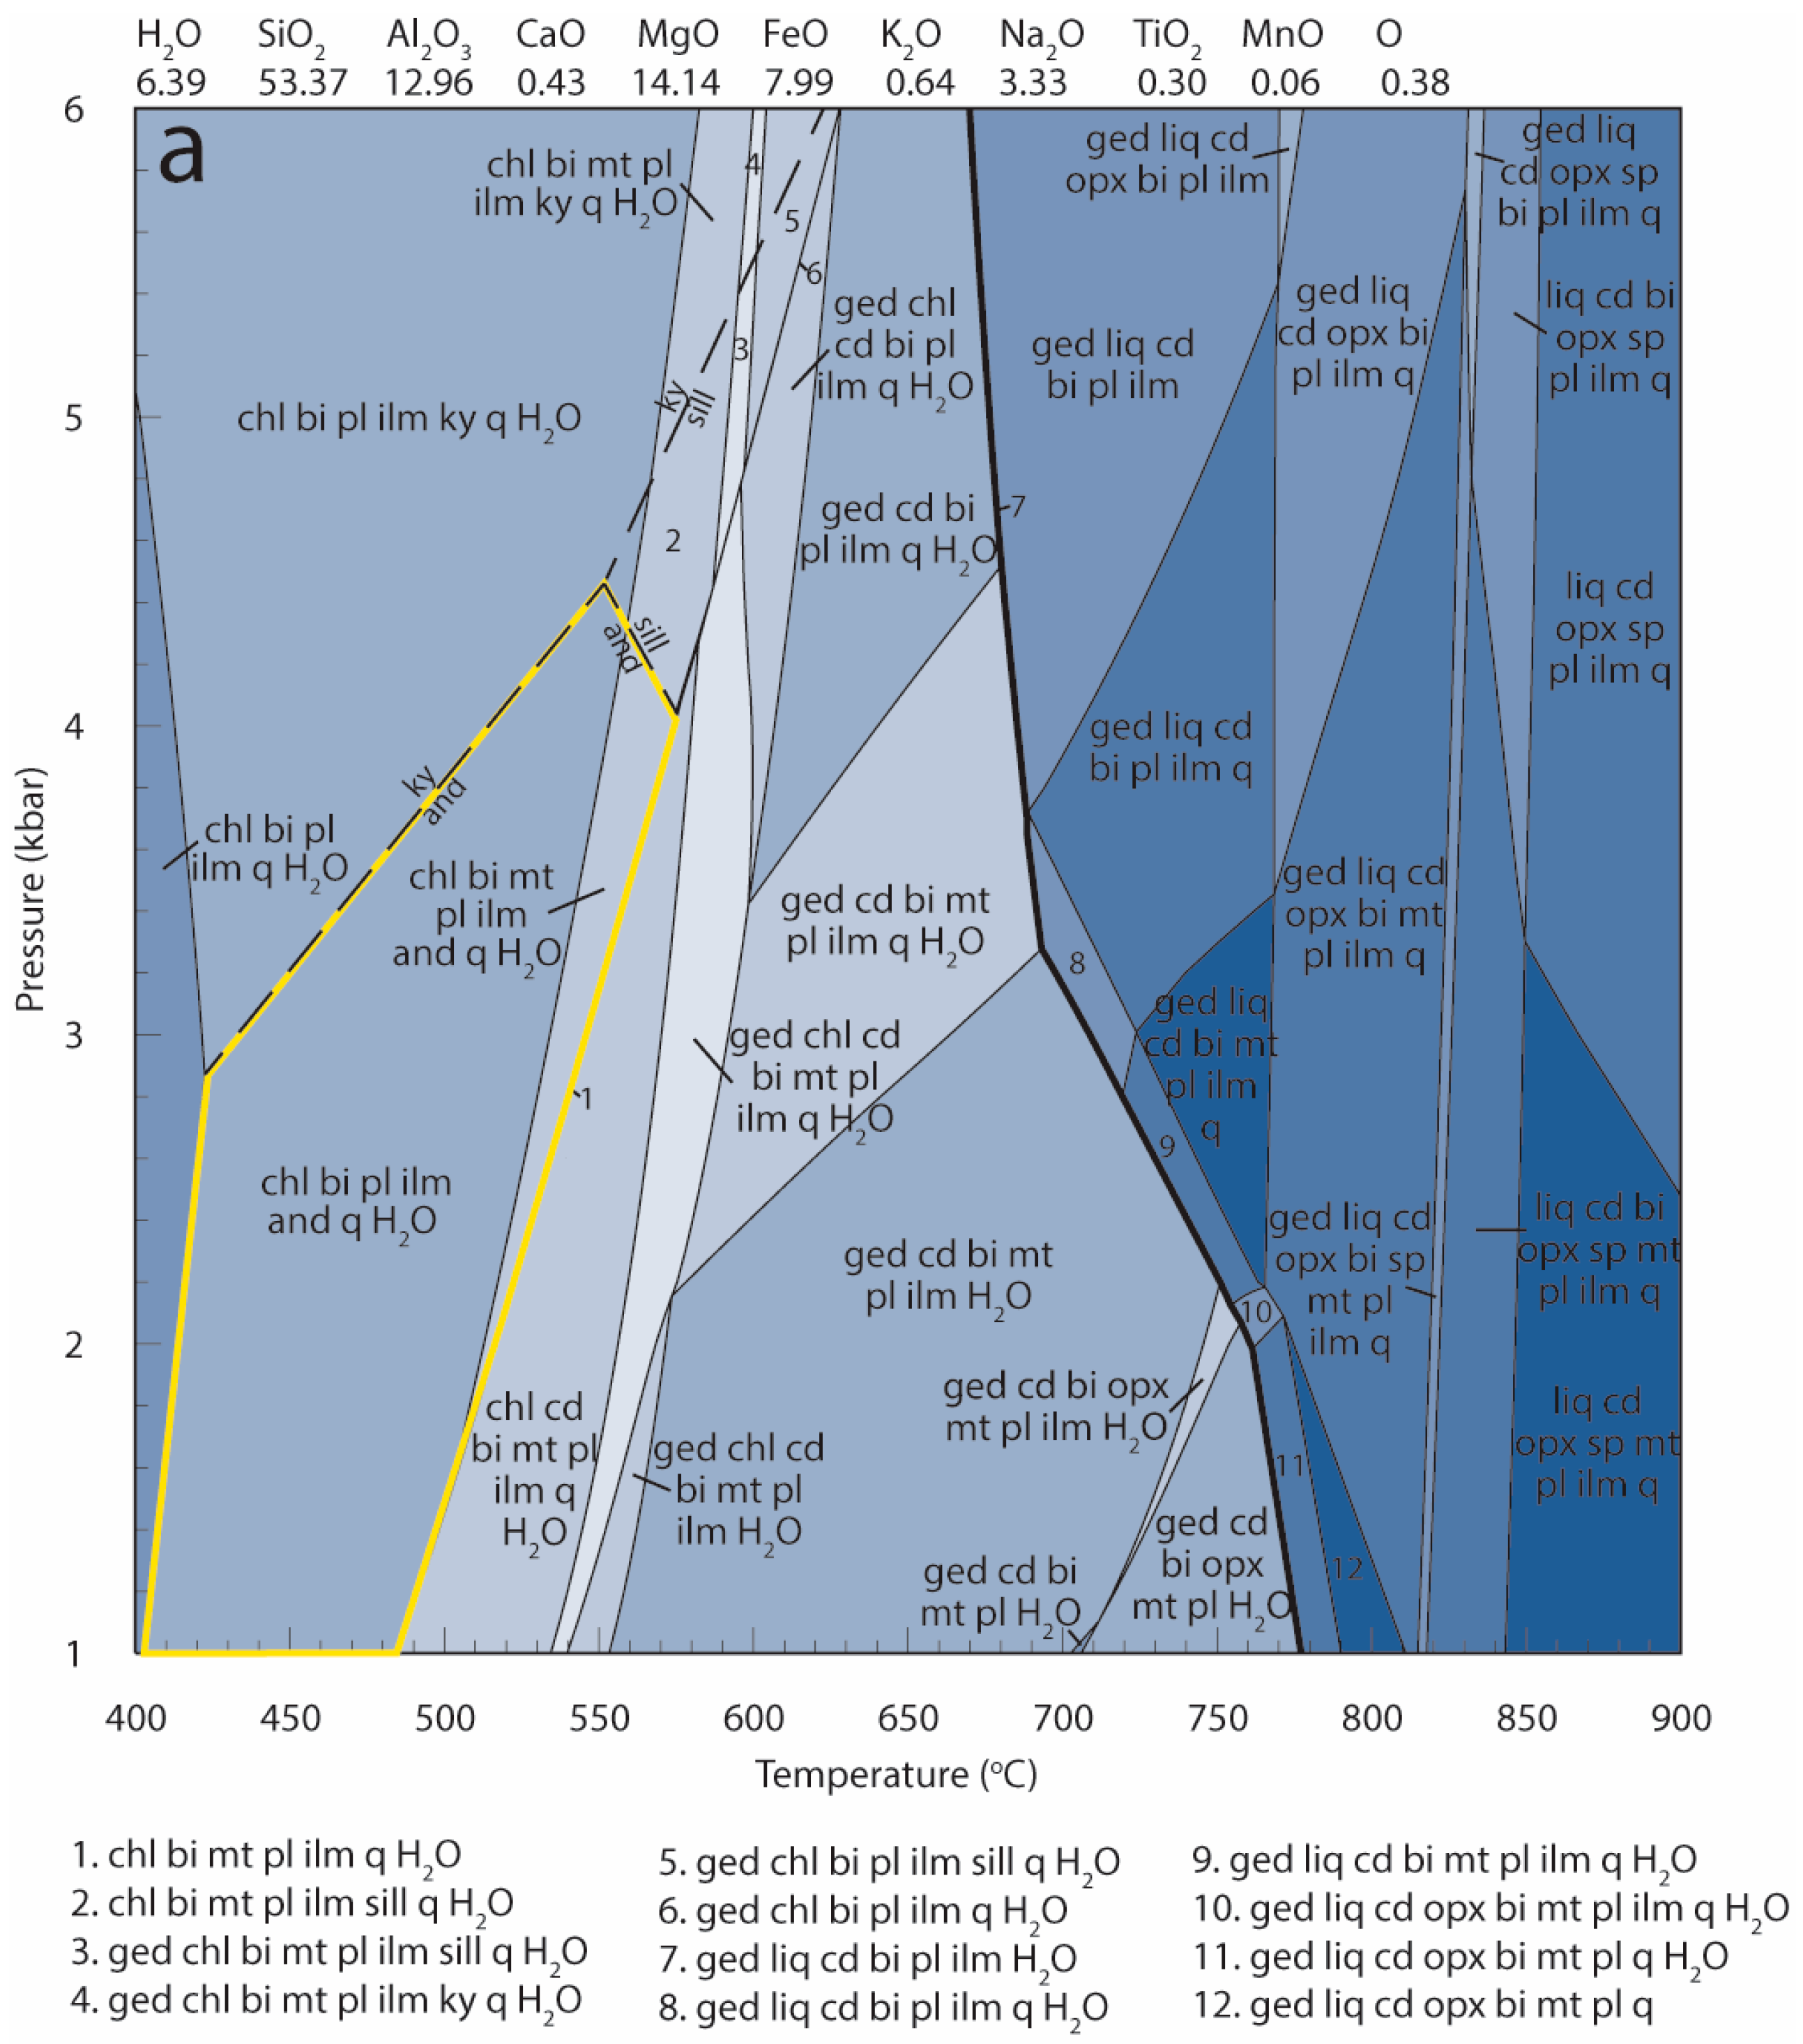
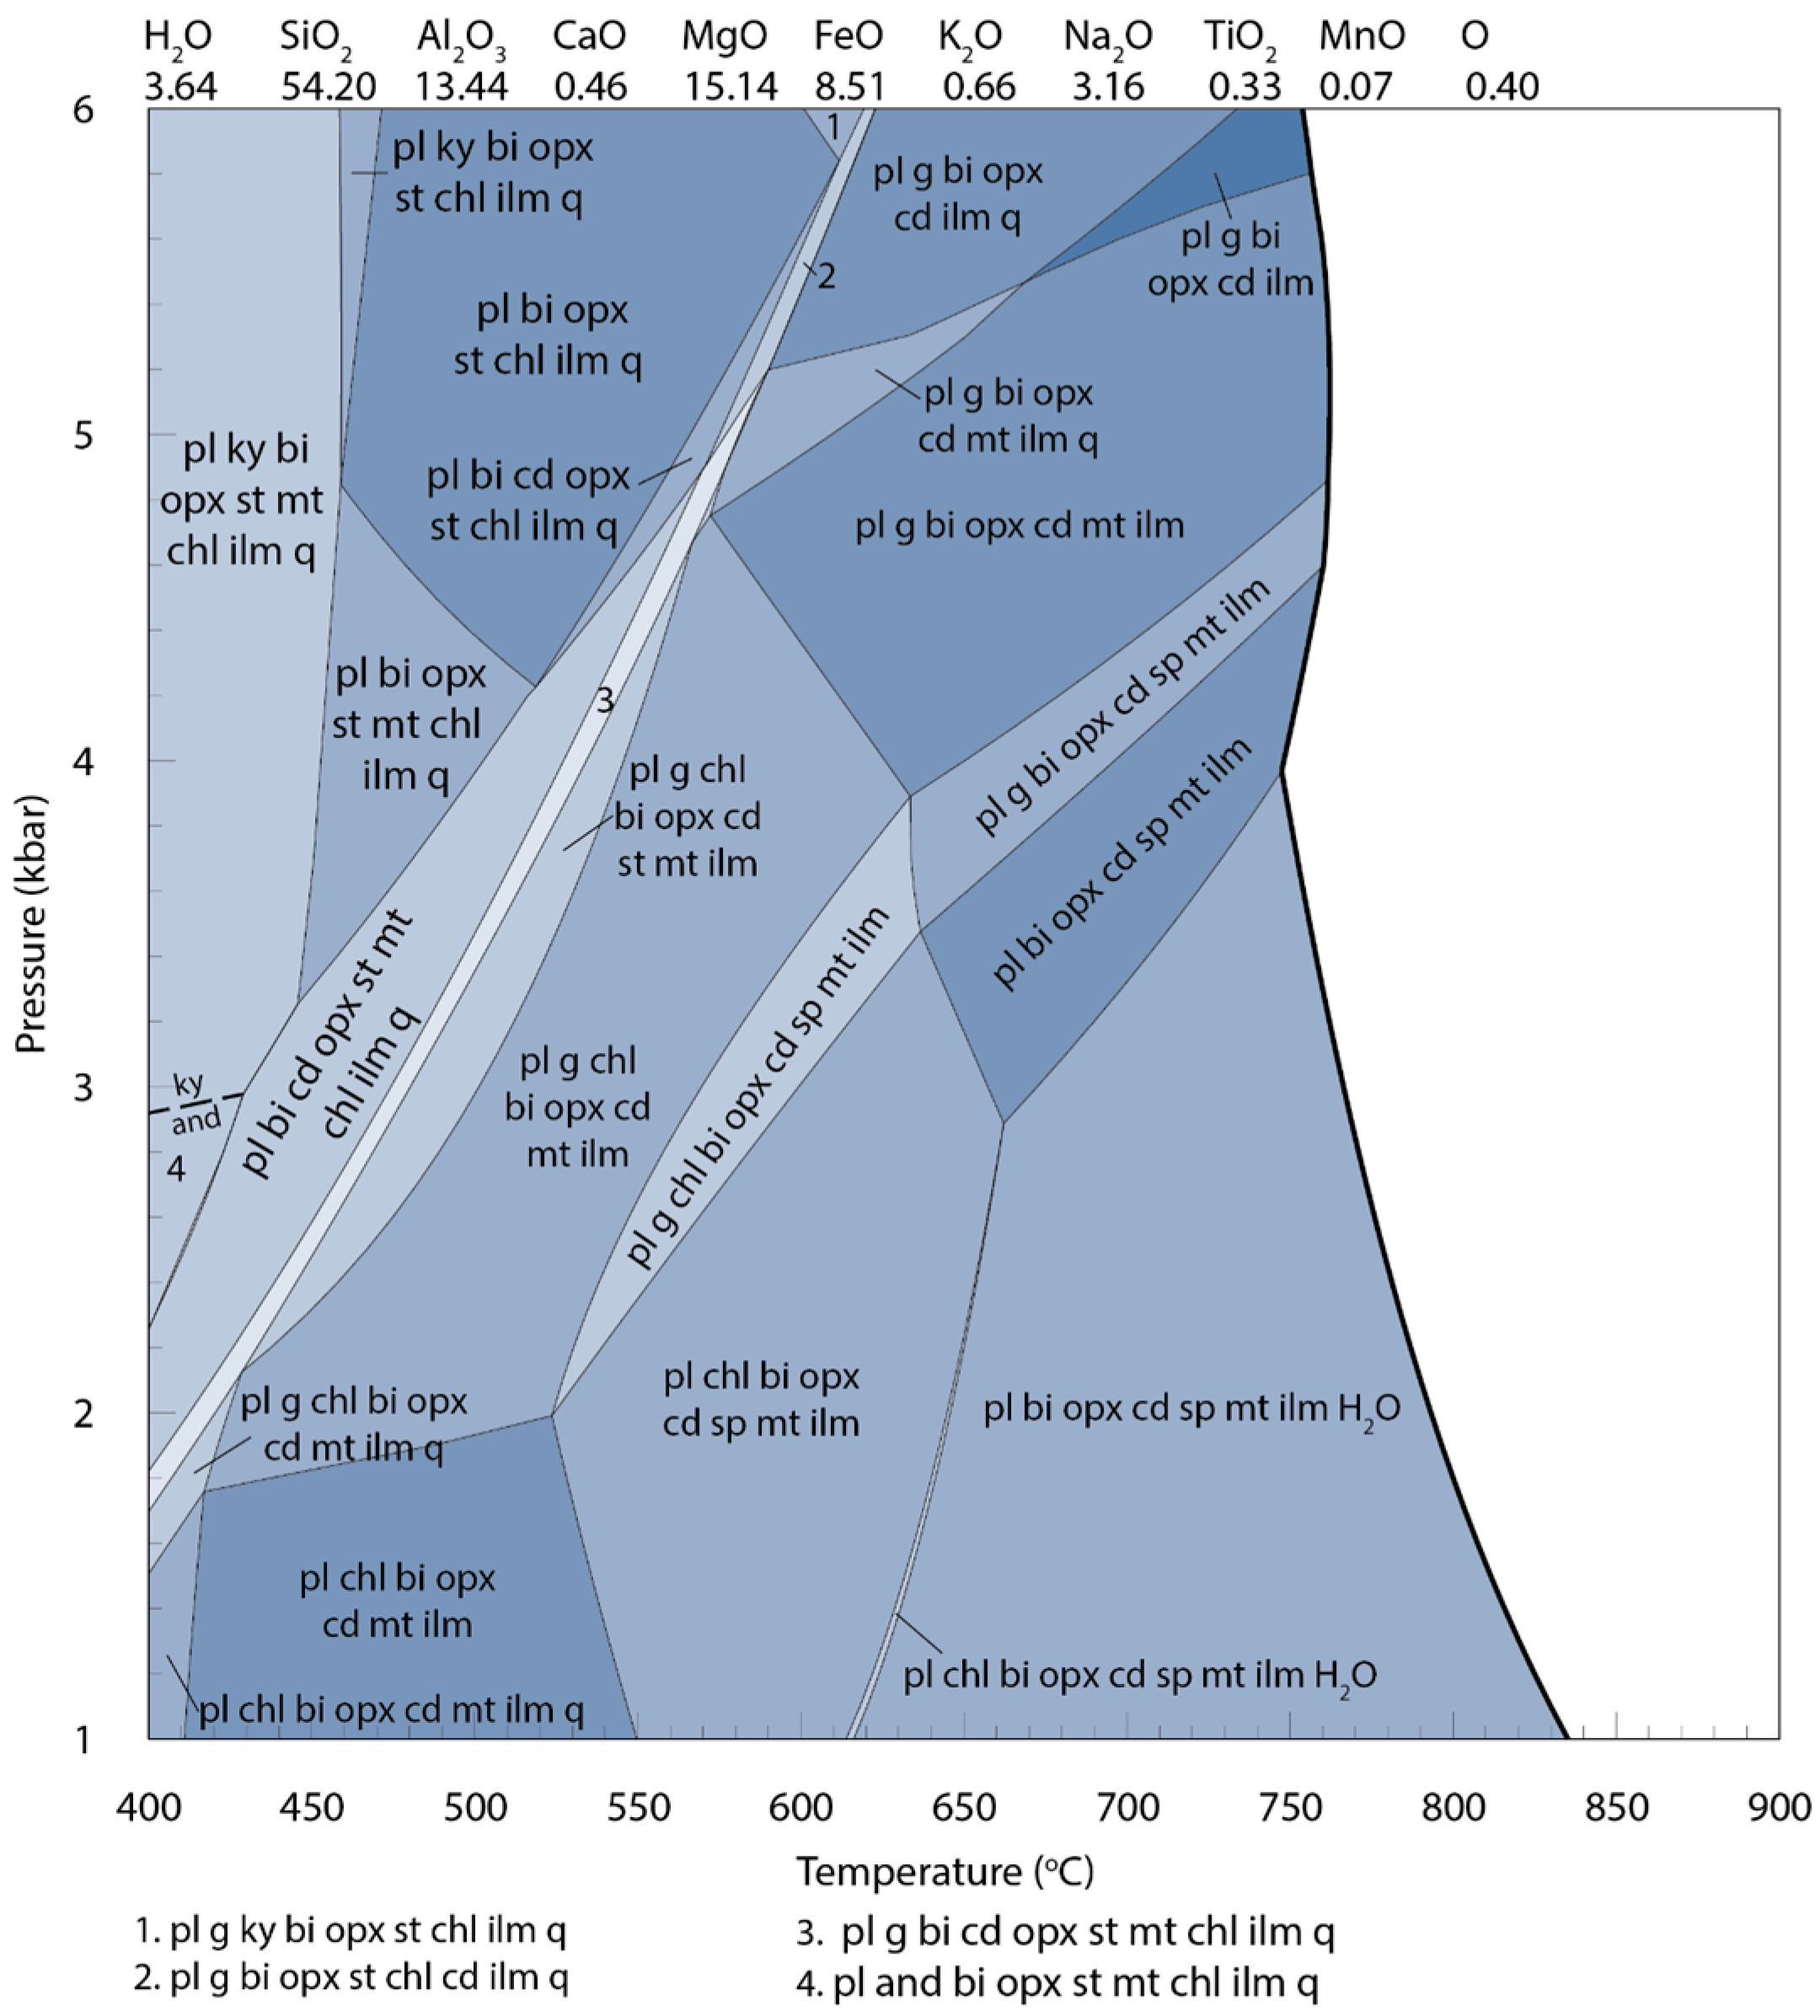
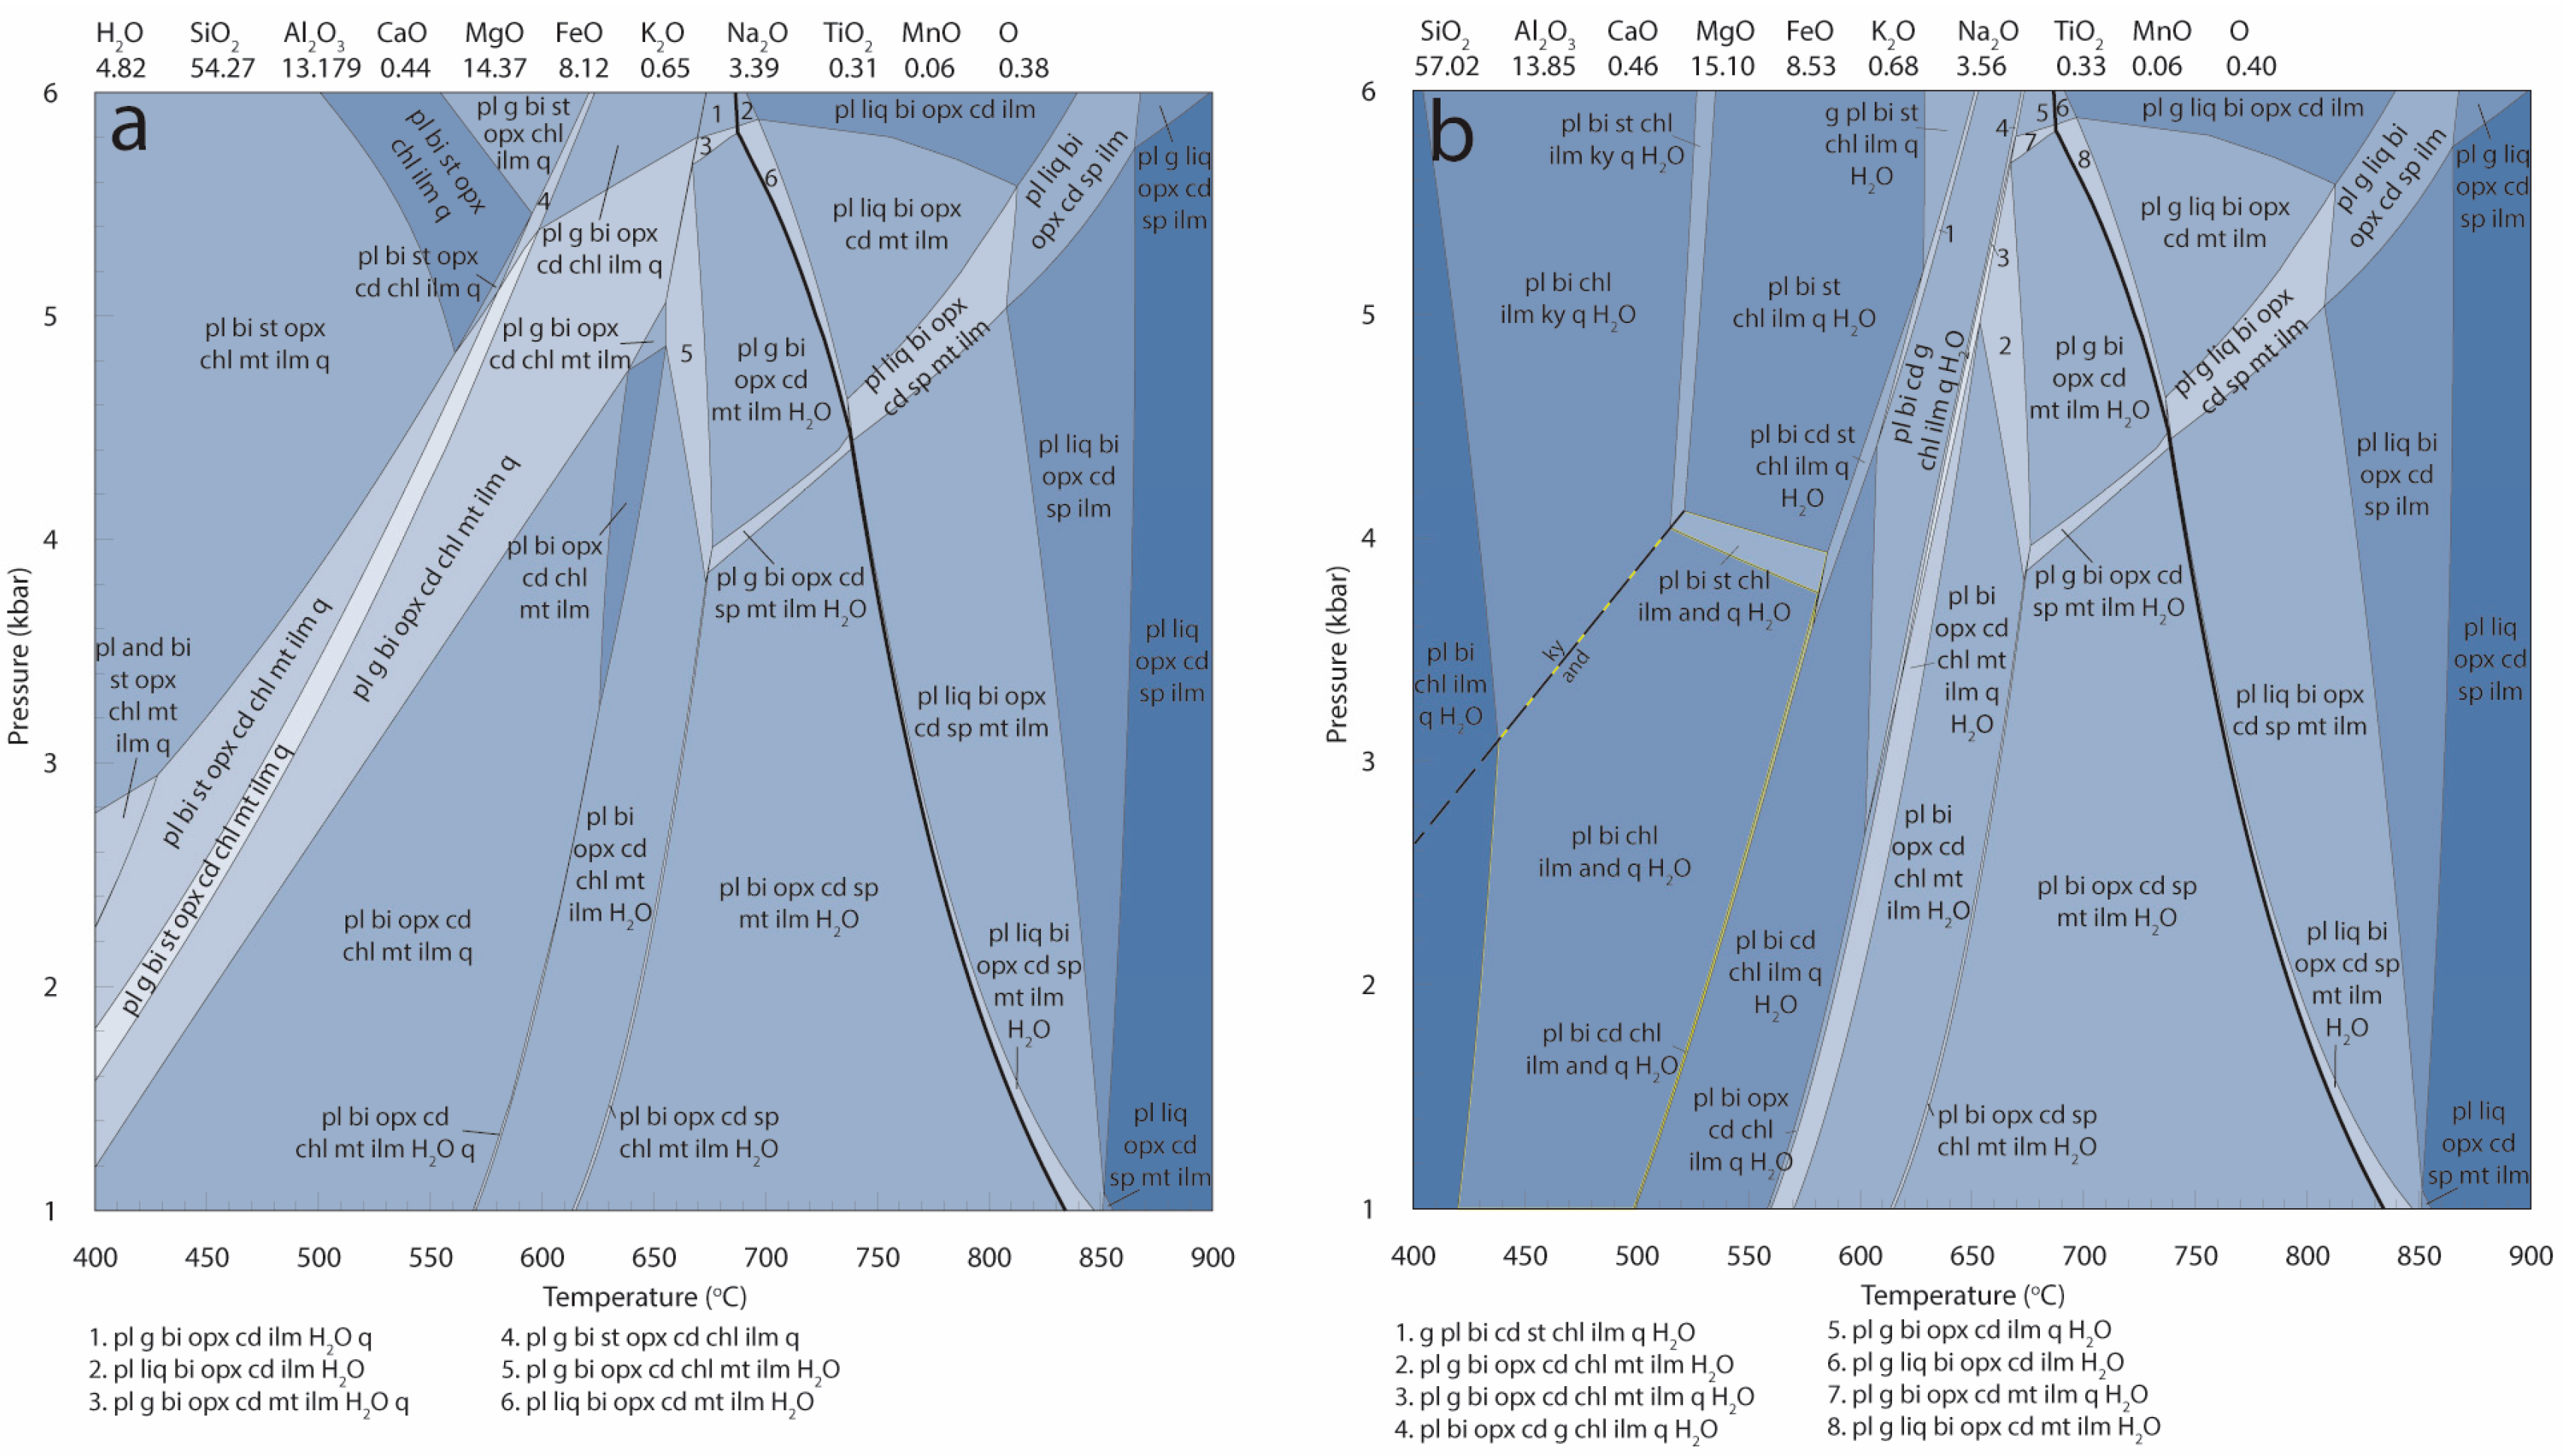
Melt was reintegrated into the residual pelite composition in two stages (Figure 5 and Figure 6), for a total of 12%. The addition of 12% melt results in a solidus that is water saturated at peak metamorphic conditions (1.0–4.4 kbar; Figure 6), with ~1.4 mol% H2O present at 3.5 kbar. The addition of 12% melt results in a decrease in the temperature of the solidus at 3.5 kbar from ~810 °C to ~750 °C. After the reintegration of 12% melt, the peak assemblage above the solidus is still present and occurs at similar P–T conditions, but subsolidus assemblages have been significantly changed. However, notably, subsolidus equilibria calculated using the H2O content of the melt reintegrated composition do not contain andalusite (Figure 6a). The H2O content of the melt reintegrated composition also does not allow for a free H2O phase at temperatures below 570–670 °C (with increasing pressure). However, if H2O is set to excess below the solidus, which is an approach commonly used for modelling subsolidus rocks, then mineral assemblages containing andalusite can be produced at temperatures below ~570 °C using the melt reintegrated composition (Figure 6b). Setting H2O to be in excess also supresses the modelled stability of orthopyroxene.
5. Discussion
The aim of this study is to test the veracity of melt reintegration calculations by reintegrating melt into a compositionally residual rock whose precursor mineralogy is partly known. We interpret andalusite to have been present during the subsolidus prograde evolution of the rock, based on blocky mineral aggregates cored by sillimanite that are rimmed by cordierite–spinel intergrowths, as well as the widespread presence of andalusite in lower grade stratigraphic equivalents. Sillimanite cores in the cordierite–spinel coronae are rare throughout the rock and were likely no more than metastable relics of the andalusite porphyroblasts that were unable to be completely replaced during metamorphism to higher temperatures due to sluggish diffusion of Al e.g., [49,50]. However, they do indicate that blocky domains of cordierite–spinel symplectites likely represent the complete replacement of andalusite porphyroblasts along the prograde path. As such, the localised occurrence of spinel–cordierite symplectites in the sample used in this study can be used to estimate the abundance of subsolidus andalusite. On this basis approximately 5% andalusite was present, allowing for volume loss associated with melt loss in the subsolidus protolith.
The P–T pseudosection calculated for the original residual composition already has stable andalusite prior to any melt reintegration (Figure 7a). However, it is well established that residual bulk compositions are not appropriate for modelling the prograde evolution of a rock [12,18,51]. The melting and melt loss that has occurred in the field area would have altered the composition of the rocks so that the subsolidus part of the pseudosection does not represent real prograde assemblages. Therefore, we have used the presence of ~5% subsolidus andalusite as a target to evaluate the viability of the melt reintegration procedure for predicting subsolidus assemblages.
Melt was reintegrated into the original residual composition in two separate batches of 6%, for a total of 12% melt until the solidus was H2O saturated at peak conditions (1.0–4.4 kbar, and up to pressures of 6 kbar). The solidus in the final melt reintegrated bulk composition remains at a high temperature (750 °C at 3.5 kbar), which likely reflects the absence of quartz above 650 °C. It is common practice for petrologists to model subsolidus equilibria with H2O in excess. Evidence of decreasing H2O content with increasing metamorphic grade at subsolidus conditions can be found in most metamorphic terranes, suggesting that H2O is typically lost from the system during prograde dehydration reactions, prior to melting [52,53,54,55]. Therefore, when the rock reaches the solidus, it is likely to contain very little free H2O, and less H2O than was present during the development of the lower temperature mineral assemblages [56]. Subsolidus andalusite could not be produced using the H2O content of the final melt reintegrated composition except at very low temperatures; however, when H2O was modelled to be in excess below the solidus, the reintegrated bulk composition was able to produce subsolidus assemblages that include andalusite (plagioclase–biotite–staurolite–chlorite–ilmenite–andalusite–quartz–H2O, plagioclase–biotite–chlorite–ilmenite–andalusite–quartz–H2O and plagioclase–biotite–cordierite–chlorite–ilmenite–andalusite–quartz–H2O) with an andalusite abundance of 1–5%. The absence of andalusite in a fluid-undersaturated system suggests that H2O plays a large role in its stability, at least using the dataset and activity models used in this study [8,9,10,43]. It should be noted that the use of different activity–composition models can result in differences in mineral stability [57]. Whereas modelling with subsolidus H2O saturation arguably represents a closed system from which H2O produced from dehydration reactions is unable to escape [56], a fluid-rich composition appears to be necessary to reproduce the subsolidus andalusite that we interpret was present. Therefore, to model the subsolidus andalusite-bearing mineral assemblages melt was reintegrated until a wet solidus was reached and H2O was then assumed to be in excess below the solidus.
5.1. Limitations of the Modelling
While the modelling of melt reintegrated composition predicts the presence of prograde andalusite, there are several limitations to the modelling that was undertaken in this study. Some limitations relate to the uncertainties associated with the internally consistent thermodynamic data [43] and the activity–composition models [8,9,10] used in THERMOCALC to calculate the mineral stability fields e.g., [10]. The simplifications that are necessary to model phase equilibria in naturally complex chemical systems are also a limiting factor. The model chemical system used in this study does not take into account minor components, such as chlorine and fluorine in biotite and ZnO and Cr2O3 in spinel, which are present in minor amounts, see Table 1, [58,59]. Although the effects of these minor components are unlikely to greatly influence the outcomes of the modelling, they are real and will slightly modify of the positions of reactions in P–T space [5]. The uncertainties in determining the effective chemical composition that relates to the formation of the peak mineral assemblages are also a limitation. The composition obtained by whole-rock geochemistry was not appropriate to model to the development of the pelitic orthopyroxene-bearing domains, as these occur in thin, discontinuous layers within metapsammitic rock. Instead, a composition for the purposes of phase equilibria modelling was determined by combining mineral abundances and average chemical compositions of minerals. A two-dimensional domainal composition is necessarily limited, but for the purposes of modelling we have assumed that it is a realistic composition.
The melt reintegration modelling is limited by simplifications to the modelled P–T path. An isobaric P–T path at 3.5 kbar was chosen for melt reintegration modelling on the basis of peak pressures reached by other locations during the Delamerian Orogeny and the presence of andalusite in lower grade successions within the Kanmantoo Group. In all likelihood, the sample used in this study would have experienced a change in pressure during prograde metamorphism, driven by the 10–20% shortening recorded in the southern part of the Delamerian Orogen [60]. However, due to the steep inclination of the solidus and liquid modal abundance contours (e.g., Figure 4a), minor changes in the pressure during heating do not significantly change the results of this study.
Despite successfully recreating subsolidus assemblages with andalusite in the presence of excess H2O after melt reintegration, a more critical issue is that the orthopyroxene-bearing subsolidus assemblages in the final model produced in this study (Figure 6b) are unlikely to have existed, as subsolidus orthopyroxene does not appear to occur in sub-granulite grade metapelitic rocks. If it is assumed that the model shown in Figure 6b represents the amphibolite facies prograde metamorphic assemblages prior to melting and melt loss, subsolidus orthopyroxene would have formed on the prograde path. Tilley [61] described the apparent occurrence of subsolidus orthopyroxene in metapelites in the Comrie aureole in the Scottish Highlands. However, later evidence of subtle partial melting was found [62], suggesting that the orthopyroxene-bearing assemblages formed under suprasolidus conditions. Although some studies have recorded mineral assemblages with prograde subsolidus orthopyroxene e.g., [63,64], these situations generally involve infiltration of a low H2O activity fluid (aH2O), such as CO2-rich fluids or highly concentrated brines, and occur in rocks that have experienced granulite facies temperatures. An example of this is the formation of fine-grained orthopyroxene–andalusite symplectites under low aH2O conditions during retrogression of pelitic granulites, described by Ballèvre, et al. [65]. The sources of low aH2O fluids could include magmatic dykes, volatile-rich carbonates, or tectonic structures such as fractures or shear zones that may act as channels for fluid to move over large distances [66,67,68]. However, such sources are not relevant to the prediction of orthopyroxene as shown in Figure 6b, since the modelling does not incorporate a low aH2O fluid and therefore it is unlikely that subsolidus orthopyroxene would form in the abundances predicted by our models in prograde metapelites at amphibolite facies conditions.
Instead, we suggest that the appearance of subsolidus orthopyroxene in our models is an artefact created by the absence of an activity–composition model for orthoamphibole in ds62 [10]. This means that Mg and Al cannot be incorporated into orthoamphibole and instead stabilises other minerals, resulting in the formation of unrealistic assemblages. Orthopyroxene can form by the breakdown of orthoamphibole in K-poor protoliths [69]. Occurrences of orthoamphibole in andalusite-bearing metapelites are rare; however, one such occurrence is also within the Kanmantoo Group, in the Springton region, approximately 30 km north of Reedy Creek [70]. Although the Springton region rocks are thought to have been metasomatised, their final bulk compositions contain low proportions of K2O and CaO, and also contain a high Na2O/K2O ratio [70], which is similar to the composition of the sample used in this study.
The modelling undertaken in this study used the most recent internally-consistent thermodynamic dataset ds62 [43]. However, our attempts to incorporate orthoamphibole into the ds62 modelling failed to reproduce any subsolidus equilibria that could be rationalised with the incoming solidus or mineral assemblages that could plausibly have existed at subsolidus conditions. Therefore, at this stage, we cannot incorporate orthoamphibole into the modelling with ds62 with any confidence. It should also be noted that low–P subsolidus equilibria involving porphyroblastic cordierite like in this study have been known to be problematic to model in ds62 e.g., [9,57,71]. Instead, the final composition produced after melt reintegration modelling (Figure 6b) was used to model the subsolidus assemblages in the previous THERMOCALC dataset ds55 [72], to investigate the effects of incorporating orthoamphibole into the modelling e.g., [69,73]. The following activity relationships were used for modelling in ds55: silicate melt and biotite [5]; chlorite [74,75]; cordierite [72]; plagioclase [76]; gedrite [73]; orthopyroxene, spinel and magnetite [77]; ilmenite [6]. Using ds55, the subsolidus assemblages were again modelled with H2O in excess (Figure 8). While we acknowledge the apparent logic disconnect in using a melt reintegrated composition created using ds62 followed by modelling in ds55, no subsolidus orthopyroxene was found to be stable using ds55, and instead, orthoamphibole (gedrite)-bearing assemblages were modelled to be stable (Figure 8). Despite the differences between the ds62 and ds55 subsolidus models, the melt reintegrated composition in ds55 was able to produce a number of assemblages containing andalusite at similar conditions to the ds62 model (1.0–4.1 kbar and 400–550 °C; Figure 8) and in similar modal proportions (Figure 7b; 1–6%). Furthermore, although the melt reintegrated composition is specific to the sample we have used, the prediction of gedrite-bearing assemblages is consistent with the presence of orthoamphibole-bearing assemblages in lower grade areas of the Kanmantoo Group [70], suggesting that while ds62 is now widely used, ds55 still provides realistic predictions.
5.2. Implications of the Melt Reintegration Modelling
Phase equilibria modelling is a powerful tool for investigating the chemical changes that occur as a result of partial melting and melt loss during high-grade metamorphism. It is one of the few methods that allows investigation of the petrological and chemical evolution of deep-crustal rocks, as it provides an opportunity to define equilibrium relationships between melt and solid mineral species for particular bulk compositions at a given set of P–T conditions e.g., [13,14]. Several previous studies have utilised this technique to explore the effects of reintegrating melt back into lower-crustal rocks [16,18,19,41,78,79]. However, rarely do studies attempt to assess the veracity of the melt reintegration process to create valid subsolidus rock compositions. Reedy Creek presents an opportunity in which a partially known subsolidus mineral assemblage can be used as a reference point for the assessment of the outcome of melt reintegration modelling on a granulite facies rock.
The Reedy Creek metasedimentary rocks preserve intact relict, centimetre-scale sedimentary layering. This suggests that melt loss from the rock was likely to have been incremental and efficient, without the accumulation of large amounts of melt that would have resulted in catastrophic melt loss and disruption of the sedimentary layering [80,81]. The melt connectivity transition approximately 7%, [46] was used as a maximum for the melt loss that would have occurred in any one melt extraction event. However, we acknowledge that in the presence of syn-anatectic deformation, melt extraction may well occur at a lower threshold [5,18,81,82].
In the modelled sample, the sillimanite is not interpreted to have been part of the equilibrium mineral assemblage at peak metamorphic conditions, or likely at any stage throughout the sample’s prograde history. In most cases, the cordierite–spinel symplectites that are seen surrounding sillimanite on rare occasion have completely replaced sillimanite, indicating that it is not part of the peak assemblage. It cannot be said for certain that sillimanite was never stable throughout any of the rock’s history. However, the models in this study (all of which were derived from the composition of the peak mineral assemblage in the sample) are not able to form stable sillimanite at any point, suggesting that it may not have occurred at all on the prograde path. Instead, we suggest that the sillimanite that we observe in the sample is simply a compositional relic of incomplete continuous reactions involving the progressive formation of cordierite and orthoamphibole at the expense of andalusite, biotite and chlorite as the rock traversed the narrow set of fields between andalusite-bearing assemblages and orthoamphibole–cordierite-bearing assemblages. We suggest that residual metastable aluminosilicate in micro-compositional domains underwent a reaction that cannot be sequentially tracked across phase fields in our P–T models. The calculation of P–T models relies on the assumption that all phases are in equilibrium at any given point across the diagram. However, in reality, this is rarely the case. Reactions may not proceed to completion, leaving behind minerals that should have reacted out to play a role in new reactions and restricting the growth of new minerals. This results in further reactions that involve metastable minerals that are not reflected on P–T diagrams e.g., [83,84,85,86]. This overstepping displaces the location of the boundary of a metamorphic reaction in P–T space, resulting in a phase diagram that does not necessarily reflect the sequence of prograde reactions that occurred in the rock. In this study, we interpret the small relics of aluminosilicate remaining in the granulite to be metastable with respect to the modelled bulk compositions. However, they play a critical role in our analysis because they allow us to confidently interpret the presence of a subsolidus mineral. Furthermore, the spinel–cordierite symplectites form clearly delineated domains in the rock that allow us to make an estimate of the approximate amount of subsolidus andalusite.
The predicted occurrence of andalusite at subsolidus conditions indicates that melt reintegration modelling is a viable way to reproduce protolith bulk rock compositions. However, it should be noted that in cases where low-grade mineral assemblages are unclear or textural evidence of compositional domains not preserved, there may still be a significant amount of uncertainty involved in selecting a potential prograde P–T path.
An important application of melt loss modelling is the interpretation of inclusion assemblages. A large number of studies have used inclusion assemblages to provide information about prograde history, even in rocks that have undergone partial melting and melt loss e.g., [87,88,89]. While these inclusions may offer an insight into the existence of potential prograde minerals, interpreting prograde conditions based on modelling a bulk composition that existed prior to modification due to melt loss is illogical, and unlikely to result in meaningful constraints. Furthermore, a number of workers have also used the compositions of individual minerals to make inferences about prograde histories e.g., [90,91,92]. Where rocks have experienced high temperature evolutions, any such compositions will only be fortuitously the same as they were at the time of capture due to diffusion-driven compositional modification of the inclusion. However, melt reintegration modelling does offer an avenue for the interpretation of inclusion assemblages providing a window onto the prograde conditions of rocks, despite extensive melt extraction compositional modification.
6. Conclusions
Phase equilibria modelling undertaken on the Kanmantoo sediments at Reedy Creek indicates that peak P–T conditions of 790–860 °C and 1.0–4.4 kbar were reached. From these peak conditions, melt reintegration modelling of the pelitic granulites was able to reproduce several viable subsolidus mineral assemblages containing andalusite, which was known to have existed in these rocks at lower grade. This indicates that current melt reintegration methods may have the potential to effectively recreate valid protolith bulk rock compositions, but do require some knowledge of the protolith to be certain. However, the absence of orthoamphibole in the current ds62 model does, in this case, restrict our ability to accurately predict many subsolidus reactions that may have occurred in this rock.
Supplementary Materials
The following are available online at www.mdpi.com/2076-3263/7/3/75/s1, Mineral compositions obtained on MicroProbe SXFive.
Acknowledgments
Jade Anderson is thanked for her assistance with data collection. This work was supported by ARC DP160101006 (DEK), ARC LP160100578 and DP160104637 (MH). The University of Adelaide is also thanked for research support funding. KLA acknowledges the support of an Australian Government Research Training Program Scholarship.
Author Contributions
Field investigations were performed by all authors. Martin Hand assisted with interpretation and project design. Laura Morrissey and David Kelsey assisted with interpretation and THERMOCALC modelling. All authors contributed in the writing and editing of the manuscript.
Conflicts of Interest
The authors declare no conflict of interest.
Appendix A
Figure A1.
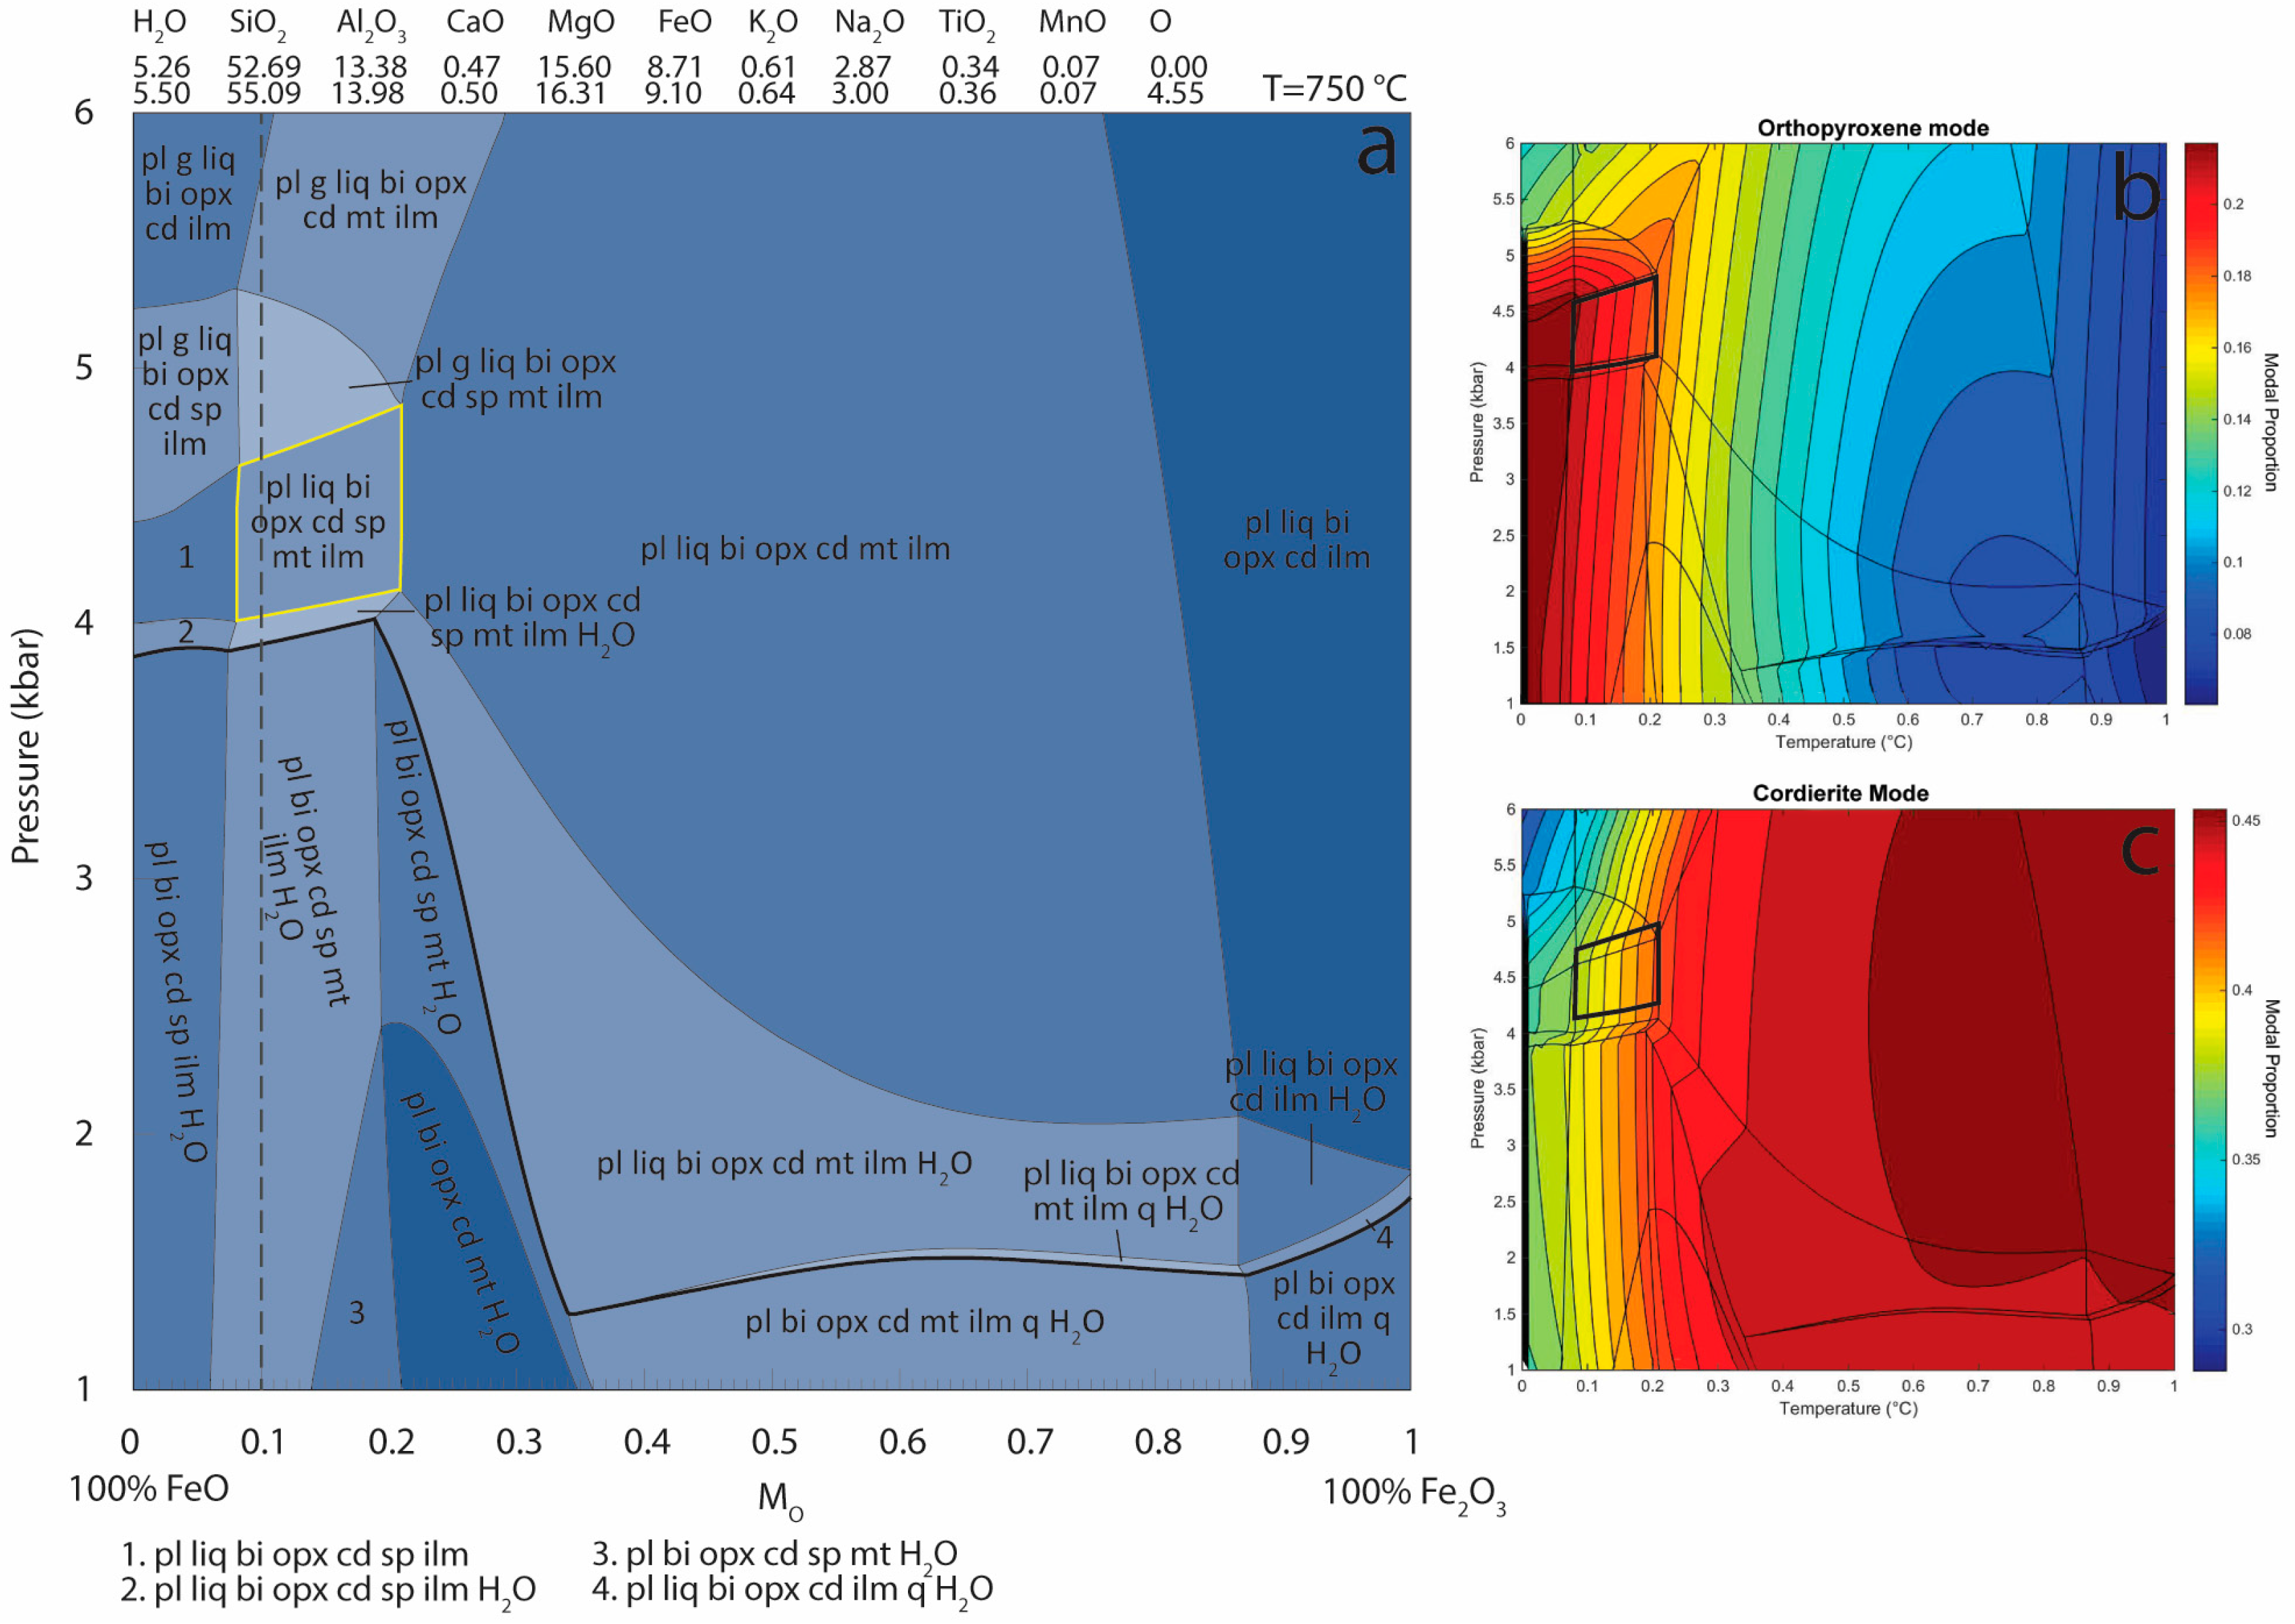
(a) P–MO model calculated to constrain the oxidation state of sample 14-RDC-04. The bold line represents the solidus. The field outlined in yellow represents the peak assemblage observed in the sample. The dashed line is the composition on the x-axis that was chosen for further modelling. (b) TCI output of modal proportion of orthopyroxene. The peak field is outlined in bold. (c) TCI output of modal proportion of cordierite. The peak field is outlined in bold.
Figure A1.
(a) P–MO model calculated to constrain the oxidation state of sample 14-RDC-04. The bold line represents the solidus. The field outlined in yellow represents the peak assemblage observed in the sample. The dashed line is the composition on the x-axis that was chosen for further modelling. (b) TCI output of modal proportion of orthopyroxene. The peak field is outlined in bold. (c) TCI output of modal proportion of cordierite. The peak field is outlined in bold.
Figure A2.
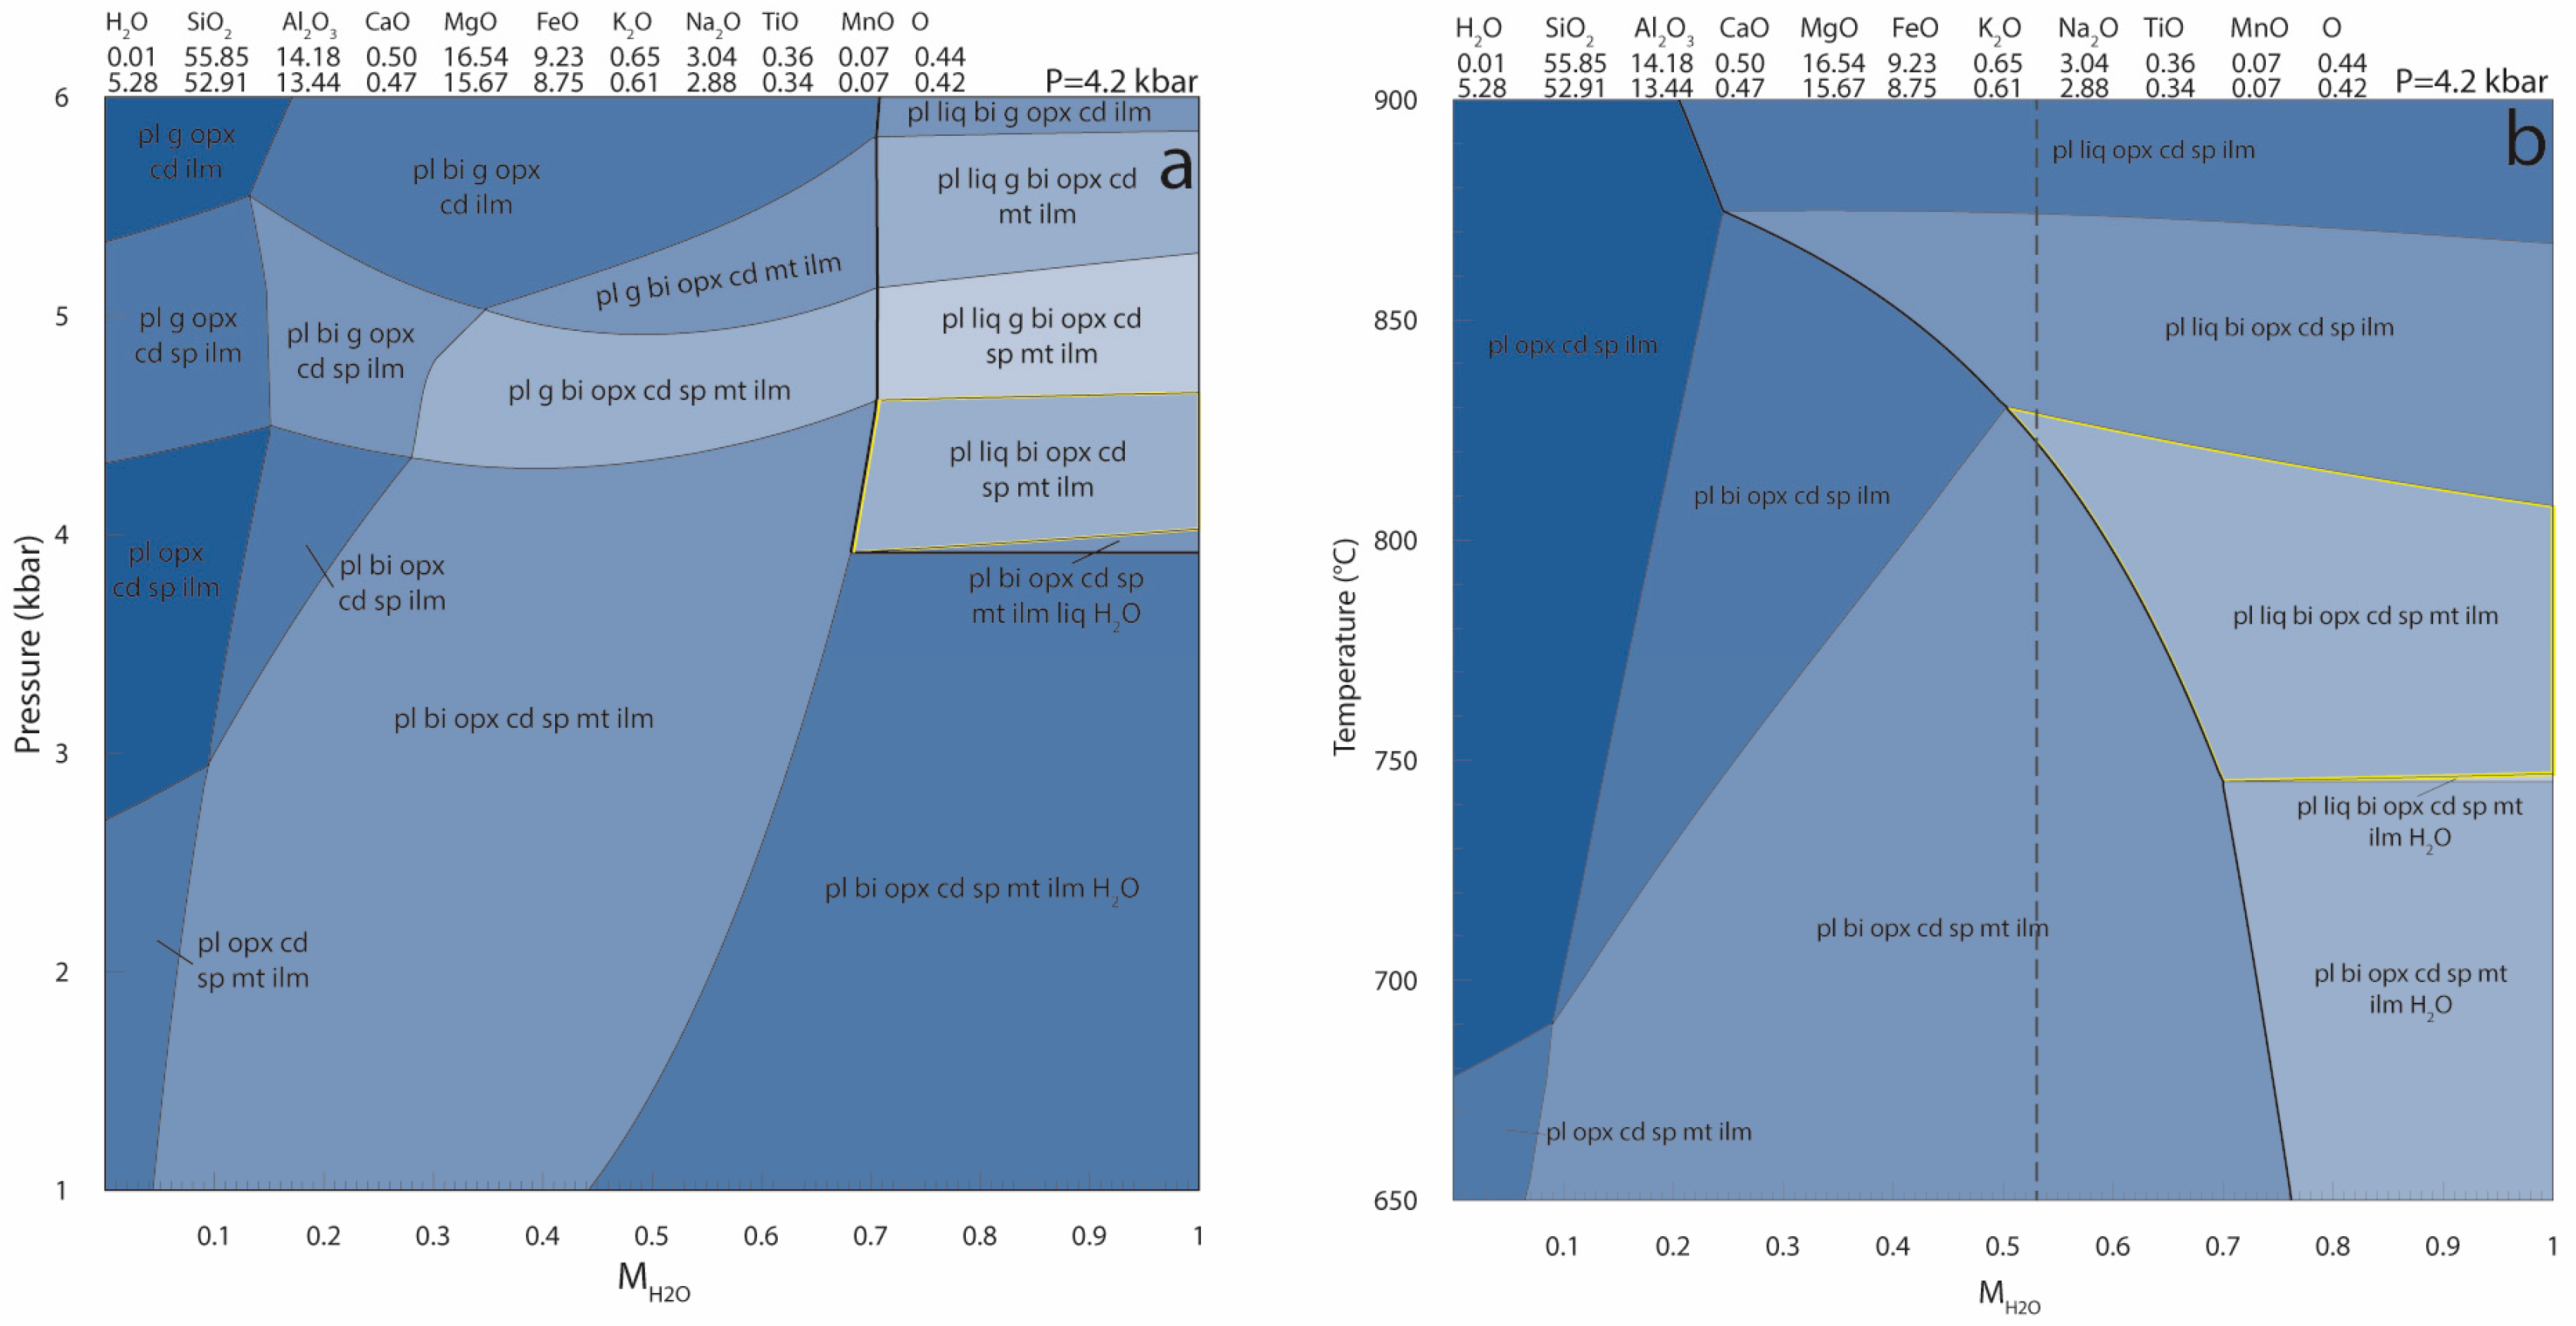
(a) P–MH2O model calculated to constrain the H2O content of sample 14-RDC-04. The bold line represents the solidus. The field outlined in yellow represents the peak assemblage observed in the sample. (b) T–MH2O model calculated to constrain the H2O content of sample 14-RDC-04. The bold line represents the solidus. The field outlined in yellow represents the peak assemblage observed in the sample. The dashed line is the composition on the x-axis that was chosen for further modelling.
Figure A2.
(a) P–MH2O model calculated to constrain the H2O content of sample 14-RDC-04. The bold line represents the solidus. The field outlined in yellow represents the peak assemblage observed in the sample. (b) T–MH2O model calculated to constrain the H2O content of sample 14-RDC-04. The bold line represents the solidus. The field outlined in yellow represents the peak assemblage observed in the sample. The dashed line is the composition on the x-axis that was chosen for further modelling.
A P–MO model (Figure A1a) was calculated to constrain the oxidation state (O) of the composition of sample 14-RDC-01. The oxidation state was chosen to be to the left of the centre of the field primarily to increase the proportion of orthopyroxene (Figure A1b) and decrease the proportion of cordierite (Figure 1c) to better adhere to the estimated modal proportions of these minerals in the sample. A P–MH2O section (Figure A2a) was originally calculated to constrain the H2O content of sample 14-RDC-04. However, H2O is not very sensitive to changes in P as opposed to T, and at the constant temperature that was chosen (750 °C) only a H2O-saturated solidus could be achieved, meaning that no melt reintegration could take place. A T–MH2O section (Figure A2b) was then calculated to assess the sensitivity of H2O with changing temperature. The left part of the peak field was chosen to represent the H2O content of the sample, as it resulted in a composition that was not H2O-saturated at the solidus and would allow for melt reintegration modelling.
Appendix B
References
- Brown, M. Crustal melting and melt extraction, ascent and emplacement in orogens: Mechanisms and consequences. J. Geol. Soc. 2007, 164, 709–730. [Google Scholar] [CrossRef]
- Heier, K.S. Metamorphism and the chemical differentiation of the crust. GFF 1965, 87, 249–256. [Google Scholar] [CrossRef]
- Sighinolfi, G.P.; Gorgoni, C. Chemical evolution of high-grade metamorphic rocks—Anatexis and remotion of material from granulite terrains. Chem. Geol. 1978, 22, 157–176. [Google Scholar] [CrossRef]
- Holland, T.; Powell, R. Calculation of phase relations involving haplogranitic melts using an internally consistent thermodynamic dataset. J. Petrol. 2001, 42, 673–683. [Google Scholar] [CrossRef]
- White, R.; Powell, R.; Holland, T. Progress relating to calculation of partial melting equilibria for metapelites. J. Metamorph. Geol. 2007, 25, 511–527. [Google Scholar] [CrossRef]
- White, R.; Powell, R.; Holland, T.; Worley, B. The effect of TiO2 and Fe2O3 on metapelitic assemblages at greenschist and amphibolite facies conditions: Mineral equilibria calculations in the system K2O–FeO–MgO–Al2O3–SiO2–H2O–TiO2–Fe2O3. J. Metamorph. Geol. 2000, 18, 497–512. [Google Scholar] [CrossRef]
- Johnson, T.; White, R.; Powell, R. Partial melting of metagreywacke: A calculated mineral equilibria study. J. Metamorph. Geol. 2008, 26, 837–853. [Google Scholar] [CrossRef]
- Powell, R.; White, R.; Green, E.; Holland, T.; Diener, J. On parameterizing thermodynamic descriptions of minerals for petrological calculations. J. Metamorph. Geol. 2014, 32, 245–260. [Google Scholar] [CrossRef]
- White, R.; Powell, R.; Holland, T.; Johnson, T.; Green, E. New mineral activity–composition relations for thermodynamic calculations in metapelitic systems. J. Metamorph. Geol. 2014, 32, 261–286. [Google Scholar] [CrossRef]
- White, R.; Powell, R.; Johnson, T. The effect of Mn on mineral stability in metapelites revisited: New a–x relations for manganese-bearing minerals. J. Metamorph. Geol. 2014, 32, 809–828. [Google Scholar] [CrossRef]
- Morrissey, L.J.; Hand, M.; Lane, K.; Kelsey, D.E.; Dutch, R.A. Upgrading iron-ore deposits by melt loss during granulite facies metamorphism. Ore Geol. Rev. 2016, 74, 101–121. [Google Scholar] [CrossRef]
- Diener, J.; White, R.; Powell, R. Granulite facies metamorphism and subsolidus fluid-absent reworking, Strangways Range, Arunta Block, central Australia. J. Metamorph. Geol. 2008, 26, 603–622. [Google Scholar] [CrossRef]
- Yakymchuk, C.; Brown, M. Consequences of open-system melting in tectonics. J. Geol. Soc. 2014, 171, 21–40. [Google Scholar] [CrossRef]
- Yakymchuk, C.; Brown, M. Behaviour of zircon and monazite during crustal melting. J. Geol. Soc. 2014, 171, 465–479. [Google Scholar] [CrossRef]
- Diener, J.F.; Fagereng, Å. The influence of melting and melt drainage on crustal rheology during orogenesis. J. Geophys. Res. Solid Earth 2014, 119, 6193–6210. [Google Scholar] [CrossRef]
- Koblinger, B.M.; Pattison, D.R. Crystallization of Heterogeneous Pelitic Migmatites: Insights from Thermodynamic Modelling. J. Petrol. 2017, 58, 297–326. [Google Scholar] [CrossRef]
- Bartoli, O. Phase equilibria modelling of residual migmatites and granulites: An evaluation of the melt-reintegration approach. J. Metamorph. Geol. 2017. [Google Scholar] [CrossRef]
- Korhonen, F.; Brown, M.; Clark, C.; Bhattacharya, S. Osumilite–melt interactions in ultrahigh temperature granulites: Phase equilibria modelling and implications for the P–T–t evolution of the Eastern Ghats Province, India. J. Metamorph. Geol. 2013, 31, 881–907. [Google Scholar] [CrossRef]
- White, R.; Powell, R.; Halpin, J. Spatially-focussed melt formation in aluminous metapelites from Broken Hill, Australia. J. Metamorph. Geol. 2004, 22, 825–845. [Google Scholar] [CrossRef]
- Redler, C.; White, R.W.; Johnson, T.E. Migmatites in the Ivrea Zone (NW Italy): Constraints on partial melting and melt loss in metasedimentary rocks from Val Strona di Omegna. Lithos 2013, 175, 40–53. [Google Scholar] [CrossRef]
- Yakymchuk, C.; Brown, M.; Clark, C.; Korhonen, F.; Piccoli, P.; Siddoway, C.; Taylor, R.; Vervoort, J. Decoding polyphase migmatites using geochronology and phase equilibria modelling. J. Metamorph. Geol. 2015, 33, 203–230. [Google Scholar] [CrossRef]
- Goodge, J.W. Latest Neoproterozoic basin inversion of the Beardmore Group, central Transantarctic Mountains, Antarctica. Tectonics 1997, 16, 682–701. [Google Scholar] [CrossRef]
- Stump, E. The Ross Orogen of the Transantarctic Mountains; Cambridge University Press: Cambridge, UK, 1995. [Google Scholar]
- Milnes, A.; Compston, W.; Daily, B. Pre-to syn-tectonic emplacement of early Palaeozoic granites in southeastern South Australia. J. Geol. Soc. Aust. 1977, 24, 87–106. [Google Scholar] [CrossRef]
- Preiss, W.V. The Adelaide Geosyncline: Late Proterozoic Stratigraphy, Sedimentation, Palaeontology and Tectonics; Department of Mines and Energy: Adelaide, South Australia, Australia, 1987.
- Haines, P.W.; Flöttmann, T. Delamerian Orogeny and potential foreland sedimentation: A review of age and stratigraphic constraints. Aust. J. Earth Sci. 1998, 45, 559–570. [Google Scholar] [CrossRef]
- Foden, J.; Elburg, M.A.; Dougherty-Page, J.; Burtt, A. The timing and duration of the Delamerian Orogeny: Correlation with the Ross Orogen and implications for Gondwana assembly. J. Geol. 2006, 114, 189–210. [Google Scholar] [CrossRef] [Green Version]
- Flöttmann, T.; James, P.; Rogers, J.; Johnson, T. Early Palaeozoic foreland thrusting and basin reactivation at the Palaeo-Pacific margin of the southeastern Australian Precambrian Craton: A reappraisal of the structural evolution of the Southern Adelaide Fold-Thrust Belt. Tectonophysics 1994, 234, 95–116. [Google Scholar] [CrossRef]
- Mancktelow, N.S. The structure of the southern Adelaide fold belt, South Australia. In The evolution of a Late Precambrian–Early Palaeozoic Rift Complex: The Adelaide Geosyncline; Geological Society of Australia: Sydney, Australia, 1990; Volume 16, pp. 369–395. [Google Scholar]
- Offler, R.; Fleming, P. A synthesis of folding and metamorphism in the Mt Lofty Ranges, South Australia. J. Geol. Soc. Aust. 1968, 15, 245–266. [Google Scholar] [CrossRef]
- Foden, J.; Sandiford, M.; Dougherty-Page, J.; Williams, I. Geochemistry and geochronology of the Rathjen Gneiss: Implications for the early tectonic evolution of the Delamerian Orogen. Aust. J. Earth Sci. 1999, 46, 377–389. [Google Scholar] [CrossRef]
- Foden, J.; Elburg, M.; Turner, S.; Sandiford, M.; O’Callaghan, J.; Mitchell, S. Granite production in the Delamerian orogen, South Australia. J. Geol. Soc. 2002, 159, 557–575. [Google Scholar] [CrossRef]
- Turner, S.; Foden, J. Magma mingling in late-Delamerian A-type granites at Mannum, South Australia. Mineral. Petrol. 1996, 56, 147–169. [Google Scholar] [CrossRef]
- Turner, S.; Kelley, S.; VandenBerg, A.; Foden, J.; Sandiford, M.; Flöttmann, T. Source of the Lachlan fold belt flysch linked to convective removal of the lithospheric mantle and rapid exhumation of the Delamerian-Ross fold belt. Geology 1996, 24, 941–944. [Google Scholar] [CrossRef]
- Sandiford, M.; Eraser, G.; Arnold, J.; Foden, J.; Farrow, T. Some causes and consequences of high-temperature, low-pressure metamorphism in the eastern Mt Lofty Ranges, South Australia. Aust. J. Earth Sci. 1995, 42, 233–240. [Google Scholar] [CrossRef]
- Moeller, T. The Petrology and Geochemistry of the Reedy Creek Granitoids and Migmatites. Honours Thesis, University of Adelaide, Adelaide, Australia, 1980. [Google Scholar]
- Sando, M. The Granitic and Metamorphic Rocks of the Reedy Creek Area, Mannum, South Australia. Master’s Thesis, University of Adelaide, Adelaide, Australia, 1957. [Google Scholar]
- White, R.; Powell, R. Melt loss and the preservation of granulite facies mineral assemblages. J. Metamorph. Geol. 2002, 20, 621–632. [Google Scholar]
- Dymoke, P.; Sandiford, M. Phase relationships in Buchan facies series pelitic assemblages: Calculations with application to andalusite-staurolite parageneses in the Mount Lofty Ranges, South Australia. Contrib. Mineral. Petrol. 1992, 110, 121–132. [Google Scholar] [CrossRef]
- Carson, C.; Powell, R.; Clarke, G. Calculated mineral equilibria for eclogites in CaO–Na2O–FeO–MgO–Al2O3–SiO2–H2O: Application to the Pouébo Terrane, Pam Peninsula, New Caledonia. J. Metamorph. Geol. 1999, 17, 9–24. [Google Scholar] [CrossRef]
- Indares, A.; White, R.; Powell, R. Phase equilibria modelling of kyanite-bearing anatectic paragneisses from the central Grenville Province. J. Metamorph. Geol. 2008, 26, 815–836. [Google Scholar] [CrossRef]
- Palin, R.M.; Weller, O.M.; Waters, D.J.; Dyck, B. Quantifying geological uncertainty in metamorphic phase equilibria modelling; a Monte Carlo assessment and implications for tectonic interpretations. Geosci. Front. 2016, 7, 591–607. [Google Scholar] [CrossRef]
- Holland, T.; Powell, R. An improved and extended internally consistent thermodynamic dataset for phases of petrological interest, involving a new equation of state for solids. J. Metamorph. Geol. 2011, 29, 333–383. [Google Scholar] [CrossRef]
- Powell, R.; Holland, T. An internally consistent thermodynamic dataset with uncertainties and correlations: 3. Applications to geobarometry, worked examples and a computer program. J. Metamorphic Geol. 1988, 6, 173–204. [Google Scholar] [CrossRef]
- Pearce, M.A.; White, A.J.R.; Gazley, M.F. TCInvestigator: Automated calculation of mineral mode and composition contours for thermocalc pseudosections. J. Metamorph. Geol. 2015, 33, 413–425. [Google Scholar] [CrossRef]
- Jenkins, R.J.F.; Sandiford, M. Observations on the tectonic evolution of the southern Adelaide Fold Belt. Tectonophysics 1992, 214, 27–36. [Google Scholar] [CrossRef]
- Rosenberg, C.L.; Handy, M.R. Experimental deformation of partially melted granite revisited: Implications for the continental crust. J. Metamorph. Geol. 2005, 23, 19–28. [Google Scholar] [CrossRef]
- Alias, G.; Sandiford, M.; Hand, M.; Worley, B. The P–T record of synchronous magmatism, metamorphism and deformation at Petrel Cove, southern Adelaide Fold Belt. J. Metamorph. Geol. 2002, 20, 351–363. [Google Scholar] [CrossRef]
- White, R.; Powell, R. Retrograde melt–residue interaction and the formation of near-anhydrous leucosomes in migmatites. J. Metamorph. Geol. 2010, 28, 579–597. [Google Scholar] [CrossRef]
- Mongkoltip, P.; Ashworth, J. Quantitative estimation of an open-system symplectite-forming reaction: Restricted diffusion of Al and Si in coronas around olivine. J. Petrol. 1983, 24, 635–661. [Google Scholar] [CrossRef]
- Kelsey, D.E.; Hand, M. On ultrahigh temperature crustal metamorphism: Phase equilibria, trace element thermometry, bulk composition, heat sources, timescales and tectonic settings. Geosci. Front. 2015, 6, 311–356. [Google Scholar] [CrossRef]
- Ague, J.J. Evidence for major mass transfer and volume strain during regional metamorphism of pelites. Geology 1991, 19, 855–858. [Google Scholar] [CrossRef]
- Clemens, J.D.; Droop, G.T.; Stevens, G. High-grade metamorphism, dehydration and crustal melting: A reinvestigation based on new experiments in the silica-saturated portion of the system KAlO2–MgO–SiO2–H2O–CO2 at P ≤ 1.5 GPa. Contrib. Mineral. Petrol. 1997, 129, 308–325. [Google Scholar] [CrossRef]
- Huang, W.; Wyllie, P. Muscovite dehydration and melting in deep crust and subducted oceanic sediments. Earth Planet. Sci. Lett. 1973, 18, 133–136. [Google Scholar] [CrossRef]
- Miyashiro, A. Evolution of metamorphic belts. J. Petrol. 1961, 2, 277–311. [Google Scholar] [CrossRef]
- Webb, G.; Powell, R.; McLaren, S. Phase equilibria constraints on the melt fertility of crustal rocks: The effect of subsolidus water loss. J. Metamorph. Geol. 2015, 33, 147–165. [Google Scholar] [CrossRef]
- Pattison, D.; DeBuhr, C. Petrology of metapelites in the Bugaboo aureole, British Columbia, Canada. J. Metamorph. Geol. 2015, 33, 437–462. [Google Scholar] [CrossRef]
- Peterson, J.; Chacko, T.; Kuehner, S. The effects of fluorine on the vapor-absent melting of phlogopite+ quartz; implications for deep-crustal processes. Am. Miner. 1991, 76, 470–476. [Google Scholar]
- Nichols, G.T.; Berry, R.F.; Green, D.H. Internally consistent gahnitic spinel-cordierite-garnet equilibria in the FMASHZn system: Geothermobarometry and applications. Contrib. Mineral. Petrol. 1992, 111, 362–377. [Google Scholar] [CrossRef]
- Paul, E.; Flöttmann, T.; Sandiford, M. Structural geometry and controls on basement-involved deformation in the northern Flinders Ranges, Adelaide Fold Belt, South Australia. Aust. J. Earth Sci. 1999, 46, 343–354. [Google Scholar] [CrossRef]
- Tilley, C.E. Contact-metamorphism in the Comrie area of the Perthshire Highlands. Q. J. Geol. Soc. 1924, 80, 22–71. [Google Scholar] [CrossRef]
- Pattison, D.R.; Tracy, R.J. Phase equilibria and thermobarometry of metapelites. Rev. Mineral. Geochem. 1991, 26, 105–206. [Google Scholar]
- Droop, G.R.; Bucher-Nurminen, K. Reaction textures and metamorphic evolution of sapphirine-bearing granulites from the Gruf Complex, Italian Central Alps. J. Petrol. 1984, 25, 766–803. [Google Scholar] [CrossRef]
- Harlov, D.E.; Johansson, L.; Van Den Kerkhof, A.; Förster, H.-J. The role of advective fluid flow and diffusion during localized, solid-state dehydration: Söndrum Stenhuggeriet, Halmstad, SW Sweden. J. Petrol. 2006, 47, 3–33. [Google Scholar] [CrossRef]
- Ballèvre, M.; Hensen, B.J.; Reynard, B. Orthopyroxene-andalusite symplectites replacing cordierite in granulites from the Strangways Range (Arunta block, central Australia): A new twist to the pressure-temperature history. Geology 1997, 25, 215–218. [Google Scholar] [CrossRef]
- Knudsen, T.-L.; Lidwin, A. Magmatic CO2, brine and nitrogen inclusions in Sveconorwegian enderbitic dehydration veins and a gabbro from the Bamble sector, Southern Norway. Eur. J. Mineral. 1996, 1041–1064. [Google Scholar] [CrossRef]
- Harlov, D.E.; Förster, H.-J. High-grade fluid metasomatism on both a local and a regional scale: The Seward peninsula, Alaska, and the Val Strona di Omegna, Ivrea–Verbano Zone, Northern Italy. Part I: Petrography and silicate mineral chemistry. J. Petrol. 2002, 43, 769–799. [Google Scholar] [CrossRef]
- Radhika, U.; Santosh, M. Shear-zone hosted graphite in southern Kerala, India: Implications for CO2 infiltration. J. Southeast Asian Earth Sci. 1996, 14, 265–273. [Google Scholar] [CrossRef]
- Diener, J.; Powell, R.; White, R. Quantitative phase petrology of cordierite–orthoamphibole gneisses and related rocks. J. Metamorph. Geol. 2008, 26, 795–814. [Google Scholar] [CrossRef]
- Arnold, J.; Sandiford, M. Petrogenesis of cordierite-orthoamphibole assemblages from the Springton region, South Australia. Contrib. Mineral. Petrol. 1990, 106, 100–109. [Google Scholar] [CrossRef]
- Pattison, D.; Spear, F.; Debuhr, C.; Cheney, J.; Guidotti, C. Thermodynamic modelling of the reaction muscovite + cordierite → Al2SiO5 + biotite + quartz + H2O: Constraints from natural assemblages and implications for the metapelitic petrogenetic grid. J. Metamorph. Geol. 2002, 20, 99–118. [Google Scholar] [CrossRef]
- Holland, T.; Powell, R. An internally consistent thermodynamic data set for phases of petrological interest. J. Metamorph. Geol. 1998, 16, 309–343. [Google Scholar] [CrossRef]
- Diener, J.; Powell, R.; White, R.; Holland, T. A new thermodynamic model for clino-and orthoamphiboles in the system Na2O–CaO–FeO–MgO–Al2O3–SiO2–H2O–O. J. Metamorph. Geol. 2007, 25, 631–656. [Google Scholar] [CrossRef]
- Mahar, E.M.; Baker, J.; Powell, R.; Holland, T.; Howell, N. The effect of Mn on mineral stability in metapelites. J. Metamorph. Geol. 1997, 15, 223–238. [Google Scholar] [CrossRef]
- Holland, T.; Baker, J.; Powell, R. Mixing properties and activity-composition relationships of chlorites in the system MgO–FeO–Al2O3–SiO2–H2O. Eur. J. Mineral. 1998, 10, 395–406. [Google Scholar] [CrossRef]
- Holland, T.; Powell, R. Activity–composition relations for phases in petrological calculations: An asymmetric multicomponent formulation. Contrib. Mineral. Petrol. 2003, 145, 492–501. [Google Scholar] [CrossRef]
- White, R.; Powell, R.; Clarke, G. The interpretation of reaction textures in Fe-rich metapelitic granulites of the Musgrave Block, central Australia: Constraints from mineral equilibria calculations in the system K2O–FeO–MgO–Al2O3–SiO2–H2O–TiO2–Fe2O3. J. Metamorph. Geol. 2002, 20, 41–55. [Google Scholar] [CrossRef]
- Guilmette, C.; Indares, A.; Hébert, R. High-pressure anatectic paragneisses from the Namche Barwa, Eastern Himalayan Syntaxis: Textural evidence for partial melting, phase equilibria modeling and tectonic implications. Lithos 2011, 124, 66–81. [Google Scholar] [CrossRef]
- Palin, R.; Searle, M.; Waters, D.; Parrish, R.; Roberts, N.; Horstwood, M.; Yeh, M.W.; Chung, S.L.; Anh, T. A geochronological and petrological study of anatectic paragneiss and associated granite dykes from the Day Nui Con Voi metamorphic core complex, North Vietnam: Constraints on the timing of metamorphism within the Red River shear zone. J. Metamorph. Geol. 2013, 31, 359–387. [Google Scholar] [CrossRef]
- Pattison, D.; Harte, B. Evolution of structurally contrasting anatectic migmatites in the 3-kbar Ballachulish aureole, Scotland. J. Metamorph. Geol. 1988, 6, 475–494. [Google Scholar] [CrossRef]
- White, R.W.; Powell, R.; Holland, T.J.B. Calculation of partial melting equilibria in the system Na2O-CaO-K2O–FeO–MgO–Al2O3–SiO2–H2O (NCKFMASH). J. Metamorph. Geol. 2001, 19, 139. [Google Scholar] [CrossRef]
- Brown, M. The spatial and temporal patterning of the deep crust and implications for the process of melt extraction. Philos. Trans. Math. Phys. Eng. Sci. 2010, 368, 11–51. [Google Scholar] [CrossRef] [PubMed]
- Johnson, T.; White, R.; Brown, M. A year in the life of an aluminous metapelite xenolith—The role of heating rates, reaction overstep, H2O retention and melt loss. Lithos 2011, 124, 132–143. [Google Scholar] [CrossRef]
- Waters, D.; Lovegrove, D. Assessing the extent of disequilibrium and overstepping of prograde metamorphic reactions in metapelites from the Bushveld Complex aureole, South Africa. J. Metamorph. Geol. 2002, 20, 135–149. [Google Scholar] [CrossRef]
- Zeh, A.; Holness, M. The effect of reaction overstep on garnet microtextures in metapelitic rocks of the Ilesha Schist Belt, SW Nigeria. J. Petrol. 2003, 44, 967–994. [Google Scholar] [CrossRef]
- Spear, F.S.; Pattison, D.R. The implications of overstepping for metamorphic assemblage diagrams (MADs). Chem. Geol. 2017, 457, 38–46. [Google Scholar] [CrossRef]
- Guo, J.; O’Brien, P.; Zhai, M. High-pressure granulites in the Sanggan area, North China craton: Metamorphic evolution, P–T paths and geotectonic significance. J. Metamorph. Geol. 2002, 20, 741–756. [Google Scholar] [CrossRef]
- Liu, D.; Jian, P.; Kröner, A.; Xu, S. Dating of prograde metamorphic events deciphered from episodic zircon growth in rocks of the Dabie–Sulu UHP complex, China. Earth Planet. Sci. Lett. 2006, 250, 650–666. [Google Scholar] [CrossRef]
- Parkinson, C.D. Coesite inclusions and prograde compositional zonation of garnet in whiteschist of the HP-UHPM Kokchetav massif, Kazakhstan: A record of progressive UHP metamorphism. Lithos 2000, 52, 215–233. [Google Scholar] [CrossRef]
- Inui, M.; Toriumi, M. Prograde pressure–temperature paths in the pelitic schists of the Sambagawa metamorphic belt, SW Japan. J. Metamorph. Geol. 2002, 20, 563–580. [Google Scholar] [CrossRef]
- Schertl, H.-P.; Schreyer, W.; Chopin, C. The pyrope-coesite rocks and their country rocks at Parigi, Dora Maira Massif, Western Alps: Detailed petrography, mineral chemistry and PT-path. Contrib. Mineral. Petrol. 1991, 108, 1–21. [Google Scholar] [CrossRef]
- Spear, F.S.; Selverstone, J.; Hickmott, D.; Crowley, P.; Hodges, K. PT paths from garnet zoning: A new technique for deciphering tectonic processes in crystalline terranes. Geology 1984, 12, 87–90. [Google Scholar] [CrossRef]
Figure 1.
Detail of the geology in the Delamerian Orogen as seen in the southern Adelaide Fold Belt. After Foden et al. [27].
Figure 1.
Detail of the geology in the Delamerian Orogen as seen in the southern Adelaide Fold Belt. After Foden et al. [27].
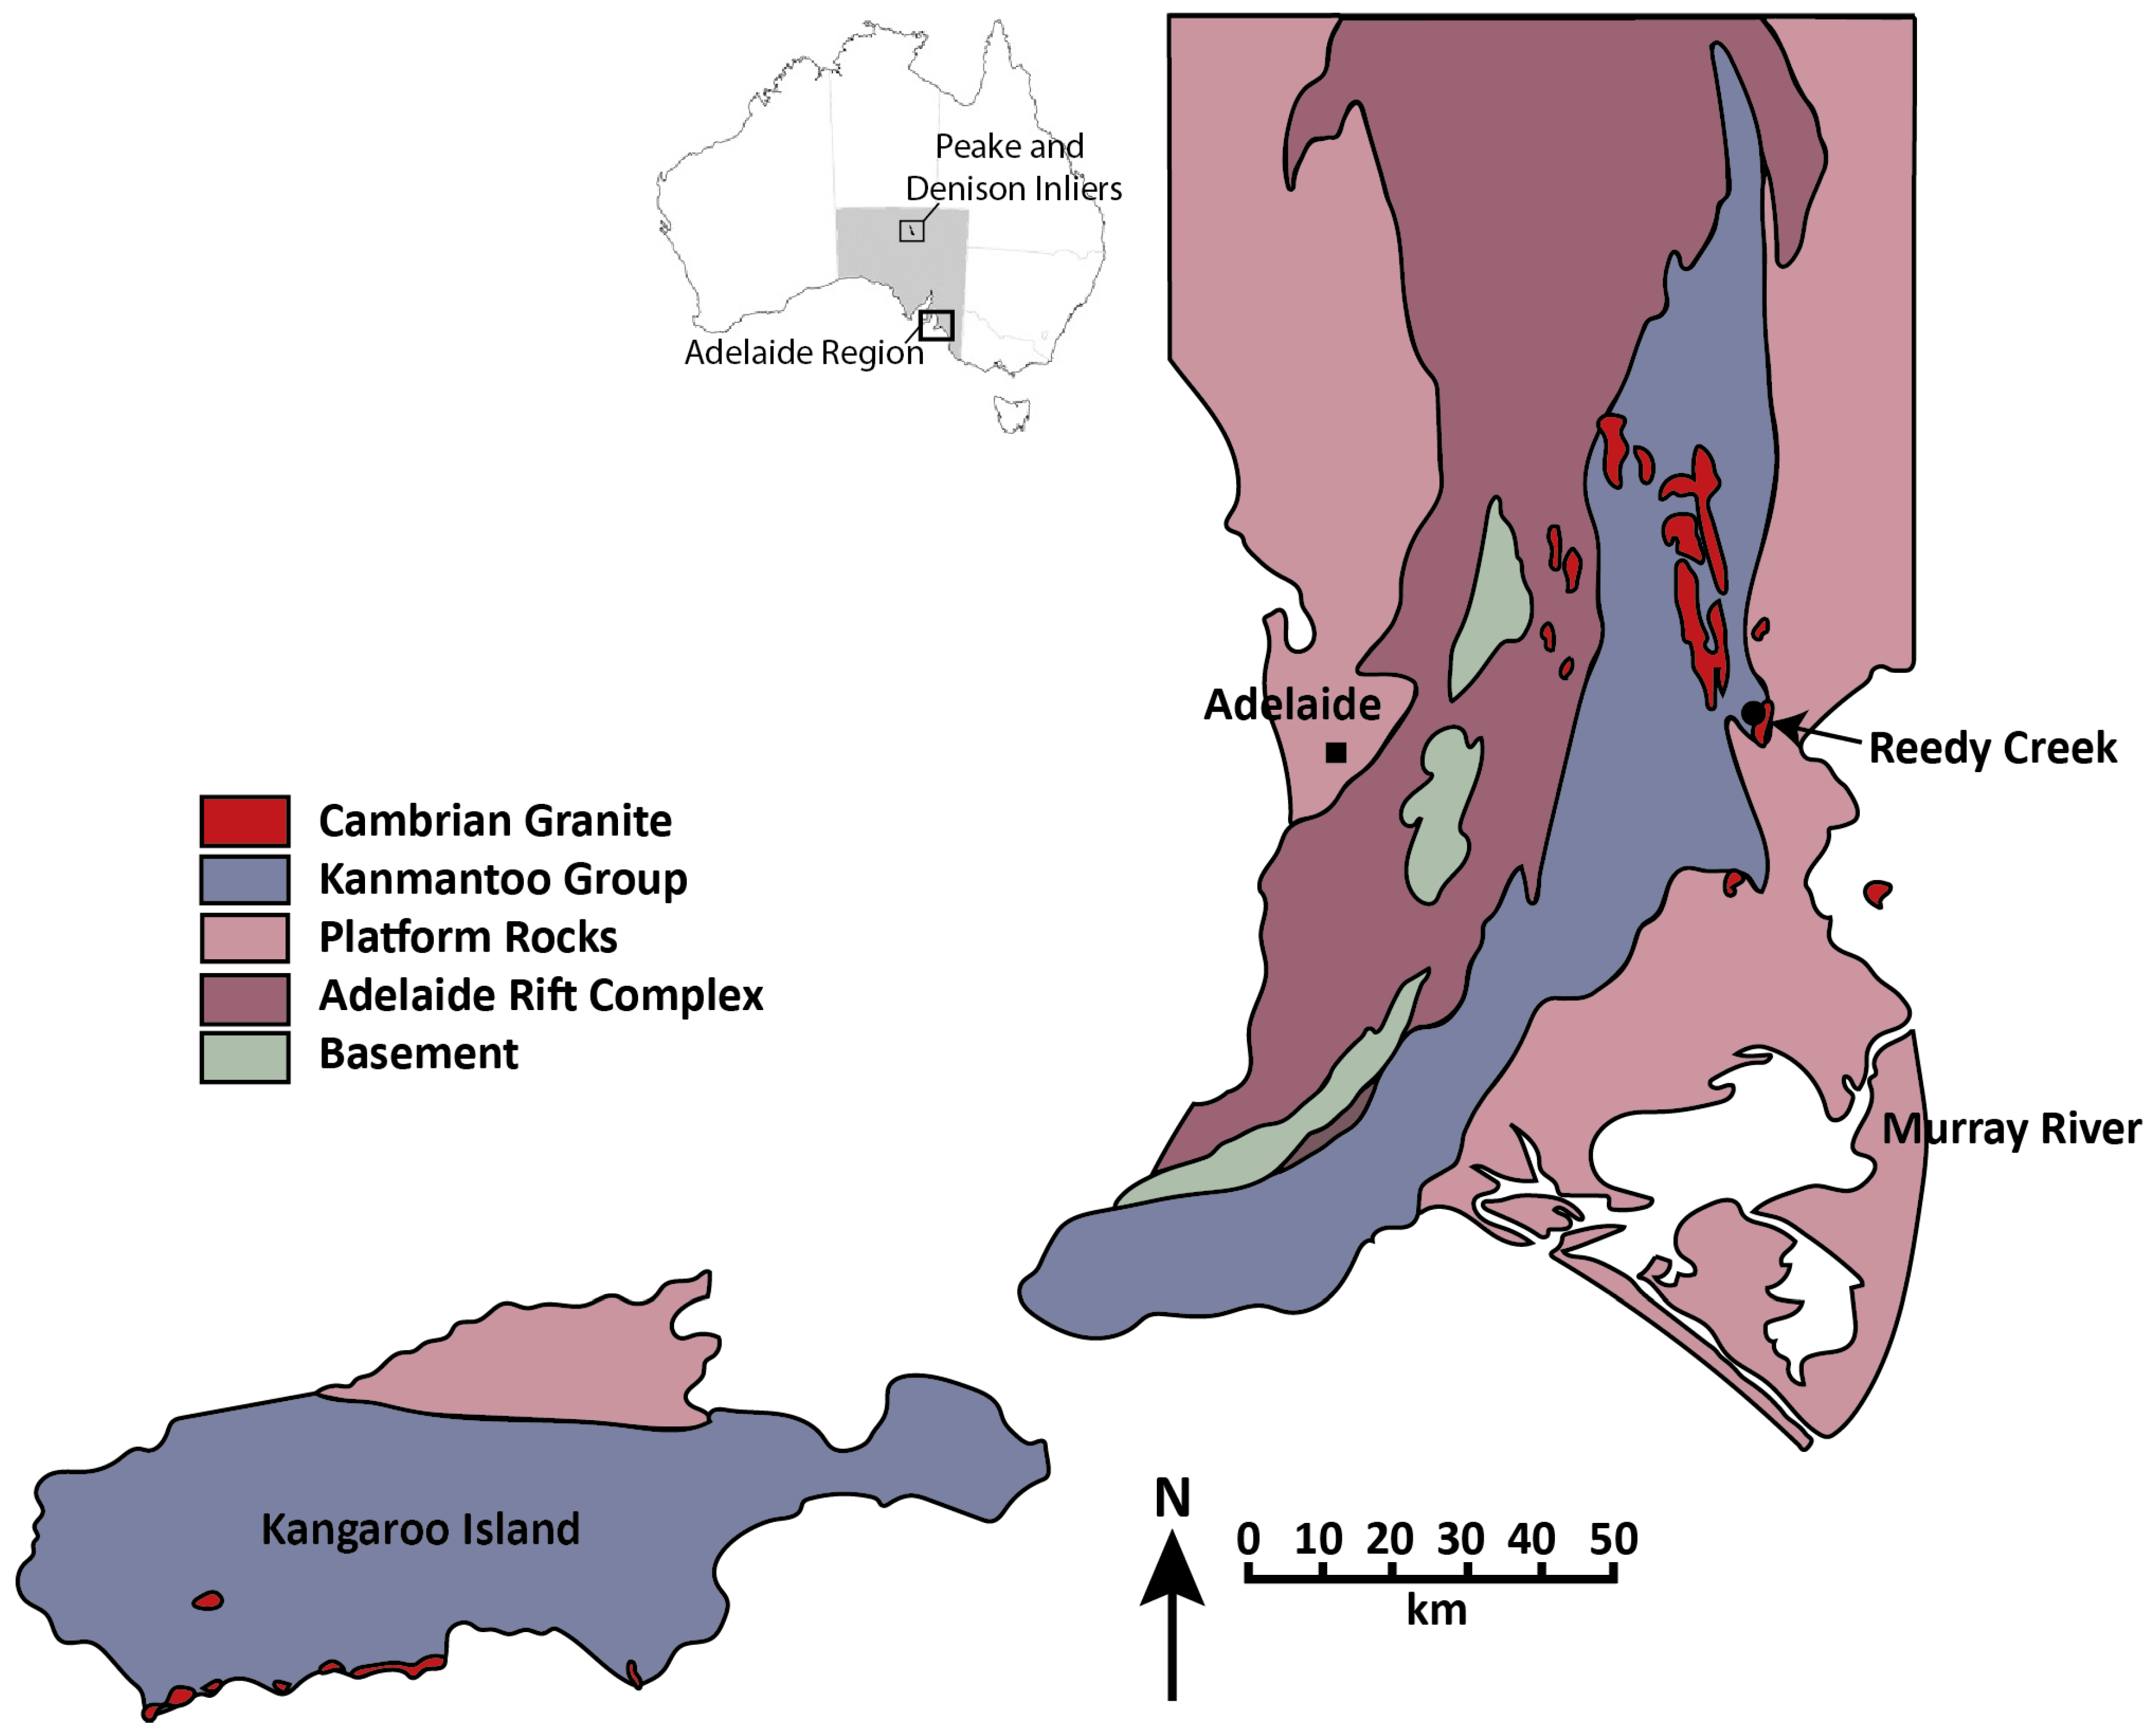
Figure 2.
(a) Mg-rich layer dominated by cordierite–biotite–orthopyroxene–plagioclase; (b) Thin, discontinuous orthopyroxene-bearing domain; (c) Rock sample of the thin layer that was sampled showing cordierite–spinel symplectites, amongst orthopyroxene and plagioclase; (d) Andalusite porphyroblasts enclosed within metapelite from a lower grade area of the Delamerian (54K 0316690 E, 6122806 S, datum WGS84).
Figure 3.
Photomicrographs and thin section photographs of sample 14-RDC-04. (a) Spinel and cordierite symplectites; (b) Relict sillimanite grain, showing typical crosshatching andalusite replacement texture, surrounded by symplectic corona of spinel and cordierite; (c) Relict sillimanite surrounded by a cordierite–spinel corona; (d) Anhedral orthopyroxene grains adjacent to semi-oriented biotite. Biotite becomes unoriented and has an anhedral shape when in contact with cordierite.

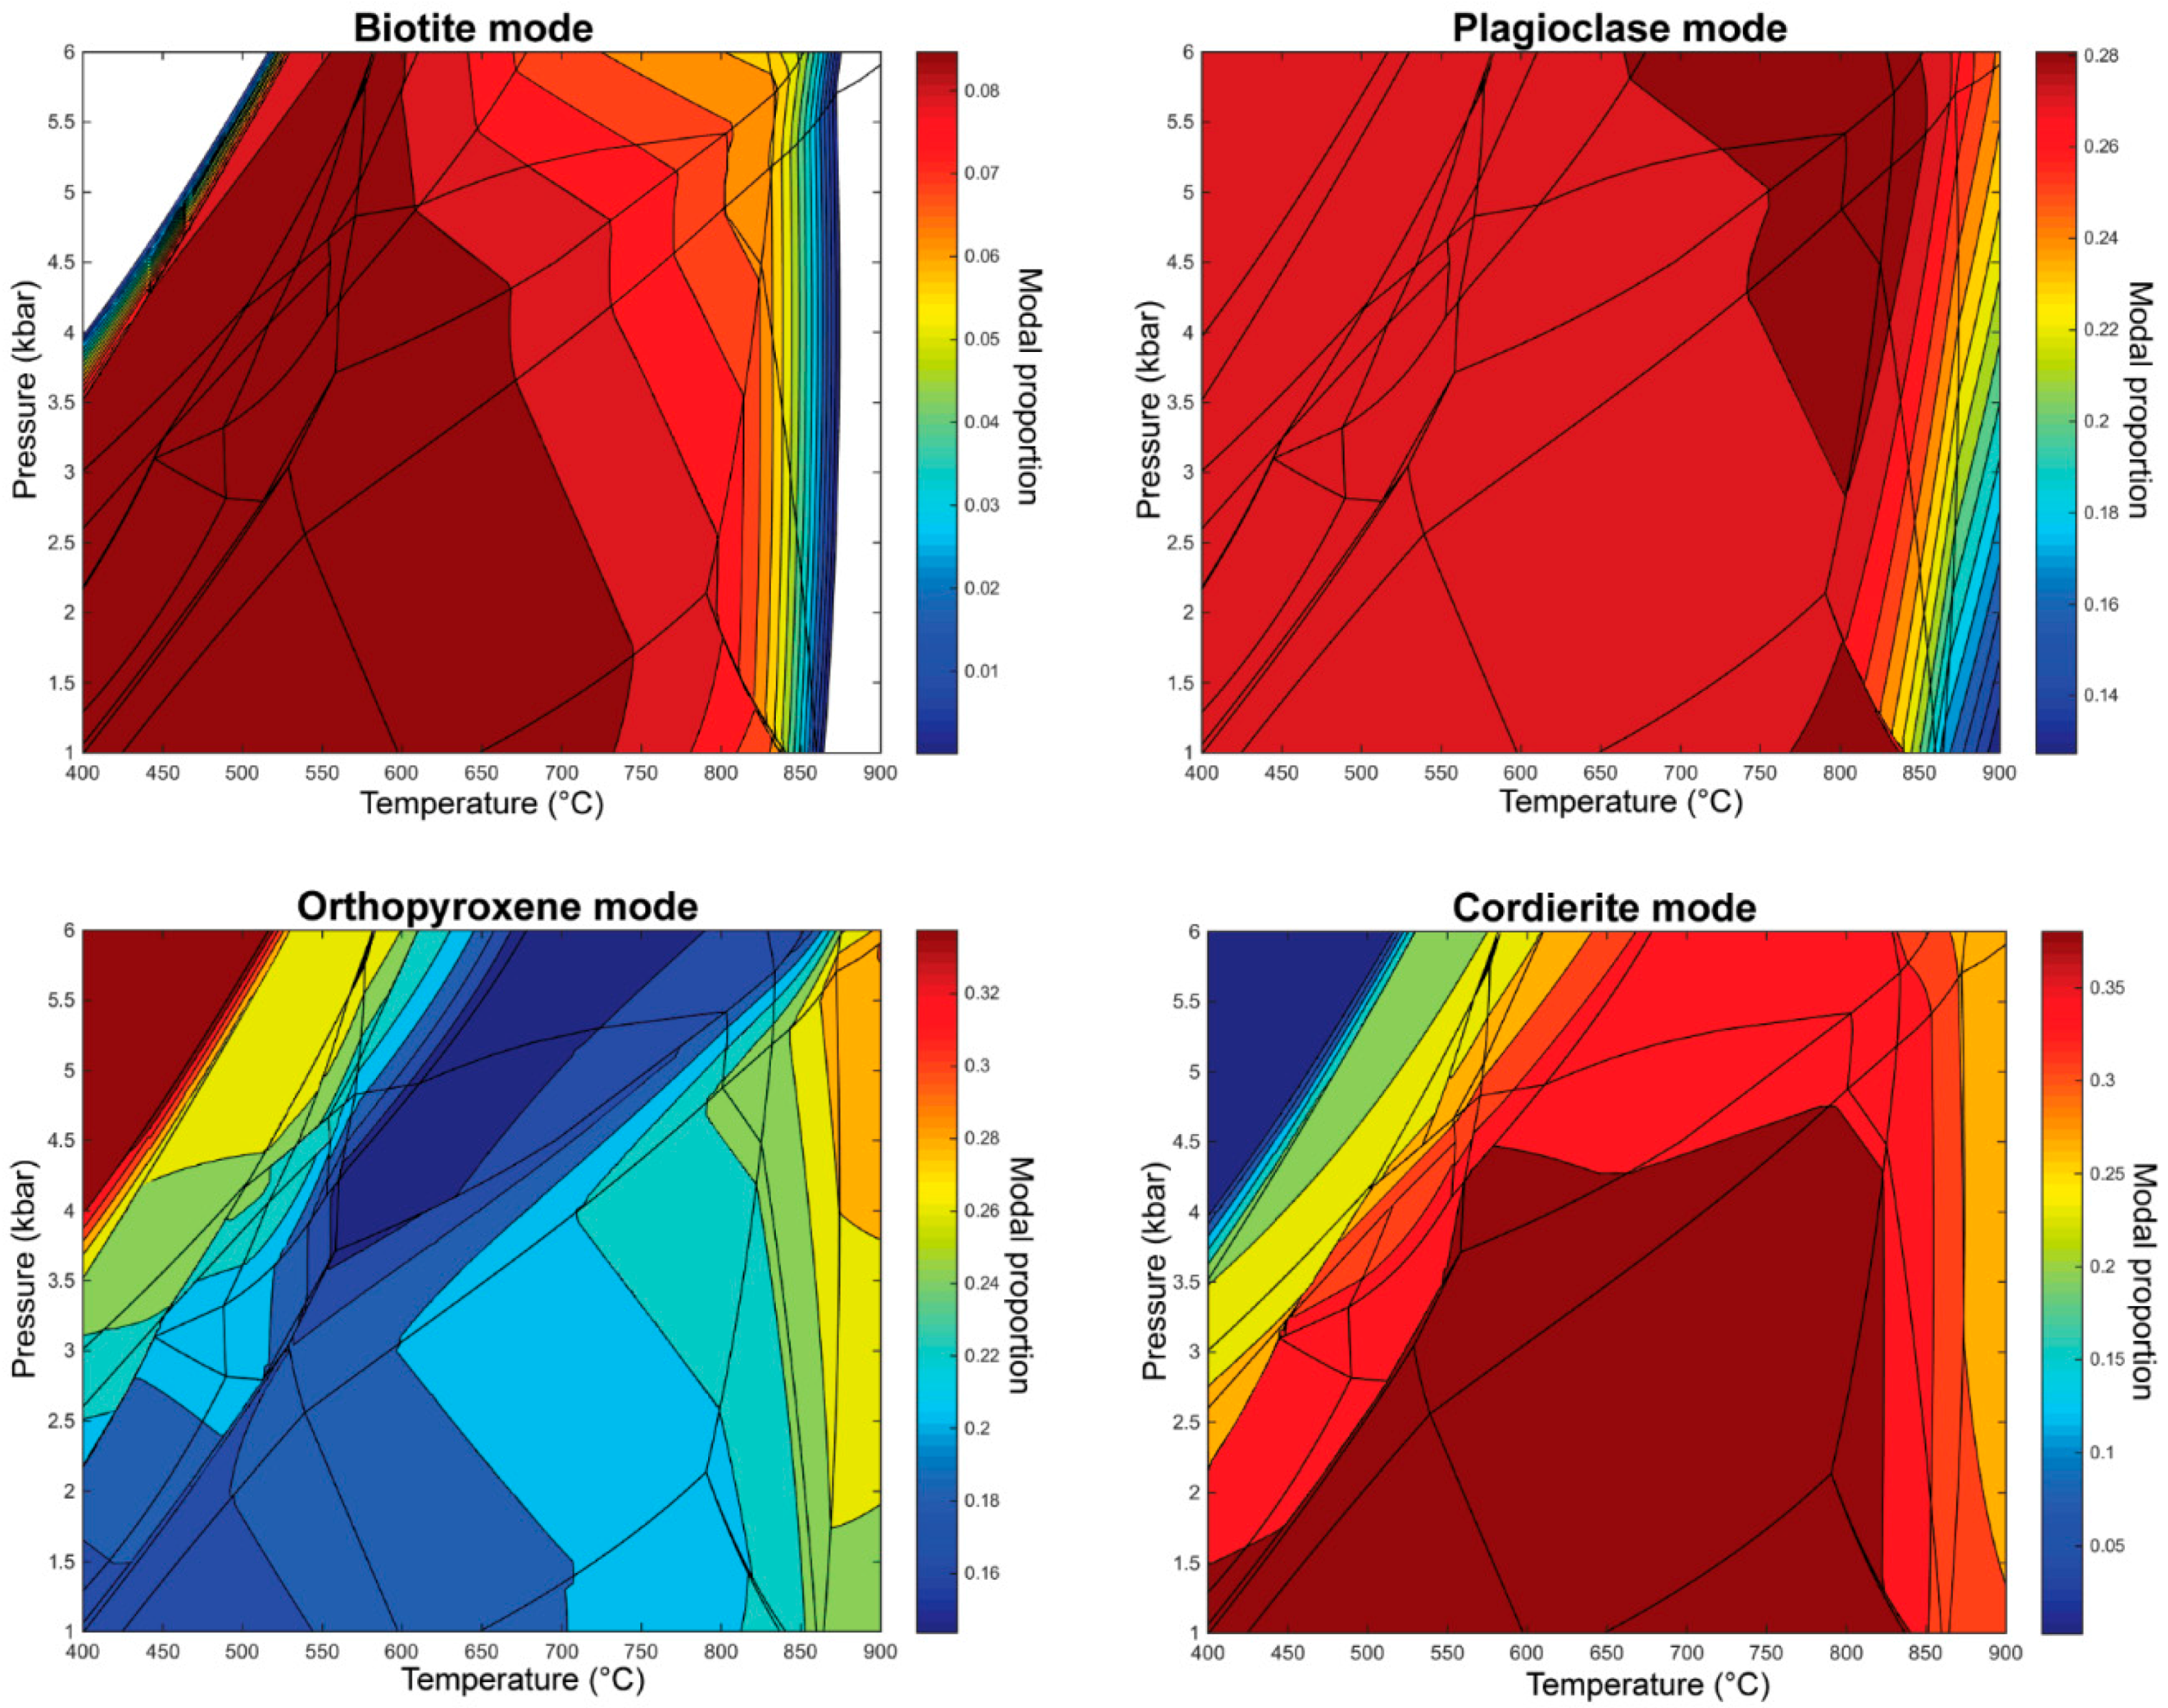
Figure 4.
(a) Calculated P–T pseudosection using the composition of the residual orthopyroxene-bearing domain. The bulk composition (in mol%) is given above the pseudosection. The bold black line represents the solidus and the field outlined in yellow is the interpreted peak assemblage. (b) Overlay of modal contours on the peak field of Figure 4a. To avoid making the diagram overly complex, only the most abundant phases were included on the overlay. The contours of each mineral on the peak field of the P–T section represent the modal abundances of the major phases in sample 14-RDC-04, including plagioclase, biotite, orthopyroxene and cordierite. Primary overlap of phases occurs between 2–4 kbar in the peak field. Individual modal proportion plots for each mineral can be found in Appendix B.

Figure 5.
Calculated P–T pseudosection after the first melt reintegration (6% melt reintegrated). The bulk composition (in mol%) was calculated with the addition of 6% melt into the original granulite composition (Figure 4a) and is given above the pseudosection. The bold black line represents the solidus.

Figure 6.
Calculated P–T pseudosections after the second melt reintegration (12% melt reintegrated). The bulk composition (in mol%) was calculated with the addition of a further 6% melt into the composition after the first melt reintegration (Figure 4a) and is given above each pseudosection. The bold black line represents the solidus. (a) H2O was not set to excess below the solidus, instead subsolidus equilibria were calculated using the H2O content of the melt reintegrated composition. (b) H2O was set to excess below the solidus. Setting H2O to excess allows calculation of equilibria with a free water phase at subsolidus temperatures and results in significant changes to the stability of andalusite.

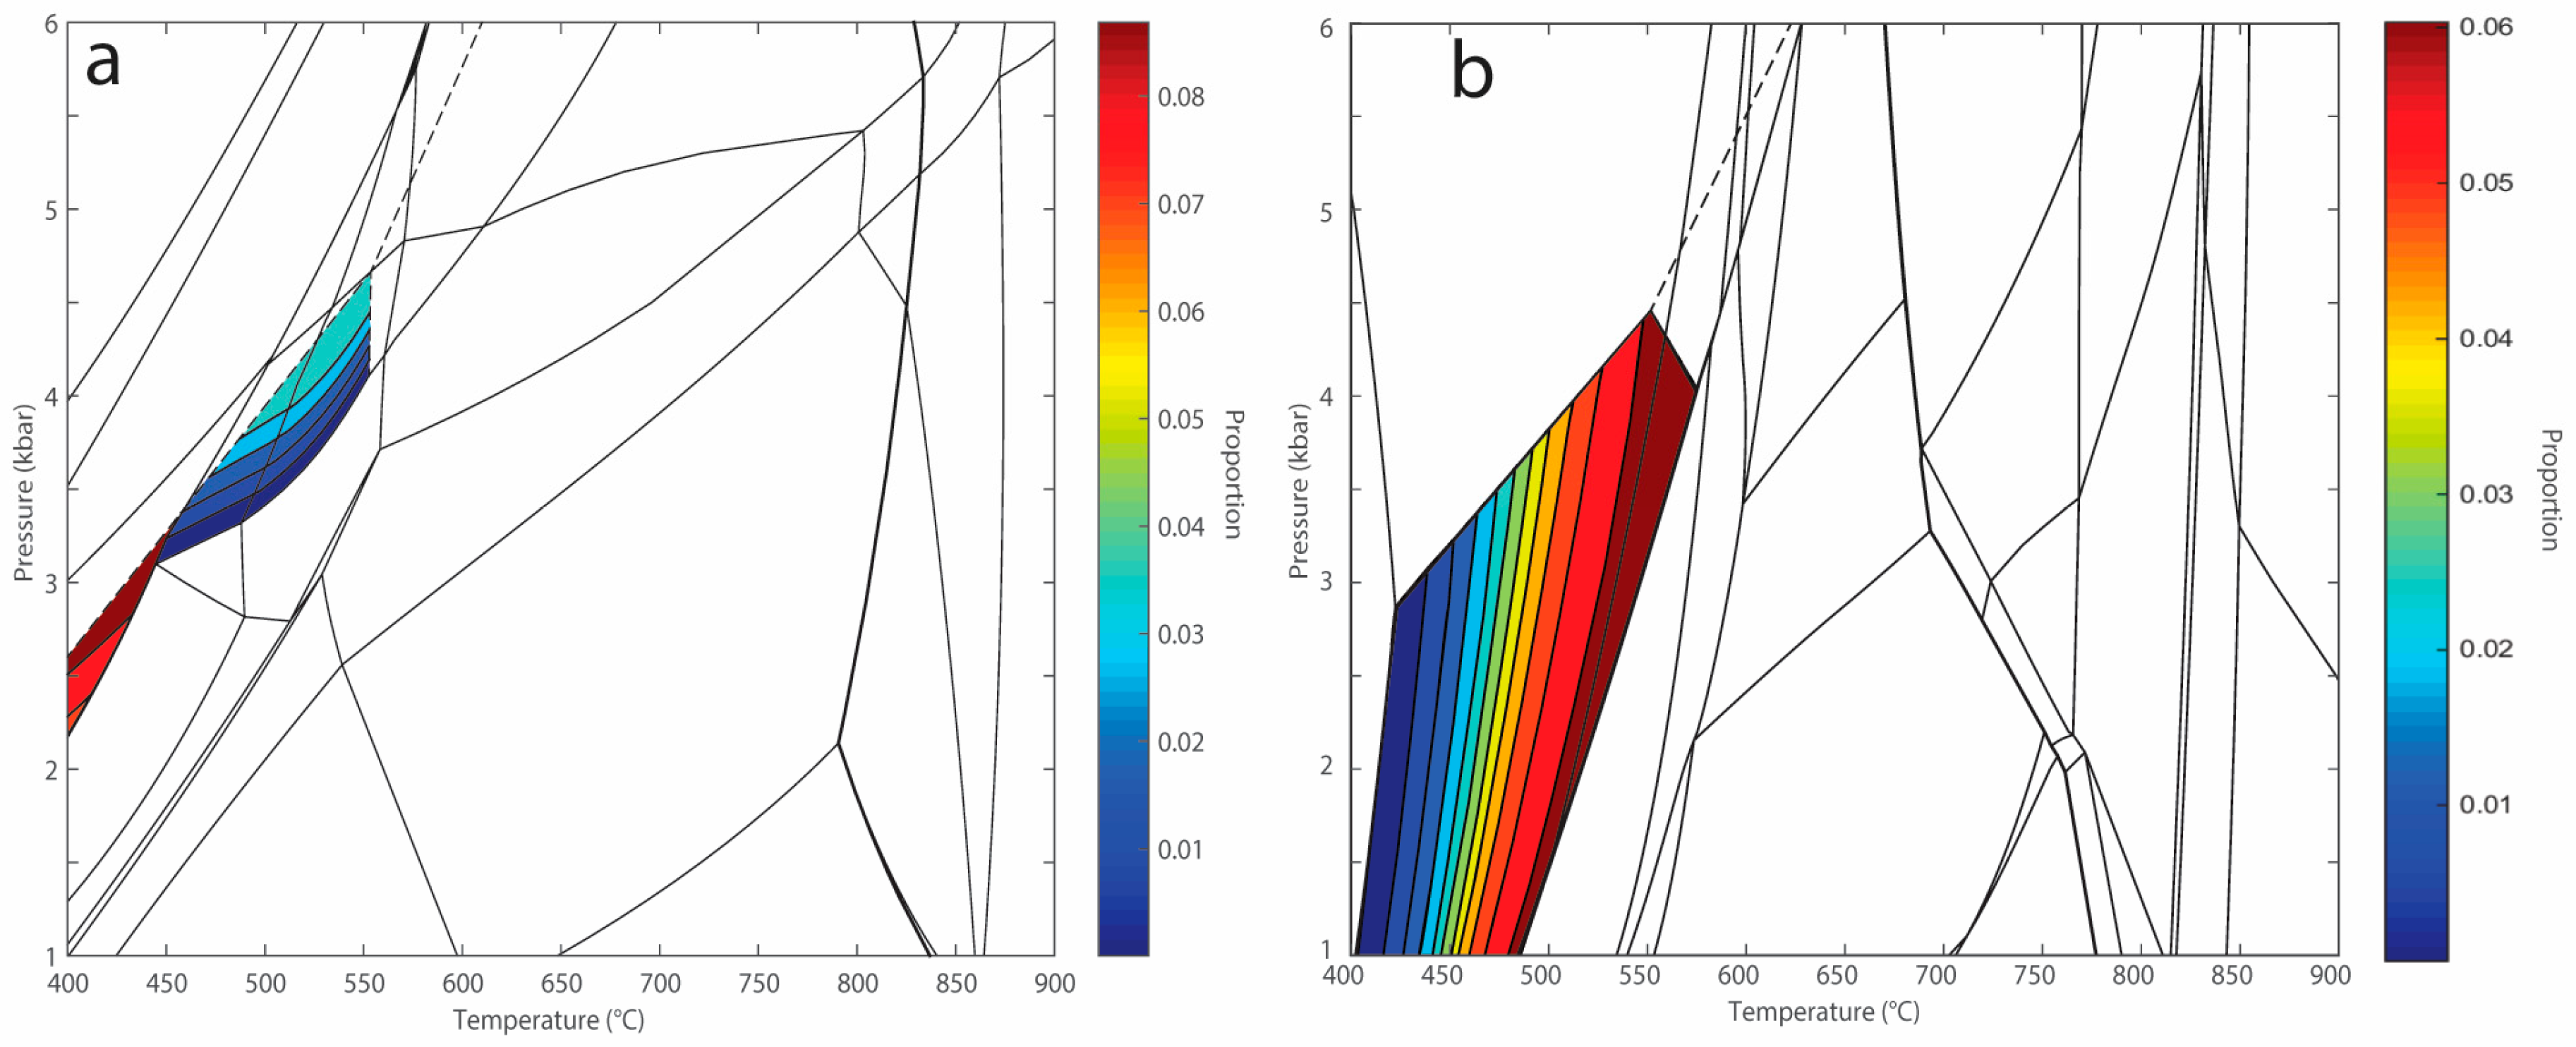
Figure 7.
(a) TCInvestigator [45] plot of the modal proportion of andalusite present in the residual P–T pseudosection (Figure 4a) prior to melt reintegration. (b) TCInvestigator [45] plot of the modal proportion of andalusite present in the ds55 P–T pseudosection after 12% melt reintegration and with H2O in excess.
Figure 8.
P–T pseudosection calculated using the same melt reintegrated composition as in Figure 6, but using ds55 rather than ds62 to explore the stability of orthoamphibole. The fields highlighted in yellow contain andalusite. The bold black line represents the solidus. H2O is set to excess below the solidus. Differences in the subsolidus and suprasolidus magnetite models in ds55 resulted in differences in fields across the solidus.

Table 1.
Mineral modal proportions and average mineral chemistry used to obtain a chemical composition of the orthopyroxene-bearing domains for the purposes of phase equilibria modelling. Individual mineral analyses can be found in Supplementary materials.
Table 1.
Mineral modal proportions and average mineral chemistry used to obtain a chemical composition of the orthopyroxene-bearing domains for the purposes of phase equilibria modelling. Individual mineral analyses can be found in Supplementary materials.
| Mineral | Bi | Cd | Opx | Sp | Pl | Total | |
|---|---|---|---|---|---|---|---|
| Mode (wt %) | 9.93 | 34.59 | 21.41 | 6.41 | 27.67 | 100 | – |
| Mineral Density (kg/m3) | 2.9 | 2.6 | 3.5 | 4.1 | 2.6 | – | – |
| wt % | Bi | Cd | Opx | Sp | Pl | Average Bulk Composition | Final Bulk Composition |
| SiO2 | 37.99 | 49.39 | 52.65 | 0.09 | 68.77 | 51.16 | 50.61 |
| TiO2 | 3.48 | 0 | 0.09 | 0.01 | 0 | 0.37 | 0.37 |
| Al2O3 | 15.17 | 33.06 | 2.22 | 58.04 | 19.68 | 22.58 | 22.34 |
| Cr2O3 | 0.1 | 0 | 0.04 | 0.04 | 0 | 0.02 | 0.02 |
| FeO | 14.36 | 5.06 | 24.2 | 33.72 | 0 | 10.52 | 10.41 |
| MnO | 0.02 | 0.05 | 0.24 | 0.12 | 0 | 0.08 | 0.08 |
| MgO | 15.89 | 11.14 | 21.71 | 7.89 | 0 | 10.58 | 10.47 |
| ZnO | 0.01 | 0.01 | 0.02 | 0.13 | 0 | 0.02 | 0.02 |
| CaO | 0 | 0 | 0.02 | 0.01 | 1.5 | 0.42 | 0.42 |
| Na2O | 0.08 | 0 | 0 | 0 | 10.04 | 2.79 | 2.76 |
| K2O | 8.68 | 0 | 0.03 | 0 | 0 | 0.86 | 0.85 |
| Cl | 0.49 | 0.16 | 0 | 0 | 0 | 0.11 | 0.11 |
| F | 0.02 | 0 | 0 | 0 | 0 | 0 | 0.00 |
| Total | 96.29 | 98.87 | 101.22 | 100.05 | 99.99 | 101.08 | 100 |
© 2017 by the authors. Licensee MDPI, Basel, Switzerland. This article is an open access article distributed under the terms and conditions of the Creative Commons Attribution (CC BY) license (http://creativecommons.org/licenses/by/4.0/).
Share and Cite
MDPI and ACS Style
Alessio, K.L.; Hand, M.; Morrissey, L.J.; Kelsey, D.E.; Payne, J.L. Melt Reintegration Modelling: Testing against a Subsolidus Reference Assemblage. Geosciences 2017, 7, 75. https://doi.org/10.3390/geosciences7030075
AMA Style
Alessio KL, Hand M, Morrissey LJ, Kelsey DE, Payne JL. Melt Reintegration Modelling: Testing against a Subsolidus Reference Assemblage. Geosciences. 2017; 7(3):75. https://doi.org/10.3390/geosciences7030075
Chicago/Turabian StyleAlessio, Kiara L., Martin Hand, Laura J. Morrissey, David E. Kelsey, and Justin L. Payne. 2017. "Melt Reintegration Modelling: Testing against a Subsolidus Reference Assemblage" Geosciences 7, no. 3: 75. https://doi.org/10.3390/geosciences7030075
Note that from the first issue of 2016, this journal uses article numbers instead of page numbers. See further details here.