Article

Different Responses of Microbiota across Intestinal Tract to Enterococcus faecium HDRsEf1 and Their Correlation with Inflammation in Weaned Piglets

State Key Laboratory of Agriculture Microbiology, College of Veterinary Medicine, Huazhong Agricultural University, Wuhan 430070, China
*
Authors to whom correspondence should be addressed.
Microorganisms 2021, 9(8), 1767; https://doi.org/10.3390/microorganisms9081767
Submission received: 21 July 2021 / Revised: 11 August 2021 / Accepted: 16 August 2021 / Published: 19 August 2021
(This article belongs to the Section Veterinary Microbiology)

Abstract

:
Enterococcus faecium HDRsEf1 (HDRsEf1) was identified to reduce the incidence of diarrhea in weaned piglets, but the mechanism has not been elucidated yet. Based on the fact that gut microbiota plays a crucial role in regulating inflammatory responses, the effects of HDRsEf1 on microbiota across the intestinal tract in weaned piglets were investigated. Microbiota from the luminal contents and the mucosa of the ileum, cecum, and colon of HDRsEf1-treated piglets were explored by 16S rRNA sequencing and qPCR. It was demonstrated that microbiota in different gut niches responded specifically to HDRsEf1, with major alterations occurring in the ileum and cecum. The total bacterial load of microbiota in ileal luminal contents and the relative abundance of Escherichia-Shigella in the ileal mucosa was significantly down-regulated by HDRsEf1 administration, while the relative abundance of butyrate-producing bacteria (including Clostridiaceae-1, Rumencoccidae, and Erysipelotrichaceae) in cecal luminal contents was significantly up-regulated. Moreover, the utilization of HDRsEf1 improved intestinal morphological development and reduced the inflammatory response, which were negatively correlated with the relative abundance of Escherichia-Shigella in the ileal mucosa and butyrate-producing bacteria in cecal luminal contents, respectively. Collectively, this study suggests that the administration of HDRsEf1 alters gut microbiota, thereby alleviating inflammation and improving intestinal morphological development in weaned piglets.

1. Introduction

In the pig rearing industry, early weaning stress of piglets often leads to an increased diarrhea rate and growth retardation [1]. Since the 1850s, a subclinical dose of antibiotics has been used in animal husbandry, especially in piglet breeding, to reduce the diarrhea rate and promote the growth of piglets [2]. However, the utilization of antibiotics as feed additives has caused the emergence and spread of drug-resistant bacteria and antibiotic residues in pig meat. That is why antibiotic consumption for pig production has been gradually banned in several countries [3]. Ever since the ban on antibiotic as growth promoters in animal production, the application of probiotics as alternatives to antibiotics has progressively started [4]. E. faecium is one of the first batch of probiotics approved by the EU and FDA for animal feed [5]. Our previous studies have shown that HDRsEf1 could promote growth and reduce the incidence of diarrhea in piglets; however, the protective mechanism still needs to be investigated [6]. Many studies reported that E. faecium exhibited several beneficial functions, including enhancing the intestinal barrier integrity, inhibiting pathogen adhesion and infection, inducing anti-inflammatory and anti-oxidant effects, and promoting immune system development [7,8,9,10,11,12]. However, the effects of E. faecium on gut microbiota have not been investigated yet. A variety of microorganisms inhabit in the gastrointestinal tract of mammals and have profound influences on host development, nutrient digestion, and immune modulation [13,14,15]. In early life, multiple factors, such as diet, therapeutic agents, and infection shape the host’s initial gut microbiota, which, consequently, cause a long-term impact on the host [16]. It is well known that antibiotics promote growth by affecting the number and structure of the microbiota in the small intestine [17,18], and some probiotics can also promote animal growth and improve health by regulating gut microbiota of piglets [19,20]. E. faecium belongs to lactic acid bacteria, and some strains can secrete organic acids, bacteriocin, and other antibacterial substances [21]. In addition, HDRsEf1, which belongs to E. faecium, has probiotic effects on different animals, including mammals (pigs) and poultry (broilers) [6]. Therefore, it is reasonable to hypothesize that the effects of HDRsEf1 on piglets may be due to its regulation on gut microbiota.
There are different microenvironments along the whole gastrointestinal tract, which contribute to spatial changes in the bacterial composition [22,23,24,25]. Studies have shown microbiota in different gut niches respond differently to dietary changes [26,27]. Although many previous studies have explored the impact of probiotics on gut microbiota, due to the convenience of sampling, previous studies mostly took fecal and colonic contents as samples, ignoring the regional differences of gut microbiota.
Therefore, this study was designed to explore the effects of HDRsEf1 on microbiota in different gut niches, including luminal contents and the mucosa of the ileum, cecum, and colon. Moreover, given that weaning stress could cause excessive inflammation, which results in intestinal injury and diarrhea, the correlation between changes in microbial composition and inflammation or intestinal development were also assessed [28].

2. Materials and Methods

2.1. Animal Husbandry

Animal experiment was carried out at the experimental station of Huazhong Agricultural University in Hubei Province, China. All animal protocols used in this study were in accordance with the Guidelines for the Care and Use of Animals for Research and Teaching and approved by the Animal Care and Use Committee of Huazhong Agricultural University (permit number: HZAUSW2018-018). Three-week-old male (Landrace × Large White) post-weaning piglets with similar body weights were assigned to HDRsEf1 treatment group or control group (n = 5). All the piglets were weaned on the 21st day of age and had an adaption period for one week. After adaption, the piglets were randomly allocated into two groups: a control group and the HDRsEf1 treatment group. The control group was administered with the basal diet according to nutrient requirements (NRC, 2012). The HDRsEf1 treatment group was administered the basal diet supplemented with E. faecium HDRsEf1 at 5 × 10⁶ CFU/g for 28 days [6]. The HDRsEf1 was provided by Huada Ruier Co., Ltd. (Wuhan, China). All piglets were free to feed and drink, weighed once a week, and no antibiotics were used during the experiment.

2.2. Slaughtering and Sampling

After fasting overnight, at the 28th day of HDRsEf1 treatment, piglets were sacrificed for samples collection. Ileum, cecum, and middle colon were ligated, and then the luminal contents and mucosal tissue were collected from these sites. After being washed with PBS, the mucosal tissue was scraped by a glass slide. All samples were stored at −80 °C after being quick frozen with liquid nitrogen. For the measurements of serum inflammatory factors, the serum samples from these sacrificed piglets were collected. The duodenum, jejunum, and ileum tissues were collected and immediately fixed in 4% paraformaldehyde for subsequent morphological analysis.

2.3. DNA Extraction, 16S rRNA Gene Amplification, and High-Through Sequencing

A total of 0.5 g lumen contents and mucosal scraps of ileum, cecum, and colon were used to extract total bacterial genomic DNA using the QIAamp R Fast DNA Stool Mini Kit (QIAGEN Ltd., Hilden, Germany) according to the manufacturer’s protocol. The V3–V4 region of the 16S rRNA gene was amplified using universal primers 338F (5′-ACTCCTACGGGAGGCAGCAG-3′) and 806R (5′-GGACTACHVGGGTWTCTAAT-3′). The PCR reactions were conducted using the following program: denaturation at 95 °C for 3 min, 27 cycles of 95 °C for 30 s, annealing at 55 °C for 30 s, elongation at 72 °C for 45 s, and a final extension at 72 °C for 10 min. The PCR components, the extraction and purification of PCR products were the same with previous study [29]. Purified PCR products were pooled into equimolar amounts and sequenced on the Illumina MiSeq platform according to the standard protocols by Shanghai Majorbio Bio-pharm Technology Co., Ltd. (Shanghai, China). The raw reads were deposited into the NCBI Sequence Read Archive (SRA) database (Accession Number: PRJNA694358).

2.4. Analysis of Sequencing Data

Raw FASTQ files were demultiplexed, quality-filtered by Trimmomatic, and merged by FLASH by the criteria described previously [30]. Operational taxonomic units (OTUs) were clustered with 97% similarity cutoff using UPARSE (version 7.1 http://drive5.com/uparse/, accessed on 26 April 2020) and chimeric sequences were identified and removed using UCHIME [31]. The taxonomy of each 16S rRNA gene sequence was analyzed by RDP Classifier algorithm (http://rdp.cme.msu.edu/, accessed on 26 April 2020) against the Silva (silva 132/16s bacteria) database using confidence threshold of 70% [32].
Sob and Shannon indices were used to reflect α diversity at 97% identity and plotted using Mothur (version v.1.30.2) [33]. In β diversity analysis, unweighted principal coordinates and weighted principal coordinates based on the abundance of OTU were used to determine the difference of microbiota between groups. Analysis of similarities (ANOSIM) was performed to assess the overall similarity between groups by testing the significance of spatial separation in PCoA using the “vegan” package [34]. According to the composition and sequence distribution of samples at each taxonomic level, the significant differential abundant genera between groups were tested by Student’s t-test and visualized using the R package software (version 3.3.1) [35]. Linear discriminant analysis (LDA, threshold set to 2 or 3) effect size (LEfSe) was used to elucidate the differences of bacterial taxa. The algorithm uses the nonparametric factorial Kruskal–Wallis sum rank test to detect features with significant differential abundance, followed by linear discriminant analysis to estimate the effect size of each differentially abundant taxa. The cladogram was drawn using the LEfSe algorithm (http://huttenhower.sph.harvard.edu/lefse/, accessed on 27 November 2020) [36]. The correlations between bacterial composition and inflammatory cytokine expression or the development of intestinal villi were calculated by spearman correlation coefficient and displayed by the heatmap generated by R (version 3.3.1) using the “pheatmap” package [37].

2.5. RNA Extraction and RT-qPCR of Small Intestine

Total RNA was extracted from duodenum, jejunum, and ileum tissues using Trizol reagent (Takara Bio, Otsu, Japan) and quantified for cDNA synthesis. Total RNA (1 μg) was reverse-transcribed using a PrimeScript® RT reagent Kit with gDNA Eraser (Takara Bio, Otsu, Japan), carefully following the manufacturer’s instructions. The primers and amplification conditions for inflammatory cytokines (IL-1β, IL-8, IL-12p35, IL-12p40, TNF-α, and IFN-γ), NFκB, and GAPDH are listed in Table S1. Quantitative real-time PCR (RT- qPCR) was performed using SYBR Premix EX Taq (Takara Bio, Otsu, Japan). Amplification was carried out in a total volume of 20 μL, containing 2 μL cDNA, 10 μL 2× SYBR Green Premix EX Taq, 7 μL double-distilled H2O, and 0.5 μL of each primer. All measurements were performed in triplicate. The relative amount of each studied mRNA was normalized to GAPDH mRNA levels and the data were analyzed according to the 2−∆∆CT method.

2.6. Morphological Analysis of Small Intestine

The duodenum, jejunum, and ileum tissues were embedded in paraffin, sectioned (4 μm), stained with hematoxylin and eosin (H&E), and imaged with a Panoramic MIDI slide scanner (3D HISTECH Co., Ltd., Budapest, Hungary). Villus height and crypt depth were measured based on 10 appearance-intact villi and crypt per specimen with Image-pro plus 6.0 (Media Cybernetics, Inc., Bethesda, MD, USA). The villus height and crypt depth refer to the distance from the top of the villus to the crypt opening and the distance from the crypt opening to the base, respectively.

2.7. Microbial Genomic DNA Extraction and Quantification

The genomic DNA of microbes in the intestinal contents and mucosa of piglets were extracted with Aidlab Stool DNA kit (Aidlab Biotech, Beijing, China). The qPCR was performed to quantify the total bacteria number using bacteria-specific primer 5′-CGGYCCAGACTCCTACGGG-3′ and primer 5′-TTACCGCGGCTGCTGGCAC-3′ (10 µM) [38], and the total number of E. faecium using E. faecium-specific primers 5′-TTGAGGCAGACCAGATTGACG-3′ and 5′-CGGAAGTGATGCTTCCTACTG-3′ [39]. The qPCR was carried out in 10 µL reaction mixtures consisting of 1 µL DNA, 0.5 µL of each primer (10 µmol), and 5 µL of universal SYBR qPCR Master Mix (2×) (Accurate Bio-Medical Co., Ltd., Changsha, China). These primers were used to generate amplicon from Escherichia coli and E. faecium HDRsEf1, respectively, which was subsequently cloned into pMD-18T vector (Takara Bio, Otsu, Japan). The 10-fold serial dilution of plasmid with known concentration was used as a standard for qPCR analysis to determine bacteria copy numbers in samples.

2.8. Analysis of Serum Inflammatory Factors

The concentrations of inflammatory factors (including IL-4, IL-6, IL-8, IL-10, IL-12, IFN-γ, TGF-β1) in serum were determined by Quantibody Porcine Cytokine Array kits (RayBiotech, Inc., Atlanta, GA, USA) in accordance with the manufacturer’s protocol.

2.9. Statistical Analysis

Differences were determined with Student’s t-test by the application of GraphPad Prism 8.0 (GraphPad Software, Inc., San Diego, CA, USA). If there are no additional instructions, our data are shown as mean ± SEM. For all tests, p-value < 0.05 represents significant differences among groups.

3. Results

3.1. High-Throughput Sequencing Data

A total of 2,909,872 high-quality sequences were obtained from 60 samples, with an average length of 419 bp. The rarefaction curves tended to be flat, indicating that the current sequencing amount could cover most species in these samples. According to a 97% sequence similarity, these sequences were clustered into 2866 OTUs, and then divided into 45 phyla, 94 classes, 195 orders, 352 families, and 743 genera.

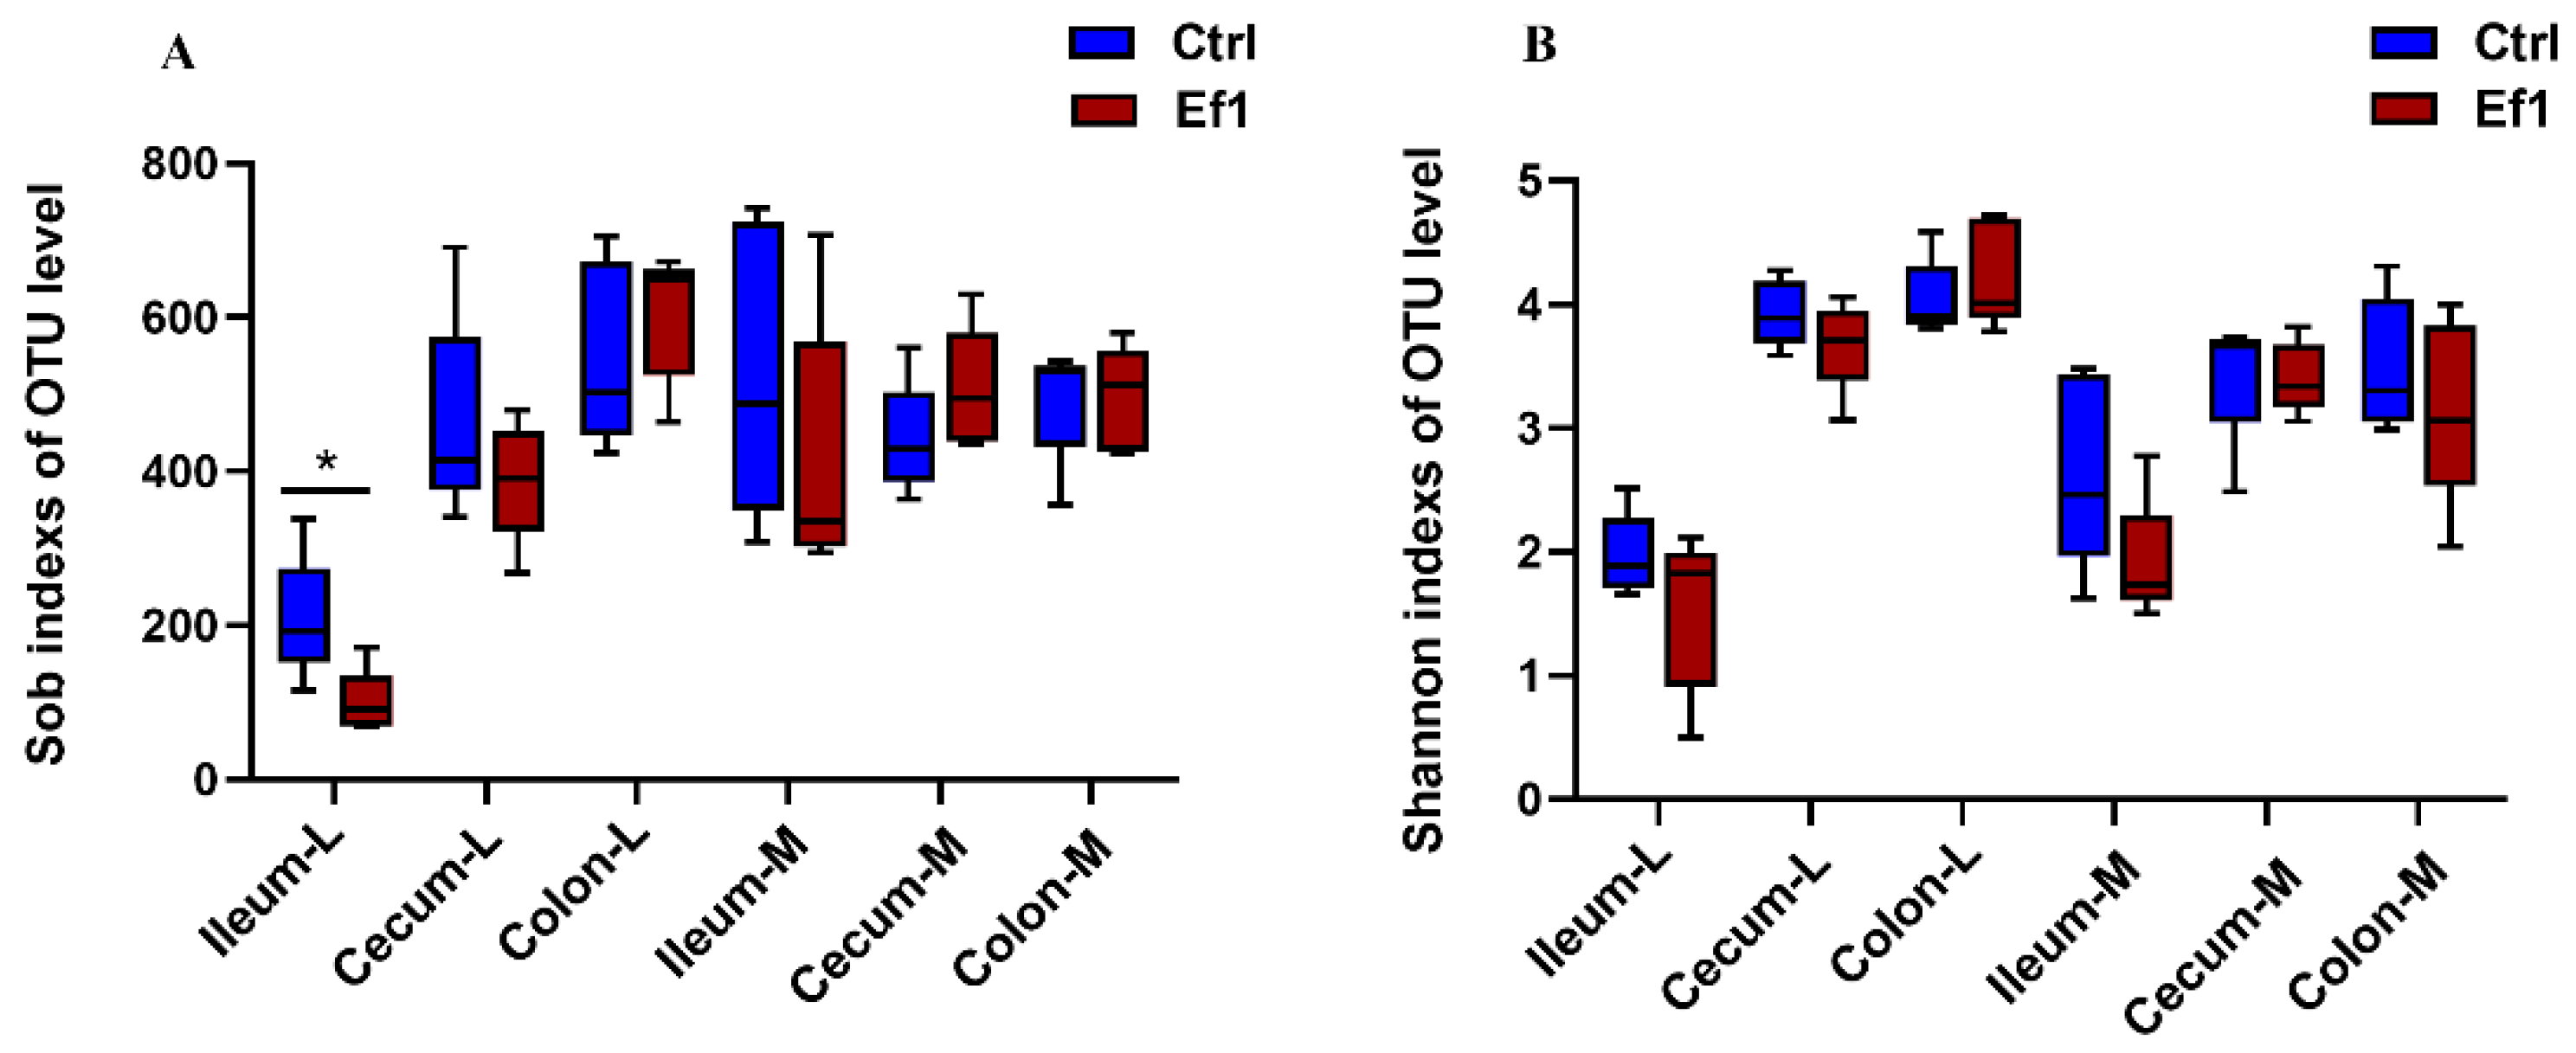
3.2. Effects of HDRsEf1 on Microbial Alpha Diversity in Different Niches

The α diversity indices (sob index and Shannon index) were significantly increased in the colonic luminal contents and cecal luminal contents compared with the ileal luminal contents, while no significant difference of α diversity index was found in the corresponding mucosa (Figure S1A,B). The sob index in ileal luminal contents was significantly decreased by HDRsEf1 administration, while other niches were not affected (Figure 1A,B).

3.3. Effects of HDRsEf1 on Total Bacterial Load in Different Gut Niches

To investigate the impact of HDRsEf1 on the total bacterial load in the intestine, qPCR was used to detect the 16S rRNA gene copy number of bacteria in different niches. It was shown that the total bacterial load increased from the small intestine to the large intestine and from the mucosa to lumen contents (Figure 2A). In addition, the 16S rRNA gene copy number of ileal luminal contents was significantly decreased in the HDRsEf1 group compared with the control group, while there was no significant difference in other niches (Figure 2A). Furthermore, the significantly lower number of 16S rRNA gene copies was confirmed by the decreased number of OTUs, with only 255 OTUs in the HDRsEf1 group while 545 OTUs in the control group identified in ileal luminal contents. (Figure 2B). Taken together, these results indicated that HDRsEf1 could effectively inhibit the growth of microorganisms in ileal luminal contents. In order to verify the colonization of HDRsEf1 in the intestinal tracts, the number of E. faecium in intestinal contents was detected with qPCR. The number of E. faecium was significantly increased in the ileum, cecum, and colon compared with the control group (Figure 2C), indicating that HDRsEf1 could colonize in the intestine successfully. Moreover, it was shown that E. faecium colonizes in the intestine with an extremely low abundance (1/100,000~1/1,000,000) (Figure 2D).

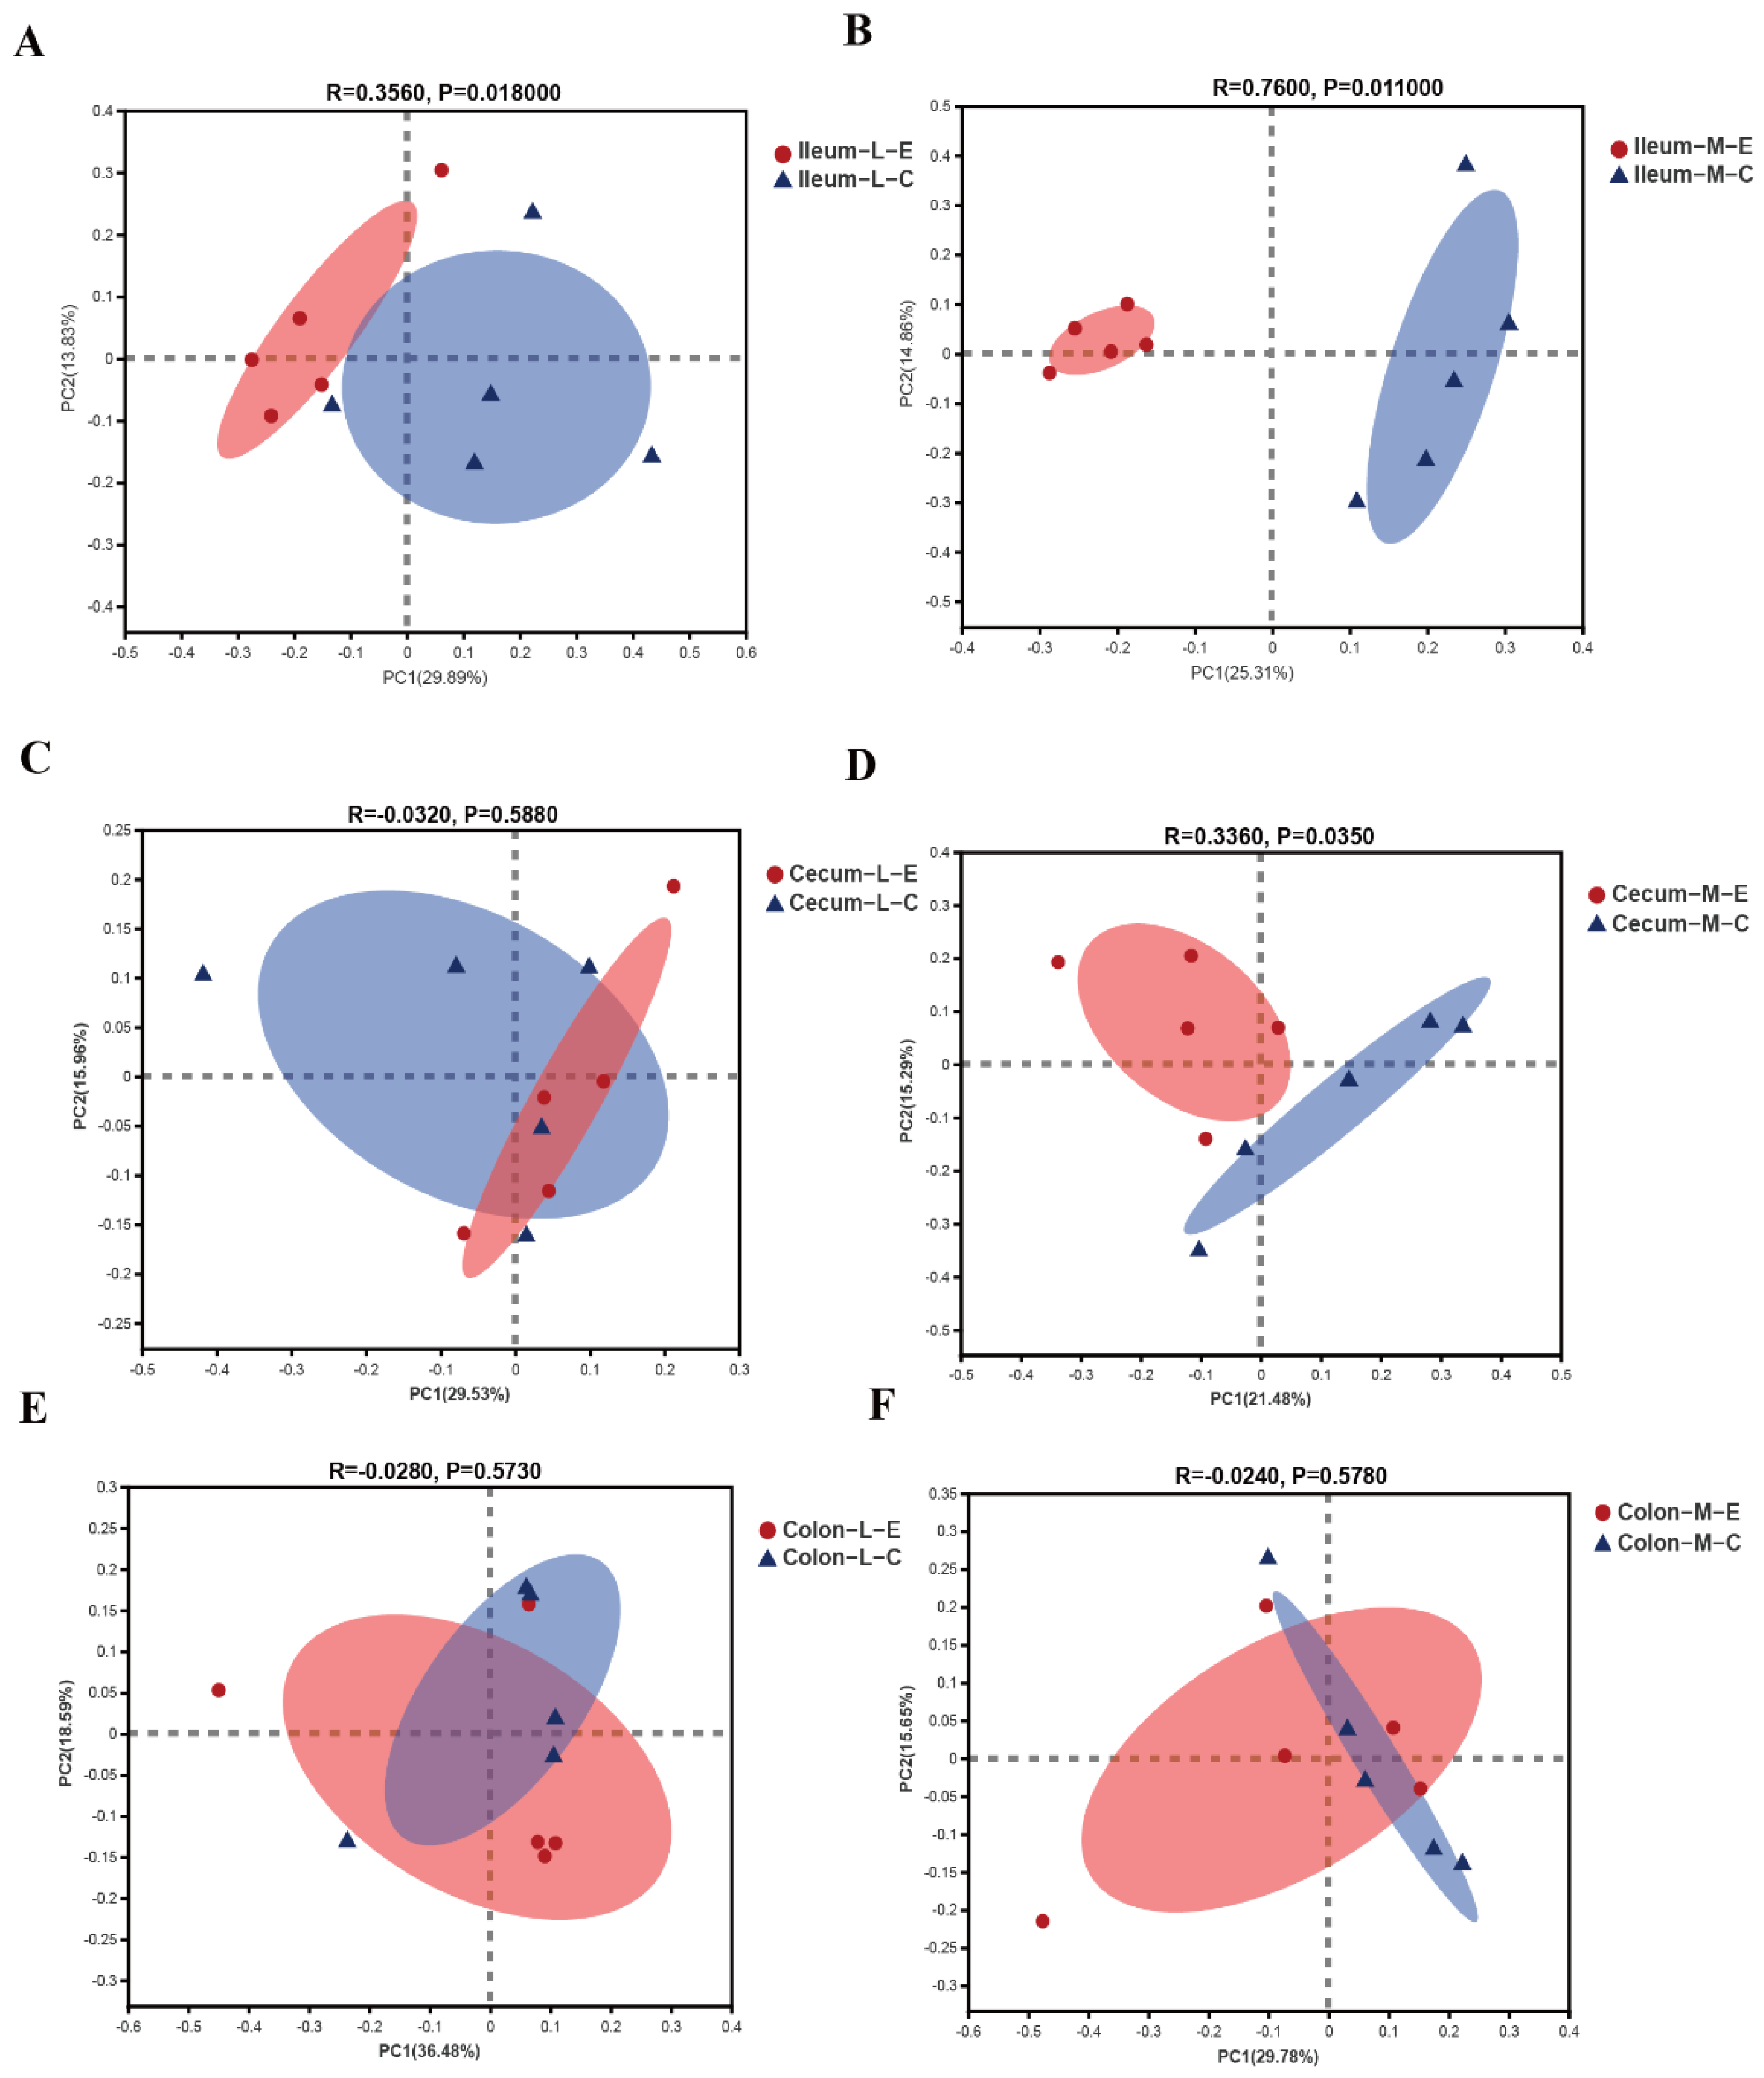
3.4. Effects of HDRsEf1 on Microbial Beta Diversity in Different Niches

A PCoA plot based upon unweighted principal coordinates (Figure 3) and weighted principal coordinates (Figure S2) was used to analyze the β-diversity of microbiota, an ANOSIM analysis was also used to confirm the difference between the control group and HDRsEf1 group (Table 1). In general, gut microbiota in different gut niches responded differently to HDRsEf1. A clear separation of the microbiota community structure was found between the HDRsEf1 group and the control group in the ileum, especially in the ileal mucosa (Figure 3A,B and Figure S2B). Moreover, cecal microbiota did not separate between different groups except for the mucosal microbiota in the unweighted PCoA plot (Figure 3C,D and Figure S2C,D). In contrast, colonic microbiota, neither from luminal contents nor mucosa, showed separate between the control group and HDRsEf1 group (Figure 3E,F and Figure S2E,F).

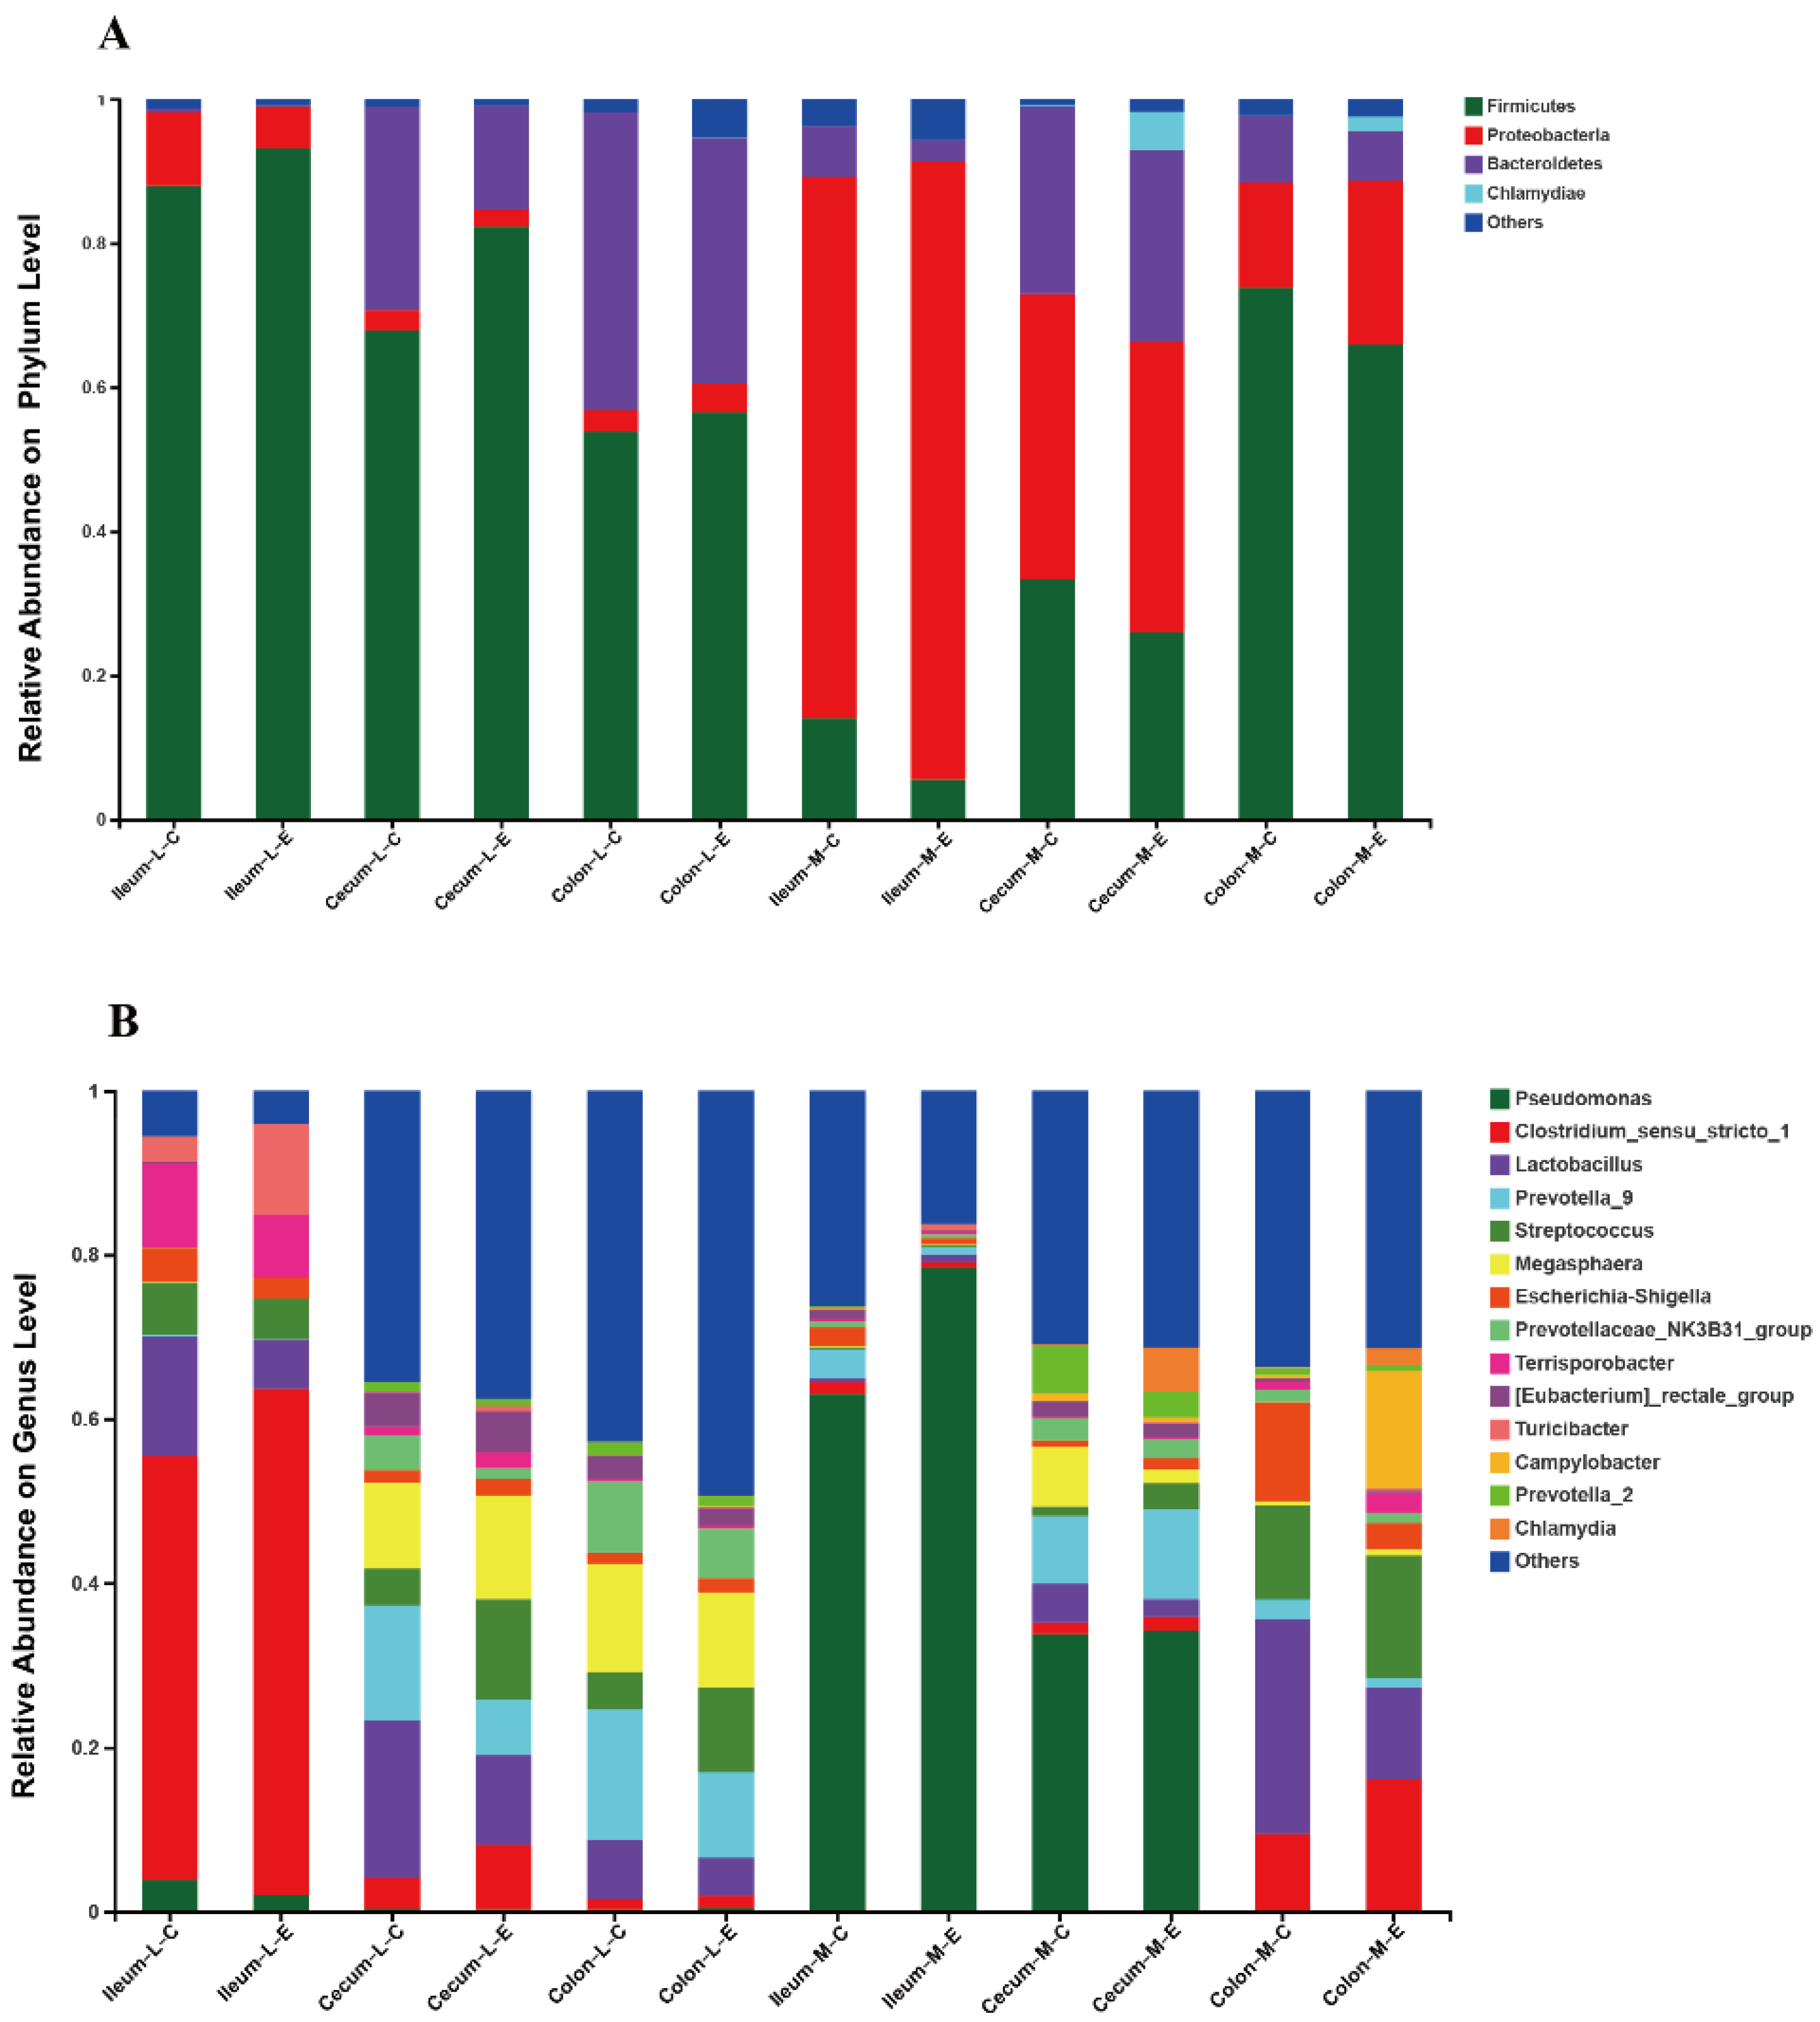
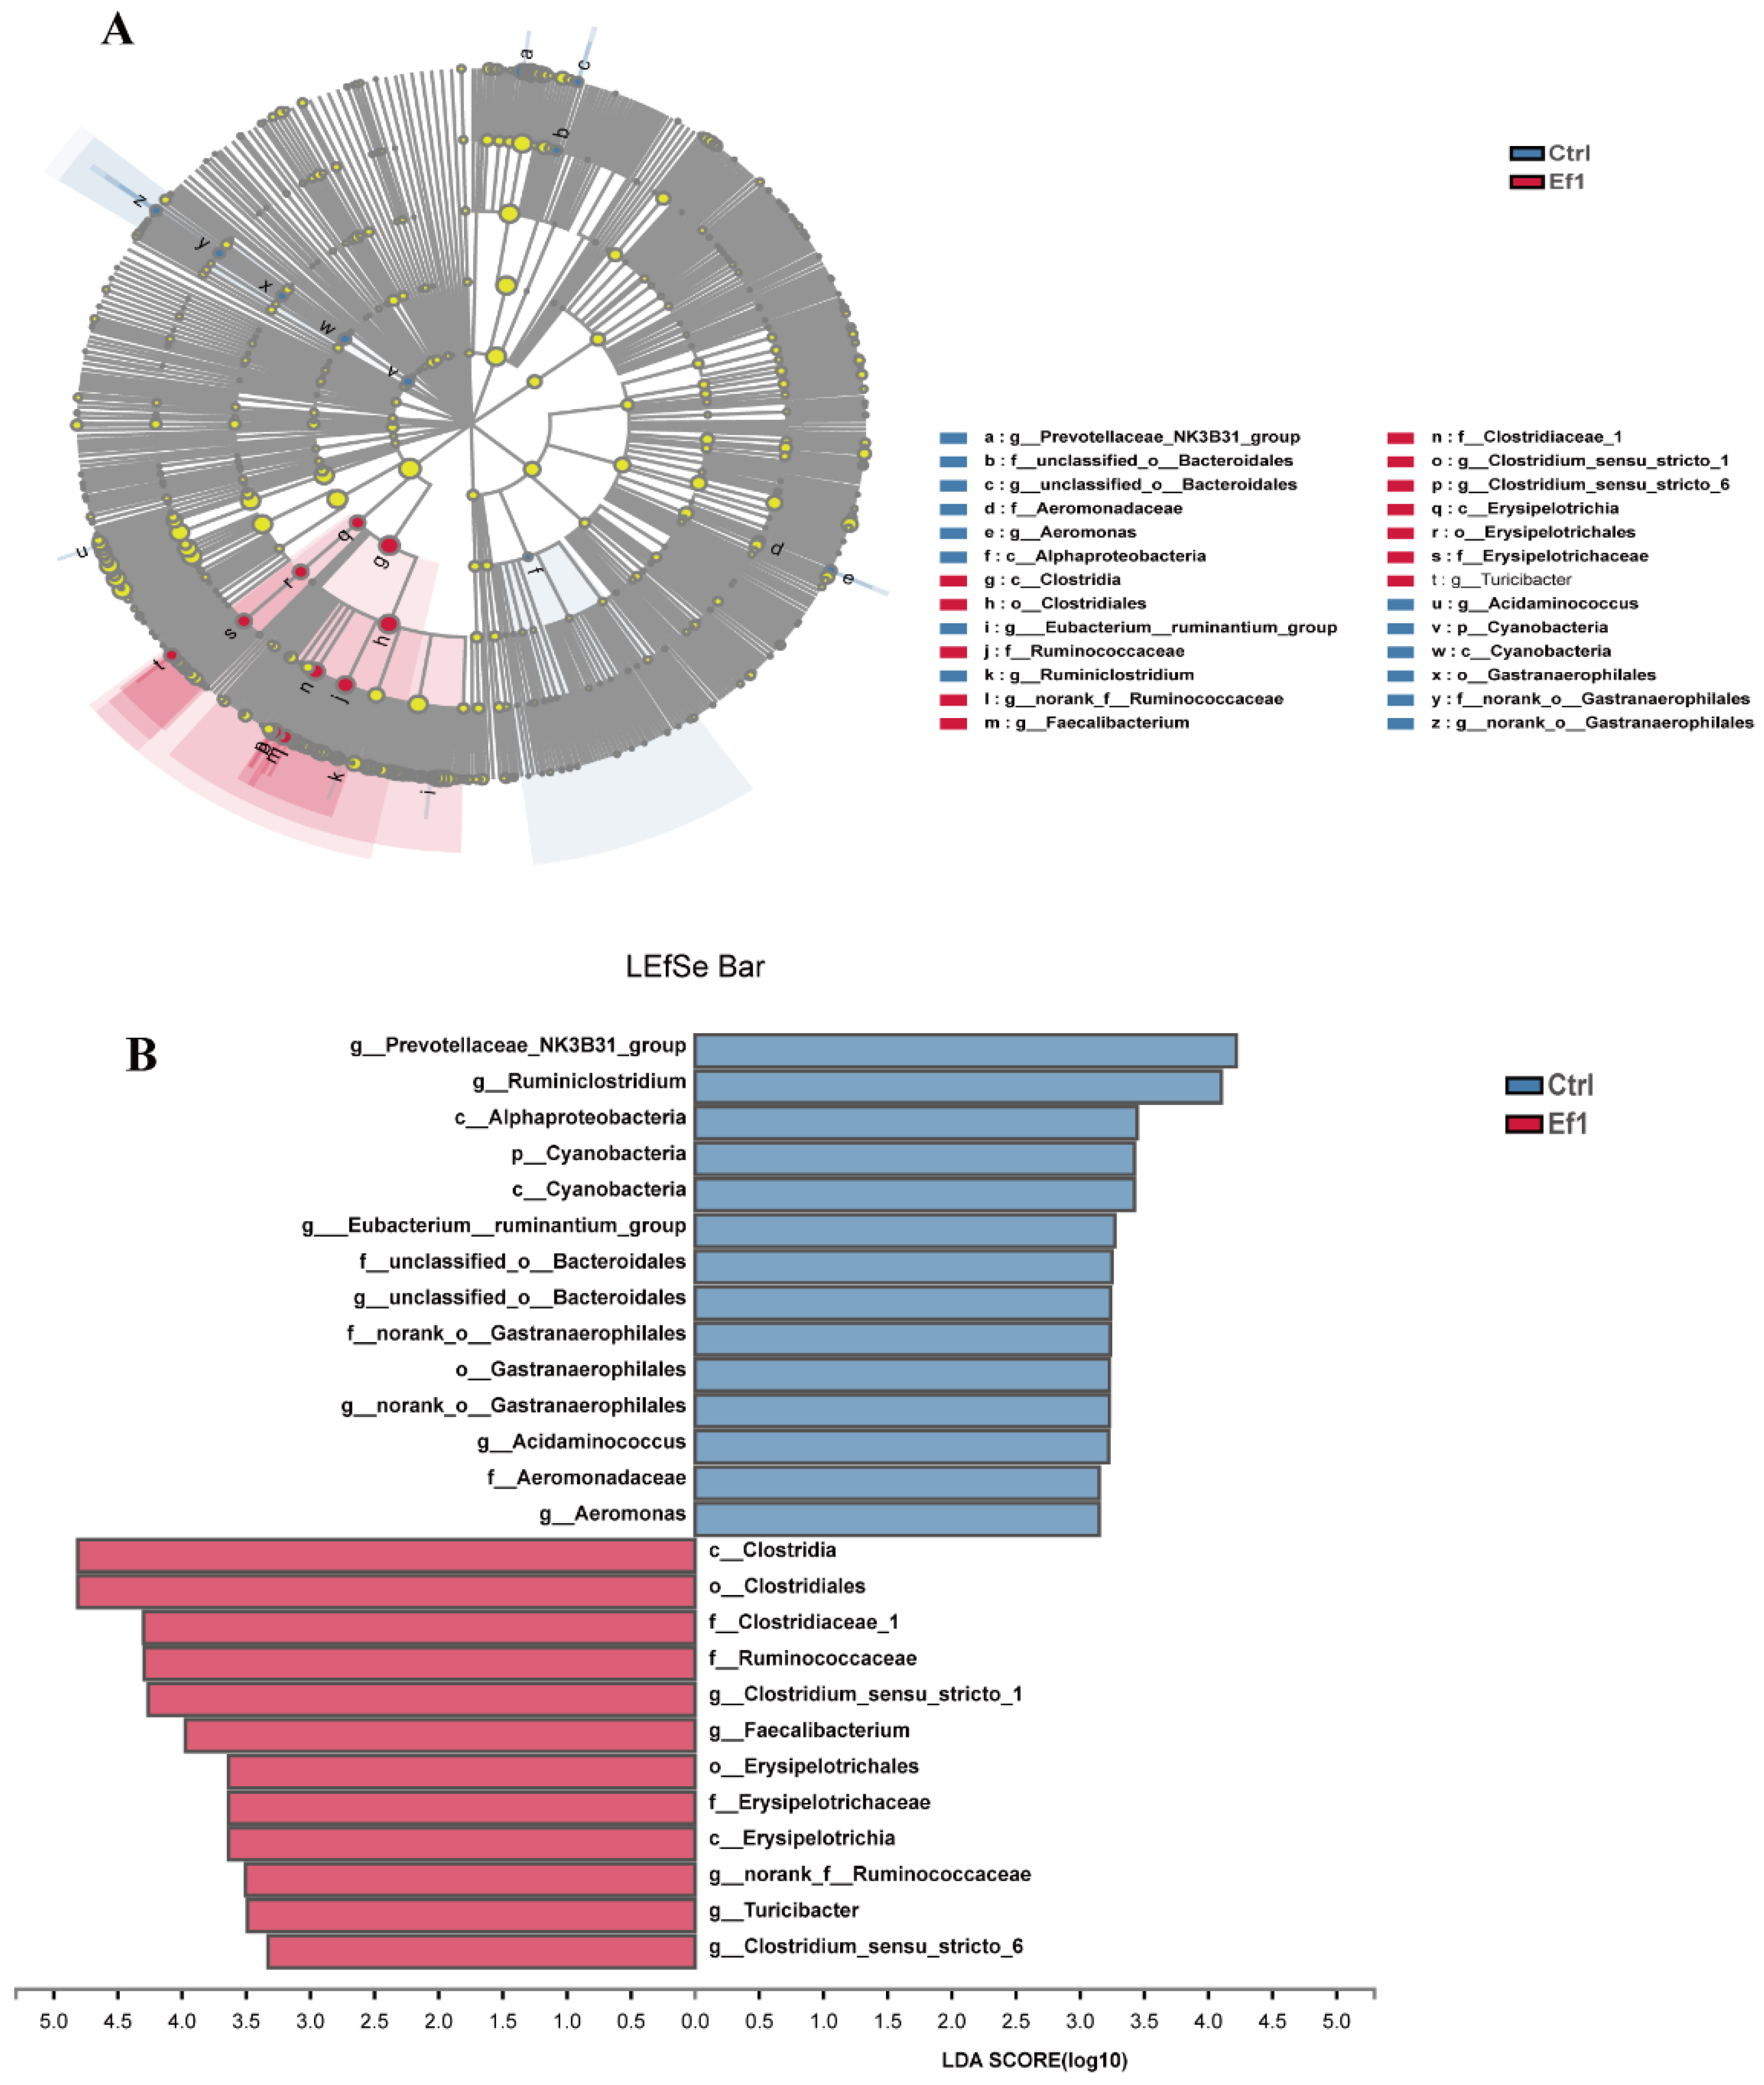
3.5. Effects of HDRsEf1 on Microbiota Composition in Different Niches

In general, the microbiota across all gut niches were dominated by Firmicutes, Proteobacteria, and Bacteroidetes. At the genus level, the microbiota was mainly composed of Pseudomonas, Escherichia-Shigella (belonging to Proteobacteria), Lactobacillus, Clostridium-sensu-stricto-1, Streptococcus (belonging to Firmicutes), and Prevotella-9, prevotella-NK3B31, prevotella-2, Megasphaera (belonging to Bacteroides). In luminal contents, through the ileum–cecum–colon, the relative abundances of Firmicutes and Proteobacteria were decreased, while the relative abundance of Bacteroidetes increased. In contrast, in the mucosa, the relative abundance of Firmicutes increased gradually from the ileum to the cecum and to the colon, while the relative abundance of Proteobacteria reduced. In addition, the relative abundance of Proteobacteria in the intestinal mucosa was significantly higher than intestinal contents (Figure 4A,B)
In this study, it was found that the microbial composition was changed greatly by HDRsEf1 administration. In the ileal mucosa, the relative abundances of 13 genera were significantly decreased (including Prevotella-9, Escherichia-Shigella, Vibro), while the relative abundances of two genera (K- Norank, Herminiimonas) were significantly increased with HDRsEf1 administration (Figure 5A). In ileal luminal contents, the relative abundance of Lactobacillus was significantly decreased with HDRsEf1 administration (Figure 5B). In the cecal mucosa, the relative abundances of four genera (Megasphaera, Phascolarctobacterium, norank-f-Bacteroidales-S24-7-group, Rikenellaceae-RC9-gut-group) were significantly decreased in the HDRsEf1 group, while the relative abundances of Vibrio and Moritella increased (Figure 5C). Importantly, in cecal contents, the relative abundances of five genera (Streptococcus, Faecalibacterium, Turcicibacter, Clostridium-sensu-stricto-6, Norank-F-Ruminococcaceae), which all belong to Clostridia, were significantly increased, while the relative abundance of the Prevotellaceae-NK3B31-Group was significantly decreased with HDRsEf1 administration (Figure 5D).
To confirm the difference of intestinal microbiota between the control group and HDRsEf1 group, a Linear discriminant analysis (LDA) and effect size analysis (LefSe) were performed. It was shown that the effects of HDRsEf1 on microbial composition were mainly concentrated in the ileal mucosa and cecal lumen contents. In the ileal mucosa, the relative abundances of numerous taxa were decreased by HDRsEf1 administration, which were mainly enriched in Firmicutes, Bacteroides, and a part of Proteobacteria (Figure S3). In cecal luminal contents, the relative abundances of Clostridia and Erysipelotrichia in the HDRsEf1 group were significantly increased in the HDRsEf1 group. At the genus level, the relative abundances of Clostridium-sensu-stricto-1, Clostridium-sensu-stricto-6, Faecalibacterium (all belong to Clostridia), and Tuncibacter (belong to Erysipelotrichia) were elevated in the HDRsEf1 group while the relative abundances of Prevotellaceae-NK3B31-Group, unclassed-o-bacteroidales, and norank-o-Gastranaerophilales were increased in the control group (Figure 6).

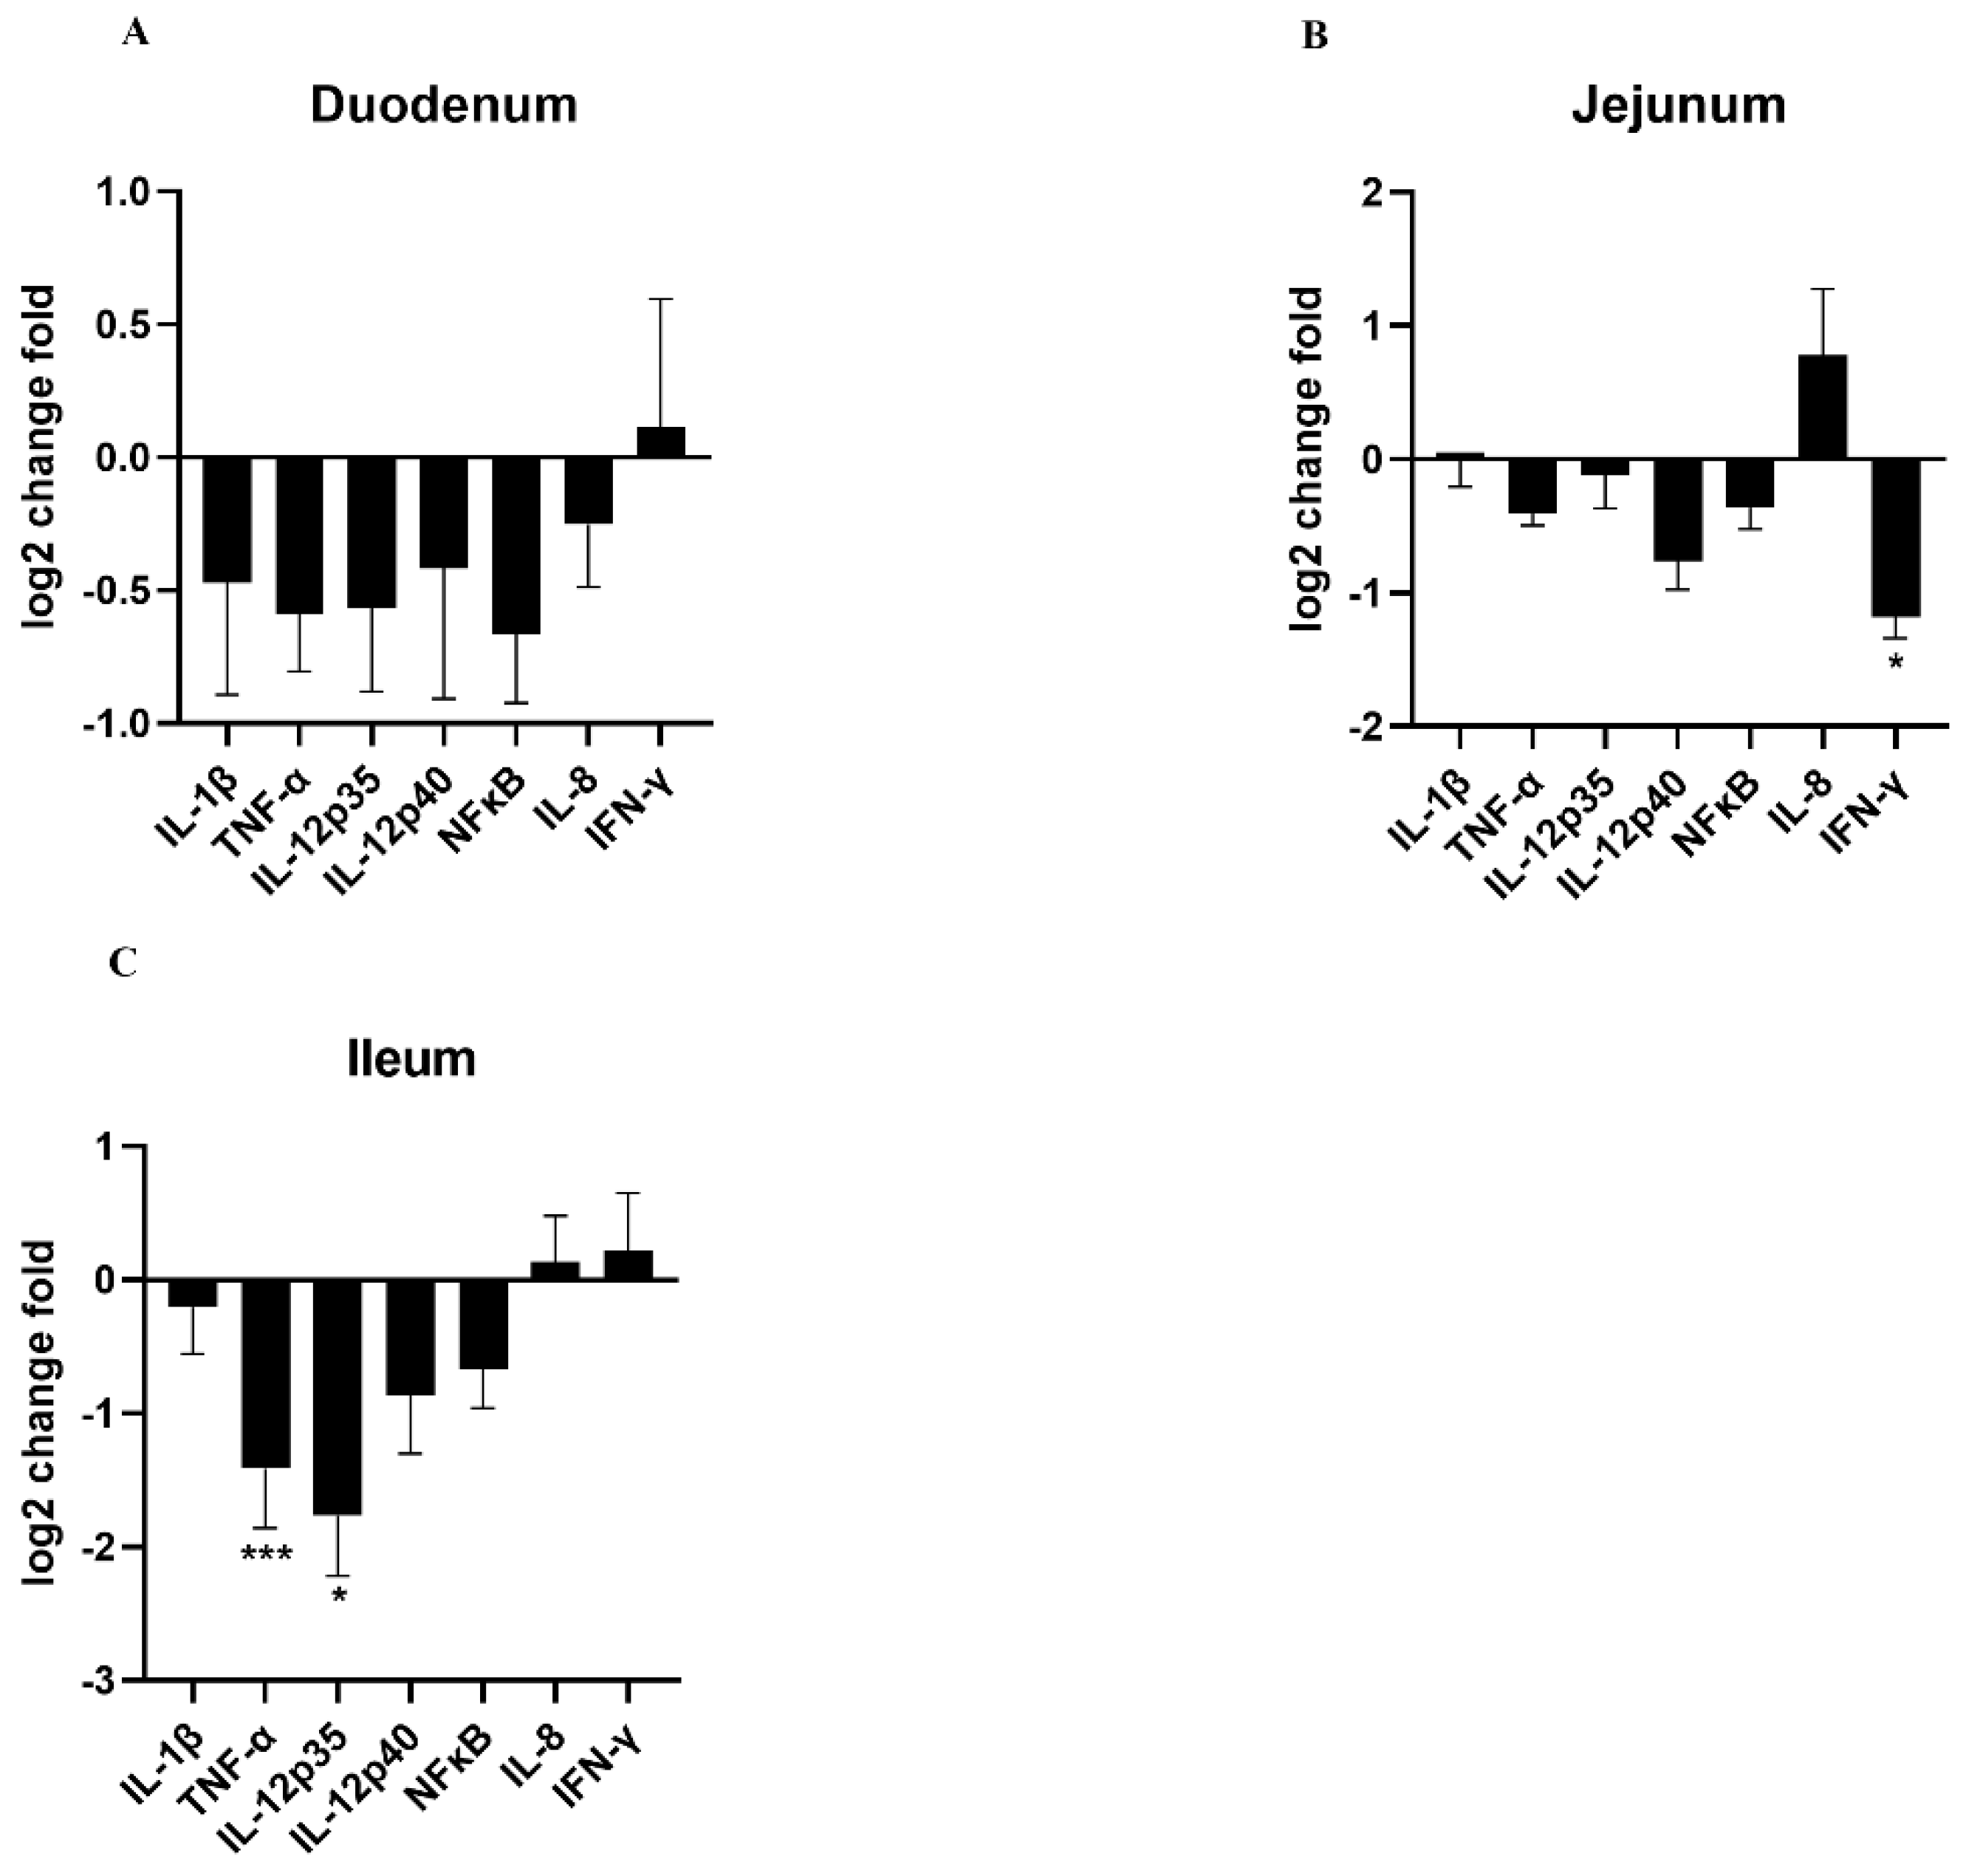
3.6. Effects of HDRsEf1 on Intestinal Inflammation

It is well known that weaning stress could cause excessive intestinal inflammation, which could contribute to intestinal injury and diarrhea. To understand the anti-inflammatory effect of HDRsEf1 on piglets, the inflammatory factors in the mucosa of the small intestine and serum were measured and the morphology of the small intestine was analyzed. In this study, the expression of TNF-α, IL-12p35 in the ileum and IFN-γ in the duodenum significantly decreased in the HDRsEf1 group compared with the control group (Figure 7A–C). Moreover, in agreement with intestinal samples, piglets in the HDRsEf1 group exerted a significantly lower expression of IL-12 and IFN-γ in serum samples compared with the control group (Figure 8A,B). Moreover, HDRsEf1 significantly increased the villus height in the jejunum and the villus height to the crypt depth ratio in duodenal (Figure S4A–D). Taken together, these results indicated that HDRsEf1 could effectively alleviate inflammatory responses and improved the intestine morphology of piglets.

3.7. Correlation Analysis of Gut Microbiota Alterations and Inflammatory Responses

To further investigate whether the changes of inflammatory responses were correlated with the change of gut microorganisms, we studied the correlation between inflammatory cytokine expression, the height of intestinal villi, daily body weight gain, and gut microorganisms that were significantly affected by HDRsEf1 from the phylum to genus level. The correlation analysis showed that the relative abundances of Enterobacteriaceae and Escherichia-Shigella in the ileum mucosa were significantly negatively correlated with the villus height of the small intestine (Figure 9A and Figure S5A). The relative abundances of Clostridiaceae-1, Rumencoccidae, and Erysipelotrichaceae in cecum contents were significantly negatively correlated with the expression of inflammatory factors (Figure 9B). In Clostridiaceae-1, the relative abundances of Clostridium-sensu-stricto-1 were significantly negatively correlated with inflammatory factors IL-12, IL-6 and IFN-γ in serum and the relative abundance of Faecalibacterium was significantly positively correlated with body weight and villus height (Figure S5B). However, there was no correlative relationships between gut microorganism’s alterations and inflammatory responses in other inches.

4. Discussion

Post-weaning diarrhea in piglets frequently causes serious complications and is associated with enteric infections due to the overuse of antibiotics [1]. Probiotics supplements have promising effects on gut microbiota and have been commonly fed to improve the growth performance of weaned piglets [4,40]. Previous studies have shown that HDRsEf1 could significantly reduce the incidence of diarrhea of piglets [6]. However, the effects of HDRsEf1 on gut microbiota in weaned piglets are poorly understood. In this study, we investigated the effects of HDRsEf1 on gut microbiota in six different ecological niches: luminal contents and the mucosa of the ileum, cecum, and middle colon. In addition, we analyzed the effects of HDRsEf1 on intestinal development and inflammatory responses in piglets. It was shown that the use of HDRsEf1 significantly altered the composition of microbiota in the ileum and cecum. At the same time, these changes of gut microbiota were correlated with the improvement of intestinal development and the suppression of inflammation.
Many studies have shown that probiotics could play a beneficial role by affecting gut microbiota [20,41]. In this study, the utilization of HDRsEf1 significantly reduced the α diversity and total bacterial load in ileum contents. These results demonstrated for the first time that Enterococcus faecium could decrease the number of microorganisms in the small intestine of piglets. Probably, these effects can be attributed to the ability of E. faecium to secrete bacteriocin, organic acid, and other bactericidal substances [42]. Nutrients are mainly absorbed in the small intestine, and microorganisms in small intestine, especially ileum, are competitive with the host in nutrient absorption [43,44]. It has been proposed that the reduction in the microbial competition for nutrients and harmful microbial metabolites in the small intestine is the primary mechanism by which antibiotics improve animal performance [18,43]. HDRsEf1 plays a role such as antibiotics in inhibiting the growth of small intestinal microorganisms, which might be one of the mechanisms of HDRsEf1 that improved the performance of piglets.
The analysis of PCoA and ANOSIM further revealed that HDRsEf1 significantly affected the microbiota community structure of the ileum, while it had no significant effect on the colon. Probably, it was due to the higher diversity of cecal and colonic microbiota, which cumulatively contributed to the stability of the microbiota community. In addition, it was found that the relative abundance of E. faecium in the intestine was extremely low (1/100,000~1/1,000,000), which indicated, again, that E. faecium played a role by regulating gut microbiota.
In this study, the relative abundance of Escherichia-shigella in the ileal mucosa was reduced with the utilization of HDRsEf1, which was consistent with previous studies that E. faecium could alleviate the infection caused by pathogenic Escherichia coli [45,46]. In pig breeding, Escherichia coli is an important opportunistic pathogen in newborn and weaned piglets, which can cause diarrhea, dehydration, growth retardation, and death of piglets [47,48,49,50]. In addition, due to the abuse of antibiotics, the drug resistance of Escherichia coli is seriously increasing, which has posed a serious threat to the breeding industry and public health [51]. Some strains of Escherichia coli, such as enterotoxin-producing Escherichia coli (ETEC), could adhere to specific receptors of the ileal mucosa, damage the intestinal barrier, decrease the intestinal villi height and change the intestinal morphology [52,53]. Our data were coincident with these results. The utilization of HDRsEf1 enhanced the height of intestinal villi and reduced inflammatory factors in the intestinal mucosa. The increased intestinal villous height was negatively correlated with the relative abundance of Escherichia-Shigella in the ileal mucosa, indicating that E. faecium could improve the intestinal development and growth of piglets by inhibiting the growth of Escherichia-shigella.
In cecal luminal contents, the microorganisms in Clostridiales in the HDRsEf1 group were significantly increased, including Clotridiaceae-1 and Ruminococcaceae in the family level and Clotridium-sensu-stricto-6, Clotridium-sensu-stricto-1, and Faeccalibacterium in the genus level, which all are short-chained fatty acids (SCFA) producing taxa. It has been reported that Clostridium plays a key role in butyrate production, by which it can induce the production of Treg CD4+ T cells and play an anti-inflammatory role [54,55]. Some studies also reported that Faecalibacterium prausnitzii could attenuate the activation of the inflammatory pathway by producing butyrate, which could maintain the intestinal health [56]. The weaning piglets were often accompanied by an excessive inflammatory response, which might lead to both epithelial barrier dysfunction and diarrhea [57]. In this study, HDRsEf1 decreased the expression of IL-12p70 and IFN-γ in serum. Through a correlation analysis, the elevated relative abundances of Clostridiaceae-1, Rumencoccidae, Erysipelotrichaceae, and Clotridium-sensu-stricto-1 in cecum contents were negatively correlated with the level of inflammatory factors IL-12, IL-6 and IFN-γ. The enhanced abundance of Faecalibactrium was positively correlated with body weight gain and villus height. A possible reason is that these taxa induced an immune tolerance and promoted the intestinal health through the production of butyrate. Although HDRsEf1 alone did not produce SCFAs, HDRsEf1 expanded intestinal butyrate-producing bacteria, which indicated that HDRsEf1 indirectly increased the production of SCFAs and down regulated inflammation. In the next step, we would explore the effects of HDRsEf1 on gut microbiota from a metabolism perspective and verify our results by germ-free animals.
In summary, this experiment provided the evidence that E. faecium HDRsEf1 could effectively alter gut microbiota and the alteration in different niches of intestine was obviously different, thereby alleviating inflammation and improving the intestinal morphological development in weaned piglets. The response of microbiota in the foregut and cecum has been rarely studied in either humans or animals. To fully unveil the response of intestinal microbiota to probiotics, the research on microbiota in different intestine segments is more recommended. Taken together, this study provided an insight into the mechanism of E. faecium in piglets and provided a reference for probiotics for humans and animals.

Supplementary Materials

The following are available online at https://www.mdpi.com/article/10.3390/microorganisms9081767/s1, Figure S1: Alpha diversity of microbiota in different niches of piglets. (A) Sobs index, (B) Shannon index. L, luminal contents; M, mucosa, Figure S2: weighted principal coordinates (PCoA) of microbiota in different inches. (A) Ileal luminal contents. (B) Ileal mucosa. (C) Cecal luminal contents. (D) Cecal mucosa. (E) Colonic luminal contents. (F) Colonic mucosa. M, mucosa; C, control; E, Enterococcus faecium HDRsEf1, Figure S3: LefSe analysis and LDA score of microbial community in ileal mucosa from control groups and HDRsEf1 group. (A) Cladogram revealed the microbial taxa with significant differences between the control group and HDRsEf1 group from phyla to genus. The red and blue nodes represent microbial taxa that were enriched in the HDRsEf1 group and the control group, respectively. (B) Microbial taxa with LDA score greater than 2.0, the length of the histogram represents the LDA score of the taxa with significant difference. n = 5 per group, Figure S4: effects of HDRsEf1 on intestinal morphology. (A) The morphology of duodenum, jejunum, and ileum, respectively. (B–D) Statistical analysis of villus height (µm), crypt depth (µm), and the ratios of villus height (µm) to crypt depth (µm) in duodenum, jejunum, and ileum of weaned piglets. Ctrl, control; Ef1, HDRsEf1. Data are represented as mean ± SEM and median ± interquartile range, n = 5, * p < 0.05, Figure S5: heatmap for correlation analysis between microbiota and villus height or inflammatory responses in ileum mucosa and cecal luminal contents. (A) Microbiota in ileum mucosa at genus level. (B) Microbiota in cecal luminal contents at genus level. Red box, microorganisms with significant difference between HDRsEf1 group and control group. * p < 0.05, ** p < 0.01, Table S1: the primer sequences for RT-qPCR.

Author Contributions

Conceived and designed the experiments: D.S., Y.X. and J.Z. Performed the experiments: J.Z., J.L., Q.X., X.W. and Z.Z. Analyzed the data: J.Z. and S.Y. Manuscript preparation: J.Z. and D.S. All authors read and approved the final version of the manuscript reported. All authors have read and agreed to the published version of the manuscript.

Funding

This work was supported by the Fundamental Research Funds for the Central Universities (2662019PY060) and the National Key Research and Development Program of China (2018YFD0501802).

Institutional Review Board Statement

The study was conducted according to the guidelines of the declaration of Helsinki, and approved by the Ethics Committee of Huazhong Agricultural University, Wuhan, China, under permit No. HZAUSW2018-018 (2018).

Informed Consent Statement

Not applicable.

Data Availability Statement

The sequences used in this manuscript were submitted to NCBI-SRA under the BioProject accession number PRJNA694358.

Acknowledgments

The authors thank Huazhen Liu and Muhammad Akhtar for editing the manuscript.

Conflicts of Interest

The authors declare no conflict of interest.

References

  1. Lalles, J.P.; Bosi, P.; Smidt, H.; Stokes, C.R. Nutritional management of gut health in pigs around weaning. Proc. Nutr. Soc. 2007, 66, 260–268. [Google Scholar] [CrossRef] [PubMed]
  2. Looft, T.; Johnson, T.A.; Allen, H.K.; Bayles, D.O.; Alt, D.P.; Stedtfeld, R.D.; Sul, W.J.; Stedtfeld, T.M.; Chai, B.; Cole, J.R.; et al. In-feed antibiotic effects on the swine intestinal microbiome. Proc. Natl. Acad. Sci. USA 2012, 109, 1691–1696. [Google Scholar] [CrossRef] [Green Version]
  3. Casewell, M.; Friis, C.; Marco, E.; McMullin, P.; Phillips, I. The European ban on growth-promoting antibiotics and emerging consequences for human and animal health. J. Antimicrob. Chemother. 2003, 52, 159–161. [Google Scholar] [CrossRef] [PubMed] [Green Version]
  4. Kenny, M.; Smidt, H.; Mengheri, E.; Miller, B. Probiotics—Do they have a role in the pig industry? Animal 2011, 5, 462–470. [Google Scholar] [CrossRef] [PubMed] [Green Version]
  5. Franz, C.M.A.P.; Huch, M.; Abriouel, H.; Holzapfel, W.; Gálvez, A. Enterococci as probiotics and their implications in food safety. Int. J. Food Microbiol. 2011, 151, 125–140. [Google Scholar] [CrossRef] [Green Version]
  6. Shi, D.; Xiao, Y.; Bi, D.; Xiong, Y.; Wang, X.; Gao, X.; Li, Z.; Zhou, Z.; Liu, M.; Xu, Q.; et al. A Beneficial Enterococcus Faecium Strain’s Screening and Application. China Patent ZL201,110,452,087.2, 11 November 2013. [Google Scholar]
  7. Klingspor, S.; Martens, H.; Caushi, D.; Twardziok, S.; Lodemann, U. Characterization of the effects of Enterococcus faecium on intestinal epithelial transport properties in piglets. J. Anim. Sci. 2013, 91, 1707–1718. [Google Scholar] [CrossRef]
  8. Lodemann, U.; Hübener, K.; Jansen, N.; Martens, H. Effects of Enterococcus faecium NCIMB 10415 as probiotic supplement on intestinal transport and barrier function of piglets. Arch. Anim. Nutr. 2006, 60, 35–48. [Google Scholar] [CrossRef] [PubMed]
  9. Bednorz, C.; Guenther, S.; Oelgeschlager, K.; Kinnemann, B.; Pieper, R.; Hartmann, S.; Tedin, K.; Semmler, T.; Neumann, K.; Schierack, P. Feeding the Probiotic Enterococcus faecium Strain NCIMB 10,415 to Piglets Specifically Reduces the Number of Escherichia coli Pathotypes That Adhere to the Gut Mucosa. Appl. Environ. Microbiol. 2013, 79, 7896–7904. [Google Scholar] [CrossRef] [PubMed] [Green Version]
  10. Pollmann, M.; Nordhoff, M.; Pospischil, A.; Tedin, K.; Wieler, L.H. Effects of a Probiotic Strain of Enterococcus faecium on the Rate of Natural Chlamydia Infection in Swine. Infect. Immun. 2005, 73, 4346–4353. [Google Scholar] [CrossRef] [Green Version]
  11. Scharek, L.; Guth, J.; Reiter, K.; Weyrauch, K.D.; Taras, D.; Schwerk, P.; Schierack, P.; Schmidt, M.F.G.; Wieler, L.H.; Tedin, K. Influence of a probiotic Enterococcus faecium strain on development of the immune system of sows and piglets. Vet. Immunol. Immunopathol. 2005, 105, 151–161. [Google Scholar] [CrossRef]
  12. Capcarova, M.; Weiss, J.; Hrncar, C.; Kolesarova, A.; Pal, G. ORIGINAL ARTICLE: Effect of Lactobacillus fermentum and Enterococcus faecium strains on internal milieu, antioxidant status and body weight of broiler chickens. J. Anim. Physiol. Anim. Nutr. 2010, 94, e215–e224. [Google Scholar] [CrossRef]
  13. Fouhse, J.M.; Gao, J.; Vasanthan, T.; Izydorczyk, M.; Beattie, A.D.; Zijlstra, R.T. Whole-Grain Fiber Composition Influences Site of Nutrient Digestion, Standardized Ileal Digestibility of Amino Acids, and Whole-Body Energy Utilization in Grower Pigs. J. Nutr. 2017, 147, 29–36. [Google Scholar] [CrossRef] [PubMed]
  14. Buffie, C.G.; Pamer, E.G. Microbiota-mediated colonization resistance against intestinal pathogens. Nat. Rev. Immunol. 2013, 13, 790–801. [Google Scholar] [CrossRef] [Green Version]
  15. Abreu, M.T.; Fukata, M.; Arditi, M. TLR Signaling in the Gut in Health and Disease. J. Immunol. 2005, 174, 4453–4460. [Google Scholar] [CrossRef] [PubMed] [Green Version]
  16. Zeissig, S.; Blumberg, R.S. Life at the beginning: Perturbation of the microbiota by antibiotics in early life and its role in health and disease. Nat. Immunol. 2014, 15, 307–310. [Google Scholar] [CrossRef] [PubMed]
  17. Anderson, D.; McCracken, V.; Aminov, R.; Simpson, J.M.; Mackie, R.; Verstegen, M.; Gaskins, H.R. Gut microbiology and growth-promoting antibiotics in swine. Nutr. Abstr. Reviews. Ser. B Livest. Feeds Feed 2000, 70, 101–108. [Google Scholar]
  18. Dibner, J.J.; Richards, J.D. Antibiotic Growth Promoters in Agriculture: History and Mode of Action. Poult. Sci. 2005, 84, 634–643. [Google Scholar] [CrossRef]
  19. Li, P.; Niu, Q.; Wei, Q.; Zhang, Y.; Ma, X.; Kim, S.W.; Lin, M.; Huang, R. Microbial shifts in the porcine distal gut in response to diets supplemented with Enterococcus Faecalis as alternatives to antibiotics. Sci. Rep. 2017, 7. [Google Scholar] [CrossRef]
  20. Wang, T.; Teng, K.; Liu, Y.; Shi, W.; Zhang, J.; Dong, E.; Zhang, X.; Tao, Y.; Zhong, J. Lactobacillus plantarum PFM 105 Promotes Intestinal Development Through Modulation of Gut Microbiota in Weaning Piglets. Front. Microbiol. 2019, 10, 90. [Google Scholar] [CrossRef]
  21. Yang, S.C.; Lin, C.H.; Sung, C.T.; Fang, J.Y. Antibacterial activities of bacteriocins: Application in foods and pharmaceuticals. Front. Microbiol. 2014, 5, 241. [Google Scholar] [CrossRef] [Green Version]
  22. Takahashi, T.; Sakaguchi, E. Transport of bacteria across and along the large intestinal lumen of guinea pigs. J. Comp. Physiol. B Biochem. Syst. Environ. Physiol. 2006, 176, 173–178. [Google Scholar] [CrossRef]
  23. Martinez-Guryn, K.; Leone, V.; Chang, E.B. Regional Diversity of the Gastrointestinal Microbiome. Cell Host Microbe 2019, 26, 314–324. [Google Scholar] [CrossRef] [PubMed]
  24. Zhang, L.; Wu, W.; Lee, Y.K.; Xie, J.; Zhang, H. Spatial Heterogeneity and Co-occurrence of Mucosal and Luminal Microbiome across Swine Intestinal Tract. Front. Microbiol. 2018, 9, 48. [Google Scholar] [CrossRef] [Green Version]
  25. Looft, T.; Allen, H.K.; Cantarel, B.L.; Levine, U.Y.; Bayles, D.O.; Alt, D.P.; Stanton, T.B. Bacteria, phages and pigs: The effects of in-feed antibiotics on the microbiome at different gut locations. ISME J. 2014, 8, 1566–1576. [Google Scholar] [CrossRef] [Green Version]
  26. Li, Y.; Bruni, L.; Jaramillo-Torres, A.; Gajardo, K.; Kortner, T.M.; Krogdahl, Å. Differential response of digesta- and mucosa-associated intestinal microbiota to dietary insect meal during the seawater phase of Atlantic salmon. Anim. Microbiome 2021, 3, 8. [Google Scholar] [CrossRef]
  27. Kelly, J.; Daly, K.; Moran, A.W.; Ryan, S.; Bravo, D.; Shirazi-Beechey, S.P. Composition and diversity of mucosa-associated microbiota along the entire length of the pig gastrointestinal tract; dietary influences. Environ. Microbiol. 2017, 19, 1425–1438. [Google Scholar] [CrossRef] [PubMed] [Green Version]
  28. Smith, F.; Clark, J.B. Early weaning stress impairs development of mucosal barrier function in the porcine intestine. Am. J. Physiol. Gastrointest. Liver Physiol. 2010, 298, G352–G363. [Google Scholar] [CrossRef] [Green Version]
  29. Zhang, Y.; Wu, Q.; Zhou, M.; Luo, Z.; Lv, L.; Pei, J.; Wang, C.; Chai, B.; Sui, B.; Huang, F.; et al. Composition of the murine gut microbiome impacts humoral immunity induced by rabies vaccines. Clin. Transl. Med. 2020, 10, e161. [Google Scholar] [CrossRef] [PubMed]
  30. Ye, H.; Liu, J.; Feng, P.; Zhu, W.; Mao, S. Grain-rich diets altered the colonic fermentation and mucosa-associated bacterial communities and induced mucosal injuries in goats. Sci. Rep. 2016, 6, 20329. [Google Scholar] [CrossRef] [PubMed] [Green Version]
  31. Edgar, R.C. UPARSE: Highly accurate OTU sequences from microbial amplicon reads. Nat. Methods 2013, 10, 996–998. [Google Scholar] [CrossRef]
  32. Quast, C.; Pruesse, E.; Yilmaz, P.; Gerken, J.; Schweer, T.; Yarza, P.; Glöckner, F.O. The SILVA ribosomal RNA gene database project: Improved data processing and web-based tools. Nucleic Acids Res. 2013, 41, D590–D596. [Google Scholar] [CrossRef]
  33. Schloss, P.D.; Westcott, S.L.; Ryabin, T.; Hall, J.R.; Hartmann, M.; Hollister, E.B.; Weber, C.F. Introducing mothur: Open-source, platform-independent, community-supported software for describing and comparing microbial communities. Appl. Environ. Microbiol. 2009, 75, 7537–7541. [Google Scholar] [CrossRef] [Green Version]
  34. Clarke, K.R. Non-parametric multivariate analyses of changes in community structure. Austral Ecol. 1993, 18, 117–143. [Google Scholar] [CrossRef]
  35. Oksanen, J.; Blanchet, F.G.; Kindt, R.; Legendre, P.; Wagner, H. Vegan: Community Ecology Package. R Package Version 2.0-10. 2013. Available online: http://vegan.r-forge.r-project.org/ (accessed on 11 December 2019).
  36. Segata, N.; Izard, J.; Waldron, L.; Gevers, D.; Miropolsky, L.; Garrett, W.S.; Huttenhower, C. Metagenomic biomarker discovery and explanation. Genome Biol. 2011, 12, R60. [Google Scholar] [CrossRef] [Green Version]
  37. Kolde, R. Pheatmap: Pretty Heatmaps. 2015. Available online: http://th.archive.ubuntu.com/cran/web/packages/pheatmap/ (accessed on 28 January 2021).
  38. Pieper, R.; Bindelle, J.; Rossnagel, B.; Van Kessel, A.; Leterme, P. Effect of Carbohydrate Composition in Barley and Oat Cultivars on Microbial Ecophysiology and Proliferation of Salmonella enterica in an In Vitro Model of the Porcine Gastrointestinal Tract. Appl. Environ. Microbiol. 2009, 75, 7006–7016. [Google Scholar] [CrossRef] [Green Version]
  39. Mac, K.; Wichmann-Schauer, H.; Peters, J.; Ellerbroek, L. Species identification and detection of vancomycin resistance genes in enterococci of animal origin by multiplex PCR. Int. J. Food Microbiol. 2003, 88, 305–309. [Google Scholar] [CrossRef]
  40. Valeriano, V.D.; Balolong, M.P.; Kang, D.K. Probiotic roles of Lactobacillus sp. in swine: Insights from gut microbiota. J. Appl. Microbiol. 2017, 122, 554–567. [Google Scholar] [CrossRef] [Green Version]
  41. Tyagi, A.M.; Yu, M.; Darby, T.M.; Vaccaro, C.; Li, J.Y.; Owens, J.A.; Hsu, E.; Adams, J.; Weitzmann, M.N.; Jones, R.M.; et al. The Microbial Metabolite Butyrate Stimulates Bone Formation via T Regulatory Cell-Mediated Regulation of WNT10B Expression. Immunity 2018, 49, 1116–1131. [Google Scholar] [CrossRef] [Green Version]
  42. Nilsen, T.; Nes, I.F.; Holo, H. Enterolysin A, a Cell Wall-Degrading Bacteriocin from Enterococcus faecalis LMG 2333. Appl. Environ. Microbiol. 2018, 69, 2975–2984. [Google Scholar] [CrossRef] [Green Version]
  43. Gaskins, H.R.; Collier, C.T.; Anderson, D.B. Antibiotics as growth promotants: Mode of action. Anim. Biotechnol. 2002, 13, 29–42. [Google Scholar] [CrossRef]
  44. Zoetendal, E.G.; Raes, J.; van den Bogert, B.; Arumugam, M.; Booijink, C.C.; Troost, F.J.; Bork, P.; Wels, M.; de Vos, W.M.; Kleerebezem, M. The human small intestinal microbiota is driven by rapid uptake and conversion of simple carbohydrates. ISME J. 2012, 6, 1415–1426. [Google Scholar] [CrossRef]
  45. Tian, Z.; Liu, X.; Ran, D.; Xiao, Y.; Wang, X.; Bi, D.; Shi, D. Enterococcus faecium HDRsEf1 Protects the Intestinal Epithelium and Attenuates ETEC-Induced IL-8 Secretion in Enterocytes. Mediat. Inflamm. 2016, 2016, 7474306. [Google Scholar] [CrossRef] [Green Version]
  46. Peng, X.; Wang, R.; Hu, L.; Zhou, Q.; Liu, Y.; Yang, M.; Fang, Z.; Lin, Y.; Xu, S.; Feng, B. Enterococcus faecium NCIMB 10415 administration improves the intestinal health and immunity in neonatal piglets infected by enterotoxigenic Escherichia coli K88. J. Anim. Sci. Biotechnol. 2019, 10, 72. [Google Scholar] [CrossRef]
  47. Kaper, J.B. Pathogenic Escherichia coli. Nat. Rev. Microbiol. 2004, 2, 123–140. [Google Scholar] [CrossRef]
  48. Russo, T.A.; Johnson, J.R. Proposal for a new inclusive designation for extraintestinal pathogenic isolates of Escherichia coli: ExPEC. J. Infect. Dis. 2000, 181, 1753–1754. [Google Scholar] [CrossRef] [Green Version]
  49. Fairbrother, J.M.; Nadeau, E.; Gyles, C.L. Escherichia coli in postweaning diarrhea in pigs: An update on bacterial types, pathogenesis, and prevention strategies. Anim. Health Res. Rev. 2005, 6, 17–39. [Google Scholar] [CrossRef] [Green Version]
  50. Xu, G.; Wei, A.; Wang, H.; Zhang, X. Prevalence and characteristics of extended-spectrum β-lactamase genes in Escherichia coli isolated from piglets with post-weaning diarrhea in Heilongjiang province, China. Front. Microbiol. 2015, 6, 1103. [Google Scholar] [CrossRef]
  51. Pruthvishree, B.S.; Kumar, O.R.V.; Sinha, D.K.; Malik, Y.P.S.; Dubal, Z.B.; Desingu, P.A.; Shivakumar, M.; Krishnaswamy, N.; Singh, B.R. Spatial molecular epidemiology of carbapenem-resistant and New Delhi metallo beta-lactamase (blaNDM)-producing Escherichia coli in the piglets of organized farms in India. J. Appl. Microbiol. 2017, 122, 1537–1546. [Google Scholar] [CrossRef]
  52. Devriendt, B.; Stuyven, E.; Verdonck, F.; Goddeeris, B.M.; Cox, E. Enterotoxigenic Escherichia coli (K88) induce proinflammatory responses in porcine intestinal epithelial cells. Dev. Comp. Immunol. 2010, 34, 1175–1182. [Google Scholar] [CrossRef]
  53. Guttman, J.A.; Finlay, B.B. Tight junctions as targets of infectious agents. Biochim. Biophys. Acta 2009, 1788, 832–841. [Google Scholar] [CrossRef] [Green Version]
  54. Flint, H.J.; Duncan, S.H.; Scott, K.P.; Louis, P. Links between diet, gut microbiota composition and gut metabolism. Proc. Nutr. Soc. 2015, 74, 13–22. [Google Scholar] [CrossRef] [PubMed] [Green Version]
  55. Furusawa, Y.; Obata, Y.; Fukuda, S.; Endo, T.A.; Nakato, G.; Takahashi, D.; Nakanishi, Y.; Uetake, C.; Kato, K.; Kato, T. Commensal microbe-derived butyrate induces the differentiation of colonic regulatory T cells. Nature 2013, 504, 446–450. [Google Scholar] [CrossRef] [PubMed]
  56. Sokol, H.; Pigneur, B.; Watterlot, L.; Lakhdari, O.; Bermudez-Humaran, L.G.; Gratadoux, J.J.; Blugeon, S.; Bridonneau, C.; Furet, J.P.; Corthier, G. Faecalibacterium prausnitzii is an anti-inflammatory commensal bacterium identified by gut microbiota analysis of Crohn disease patients. Proc. Natl. Acad. Sci. USA 2018, 105, 16731–16736. [Google Scholar] [CrossRef] [PubMed] [Green Version]
  57. Mccracken, B.A.; Spurlock, M.E.; Roos, M.A.; Zuckermann, F.A.; Gaskins, H.R. Weaning anorexia may contribute to local inflammation in the piglet small intestine. J. Nutr. 1999, 129, 613–619. [Google Scholar] [CrossRef] [PubMed] [Green Version]
Figure 1. Alpha diversity of gut microbiota in the luminal contents and the corresponding mucosal tissues of ileum, cecum, and colon. (A) Sobs index, (B) Shannon index. L, luminal contents; M, mucosa; Ctrl, control; Ef1, Enterococcus faecium HDRsEf1; n = 5 per group. Values are median ± interquartile range, * p < 0.05.
Microorganisms 09 01767 g001
Figure 2. The total bacterial load and E. faecium load in different gut niches. (A) qPCR determination of total 16S rRNA gene copy number in the mucosal tissues and the corresponding luminal contents of ileum, cecum, and colon. (B) Venn diagram for bacterial OTUs number in ileal luminal contents samples. (C) qPCR determination for the copy number of E. faecium in the luminal contents of ileum, cecum, and colon. (D) Relative abundance of E. faecium. Data are shown as mean ± SEM and median ± interquartile range, L, luminal contents; M, mucosa; Ctrl, control; Ef1, E. faecium HDRsEf1; n = 5 per group. * p < 0.05, ** p < 0.01, *** p < 0.001.
Microorganisms 09 01767 g002
Figure 3. Unweighted principal coordinates (PCoA) of microbiota in different inches. (A) Ileal luminal contents. (B) Ileal mucosa. (C) Cecal luminal contents. (D) Cecal mucosa. (E) Colonic luminal contents. (F) Colonic mucosa. M, mucosa; C, control; E, Enterococcus faecium HDRsEf1.
Microorganisms 09 01767 g003
Figure 4. Microbiota composition in different niches. (A) Relative abundance of bacterial taxa on the phylum level. (B) Relative abundance of bacterial taxa on the genus level. Only phylum with average relative abundance greater than 1% and genus greater than 5% were shown. L, lumen contents; M, mucosa; C, control; E, Enterococcus faecium HDRsEf1.
Microorganisms 09 01767 g004
Figure 5. Effects of HDRsEf1 on Microbiota composition in different niches at genus level. (A) Ileal mucosal samples at genus level. (B) Ileal luminal contents samples at genus level. (C) Cecal mucosal samples at genus level. (D) Cecal luminal contents samples at genus level. Only relative abundance greater than 0.5% were shown, n = 5 per group, * p < 0.05, ** p < 0.01.
Microorganisms 09 01767 g005
Figure 6. LefSe analysis and LDA score of cecal luminal microbial community from control groups and the HDRsEf1 group. (A) Cladogram revealed the microbial taxa with significant differences between the control group and HDRsEf1 group from phyla to genus. The red and blue nodes represent microbial taxa that were enriched in the HDRsEf1 group and the control group, respectively. (B) Microbial taxa with LDA score greater than 2.0, the length of the histogram represents the LDA score of the taxa with significant difference. n = 5 per group.
Microorganisms 09 01767 g006
Figure 7. Effects of HDRsEf1 on inflammatory responses in small intestine. (AC) Inflammatory factors in mucosa of duodenum, jejunum, and ileum. n = 5, * p < 0.05, *** p < 0.001.
Microorganisms 09 01767 g007
Figure 8. Effects of HDRsEf1 on inflammatory responses in serum. (AF) The levels of inflammatory factors in serum, including IL-12, IFN-γ, IL-6, IL-8, IL-4, and TGF-β1. Ctrl, control; Ef1, Enterococcus faecium HDRsEf1. Data are represented as mean ± SEM, n = 5, * p < 0.05.
Microorganisms 09 01767 g008
Figure 9. Heatmap for correlation analysis between microbiota inflammatory responses or villus height in ileal mucosa and cecal luminal contents. (A) Microbiota in ileal mucosa at family level. (B) Microbiota in cecal luminal contents at family level. Red box, microorganisms with significant difference between HDRsEf1 group and control group. * p < 0.05, ** p < 0.01, *** p < 0.001.
Microorganisms 09 01767 g009
Table 1. ANOSIM R-values of microbial community between HDRsEf1 group and the control group.
VariablesUnweighted (R)p-ValueWeighted (R)p-Value
C VS E
Ileal Lumen0.35600.0180,0240.348
Ileal Mucosa0.76000.0110.46000.014
Cecal Lumen−0.03200.5880.31600.068
Cecal Mucosa0.3360.035−0.0520.430
Colonic Lumen−0.0280.5730.07600.691
Colonic Mucosa−0.0240.5780.0000.793
Publisher’s Note: MDPI stays neutral with regard to jurisdictional claims in published maps and institutional affiliations.

