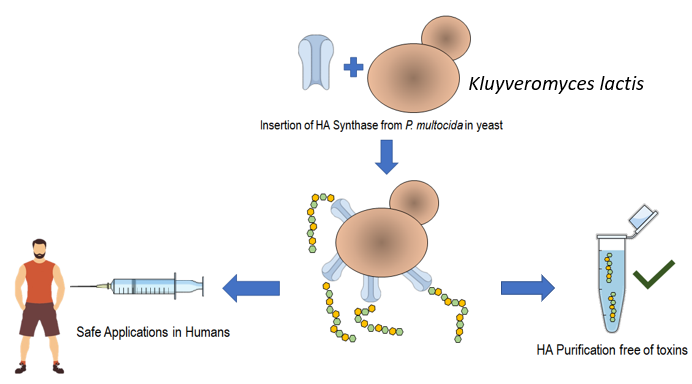
Heterologous Hyaluronic Acid Production in Kluyveromyces lactis


Abstract

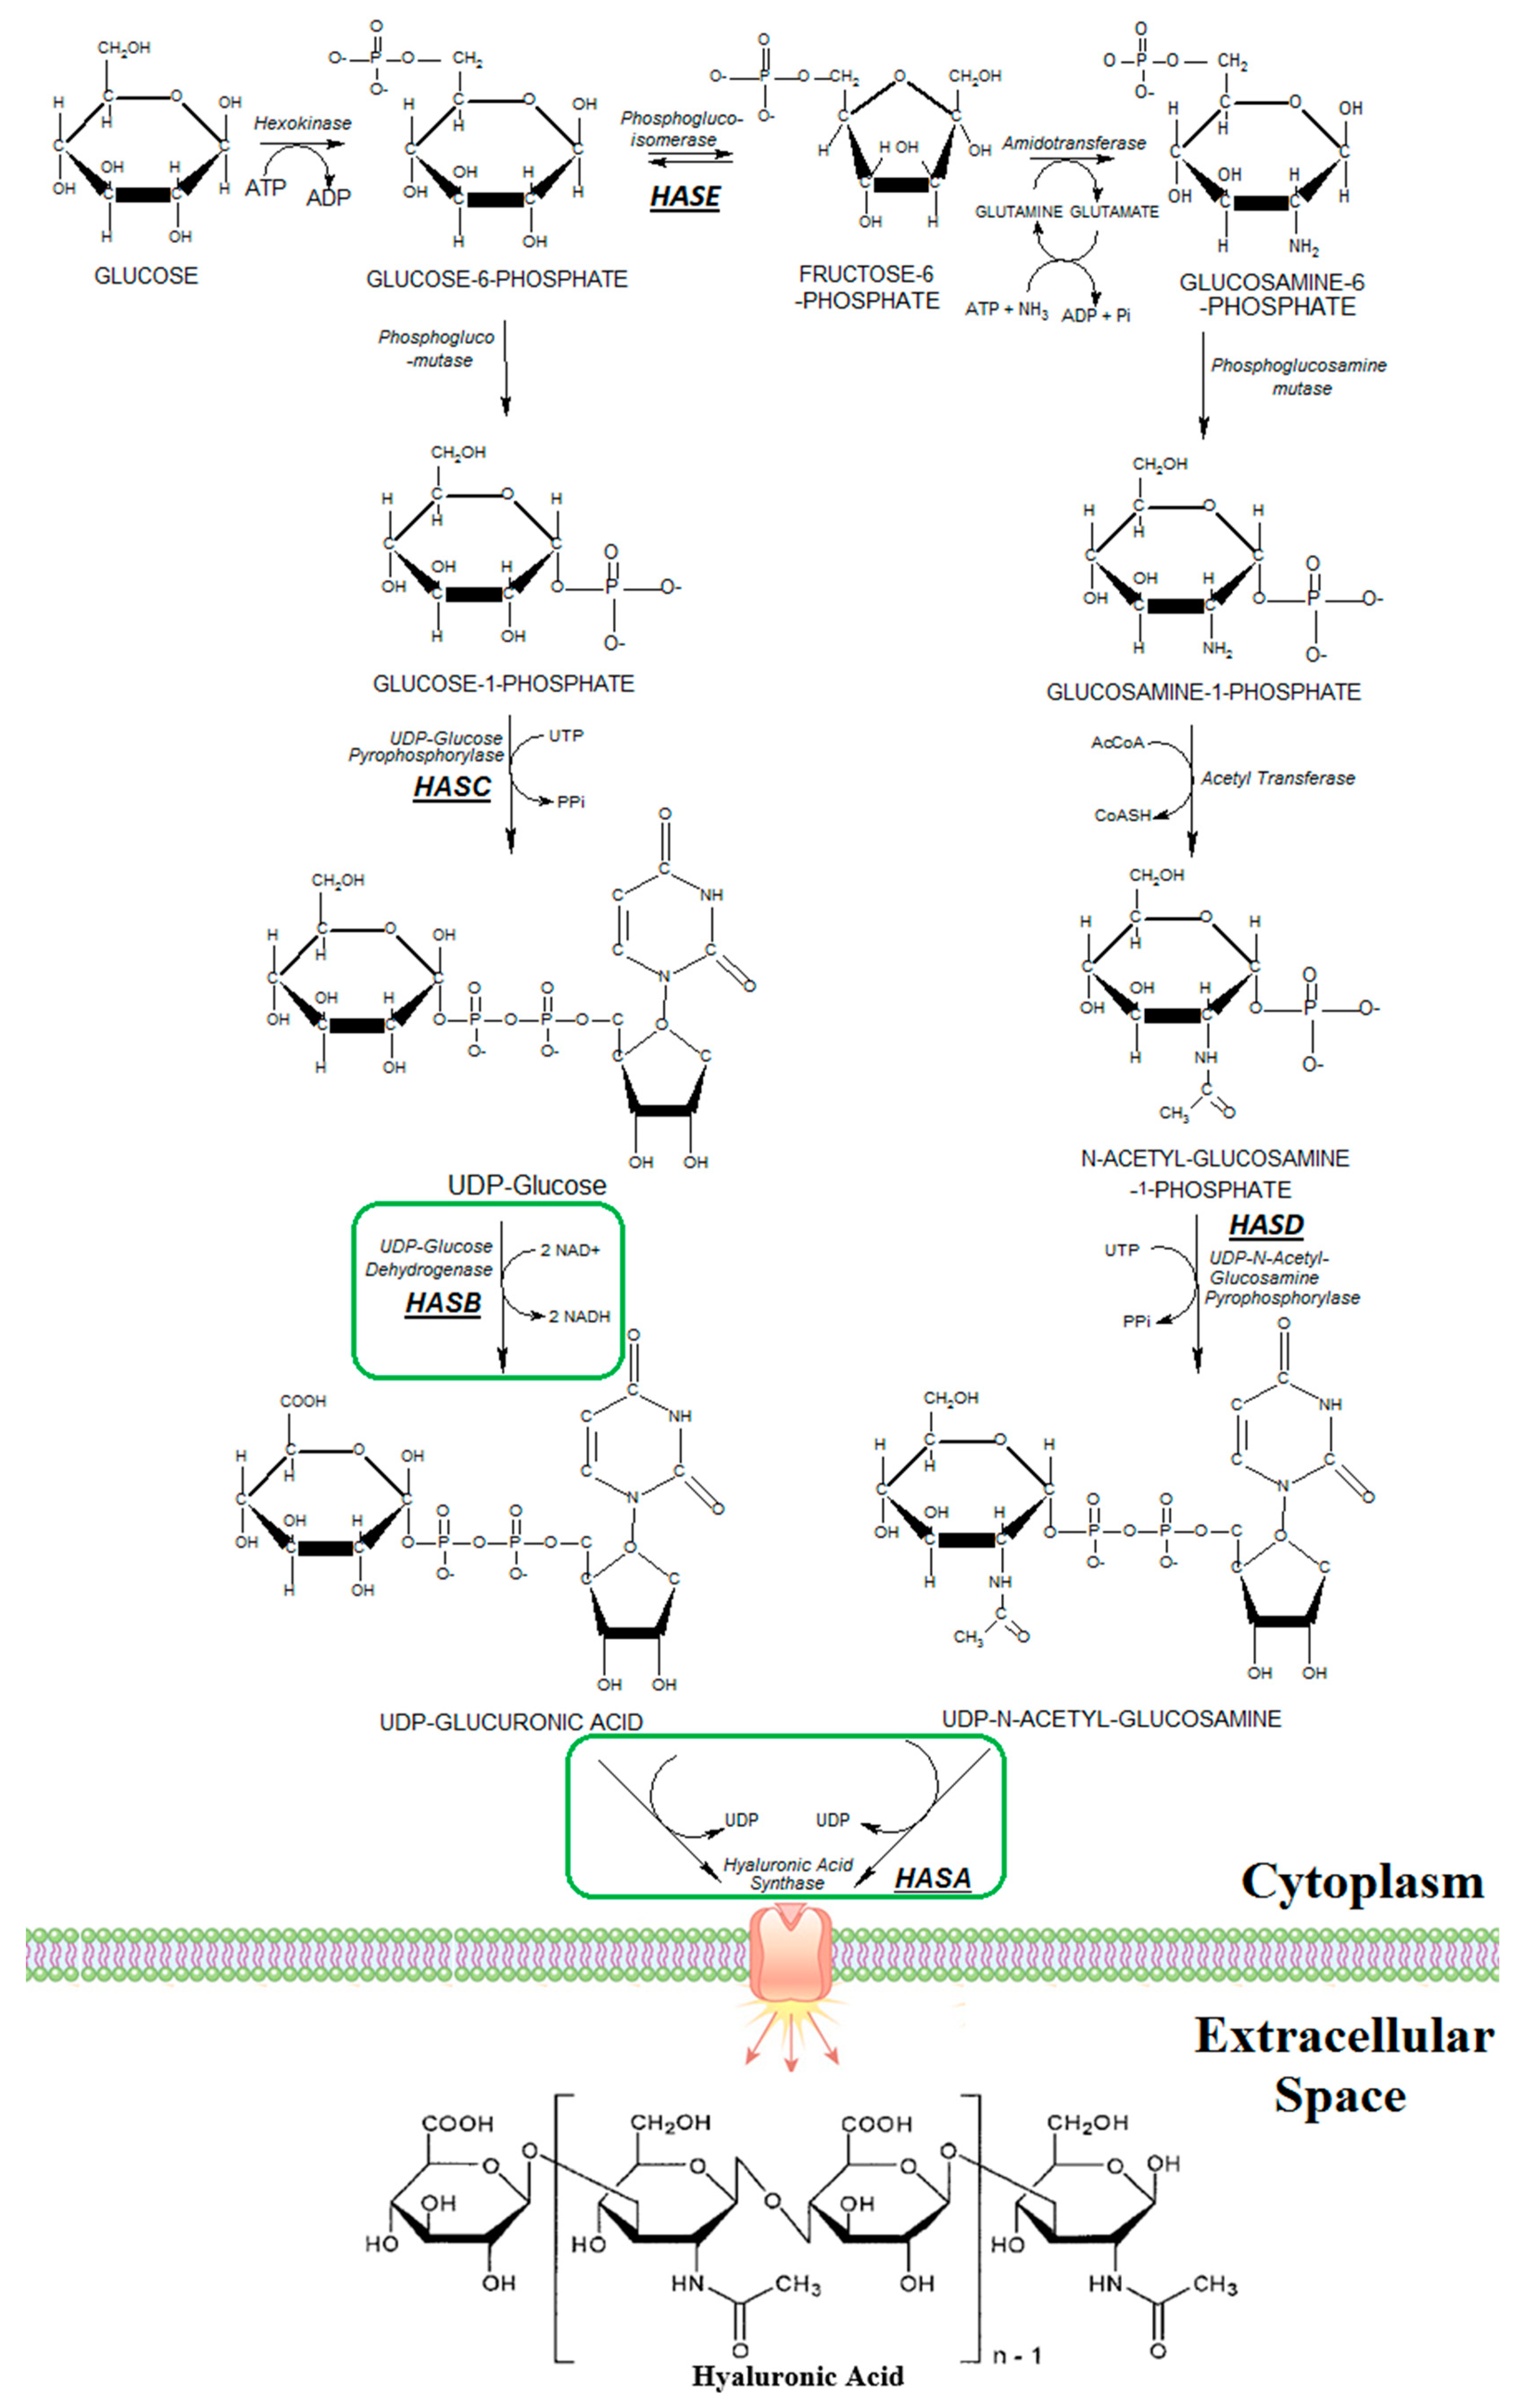
1. Introduction
2. Materials and Methods
2.1. Microorganisms and Plasmids
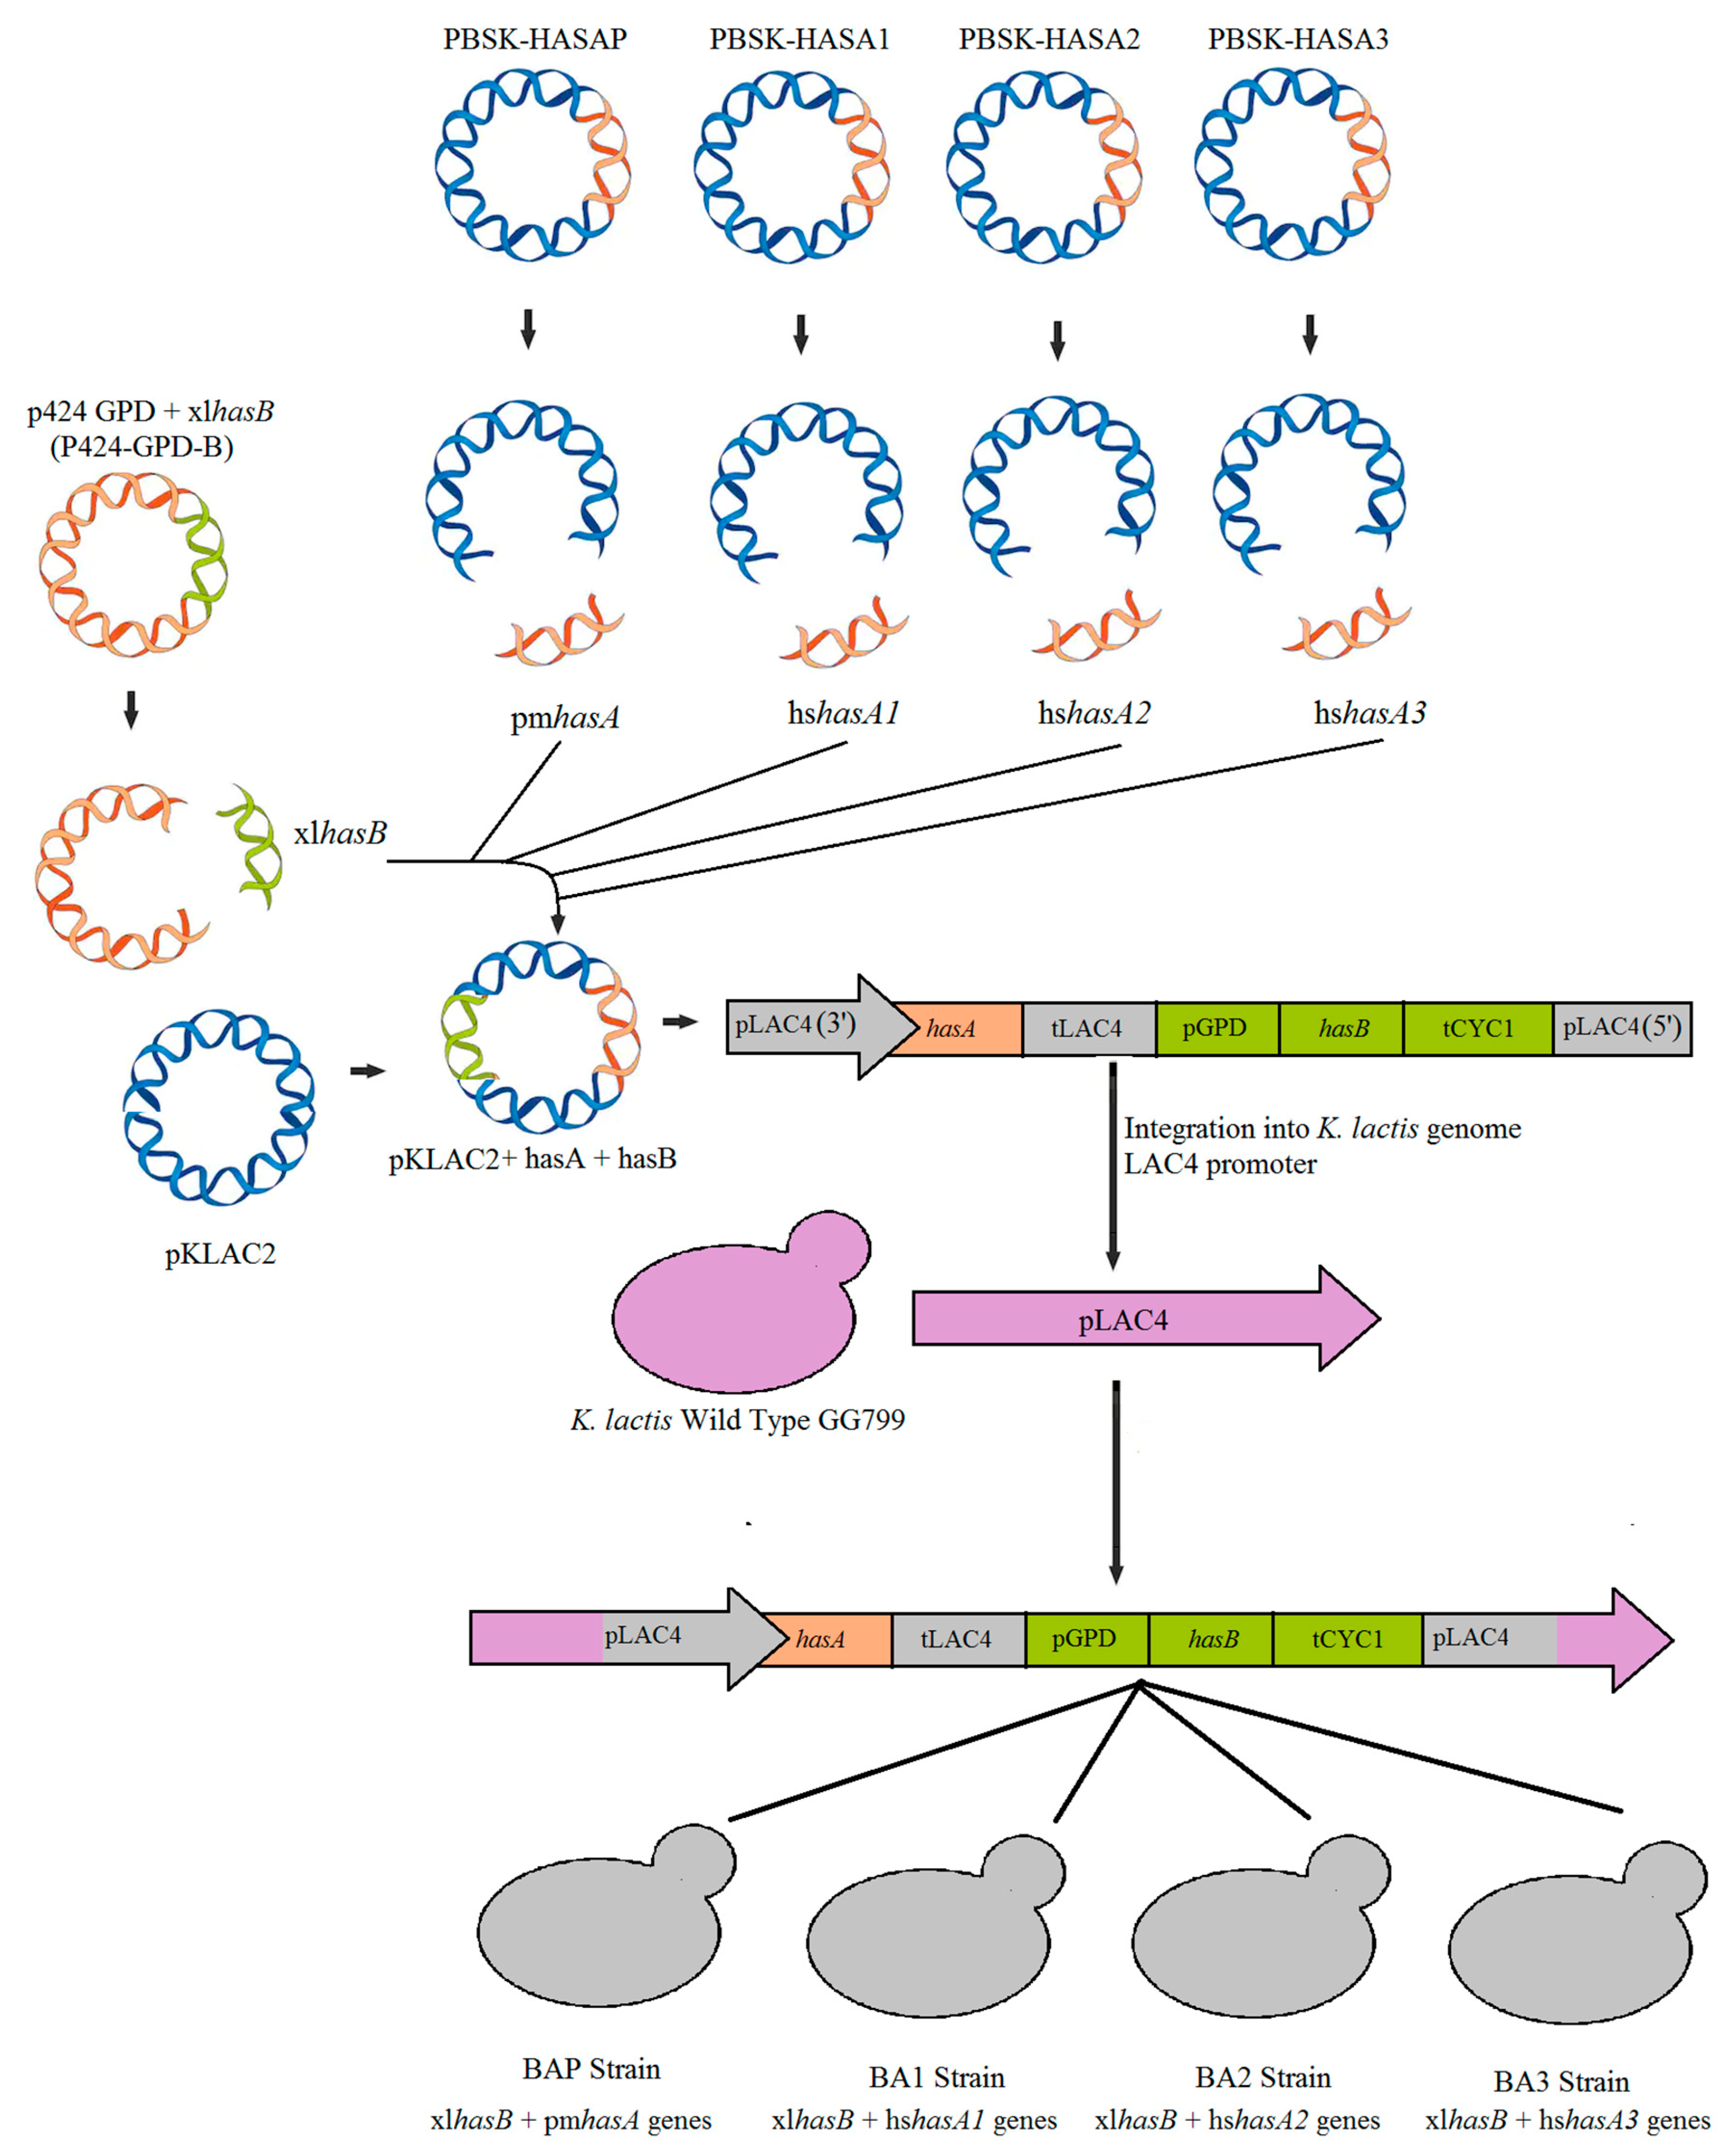
2.2. Plasmids Construction
2.3. Nucleotide Sequence Accession Numbers
2.4. Transformation of Kluyveromyces lactis Cells
2.5. Growth of K. lactis Strains BAP, BA1, BA2, and BA3 in Shake Flask
2.6. Detection of the hasB, hasA1, hasA2, hasA3 and hasAP Gene Transcripts
2.7. Gene Copy Number Quantification
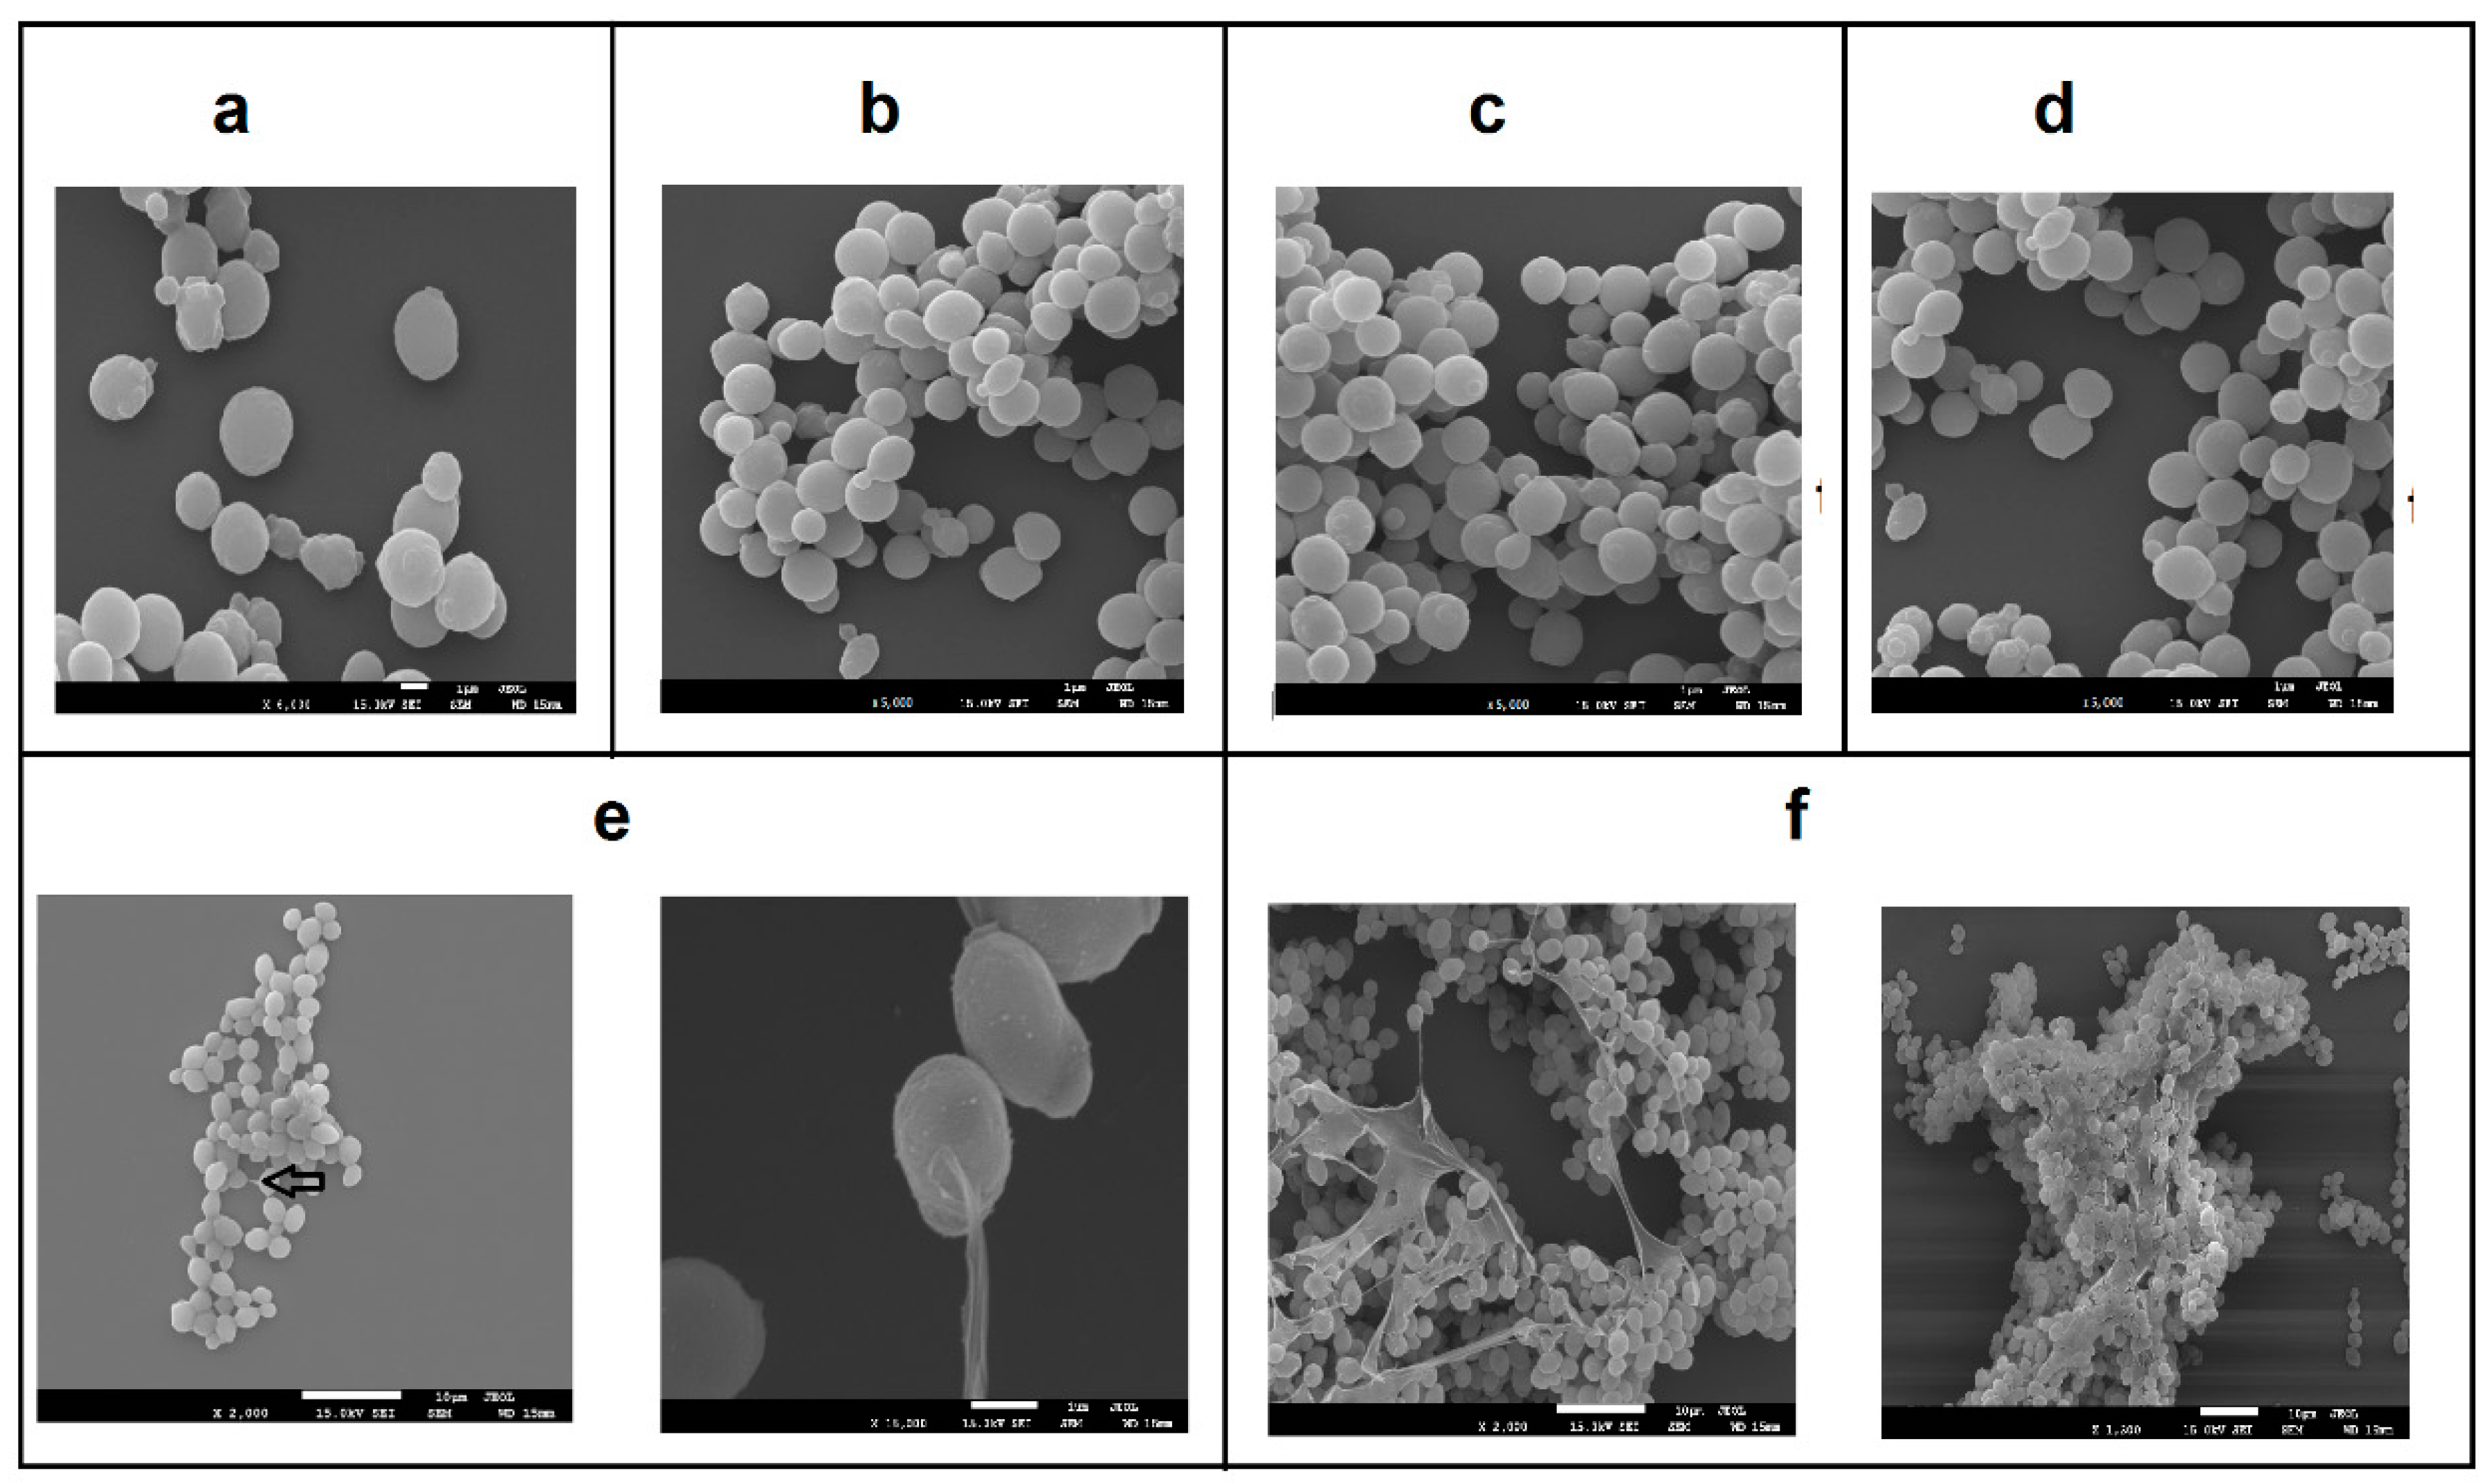
2.8. Microscopic Analysis of Recombinant K. lactis Strains
2.9. Batch Fermentations of K. lactis Strains
2.10. Detection and Quantification of the Substrate and Cellular Products
2.11. HA Quantification
2.12. HA Molecular Weight Determination
3. Results
3.1. Growth Rate Determination and HA Detection for BAP, BA1, BA2, and BA3 in Shake Flask
3.2. Transcript Values of HAS Genes
3.3. Microscopic Analysis of GG799, BAP, BA1, BA2, and BA3 Strains
3.4. Batch Fermentation and Co-Product Formation
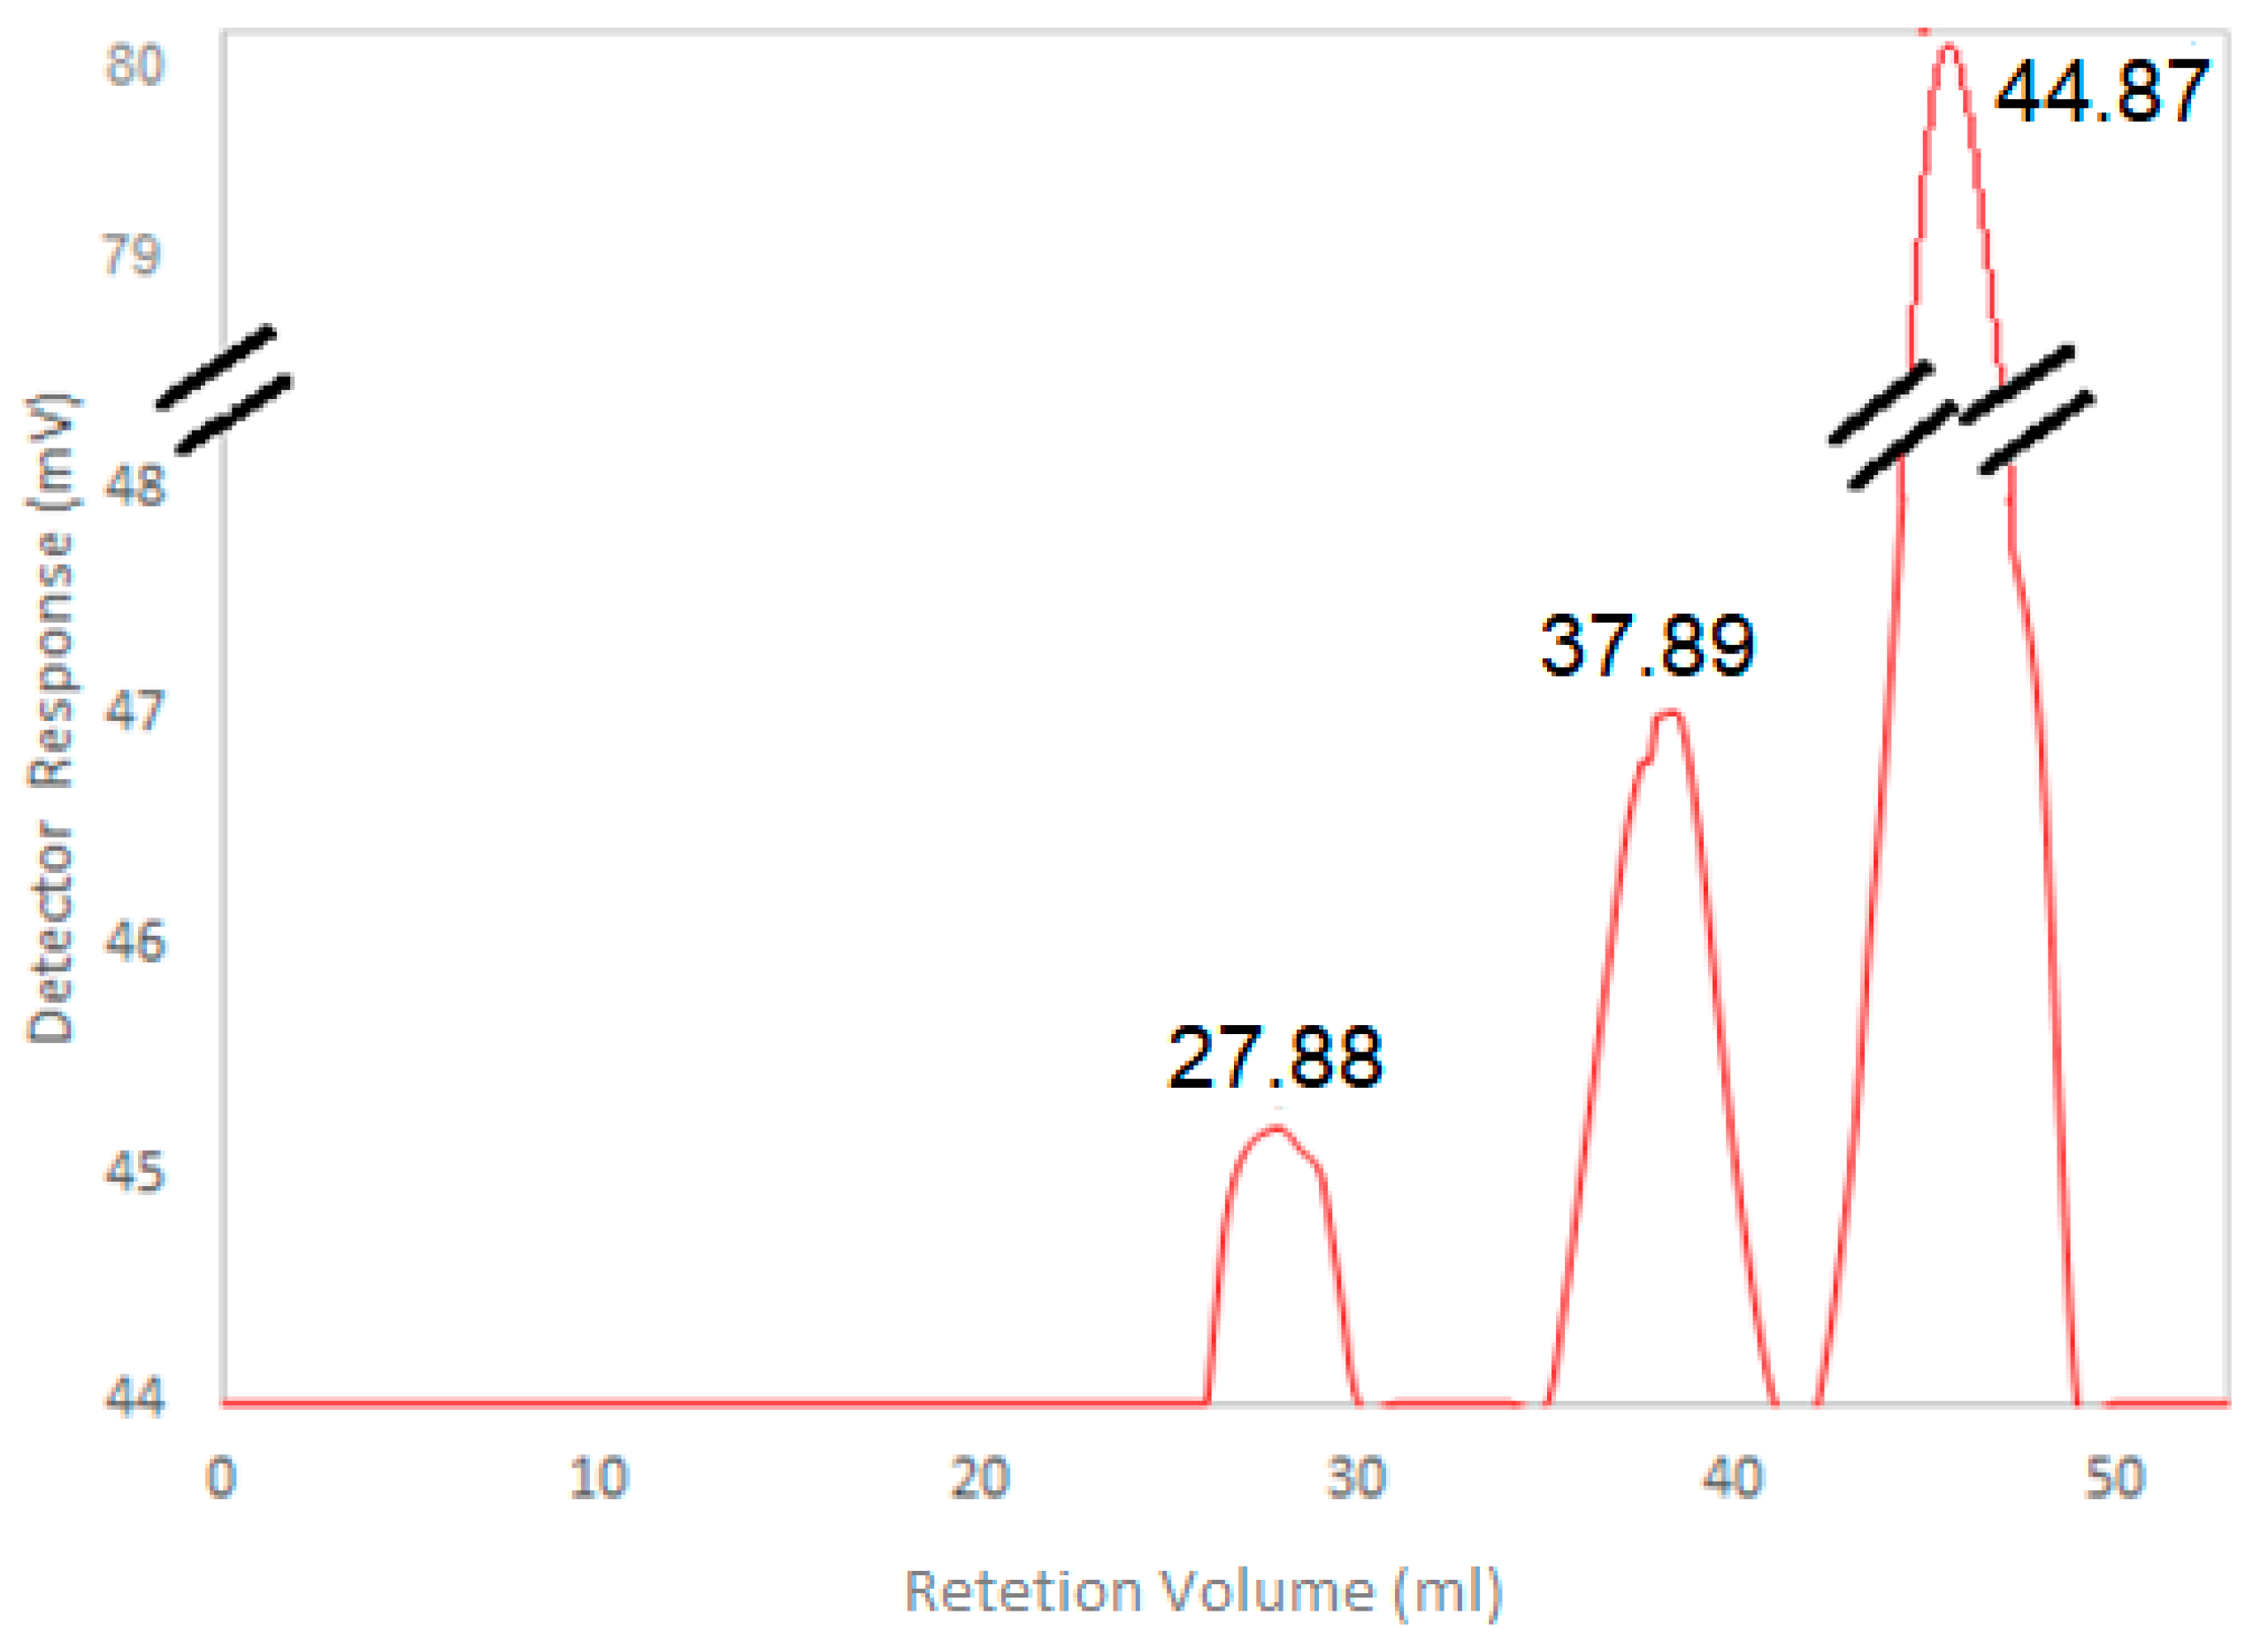
3.5. HA Molecular Weight Determination
4. Discussion
5. Conclusions
Supplementary Materials
Author Contributions
Funding
Acknowledgments
Conflicts of Interest
References
- Liu, L.; Liu, Y.; Li, J.; Du, G.; Chen, J. Microbial production of hyaluronic acid: Current state, challenges, and perspectives. Microb. Cell Fact. 2011, 10, 99. [Google Scholar] [CrossRef]
- de Oliveira, J.D.; Carvalho, L.S.; Gomes, A.M.V.; Queiroz, L.R.; Magalhães, B.S.; Parachin, N.S. Genetic basis for hyper production of hyaluronic acid in natural and engineered microorganisms. Microb. Cell Fact. 2016, 15, 119. [Google Scholar] [CrossRef]
- Long, M.; Fu, M.; Liu, Y.; Cao, H.; Lin, Y.L. Capsular hyaluronic acid of Cryptococcus neoformans contributes to fungal invasion across the alveolar-capillary interface. Int. J. Infect. Dis. 2014, 21, 282. [Google Scholar] [CrossRef][Green Version]
- Gandhi, N.S.; Mancera, R.L. The structure of glycosaminoglycans and their interactions with proteins. Chem. Biol. Drug Des. 2008, 72, 455–482. [Google Scholar] [CrossRef]
- Research, G.V. Hyaluronic Acid Market Size Worth $15.25 Billion By 2026 | CAGR 7.8%. Available online: https://www.grandviewresearch.com/press-release/global-hyaluronic-acid-market (accessed on 29 July 2019).
- Greenberg, D.D.; Stoker, A.; Kane, S.; Cockrell, M.; Cook, J.L. Biochemical effects of two different hyaluronic acid products in a co-culture model of osteoarthritis. Osteoarthr. Cartil. 2006, 14, 814–822. [Google Scholar] [CrossRef]
- Kogan, G.; Šoltés, L.; Stern, R.; Gemeiner, P. Hyaluronic acid: A natural biopolymer with a broad range of biomedical and industrial applications. Biotechnol Lett. 2007, 29, 17–25. [Google Scholar] [CrossRef]
- Spicer, A.P.; Seldin, M.F.; Olsen, A.S.; Brown, N.; Wells, D.E.; Doggett, N.A.; Itano, N.; Kimata, K.; Inazawa, J.; McDonald, J.A. Chromosomal localization of the human and mouse hyaluronan synthase genes. Genomics 1997, 41, 493–497. [Google Scholar] [CrossRef]
- DeAngelis, P.L. Hyaluronan synthases: Fascinating glycosyltransferases from vertebrates, bacterial pathogens, and algal viruses. Cell. Mol. Life Sci. 1999, 56, 670–682. [Google Scholar] [CrossRef]
- DeAngelis, P.L. Enzymological characterization of the Pasteurella multocida hyaluronic acid synthase. Biochemistry 1996, 35, 9768–9771. [Google Scholar] [CrossRef]
- DeAngelis, P.L. Molecular directionality of polysaccharide polymerization by the Pasteurella multocida hyaluronan synthase. J. Biol. Chem. 1999, 274, 26557–26562. [Google Scholar] [CrossRef]
- Itano, N.; Sawai, T.; Yoshida, M.; Lenas, P.; Yamada, Y.; Imagawa, M.; Shinomura, T.; Hamaguchi, M.; Yoshida, Y.; Ohnuki, Y.; et al. Three isoforms of mammalian hyaluronan synthases have distinct enzymatic properties. J. Biol. Chem. 1999, 274, 25085–25092. [Google Scholar] [CrossRef]
- Weigel, P.H.; DeAngelis, P.L. Hyaluronan synthases: A decade-plus of novel glycosyltransferases. J. Biol. Chem. 2007, 282, 36777–36781. [Google Scholar] [CrossRef]
- Necas, J.; Bartosikova, L.; Brauner, P.; Kolar, J. Hyaluronic acid (hyaluronan): A review. Vet. Med. (Praha). 2008, 53, 397–411. [Google Scholar] [CrossRef]
- Kendall, F.E.; Heidelberger, M.; Dawson, M.H. A serologically inactive polysaccharide elaborated by mucoid strains of Group A Streptococcus. J. Biol. Chem. 1937, 61–69. [Google Scholar]
- Kim, J.H.; Yoo, S.J.; Oh, D.K.; Kweon, Y.G.; Park, D.W.; Lee, C.H.; Gil, G.H. Selection of a Streptococcus equi mutant and optimization of culture conditions for the production of high molecular weight hyaluronic acid. Enzym. Microb. Technol. 1996, 19, 440–445. [Google Scholar] [CrossRef]
- Chien, L.J.; Lee, C.K. Hyaluronic acid production by recombinant Lactococcus lactis. Appl. Microbiol. Biotechnol. 2007, 77, 339–346. [Google Scholar] [CrossRef]
- Mao, Z.; Shin, H.D.; Chen, R. A recombinant E. coli bioprocess for hyaluronan synthesis. Appl. Microbiol. Biotechnol. 2009, 84, 63–69. [Google Scholar] [CrossRef]
- Jin, P.; Kang, Z.; Yuan, P.; Du, G.; Chen, J. Production of specific-molecular-weight hyaluronan by metabolically engineered Bacillus subtilis 168. Metab. Eng. 2016, 35, 21–30. [Google Scholar] [CrossRef]
- Jia, Y.; Zhu, J.; Chen, X.; Tang, D.; Su, D.; Yao, W.; Gao, X. Metabolic engineering of Bacillus subtilis for the efficient biosynthesis of uniform hyaluronic acid with controlled molecular weights. Bioresour. Technol. 2013, 132, 427–431. [Google Scholar] [CrossRef]
- Westbrook, A.; Ren, X.; Oh, J.; Moo-Young, M.; Chou, C. Metabolic engineering to enhance heterologous production of hyaluronic acid in Bacillus subtilis. Metab. Eng. 2018. [Google Scholar] [CrossRef]
- Mao, Z.; Chen, R.R. Recombinant synthesis of hyaluronan by Agrobacterium sp. Biotechnol. Prog. 2007, 23, 1038–1042. [Google Scholar] [CrossRef]
- Cheng, F.; Gong, Q.; Yu, H.; Stephanopoulos, G. High-titer biosynthesis of hyaluronic acid by recombinant Corynebacterium glutamicum. Biotechnol. J. 2016, 11, 574–584. [Google Scholar] [CrossRef]
- Yoshimura, T.; Shibata, N.; Hamano, Y.; Yamanaka, K. Heterologous production of hyaluronic acid in an ε-Poly-L-Lysine producer, Streptomyces albulus. Appl. Environ. Microbiol. 2015, 81, 3631–3640. [Google Scholar] [CrossRef]
- Jung, Y.; Jung, M.Y.; Park, J.H.; Jung, G.C.; Hong, Y.S.; Yeom, C.H.; Lee, S. Production of human hyaluronidase in a plant-derived protein expression system: Plant-based transient production of active human hyaluronidase. Protein Expr. Purif. 2010, 74, 181–188. [Google Scholar] [CrossRef]
- Jeong, E.; Shim, W.Y.; Kim, J.H. Metabolic engineering of Pichia pastoris for production of hyaluronic acid with high molecular weight. J. Biotechnol. 2014, 185, 28–36. [Google Scholar] [CrossRef]
- Rodicio, R.; Heinisch, J.J. Yeast on the milky way: Genetics, physiology and biotechnology of Kluyveromyces lactis. Yeast 2013, 30, 165–177. [Google Scholar] [CrossRef]
- Dujon, B.; Sherman, D.; Fischer, G.; Durrens, P.; Casaregola, S.; Lafontaine, I.; De Montigny, J.; Marck, C.; Neuvéglise, C.; Talla, E.; et al. Genome evolution in yeasts. Nature 2004, 430, 35–44. [Google Scholar] [CrossRef]
- van Ooyen, A.; Dekker, P.; Huang, M.; Olsthoorn, M.; Jacobs, D.I.; Colussi, P.A.; Taron, C.H. Heterologous protein production in the yeast Kluyveromyces lactis. Fed. Eur. Microbiol. Soc. 2006, 381–392. [Google Scholar]
- Itano, N.; Kimata, K. Mammalian Hyaluronan Synthases. IUBMB Life 2002, 1, 195–199. [Google Scholar] [CrossRef]
- Siiskonen, H.; Oikari, S.; Pasonen-Seppänen, S.; Rilla, K. Hyaluronan synthase 1: A mysterious enzyme with unexpected functions. Front. Immunol. 2015, 6, 1–11. [Google Scholar] [CrossRef]
- Sussmann, M.; Sarbia, M.; Meyer-Kirchrath, J.; Nüsing, R.M.; Schrör, K.; Fischer, J.W. Induction of Hyaluronic Acid Synthase 2 (HAS2) in Human Vascular Smooth Muscle Cells by Vasodilatory Prostaglandins. Circ. Res. 2004, 94, 592–600. [Google Scholar] [CrossRef]
- Makkonen, K.M.; Pasonen-Seppänen, S.; Törrönen, K.; Tammi, M.I.; Carlberg, C. Regulation of the hyaluronan synthase 2 gene by convergence in cyclic AMP response element-binding protein and retinoid acid receptor signaling. J. Biol. Chem. 2009, 284, 18270–18281. [Google Scholar] [CrossRef]
- Cifonelli, J.A.; Rebers, P.A.; Heddleston, K.H. The isolation and characterization of hyaluronic acid from Pasteurella multocida. Carbohydr. Res. 1970, 14, 272–276. [Google Scholar] [CrossRef]
- Müllegger, J.; Lepperdinger, G. Hyaluronan is an abundant constituent of the extracellular matrix of Xenopus embryos. Mol. Reprod. Dev. 2002, 61, 312–316. [Google Scholar] [CrossRef]
- Hanahan, D.; Jessee, J.; Bloom, F.R. Bacterial Genetic Systems. Methods Enzymol. 1991, 204, 63–113. [Google Scholar]
- Im, J.H.; Song, J.M.; Kang, J.H.; Kang, D.J. Optimization of medium components for high-molecular-weight hyaluronic acid production by Streptococcus sp. ID9102 via a statistical approach. J. Ind. Microbiol. Biotechnol. 2009, 36, 1337–1344. [Google Scholar] [CrossRef]
- Aranda, P.S.; Lajoie, D.M.; Jorcyk, C.L. Bleach gel: A simple agarose gel for analyzing RNA quality. Electrophoresis 2012, 33, 366–369. [Google Scholar] [CrossRef]
- Ma, L.; Chung, W.K. Quantitative analysis of copy number variants based on real-time lightcycler PCR. Curr. Protoc. Hum. Genet. 2014. [Google Scholar]
- Das Murtey, M.; Ramasamy, P. Sample Preparations for Scanning Electron Microscopy-Life Sciences. Mod. Electron Microsc. Phys. Life Sci. 2016. [Google Scholar]
- Bitter, T.; Muir, H.M. A modified uronic acid carbazole reaction. Anal. Biochem. 1962, 4, 330–334. [Google Scholar] [CrossRef]
- Jong, A.; Wu, C.H.; Chen, H.M.; Luo, F.; Kwon-Chung, K.J.; Chang, Y.C.; LaMunyon, C.W.; Plaas, A.; Huang, S.H. Identification and characterization of CPS1 as a hyaluronic acid synthase contributing to the pathogenesis of Cryptococcus neoformans infection. Eukaryot Cell 2007, 6, 1486–1496. [Google Scholar] [CrossRef]
- Deangelist, P.L.; Achyuthan, A.M. Yeast-derived recombinant DG42 protein of Xenopus can synthesize hyaluronan in vitro. J. Biol. Chem. 1996, 271, 23657–23660. [Google Scholar] [CrossRef]
- DeAngelis, P.L.; Papaconstantinou, J.; Weigel, P.H. Isolation of a Streptococcus pyogenes gene locus that directs hyaluronan biosynthesis in acapsular mutants and in heterologous bacteria. J. Biol. Chem. 1993, 268, 14568–14571. [Google Scholar]
- Widner, B.; Von Dollen, S.; Tang, M.; Heu, T.; Sloma, A.; Sternberg, D.; Deangelis, P.L.; Weigel, P.H.; Brown, S. Hyaluronic Acid Production in Bacillus subtilis. Appl. Environ. Microbiol. 2005, 71, 3747–3752. [Google Scholar] [CrossRef]
- Yu, H.; Stephanopoulos, G. Metabolic engineering of Escherichia coli for biosynthesis of hyaluronic acid. Metab. Eng. 2008, 10, 24–32. [Google Scholar] [CrossRef]
- Chien, L.J.; Lee, C.K. Enhanced hyaluronic acid production in Bacillus subtilis by coexpressing bacterial hemoglobin. Biotechnol. Prog. 2007, 23, 1017–1022. [Google Scholar] [CrossRef]
- Sheng, J.Z.; Ling, P.X.; Zhu, X.Q.; Guo, X.P.; Zhang, T.M.; He, Y.L.; Wang, F.S. Use of induction promoters to regulate hyaluronan synthase and UDP-glucose-6-dehydrogenase of Streptococcus zooepidemicus expression in Lactococcus lactis: A case study of the regulation mechanism of hyaluronic acid polymer. J. Appl. Microbiol. 2009, 107, 136–144. [Google Scholar] [CrossRef]
- Prasad, S.B.; Jayaraman, G.; Ramachandran, K.B. Hyaluronic acid production is enhanced by the additional co-expression of UDP-glucose pyrophosphorylase in Lactococcus lactis. Appl. Microbiol. Biotechnol. 2010, 86, 273–283. [Google Scholar] [CrossRef]
- Hmar, R.V.; Prasad, S.B.; Jayaraman, G.; Ramachandran, K.B. Chromosomal integration of hyaluronic acid synthesis (has) genes enhances the molecular weight of hyaluronan produced in Lactococcus lactis. Biotechnol. J. 2014, 9, 1554–1564. [Google Scholar] [CrossRef]
- Cheng, F.; Luozhong, S.; Guo, Z.; Yu, H.; Stephanopoulos, G. Enhanced Biosynthesis of Hyaluronic Acid Using Engineered Corynebacterium glutamicum Via Metabolic Pathway Regulation. Biotechnol. J. 2017. [Google Scholar] [CrossRef]
- Vigetti, D.; Viola, M.; Karousou, E.; De Luca, G.; Passi, A. Metabolic control of hyaluronan synthases. Matrix Biol. 2014, 35, 8–13. [Google Scholar] [CrossRef]
- Vigetti, D.; Clerici, M.; Deleonibus, S.; Karousou, E.; Viola, M.; Moretto, P.; Heldin, P.; Hascall, V.C.; De Luca, G.; Passi, A. Hyaluronan synthesis is inhibited by adenosine monophosphate-activated protein kinase through the regulation of HAS2 activity in human aortic smooth muscle cells. J. Biol. Chem. 2011, 286, 7917–7924. [Google Scholar] [CrossRef]
- Stern, R.; Asari, A.A.; Sugahara, K.N. Hyaluronan fragments: An information-rich system. Eur. J. Cell Biol. 2006, 85, 699–715. [Google Scholar] [CrossRef]
- Song, J.M.; Im, J.H.; Kang, J.H.; Kang, D.J. A simple method for hyaluronic acid quantification in culture broth. Carbohydr. Polym. 2009, 78, 633–634. [Google Scholar] [CrossRef]
- Price, R.D.; Berry, M.G.; Navsaria, H.A. Hyaluronic acid: The scientific and clinical evidence. J. Plast. Reconstr. Aesthetic Surg. 2007, 60, 1110–1119. [Google Scholar] [CrossRef]
- Shanmuga Doss, S.; Bhatt, N.P.; Jayaraman, G. Improving the accuracy of hyaluronic acid molecular weight estimation by conventional size exclusion chromatography. J. Chromatogr. B Anal. Technol. Biomed. Life Sci. 2017, 1060, 255–261. [Google Scholar] [CrossRef]
- Chen, S.J.; Chen, J.L.; Huang, W.C.; Chen, H.L. Fermentation process development for hyaluronic acid production by Streptococcus zooepidemicus ATCC 39920. Korean J. Chem. Eng. 2009, 26, 428–432. [Google Scholar] [CrossRef]


| Plasmids | Description | Reference |
| PBSK-HASB | The synthetic plasmid containing xlhasB optimized | This study |
| PBSK-HASA1 | The synthetic plasmid containing hshasA1 optimized | This study |
| PBSK-HASA2 | The synthetic plasmid containing hshasA2 optimized | This study |
| PBSK-HASA3 | The synthetic plasmid containing hshasA3 optimized | This study |
| PBSK-HASAP | The synthetic plasmid containing pmhasA optimized | This study |
| P424-GPD | Commercial Plasmid containing GPD Promoter | ATCC® |
| P424-GPD-B | P424-GPD + xlhasB gene | This study |
| PKLAC2 | Commercial Plasmid for K. lactis protein expression | New England Biolabs |
| PKLAC2-B | pKlac + xlhasB gene | This study |
| PKLAC2-BP | pKlac + xlhasB gene + pmhasA gene | This study |
| PKLAC2-B1 | pKlac + xlhasB gene + hshasA1 gene | This study |
| PKLAC2-B2 | pKlac + xlhasB gene + hshasA2 gene | This study |
| PKLAC2-B3 | pKlac + xlhasB gene + hshasA3 gene | This study |
| Strains | Description | Reference |
| E. coli Xl10-Gold | The strain used for plasmids replication | Stratagene |
| K. lactis GG799 | Wild-type yeast | New England Biolabs |
| K. lactis BAP | Yeast containing xlhasB and pmhasA genes | This study |
| K. lactis BA1 | Yeast containing xlhasB and hshasA1 genes | This study |
| K. lactis BA2 | Yeast containing xlhasB and hshasA2 genes | This study |
| K. lactis BA3 | Yeast containing xlhasB and hshasA3 genes | This study |
| Strain | GG799 | BAP | BA1 | BA2 | BA3 |
|---|---|---|---|---|---|
| Final OD600 | 42 ± 3.5 | 16.3 ± 5.2 | 36.9 ± 5.0 | 37.6 ± 1.2 | 38.7 ± 3.5 |
| µMAX (h−1) | 0.33 ± 0.03 | 0.28 ± 0.03 | 0.34 ± 0.04 | 0.35 ± 0.02 | 0.30 ± 0.03 |
| Strain | Final OD600 | µMAX (h−1) | HA (g/L) | HA MW (MDa) | Y x/s | Y gly/s | Y Et/s | Y lac/s | Y ace/s |
|---|---|---|---|---|---|---|---|---|---|
| GG799 | 77.6 ± 1.4 | 0.30 ± 0.06 | 0 | − | 0.42 ± 0.03 | 0.30 ± 0.01 | 0.04 ± 0.02 | 0.02 ± 0.02 | 0 |
| BAP | 40.2 ± 5.9 | 0.31 ± 0.03 | 1.89 ± 0.2 | 2.09 ± 0.01 | 0.34 ± 0.02 | 0.04 ± 0.02 | 0.32 ± 0.04 | 0 | 0.06 ± 0.01 |
| Microorganism | HasA Source | Promoter | Strain Name | HA (g/L) | Molecular Weight (MDa) | Quantification Method | Substrate Initial Concentration | Ref. |
|---|---|---|---|---|---|---|---|---|
| Enterococcus faecalis Escherichia coli | S. pyogenes | --a | --a | 0.69 0.08 | --a | Carbazole | --a | [44] |
| Bacillus subtilis | S. equisimilis | PamyQ-Constitutive | RB184 | 0.81 | 1.2 | Carbazole | --b | [45] |
| Lactococcus lactis | S. zooepidemicus | PNisA-Inductive | LL-NAB | 0.65 | -- a | HPLC | 10 g/L | [46] |
| Bacillus subtilis | S. zooepidemicus | PVegII-Constitutive | RB-AB | 0.84 | -- a | Carbazole | 10 g/L | [47] |
| Agrobacterium sp. | P. multocida | Phage T5-Inductive | ATCC31749 | 0.3 | 0.7-2 | Carbazole | 42 g/L | [22] |
| Escherichia coli | S. equisimilis S. pyogenes | PBAD-Inductive | sseAB spAB | 0.2 0.01 | 1.9 | Carbazole | 16 g/L | [46] |
| Escherichia coli | P. multocida | Phage T5-Inductive | JM109/pHK | 0.55 | 1.5 | Carbazole | 45 g/L | [18] |
| Lactococcus lactis | S. zooepidemicus | PNisA-Inductive | NFHA01 | 0.59 | 0.88 | Radioimmunoassay | 20 g/L | [48] |
| Lactococcus lactis | S. zooepidemicus | PNisA-Inductive | SJR2 | 0.11 | 2.8 | Carbazole | 15 g/L | [49] |
| Bacillus subtilis | P. multocida | Inductive | --c | --c | 5.43 | Carbazole | 20 g/L | [20] |
| Lactococcus lactis | S. zooepidemicus | PNisA-Inductive | VRJ2AB | 0.14 | 4.30 | Carbazole | 10 g/L | [50] |
| Pichia pastoris | Xenopus laevis | PGAP-Constitutive PAOX1-Inductive | EJ | 0.2 | 0.25 | Carbazole | 40 g/L | [26] |
| Streptomyces albulus | S. zooepidemicus | PPLS-Inductive | pJHA3 | 5.1 | 2 | Carbazole | d 60 g/L | [24] |
| Bacillus subtilis | S. zooepidemicus | PxylA-Inductive | pP43-D | 2.05 | 1.76 | Carbazole | 50 g/L | [19] |
| Corynebacterium glutamicum | S. equisimilis | PSOD-Constitutive PdapB-Constitutive | pXMJ19-PdapB | -- a 0.14 | -- a -- a | CTAB | 40 g/L | [23] |
| Corynebacterium glutamicum | S. equisimilis | PTAC-Inductive | AB | 5.4 | 1.28 | CTAB | 40 g/L | [51] |
| Bacillus subtilis | S. equisimilis | PGRAC-Inductive | AW008 | 0.48 | 1.95 | Carbazole | 20 g/L | [21] |
| Kluyveromyces lactis | P. multocida | PLAC4-Inductive | BAP | 1.89 | 2.09 | Carbazole | 40 g/L | This study |
© 2019 by the authors. Licensee MDPI, Basel, Switzerland. This article is an open access article distributed under the terms and conditions of the Creative Commons Attribution (CC BY) license (http://creativecommons.org/licenses/by/4.0/).
Share and Cite
V. Gomes, A.M.; C. M. Netto, J.H.; Carvalho, L.S.; Parachin, N.S. Heterologous Hyaluronic Acid Production in Kluyveromyces lactis. Microorganisms 2019, 7, 294. https://doi.org/10.3390/microorganisms7090294
V. Gomes AM, C. M. Netto JH, Carvalho LS, Parachin NS. Heterologous Hyaluronic Acid Production in Kluyveromyces lactis. Microorganisms. 2019; 7(9):294. https://doi.org/10.3390/microorganisms7090294
Chicago/Turabian StyleV. Gomes, Antonio M., João H. C. M. Netto, Lucas S. Carvalho, and Nádia S. Parachin. 2019. "Heterologous Hyaluronic Acid Production in Kluyveromyces lactis" Microorganisms 7, no. 9: 294. https://doi.org/10.3390/microorganisms7090294
APA StyleV. Gomes, A. M., C. M. Netto, J. H., Carvalho, L. S., & Parachin, N. S. (2019). Heterologous Hyaluronic Acid Production in Kluyveromyces lactis. Microorganisms, 7(9), 294. https://doi.org/10.3390/microorganisms7090294