
Effect of Water Activity on Conidia Germination in Aspergillus flavus

Department of Animal Nutrition and Feed Science, College of Animal Science and Technology, Huazhong Agricultural University, Wuhan 430070, China
*
Authors to whom correspondence should be addressed.
Microorganisms 2022, 10(9), 1744; https://doi.org/10.3390/microorganisms10091744
Submission received: 25 July 2022
/
Revised: 18 August 2022
/
Accepted: 24 August 2022
/
Published: 29 August 2022
(This article belongs to the Special Issue Fungal Biology and Interactions)
Abstract
:In this study, we explored the mechanism underlying Aspergillus flavus conidia germination inhibited by decreased water activity. The impact of low water activity was analyzed at 4 h, 8 h and 12 h. Additionally, we demonstrated that low water activity affected cell shape and decreased cell sizes. Transcriptomics found numerous differentially expressed genes (DEGs) during the first 12 h of germination, with 654 DEGs observed among 4 h, 8 h and 12 h. In particular, more DEGs were detected at 8 h of germinating. Therefore, proteomics was performed at 8 h, and 209 differentially expressed proteins (DEPs) were speculated, with 94 up-regulated and 115 down-regulated. Combined analysis of KEGG of transcriptomics and proteomics demonstrated that the dominant pathways were nutrient metabolism and translation. We also found several DEGs and DEPs in the Mitogen Activated Protein Kinase (MAPK) pathway. Therefore, we concluded that low water activity inhibited conidia germination, causing unregular morphology. In addition, low water activity influenced expression of creA, TreB in carbohydrate metabolism, Clr4, RmtA in amino acid metabolism and RPL37, RPL3 in translation in Aspergillus flavus.
1. Introduction
Aspergillus flavus is a pathogen that widely pollutes food and feed crops, including corn, peanuts, cotton and maize [1]. This fungus produces mycotoxins, such as aflatoxin B1, that causes harmful disease to animals, plants and insects [2]. Therefore, seeds infected by A. flavus could result in great damage to agricultural and economic losses by diminishing values and lower price of the crops [3].
Previous research [4,5] demonstrated that water activity (aw) is an important environmental factor for fungi. Aw is an important index that describes the state of water [6]; it is a measurement of freely available water required for microorganisms to grow, and it relates to pure water, which contains an aw of 100% relative moisture [7]. Accumulating evidence [8,9] has indicated that aw could affect the germination, growth and toxigenicity of A. flavus. In addition, many studies [4,10,11] have confirmed that aw is important for germination of conidia of Aspergilli. Moreover, a germination model of fungal conidia was established, which [12] concluded that conidia germination was affected by temperature, percentage of germinated conidia and fungal strains to a great extent. The study created a model that could effectively be used as a quality management system for fungus control. Research performed on A. fresenii and A. sulphureus [4] revealed the optimum aw and temperature for both fungi to grow, but did not focus on conidia germination, limiting the category of aw and temperature.
Transcriptomics was performed in A. flavus to reveal the relationship between toxigenicity and aw [9], with data corroborating that aw had an impact on aflatoxin biosynthesis. Research on Aspergillus niger [13] found that low aw causes damage to hyphae. A recent study on the interaction of temperature and aw on A. flavus [14] reported that the optimum conditions for the fungi to grow were at 0.92–0.96 aw and 28–37 °C. Moreover, research [15] has demonstrated the effect of aw and temperature on the growth and aflatoxin production of Aspergillus parasiticus and A. flavus.
Transcriptomics of A. niger conidia was analyzed during the first 8 h of germination and 4780 expressed genes were observed [16]. The study concluded that conidia change mainly in protein synthesis, cell cycle, DNA processing, respiration and metabolism. A study of A. flavus [17] demonstrated that the MAPK pathway is important in the regulation of development, secondary metabolism and pathogenicity. Moreover, proteomics was used to evaluate A. flavus in response to aw [18], revealing that at two different aw, 837 differentially expressed proteins were identified. Another proteomic study on A. flavus [19] found 417 identified proteins in germinating conidia, and functional characterization of proteins were mostly to cell wall synthesis and degradation, metabolisms, protein synthesis and degradation. A study of proteomics of A. fumigatus conidia-containing phagolysosomes [20] identified 637 host and 22 proteins that were differentially abundant in phagolysosome and found several key proteins in some processes, including signaling pathways and so on.
Other fungal species have been studied extensively in regard to conidia germination, such as A. nidulans [21], A. niger [16], A. fumigatus [22] and yeast [23]. Little attention, however, has been devoted to the conidia germination of A. flavus. Our research detects the blind spots of previous studies of A. flavus, and we investigated the effect of aw on conidia germination. Finding methods to reduce toxin produced by A. flavus is an efficient way to solve the contamination by fungal toxin. Thus, when the mechanism of conidia germination is cleared, the problem could be solved from the origin state. As a result, we investigated the relationship between aw and conidia germination by transcriptomics and proteomics, attempting to figure out the molecular mechanism by which aw influences the conidia germination of A. flavus.
2. Materials and Methods
2.1. Fungal Strain and Growth Conditions
The Aspergillus flavus NRRL 3357, kindly provided by Zhumei He (Sun Yat-sen University, Guangzhou, China) was used in this study. Conidia were cultured on fresh potato dextrose agar medium at 30 °C for seven days, then collected and suspended in sterile water containing 0.05% Tween-80. The conidia suspension was filtered through sterile four layers lens paper and kept on ice until further processing on the same day. Conidia were counted using a hemocytometer and diluted to 106 per mL. The corresponding aw of the medium was adjusted to 0.98 aw and 0.90 aw as in previous studies (with glycerol 13.1 mL, 0.98; 31.3 mL, 0.90) [24]. Water activity was verified using a water activity meter (LabMaster−aw, Novasina, St. Gallen, CH).
After incubating at different aw levels, this strain was used for different purposes. For conidia germination, 10 µL conidia’ suspension was added to YES agar medium (150 g source, 20 g yeast extract and 15 g agar per liter) with 6 cm Petri plates and cultured at 30 °C for 4, 8 or 12 h, then a microscope was utilized to observe different germination states of the conidia. For RNA extraction, 20 mL conidia’ suspension was added to 200 mL YES medium, shaking at 150 rpm at 30 °C for 4, 8 or 12 h, after which the liquid medium was centrifugated at 3000 rpm and the conidia then collected.
To determine the rate of germination, a total of at least 200 conidia per sample were examined. Conidia were considered as germinated if a germ tube of at least 2 μm was visible.
2.2. Microscopy
The specific process is displayed in the Appendix A. Briefly, the conidia were harvested after incubating for 4 h, 8 h and 12 h. An optimal microscope was utilized for direct observation and images of the conidia. With a scanning electron microscope (SEM), the conidia were washed and immediately fixed with 2.5% glutaraldehyde for two hours, then transferred at 4 °C for preservation and transportation. The conidia were then washed with several reagents (details in Appendix A) and dried with a Critical Point Dryer, then attached to metallic stubs with gold for 30 s to observe and take images.
2.3. Flow Cytometry of Conidia
Flow cytometry was used to measure the size of the conidia over the first few hours of germination. Liquid medium was inoculated with conidia at a concentration of 106 per mL, shaking at 150 rpm at 30 °C. The conidia were harvested by centrifuge (3000 rpm, five minutes) after inoculating for 4 h and 8 h. The supernatant was removed and conidia were washed in 1 mL Tween 80 (0.01% v/v). The samples were then analyzed using flow cytometry (Beckman-CytoFLEX Coulter, Brea, CA, USA) to determine the forward scatter (FSC) parameter for each sample to measure the size of the conidia.
2.4. RNA-Seq Analysis
The specific process of RNA-Seq analysis is detailed in the Appendix A. In brief, the total RNA of 4 h, 8 h and 12 h conidia were extracted using TRIzol® Reagent (Plant RNA Purification Reagent for plant tissue; Invitrogen, Waltham, MA, USA), according to the manufacturer’s instructions. RNA-seq transcriptome library was prepared following TruSeqTM RNA sample preparation Kit from Illumina (San Diego, CA, USA) using 1 μg of total RNA. The raw paired end reads were trimmed and quality controlled by SeqPrep (https://github.com-/jstjohn/SeqPrep) (accessed on 2 July 2020) and Sickle (https://github.com/n-ajoshi/sickle) (accessed on 2 July 2020) with default parameters. Then clean reads were separately aligned to reference genome with orientation mode using HISAT2 software (version 2.1.0) (http://ccb.jh-u.edu/software-/hisat2/index.shtmL) (accessed on 8 July 2020) [25]. The mapped reads of each sample were assembled by StringTie (https://ccb.jhu.edu/software/stringtie-/index.shtmL?t=example) (accessed on 10 July 2020) in a reference-based approach [26]. To identify DEGs (differential expression genes), DESeq analysis was used. Transcriptomics was considered to have significant differential genes if fold change (>2) and p-value < 0.05. In addition, functional-enrichment analysis including GO [27] and KEGG [28] was performed to identify which DEGs were significantly enriched in GO terms and metabolic pathways by Fisher’s exact test at Bonferroni-corrected p-value ≤ 0.05 compared with the whole-transcriptome background. GO (version 2020.0628) functional enrichment and KEGG (version 2020.07) pathway analysis were carried out by Goatools (version 0.6.5) (https://github.com/tanghaibao/Goatools) (accessed on 25 July 2020) and KOBAS (version 2.1.1) (http://kobas.cbi.pk-u.edu.cn/home.do) (accessed on 25 July 2020) [29].
2.5. Real-Time Quantitative PCR
The quality and amount of total RNA was measured by NanoDrop 2000 spectrophotometer (Thermo Fisher Scientific, Walthamm, MA, USA). The first-strand cDNA was synthesized from the extracted RNA using a PrimeScript™ RT reagent Kit (Takara, Kusatsu City, Japan). Real-time quantitative PCR was conducted on a Bio-Rad CFX384 Real-Time PCR System with TB Green® Premix Ex Taq™ II (Tli RNaseH Plus) (Takara). The relative amounts of mRNAs were normalized with the housekeeping gene β-actin and were analyzed by the 2−ΔΔCt method [30]. All primer information were shown in Table S1.
2.6. Tandem Mass Tag (TMT)-Labelling Analysis
The specific process of the TMT-labeling analysis is outlined in the Appendix A. In brief, a total protein of eight-hour conidia were extracted from A. flavus by using a urea lysis buffer (7 M urea, 2 M thiourea, and 1% SDS) with a protease inhibitor. Protein concentrations were detected with a BCA Protein Assay Kit (Thermo, Grand Island, NY, USA). Following reduction, cysteine alkylation, and digestion, the samples were labelled with TMT reagent (Thermo Fisher, Art.No.90111, Walthamm, MA, USA) according to the manufacturer’s instructions. After being desalted with a C18 solid-phase extraction, peptides were used for Nano Liquid Chromatography–Mass Spectrometry/Mass Spectrometry (LC–MS/MS) analysis [31]. Labeled peptides were analyzed by online nano flow liquid chromatography tandem mass spectrometry performed on a 9RKFSG2_NCS-3500R system (Thermo, Bellefonte, PA, USA) connected to a Q Exactive Plus quadrupole orbitrap mass spectrometer (Thermo, Bellefonte, PA, USA) through a nano electrospray ion source. The RAW data files were analyzed using Proteome Discoverer (Thermo Scientific, Version 2.2) against Aspergillus flavus database (Aspergillus_flavus.JCVI-afl1-v2.0.pep.unique.fa.MJ20200708085.fasta). A total of 5460 proteins expressed were identified as belonging to the proteome of A. flavus in this study. The thresholds of fold change (>1.5 or <0.67) and p-value < 0.05 at Student’s t-test were used to identify differentially expressed proteins (DEPs). Then we found 115 up-regulated and 94 down-regulated proteins in 0.98 aw group compared with 0.90 aw group. In addition, functional-enrichment analysis of GO was performed to identify which DEPs were significantly enriched in GO terms by Fisher’s exact test at Bonferroni-corrected p-value ≤ 0.05 compared with the whole-proteomic background.
2.7. Statistical Analysis
One-way analysis of variance (ANOVA) was used to test the effects of aw. The analyses were conducted using the SPSS Statistics 21.0 package (SPSS Inc., IBM, New York, NY, USA). The figures were generated using GraphPad Prism 6 (Graph Pad Software Inc., San Diego, CA, USA), and processed using Adobe Illustrator CC 2019 (Adobe Systems Inc., San Jose, CA, USA). Annotation of all identified proteins was performed with Gene Ontology (GO; http://www.blast2go.com/b2ghome; http://geneontology.org/) (accessed on 3 October 2020) and KEGG pathway (http://www.genome.jp/kegg/) (accessed on 3 October 2020). Flow cytometry was analyzed using FlowJo_V10 (version 10.8, Becton, Dickinson and Company, 2021).
3. Results
3.1. Conidia Germination
In this study, A. flavus was grown at 30 °C, enabling the separation of different stages of germination in time. Based on previous studies [32] and our observation, we chose 4 h, 8 h and 12 h to represent states of swelling, germ tube formation and mitosis. The germination rate of conidia was observed and listed in Figure S1. To clearly investigate the morphology of conidia germination, two types of microscopy (light microscope and SEM) and three different germination stages were observed. Conidia germination is shown in Figure 1A; no morphological changes were observed at 4 h of germination, and conidia were in the stage of swelling. While differences occurred at 8 h, that isotropic growth was observed in the 0.98 aw group, several conidia germinated and germ tubes were formed (conidia with red arrows in 8 h), while most of the 0.90 aw group was still in the stage of swelling. At 12 h, long mycelium was shown in the 0.98 aw group, while still no more than half of the conidia germinated in the 0.90 aw group (conidia with red arrows in 12 h). The SEM (Figure 1B) shows that in the 0.98 aw group, the conidia were relatively smooth, and the shape of the cells were relatively regular. In comparison, in the 0.90 aw group, it was observed that low water activity caused many folds in the cell surface. The differences were clearly shown between two red boxes. In addition, cells possessed with relatively rough surface and significant sinking (marked by red arrows) could be visualized in some conidia at 8 h and 12 h. Moreover, at 8 h, the germ tube was longer in the 0.98 aw group (measured with segment in 8 h).
3.2. Flow Cytometry of Conidia
In order to measure the differences in size of the conidia due to low aw, conidia were prepared and analyzed by flow cytometer over a period of 8 h. The counts of conidia demonstrated that compared to the 0.98 aw group, more conidia were smaller at 4 h and 8 h in the 0.90 aw group (Figure 2A,B). To illustrate this, we produced a graph based on the value of FSCs of the samples and found a significant decrease in the size of the conidia under low aw in both groups (Figure 2C).
3.3. Summary of DEGs
Transcriptomic data show the regulated genes, together with Gene Ontology (GO) and KEGG analysis in Figure 3. The principal component analysis (PCA) indicated that transcriptomic data in the same groups had good repeatability (Figure S2), and significant differences were shown between each group (Figure 3A and Figure S2). Numerous length distribution of assembled unigenes was identified in transcriptomics, ranging from 0–1800 bp (Figure S3). A summary of DEGs (Figure 3A) revealed that regulated genes differed most at 8 h (n = 4012), with 1722 up-regulated and 2290 down-regulated. While the number of regulated genes was similar at 4 h and 12 h, with 1167 up-regulated and 1560 down-regulated at 4 h (n = 2727), 1378 up-regulated and 1471 down-regulated at 12 h (n = 2849). According to the above results, we assumed that the influence of A. flavus conidia germination by low aw may be greater at 8 h compared to 4 h and 12 h. The Venn diagram (Figure 3B) showed 654 DEGs in common among these three groups. GO analysis was then applied to classify the functions of DEGs in each group. The results were summarized in the three main GO categories: molecular functions, cellular components and biological process. Several significantly enriched terms in the three categories were identified (p < 0.05), and the top six of each category (Figure 3C) for three different groups were listed. It was revealed that the dominant terms in the comparisons of the 0.98 aw group to 0.90 aw group were cellular progress, metabolic progress, cell part, binding and catalytic activity. In addition, data revealed that at 8 h, DEGs were much more than 4 h and 12 h, indicating more changes may have occurred at 8 h. Moreover, another GO analysis was performed regarding the common 654 DEGs to determine their function in conidia germination (Figure 3D). Regardless, we listed the top six of each category. It was revealed that the dominant terms in the comparisons of the 0.98 aw groups to 0.90 aw groups were cellular progress, metabolic progress, cell part, organelle, catalytic activity and binding, with results mostly consistent with the previous analysis. Moreover, KEGG analysis was followed. The top 10 pathways of DEGs at 4 h (Figure 3E), 8 h (Figure 3F) and 12 h (Figure 3G) were listed, as well as the common DEGs of the three groups (Figure 3H). The histograms showed consistency in the top five pathways for all the groups, which were translation, carbohydrate metabolism, amino acid metabolism, lipid metabolism, and transport and catabolism. In addition, the results showed that the dominant pathways for all the groups were translation, carbohydrate metabolism and amino acid metabolism. Among the translation pathways, DEGs were most enriched in ribosome and ribosome biogenesis in eukaryote pathways, with 18 genes and 35 genes significantly changed by low aw. For carbohydrate metabolism, 33 genes were regulated in carbon metabolism and 9 genes were regulated in starch and sucrose metabolism. In amino acid metabolism, 7 genes were regulated in arginine and proline metabolism, 2 genes were regulated in arginine biosynthesis pathway, and 5 genes were regulated in tryptophan metabolism.
3.4. Real-Time Quantitative PCR
Based on our transcriptomics data, we found that the dominant pathways were carbohydrate metabolism, amino acid metabolism and translation. Therefore, real-time quantitative PCR was performed to validate the data from the transcriptome (Figure 4). We verified the top two up-regulated and down-regulated genes in each pathway, and since all genes were up-regulated in the translation pathways, we verified the top four up-regulated genes in the translation pathway. In addition, fold changes (FC) of the matched genes are listed. The results were highly consistent with the transcriptomics data and none of the RNA-seq comparisons (log2FC) were significantly different (p < 0.05) from the qPCR results, except only one gene (AFLA_044550) in the amino acid metabolism pathway was down-regulated in real-time quantitative PCR, while up-regulated in transcriptomics.
3.5. Summary of DEPs
The transcriptomics results revealed that compared to 4 h and 12 h, more DEGs were shown at 8 h, with approximately 1.5-fold, which indicated that more biological processes may be influenced by low aw at 8 h. Therefore, proteomics was used at 8 h to further profile the mechanism of conidia germination influenced by low aw. The PCA analysis indicated that the proteomics data in the same groups had good repeatability (Figure S4), and significant differences were shown between each group (Figure 5A and Figure S4). Using TMT-labeled peptides, numerous different peptide length distributions were identified (Figure S5), as well as a total of 5592 proteins, and the coverage distribution of the identified proteins is shown (Figure S6). In total, 209 proteins were significantly (p < 0.05) changed (>1.5-fold) between the two groups. Among these 209 proteins, 115 were significantly up-regulated in the 0.90 aw group, and 94 were significantly down-regulated (Figure 5A). Furthermore, GO analysis was applied to classify the functions of the proteins (Figure 5B). Several significantly enriched terms (p < 0.05) in the three categories were identified in comparisons of the 0.98 aw groups and 0.90 aw groups. It was revealed that the dominant terms were cellular process, metabolic process, cellular anatomical entity, catalytic activity and binding. In addition, KEGG analysis was performed (Figure 5C). Top 10 pathways of the different expressed proteins were listed in Table S2, with results showing the main pathways as carbohydrate metabolism, translation and amino acid metabolism.
3.6. Combined Analysis of Transcriptomics and Proteomics
We identified 8464 genes at 8 h in transcriptomics, and 5460 proteins at 8 h in proteomics. Therefore, we investigated the relationship between these genes and proteins. Results showed that there were 4824 genes and proteins matched (Figure 6A), which means these genes could translate to the corresponding proteins. In addition, we attempted to match the 4 012 DEGs and 209 different expressed proteins, and 113 genes and proteins were matched (Figure 6B). Furthermore, GO and KEGG analysis were performed to identify these 113 matched genes and proteins. GO analysis revealed that the dominant terms were cellular process, metabolic process, cellular anatomical entity, catalytic activity and binding (Figure 6C), while KEGG analysis revealed that the pathways were enriched in carbohydrate metabolism, translation and amino acid metabolism. These results were similar to the above transcriptomics and proteomics results. The tree heatmap of combined KEGG analysis is shown in Figure S7.
4. Discussion
Our results demonstrated that the expression of numerous genes changed under low aw. Also, the KEGG pathway and fold change of major DEGs were shown in Table S3. For fungi, carbon is one of the most vital nutrients [33]. A study of A. niger [34] revealed that germination is initiated by mobilization of carbon stores. Our study proved that by changing aw, carbon metabolism was affected to a great extent. Among these DEGs, eight were down-regulated and one was up-regulated, inferring that low aw may reduce sucrose utilization. AFLA_053390 was described to be GPI-anchored cell wall beta-1,3-endoglucanase EglC, which was significantly down-regulated in our transcriptomic and down-regulated (no significance) in proteomic data in 0.90 aw group. GPI-anchored cell wall proteins acted as a scaffold to support the cell wall in yeast [35]. The down-regulation of this protein may concern the cell wall folded phenotype in our SEM. Our transcriptomics and real-time quantitative PCR data in a protein phosphatase gene (AFLA_050960) were up-regulated in 0.90 aw group, which was consistent with an earlier study [36], but in proteomic data the protein phosphatase showed no change, which indicated that some other progress may happen to balance the expression of the protein to maintain the steady state. In our data, compared to the 0.98 aw group, creA was significantly up-regulated in 4 h, while it was significantly down-regulated in 8 h and 12 h (Figure S8). This phenomenon revealed that low aw could affect conidia germination by affecting the expression of creA, and creA may play different roles in early conidia germination. In fact, carbon catabolite repression (CCR) has been widely studied [37] in carbon metabolism. The mechanism contains a group of genes, with creA being the major factor [38]. A study [39] revealed that creA is important in the morphology, pathogenicity and secondary metabolite production of A. flavus. On the other hand, glycolysis and the citric acid cycle (TCA cycle) are both important pathways in fungi. We found that low aw also affected these two pathways, with three genes regulated in both glycolysis and the TCA cycle, which revealed that low aw may change the ability of A. flavus to use carbon sources. Studies on A. nidulans [21] and A. flavus [40] revealed that these pathways are important in carbon metabolism and conidia germination. In TCA cycle, AFLA_018850 was up-regulated in 0.90 aw group; this gene is related to isocitrate dehydrogenase and is reported [41] to control metabolic flux through the citric acid cycle in a photo-switchable yeast, which indicated that the metabolism of citric acid cycle may be more severe under low aw.
Amino acid metabolism is an essential part of conidia germination. Germination of A. niger [34] has been found to be related to L-amino acids. Among the pathways related to amino acid metabolism in our data, the dominant pathways were concerned with arginine. Our results showed that Clr4 was significantly down-regulated in 0.90 aw group. Disruption of Clr4 was reported to result in growth abnormalities [42]. In addition, our study revealed that the SAM protein was an important protein, and KEGG analysis showed that SAM protein was related to arginine metabolism. The expression of SAM protein was significantly down-regulated in 0.90 aw group. A previous study [43] showed that RmtA targets the amino-terminal tails of arginine 3. Moreover, a study of A. flavus [44] revealed that RmtA is a putative arginine methyltransferase gene that could regulate conidia and sclerotia production, and also demonstrated that all RmtA homologs analyzed contained the SAM binding domain. Therefore, we inferred that low aw may affect the metabolism of arginine through regulating RmtA, which finally resulted in a change in conidia germination. In addition, five genes were significantly regulated in tryptophan metabolism, revealing that low aw has an impact on tryptophan metabolism. Thus, the connection between the effect of low aw on tryptophan metabolism and conidia germination should be further studied. However, there are only a few studies that have investigated the relationship between tryptophan and A. flavus. It was reported [45] that tryptophan is connected to indole precursors in fungi. A study [46] demonstrated that tryptophan has an effect on aflatoxin biosynthesis and regulation in A. flavus. Moreover, our data showed that several genes changed in lysine biosynthesis and degradation by low aw. Lysine was reported [47] to cause repression of diaminopimelate decarboxylase synthesis in conidia germination. In A. flavus [48], lysine succinylation was speculated to be a mechanism that regulates aflatoxin production. Interestingly, our study also revealed changes in the TCA cycle and succinyl-CoA, resulting in the assumption that low aw may down-regulate the succinylation of lysine. This may affect progress in the TCA cycle, which finally caused a decrease in conidia -germinating rate.
Translation pathways were also dominant pathways in our data. Our data in the translation pathways showed that by the effect of low aw, most genes were up-regulated compared to the 0.98 aw group, with only one gene down-regulated. In fact, comparative transcriptomics analysis was performed in three different Aspergillus to reveal the mechanism of germination, and our study also found a variety of ribosome-related genes that were significantly enriched. In A. fumigatus [49], it was demonstrated that impaired ribosome biogenesis affects morphogenesis and nuclear duplication. In addition, in A. flavus [50], it was revealed that ribosomes are connected to aflatoxin production. We assumed that the up-regulation of these genes may have a positive effect to combine with more rRNA to form more ribosomes, which could help resist the down-regulation of aw. In addition, our data showed an increase in expression in RPL11 in 0.90 aw group. A report [51] revealed that the ribosomal protein L11 induced cell apoptosis, which indicated that low aw could result in cell apoptosis in early conidia germination. Moreover, the RNA transport pathway was affected, with eight genes significantly changed. Among these genes, we found low aw affected translation initiation factors (eIFs) the most. In our data, eIF4E and eIF4B proteins were down-regulated in 0.90 aw group. An earlier study [52] revealed that disruption of eIF4E contributed to growth retardation, which was consistent with our result that the down-regulation of eIF4E proteins caused a decrease in conidia germination rate. Another study [53] demonstrated that eIF4B controlled survival and proliferation, which verified our study. These results showed that one important way low aw influenced the conidia germination of A. flavus was affecting ribosome biogenesis. However, the mechanism for how low aw influences ribosomes to regulate conidia germination should be further studied.
5. Conclusions
In general, aw could affect many aspects of germination of A. flavus. The morphology showed obvious changes in the size of the spore, germination rate, shape of fungi and membrane change. Transcriptome and proteome revealed that low aw influenced creA, TreB in carbohydrate metabolism, Clr4, RmtA in amino acid metabolism, RPL37, RPL3 in translation and Hog1 and Ste3 in the MAPK pathway, which demonstrated that low aw caused a global change in A. flavus germination. In particular, we found that low aw affects ribosome synthesis to a great extent, which indicated that ribosome synthesis may be the most important target pathway affected by change of aw.
Supplementary Materials
The following supporting information can be downloaded at: https://www.mdpi.com/article/10.3390/microorganisms10091744/s1, Figure S1. Conidia germination rate in different water activity and time period. The means and standard errors of duplicate samples have been plotted (n = 6). Mean values without a common letter (a, b, c, d) were significantly different (p < 0.05). Figure S2. Principal component analysis (PCA) of transcriptome. The principal component PC1 could interpret 69.44% intergroup differences and principal component PC2 could interpret 11.74% intergroup difference, PC2 is orthogonal to PC1 (n = 3). − (0.98 aw) and + (0.90 aw) represented two different aw. Figure S3. Length distribution of assembled unigenes of transcriptome data. The length of unigenes ranged from 0 to over 1800 bp. Figure S4. Principal component analysis (PCA) of proteome. The principal component PC1 could interpret 52.40% intergroup differences and principal component PC2 could interpret 19.00% intergroup difference, PC2 is orthogonal to PC1 (n = 3). − (0.98 aw) and + (0.90 aw) represented two different aw. Figure S5. Peptide length distribution. This figure showed the number of different length of peptides. X-axis showed the peptide length, while Y-axis showed the corresponding peptide number. Figure S6. This figure showed the coverage distribution of identified proteins. Each sector represented the proportion of a coverage range. The larger the sector area was, the more proteins were covered in the range. The number outside the sector represented coverage range and proportion of proteins distributed in this range. Figure S7. Each column in the graph represents a protein or gene, and each row represents a KEGG pathway. The color in the graph represents the enrichment of proteins and genes in the pathway (The smaller the p-value is, the higher the enrichment degree is). The closer the two branches are, the closer their enrichment degree is. Figure S8. Real-time quantitative PCR of regulated genes mentioned in discussion. − (0.98 aw) and + (0.90 aw) represented two different aw. The means and standard errors of duplicate samples have been plotted (n = 6). Mean values with * were significantly different (p < 0.05). Table S1. Primer information. Table S2. Description of top 10 up-regulated proteins and down-regulated proteins in proteome. Table S3. The KEGG pathway and fold change of major DEGs.
Author Contributions
Formal analysis, S.J. and C.L.; writing—original draft, S.J.; writing—review and editing, C.L.; investigation, K.W.; conceptualization, D.Q.; supervision, D.Q. and S.W.; project administration, D.Q. All authors have read and agreed to the published version of the manuscript.
Funding
This project was funded by the National Natural Science Foundation Project of China (Project no. 31772635).
Institutional Review Board Statement
Not applicable.
Informed Consent Statement
Not applicable.
Data Availability Statement
The sequencing data generated in this study have been deposited in NCBI’s Short Read Archive database (SRA, http://www.ncbi.nlm.nih.gov/Traces/sra_sub/sub.cgi) (accessed on 15 December 2020) and are accessible through SRA series accession number PRJNA694338. The mass spectrometry proteomics data have been deposited to the ProteomicsXchange Consortium (http://proteomecentral.proteomexchange.org/cgi/GetDataset?ID=PXD023808) (accessed on 18 December 2020) via the iProX partner repository [54] with the dataset identifier PXD023808.
Conflicts of Interest
The authors declare that there is no conflict of interest.
Appendix A
Appendix A.1. Microscopy
Scanning Electron Microscope
Fresh spores should be selected to minimize mechanical damage such as pulling, contusion and extrusion. Wash spores with PBS gently to remove the impurity substance. The washed spores are immediately fixed by 2.5% glutaraldehyde for 2 h at room temperature, then transferred into 4 °C for preservation and transportation. Then wash sproes with 0.1 M PB (pH 7.4) for 3 times, 15 min each. Then transfer tissue blocks into 1% OsO4 in 0.1 M PB (pH 7.4) for 1–2 h at room temperature. After that, wash tissue blocks in 0.1 M PB (pH 7.4) for 3 times, 15 min each. Then gradient elution with ethanol (concentration of 30–100%) and dry samples with Critical Point Dryer. Specimens are attached to metallic stubs using carbon stickers and sputter-coated with gold for 30 s. Observe and take images with scanning electron microscope.
Appendix A.2. RNA-Seq Analysis
Appendix A.2.1. RNA Extraction, cDNA Library Preparation, and SEQUENCING
Total RNA was extracted from the tissue using TRIzol® Reagent (Plant RNA Purification Reagent for plant tissue) according the manufacturer’s instructions (Invitrogen) and genomic DNA was removed using DNase I (TaKara). Then RNA quality was determined by 2100 Bioanalyser (Agilent, Santa Clara, CA, USA) and quantified using the ND-2000 (NanoDrop Technologies, Wilmington, DE, USA). Only high-quality RNA sample (OD260/280 = 1.8~2.2, OD260/230 ≥ 2.0, RIN ≥ 6.5, 28S:18S ≥ 1.0, >1 μg) was used to construct sequencing library.
RNA-seq transcriptome library was prepared following TruSeqTM RNA sample preparation Kit from Illumina (San Diego, CA, USA) using 1μg of total RNA. Shortly, messenger RNA was isolated according to polyA selection method by oligo(dT) beads and then fragmented by fragmentation buffer firstly. Secondly double-stranded cDNA was synthesized using a SuperScript double-stranded cDNA synthesis kit (Invitrogen, CA) with random hexamer primers (Illumina). Then the synthesized cDNA was subjected to end-repair, phosphorylation and ‘A’ base addition according to Illumina’s library construction protocol. Libraries were size selected for cDNA target fragments of 300 bp on 2% Low Range Ultra Agarose followed by PCR amplified using Phusion DNA polymerase (NEB) for 15 PCR cycles. After quantified by TBS380, paired-end RNA-seq sequencing library was sequenced with the Illumina HiSeq xten/NovaSeq 6000 sequencers (2 × 150 bp read length).
Appendix A.2.2. Read Mapping, Differential Expression Analysis and Functional Enrichment
The raw paired end reads were trimmed and quality controlled by SeqPrep (https://github.com-/jstjohn/SeqPrep) (accessed on 2 July 2020) and Sickle (https://github.com/n-ajoshi/sickle) (accessed on 2 July 2020) with default parameters. Then clean reads were separately aligned to reference genome with orientation mode using HISAT2 (version 2.1.0) (http://ccb.jh-u.edu/software-/hisat2/index.shtmL) (accessed on 8 July 2020) [25] software. The mapped reads of each sample were assembled by StringTie (https://ccb.jhu.edu/software/stringtie-/index.shtmL?t=example) (accessed on 10 July 2020) in a reference-based approach [26].
To identify DEGs (differential expression genes) between two different samples, the expression level of each transcript was calculated according to the transcripts per million reads (TPM) method. RSEM (version 1.3.1) (http://deweylab.biostat.wisc.edu/rsem/) (accessed on 15 July 2020) [55] was used to quantify gene abundances. Essentially, differential expression analysis was performed using the DESeq2 (version 1.38.0) [56] with p value ≤ 0.05 were considered to be significantly different expressed genes. In addition, functional-enrichment analysis including GO and KEGG were performed to identify which DEGs were significantly enriched in GO terms and metabolic pathways at Bonferroni-corrected p-value ≤ 0.05 compared with the whole-transcriptome background. GO functional enrichment (version 2020.0628) and KEGG pathway analysis (version 2020.07) were carried out by Goatools (version 0.6.5) (https://github.com/tanghaibao/Goatools) (accessed on 25 July 2020) and KOBAS (version 2.1.1) (http://kobas.cbi.pk-u.edu.cn/home.do) (accessed on 25 July 2020) [29].
Appendix A.2.3. Alternative Splice Events Identification
All the alternative splice events that occurred in our sample were identified by using recently releases program rMATS (version 3.2.5) (http://rnaseq-mats.sour-ceforge.net/index.htmL) (accessed on 15 July 2020) [57]. Only the isoforms that were similar to the reference or comprised novel splice junctions were considered, and the splicing differences were detected as exon inclusion, exclusion, alternative 5′, 3′, and intron retention events.
Appendix A.3. TMT Labeling Analysis
Appendix A.3.1. Total Protein Extraction, Protein Digestion and TMT Labeling
Total protein was extracted from fungal samples by using a urea lysis buffer (7 M urea, 2 M thiourea, and 1% SDS) with a protease inhibitor. Protein concentrations were detected with a BCA Protein Assay Kit (Pierce, Thermo, Waltham, MA, USA). Following reduction, cysteine alkylation, and digestion, samples were labeled with iTRAQ Reagents (Applied Biosystems, 4390812, Walthamm, MA, USA) according to the manufacturer’s instructions. After being desalted with a C18 solid-phase extraction, peptides were used for Nano Liquid Chromatography–Mass Spectrometry/Mass Spectrometry (LC-MS/MS) analysis [31].
Protein digestion was performed according to the standard procedure and the resulting peptide mixture was labeled using the 10-plex TMT reagent (Thermo fisher, Art.No.90111) according to the manufacturer’s instructions. Briefly, total protein (100 μg) taken from each sample was mixed with 100 mL of the lysate. TCEP (10 mM) was added and then it was stored at 37 °C. 60 min later, iodoacetamide (40 mM) was added and stored in dark at room temperature for 40 min.
Sixfold volumes of cold acetone were added to precipitate protein at –20 °C for 4 h. After centrifugation at 10,000× g at 4 °C for 20 min, the pellet was re-suspended with 100 µL 50 mM riethylammonium bicarbonate (TEAB) buffer. Trypsin was added at 1:50 trypsin-to-protein mass ratio and incubated at 37 °C overnight. Then, one unit of TMT reagent were thawed and reconstituted in 50 µL acetonitrile, after tagging for 2 h at room temperature, hydroxylamine was added to react for 15 min at room temperature. In our study, the samples were labeled as (0.98-1)-113, (0.98-2)-114 and (0.98-3)-115, (0.95-1)-116, (0.95-2)-117 and (0.95-3)-118.Finally, all samples were pooled, desalted and vacuum-dried.
Appendix A.3.2. LC-MS/MS Analysis
Labeled peptides were analyzed by online nano flow liquid chromatography tandem mass spectrometry performed on an 9RKFSG2_NCS-3500R system (Thermo, USA) connected to a Q Exactive Plus quadrupole orbitrap mass spectrometer (Thermo, USA) through a nano electrospray ion source. Briefly, the C18-reversed phase column (75 μm × 25 cm, Thermo, USA) as equilibrated with solvent A (A:2% formic acid with 0.1% formic acid) and solvent B (B: 80% ACN with 0.1% formic acid). The peptides were eluted using the following gradient: 0–4 min, 0%–5% B; 4–66 min, 5%−23% B; 66–80 min, 23%−29% B; 80−89 min, 29%−38% B; 89–91 min, 38–48% B; 91–92 min, 48–100% B; 92–105 min, 100% B; 105–106 min, 100–0% B) at a flow rate of 300nL/min. The Q Exactive Plus was operated in the data-dependent acquisition mode (DDA) to automatically switch between full scan MS and MS/MS acquisition. The survey of full scan MS spectra (m/z 350–1300) was acquired in the Orbitrap with 70000 resolutions. The automatic gain control (AGC) target at 3e6 and the maximum fill time was 20 ms. Then the top 20 most intense precursor ions were selected into collision cell for fragmentation by higher-energy collision dissociation (HCD). The MS/MS resolution was set at 35000 (at m/z 100), the automatic gain control (AGC) target at 1e5, the maximum fill time at 50 ms, and dynamic exclusion was 18 s.
Appendix A.3.3. Protein Identification
The RAW data files were analyzed using Proteome Discoverer (Thermo Scientific, Version 2.2) Against Aspergillus. flavus database.
(Aspergillus_flavus.JCVI-afl1-v2.0.pep.unique.fa.MJ20200708085.fasta). The MS/MS search criteria were as follows: Mass tolerance of 10 ppm for MS and 0.02 Da for MS/MS Tolerance, trypsin as the enzyme with 2 missed cleavage allowed, carbamido methylation of cysteine and the TMT of N- terminus and lysine side chains of peptides as fixed modification, and methionine oxidation as dynamic modifications, respectively. False discovery rate (FDR) of peptide identification was set as FDR ≤ 0.01. A minimum of one unique peptide identification was used to support protein identification.
Appendix A.3.4. Statistical Analysis
Annotation of all identified proteins was performed Gene Ontology (GO; http://www.blast2go.com/b2ghome; http://geneontology.org/) (accessed on 3 October 2020) and KEGG pathway (http://www.genome.jp/kegg/) (accessed on 3 October 2020). PCA analysis was perfomed by sklearn in python, and heatmap waz performed by pheatmap (version 1.0.12).
References
- Yu, J.; Cleveland, T.E.; Nierman, W.C.; Bennett, J.W. Aspergillus flavus genomics: Gateway to human and animal health, food safety, and crop resistance to diseases. Rev. Iberoam. Micol. 2005, 22, 194–202. [Google Scholar] [CrossRef] [PubMed]
- KLICH, M.A. Aspergillus flavus: The major producer of aflatoxin. Mol. Plant Pathol. 2007, 8, 713–722. [Google Scholar] [CrossRef] [PubMed]
- Wang, B.; Lv, Y.; Li, X.; Lin, Y.; Deng, H.; Pan, L. Profiling of secondary metabolite gene clusters regulated by LaeA in Aspergillus niger FGSC A1279 based on genome sequencing and transcriptome analysis. Res. Microbiol. 2018, 169, 67–77. [Google Scholar] [CrossRef] [PubMed]
- Gizachew, D.; Hsu, Y.C.; Szonyi, B.; Ting, W.E. Effect of water activity, temperature, and incubation period on fungal growth and ochratoxin A production on Nyjer seeds. Mycotoxin Res. 2019, 35, 1–8. [Google Scholar] [CrossRef]
- Belli, N.; Marin, S.; Sanchis, V.; Ramos, A.J. Influence of water activity and temperature on growth of isolates of Aspergillus section Nigri obtained from grapes. Int. J. Food Microbiol. 2004, 96, 19–27. [Google Scholar] [CrossRef]
- Cavia, M.M.; Muiño, M.A.F.; Huidobro, J.; Sancho, M. Correlation between Moisture and Water Activity of Honeys Harvested in Different Years. J. Food Sci. 2004, 69, C368–C370. [Google Scholar] [CrossRef]
- Abdel-Hadi, A.; Schmidt-Heydt, M.; Parra, R.; Geisen, R.; Magan, N. A systems approach to model the relationship between aflatoxin gene cluster expression, environmental factors, growth and toxin production by Aspergillus flavus. J. R. Soc. Interface 2012, 9, 757–767. [Google Scholar] [CrossRef]
- Alam, S.; Shah, H.U.; Magan, N. Effect of calcium propionate and water activity on growth and aflatoxins production by Aspergillus flavus. J. Food Sci. 2010, 75, M61–M64. [Google Scholar] [CrossRef] [PubMed]
- Zhang, F.; Guo, Z.; Zhong, H.; Wang, S.; Yang, W.; Liu, Y.; Wang, S. RNA-Seq-based transcriptome analysis of aflatoxigenic Aspergillus flavus in response to water activity. Toxins 2014, 6, 3187–3207. [Google Scholar] [CrossRef]
- Mohamed, S.; Mo, L.; Flint, S.; Palmer, J.; Fletcher, G.C. Effect of water activity and temperature on the germination and growth of Aspergillus tamarii isolated from “Maldive fish”. Int. J. Food Microbiol. 2012, 160, 119–123. [Google Scholar] [CrossRef]
- Santos, J.L.P.; Chaves, R.D.; Sant’Ana, A.S. Modeling the impact of water activity, pH, and calcium propionate on the germination of single spores of Penicillium paneum. LWT Food Sci. Technol. 2020, 133, 110012. [Google Scholar] [CrossRef]
- Gougouli, M.; Koutsoumanis, K.P. Modeling germination of fungal spores at constant and fluctuating temperature conditions. Int. J. Food Microbiol. 2012, 152, 153–161. [Google Scholar] [CrossRef] [PubMed]
- Segers, F.J.; van Laarhoven, K.A.; Huinink, H.P.; Adan, O.C.; Wosten, H.A.; Dijksterhuis, J. The Indoor Fungus Cladosporium halotolerans Survives Humidity Dynamics Markedly Better than Aspergillus niger and Penicillium rubens despite Less Growth at Lowered Steady-State Water Activity. Appl. Environ. Microbiol. 2016, 82, 5089–5098. [Google Scholar] [CrossRef] [PubMed]
- Lv, C.; Jin, J.; Wang, P.; Dai, X.; Liu, Y.; Zheng, M.; Xing, F. Interaction of water activity and temperature on the growth, gene expression and aflatoxin production by Aspergillus flavus on paddy and polished rice. Food Chem. 2019, 293, 472–478. [Google Scholar] [CrossRef]
- Peromingo, B.; Rodriguez, A.; Bernaldez, V.; Delgado, J.; Rodriguez, M. Effect of temperature and water activity on growth and aflatoxin production by Aspergillus flavus and Aspergillus parasiticus on cured meat model systems. Meat Sci. 2016, 122, 76–83. [Google Scholar] [CrossRef]
- van Leeuwen, M.R.; Krijgsheld, P.; Bleichrodt, R.; Menke, H.; Stam, H.; Stark, J.; Wosten, H.A.; Dijksterhuis, J. Germination of conidia of Aspergillus niger is accompanied by major changes in RNA profiles. Stud. Mycol. 2013, 74, 59–70. [Google Scholar] [CrossRef]
- Yang, G.; Cao, X.; Ma, G.; Qin, L.; Wu, Y.; Lin, J.; Ye, P.; Yuan, J.; Wang, S. MAPK pathway-related tyrosine phosphatases regulate development, secondary metabolism and pathogenicity in fungus Aspergillus flavus. Environ. Microbiol. 2020, 22, 5232–5247. [Google Scholar] [CrossRef]
- Zhang, F.; Zhong, H.; Han, X.; Guo, Z.; Yang, W.; Liu, Y.; Yang, K.; Zhuang, Z.; Wang, S. Proteomic profile of Aspergillus flavus in response to water activity. Fungal Biol 2015, 119, 114–124. [Google Scholar] [CrossRef]
- Tiwari, S.; Thakur, R.; Goel, G.; Shankar, J. Nano-LC-Q-TOF Analysis of Proteome Revealed Germination of Aspergillus flavus Conidia is Accompanied by MAPK Signaling and Cell Wall Modulation. Mycopathologia 2016, 181, 769–786. [Google Scholar] [CrossRef]
- Schmidt, H.; Vlaic, S.; Kruger, T.; Schmidt, F.; Balkenhol, J.; Dandekar, T.; Guthke, R.; Kniemeyer, O.; Heinekamp, T.; Brakhage, A.A. Proteomics of Aspergillus fumigatus Conidia-containing Phagolysosomes Identifies Processes Governing Immune Evasion. Mol. Cell. Proteom. 2018, 17, 1084–1096. [Google Scholar] [CrossRef] [Green Version]
- de Assis, L.J.; Ries, L.N.; Savoldi, M.; Dinamarco, T.M.; Goldman, G.H.; Brown, N.A. Multiple Phosphatases Regulate Carbon Source-Dependent Germination and Primary Metabolism in Aspergillus nidulans. G3 (Bethesda) 2015, 5, 857–872. [Google Scholar] [CrossRef] [PubMed]
- Baltussen, T.; Coolen, J.; Zoll, J.; Verweij, P.E.; Melchers, W. Gene co-expression analysis identifies gene clusters associated with isotropic and polarized growth in Aspergillus fumigatus conidia. Fungal Genet. Biol. 2018, 116, 62–72. [Google Scholar] [CrossRef] [PubMed]
- Herman, P.K.; Rine, J. Yeast spore germination: A requirement for Ras protein activity during re-entry into the cell cycle. EMBO J. 1997, 16, 6171–6181. [Google Scholar] [CrossRef]
- Schmidt-Heydt, M.; Abdel-Hadi, A.; Magan, N.; Geisen, R. Complex regulation of the aflatoxin biosynthesis gene cluster of Aspergillus flavus in relation to various combinations of water activity and temperature. Int. J. Food Microbiol. 2009, 135, 231–237. [Google Scholar] [CrossRef] [PubMed]
- Kim, D.; Langmead, B.; Salzberg, S.L. HISAT: A fast spliced aligner with low memory requirements. Nat. Methods 2015, 12, 357–360. [Google Scholar] [CrossRef]
- Pertea, M.; Pertea, G.M.; Antonescu, C.M.; Chang, T.C.; Mendell, J.T.; Salzberg, S.L. StringTie enables improved reconstruction of a transcriptome from RNA-seq reads. Nat. Biotechnol 2015, 33, 290–295. [Google Scholar] [CrossRef]
- Ashburner, M.; Ball, C.A.; Blake, J.A.; Botstein, D.; Butler, H.; Cherry, J.M.; Davis, A.P.; Dolinski, K.; Dwight, S.S.; Eppig, J.T.; et al. Gene ontology: Tool for the unification of biology. The Gene Ontology Consortium. Nat. Genet. 2000, 25, 25–29. [Google Scholar] [CrossRef]
- Kanehisa, M. The KEGG database. In Novartis Foundation Symposia; Wiley: Hoboken, NJ, USA, 2002; Volume 247, pp. 91–103; 119–128; 244–252. [Google Scholar] [CrossRef]
- Xie, C.; Mao, X.; Huang, J.; Ding, Y.; Wu, J.; Dong, S.; Kong, L.; Gao, G.; Li, C.Y.; Wei, L. KOBAS 2.0: A web server for annotation and identification of enriched pathways and diseases. Nucleic Acids Res. 2011, 39, W316–W322. [Google Scholar] [CrossRef] [PubMed]
- Livak, K.J.; Schmittgen, T.D. Analysis of Relative Gene Expression Data Using Real-Time Quantitative PCR and the 2−ΔΔCT Method. Methods 2001, 25, 402–408. [Google Scholar] [CrossRef]
- Luo, G.; Zhao, L.; Xu, X.; Qin, Y.; Huang, L.; Su, Y.; Zheng, W.; Yan, Q. Integrated dual RNA-seq and dual iTRAQ of infected tissue reveals the functions of a diguanylate cyclase gene of Pseudomonas plecoglossicida in host-pathogen interactions with Epinephelus coioides. Fish Shellfish Immunol. 2019, 95, 481–490. [Google Scholar] [CrossRef]
- Osherov, N.; May, G.S. The molecular mechanisms of conidial germination. FEMS Microbiol. Lett. 2001, 199, 153–160. [Google Scholar] [CrossRef] [PubMed]
- Szilagyi, M.; Miskei, M.; Karanyi, Z.; Lenkey, B.; Pocsi, I.; Emri, T. Transcriptome changes initiated by carbon starvation in Aspergillus nidulans. Microbiology 2013, 159, 176–190. [Google Scholar] [CrossRef] [PubMed]
- Hayer, K.; Stratford, M.; Archer, D.B. Structural features of sugars that trigger or support conidial germination in the filamentous fungus Aspergillus niger. Appl. Environ. Microbiol. 2013, 79, 6924–6931. [Google Scholar] [CrossRef]
- Trow, J.A. Processing of GPI-Anchored Cell Wall Proteins in Saccharomyces cerevisiae and a Role for DCW1. Ph.D. Thesis, The Johns Hopkins University, Baltimore, MD, USA, 2013. [Google Scholar]
- Alam, S.; Shah, H.U.; Magan, N. Water availability affects extracellular hydrolytic enzyme production by Aspergillus flavus and Aspergillus parasiticus. World Mycotoxin J. 2009, 2, 313–322. [Google Scholar] [CrossRef]
- Dowzer, C.E.; Kelly, J.M. Analysis of the creA gene, a regulator of carbon catabolite repression in Aspergillus nidulans. Mol. Cell. Biol. 1991, 11, 5701–5709. [Google Scholar] [CrossRef] [PubMed]
- Chulkin, A.M.; Vavilova, E.A.; Benevolenskii, S.V. The mutational analysis of carbon catabolite repression in filamentous fungus Penicillium canescens. Mol. Biol. 2011, 45, 871–878. [Google Scholar] [CrossRef]
- Fasoyin, O.E.; Wang, B.; Qiu, M.; Han, X.; Chung, K.R.; Wang, S. Carbon catabolite repression gene creA regulates morphology, aflatoxin biosynthesis and virulence in Aspergillus flavus. Fungal Genet. Biol. 2018, 115, 41–51. [Google Scholar] [CrossRef]
- Fountain, J.C.; Bajaj, P.; Pandey, M.; Nayak, S.N.; Yang, L.; Kumar, V.; Jayale, A.S.; Chitikineni, A.; Zhuang, W.; Scully, B.T.; et al. Oxidative stress and carbon metabolism influence Aspergillus flavus transcriptome composition and secondary metabolite production. Sci. Rep. 2016, 6, 38747. [Google Scholar] [CrossRef]
- Chen, H.; Mulder, L.; Wijma, H.J.; Wabeke, R.; Heinemann, M. A photo-switchable yeast isocitrate dehydrogenase to control metabolic flux through the citric acid cycle. bioRxiv 2021. [Google Scholar] [CrossRef]
- Palmer, J.M.; Perrin, R.M.; Dagenais, T.R.T.; Keller, N.P. H3K9 methylation regulates growth and development in Aspergillus fumigatus. Eukaryot. Cell 2008, 7, 2052–2060. [Google Scholar] [CrossRef]
- Strahl, B.D.; Briggs, S.D.; Brame, C.J.; Caldwell, J.A.; Koh, S.S.; Ma, H.; Cook, R.G.; Shabanowitz, J.; Hunt, D.F.; Stallcup, M.R.; et al. Methylation of histone H4 at arginine 3 occurs in vivo and is mediated by the nuclear receptor coactivator PRMT1. Curr. Biol. 2001, 11, 996–1000. [Google Scholar] [CrossRef]
- Satterlee, T.; Cary, J.W.; Calvo, A.M. RmtA, a Putative Arginine Methyltransferase, Regulates Secondary Metabolism and Development in Aspergillus flavus. PLoS ONE 2016, 11, e155575. [Google Scholar] [CrossRef]
- Xu, W.; Gavia, D.J.; Tang, Y. Biosynthesis of fungal indole alkaloids. Nat. Prod. Rep. 2014, 31, 1474–1487. [Google Scholar] [CrossRef] [PubMed]
- Wilkinson, J.R.; Yu, J.; Bland, J.M.; Scheffler, B.E.; Kim, H.S.; Nierman, W.C.; Cleveland, T.E. Influence of tryptophan on aflatoxin biosynthesis and regulation in Aspergillus flavus. In Proceedings of the American Society for Microbiology Annual Meeting, Orlando, FL, USA, 21–26 May 2006; Abstract #O-042. p. 429. [Google Scholar]
- Grandgenett, D.P.; Stahly, D.P. Control of diaminopimelate decarboxylase by L-lysine during growth and sporulation of Bacilluscereus. J. Bacteriol. 1971, 106, 551–560. [Google Scholar] [CrossRef] [PubMed]
- Ren, S.; Yang, M.; Yue, Y.; Ge, F.; Li, Y.; Guo, X.; Zhang, J.; Zhang, F.; Nie, X.; Wang, S. Lysine Succinylation Contributes to Aflatoxin Production and Pathogenicity in Aspergillus flavus. Mol. Cell. Proteom. 2018, 17, 457–471. [Google Scholar] [CrossRef]
- Bhabhra, R.; Richie, D.L.; Kim, H.S.; Nierman, W.C.; Fortwendel, J.; Aris, J.P.; Rhodes, J.C.; Askew, D.S. Impaired ribosome biogenesis disrupts the integration between morphogenesis and nuclear duplication during the germination of Aspergillus fumigatus. Eukaryot. Cell 2008, 7, 575–583. [Google Scholar] [CrossRef]
- Georgianna, D.R.; Hawkridge, A.M.; Muddiman, D.C.; Payne, G.A. Temperature-dependent regulation of proteins in Aspergillus flavus: Whole organism stable isotope labeling by amino acids. J. Proteome Res. 2008, 7, 2973–2979. [Google Scholar] [CrossRef]
- Zhang, Y.; Wolf, G.W.; Bhat, K.; Jin, A.; Allio, T.; Burkhart, W.A.; Xiong, Y. Ribosomal protein L11 negatively regulates oncoprotein MDM2 and mediates a p53-dependent ribosomal-stress checkpoint pathway. Mol. Cell. Biol. 2003, 23, 8902–8912. [Google Scholar] [CrossRef]
- Strudwick, S.; Borden, K.L. The emerging roles of translation factor eIF4E in the nucleus. Differentiation 2002, 70, 10–22. [Google Scholar] [CrossRef]
- Shahbazian, D.; Parsyan, A.; Petroulakis, E.; Hershey, J.; Sonenberg, N. eIF4B controls survival and proliferation and is regulated by proto-oncogenic signaling pathways. Cell Cycle 2010, 9, 4106–4109. [Google Scholar] [CrossRef]
- Ma, J.; Chen, T.; Wu, S.; Yang, C.; Bai, M.; Shu, K.; Li, K.; Zhang, G.; Jin, Z.; He, F.; et al. iProX: An integrated proteome resource. Nucleic Acids Res. 2019, 47, D1211–D1217. [Google Scholar] [CrossRef] [PubMed]
- Li, B.; Dewey, C.N. RSEM: Accurate transcript quantification from RNA-Seq data with or without a reference genome. BMC Bioinform. 2011, 12, 1–16. [Google Scholar] [CrossRef] [PubMed]
- Love, M.I.; Huber, W.; Anders, S. Moderated estimation of fold change and dispersion for RNA-seq data with DESeq2. Genome Biol 2014, 15, 1–21. [Google Scholar] [CrossRef] [PubMed]
- Shen, S.; Park, J.W.; Lu, Z.X.; Lin, L.; Henry, M.D.; Wu, Y.N.; Zhou, Q.; Xing, Y. rMATS: Robust and flexible detection of differential alternative splicing from replicate RNA-Seq data. Proc. Natl. Acad. Sci. USA 2014, 111, E5593–E5601. [Google Scholar] [CrossRef] [Green Version]
Figure 1.
Germination of A. flavus conidia as observed by microscopy. The states of 4 h, 8 h and 12 h were observed by different kinds of microscopy. All conidia were observed under two different aw, 0.98 and 0.90. Germination of A. flavus conidia under two different aw in optical microscope (A), bar represents 20 µm; in SEM (scanning electron microscope) (B), bar represents 4 µm in 4 h and 8 h, 10 µm in 12 h.

Figure 2.
Flow cytometry data. The differences in size of conidia germination under two aw and two states. The x-axis indicates forward scatter (FCS), the y-axis indicates counts of profiles of 10,000 conidia at 4 h (A) and 8 h (B). (C) Average size of 10,000 conidia measured as the FSC parameter. The means and standard errors of duplicate samples have been plotted (n = 3). Mean values with * were significantly different (p < 0.05).
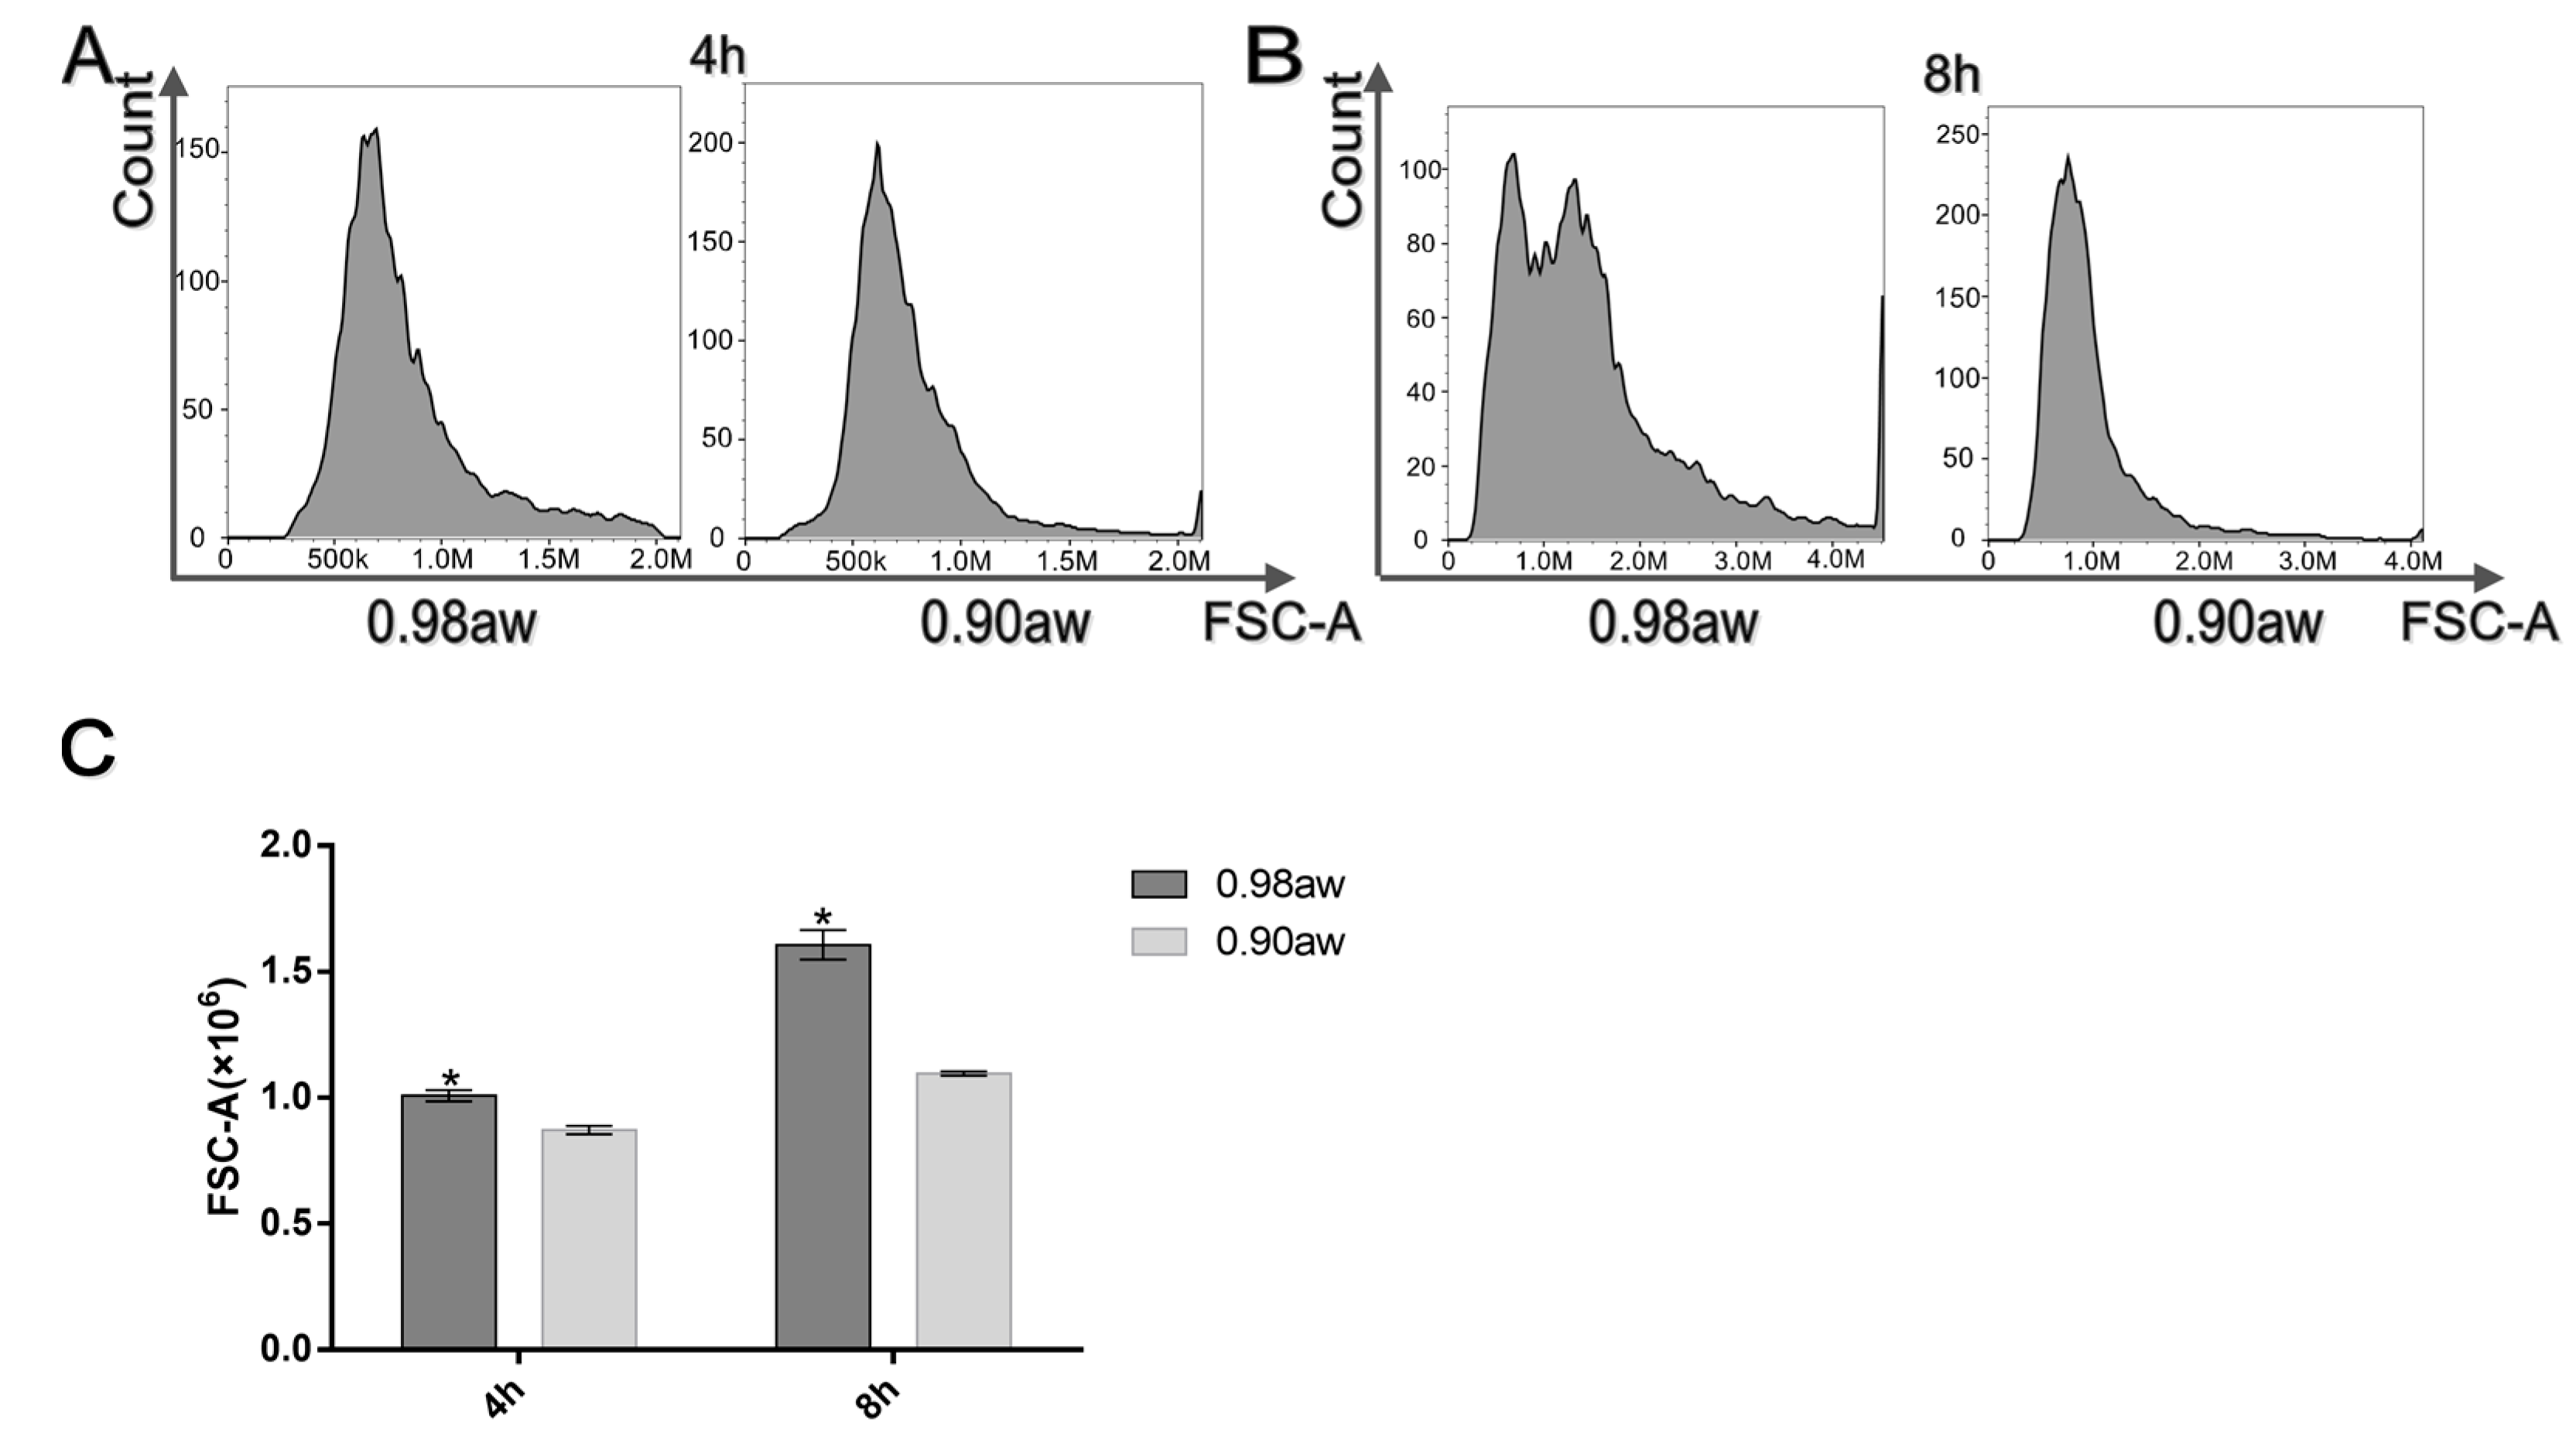
Figure 3.
Summary of regulated genes. − (0.98 aw) and + (0.90 aw) represented two different aw; the value of gene expression is significantly (p < 0.05) differentially expressed (>two-fold) between the two groups. (A) Number of different expressed genes (DEGs) in each group; the red plot indicates up-regulated gene number and the green plot indicates down-regulated number. (B) Venn of DEGs in each group. (C) Top six of Gene Ontology (GO) categorization of three independent groups. The x-axis indicates the subcategories, and the y-axis indicates the number of genes in the same category. (D) Top six of GO categorization of combined analysis of three different groups. The red columns represent molecular function, green columns represent cellular component, blue columns represent biological process. Top 10 of KEGG pathways in 4 h (E), 8 h (F) and 12 h (G) group. The x-axis indicates the pathways, and the y-axis indicates the number of genes. (H) Top 10 of KEGG pathways of combined analysis of three groups.
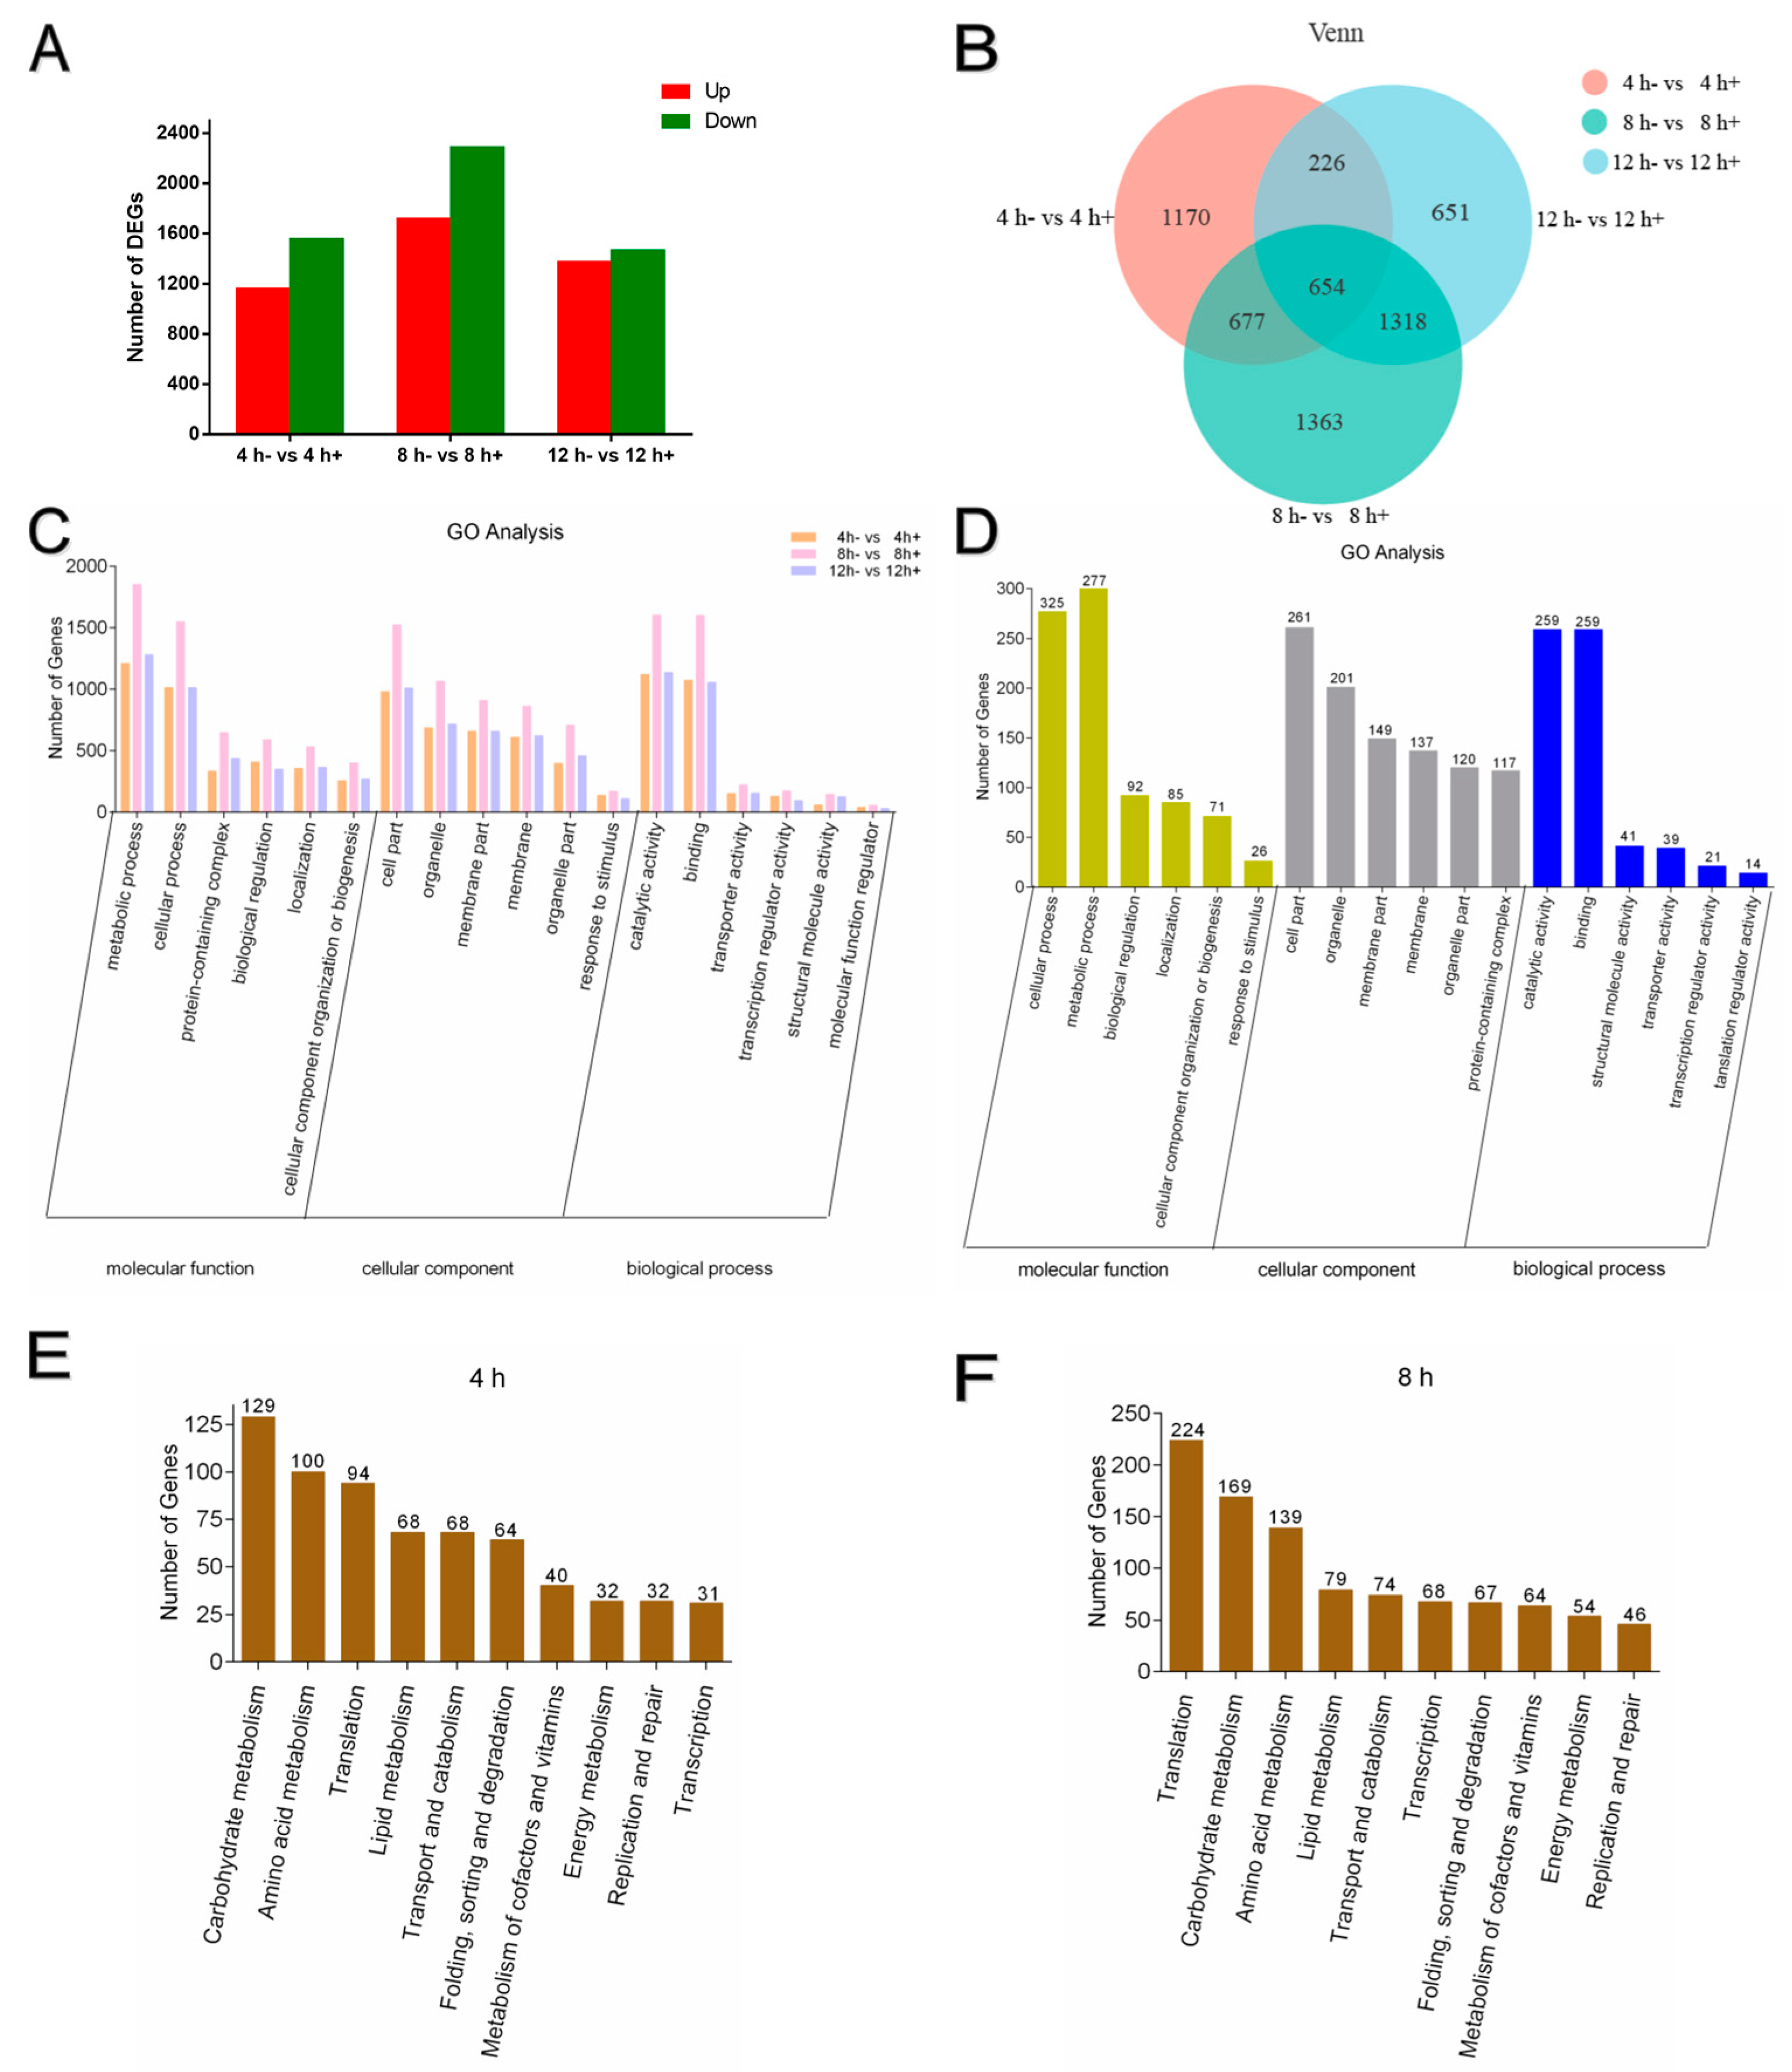

Figure 4.
Fold change (FC) and real-time quantitative PCR of high regulated genes in three dominant pathways. − (0.98 aw) and + (0.90 aw) represented two different aw. Fold change of regulated genes in carbohydrate metabolism (A), amino acid metabolism (C) and translation (E). Real-time quantitative PCR of the four genes in carbohydrate metabolism (B), amino acid metabolism (D) and translation (F). The means and standard errors of duplicate samples have been plotted (n = 6). Mean values with * were significantly different (p < 0.05).
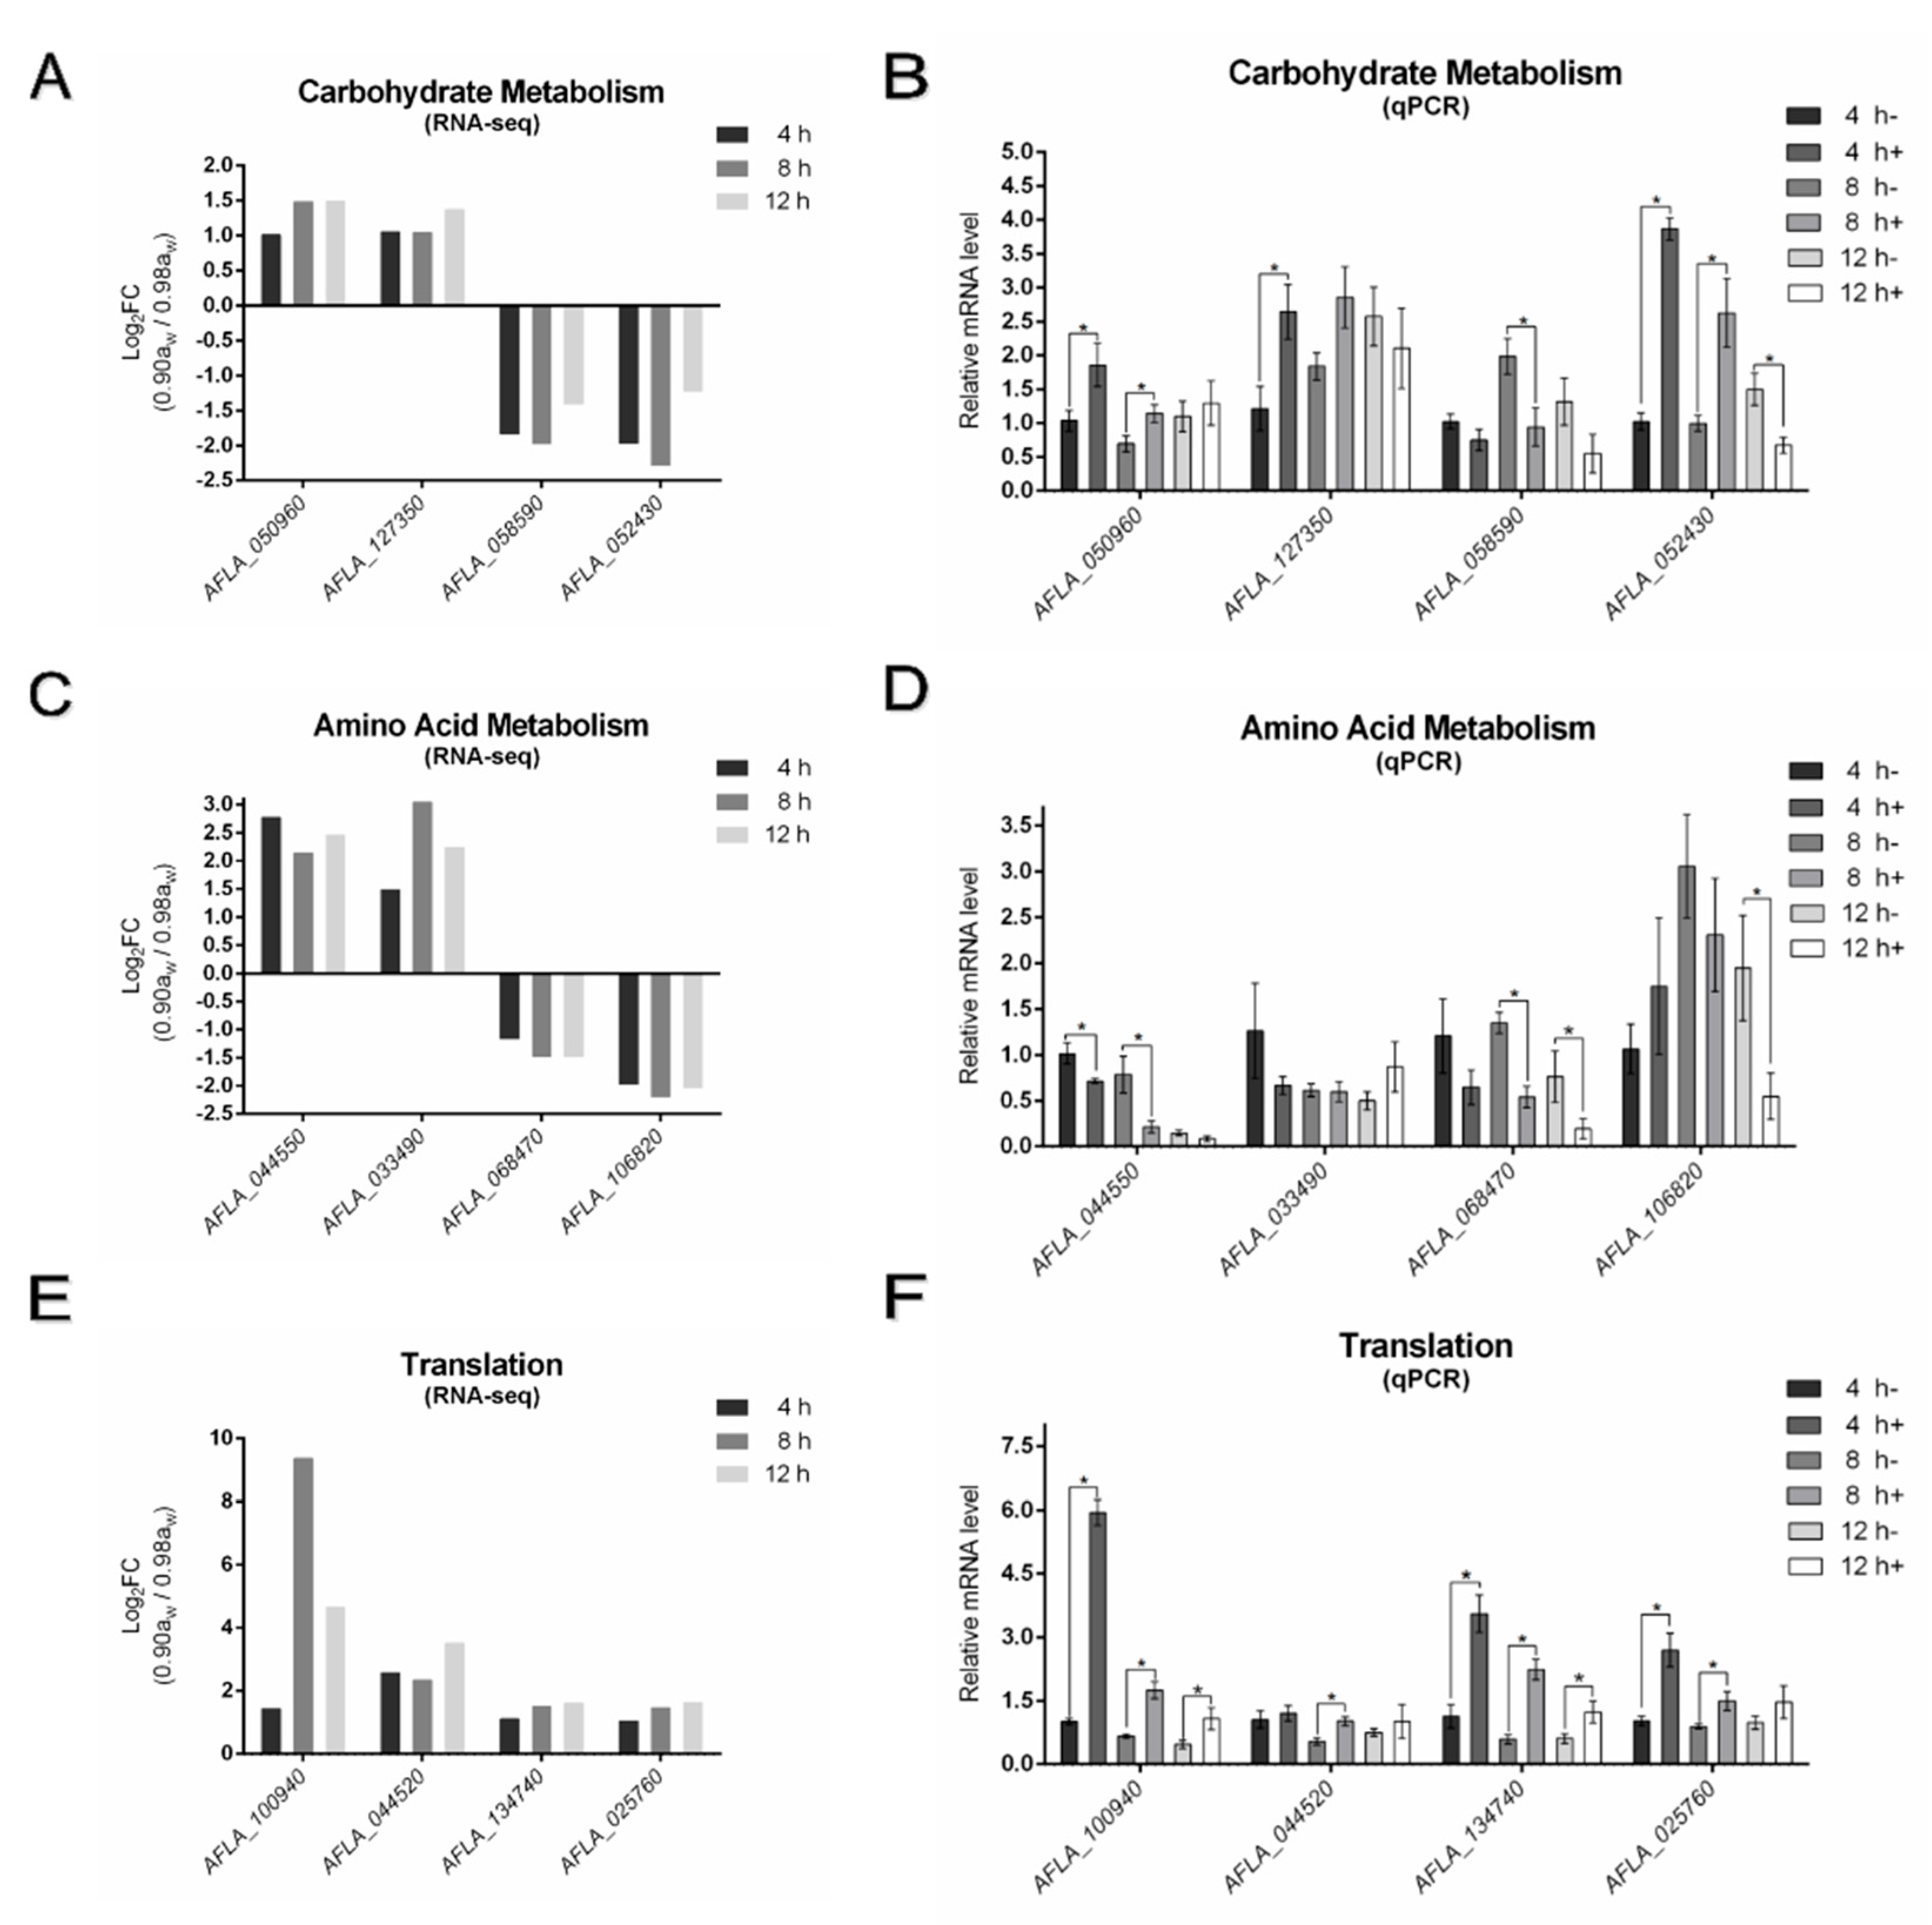
Figure 5.
Summary of regulated proteins. The value of protein expression is significantly (p < 0.05) differentially expressed (>1.5-fold) between two groups. (A) The volcano plot of regulated proteins. Red dots represent up-regulated, green dots represent down-regulated and grey dots represent no significance (compared to the 0.98aw group). The x-axis indicates fold change (log2FC), and the y-axis indicates p-value (log10 p). (B) GO categorization of different expressed proteins of two aw groups (C) Top 10 of KEGG pathways of different expressed proteins. The x-axis indicates the pathways, and the y-axis indicates the number of proteins.
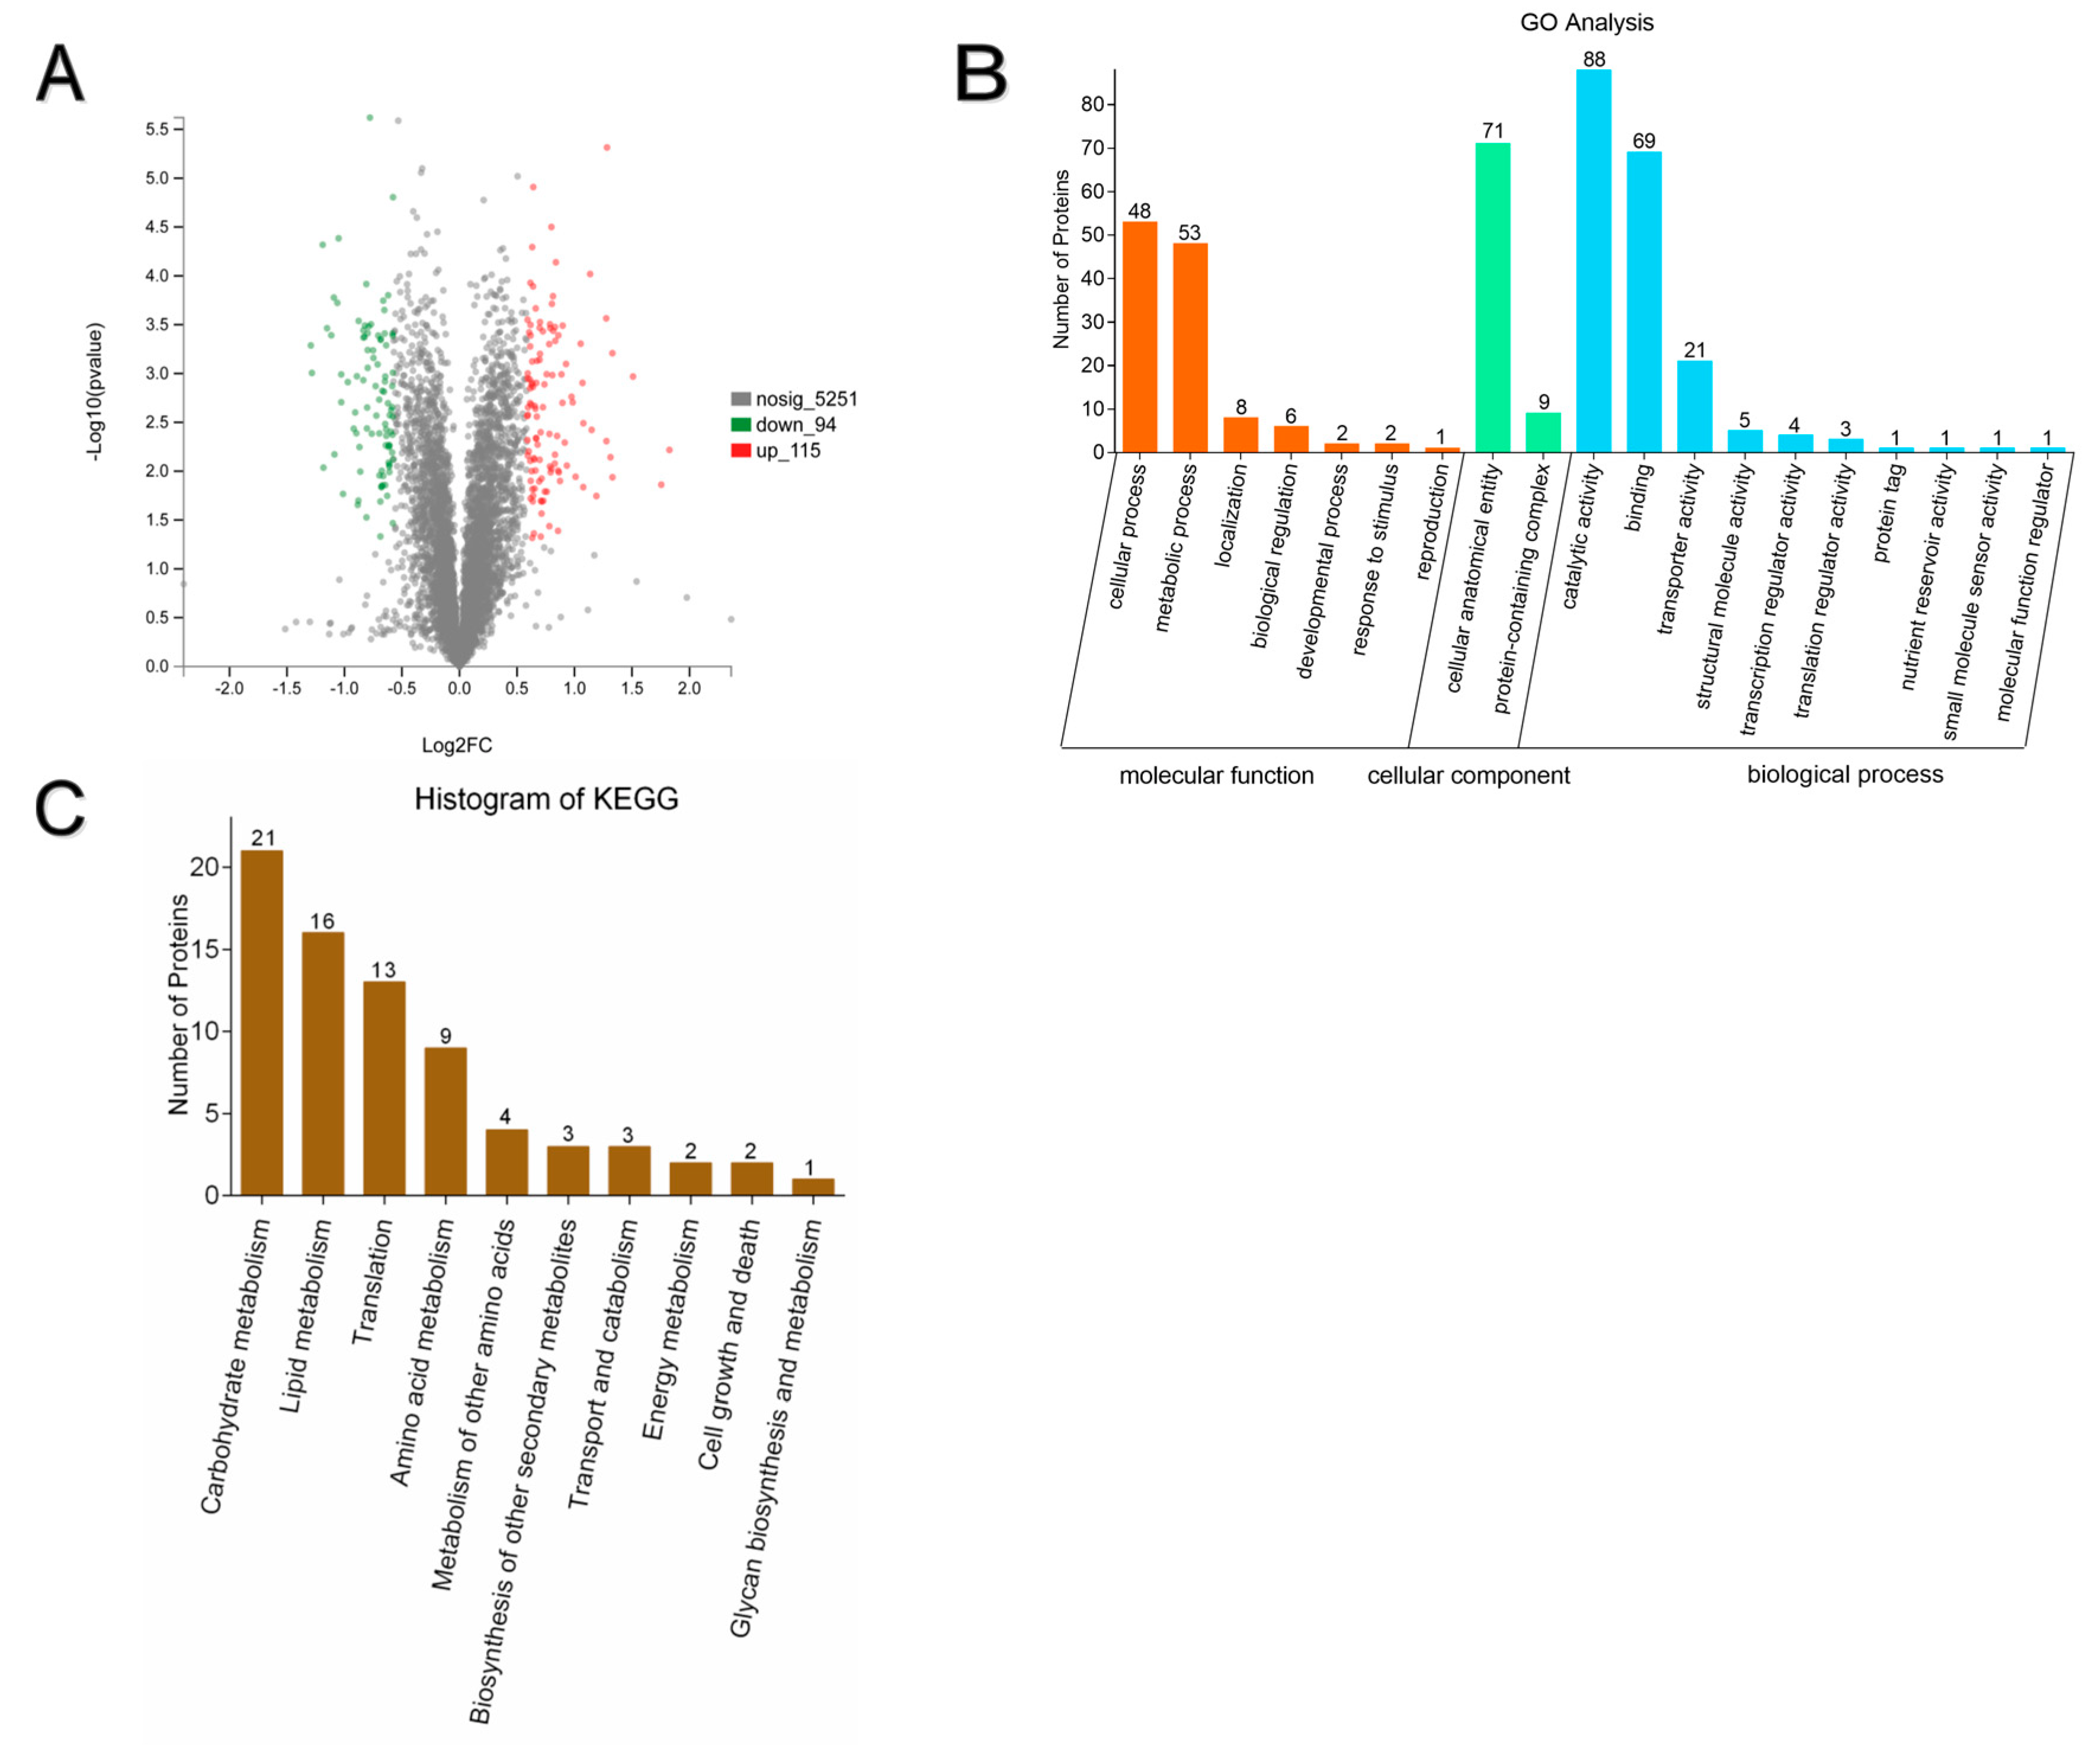
Figure 6.
Combined analysis of transcriptomics and proteomics. The value of gene expression is significantly (p < 0.05) differentially expressed (>2-fold), value of protein expression is significantly (p < 0.05) differentially expressed (>1.5-fold) between two groups. (A) Venn of relationship between genes and proteins (B) Venn of matched differentially expressed genes and proteins (C) GO categorization of matched differentially expressed genes and proteins (D) Top 10 KEGG pathways of matched differentially expressed genes and proteins.

Publisher’s Note: MDPI stays neutral with regard to jurisdictional claims in published maps and institutional affiliations. |
© 2022 by the authors. Licensee MDPI, Basel, Switzerland. This article is an open access article distributed under the terms and conditions of the Creative Commons Attribution (CC BY) license (https://creativecommons.org/licenses/by/4.0/).
Share and Cite
MDPI and ACS Style
Jia, S.; Li, C.; Wu, K.; Qi, D.; Wang, S. Effect of Water Activity on Conidia Germination in Aspergillus flavus. Microorganisms 2022, 10, 1744. https://doi.org/10.3390/microorganisms10091744
AMA Style
Jia S, Li C, Wu K, Qi D, Wang S. Effect of Water Activity on Conidia Germination in Aspergillus flavus. Microorganisms. 2022; 10(9):1744. https://doi.org/10.3390/microorganisms10091744
Chicago/Turabian StyleJia, Sifan, Chong Li, Kuntan Wu, Desheng Qi, and Shuai Wang. 2022. "Effect of Water Activity on Conidia Germination in Aspergillus flavus" Microorganisms 10, no. 9: 1744. https://doi.org/10.3390/microorganisms10091744
Note that from the first issue of 2016, this journal uses article numbers instead of page numbers. See further details here.