An Image Analysis Approach to Microgrippers Displacement Measurement and Testing
by
 , ,
, ,
Francesco Orsini
1 ,
,
Federica Vurchio
1,
Andrea Scorza
1,*,
Rocco Crescenzi
2 and
Salvatore Andrea Sciuto
1 1
Department of Engineering, Roma Tre University, via della Vasca Navale, 79-00146 Roma, Italy
2
Department of Information Engineering, Electronic and Telecommunications, Sapienza University of Rome, Via Eudossiana, 18-00184 Roma, Italy
*
Author to whom correspondence should be addressed.
Actuators 2018, 7(4), 64; https://doi.org/10.3390/act7040064
Submission received: 5 September 2018
/
Revised: 19 September 2018
/
Accepted: 20 September 2018
/
Published: 24 September 2018
(This article belongs to the Special Issue Micromanipulation)
Abstract
:The number of studies on microgrippers has increased consistently in the past decade, among them the numeric simulations and material characterization are quite common, while the metrological issues related to their performance testing are not well investigated yet. To add some contribution in this field, an image analysis-based method for microgrippers displacement measurement and testing is proposed here: images of a microgripper prototype supplied with different voltages are acquired by an optical system (i.e., a 3D optical profilometer) and processed through in-house software. With the aim to assess the quality of the results a systematic approach is proposed for determining and quantifying the main error sources and applied to the uncertainty estimation in angular displacement measurements of the microgripper comb-drives. A preliminary uncertainty evaluation of the in-house software is provided by a Monte Carlo Simulation and its contribution added to that of the other error sources, giving an estimation of the relative uncertainty up to 3.6% at 95% confidence level for voltages from 10 V to 28 V. Moreover, the measurements on the prototype device highlighted a stable behavior in the voltage range from 0 V to 28 V with a maximum rotation of 1.3° at 28 V, which is lower than in previous studies, likely due to differences in system configuration, model, and material. Anyway, the proposed approach is suitable also for different optical systems (i.e., trinocular microscopes).
1. Introduction
Microgrippers are MEMS technology-based devices, able to manipulate objects with dimensions of the order of 10−6 m. The development and diffusion of such devices is increased considerably thanks to the advent of D-RIE (Deep Reaction Ion Etching) manufacture technology, which led the construction even on a micrometer scale. The microgrippers under study in this article are made up of flexible beams, and the mechanism that allows the movement of these devices is based on a particular and innovative hinge, called a conjugate surface flexure hinge (CSFH), which can be built as a monolithic body and easily integrated into any mechanical structure of a MEMS. These devices are actuated by innovative capacitive rotary comb-drives that can generate a torque when driven by an applied voltage (Figure 1). Based on the theoretical model in [1], to perform an electro-mechanical characterization of these devices, in [2] the behavior of Comb-Drive as studied when a potential difference is applied. In this study, however, some important characteristics such as mass and material effects were neglected and the rotary capacitors were assumed as parallel plates. To validate the theoretical results and obtain a more realistic and accurate model, a numerical simulation based on Finite Element Method (FEM) was also proposed. Moreover, through the Direct Method, it was possible to validate the theoretical behavior, solving the problem of offering a good angle of rotation while minimizing the maximum internal stress. Through a Finite Element Analysis (FEA) simulator, the displacement of the clamps according to the applied potential difference [3] were studied. In addition, in [4], simulations have been conducted on V-Rotation Comb-Drive and V-Force relationships. Thanks to these studies a quadratic behavior of the relationship between the applied voltage and the angular rotation of the Comb-Drive was determined. Despite the great variety of applications involving microgrippers, such as biology [5,6], surgery [7,8] or aerospace [9,10], very few works reported measurement data for the experimental characterization of such devices [2] and the quality of the results is not established through an in-depth uncertainty analysis. To give a contribution to this issue, in this study an experimental approach to measure the microgripper displacements is proposed and applied to verify the theoretical relationship between the applied voltage and the Comb-Drive rotation. To this aim an uncertainty analysis of the quantities measured is also performed: an example of measurements and testing on a microgripper prototype is described here to confirm the theoretical displacement of its comb-drives by means of an optical system (profilometer) and an in-house image analysis software.
2. Materials and Methods
With the aim to properly characterize and test the microgripper behavior, many kinematic and dynamic output quantities should be measured (e.g., from position and displacement to forces and torques) and related to the input quantities supplied to the device (e.g., voltage, current), therefore a first systematic approach may consider the displacement of one or more of its components taking into account the characteristics of the experimental set up (Table 1).
In particular, with reference to Table 1 the following components have been considered:
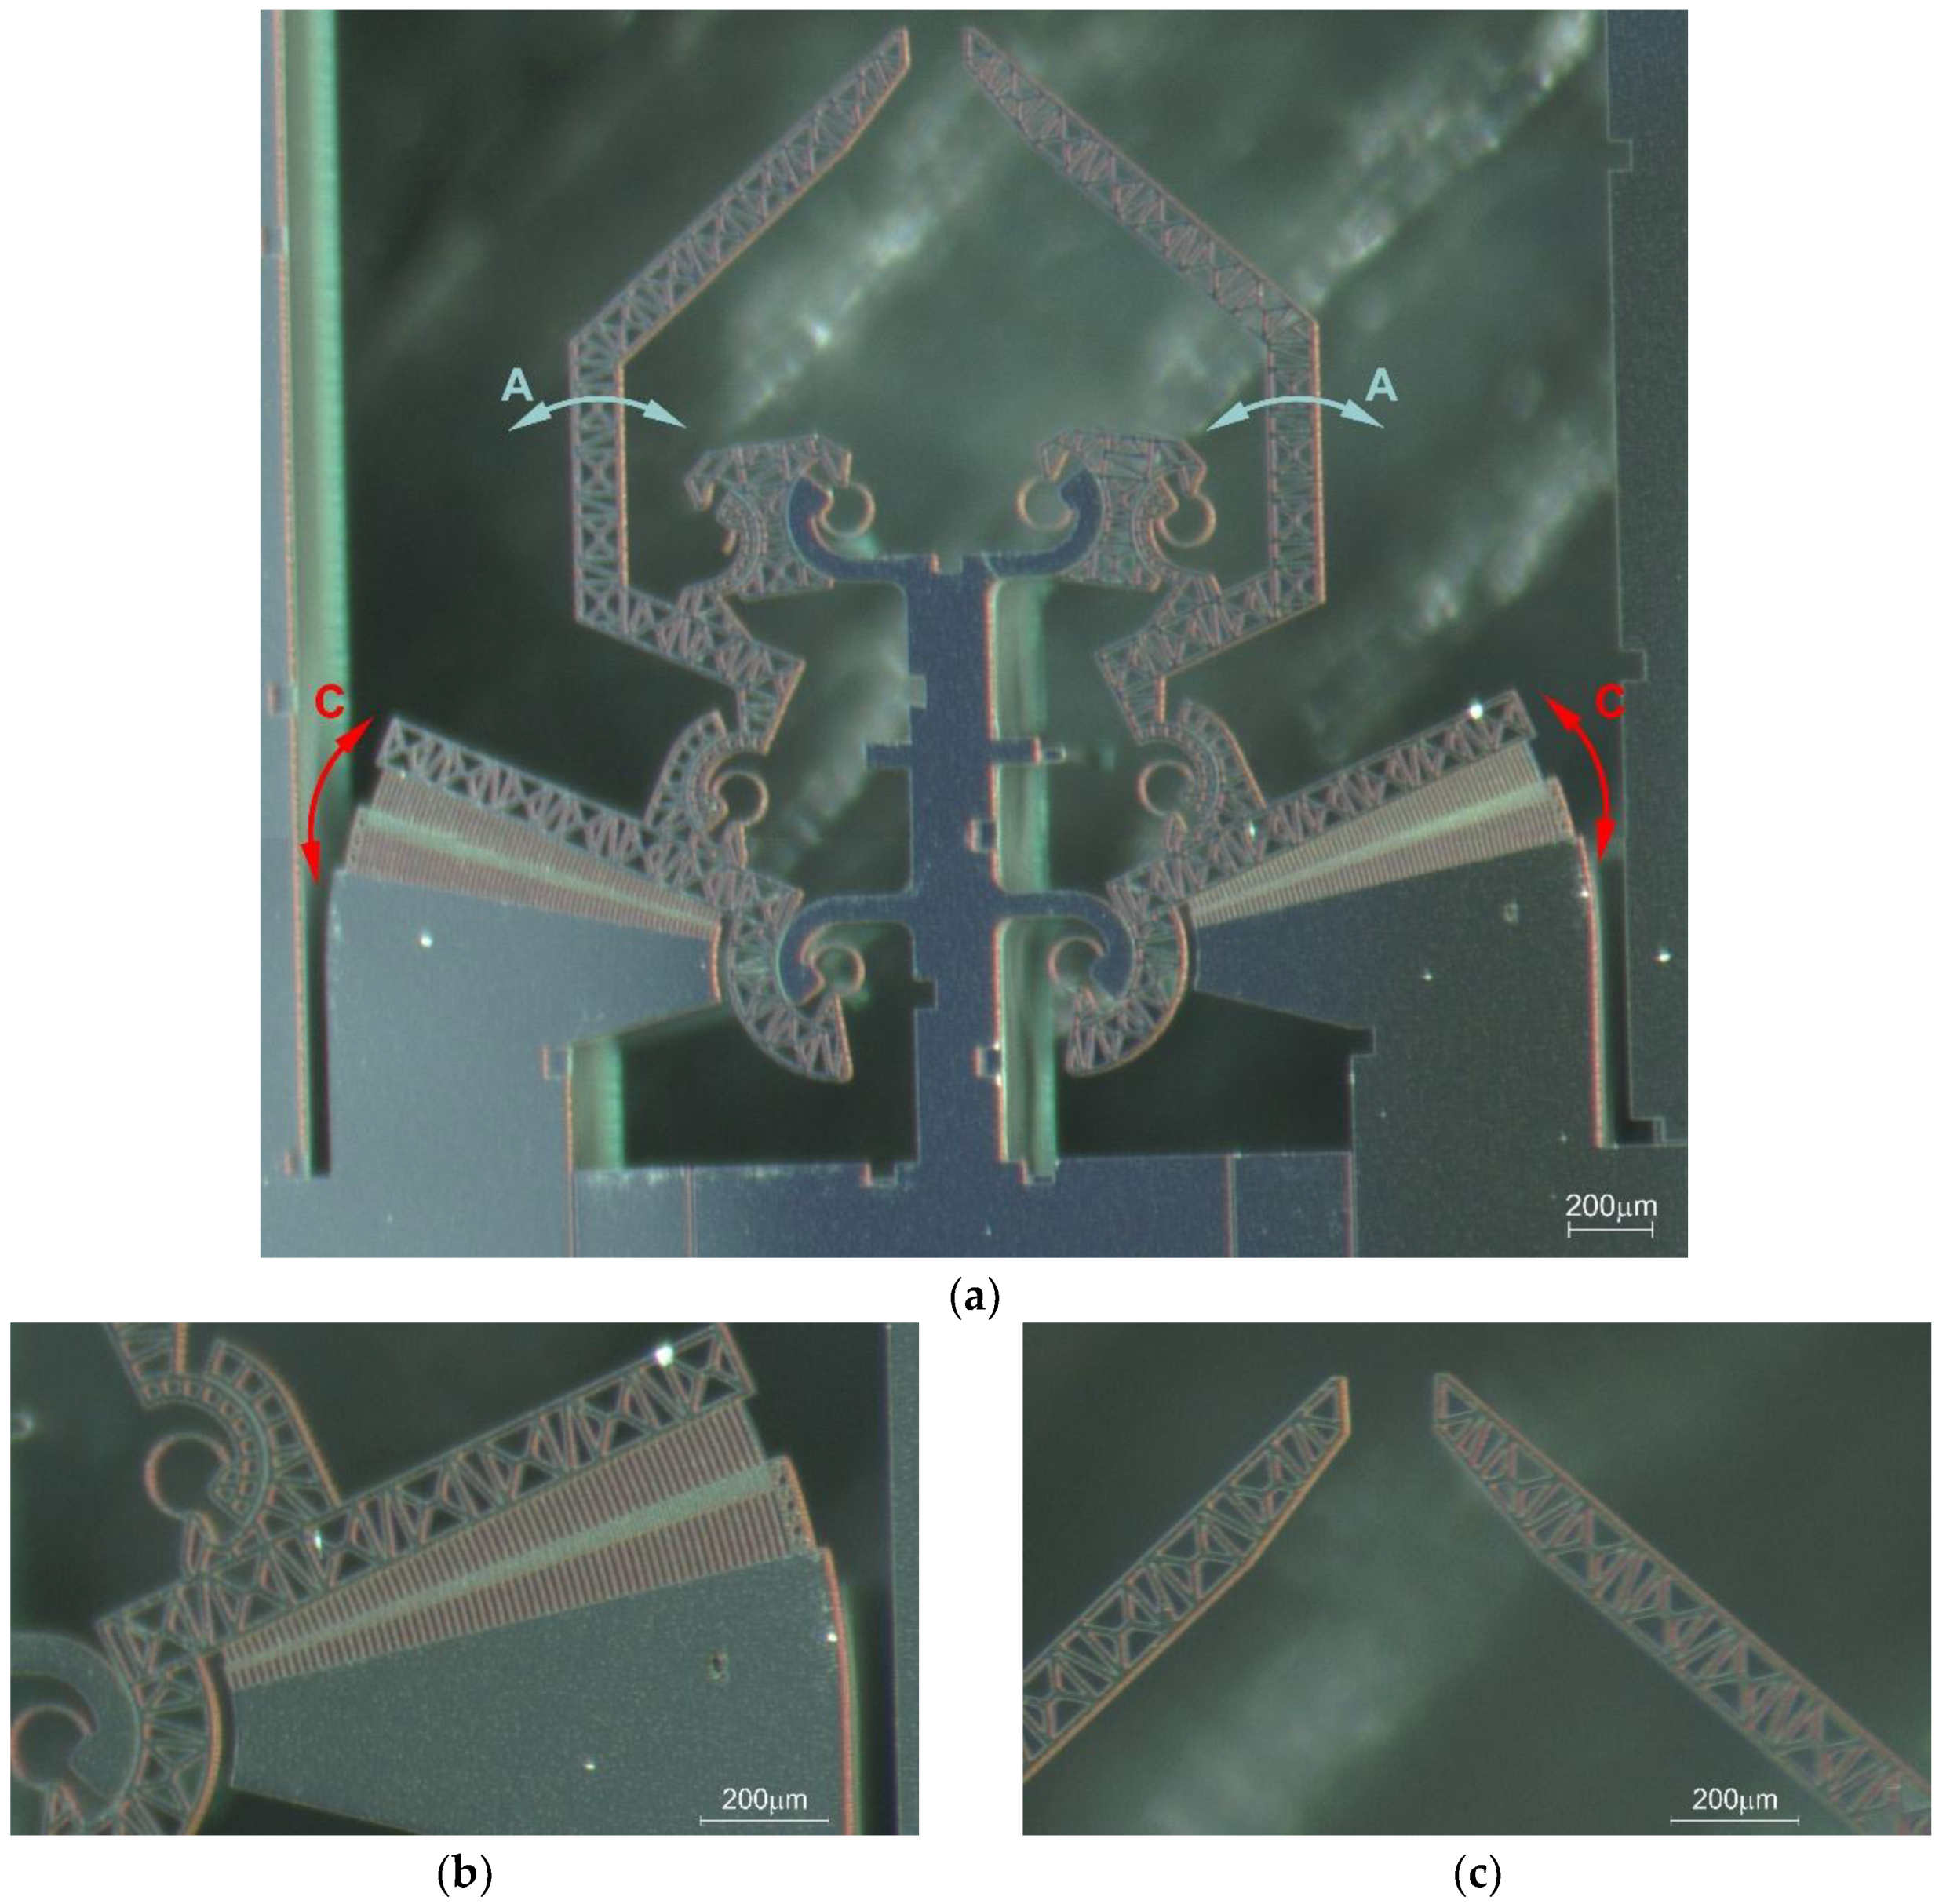
- The microgripper under study (Device Under Test or DUT), made up of flexible beams and hinges, is actuated by capacitive rotary comb-drives that generate a torque when a voltage is applied (Figure 1).
- A constant voltage source should be provided to evaluate the dependencies of the mechanical output on the voltage. In our study, the power supply device is a Keithley 236 SMU with 0.055% F.S. output voltage accuracy.
- Two micropositioners embedded with probe arms and tungsten needles have been used (Figure 2) to apply the voltage to the DUT.
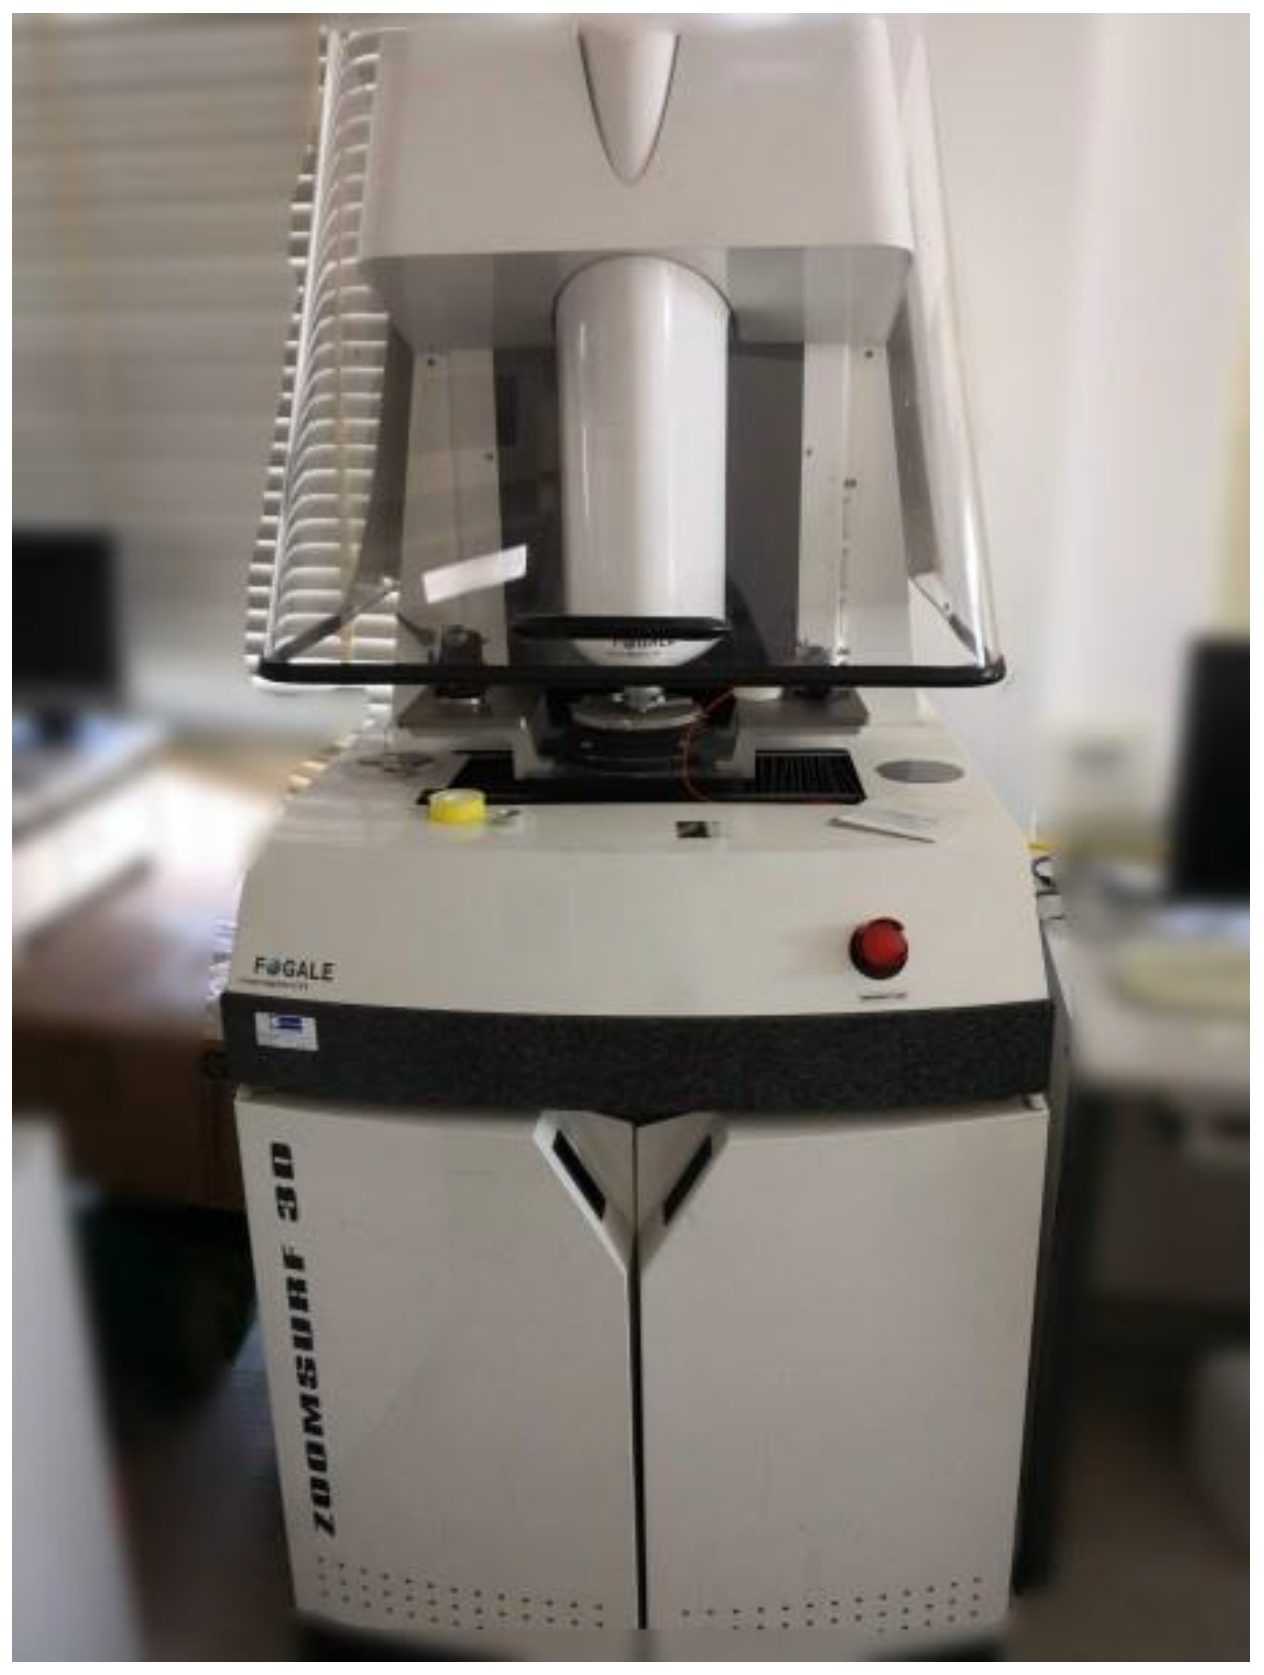
- The microgripper displacements have been measured from images acquired and collected by a Fogale Zoomsurf 3D optical profiling system (Figure 3). The maximum resolution is limited by the diffraction as in conventional optical microscopes to 0.6 μm and the vertical resolution reaches 0.1 nm. The digital image resolution is 0.6 pixel/μm therefore each pixel corresponds to about 1.6 μm. Taking into account that to clearly discriminate 2 point objects in a digital image, 3 pixel are needed in the best case [11,12], the total lateral accuracy into the digital image has been estimated to be ±2 pixel (about ±3.3 μm).
- The acquired images have been processed by an in-house software developed in MATLAB® and a notebook PC. From the analysis of the image sequences, the movement of the components has been measured by means of a template-matching algorithm. A set of images has been acquired, each one corresponding to a specific voltage setting: to calculate the angular displacement, the first acquired image (0 V) has been compared with the others (i.e., 2 V, 4 V, ..., 28 V) through the following steps:
- Step 1:
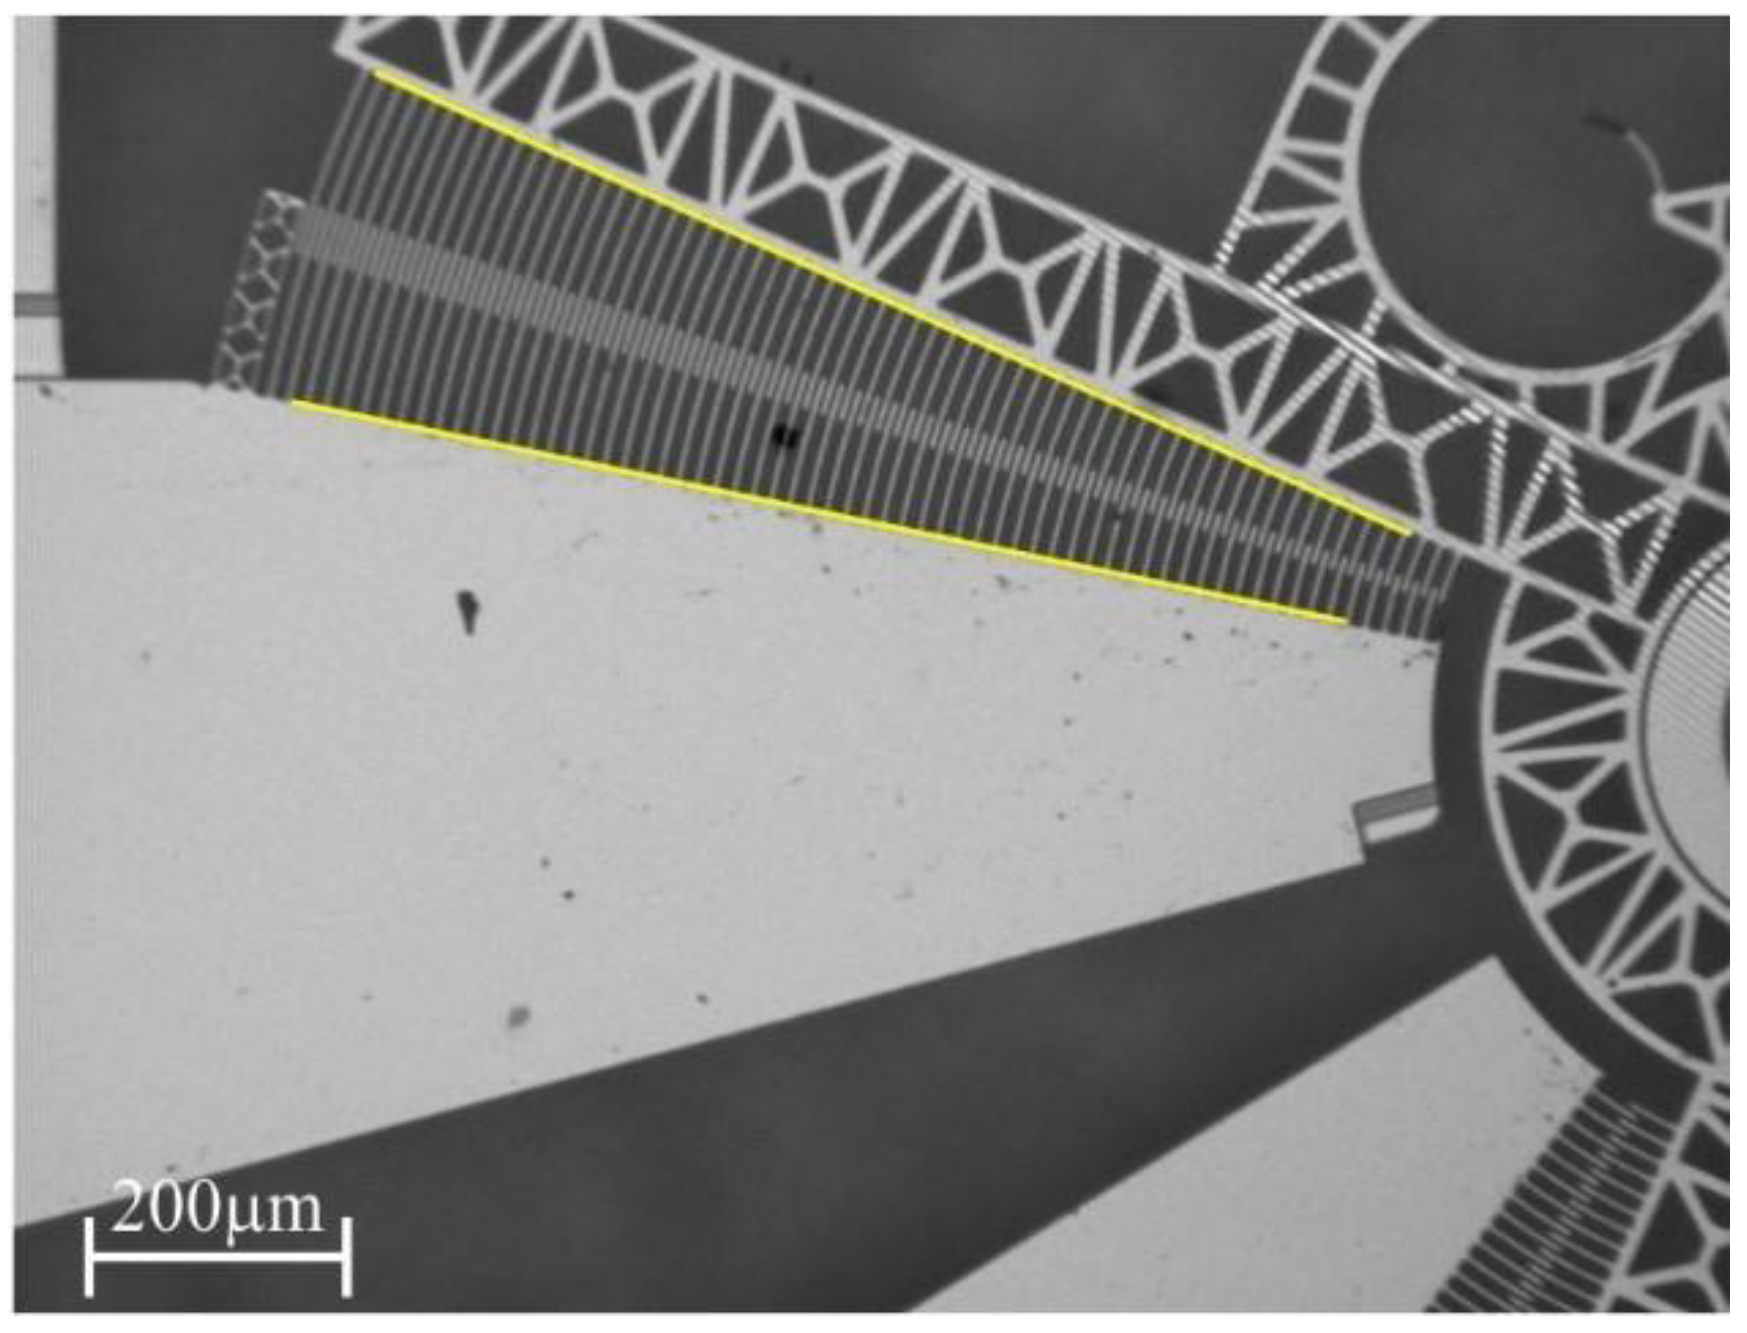
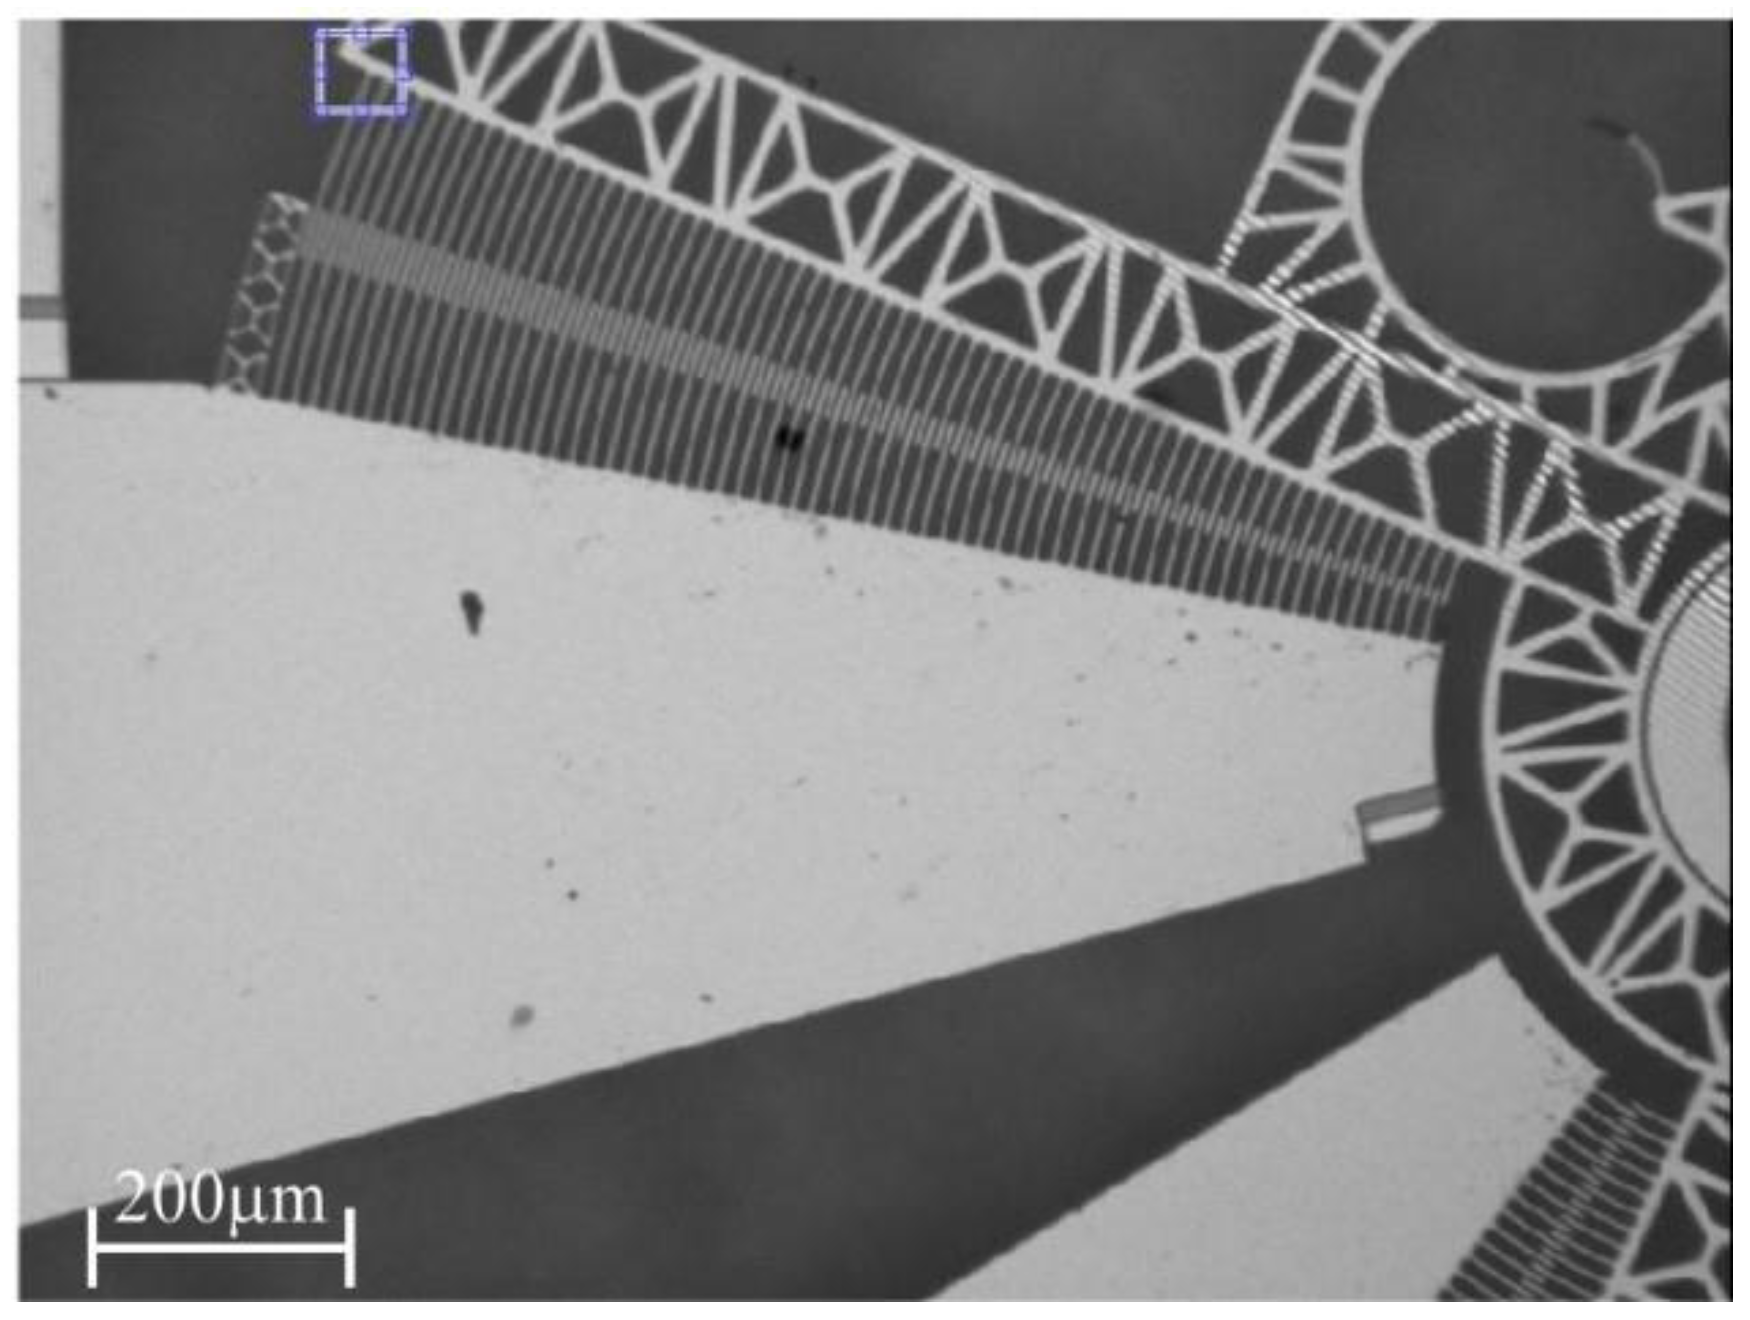
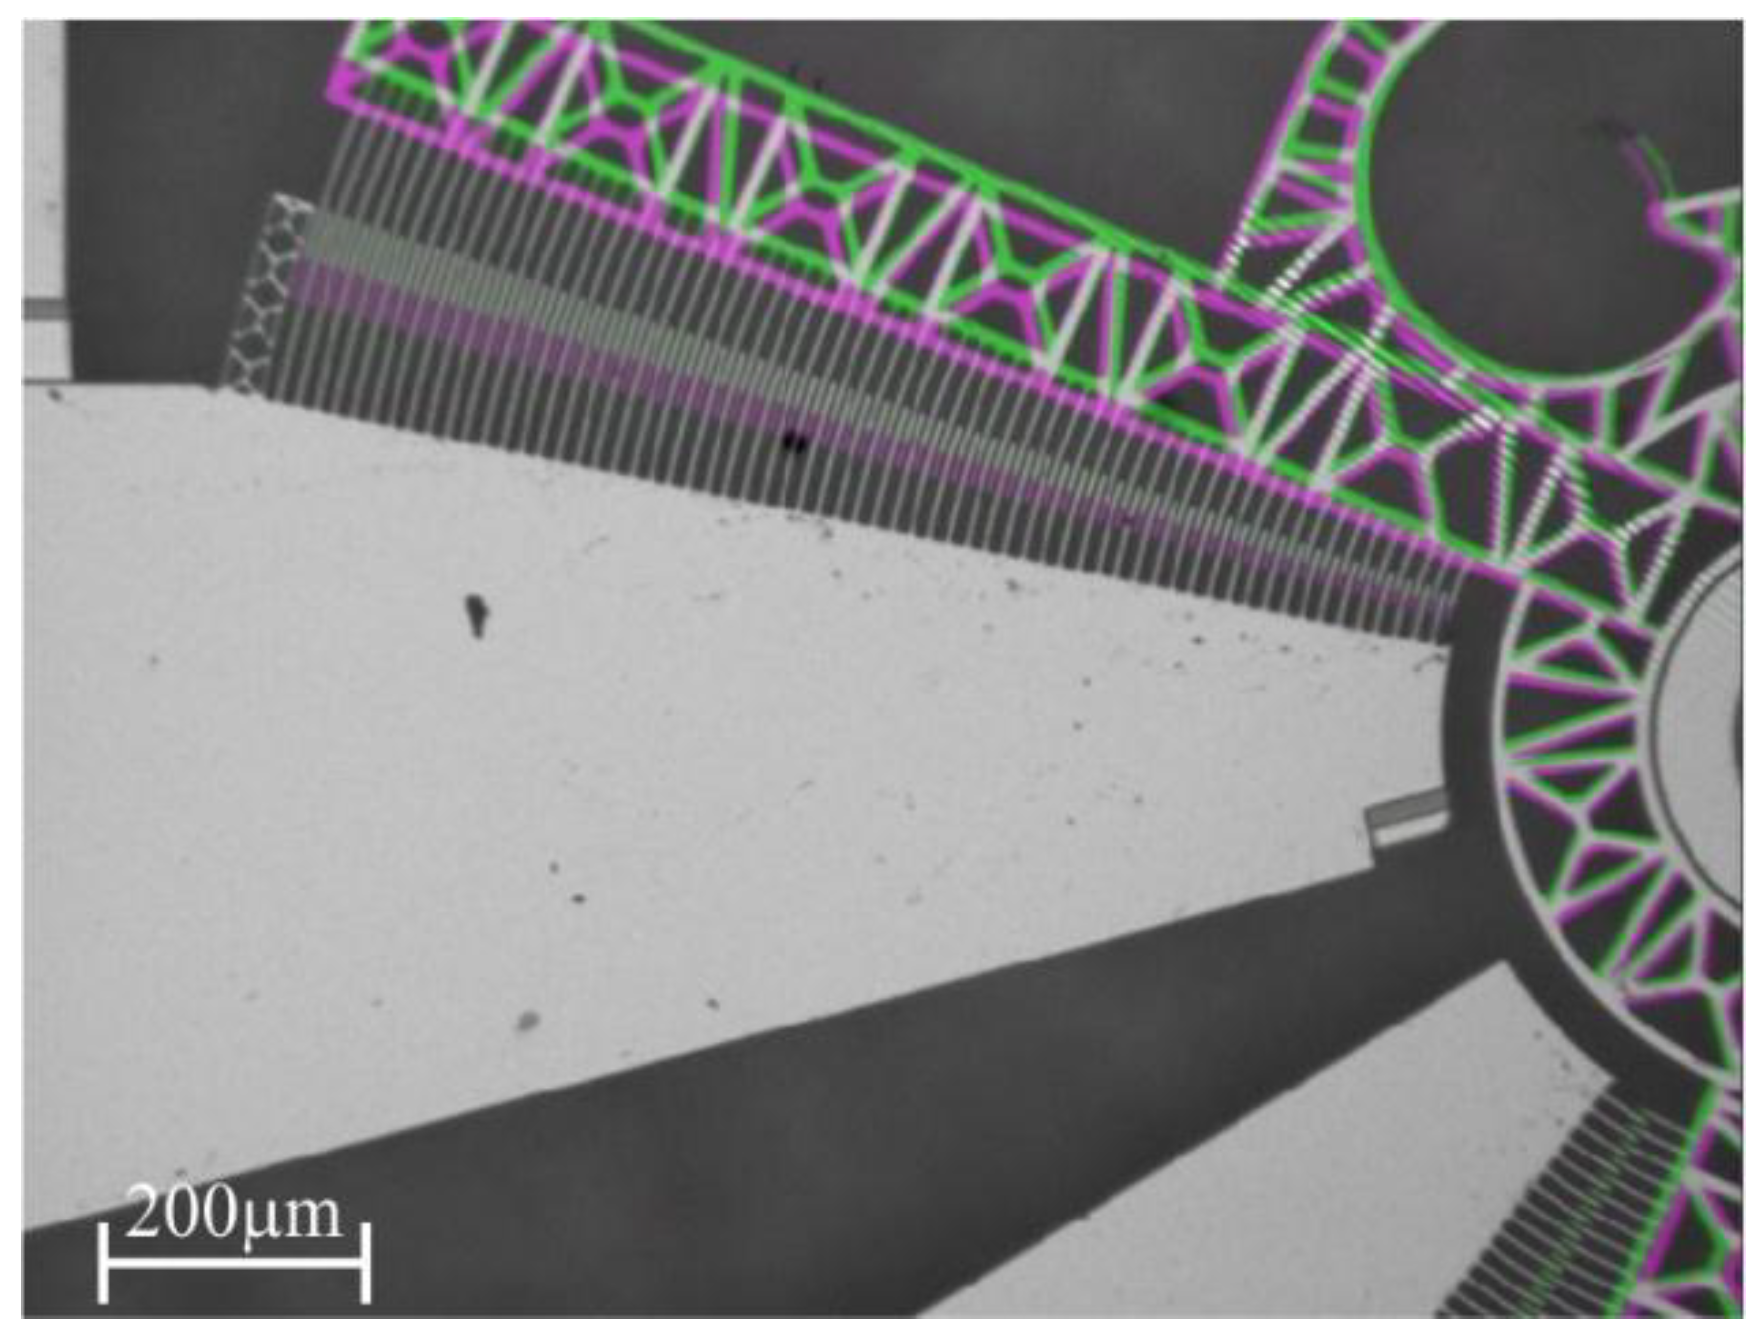
- The initial coordinates of the Comb-drive ICR (Instant Center of Rotation) are estimated. As shown in Figure 4, four points are manually selected on the edges of the Comb-Drive, and the intersection of the two corresponding lines coincided with the ICR of the Comb-Drive. The second phase involves the manual selection of a particular Region of Interest (ROI) on the image. The Comb-Drive under examination, has been designed in such a way that it has a static part anchored to the structure of the MEMS device and a mobile part. In Figure 4 the lower part is the static one. As shown in Figure 5, a ROI can be selected on the mobile part of device’s Comb-Drive to determine the angular displacement (see step 2). Figure 6 shows the superposition of two images in the sequence, one corresponding to no actuation (the neutral configuration) and one corresponding to a 28 V applied voltage.
- Step 2:
- The coordinates of the following three points are used: the most distant point from the ICR on the fixed Comb-Drive part, the ICR of the Comb-Drive and the center of the ROI. They determined a triangle, where the vertex ICR corresponds to the angular opening of the Comb-Drive.
- A match is found between the coordinates of the selected ROI on the first image (see step 1) and on all the subsequent images. Through this operation the in-house software can detect the new coordinates of the ROI’s center of gravity for each subsequent image and therefore for each applied voltage. On the hypothesis of no deformation due to the movement of the Comb-Drive, the rigid movement of the device keeps unchanged the points on the bottom left and that corresponding to the ICR. Therefore, for each subsequent image in the sequence, the coordinates of the center of the ROI are detected and used to identify a new triangle and consequently a new angular opening of the Comb-Drive for each applied voltage.
- From the angular aperture of the Comb-Drive at each voltage, the corresponding angular displacement is obtained.
The above steps can be easily adapted to measure the movement of other elements of the microgripper and are suitable on digital images produced also by systems different from that used in this work. On the other hand, it is important to consider the errors due to the variability of the parameters related to the manual selection of the operator, together with the uncertainty of the code itself. For this reason, an uncertainty analysis has been made considering the above issues by means of Monte Carlo Simulation (MCS).
First of all, an uncertainty analysis of the errors due to the experimental setup has been done, therefore the main uncertainty sources have been identified and evaluated, as shown in Table 2 where for each source a probability density function PDF together to the uncertainty type, mean m and standard deviation σ is determined.
- Power supply uncertainty has been evaluated trough the data sheet and a Gaussian distribution has been assumed, therefore the corresponding standard deviation σ is evaluated from the declared uncertainty u as σ = u/2.
- DUT stage: orientation and vibrations of the DUT stage are related to a change in image focusing during measurements. The corresponding uncertainty has been assumed negligible as the setup is mounted on an optical table with a pneumatic suspension system and at each step a correct image focusing is maintained.
- Optical system and digital image: as described before the uncertainty due to the use of the optical profilometer has been evaluated considering its maximal lateral resolution and the digital resolution of the acquired image, i.e., 0.6 µm and 1.6 µm/px, respectively. As shown in Figure 7, Figure 8, Figure 9 and Figure 10, two point objects in a digital image are resolved if they are separated by 1 or more pixel depending if they are centered or not on a picture element. In the best case (i.e., for high contrast and Signal to Noise Ratio) the minimum distance needed between them should be about 3 pixels [11,12], therefore in this study a uniform uncertainty distribution with a 2 pixels semi-amplitude is assumed.
To evaluate the accuracy of image processing software, a simulation was implemented in MATLAB® in accordance with the MCS Method. In this procedure the uncertainty sources were introduced by the variability of the parameters related to the manual selection of the operator. In particular:
- Uncertainty due to point selection: with the aim to determine the ICR, the operator manually selects some points on the image. This operation is performed only once at the beginning of the measurement process, and even if the coordinates of these points are confined to a limited region of space (the mobile edge of the Comb-Drive), there is a variability introduced by the nature of the manual process. Under the same conditions (same image selected and same operator), a set of 10 consecutive tests were carried out and a dispersion of ±2 pixels was estimated. A uniform distribution U (m, σ) was also assumed with semi-amplitude of 2 pixels and mean m from the average of the 10 tests.
- Uncertainty related to ROI position in the template-matching algorithm: the operator arbitrarily chooses the ROI position in the image. Although the ROI lies in a limited region of the image (i.e., the mobile part of the Comb-Drive), an uncertainty is introduced by the variability of the manual selection. Also, in this case, a set of 10 consecutive tests were carried out and a dispersion of ±2 pixels was determined: a uniform distribution U (m, σ) was assumed with a 2-pixel semi-amplitude and mean m from the average of the 10 tests.
- Uncertainty related to ROI size in the template-matching algorithm: in the same way, the ROI size selected by the operator may vary. Under the same conditions (same image selected and same operator), also in this case a set of 10 consecutive tests were carried out and a ±2 pixels dispersion was estimated. A uniform distribution U (m, σ) was also assumed with mean value equal to the average of the 10 trials and a 2-pixel semi-amplitude.
- Uncertainty of template-matching algorithm: also, the template-matching gives a contribution to uncertainty as described in [13], nevertheless it is included in the MCS results, as the final data dispersion is affected by this source of error too.
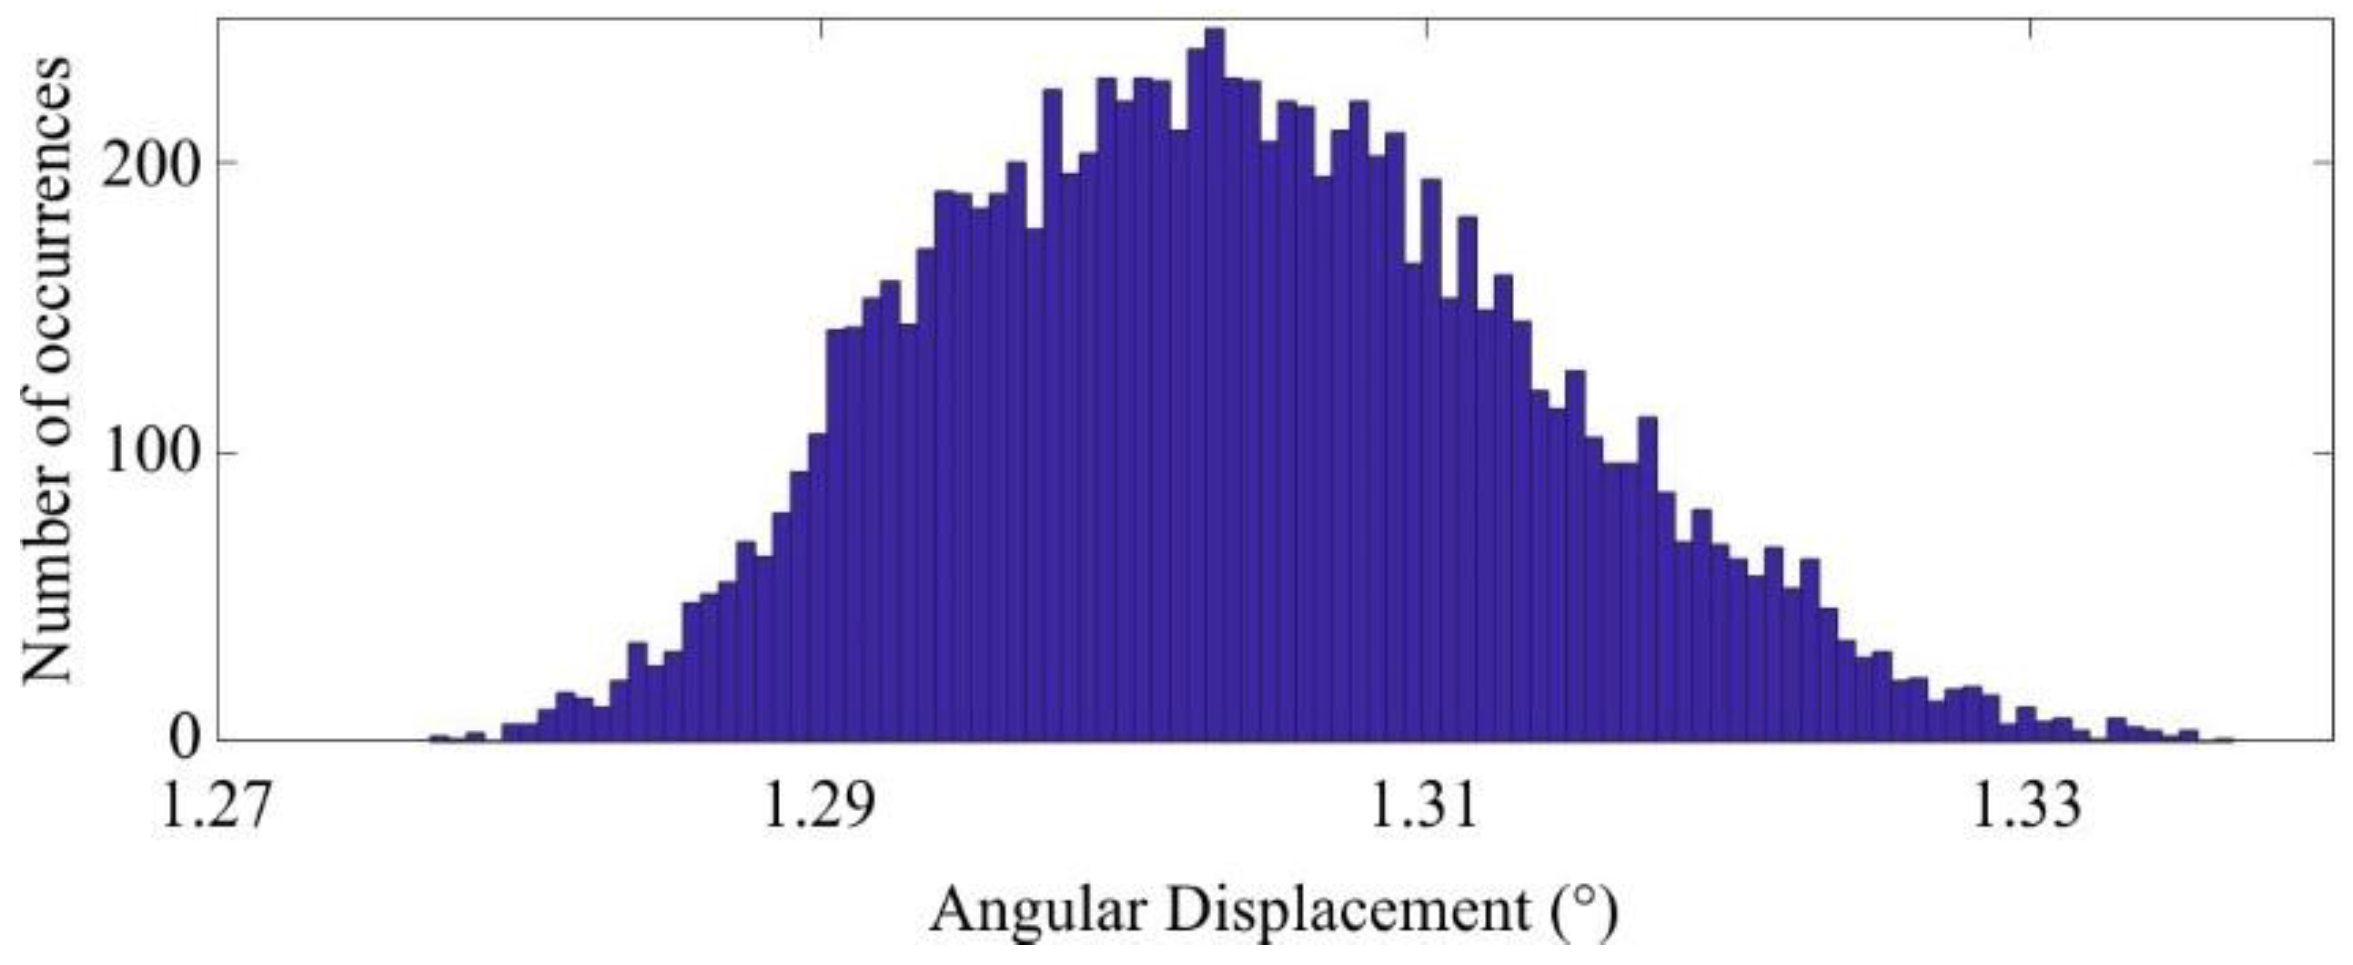
Once the distributions related to the variability of manual selection processes have been established, the process of calculating the angular displacement of the Comb-Drive is performed 10,000 times (i.e., 10,000 iterations in the MCS), for an applied potential difference of 28 V. This procedure is carried out to verify the distribution of the angular displacements when the above parameters change.
The total uncertainty uc of the displacement measurement is evaluated as suggested in [13] with the following expression:
where uA and uB are the type A and type B overall uncertainty respectively. In particular, uA is the uncertainty contribution evaluable with a statistic analysis of the measurements dispersion obtained with the system and uB is the overall uncertainty from the main error sources related to the experimental setup. To also evaluate the uncertainty contribution of the power supply the relation f between the voltage V and the angular displacement α has been considered. The uB can be written as:
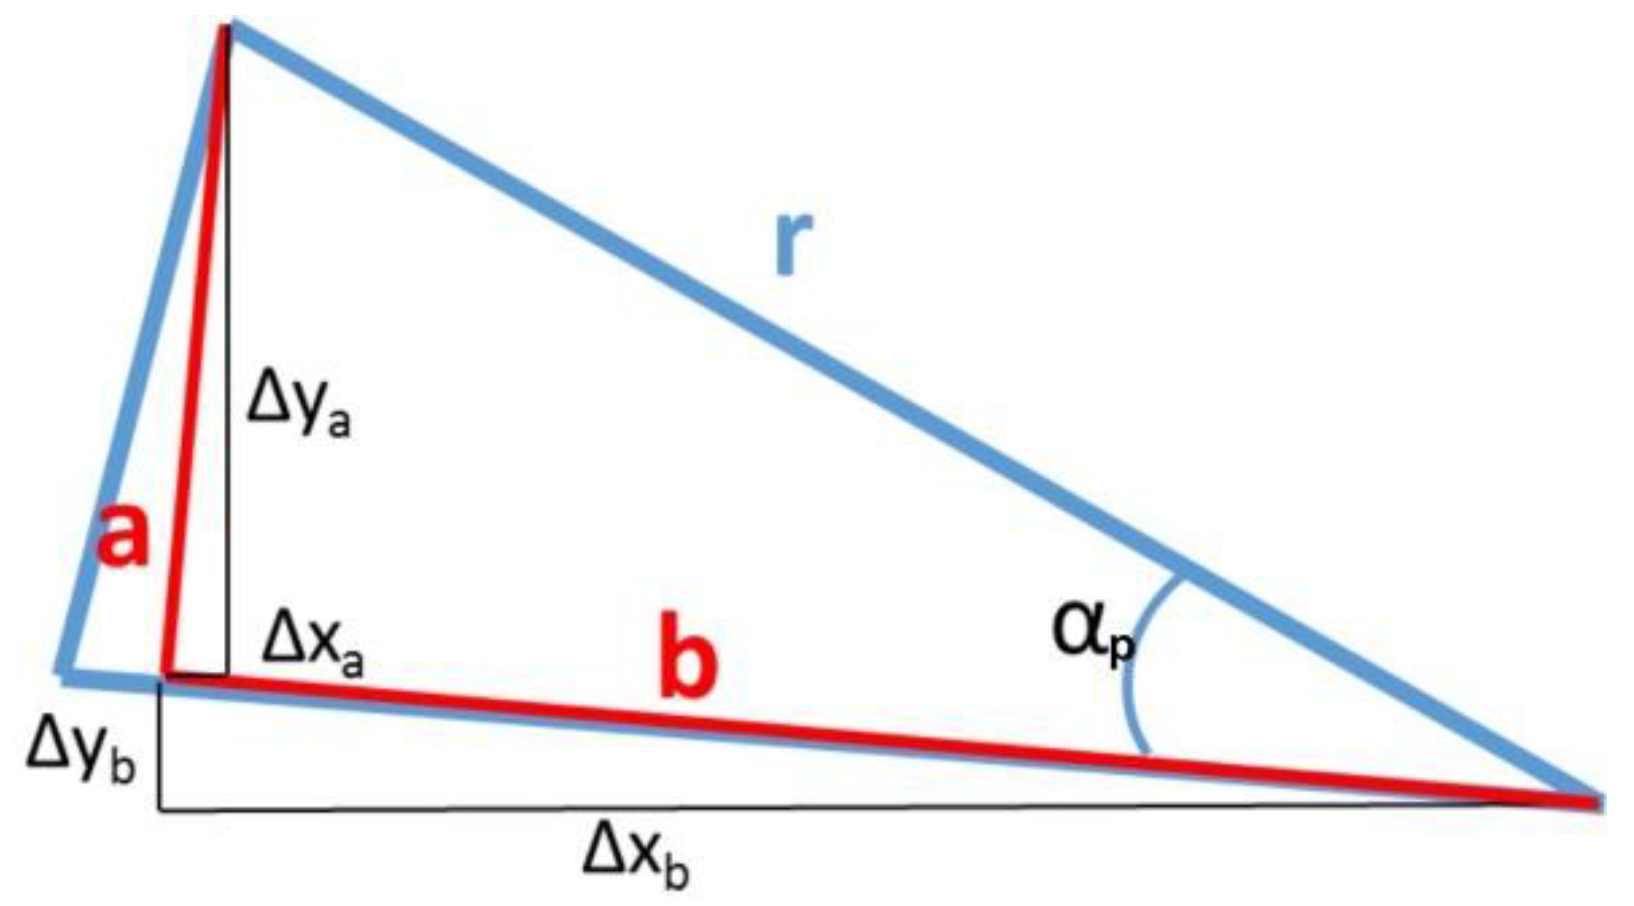
where αp are the angle measurement uncertainty due to the profilometer system (optical and A/D conversion), αs is the angle measurement uncertainty due to the implemented software system, δV the uncertainty on the supply voltage and ∂f/∂V is the derived function that described the correlation between the supply voltages and the Comb-Drive rotations [13]. This last uncertainty contribution has been evaluated through an MCS. To evaluate the αp contribution, the angle has been measured by means of the triangular properties as shown in Figure 11 and (3).
From Figure 11 the values a and b are obtained from the Δx and Δy lengths, following the expressions in (4):
The quantities a and b in (6) depend on the image resolution and size. For this study, the lengths of the Comb-Drive triangle in the image are considered for the maximum rotation, i.e., Δxa = 25 pixel, Δya = 150 pixel, Δxb = 680 pixel and Δyb = 150 pixel, therefore a = 152 pixel, and b = 700 pixel.
From Table 2 and the maximum measured angle is 1.3° and the relative uncertainty is up to 3.6% for voltages higher than 10 V.
In a second step of our study some tests have been conducted to evaluate how good the microgripper behavior fits the theoretical model [2]. With this aim it has been supplied with different voltages, i.e., from 0 V to 28 V at 2 V steps, forward and backward 6 times.
In Figure 6 two superimposed images of the same Comb-Drive at different voltages are shown: the in-house software can evaluate the angle difference between them.
For each voltage value the standard deviation and the average of the angular displacement of the Comb-Drive have been measured as above. Finally, all the measurement data have been processed and interpolated to provide a curve fitting of the actual motion of the Comb-Drive depending on the voltage supply.
3. Results
From the MCS the image processing software accuracy has been estimated: as shown in Figure 12 the distribution of results followed a Gaussian curve with ±0.02° interval at a 95% confidence level (percentile values for 2.5% and 97.5% are 1.29° and 1.32° respectively). This value has been used to evaluate the total measuring system uncertainty following (1).
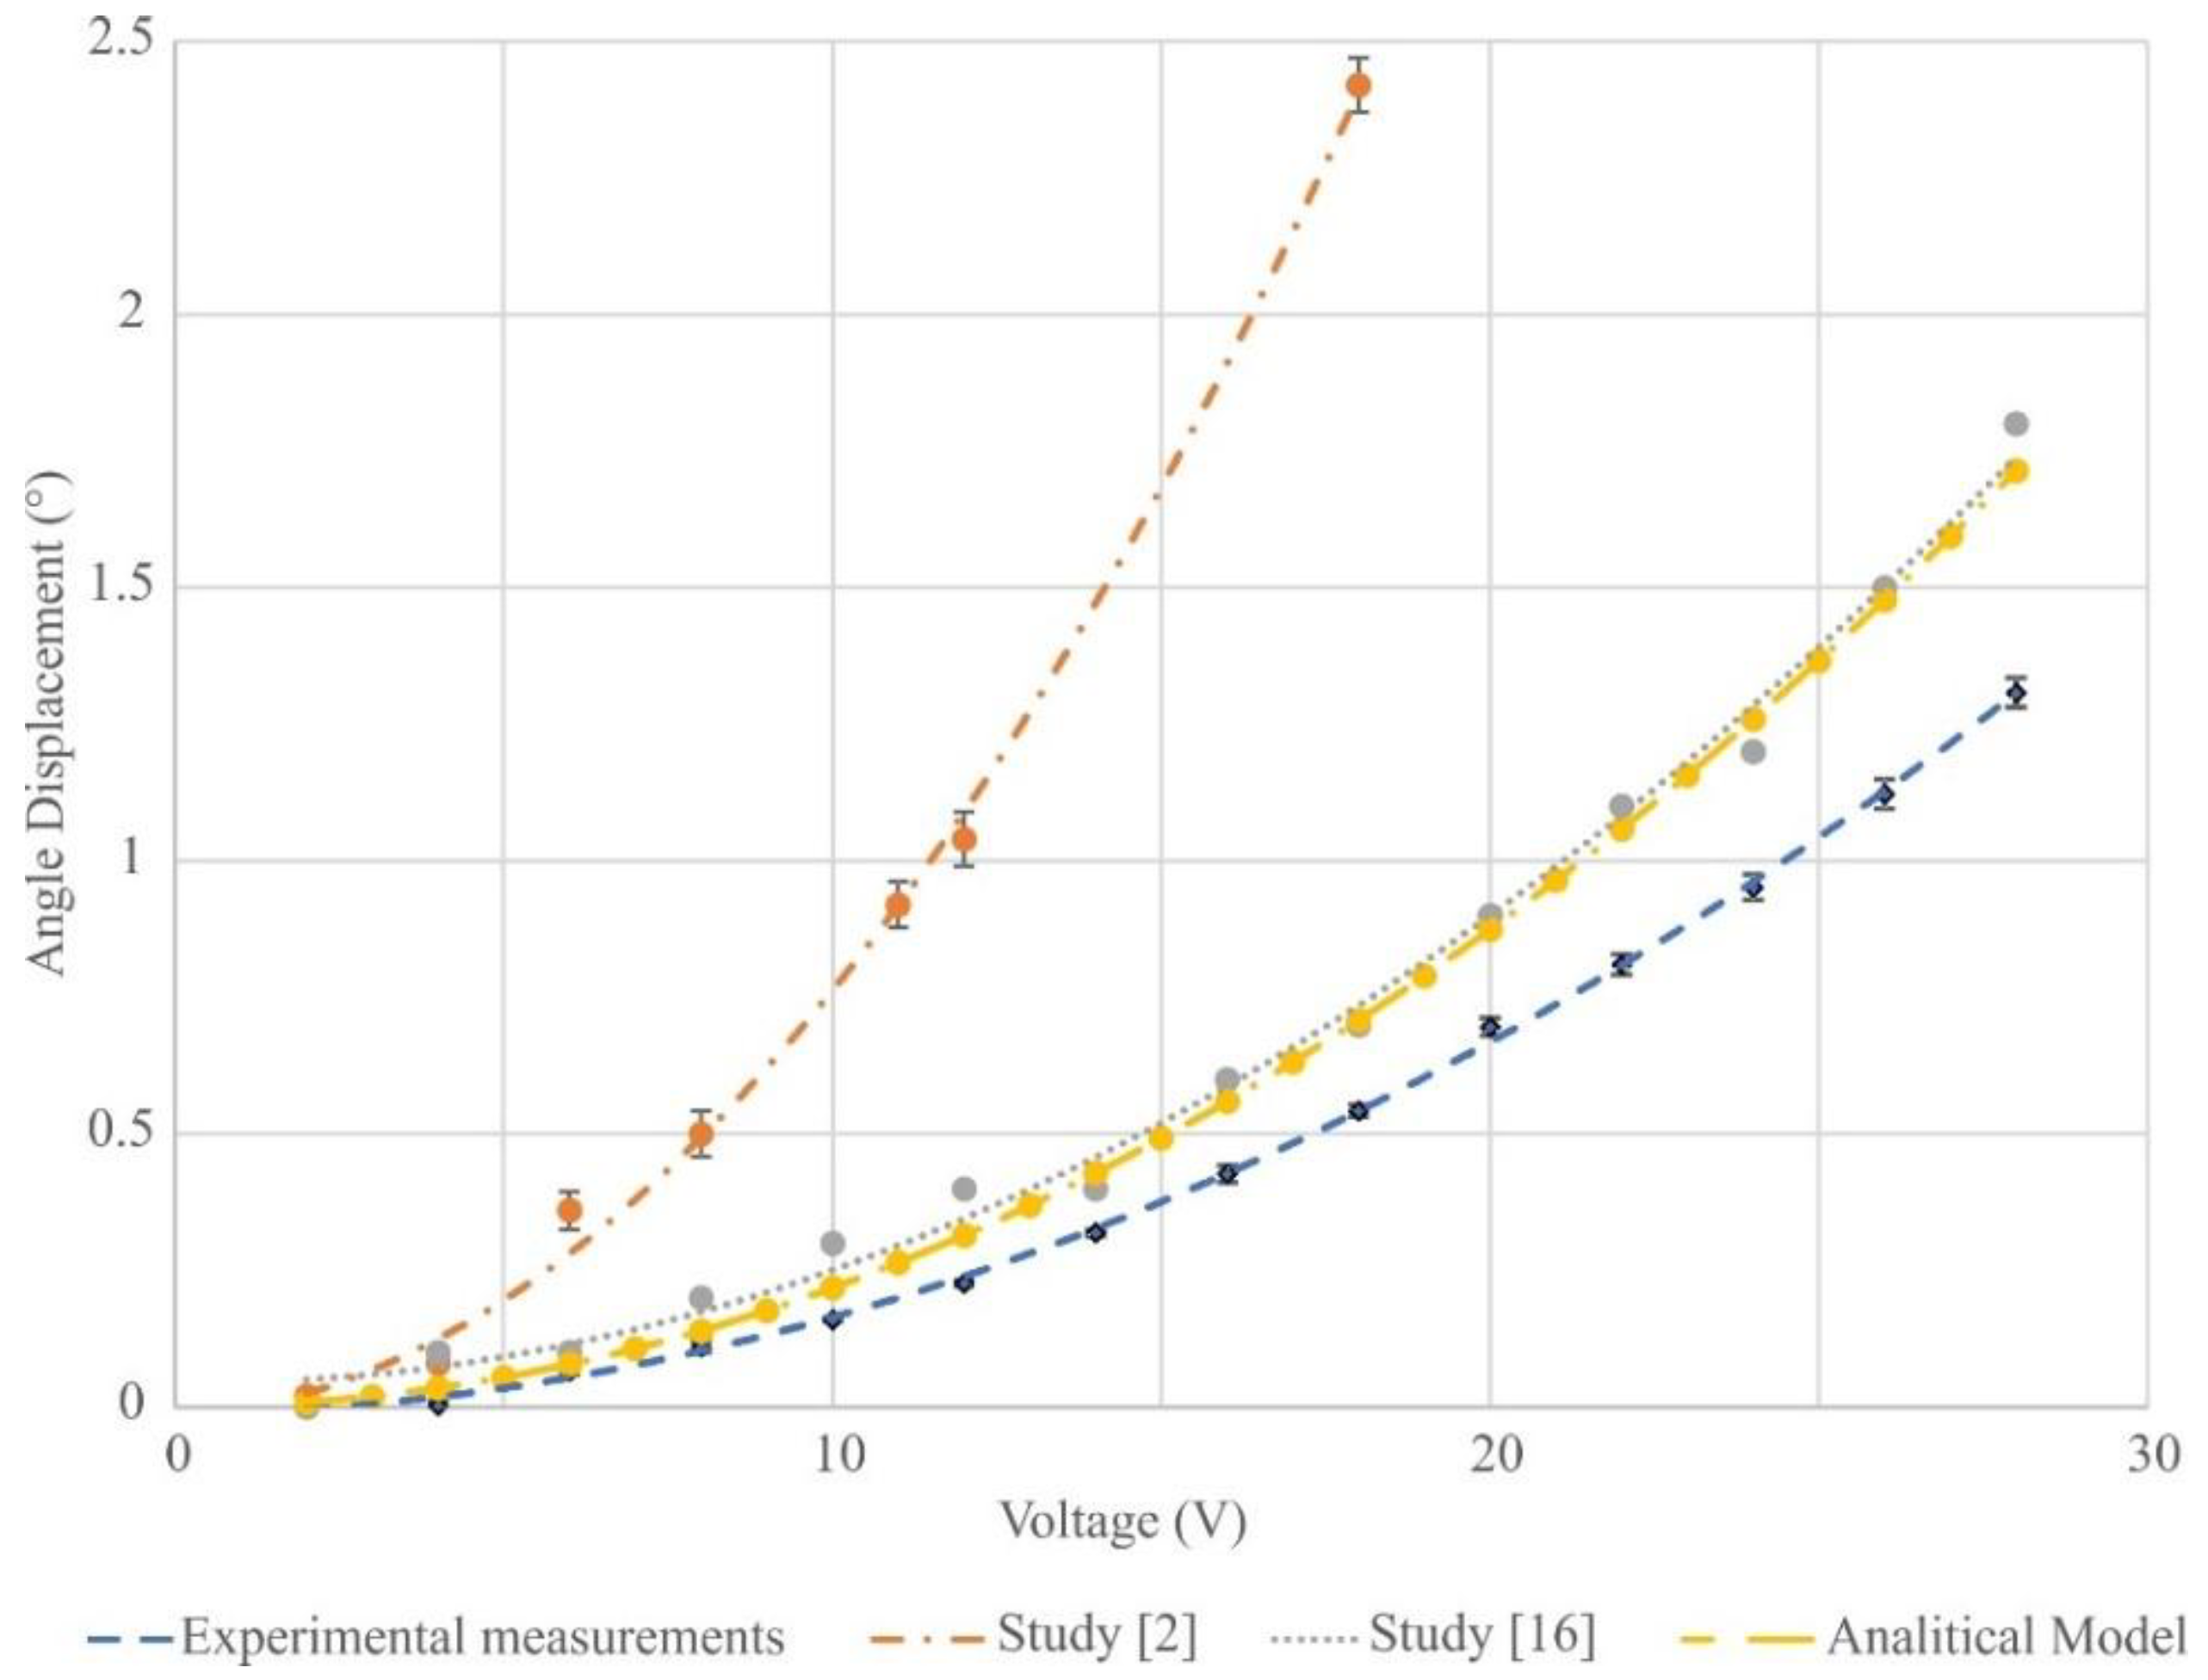
The uncertainty analysis above has been applied to angular measurements on the microgripper at different voltages (Figure 13, Table 3). Measurement data showed that the interpolating curve (voltage vs angular displacement) was similar to the numerical results and to measurements reported in other works on similar devices [2,16], but the angles measured here were usually lower for the same voltages. This different behavior is likely due to the different microgripper used (a different model, configuration, and material). Indeed, in the studies above mentioned [2,16], different microgripper configurations and models provided different angular behaviors, as shown in Table 3.
In Figure 13 the measurement results proposed here seem to be more similar to [16] than [2]. The different materials and configuration may be related to different elastic resistances in the hinges translating in different angular displacements. Anyway, a best fitting curve with a R2 = 0.999 demonstrated a coherent behavior along all the voltages: this is likely due also to the systematic approach and to the in-house software applied in this study to perform the measurements with repeatability and low-operator-dependence.
4. Conclusions
With the aim to characterize and test the behavior of a microgripper a systematic approach to measurements is proposed and applied. An experimental setup has been developed and the main sources of error have been evaluated to estimate the measurement uncertainty in angular displacements of the microgripper Comb-Drive depending on the applied voltage.
The results showed a stable behavior of the Comb-Drive with angular displacement lower than in other works, that was likely due to the different MEMS configuration and model, as the different materials and configuration could imply a different elastic resistance in the hinges evolving in different angular displacement.
The software here implemented can work on different components of the gripper (clamp instead Comb-Drive). Moreover, the method proposed can be easily applied to images provided by systems that provide bidimensional images of the microgripper in operational conditions, e.g., it can work also with images from a trinocular microscope equipped in a probe station. In this case, an in-depth analysis of the probe station characteristics and its calibration should be done. Although the overall measurement uncertainty may be higher than in the case described here, it must be pointed out that the optical microscope is a measurement system less complex and expensive than the 3D optical profilometer, therefore it may be a good trade-off between costs and results accuracy. Future works will be focused on this kind of testing system and a study on the clamp motion behavior in comparison with the Comb-Drive rotation is going to be conducted to further contribute to a more complete approach to microgripper experimental characterization and testing.
Author Contributions
Conceptualization, A.S.; Methodology, F.O., F.V. and A.S.; Software, F.O. and F.V.; Validation, F.O., F.V. and A.S.; Formal Analysis, F.O.; Investigation, F.V. and F.O.; Resources, S.A.S. and R.C.; Data Curation, F.V.; Writing-Original Draft Preparation, F.O., F.V. and A.S.; Writing-Review & Editing, A.S., F.O., F.V. and S.A.S.; Visualization, F.O. and F.V.; Supervision, A.S. and S.A.S.; Project Administration, A.S. and S.A.S.; Funding Acquisition, S.A.S.
Conflicts of Interest
The authors declare no conflict of interest.
References
- Tu, C.C.; Fanchiang, K.; Liu, C.H. 1 × N rotary vertical micromirror for optical switching applications. In Proceedings of the MOEMS-MEMS Micro and Nanofabrication, San Jose, CA, USA, 22 January 2005. [Google Scholar]
- Crescenzi, R.; Balucani, M.; Belfiore, N.P. Operational characterization of CSFH MEMS-Technology based hinges. J. Micromech. Microeng. 2018, 28, 055012. [Google Scholar] [CrossRef]
- Cecchi, R.; Verotti, M.; Capata, R.; Dochshanov, A.; Broggiato, G.B.; Crescenzi, R.; Balucani, M.; Natali, S.; Razzano, G.; Lucchese, F.; et al. Development of Micro-Grippers for Tissue and Cell Manipulation with Direct Morphological Comparison. Micromachines 2015, 6, 1710–1728. [Google Scholar] [CrossRef] [Green Version]
- Veroli, A.; Buzzin, A.; Crescenzi, R.; Frezza, F.; de Cesare, G.; D’Andrea, V.; Mura, F.; Verotti, M.; Dochshanov, A.; Belfiore, N.P. Development of a NEMS-Technology Based Nano Gripper. In Proceedings of the International Conference on Robotics in Alpe-Adria Danube Region, Torino, Italy, 21–23 June 2017. [Google Scholar]
- Panescu, D. Mems in medicine and biology. IEEE Eng. Med. Biol. Mag. 2006, 25, 19–28. [Google Scholar] [CrossRef] [PubMed]
- Kim, K.; Liu, X.; Zhang, Y.; Sun, Y. Nanonewton force-controlled manipulation of biological cells using a monolithic mems microgripper with two-axis force feedback. J. Micromech. Microeng. 2008, 18, 055031. [Google Scholar] [CrossRef]
- Gosline, A.; Vasilyev, N.; Butler, E.; Folk, C.; Cohen, A.; Chen, R.; Lang, N.; Del Nido, P.; Dupont, P. Percutaneous intracardiac beating-heart surgery using metal mems tissue approximation tools. Int. J. Robot. Res. 2012, 31, 1081–1093. [Google Scholar] [CrossRef] [PubMed]
- Benfield, D.; Yue, S.; Lou, E.; Moussa, W. Design and calibration of a six-axis mems sensor array for use in scoliosis correction surgery. J. Micromech. Microeng. 2014, 24, 085008. [Google Scholar] [CrossRef]
- Leclerc, J. MEMS for aerospace navigation. IEEE Aerosp. Electron. Syst. Mag. 2007, 22, 31–36. [Google Scholar] [CrossRef]
- Ibrahim, D. Using MEMS accelerometers in aerospace and defence electronics. Electron. World 2012, 118, 16–21. [Google Scholar]
- Pawley, J.B. Points, Pixels and Gray Levels: Digitizing Image Data. In Handbook of Biological Confocal Microscopy: Third Edition; Springer Publishing: New York, NY, USA, 2006; pp. 59–79. [Google Scholar]
- Waters, J.C. Accuracy and precision in quantitative fluorescence microscopy. J. Cell Biol. 2009, 185, 1135–1148. [Google Scholar] [CrossRef] [PubMed] [Green Version]
- ISO/IEC Guide 98-3: 2008. Available online: https://www.iso.org/standard/50461.html (accessed on 21 September 2018).
- Orsini, F.; Scena, S.; D’Anna, C.; Scorza, A.; Schinaia, L.; Sciuto, S.A. Uncertainty Evaluation of a Method for the Functional Reach Test Evaluation by means of Monte-Carlo Simulation. In Proceedings of the 22nd IMEKO TC4 International Symposium & 20th International Workshop on ADC Modelling and testing supporting world development through electrical & electronic measurements, Iasi, Romania, 14–15 September 2017. [Google Scholar]
- Orsini, F.; Scorza, A.; Rossi, A.; Botta, F.; Sciuto, S.A.; Di Giminiani, R. A preliminary uncertainty analysis of acceleration and displacement measurements on a novel WBV platform for biologic response studies. In Proceedings of the 2016 IEEE International Symposium on Medical Measurements and Applications (MeMeA), Benevento, Italy, 15–18 May 2016. [Google Scholar]
- Bagolini, A.; Ronchin, S.; Bellutti, P.; Chistè, M.; Verotti, M.; Belfiore, N.P. Fabrication of Novel MEMS Microgrippers by Deep Reactive Ion Etching with Metal Hard Mask. J. Microelectromech. Syst. 2017, 26, 926–934. [Google Scholar] [CrossRef]
- Scorza, A.; Pietrobon, D.; Orsini, F.; Sciuto, S.A. A preliminary study on a novel phantom based method for performance evaluation of clinical colour doppler systems. In Proceedings of the 22nd IMEKO TC4 International Symposium & 20th International Workshop on ADC Modelling and Testing Supporting World Development through Electrical & Electronic Measurements, Iasi, Romania, 14–15 September 2017. [Google Scholar]
Figure 1.
Images of a microgripper captured by a trinocular microscope. (a) microgripper, the displacement of the arm A is provided by the rotation of the Comb-Drive C (b) Hinges and rotary Comb-Drive (c) pliers.
Figure 1.
Images of a microgripper captured by a trinocular microscope. (a) microgripper, the displacement of the arm A is provided by the rotation of the Comb-Drive C (b) Hinges and rotary Comb-Drive (c) pliers.
Figure 2.
Micro-positioner.
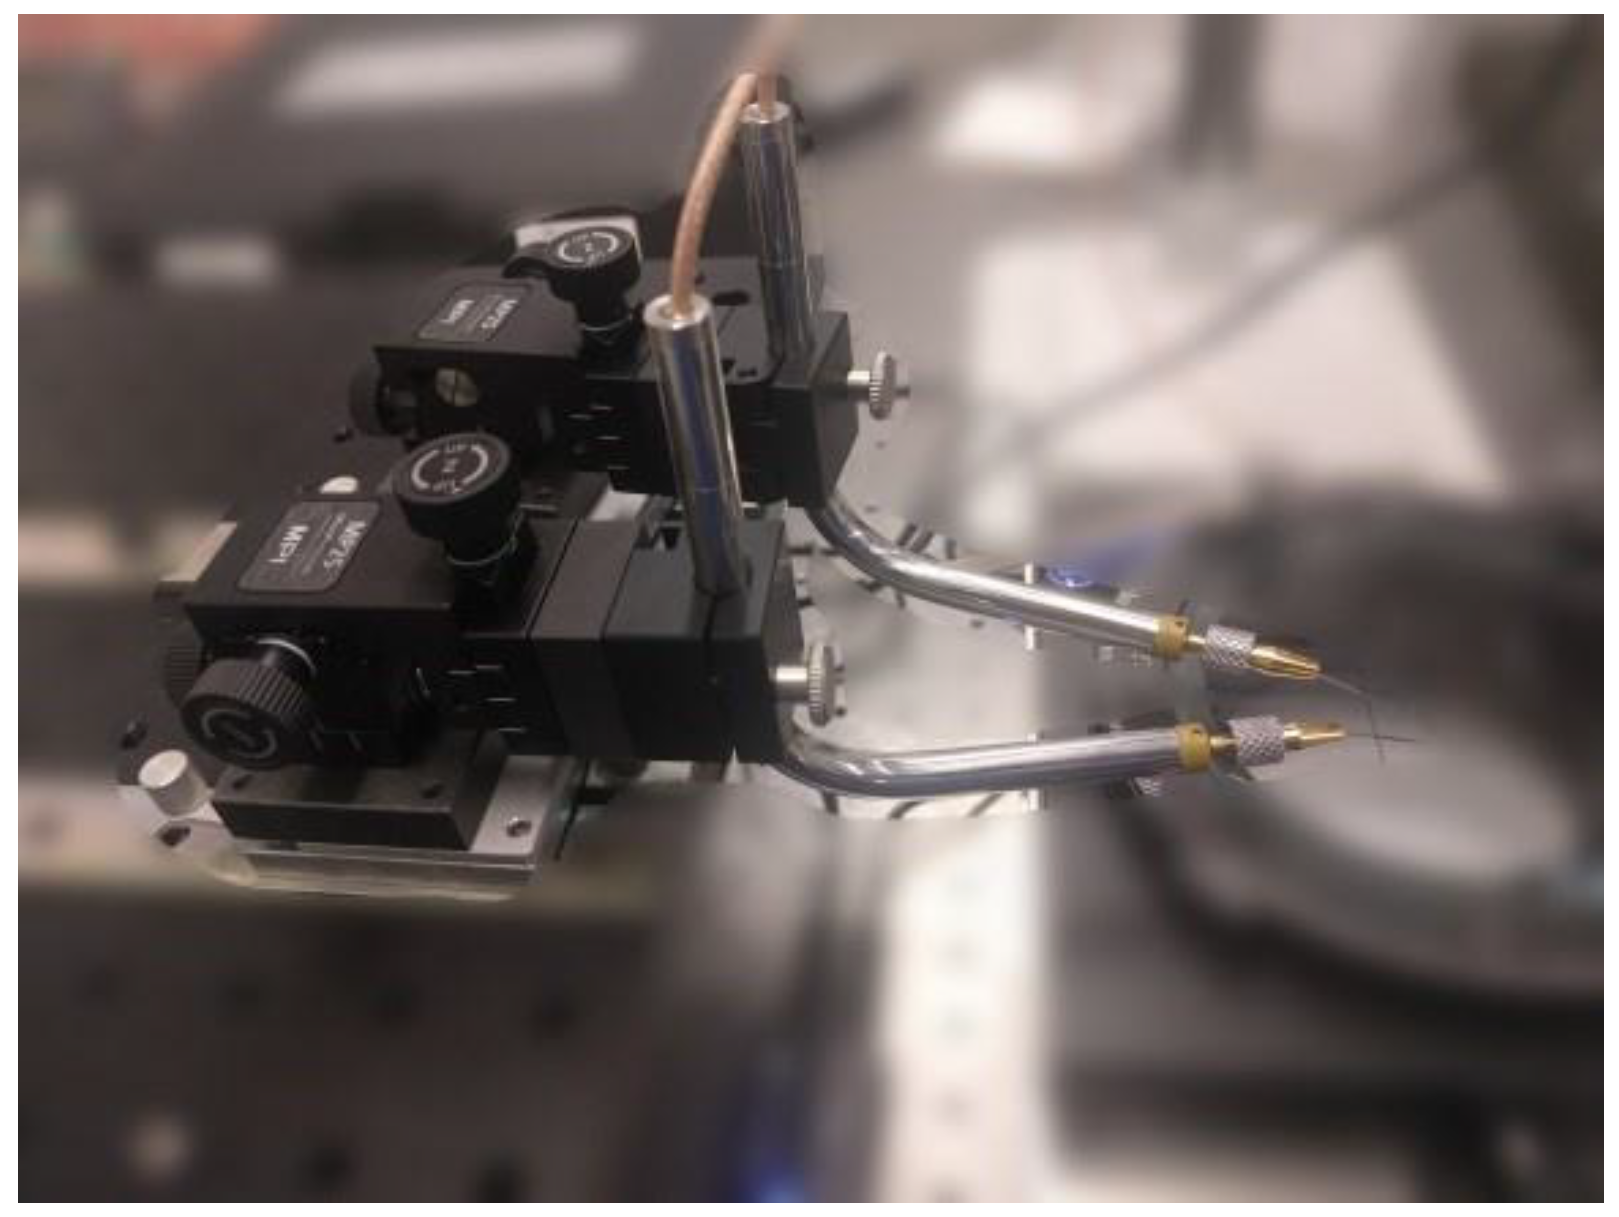
Figure 3.
Optical profiling system.
Figure 4.
Microgripper under study (DUT): image of the Comb-Drive provided by the 3D optical profiling system. From the intersection of the yellow lines the ICR is determined.
Figure 4.
Microgripper under study (DUT): image of the Comb-Drive provided by the 3D optical profiling system. From the intersection of the yellow lines the ICR is determined.
Figure 5.
Image of the DUT provided by the 3D optical profiling system. ROI identification on the mobile arm of the Comb-Drive.
Figure 5.
Image of the DUT provided by the 3D optical profiling system. ROI identification on the mobile arm of the Comb-Drive.
Figure 6.
Superposition of two images of the DUT Comb-Drive, corresponding to 0 V and 28 V applied voltage, respectively.
Figure 6.
Superposition of two images of the DUT Comb-Drive, corresponding to 0 V and 28 V applied voltage, respectively.
Figure 7.
Two pixel-centered point elements separated by 2 pixels.

Figure 8.
Two point elements in 2 near pixels.

Figure 9.
Two point elements not pixel-centered separated by 3 pixels.

Figure 10.
Two point elements not pixel-centered separated by 2 pixels.

Figure 11.
Angle measurement for the uncertainty evaluation related to the profilometer image.
Figure 12.
Example of results of the Monte Carlo Simulation for software uncertainty analysis (10,000 cycles).
Figure 12.
Example of results of the Monte Carlo Simulation for software uncertainty analysis (10,000 cycles).
Figure 13.
Curve and points obtained for measurements made with the proposed system (blue dashed line) compared with that from the analytical model (yellow dashed line) and the experimental data (orange dot-dashed line) in [2,16] (dotted line).

Table 1.
Experimental setup.
| Device | Characteristics |
|---|---|
| Power supply | Keithley 236, Range settable to 1.1/11/110/1100 V with respectively 0.1/1/10/100 mV resolution, accuracy 0.06 V at F.S. |
| Micropositioners | n.1 MP25L, n.1 MP25R, range X/Y/Z 10/10/10 mm with 5 μm resolution |
| Probes (supply) | PA-C-1M with tungsten needles |
| Device Under Test (DUT) | Silicon microgripper (Silicon type P. dopant Boron, orientation <100>, electrical resistivity 0.005–0.03 Ohm×cm), module dimensions 2000 µm × 1500 µm, device thickness 40 µm, insulated layer thickness 3 µm, handle thickness 400 µm, capacitive comb-drives |
| DUT stage | The wafer containing the DUT is placed on the profilometer working surface fixed by an adhesive tape |
| Optics: 3D Optical Profilometer | field of view from 7.2 mm × 5.4 mm to 80 nm × 60 nm, maximal lateral resolution 0.6 µm |
| Digital Image | 768 × 580 pixels, 8 bit, 0.6 px/μm |
| Image Processing Software | In-house software developed in MATLAB (2017a, MathWorks) |
| Notebook pc | Intel core i7-2670, 6 Gb RAM, Nvidia GeForce GT 520 MX |
Table 2.
Uncertainty sources.
| Uncertainty Source | Probability Density Function (PDF) 1 | Type 2 | m | σ | Unit |
|---|---|---|---|---|---|
| Power Supply: Voltage accuracy | N (m, σ) | B | 0.03 | V | |
| DUT Stage: Plate planarity and vibration, focusing plane variation | - | - | - | - | - |
| Optical System: Profilometer Maximal lateral resolution due to diffraction | U (m, σ) | B | 0.4 | μm | |
| Digital Image: digital conversion | U (m, σ) | B | 1.9 | μm | |
| Calibration: Included in the nominal uncertainty of the Optical System | - | - | - | - | - |
| Image Processing Software: uncertainty in point identification uncertainty in ROI position (template-matching) uncertainty in ROI size (template-matching) | U (m, σ) | A | ±2 ±2 ±2 | pixel pixel pixel | |
| uncertainty in the template-matching algorithm | A Monte Carlo Simulation is used. | ||||
1 N(m, σ) is a Gaussian PDF with mean m and standard deviation σ; U(m, σ) is a uniform PDF with mean m and standard deviation σ; 2 Type A and type B uncertainty as in [13]
Table 3.
Results on angular displacement measurements (Figure 13).
Table 3.
Results on angular displacement measurements (Figure 13).
| Supply Voltage (V) | Angle Rotation Mean Val. (°) | Standard Deviation (°) | Angle [2] (°) | Angle [16] (°) |
|---|---|---|---|---|
| 2 | 0.005 | 0.005 | 0.02 | 0 |
| 4 | 0.011 | 0.008 | 0.08 | 0.1 |
| 6 | 0.065 | 0.004 | 0.24 | 0.1 |
| 8 | 0.11 | 0.011 | 0.5 | 0.2 |
| 10 | 0.1603 | 0.004 | 0.8 | 0.3 |
| 12 | 0.227 | 0.006 | 1.08 | 0.4 |
| 14 | 0.3190 | 0.007 | 1.65 | 0.4 |
| 16 | 0.427 | 0.015 | 2.08 | 0.6 |
| 18 | 0.5425 | 0.011 | - | 0.7 |
| 20 | 0.696 | 0.016 | - | 0.9 |
| 22 | 0.810 | 0.018 | - | 1.1 |
| 24 | 0.952 | 0.024 | - | 1.2 |
| 26 | 1.122 | 0.027 | - | 1.5 |
| 28 | 1.308 | 0.027 | - | 1.8 |
© 2018 by the authors. Licensee MDPI, Basel, Switzerland. This article is an open access article distributed under the terms and conditions of the Creative Commons Attribution (CC BY) license (http://creativecommons.org/licenses/by/4.0/).
Share and Cite
MDPI and ACS Style
Orsini, F.; Vurchio, F.; Scorza, A.; Crescenzi, R.; Sciuto, S.A. An Image Analysis Approach to Microgrippers Displacement Measurement and Testing. Actuators 2018, 7, 64. https://doi.org/10.3390/act7040064
AMA Style
Orsini F, Vurchio F, Scorza A, Crescenzi R, Sciuto SA. An Image Analysis Approach to Microgrippers Displacement Measurement and Testing. Actuators. 2018; 7(4):64. https://doi.org/10.3390/act7040064
Chicago/Turabian StyleOrsini, Francesco, Federica Vurchio, Andrea Scorza, Rocco Crescenzi, and Salvatore Andrea Sciuto. 2018. "An Image Analysis Approach to Microgrippers Displacement Measurement and Testing" Actuators 7, no. 4: 64. https://doi.org/10.3390/act7040064
Note that from the first issue of 2016, this journal uses article numbers instead of page numbers. See further details here.