Article

Dielectric Electroactive Polymers with Chemical Pre-Strain: An Experimentally Validated Model

1
Purdue Polytechnic School of Engineering Technology, Adaptive Additive Technologies Lab (AATL), Purdue University, West Lafayette, IN 47907, USA
2
Agricultural and Biological Engineering, Purdue University, West Lafayette, IN 47907, USA
*
Author to whom correspondence should be addressed.
Actuators 2018, 7(3), 50; https://doi.org/10.3390/act7030050
Submission received: 15 June 2018 / Revised: 28 July 2018 / Accepted: 15 August 2018 / Published: 22 August 2018
(This article belongs to the Special Issue Modeling Smart Actuators and Their Applications)

Abstract

:
Dielectric electroactive polymer materials represent a distinct group of smart materials that are capable of converting between electrical and mechanical energy. This research focuses on the modeling and testing of an industrial grade fluoropolymer material for its feasibility as a dielectric elastomer electroactive polymer. Through this process, a novel chemical pre-strain method was tested, along with a one-step process for application of pre-strain and addition of an elastomer conductive layer. Modeled and experimental actuators produced approximately 1 mm displacements with 0.625 W of electrical power. The displacement of the actuators was characterized, and the effects of multiple parameters were modeled and analyzed.

1. Introduction

Smart materials represent an ideology that the materials themselves, which are the building blocks of current mechanical and electrical structures, can react to presented stimuli, thereby improving safety and efficiency. Smart materials as a class represent a wide range of materials and applications including piezoelectrics, shape-memory alloys, ferroelectrics, thermoelectric materials, and dielectric elastomers. This research focuses on one sub-group: electroactive polymers. Electroactive polymers are categorized under the subclass of soft sensors and actuators. Electroactive polymer materials are a unique class, capable of responding mechanically to an electric stimulus or of storing electrical energy from mechanical deformation in the same way as a capacitor. This makes these materials optimal for sensing, as well as actuation. The field of electroactive polymers can be further divided into two subsets: ionic and electric. Electric electroactive polymers generally require large electric fields for stimulation (between 80 V/µm and 180 V/µm) [1,2,3]. However, electric electroactive polymers have the ability to retain their activated state under a DC field, exhibit fast response times (microsecond range), and have no general environmental limitations excluding those that are polymer based [4]. Ionic gels, ionic polymer metal composites, conductive polymers, and specific nanotube based constructions comprise the ionic class. Ionic electroactive polymers require a smaller activation field—generally 1–5 V for conductive polymers—but due to their operating mechanism, an aqueous environment must be maintained [5]. While possible, a DC field maintained strain is more challenging to achieve in ionic polymers, but it can be achieved with certain subsets, such as conductive polymers. The focus of this research is on dielectric electroactive polymers which fall under the electric category, and more specifically, the utilization of these materials in industrial environments.
Dielectric elastomers were discovered in 1880 when Wilhelm Roentgen observed the movement of a mass by a 16 cm × 100 cm rubber band when an electric field was introduced to the rubber band. The rubber band had a fixed boundary at one end, with the mass remaining at the alternate end of the polymer. Roentgen studied the change in length of the rubber band [6,7]. In 1899, Sacerdote formulated that the strain response was due to an electric field [4,7]. In 1925, the first electroactive polymer was discovered and donned with the name “Electret.” Eguchi discovered this material which was a mixture of carnauba, wax, beeswax, and rosin, and documented the material’s piezoelectric characteristics [8]. In the 1970’s, Zhang and Bar-Cohen began research on poly(vinylidene fluoride), and noted its piezoelectric responses [4,9,10]. As a result of these observations, scientists began developing of a novel class of electroactive polymer materials. Then in the 1990s and the early 2000s, significant developments occurred through enhanced strains and the development of actuation strain enhancement through addition of mechanical pre-strain to the polymer matrix [11,12]. Goshkoderia and Rudykh [13] studied the effect of mechanical deformation on the stability of the dielectric material and proposed a model for predicting the electrostatic moduli of the dielectric material subjected to mechanical deformation. Furthermore, this work explored the effect of adding embedded inclusions on the dielectric matrix to improve the electrostatic properties of these materials. Other interesting uses of these materials include the study and use of spherically shaped objects made of EAP’s to model and produce micro-fluidic pumps [14].
Flouroelastomers are often used in EAP applications thanks to their ability to work as acceptable ferroelectric materials while maintaining a high resistance to high temperature, and good chemical resistance to degradation when exposed to a wide variety of solvents, acids, and bases. According to ASTM D1418 [15] Flouroelastomers are generally available in three specific compositions of the M class, which represents Rubbers having a saturated chain of the polymethylene type: (a) Non-substituted alkene monomers, (b) Partially substituted alkene monomers, and (c) fully substituted alkene monomers. Flouroelastomers are further classified into six different types based on their chemical composition, of which PMVE (Perflouromethilvinylether), a type 3, M rubber, is the preferred material for use in EAP applications thanks to its dielectric properties. Although the electrical properties of Flouroelastomers are less favorable than those of some acrylates, silicones, or urethanes, these materials are preferred for their high resistance to chemical degradation, high flexibility, and manufacturability [16]. Various researchers have attempted to improve the electric and mechanical properties of PDVF by synthesizing or combining it with diverse materials. Rat et al. [3] proposed and used P(VDF-TrFE) 70–30% mol as a dielectric material for EAP actuators and energy harvesting applications. In their work, they were able to homogenously disperse spin-crossover nanoparticles to enhance the mechanical flexibility and electric permittivity of the base P(VDF-TrFE) copolymer. Thakur et al. [17] investigated the use of aqueous functionalization of PVDF through bio-inspired proteins. They investigated the dielectric properties of regular PVDF and PDOPA@PVDF (dopamine-modified PVDF) films at various frequencies and temperatures. The PDOPA@PVDF resulted in a dielectric constant of 2.67 times higher than PVDF. According to Li et al. [15] conductive and strengthening particles of Silicon Dioxide SiO2, (nanofillers) can be used to facilitate crystallization of the polymer and have better control of the polymerization process. The addition of such particles resulted in an improved dielectric constant, low dielectric loss, excellent mechanical strength, toughness, and optical transparency. In this research, commercially available industrial grade fluoropolymer materials were adapted through the addition of graphite particles to adjust their electrical properties, and were used to produce dielectric EAPs through a one-step chemical pre-strain process.

2. Theoretical Background

Dielectric elastomers are built as a parallel plate capacitor, comprised of a dielectric layer placed between two conductive layers. These materials actuate based on two primary mechanisms (1) Maxwell stress and (2) electrostriction [18]. As the capacitor which makes up the electroactive polymer circuit charges, a Maxwell stress is generated from changes in the electric field distribution as the dielectric is strained. This is also called Coulombic charge interaction. The second mechanism is electrostriction, wherein the dielectric material changes over time with strain, and often change can be seen in the materials permittivity [19]. The full relation to stress in the x and z directions can be seen in Equations (1) and (2). In these equations, σ represents mechanical stress, ε is the dielectric constant of the insulator, εo is the permittivity of free space, 8.85 × 10⁻¹² F/m, V represents the applied electrical potential, a1 is an electrostrictive coefficient which is the change in relative permittivity when shape is changed assuming constant volume, and a2 represents a density dependent permittivity [19]. However, the electrostriction effects are small in comparison to the Coulombic charge interaction response [18,19,20]. Therefore, for simplification, the following equations can be used to define the anticipated actuation and corresponding pressures seen by the electroactive material. The corresponding stresses can be seen in Equations (3) and (4).
σ z z = 1 2 ε o ε V 2 ( 1 a 1 + a 2 ε )
σ x x = σ y y = 1 2 ε o ε V 2 ( 1 + a 2 ε )
σ z z = 1 2 ε o ε V 2
σ x x = σ y y = 1 2 ε o ε V 2
The pressure to achieve and maintain the designated strain can be found from calculating the differences between σ y y and σ z z as seen in Equation (5). In this equation σ y y σ z z represents the change in normal stress, ε is the dielectric constant of the insulator material, εo is the permittivity of free space which is 8.85 × 10⁻¹² F/m, and V represents the applied electrical potential.
σ y y σ z z = ε ε o V 2
Equation (6) shows the compressive pressure from the perspective of the dielectric polymer film in the z-axis through dividing the force by the square of the thickness [18,19,20,21]. In this equation, P represents electrostatic pressure, ε is the dielectric constant of the insulator material, εo is the permittivity of free space which is 8.85 × 10⁻¹² F/m, V represents the applied electrical potential, and D is the dielectric thickness.
P = ε ε o V 2 D 2
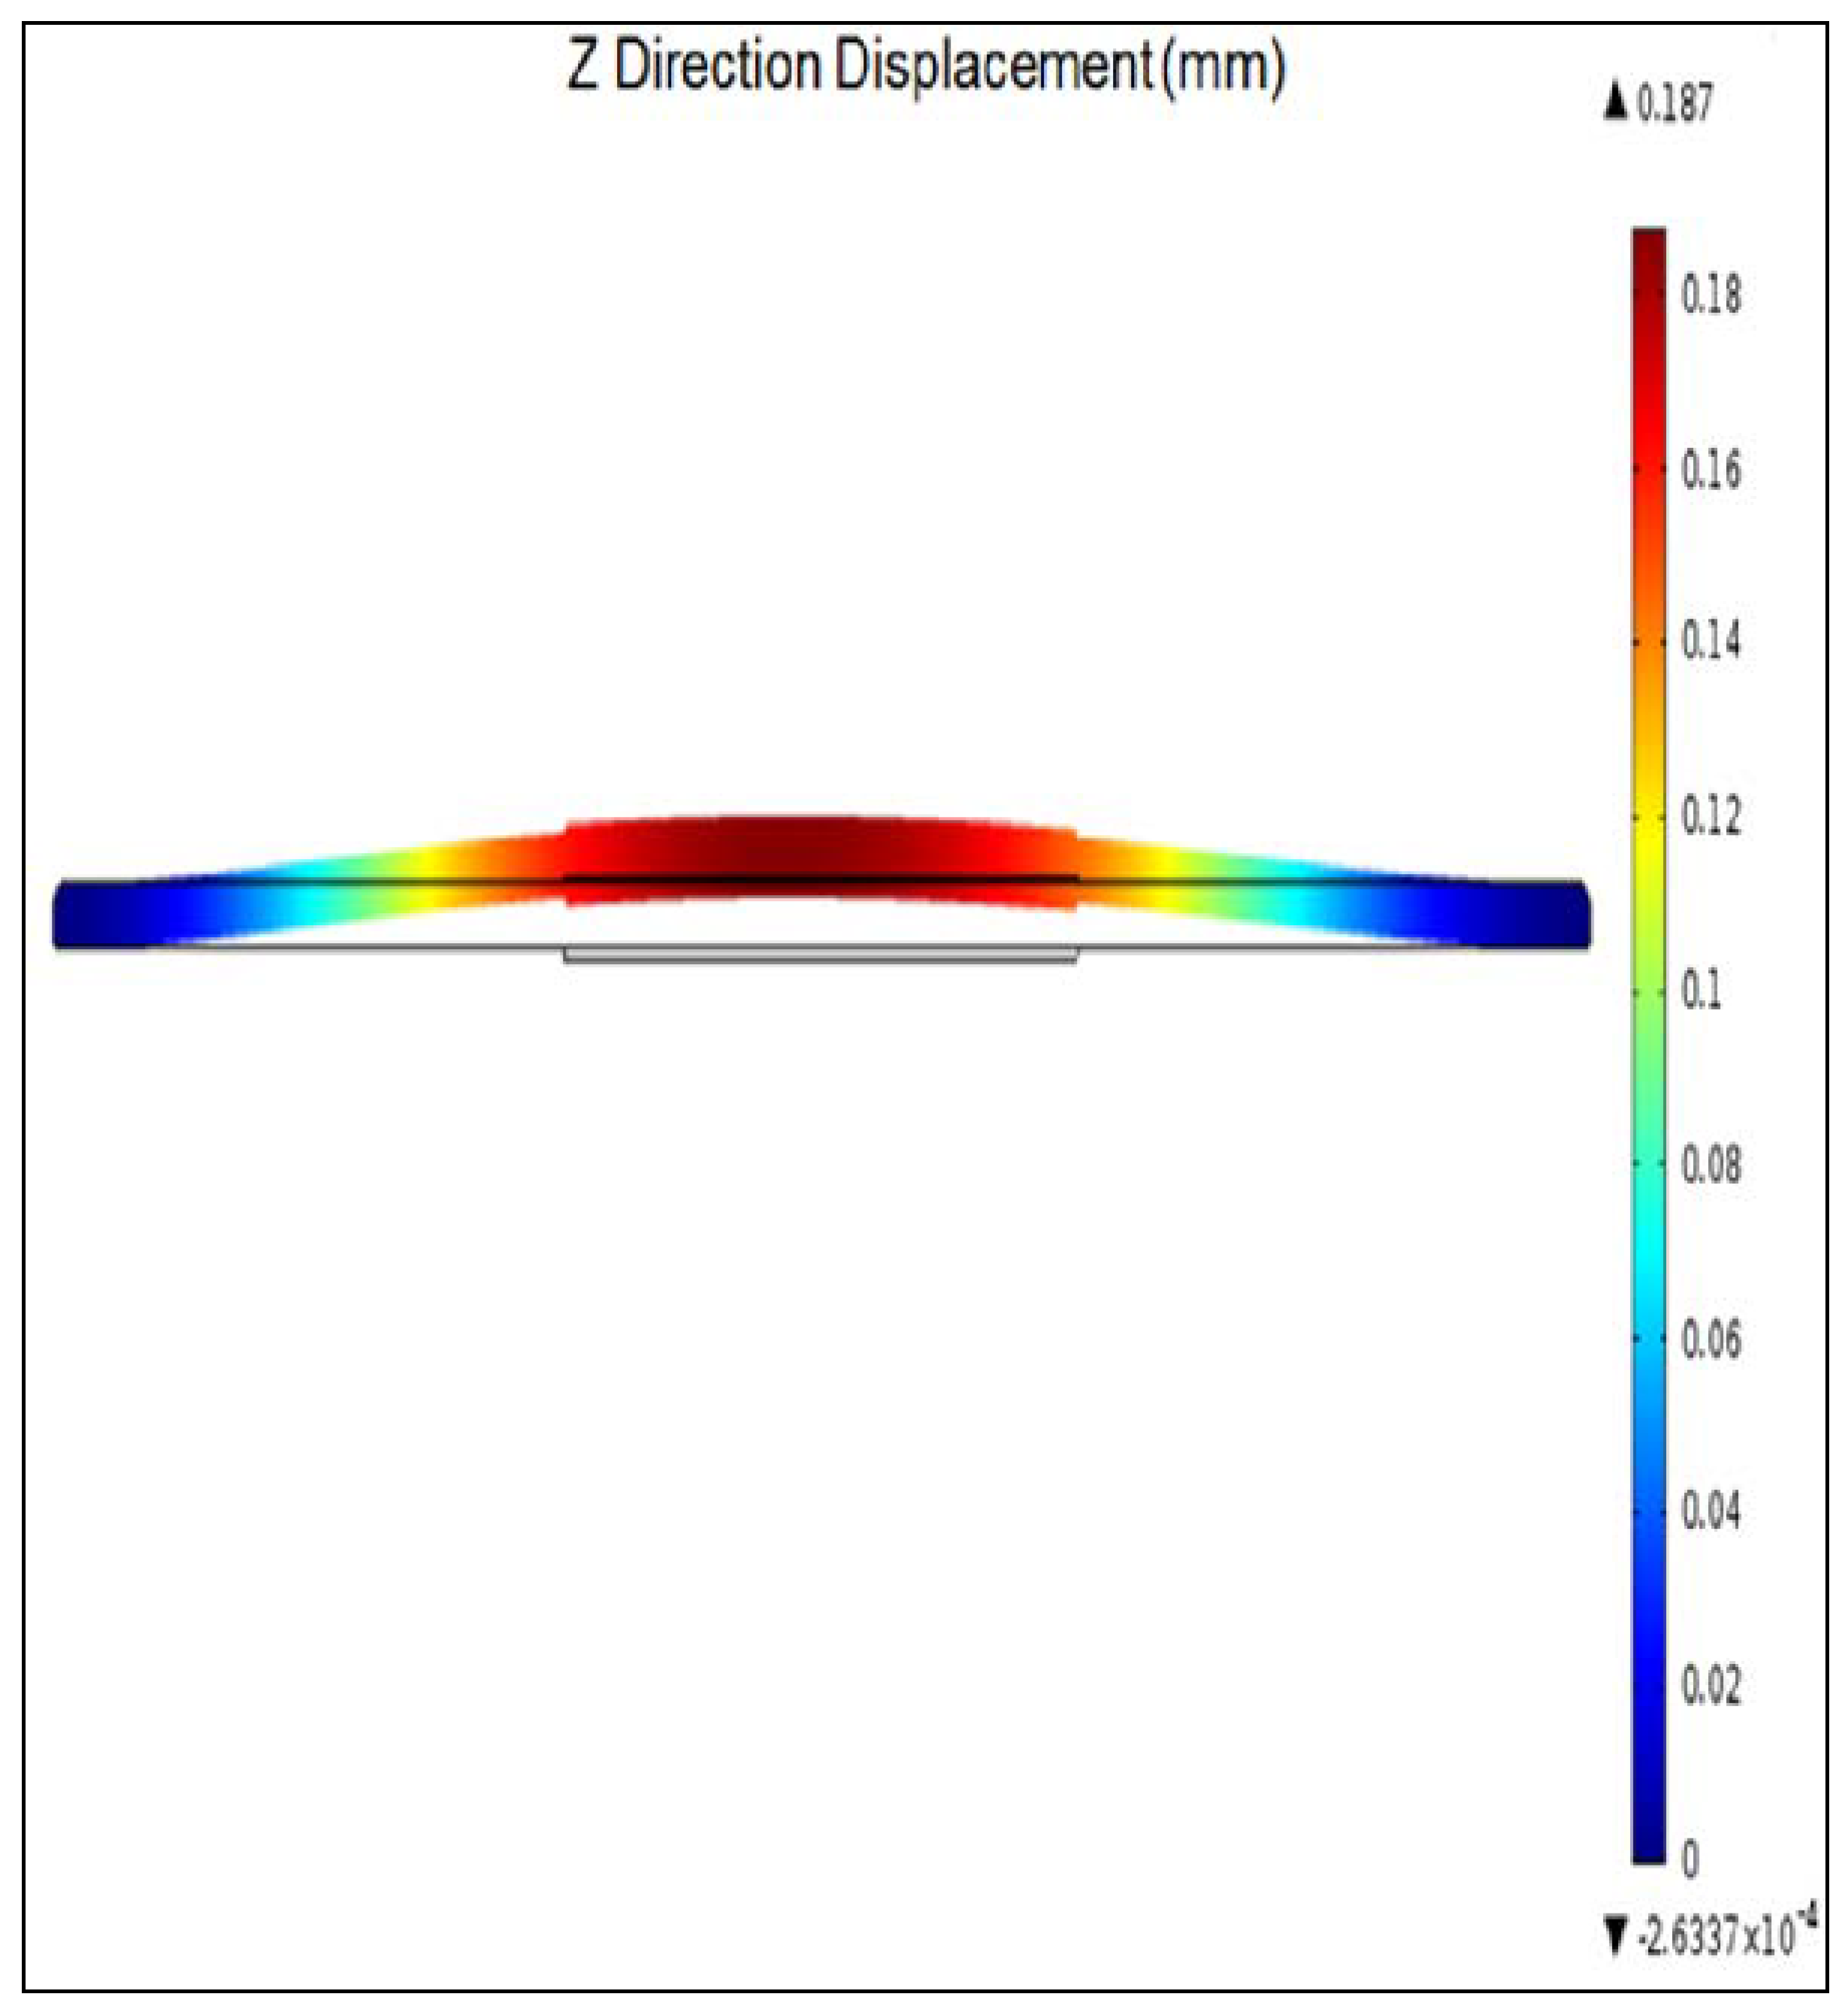
This formulated pressure is the foundation for actuation seen in the finite element model presented in this research and the correlating experimental data. This research expands upon this foundational knowledge to predict and test how a commonly used fluoropolymer industrial material can be manufactured and enhanced for use as a dielectric electroactive polymer in real world applications. This research produces a novel method of chemical pre-strain and uses an industrial polymer as the dielectric material, while also simplifying manufacturing through a single step process for pre-strain and electrode applications. Actuators produced using this method are evaluated for actuation response.

3. Materials and Methods

The materials and methods section utilized in this research will be broken into the physical components for construction of experimental samples and the generation of the finite element analysis model.

3.1. Experimental Samples

This research focused on testing and modeling of a novel industrial material, a proprietary fluoropolymer material used in sealing applications produced by Parker Hannifin Inc., Seals Division. However, these results can be expanded to other fluoropolymers and to other industrial grade materials. Fluoropolymer materials are utilized in numerous industrial and automotive applications due to their chemical resistivity particularly to solvents and strong acids and bases, and have ideal material properties for sealing and fluid conveyance applications. This, combined with their generally dielectric properties, made fluoropolymers an optimal choice for testing. Generally, electroactive polymer dielectric elastomer samples are pre-strained mechanically to enhance the actuation potential of the material under load [21,22]. However, this provides a significant challenge in real world manufacturing, since this mechanical pre-strain must be maintained throughout all subsequent processes and in application. Therefore, an alternative method, chemical pre-strain was investigated [23,24,25].

3.2. Experimental Samples: Chemical Pre-Strain

In order to test the feasibility of using a chemical as a pre-strain agent, fluoropolymer samples that were initially pressed to their desired thickness ranging between 0.18 and 0.33 mm were formed. Then, the fluoropolymers were placed in a solvent, Methyl Ethyl Ketone (MEK) (Sunnyside® from Menards Inc., Eau Claire, WI, USA) for 5 min, removed, and allowed to dry for 12 h at room temperature in a fume hood. According to its MSDS, the evaporation rate of this product is approximately 4.6 per ASTM D3539 [26], which is slower than Acetone (with an evaporation rate of 7.8) but faster than 95% Ethyl alcohol (with an evaporation rate of 1.4) [27]; thus the 12 h period used was sufficient for drying the samples. The solvent interacted with the fluoropolymer material, causing intercalation within the polymer structure, resulting in swelling of the material. However, this process is primarily reversible. Therefore, during the dry time, the material returned to its native state. During the intercalation process, the fluoropolymer material expanded in the x, y, and z directions. These dimensional changes were measured using a standard ruler before, during, and after induced strain [23,24].

3.3. Experimental Samples: Addition of a Conductive Layer

After completing chemical pre-strain testing, it was noted that pre-strain and electrode application could likely be combined into a one-step process. This provides a significant improvement in manufacturing by reducing time and the number of processing steps. Furthermore, this procedure utilized the same polymer material for both the conductive layer and the dielectric layer, providing a higher level of consistency in actuator movement. In order to complete this combined manufacturing step, a mixture of the fluoropolymer material doped with conductive particles, Graphite Powdered Lubricant from MCM Electronics, and the pre-strain agent, MEK was applied to the surface of the dielectric fluoropolymer material [23,24,25,28,29]. This led to selective pre-strain in only the active region where the conductive material is present. This mixture was applied to the top surface of the dielectric fluoropolymer. The samples were allowed to air dry in a fume hood until the swelling was reduced, and then the sample was flipped so the mixture could be applied to the bottom of the samples to complete the capacitor design. The structures were left in the fume hood for 12 h to ensure full removal of the solvent. After this time, the samples were heat cured [23,24,25]. Copper foil tape with conductive adhesive purchased from McMaster-Carr Inc. (Elmhurst, IL, USA) were cut to approximately 10 mm in width, and placed on the top and bottom of the samples for testing.

3.4. Experimental Samples: Displacement Measurements

Actuators were designed to move out of plane by adding a fixed boundary constraint to the perimeter of the material. This constraint was placed in the model and in the experimental set-up. Material z-axis displacement was then measured using a Keyence LK-G82 (Osaka, Japan) laser with a LK-GD500 controller. The laser was aligned and calibrated, and samples were then placed in line with the set-up. Samples were then subsequently activated with a high voltage power supply in the range of 1000–5000 V and 125 μA, using the Biomimetics Laboratory (Auckland, New Zealand) four channel Artificial Muscle Control unit. Samples were powered using both AC and DC supply. The AC frequency was 0.2 Hz. The Keyence laser had a wavelenght of 650 nm and a spot diameter of 70 μm. The measurement range for this instrument was ±15 mm. The repeatability of the system was within 0.2 μm. Sample measurements were taken in triplicate across four quadrants of each sample. The recorded measurements were calibrated to a 0 mm initial starting point. Data was recorded every millisecond for one minute [23,24]. The effect of geometry and voltage was tested. Three sample geometries were constructed for this testing. Their dimensions can be seen in Table 1, one full circle and two ring shaped actuators [23,24]. An image of the samples created can be seen in Figure 1A. Five voltages were applied, ranging from 1000 V–5000 V, in 1000 V intervals to study the effects of applied voltage.

3.5. Model: Construction

In order to predict the behavior of actuators produced using a fluoropolymer dielectric material and fluoropolymer conductive material, a new finite element analysis model was created. The model was completed in Comsol MultiphysicsTM. Initial inputs to the system included a stress-strain curve of the fluoropolymer material with tensile test data taken at a rate of 20 in/min. The stress-strain data was fit using a 5-order Mooney-Rivlin fit with a root mean square error of 0.272. The model fitting was completed using Creo Elements software for fitting of a hyperelastic model. Multiple forms of strain energy calculations exist including Odgen, Yeoh, and Arruda-Boyce [22]. However, the Mooney-Rivlin model was selected due to the output of the lowest Root Mean Square error with the data fitting. The 5th order Mooney-Rivlin model was constructed using Equation (7) for calculation of strain energy, W [21,30]. The strain energy equation is dependent upon the invariants produced from the left Cauchy Green deformation tensor. The left Cauchy Green tensor is calculated from the deformation tensor, F through FFT. The C values in the equation are based on material parameters, and dk is determined based on the shear modulus. The material is assumed to be incompressible and initially isotropic. Therefore, the resulting invariants can be calculated from the eigenvalues of the deformation gradient tensor. These values are generally referred to as the stretch ratios, λ, and are defined in Equations (8)–(10). In the original undeformed state, λ1 = λ2 = λ3 = 1. Therefore, I1 = I2 = 3, which results in Equation (7). Due to incompressibility, J, which is the volume ratio, is set to 1.
W = i + j = 1 N C i j ( 1 3 ) i ( 2 3 ) j + k = 1 N 1 d k ( J e l 1 ) 2 k
Invariants (I):
I1 = λ12 + λ22 + λ32
I 2 = 1 λ 1 2 + 1 λ 2 2 + 1 λ 3 2
I3 = (λ12)(λ22)(λ32) = J2
Additional inputs to the system included material properties for the fluoropolymer material, which can be seen in Table 2 [28].
After inclusion of the material properties, the geometry was built in a 2-D axisymmetric format in order to improve computation efficiency. The construction can be seen in Figure 2A, and the revolved version can be seen in Figure 2C. The construction includes the dielectric area with an inactive dielectric perimeter, and the conductive electrodes which are produced from the same fluoropolymer material, but with added conductive particles. In Figure 2B, an electrical potential is applied to the conductive electrode layers highlighting this region. Three geometries were created in the model. Each geometry had the same outer active diameter, but the inner diameter varied from a full circle to small ring, which was identical to the experimental constructions. The dimensions for each geometry can be seen in Table 1. The thickness of the samples was measured in triplicate per sample, and the averaged value was used for model construction. The average experimental thickness as 0.2549 mm. The averages, standard deviation, and maximum and minimum values for each sample set can be seen in Table 3. The variation in thickness of the dielectric material from the manufacturer was large, resulting in high standard deviations. The manufacturing process at the manufacturer’s site was lab-scale, due to production of one-off batches which resulted in lower sample repeatability in regards to thickness. After construction of the geometries and materials, the model was meshed using triangular elements. Four-node quadrilateral mesh elements were also tested, and the results were convergent between both element types. The mesh size ranged from 0.0124 mm–0.2877 mm. A denser mesh was applied to active interfaces where deformation was likely to occur, as seen in Figure 3.
Comsol Mutliphysics enabled use of multiple modalities, which is why this software was selected. Electric, mechanical, and hyperelastic effects were taken into account in the model. A square wave of 0–5000 V was applied to the conductive material surface and converted to a mechanical pressure using Equation (6). At this point, it was assumed that heat and energy losses associated with the conversion were minimal. The applied pressure was induced in a time-dependent manner to allow for matrix convergence as deformation occurred. Ramping prevented the formation of inverted matrices in the solver. The ramp function was set with a slope equal to the electromechanical pressure divided by 100 to reach the maximum pressure resulting in a slope of Pressure/100 (Pa/s). A cutoff time of 100 s was applied to the model. A MUlitfrontal Massively Parallel sparse direct solver (MUMPS) was used to resolve the solution. This was selected due to the solvers high numeric stability [23,24,25,28,29].

3.6. Model: Sensitivity Analysis

In order to look at the importance and effects of different variables on the model, a sensitivity analysis was conducted. A parametric sweep was utilized to test temperature, voltage, dielectric constant, and actuator size. A full factorial sensitivity analysis with 2k trials (k = 5) was conducted. The variables tested and test ranges can be seen in Table 4. The designed experiments tested the maximum and minimum combinations of all variables. The size correlated with the minimum and maximum geometries used, and the voltage values correlated to achievable ranges with the voltage supply unit maximum (5000 V), which was also under the dielectric breakdown of the fluoropolymer material. The temperature range was selected to be within the working range for the fluoropolymer material. The thickness values were based on minimum and maximum values measured from experimental samples. The dielectric constant was based on experimental measurements and optimal values for electroactive polymer materials.

4. Results

4.1. Experimental Samples: Chemical Pre-Strain

Ten samples of the dielectric fluoropolymer material were measured with a ruler, and the measurements were recorded in Table 5. Then the samples were placed in the chemical pre-strain agent, Methyl Ethyl Ketone (MEK) for 5 min. After this time, the sample dimensions were measured and recorded, as seen in Table 5. An example of the material prior to pre-strain can be seen as in the left image in Figure 4, and after pre-strain can be seen in the right image of Figure 4. The outer ring in Figure 4 depicts the same material after incubation in the pre-strain agent, MEK for 5 min. The material pre-strain averaged 158.9%, with a standard deviation of 6.3% across the 10 samples providing evidence that chemical pre-strain can produce strains greater than 100% in dielectric elastomers [23,24]. The process is primarily reversible. The chemical was allowed to evaporate out of the polymer matrix for 12 h in a fume hood at room temperature and the sample dimensions were re-measured. The fluoropolymer expands due to intercalation of the solvent within the polymer matrix. The 12 h wait time allows the matrix to re-crystallize after evaporation of the solvent from the fluoropolymer. The results showed the process was 97.5% reversible, with a standard deviation of 2.9%. Therefore, the samples were stable for use as electroactive polymer materials [23,24,25,28]. Time left in solvent controls the amount of pre-strain exhibited by the material. In mechanical pre-strain, generally 100–200% pre-strain is applied, and 5 min was selected in order to fall within this accepted range.

4.2. Experimental Samples: Displacement Results

The constructed actuators produced using the process outlined in the Experimental Samples section of the Materials and Methods were tested using z-axis displacement. They were measured by the Keyence laser system, producing the displacement curves seen in Figure 5. The actuators were designed to actuate out of plane by placement of a boundary constraint on their outer perimeter, forcing the motion into the z-axis. The samples shown in Figure 5, Figure 6 and Figure 7 are powered with 5000 V and 125 μA. Measurements were taken in all four quadrants of each sample and at three locations across each quadrant: the inner diameter (middle), center, and outer diameter (edge). The data shown in Figure 4 shows the response of a sample to a sudden increase in voltage. This experiment was performed on a flat ring sample with a 57 mm outside diameter and a 0.5 mm inner diameter. While there was variability in the response to the voltage stimulus, it was found that in both experiments, the response times for the displacement was similar. Sample 2 had a time t = 7.4 s to achieve the 63.2% of maximum steady state displacement of 0.638 mm. Sample 1 had a time t = 12.3 s to achieve 63.2% of the full steady state displacement of 0.898 mm. This was further reinforced with the analysis presented in Figure 6A, which represents the velocity of the actuator; the maximum speed of the sample 2 actuator was 0.38 mm/s at the time where the voltage was applied, while the sample 1 showed a maximum speed of 0.57 mm/s at the same instant. The plots in Figure 6B show the acceleration of both samples, where sample 2 had an acceleration of 28.4 mm/s2, and sample 1 had an acceleration of 44.8 mm/s2. The reason for this variability is unknown, but may be attributed to various factors, such as variation in sample thickness and inconsistencies in the lab-scale manufacturing process.
Figure 7 depicts the results from z-axis displacement of the three geometries studied. The Set numbers correlate to the sample dimensions in Materials and Methods Table 1. The results showed that the larger the active sample area Set 1, the greater the resulting displacement. The average values from each set can be seen in Table 6 [23,24,28]. Displacements ranged from 0.19 mm to 0.99 mm depending upon geometry. The laser measuring spot was located at three distinct radial locations within the samples; this was done by translating the horizontal position of the sample using a graduated xy table and leaving the laser head static, thereby assuring the three locations were consistent between the sample. Figure 7 also shows that displacement is dependent upon measurement location; the center region of the actuators demonstrated the greatest displacement while regions closer to the inactive boundaries experience less overall deflection. Figure 7A shows the effect of location for a ring of 5.7 mm outside diameter and no inner diameter (a flat circle). For this sample, the edge location corresponds to approximately 2.85 mm from the center, the middle location corresponds to 1.42 mm from the center, and the center location corresponds to the center of the sample. It showed that the maximum displacement was achieved at the center, the maximum displacement at the center was 2.12 mm, 1.69 mm at the middle position and 1.37 mm at the edge. Figure 7B shows the effect of location for a ring of 5.7 mm outside diameter and an inner diameter of 0.5 mm (a flat circle with a small centered hole); in this case the location of the edge measurement is the same as before, but the middle and edge locations are found at 3.1 mm and 0.5 mm from the relative sample center. It showed again that the maximum displacement was achieved towards the center; the maximum displacement at the center was 0.90 mm, 0.64 mm at the middle position and 0.49 mm at the edge. Lastly, Figure 7C shows the effect of location for a ring of 5.7 mm outside diameter and an inner diameter of 0.7 mm (a flat circle with a medium sized centered hole). It showed again that the maximum displacement was achieved towards the center: the maximum displacement at the center was 0.64 mm, 0.41 mm at the middle position and 0.26 mm at the edge. In this case, the location of the edge measurement is the same as before, but the middle and edge locations are found at 3.2 mm and 0.7 mm from the relative sample center.

4.3. Model Results and Experimental Comparison

Figure 8 depicts standard displacement results generated from the model, and represents predicted results from Set 3 samples, with the black region representing the original location and the multi-colored region depicting modeled displacements. Table 7 depicts the numeric values for maximum actuation measured across the samples for each geometry compared to the predicted data from the finite element analysis model. Figure 9A represents model and experimental data for Set 2 specimens between 1000 and 5000 V. Three samples of Set 2 geometries were tested at 1000–5000 V in 1000 V intervals, and the values were averaged. The model parameters for Set 2 included a standard temperature of 293 K and a thickness value of 0.2549 mm and a dielectric constant of 10.7. The model and experimental results demonstrate the trend of increasing actuation with increasing voltage. However, the model generally predicts a larger deformation compared to the actual experiment produced. This is to be expected, because the model assumes no heat loss, uniform distribution of charge, and material uniformity. In the actual experiments, copper leads are used to transmit charge, and material geometry is not uniform. However, as seen in Figure 9A, at 5000 V the experimental results outperform the model. It was noted that materials did not return fully to their initial start positions, likely due to material creep after deformation. In general, the model represents the theoretical performance achievable for this material under these supplied parameters. An analysis comparing three samples of the three geometries at 5000 V, 293 K, thickness of 0.2549 mm and a dielectric constant of 10.7 was performed, as seen in Figure 9B. The results show similar trends between experimental and model results, but the experimental results demonstrate high standard deviations. A sensitivity analysis was further performed to analyze the discrepancies between the model and the experimental data. Thickness and size had the largest sensitivities, as seen in Figure 10. The thickness of experimental samples varied significantly, as listed in Table 3; this is assumed to be a leading cause of error in the experimental measures and variation between the model and experimental results.

4.4. Model: Sensitivity Analysis

The radar plot seen in Figure 10 depicts the results of the sensitivity analysis from the finite element analysis model. The results showed the actuator size, thickness, and voltage supplied played the largest roles in the final displacement values, which directly correlates with the experimental observations. Size had the largest sensitivity, with a value of 0.685, followed by thickness, with a value of 0.441, and voltage, with a value of 0.278. The effect of the material’s dielectric constant had a smaller effect, with a value of 0.054, while the effect of temperature was negligible, at −5.68 × 10⁻⁵.

5. Discussion

The conducted research demonstrates both through modeling and experimentally that an industrial grade flexible fluoropolymer material can function as an electroactive polymer, and can also be produced in a single process incorporating both chemical based pre-strain and the addition of a conductive layer. The effectiveness of the chemical agent in inducing chemical pre-strain was successfully demonstrated, and shown to be primarily reversible. Model and experimental results demonstrate up to at least 1 mm displacement in samples with an active area of 17.35 mm2. Sample actuation showed an immediate fast response time, followed by a slow material creep. Material actuation was also voltage, active area, and measurement location dependent. Material displacement was greatest farthest away from the inactive boundaries of the materials. This trend was seen in both experimental and modeled data. Variations in experimental results and discrepancies from model to experimental data were attributed to variation in material thickness and lacking uniformity due to the lab scale manufacturing process. This process will be improved in future work to provide a more uniform response. In conclusion, a novel material and process for the production of industrial grade electroactive polymers was demonstrated, and its effectiveness tested.

6. Patents

  • Newell, B.A.; Krutz, G.W. Electroactive Actuators, Systems Equipped Therewith, and Methods of Use and Manufacture. U.S. Patent 9683663, 20 June 2017.
  • Newell, B.A.; Krutz, G.W. Electroactive Polymers, Methods of Manufacture, and Structures Formed Thereof. U.S. Patent Application 15556696, 10 March 2016.

Author Contributions

B.N. was responsible for design of the experiments, execution of the studies, data analysis and manuscript preparation. J.G. was responsible for formal data analysis, manuscript preparation, and reviewing and editing. G.K. was responsible for design of experiments, supervision, and reviewing.

Funding

This research was funded by Parker Hannifin Inc.

Conflicts of Interest

The authors declare no conflict of interest. The funding sponsors provided technical expertise in regards to this research.

References

  1. Bae, J.-H.; Chang, S.-H. Characterization of an electroactive polymer (PVDF-TrFE) film-type sensor for health monitoring of composite structures. Compos. Struct. 2015, 131, 1090–1098. [Google Scholar] [CrossRef]
  2. Coskun, M.Y.; Sancak, C.; Itik, M.; Alici, G. Hybrid force and position control of a conducting tri-layer electro-active polymer actuator. Trans. Inst. Meas. Control 2017, 39, 288–296. [Google Scholar] [CrossRef]
  3. Rat, S.; Piedrahita-Bello, M.; Salmon, L.; Molnár, G.; Demont, P.; Bousseksou, A. Coupling Mechanical and Electrical Properties in Spin Crossover Polymer Composites. Adv. Mater. 2018, 30, 1705275. [Google Scholar] [CrossRef] [PubMed]
  4. Bar-Cohen, Y. Electroactive Polymer (EAP) Actuators as Artificial Muscles: Reality, Potential, and Challenges, 2nd ed.; SPIE Publications: Bellingham, WA, USA, 2004. [Google Scholar]
  5. Bar-Cohen, Y. Electroactive Polymers as Actuators. In Advanced Piezoelectric Materials Science and Technology; Woodhead Publishing: Cambridge, UK, 2010; pp. 287–317. [Google Scholar]
  6. Roentgen, W.C. About the changes in shape and volume of dielectrics caused by electricity. Ann. Phys. Chem. 1880, 11, 771–786. [Google Scholar]
  7. Sacerdote, M.P. On the electrical deformation of isotropic dielectric solids. J. Phys. 1899, 3, 282–285. [Google Scholar]
  8. Eguchi, M. On the permanent electret. Philos. Mag. Ser. 1925, 6, 178–192. [Google Scholar] [CrossRef]
  9. Zhang, Q.M.; Bharti, V.; Zhao, X. Giant electrostriction and relaxor ferroelectric behavior in electron-irradiated poly(vinylidene fluoridetrifluorethylene) copolymer. Science 1998, 280, 2101–2104. [Google Scholar] [CrossRef] [PubMed]
  10. Bar-Cohen, Y.; Xue, T.; Lih, S.-S. Polymer Piezoelectric Transducers for Ultrasonic NDE, First International Internet Workshop on Ultrasonic NDE, Subject: Transducers, Organized by R. Diederichs, UT online Journal, Germany. 30 September 1996. Available online: http://www.ndt.net/article/yosi/yosi.htm (accessed on 20 June 2018).
  11. Pelrine, R.; Kornbluh, R.; Joseph, J.P. Electrostriction of polymer dielectrics with compliant electrodes as a means of actuation. Sens. Actuators A Phys. 1998, 64, 77–85. [Google Scholar] [CrossRef]
  12. Biggs, J.; Danielmeier, K.; Hitzbleck, J.; Krause, J.; Kridl, T.; Nowak, S.; Orselli, E.; Quan, X.; Schapeler, D.; Sutherland, W.; et al. Electroactive Polymers: Developments of and Perspectives for Dielectric Elastomers. Angew. Chem. Int. Ed. 2013, 52, 2–15. [Google Scholar] [CrossRef] [PubMed]
  13. Goshkoderia, A.; Rudykh, S. Electromechanical macroscopic instabilities in soft dielectric elastomer composites with periodic microstructures. Eur. J. Mech. A Solids 2017, 65, 243–256. [Google Scholar] [CrossRef]
  14. Rudykh, S.; Bhattacharya, K. Snap-through actuation of thick-wall electroactive balloons. Int. J. Non-Linear Mech. 2012, 47, 206–209. [Google Scholar] [CrossRef]
  15. ASTM D1418-17 Standard Practice for Rubber and Rubber Latices—Nomenclature; ASTM International: West Conshohocken, PA, USA, 2017; Available online: https://doi-org.ezproxy.lib.purdue.edu/10.1520/D1418-17 (accessed on 20 June 2018).
  16. Li, L.; Feng, R.; Zhang, Y.; Dong, L. Flexible, transparent and high dielectric-constant fluoropolymer-based nanocomposites with a fluoride-constructed interfacial structure. J. Mater. Chem. C 2017, 5, 11403–11410. [Google Scholar] [CrossRef]
  17. Thakur, V.K.; Lin, M.F.; Tan, E.J.; Lee, P.S. Green aqueous modification of fluoropolymers for energy storage applications. J. Mater. Chem. 2012, 22, 5951–5959. [Google Scholar] [CrossRef]
  18. Krakovský, I.; Romijn, T.; Posthuma de Boer, A. A Few Remarks on the Electrostriction of Elastomers. J. Appl. Phys. 1999, 85, 628–629. [Google Scholar] [CrossRef]
  19. Yamwong, T.; Voice, A.M.; Davies, G.R. Electrostrictive Response of an Ideal Polar Rubber. J. Appl. Phys. 2002, 91, 1472–1476. [Google Scholar] [CrossRef]
  20. Kofod, G.; Sommer-Larsen, P.; Kornbluh, R.; Pelrine, R. Actuation Response of Polyacrylate Dielectric Elastomers. J. Intell. Mater. Syst. Struct. 2002, 14, 787–793. [Google Scholar] [CrossRef]
  21. Pelrine, R.; Kornbluh, R.; Pei, Q.; Joseph, J. High-Speed Electrically Actuated Elastomers with Strain Greater Than 100%. Science 2000, 287, 836–839. [Google Scholar] [CrossRef] [PubMed]
  22. Wissler, M.; Mazza, E. Modeling of a pre-strained circular actuator made of dielectric elastomers. Sens. Actuators A Phys. 2005, 120, 184–192. [Google Scholar] [CrossRef]
  23. Newell, B. Electroactive Polymers as Sealing Devices. Ph.D. Dissertation, Purdue University, West Lafayette, IN, USA, 2012. [Google Scholar]
  24. Newell, B.A.; Krutz, G.W.; Stewart, F.; Pascal, K. Novel Pre-Strain Method for Dielectric Electroactive Polymers. Proc. SPIE 2016, 9798, 979837. [Google Scholar] [CrossRef]
  25. Newell, B.A.; Krutz, G.W. Electroactive Polymers, Methods of Manufacture, and Structures Formed Thereof. U.S. Patent Application 15556696, 10 March 2016. [Google Scholar]
  26. ASTM International/ASTM D3539, D01.24 Paint Related Coatings, Materials, Applications. “Standard Test Methods for Evaporation Rates of Volatile Liquids by Shell Thin-Film Evaporometer. 2011. Available online: https://www.astm.org/Standards/D3539.htm (accessed on 17 August 2018).
  27. Chen, B.T. Investigation of the solvent-evaporation effect on spin coating of thin films. Polym. Eng. Sci. 1983, 23, 399–403. [Google Scholar] [CrossRef]
  28. Newell, B.A.; Krutz, G.W.; Stewart, F.; Pascal, K. Chemically Pre-strained Dielectric Elastomers Finite Element Analysis. Proc. SPIE 2017, 10163, 101630T. [Google Scholar] [CrossRef]
  29. Newell, B.A.; Krutz, G.W. Electroactive Actuators, Systems Equipped Therewith, and Methods of Use and Manufacture. U.S. Patent 9683663, 20 June 2017. [Google Scholar]
  30. Mooney, M. A Theory of Large Elastic Deformation. J. Appl. Phys. 1940, 11, 582–592. [Google Scholar] [CrossRef]
Figure 1. (A) Image of Standard Constructed Actuators. (B) Image of Powered Actuator [23,24].
Actuators 07 00050 g001
Figure 2. (A) Cross-Section of Modeled Actuator (B) Applied Electric Potential at Electrode Surfaces (Sample 4000 V) (C) 2-D Axisymmetric Revolution.
Actuators 07 00050 g002
Figure 3. Mesh Distribution.
Actuators 07 00050 g003
Figure 4. Chemical Pre-strain. Left o-ring is without treatment, right o-ring with treatment in solvent for 15 min.
Actuators 07 00050 g004
Figure 5. Set 2 Geometry Z-Axis Displacement.
Actuators 07 00050 g005
Figure 6. Set 2 (A) Velocity and (B) Acceleration.
Actuators 07 00050 g006
Figure 7. Displacement Curves across Multiple Geometries. (A) Set 1; (B) Set 2; (C) Set 3.
Actuators 07 00050 g007
Figure 8. Model Z-Axis Displacement Results for Set 3 at 5000 V.
Actuators 07 00050 g008
Figure 9. Experimental and Model Displacement Data versus Voltage. (A) Stencil 2 Voltage Response; (B) Actuation versus Size.
Actuators 07 00050 g009
Figure 10. Finite Element Model Sensitivity Analysis.
Actuators 07 00050 g010
Table 1. Sample Dimensions [23,24].
Set NumberInactive Region Outer DiameterInactive Region Inner DiameterActive Region Outer DiameterActive Region Inner DiameterActive AreaWidth of Ring
15.7 cmNA 14.7 cmNA 117.35 cm2NA 1
25.7 cm0.7 cm4.7 cm1.7 cm15.08 cm21.5 cm
35.7 cm2.7 cm4.7 cm3.7 cm6.60 cm20.5 cm
1 Sample 1 is a circular actuator not a ring structure.
Table 2. Material Property Model Inputs.
Material PropertyValue
Dielectric Constant10.7
Thickness0.2549 mm
Poisson Ratio0.499
Bulk Modulus2.2986 MPa
Shear Modulus2.29 kPa
Young’s Modulus1.8 MPa
Electrical Conductivity (Dielectric Layer)2.857 × 10⁻¹⁴ S/m
Electrical Conductivity (Electrode Layer)10 × 104 S/m
Relative Permittivity2.5
Density1800 kg/m3
Thermal Conductivity0.2 W/(m·K)
Heat Capacity at Constant Pressure700 J/(kg·K)
Table 3. Measured Sample Thickness.
StencilAverage (mm)Standard DeviationMaximum (mm)Minimum (mm)
10.2340.0540.3050.152
20.2840.0300.3300.254
30.2550.0500.3300.152
Table 4. Sensitivity Analysis Variables and Ranges.
VariablesMinimumMaximum
Size (Active Area)6.60 cm217.35 cm2
Voltage1000 V5000 V
Temperature293 K400 K
Dielectric Constant10.721.4
Thickness0.329 mm0.654 mm
Table 5. Results of Chemical Pre-strain [23,24].
Initial Dimensions (cm)5 min Chemical Strain Dimensions (cm)5 min after Removal Dimensions (cm)% Swell% Reversal
5.108.175.40160.1394.44
5.138.005.13155.84100.00
4.537.274.60160.2998.55
4.776.974.73146.15100.00
4.637.634.87164.7595.21
4.607.174.97155.8092.62
4.607.504.65163.0498.92
4.607.604.50165.22100.00
Table 6. Averaged Experimental Z-axis Displacement [23,26,27,28,29].
Set Active Area Experimental Displacement
1 17.35 cm2 0.9876 mm
2 15.08 cm2 0.8475 mm
3 6.60 cm2 0.1891 mm
Table 7. Comparison between Model and Experimental Results.
Specimen Active Area Model Displacement Experimental Displacement
1 17.35 cm2 1.1653 mm 0.9876 mm
2 15.08 cm2 0.633 mm 0.8475 mm
3 6.60 cm2 0.1870 mm 0.1891 mm

