
Ionizing Waves in Surface Dielectric Barrier Discharges Plasma Actuators


Dipartimento di Fisica, Università degli Studi di Milano-Bicocca, Piazza della Scienza 3, 20126 Milano, Italy
*
Author to whom correspondence should be addressed.
Actuators 2024, 13(3), 86; https://doi.org/10.3390/act13030086
Submission received: 19 December 2023
/
Revised: 19 February 2024
/
Accepted: 20 February 2024
/
Published: 22 February 2024
(This article belongs to the Special Issue Dielectric Barrier Discharge Plasma Actuators for Thermo-Fluid Dynamics Applications)
Abstract
:Plasma actuators have been proposed as a tool to produce hydrodynamical effects in the boundary layer of aerodynamical flows. We have analyzed some properties of these systems using suitable plasma diagnostics based on the emissivity characteristics of such plasmas. The direction and the velocity of propagation of the ionizing wave spreading on the dielectric surface were measured (in the 100–200 km/s range), and it was demonstrated that it behaves like a cathode-directed streamer. The averaged electron temperature (4–5 eV) and the reduced field strength (E/N ≈ 6 × 10¹⁹ V·m2) of the ionizing wave switching the discharges on were measured, too.
1. Introduction
Asymmetric Surface Dielectric Barrier Discharges (sDBDs) have been proposed as plasma actuators when it was observed that they can induce a directed airflow in the gas just above the surface [1,2,3]. This hydrodynamical phenomenon was sometimes referred to, although improperly, as an ionic wind [4]. The term was introduced earlier, along with observations made about the effects of electrical discharges in air [5]. Also, the nature of the particles involved in or causing the phenomenon is not fully understood. Interestingly, this can be used to energize the boundary layer of a flow, which can influence several properties, in particular, drag reduction, lift enhancement, or stall prevention of air windings [6,7]. In this respect, plasma could be considered an actuator, enabling flow condition control. Its peculiar advantages are the fast response, possibly also remotely controlled when switching the discharge on and off, and the limited (electrical) input power needed.
The direct connection, especially the capability of control, between the discharge properties and the induced flow is the subject of active research both from the experimental and the theoretical points of view (see, e.g., the reviews [8,9,10,11]). Some recent results can also be found in the literature [12,13]. Although a relevant amount of information has already been discussed in the literature, there are many unanswered questions, too. The more relevant ones concern the microscopic properties of the plasma state and its transport, recombination, and spread on the dielectric surfaces. Also, the details of the energy transfer from the electric discharge agents and the neutral flow are not fully understood.
In our view, a promising path to understanding these issues relies on contributions of plasma physics expertise and the use of suitable plasma diagnostics. Here, some properties of the sDBDs will be discussed, as they could be inferred from the application of suitable plasma diagnostics [14,15], which are relevant for understanding the link between the discharge characteristics and the induced hydrodynamical phenomena in the surrounding gas. In particular, the role and the propagation of the ionizing wave, which switches the electrical discharge on, was studied. The wave promotes the formation of plasma filaments and the propagation of the electric currents, which sustain the formation of the hydrodynamical flow.
2. Materials and Methods
The experimental setup used has already been described in our previous papers [16,17]. Here, only the most relevant properties are recalled. The discharge occurs through short pulses developing in current filaments, filling the air gap between the electrodes. Instantaneous values of the microdischarge (MD) current pulses can be reconstructed (up to 100 MHz bandwidth) using Rogoski coils signals, FFT transforms, and frequency-dependent corrections after suitable calibration procedures [18]. Almost instantaneous measurements of MD emissivity can be obtained from optical emission spectroscopy using photomultiplier detectors, spotting the UV lines of N2(C) and N2+(B) excited states radiative decays [19]. Time spread, in the order of the excited states’ lifetimes (40/60 ns), is substantially reduced in MD thanks to quenching due to non-radiative de-excitations happening in atmospheric pressure plasmas. The early formation of a vortex flow in the discharge region can also be spotted using optical measurements based on the Background-Oriented Schlieren technique [20]. Voltages, charges transported or deposited on the dielectric surfaces, and the energy of the MD can be measured with more standard means [21]. Optical Emission Spectroscopy (OES) has been performed, too, using optical fibers and a low-resolution, low-speed UV–Vis spectrometer [16].
As a starting point, one could recall that if a sufficiently high voltage difference is applied between two electrodes placed at the opposite sides of an insulating material, an sDBD is obtained, following the electrical breakdown and subsequent ionization of the gas surrounding the dielectric material [22,23]. Moreover, if one electrode is insulated from the air or simply buried, the discharge is generally ignited in correspondence with just one side of the barrier [1,2]. If the exposed electrode is flat, the discharge occurs exactly at the dielectric surface, generally in the region corresponding to the electrode edge. This is the typical asymmetric SDBD setup considered in plasma actuator applications [1,2].
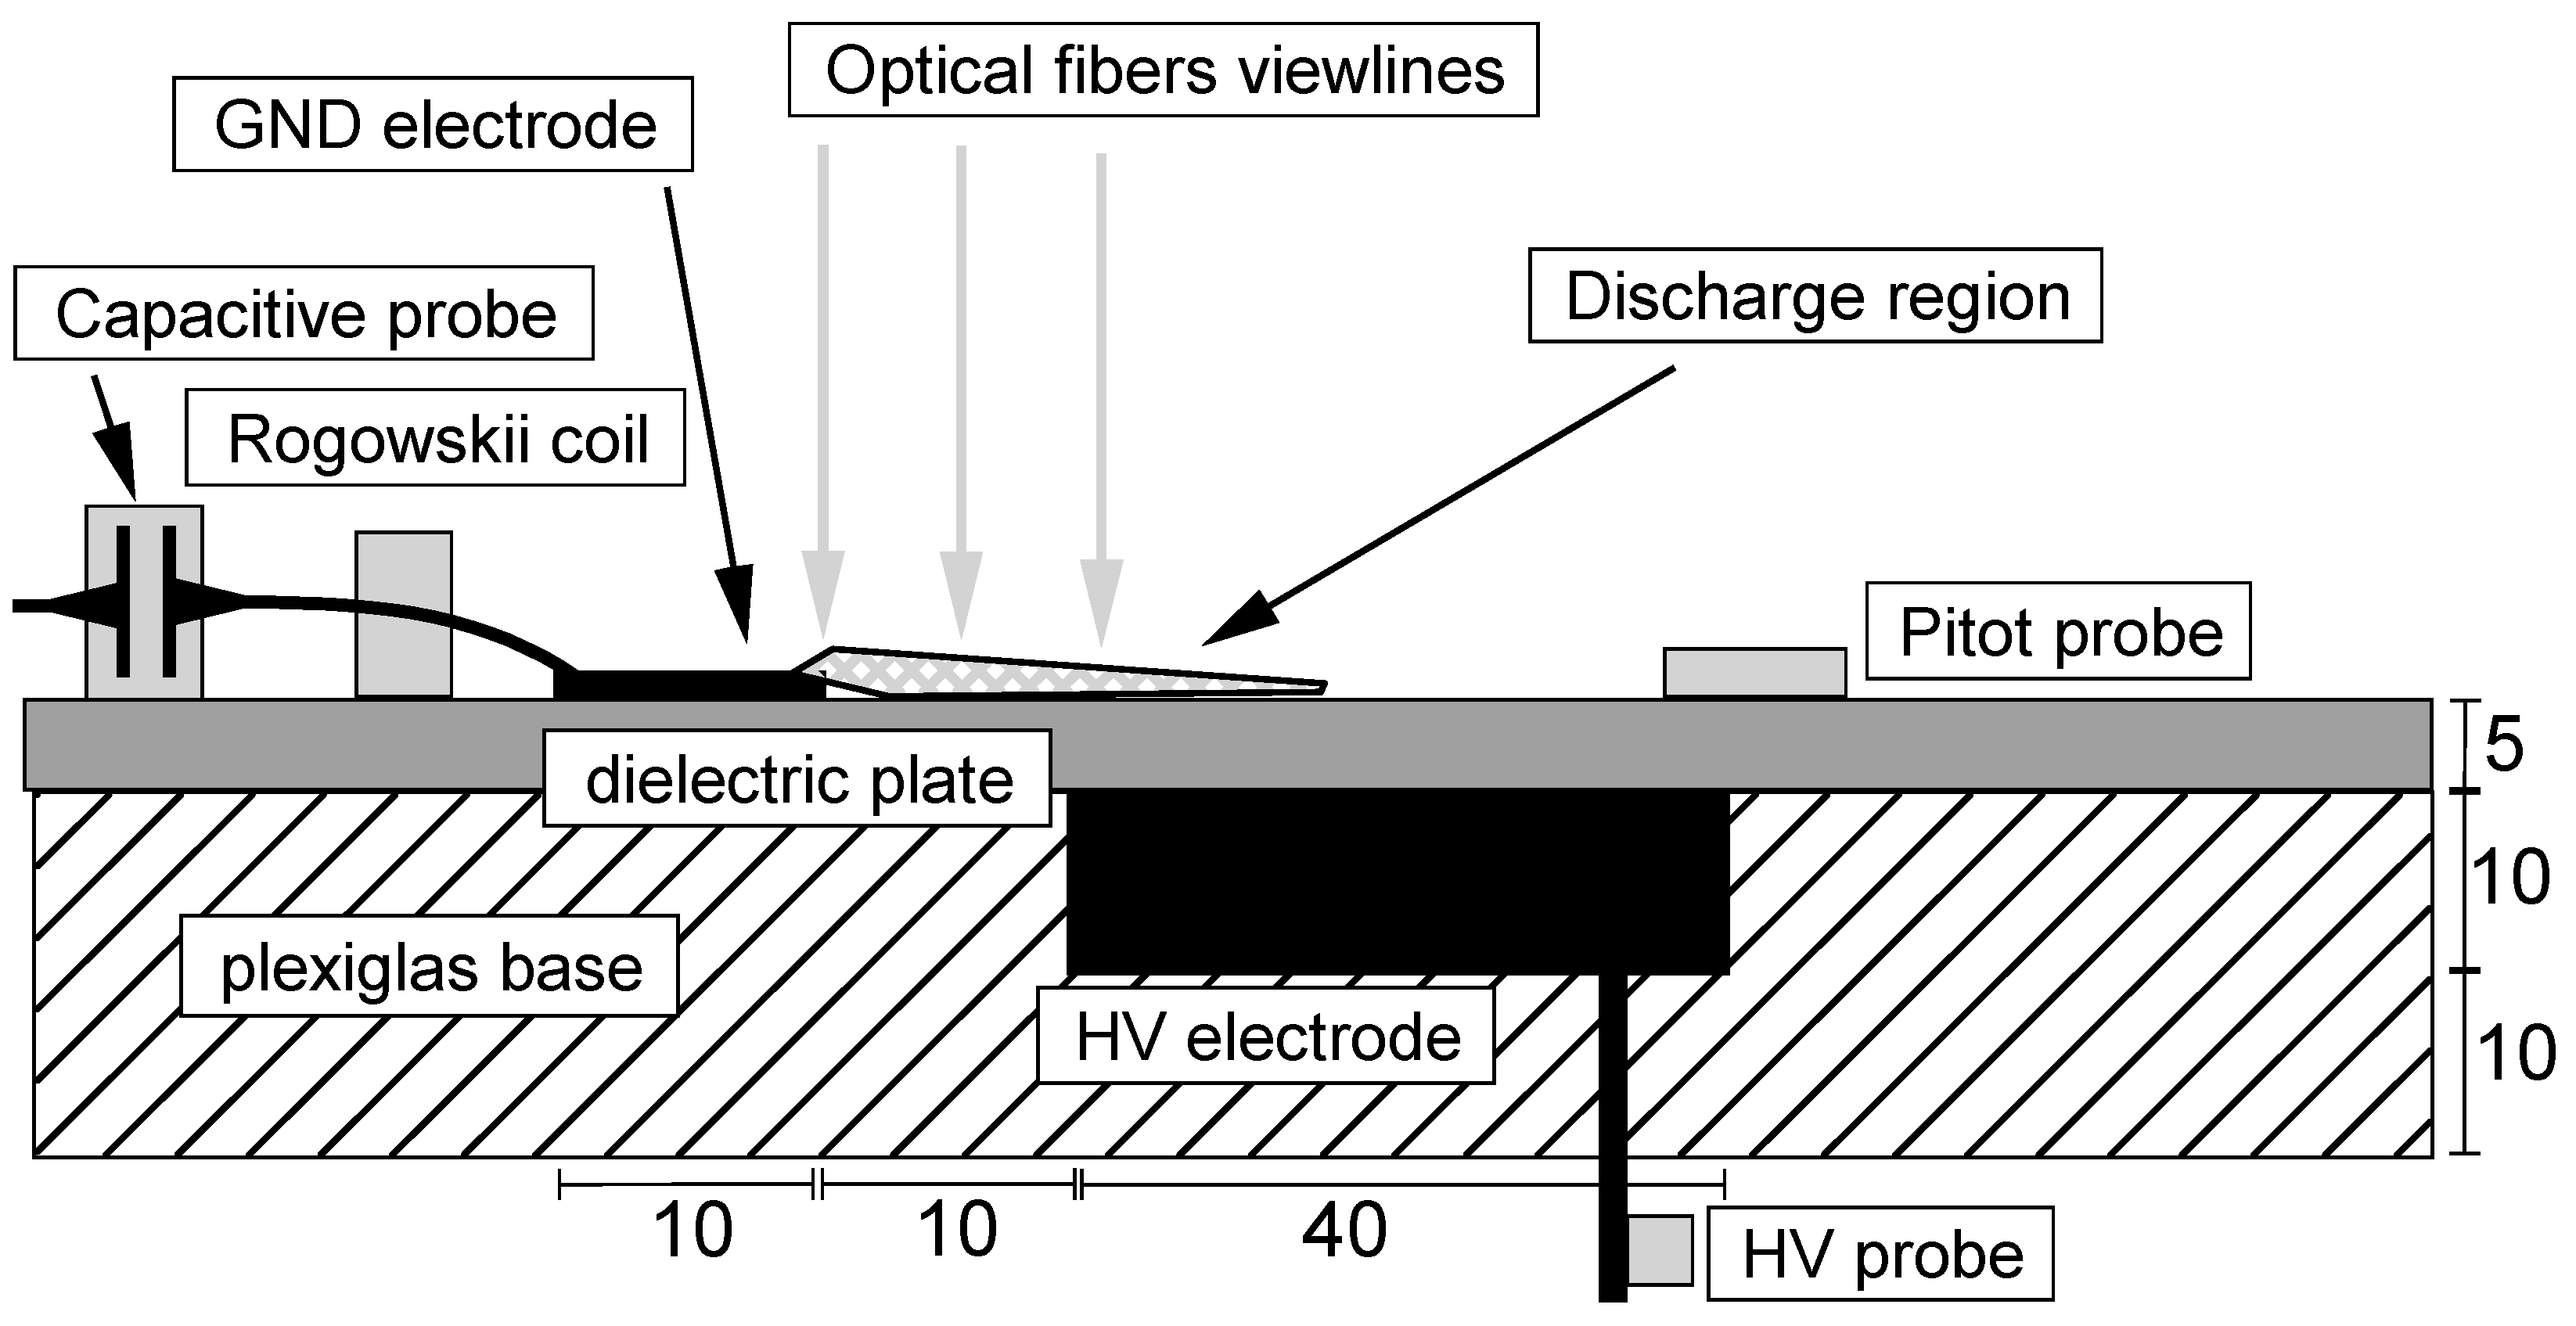
The experiments described below have been performed in a suitable setup arrangement, which allows the implementation of several plasma diagnostics [17]. A sketch of the setup is displayed in Figure 1. The electrodes are parted by a dielectric sheet (5 × 220 × 200 mm3). The barrier material was Teflon, whose relative dielectric constant εr is 2.05. An aluminum block (10 × 40 × 180 mm3), connected with the HV supply, was buried in a plexiglas plate (20 × 330 × 200 mm3). The exposed electrode was built by a tin-clad copper adhesive sheet (60 µm thick, 10 mm wide) glued onto the dielectric plate.
The two electrodes thus lie parallel to each other where the edges just correspond in order to avoid any overlap or slight shift, 10 mm apart, as shown in Figure 1, where relevant quotes are reported.
The instantaneous pattern of the potential and electric fields was calculated by Estat software (Estat 7.0) by Field Precision LLC (Albuquerque, NM, USA) and reported in Figure 2 for a simplified configuration. It is clear that the maximum intensity occurs just across the line corresponding to the juxtaposed electrode edges. It is worth mentioning that although the discharge pattern could be intricated and branched, within the drift approximation, the electrons move along the electric field lines. So, the figure helps with guessing the pattern of the discharges.
However, it is also noteworthy that the charge transported by the discharges and accumulated on the dielectric surface will distort this pattern, and the actual size and shape of current filaments cannot be predicted. Once the discharge is ignited, as will be discussed below, microdischarges happen in two-phase portions of the sinusoidal cycle, during which the intensity of the external applied voltage changes even more strongly.
As is shown in Figure 1, the discharge region could be observed through a series of optical fibers, whose viewlines were vertical and could be arranged to look at small spot areas on the dielectric surface, hopefully intersecting the pattern of a single discharge filament. Our purpose was to use a multi-anode photomultiplier tube (PMT) to simultaneously process signals from different regions of the plasma. PMTs themselves have the correct fastness and sensitivity needed for visible radiation detection (0.83 ns rise time, 12 ns transit time, 80 mA/W @420 nm, 106 gain). The choice of multi-anode devices can be a suitable substitute for an array of single PMTs or a CCD. Their use is beneficial in terms of both cost and better stability. Their cost is an order of magnitude lower than CCD fast cameras, their natural detector alternatives. Here, a 4 × 4 matrix multi-anode PMT, model H8711 by Hamamatsu, Photonics (Shimokanzo, Iwata City, Japan) was adopted to detect spatial correlations in the plasma emissivity. As already stated, the flashes of light from the plasma are carried to the different PMT-sensitive areas through fiber optics (Avantes, Apeldoorn, The Netherlands, 200 µm diameter, 2 m length). In order to retain as much of the emission timing information as possible, a simplified acquisition method was adopted. It uses the formation of the signal by the low impedance input of a digital scope (here, a 1 GHz, Infinium MSO-8104 by Agilent Technologies, Santa Clara, CA, USA). As observed on this instrument, the bunch of electrons produced by the PMT shows up as a small negative spike in voltage with a fast rise time and a somewhat longer decay, with a duration of about 3 ns [17]. A scope trace is shown in Figure 3 to demonstrate the quality of the measured signals and the absence of cross-talk. Using such an instrument, only up to four simultaneous viewlines could be recorded.
The light emission from the discharge, collected by the optical fibers, as shown in Figure 1, was also measured with a wide-range, low-resolution spectrometer (Avantes, AvaSpec-ULS4096CL-EVO). The instrument is provided with a UA grating and a 10 μm slit. It could measure emission spectra in the 200–1100 nm range, with about 0.3 nm resolution. Acquisition times, however, are in the order of the seconds, so only averaged properties of emission spectra were measured. Intensities were corrected for device efficiency using a calibrated lamp.
A few measurements of the produced flow have been performed in our experiments. Pitot tubes are small glass tubes with outer and inner diameters usually equal to 1.4 mm and 1.0 mm, respectively, and the pressure difference was measured by an LPM-9381 Druck transducer. The Pitot inlet was placed in contact with the dielectric surface and generally 10 to 50 mm downstream of the exposed electrode edge, as can be seen in Figure 1. Some more defined vertical profiles were measured using a capillary of 0.1 mm diameter.
3. Presentation and Discussion of Results
It is known that when oscillating HV signals are applied, the discharge occurs two times per cycle, as reported, e.g., in our previous experiments [17]. The two strokes happen during a time (or phase) portion of the two semi-cycles: the positive-going one (dV/dt > 0) and the negative-going one (dV/dt < 0). It is worth noting that it is not the actual sign of the applied voltage but the sign of its derivative that controls the alternating of the two strokes [17]. This behavior is controlled by the charge transport to/from the dielectric surfaces. The two strokes are denoted as Forward and Backward Discharges (FD and BD, respectively). These names were chosen to stress the supposed motion of the electrons with respect to the induced flow direction [1,17]. Thus, in our setup, where the hot electrode is the buried one (see Figure 1), the positive-going semi-cycle corresponds to the FD, whereas the negative-going one corresponds to the BD.
The interest in such taxonomy relies on the observation that the Backward Discharge is generally much stronger in asymmetric DBD in terms of emitted light or number of microdischarges with respect to the Forward Discharge [17]. It is also thought to be the leading agent in transferring the energy to the induced flow [1], although direct evidence is lacking, mainly because of the large time lag between the HV oscillation periods and the onset of the hydrodynamical perturbation. This motivates us to focus our study on the character of the BD.
The first property that was investigated is related to the propagation of the ionizing wave on the dielectric surface during the Backward Discharge. One could recall that the electric discharge in DBD is made up of narrow current filaments, each having lifetimes of a few nanoseconds [22]. In a cathode-directed streamer, the development of the discharge filaments is guided by the electron avalanche multiplication that occurs in the strong electric field ahead of the ionizing wave (which could reach values about 5–15 × 106 V/m) and travels typically very fast (with velocities in the 105–106 m/s range) [19,22]. To demonstrate this, the delay between the light emission from subsequent parallel viewlines above the surface intersecting the filament pattern has been measured. In Figure 4, the filament pattern was recorded with a CMOS-intensified camera (time exposure 200 ms), where the bright spots are located just at the exposed electrode edge. The buried electrode edge corresponds exactly with this line in these experiments.
To demonstrate the method, the light collected from two parallel viewlines was sent to two channels of the multi-anode PMT, and the electric pulses were digitized on the low impedance input of a 4 GHz band scope. The viewlines imaged spots were about 0.4 mm in diameter, separated by 2 mm, the former just at the edge of the exposed electrode and the latter on the nearby dielectric surface. The arrival times of the pulses were recorded, and the delay between the two nearest ones was calculated. The latter was then used to reconstruct a frequency histogram, as seen in Figure 5. The distributions are generally large, and a Gaussian fit is sufficient to estimate a central value of the time lag and its spread. In the case shown, a delay of 9.2 ± 0.3 ns was measured. Such precision is sufficient to evaluate the direction of the propagating ionizing wave and also to assess its average velocity in the space between the spots.
Figure 6 shows the measured delays and the ionizing wave propagation velocity for different values of potential difference across the electrodes. This was achieved by recording the PMT signals only during a limited phase portion of the voltage sinusoidal oscillation, using the segmented memory acquisition option of the scope. Here, only light collected during the BD strokes was used to measure the delays. Light emission occurs first at the exposed electrode edge and then can be detected above the dielectric surface, which lies in the direction of the cathode-acting electrode during the BDs. This demonstrates that the discharge filament evolves as a cathode-directed streamer [24] despite the electrons moving toward the anode. The formation of a weakly ionized channel escapes our detection capabilities. Also, the presence of anode-directed streamers cannot be excluded, although it should be a minority [24].
Actually, this velocity corresponds to the average propagation speed over the first 2.4 mm beside the exposed electrode edge. The propagation velocity appears to increase roughly linearly with the applied voltage amplitude. The order of magnitude of the speed agrees with estimates based on cross-correlation spectroscopy and theoretical expectations for such kinds of streamers [24,25]. It also agrees with our previous results obtained with a single PMT and by combining the light of different optical fiber viewlines [19].
It should be noted that the exact nature of the asymmetry between FD and BD strokes, as well as their mutual or antagonist contribution to the hydrodynamical effects, is yet to be demonstrated, and our findings are somewhat complementary to the electron avalanche mechanism already pointed out in the literature [2].
The second aspect of plasma actuators that will be addressed is related to the emission light spectra of the discharges. As can be seen from Figure 7, those spectra are dominated by the N2 second positive system (emissions from the vibrational states of the C 3Πu level) in the violet and near-UV band [26].
Here, the comparison was made using an optical fiber viewline with a spot area of about 5 mm in diameter, centered at the edge of the exposed electrode. Emission intensity grows with the applied voltage, as shown in Figure 8. However, the increase is almost exponential rather than linear. The trend appears to be independent of the repetition rate, although the absolute intensity changes considerably.
In fact, whereas the increase between 20 and 30 kHz could be simply explained by considering the larger number of discharges (1.5 times) happening in the unit time at the higher frequency, the explanation of the smaller intensity at intermediate frequencies appears more challenging. One could assume the presence of a depleted number of discharges taking place in the limited region imaged by the OES diagnostics. This could happen since, sometimes, the discharge displays a pattern of strong filaments, and such a spatial pattern appears to wander somewhat in the direction transverse to the electrodes.
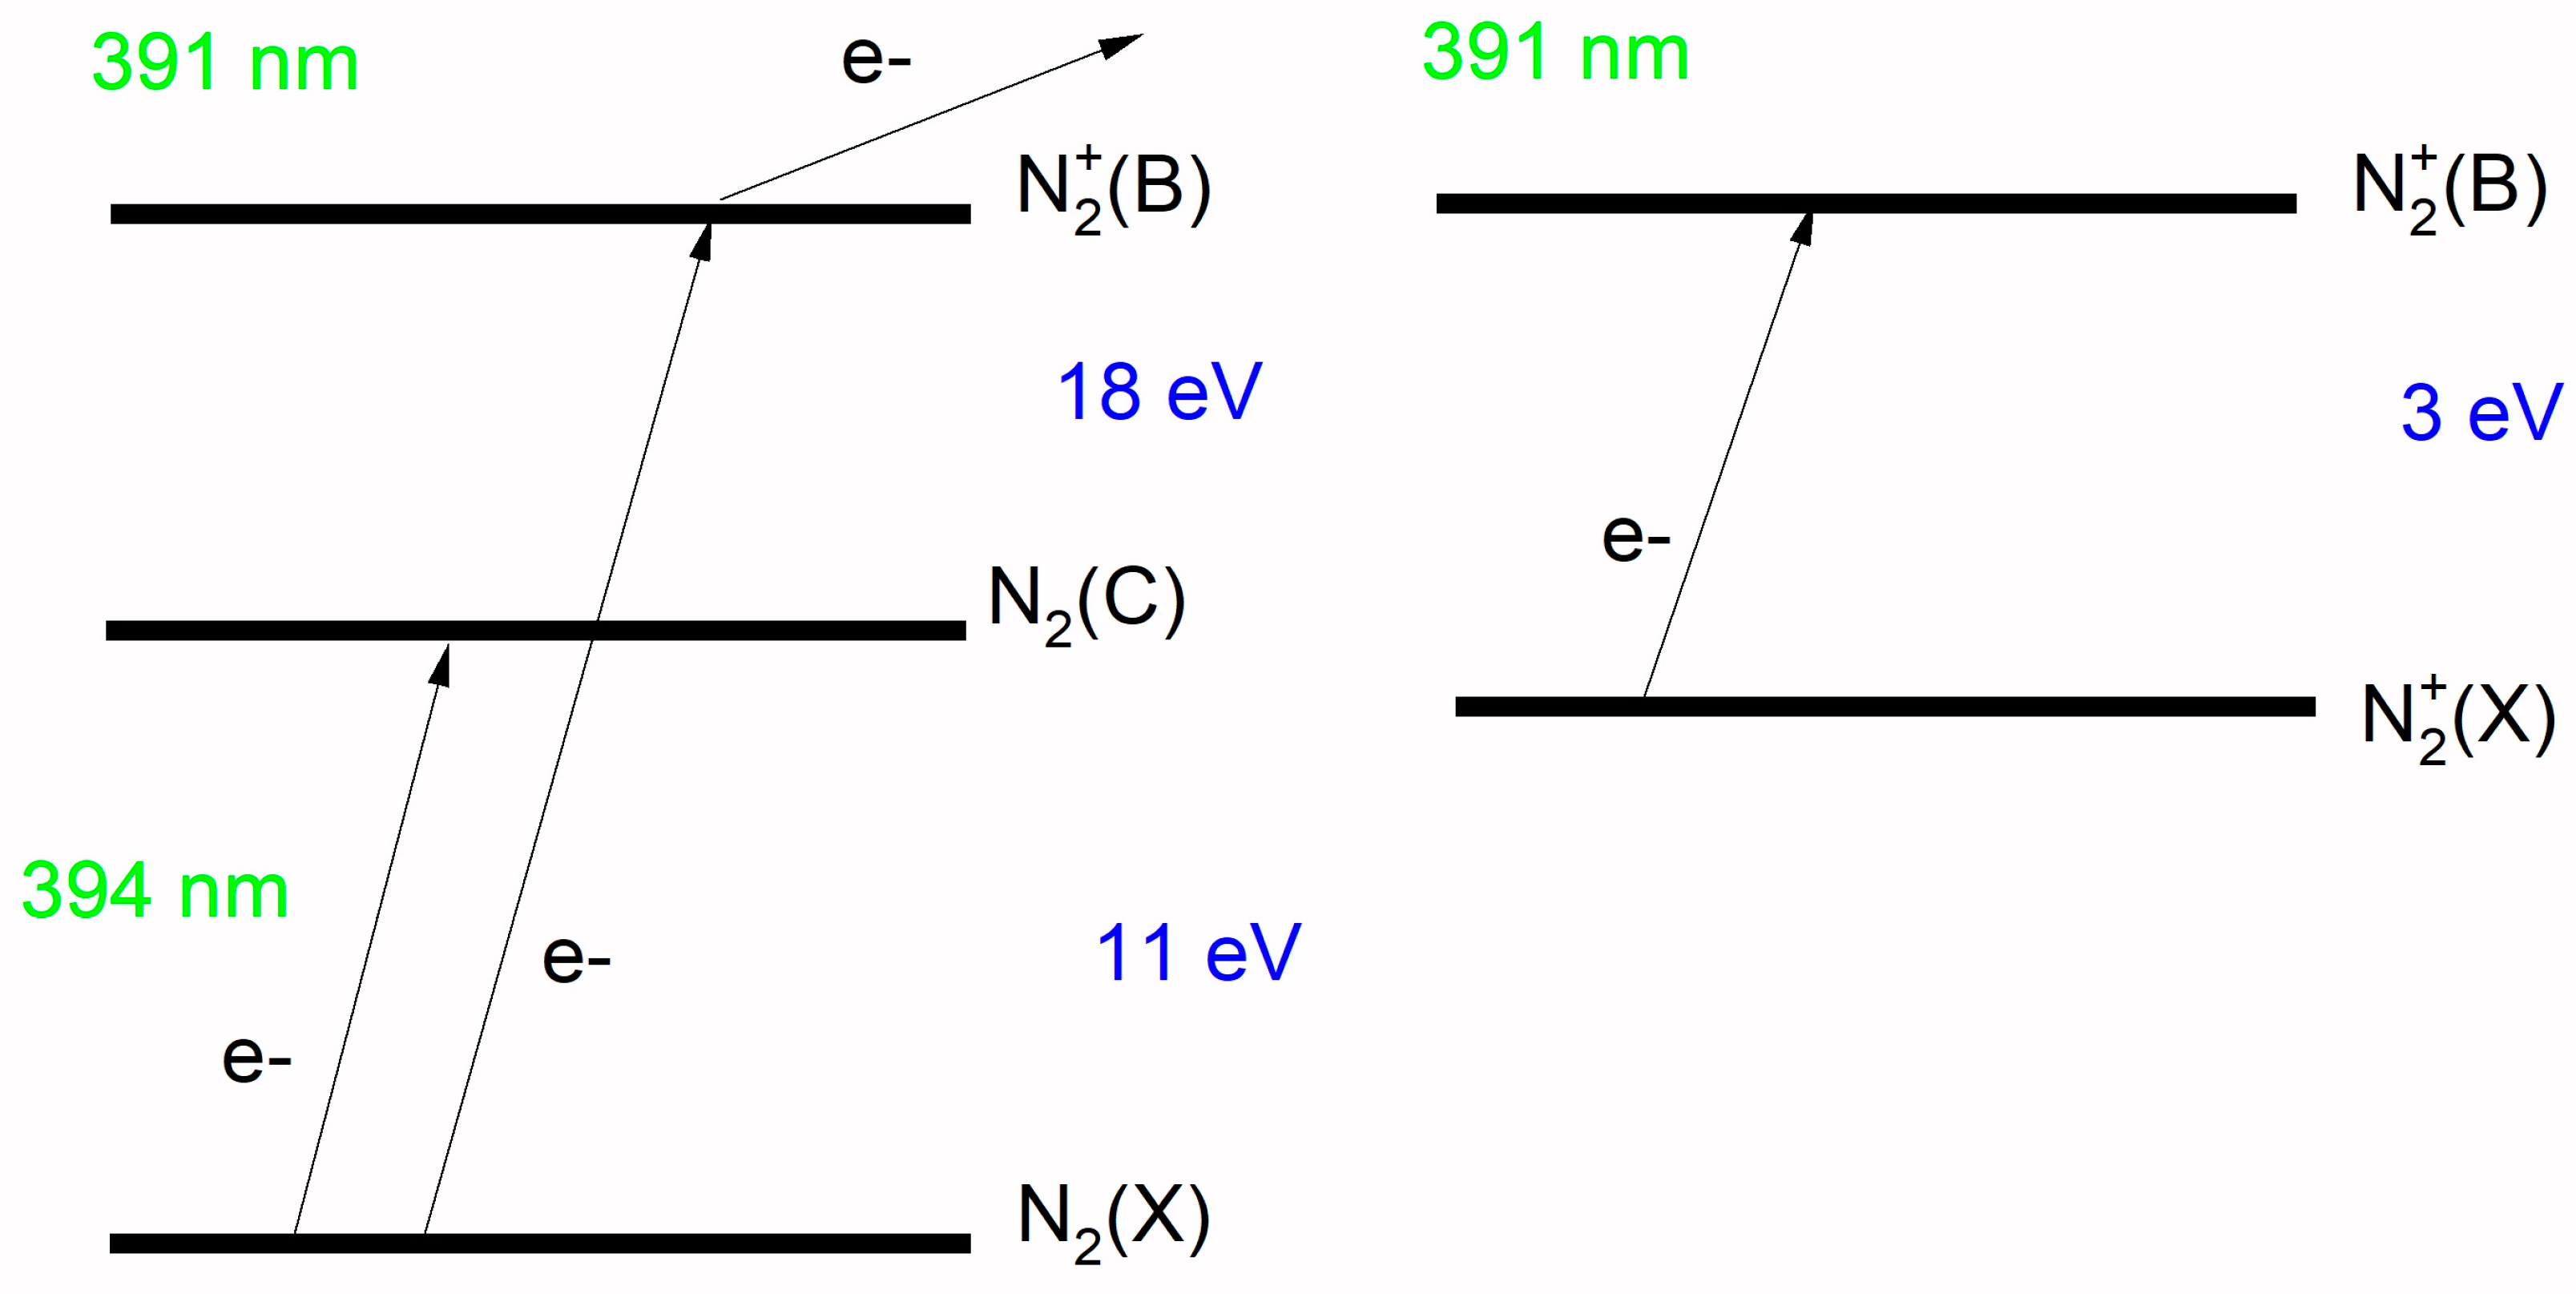
Much less evident but more informative are measurements of other minority emission lines. In the spectra, some lines are observed from other molecular nitrogen optical systems, from atomic oxygen, from OH radicals, and also from nitrogen ions N2+. Here, the ratio of the intensities of two nearby emission lines at 391 and 394 nm has been calculated [26]. The former comes from the nitrogen ions, whereas the latter belongs to the second positive system. Because they are so near, one could expect the same efficiency of the detector, which factors them out. The intensity ratio was plotted as a function of the applied voltage, as shown in Figure 9. The line intensity ratio was calculated from both the peak maximum and area (after background subtraction), which agrees that, as in our low-resolution instrument, the line shape depends on the spectrometer rather than on the specific emission line. As observed concerning the emission line intensities, the reported trend challenges simple expectations.
According to a simplified model of the excitation processes by energetic electron impact, displayed in Figure 10, one could expect the ratio to increase with the applied voltage because of an increased ion density and/or larger electron energy. This is not what one observes. First of all, it could be inferred that such ratio values correspond either to electron temperatures of about 4–5 eV [27] or to a reduced effective electric field E/N of about 6 × 10⁻¹⁹ V·m2 [28], where a formula was reported connecting the intensity ratio to the field strength. A recent paper discussing measurements of electric field strength can also be quoted [29]. To put it in perspective, this is about five times the dielectric strength of air at STP. These values can also be used as input to develop suitable discharge models aimed at obtaining an energy transfer to the neutral molecules and to the development of hydrodynamical effects. Mean electron energies or equivalently electric field strengths, during the ionizing wave, are a crucial input for radiative-collisional models [28] or for the modeling of the discharge and its effects as a whole. Our results can already be used against some approaches based on steady plasma conditions [30].
Finally, both the decreasing trend and, again, the mixed behavior as the repetition frequency is changed point to the effect of the actual extension of the MD connected with the spatial pattern of the discharge. In particular, the growing contribution from the FD balancing the BD when the amplitude is raised could contribute to diluting and decreasing the averaged electric field strength that is probed by the emission line intensity ratio. Further work, using time and wavelength-resolved measurements at once, could help resolve this issue.
As a final remark, it could also be pointed out that our device can function as a plasma actuator, among other applications that benefit from the hydrodynamical effects associated with such plasmas [31]. More precisely, the formation of a vortex evolving into a surface jet extending down the discharge region has been observed [20].
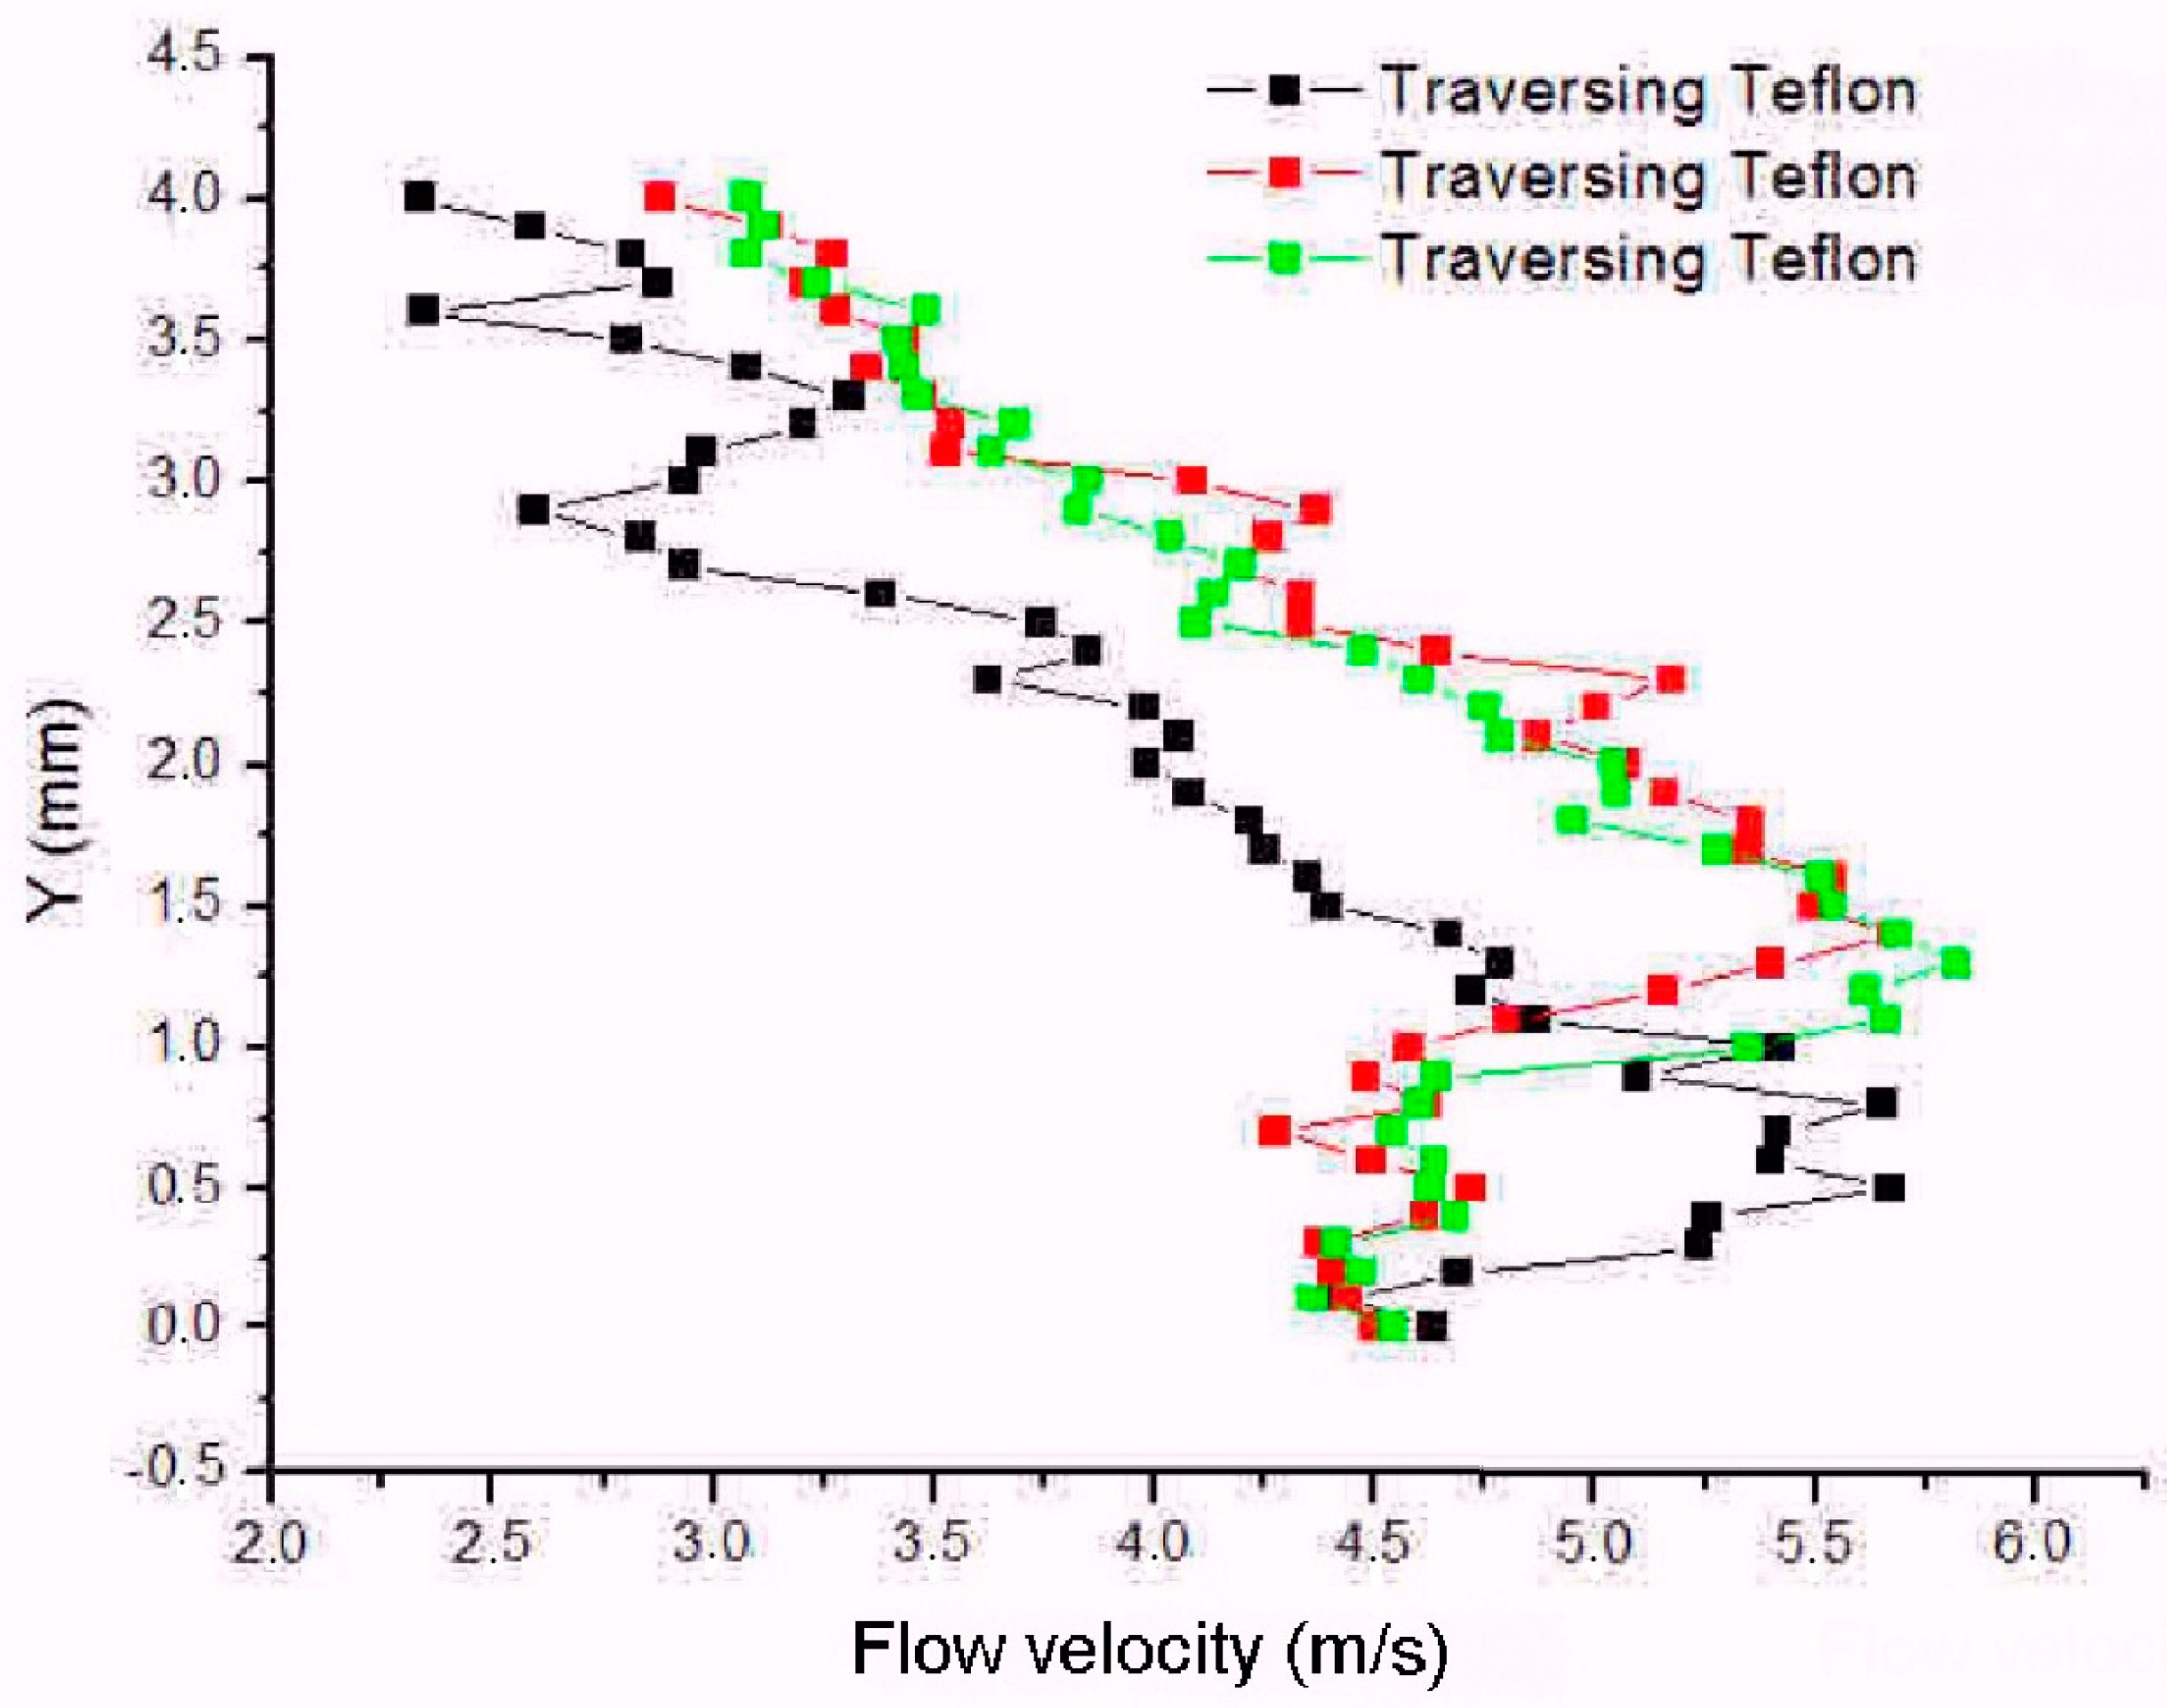
As already known, this gas flow is mostly uniform, spanning the entire electrode length and moving just above the dielectric surface. Flow velocities about a few m/s were recorded. As shown in Figure 11, the speed increases almost linearly as the applied voltage is raised. This contrasts with the exponential growth of the plasma emission light intensity already described and also with the estimates of the reduced electric field strength. Although the peak velocity is increased, the velocity field pattern appears almost independent of the applied voltage in its extension and spatial distribution, consisting of a thin surface jet slowly decelerating downstream against the ambient air. The jet was tracked downstream up to 25 mm away from the exposed electrode edge, and its vertical profile and extension were measured and found to be quite independent of the downstream position, as shown in Figure 12. In particular, the velocity profile peaks within the first millimeters above the surface and remains attached to it. So, the kinetic energy provided by the plasma device is injected directly within the boundary layer above the surface.
It could be underlined that the configuration was kept as simple as possible in order to focus more on the properties of the discharges rather than on the optimization of the hydrodynamics efficiency. However, the produced flow will affect the boundary layer above the free surface downstream of the device, where the hydrodynamical effects are more useful, as needed by a sensible plasma actuator. We also recall that our supply system, based on driving the resonant circuit built of the electrodes system and the secondary of an HV transformer, allows for changes in frequency and voltage but cannot control the microdischarges properties or the hydrodynamical efficiency, which are beyond the scope of our experiments [32].
4. Conclusions
Some properties of the sDBD, in configurations that have been proposed for applications as plasma actuators, have been discussed. The actual device is able to produce suitable ionic winds, with velocities of several meters per second, in the form of a surface jet propagating downstream along the dielectric barrier.
Plasma diagnostics have been employed, using several techniques that are relevant for understanding the link between the discharge characteristics and the induced hydrodynamical phenomena in the surrounding gas. In particular, the development of the filaments that populate the most active phase of the asymmetric sDBD, the Backward Discharge semi-cycle, has been analyzed. The arrival of the ionizing wave has been consistently measured, and it was demonstrated that the wave behaves like a cathode-directed discharge. In addition, propagation velocities and their dependence on the applied voltage have also been measured.
Emission spectra have also been analyzed, and several observations were made correlating the plasma emissivity with the electrical parameters driving the discharges. Some already existing approximate models of collisional radiative processes have been used to estimate the averaged electron temperature and the reduced field strength of the ionizing wave switching the discharges on.
Author Contributions
Conceptualization, C.R.; methodology, R.B. and H.E.R.; investigation, R.B.; writing—original draft preparation, R.B.; writing—review and editing, all; visualization, R.B. All authors have read and agreed to the published version of the manuscript.
Funding
Part of the research was performed within the MUSA—Multilayered Urban Sustainability Action—project, funded by the European Union—NextGenerationEU, under the National Recovery and Resilience Plan (NRRP) Mission 4, Component 2, Investment Line 1.5: Strenghtening of research structures and creation of R&D “innovation ecosystems”, set up of “territorial leaders in R&D”. This work was also funded by the National Plan for NRRP Complementary Investments (PNC, established with the decree-law 6 May 2021, n. 59, converted by law n. 101 of 2021) in the call for the funding of research initiatives for technologies and innovative trajectories in the health and care sectors (Directorial Decree n. 931 of 6 June 2022)—project n. PNC0000003—AdvaNced Technologies for Human-centrEd Medicine (project acronym: ANTHEM). This work reflects only the authors’ views and opinions; neither the Ministry for University and Research nor the European Commission can be considered responsible for them.
Data Availability Statement
The data presented in this study are available on request from the corresponding author.
Acknowledgments
We are pleased to acknowledge the support of our technical staff at the PlasmaPrometeo Center, Alessandro Mietner and Alessandro Bau, as well as fruitful discussions with past members of the center as well as of Italian aerospace company Aermacchi.
Conflicts of Interest
The authors declare no conflicts of interest.
References
- Roth, J.R.; Sherman, D.M.; Wilkinson, S.P. Electrohydrodynamic Flow Control with a Glow-Discharge Surface Plasma. AIAA J. 2000, 38, 1166–1172. [Google Scholar] [CrossRef]
- Corke, T.C.; Enloe, C.L.; Wilkinson, S.P. Dielectric Barrier Discharge Plasma Actuators for Flow Control. Annu. Rev. Fluid Mech. 2010, 42, 505–529. [Google Scholar] [CrossRef]
- Caruana, D. Plasmas for aerodynamic control. Plasma Phys. Control. Fusion 2010, 52, 124045. [Google Scholar] [CrossRef]
- Moreau, E.; Sosa, R.; Artana, G. Electric wind produced by surface plasma actuators: A new dielectric barrier discharge based on a three-electrode geometry. J. Phys. D 2008, 41, 115204. [Google Scholar] [CrossRef]
- Robinson, M. History of the electric wind. Am. J. Phys. 1962, 30, 366–372. [Google Scholar] [CrossRef]
- Corke, T.C.; Post, M.L.; Orlov, D.M. Single Dielectric Barrier Discharge Plasma Enhanced Aerodynamics: Concepts, Optimization and Applications. J. Propuls. Power 2008, 24, 935–945. [Google Scholar] [CrossRef]
- Corke, T.C.; Mertz, B.; Patel, M.P. Plasma Flow Control Optimized Airfoil. In Proceedings of the 44th AIAA Aerospace Sciences Meeting and Exhibit, Reno, Nevada, 9–12 January 2006. [Google Scholar]
- Kriegseis, J.; Simon, B.; Grundmann, S. Towards in-flight applications? A review on dielectric barrier discharge-based boundary-layer control. Appl. Mech. Rev. 2016, 68, 020802. [Google Scholar] [CrossRef]
- Brandenburg, R. Dielectric barrier discharges: Progress on plasma sources and on the understanding of regimes and single filaments. Plasma Sources Sci. Technol. 2017, 26, 053001. [Google Scholar] [CrossRef]
- Belan, M.; Messanelli, F. Compared ionic wind measurements on multi-tip corona and dbd plasma actuators. J. Electrost. 2015, 76, 278–287. [Google Scholar] [CrossRef]
- Benard, N.; Moreau, E. Electrical and mechanical characteristics of surface ac dielectric barrier discharge plasma actuators applied to airflow control. Exp. Fluids 2014, 55, 1846. [Google Scholar] [CrossRef]
- Zhao, P.; Portugal, S.; Roy, S. Efficient needle plasma actuators for flow control and surface cooling. Appl. Phys. Lett. 2015, 107, 033501. [Google Scholar] [CrossRef]
- Mohammadpour, P.; Mani, M.; Saededi, M. Experimental investigation of induced velocity by dielectric barrier discharge plasma actuator in different configurations. AIP Adv. 2021, 11, 105007. [Google Scholar] [CrossRef]
- Piferi, C.; Barni, R.; Roman, H.E.; Riccardi, C. Current Filaments in Asymmetric Surface Dielectric Barrier Discharge. Appl. Sci. 2021, 2021, 2079. [Google Scholar] [CrossRef]
- Kotsonis, M. Diagnostics for characterisation of plasma actuators. Meas. Sci. Technol. 2015, 26, 092001. [Google Scholar] [CrossRef]
- Biganzoli, I.; Barni, R.; Riccardi, C.; Gurioli, A.; Pertile, R. Optical and Electrical Characterization of a Surface Dielectric Barrier Discharge Plasma Actuator. Plasma Sources Sci. Technol. 2013, 22, 025009. [Google Scholar] [CrossRef]
- Biganzoli, I.; Barni, R.; Riccardi, C. Temporal evolution of a surface dielectric barrier discharge for different groups of plasma microdischarges. J. Phys. D 2013, 46, 025201. [Google Scholar] [CrossRef]
- Biganzoli, I.; Barni, R.; Riccardi, C. On the use of Rogowski coils as current probes for atmospheric pressure dielectric barrier discharges. Rev. Sci. Instrum. 2013, 84, 016101. [Google Scholar] [CrossRef] [PubMed]
- Barni, R.; Biganzoli, I.; Riccardi, C. Spatial and temporal evolution of microdischarges in surface Dielectric Barrier Discharges for aeronautical applications. J. Phys. Conf. Ser. 2014, 550, 012036. [Google Scholar] [CrossRef]
- Biganzoli, I.; Capone, C.; Barni, R.; Riccardi, C. Background Oriented Schlieren as a diagnostics for airflow control by plasma actuators. Rev. Sci. Instrum. 2015, 86, 026103. [Google Scholar] [CrossRef]
- Manley, T.C. The Electric Characteristics of the Ozonator Discharge. Trans. Electrochem. Soc. 1943, 84, 83. [Google Scholar] [CrossRef]
- Kogelschatz, U. Dielectric-barrier discharges: Their history, discharge physics, and industrial applications. Plasma Chem. Plasma Proc. 2003, 23, 1–46. [Google Scholar] [CrossRef]
- Fridman, A.; Chirokov, A.; Gutsol, A. Non-thermal atmospheric pressure discharges. J. Phys. D Appl. Phys. 2005, 38, R1–R24. [Google Scholar] [CrossRef]
- Raizer, Y.P. Gas Discharge Physics; Springer: Berlin/Heidelberg, Germany, 1991. [Google Scholar]
- Brandenburg, R.; Gros, H.; Hoder, T.; Weltmann, K.D. Phase resolved cross-correlation spectroscopy on surface barrier discharges in air at atmospheric pressure. Eur. Phys. J. Appl. Phys. 2011, 55, 13813. [Google Scholar] [CrossRef]
- Pearse, R.W.B.; Gaydon, A.G. The Identification of Molecular Spectra; Wiley: New York, NY, USA, 1976. [Google Scholar]
- Britun, N.; Gaillard, M.; Ricard, A.; Kim, Y.M.; Kim, K.S.; Han, J.G. Determination of the vibrational, rotational and electron temperatures in N2 and Ar–N2 rf discharge. J. Phys. D 2007, 40, 1022–1029. [Google Scholar] [CrossRef]
- Paris, P.; Aints, M.; Valk, F.; Plank, T.; Haljaste, A.; Kozlov, K.V.; Wagner, H.-E. Intensity ratio of spectral bands of nitrogen as a measure of electric field strength in plasmas. J. Phys. D 2005, 38, 3894–3899. [Google Scholar] [CrossRef]
- Mrkvičková, M.; Kuthanová, L.; Bílek, P.; Obrusník, A.; Navrátil, Z.; Dvořák, P.; Adamovich, I.; Šimek, M.; Hoder, T. Electric field in APTD in nitrogen determined by EFISH, FNS/SPS ratio, α-fitting and electrical equivalent circuit model. Plasma Sources Sci. Technol. 2023, 32, 065009. [Google Scholar] [CrossRef]
- Orlov, D.M. Modelling and Simulation of Single Dielectric Barrier Discharge Plasma Actuators. Ph.D. Thesis, University of Notre Dame, Notre Dame, IN, USA, 2006. [Google Scholar]
- Zanini, S.; Zoia, L.; Della Pergola, R.; Riccardi, C. Pulsed plasma-polymerized 2-isopropenyl-2-oxazoline coatings: Chemical characterization and reactivity studies. Surf. Coat. Technol. 2018, 334, 173. [Google Scholar] [CrossRef]
- Singh, K.P.; Roy, S. Impedance matching for an asymmetric dielectric barrier discharge plasma actuator. Appl. Phys. Lett. 2007, 91, 081504. [Google Scholar] [CrossRef]
Figure 1.
Layout of the experimental setup of the plasma actuator with diagnostics.
Figure 2.
Calculation of the electric potential in the plasma actuator with superimposed electric field lines.
Figure 2.
Calculation of the electric potential in the plasma actuator with superimposed electric field lines.
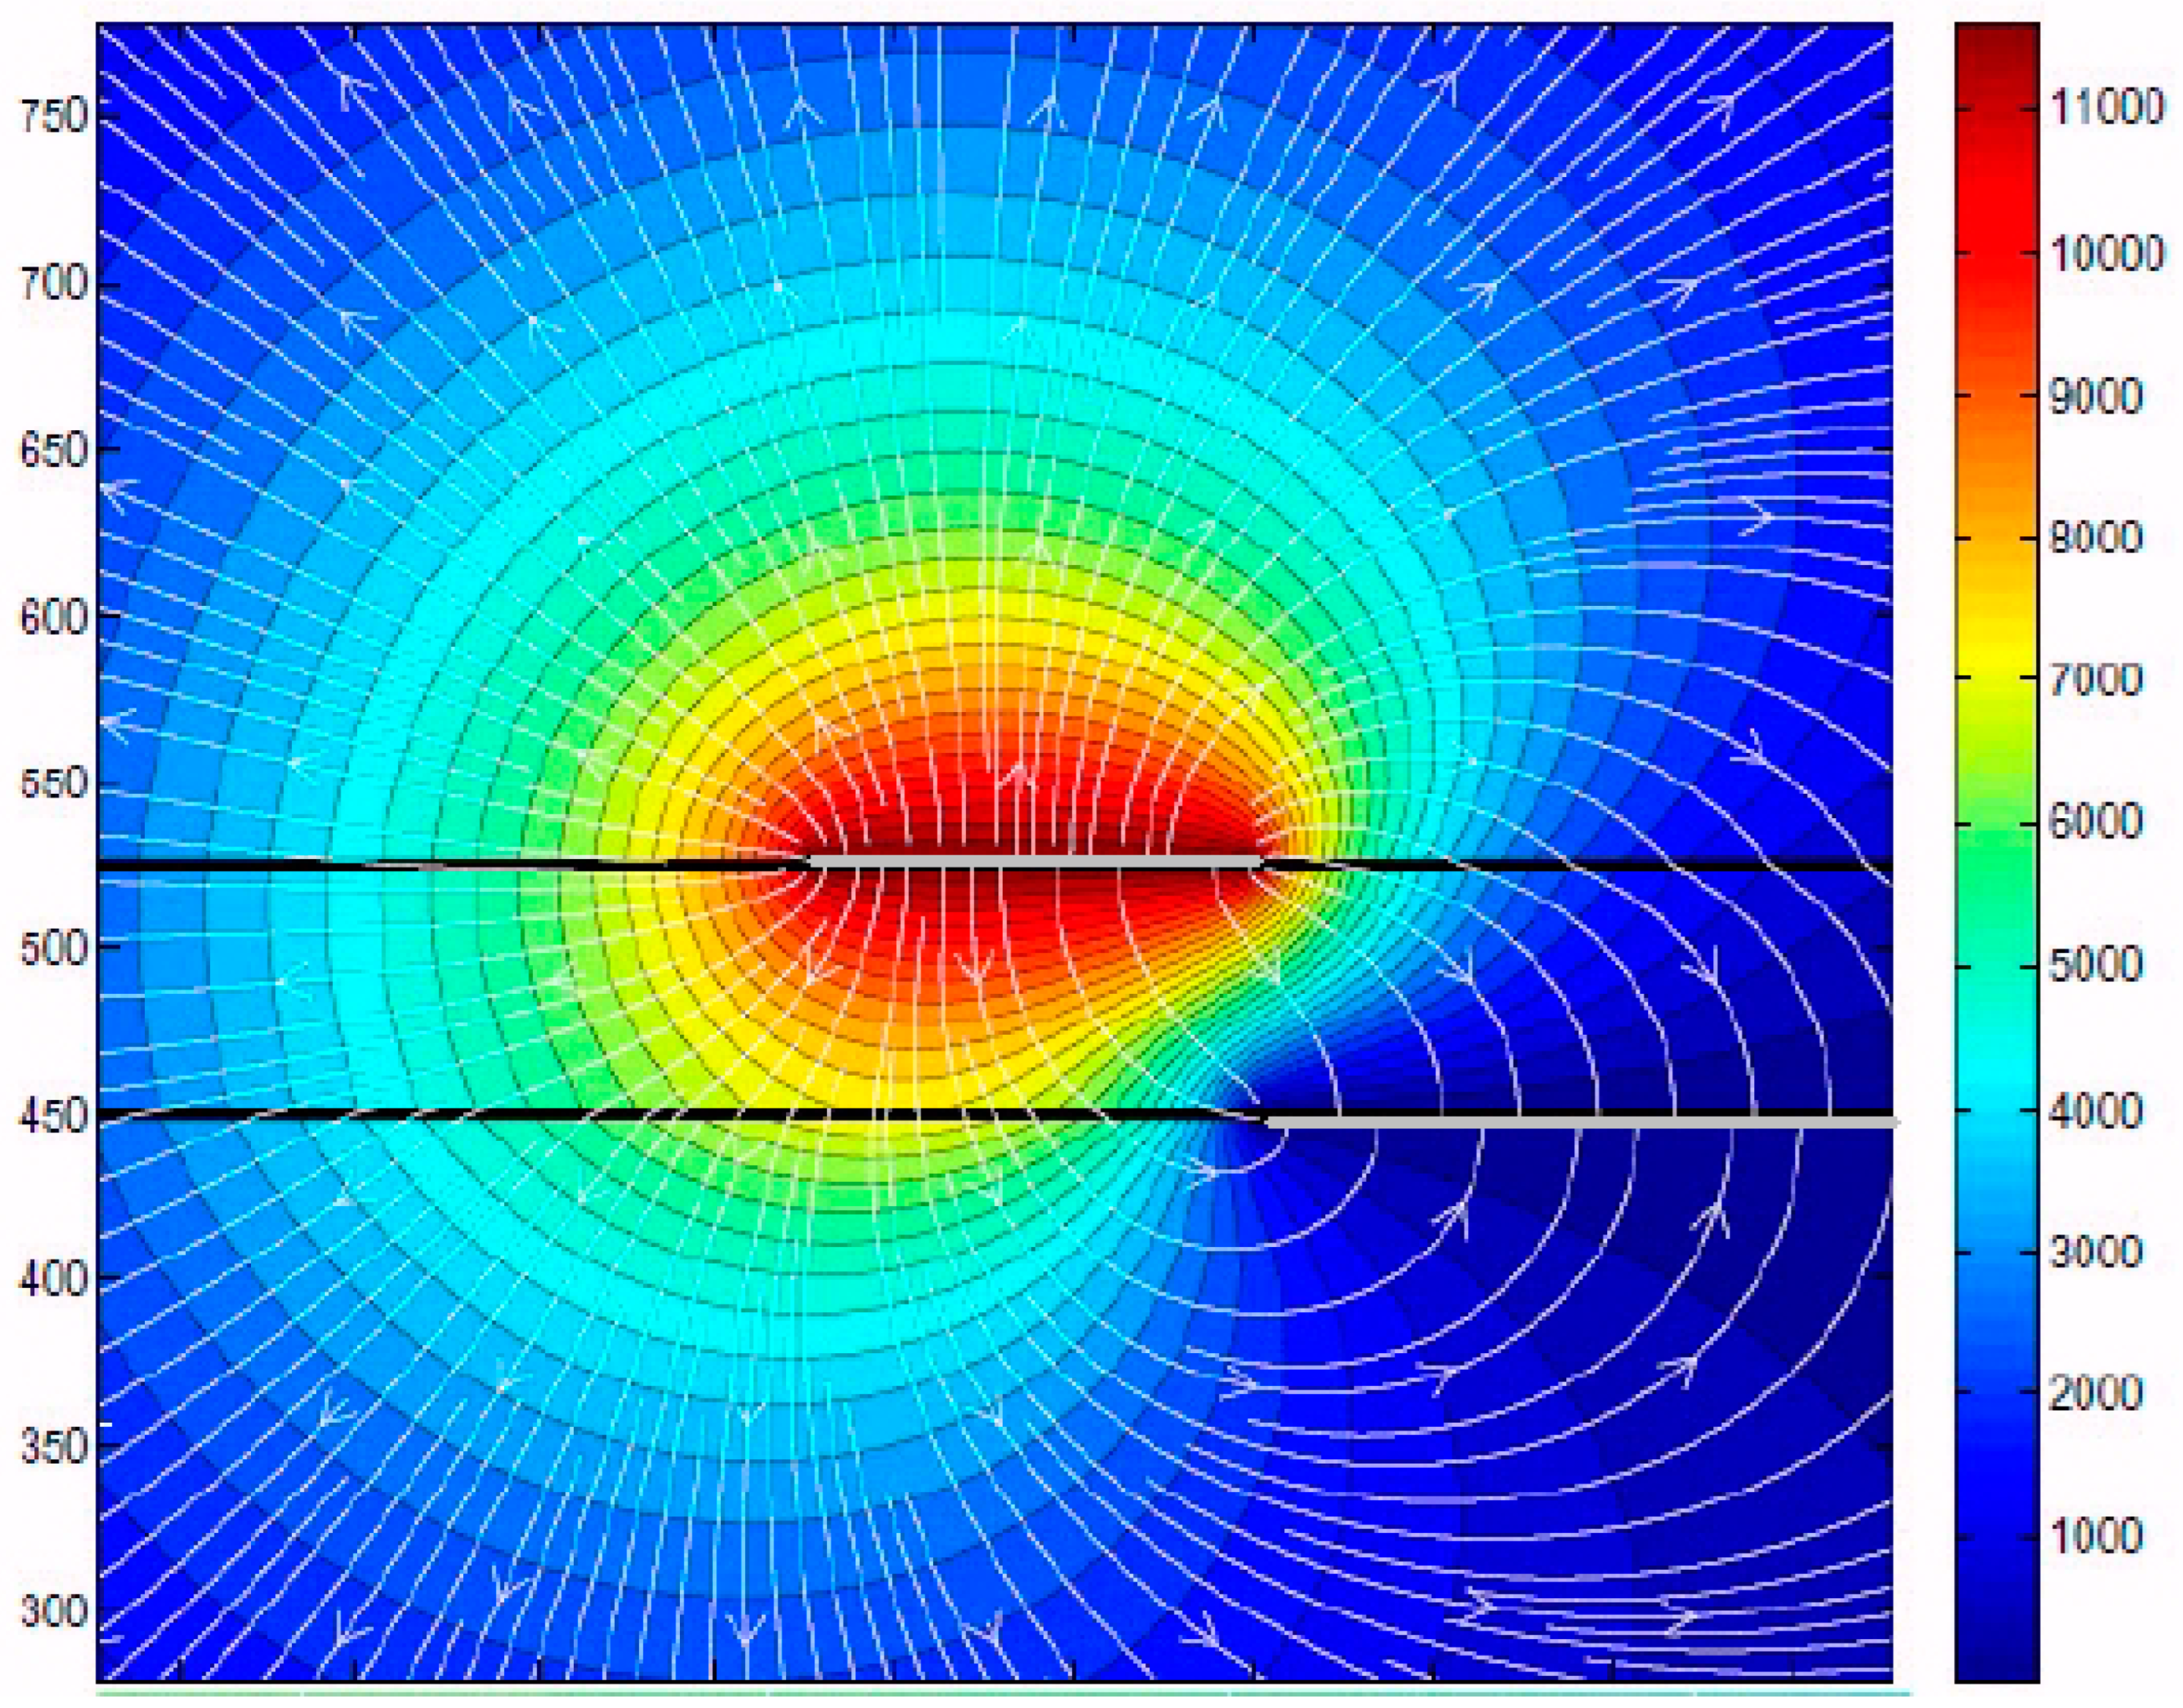
Figure 3.
Scope trace with the signals of four pixels of the multi-anode PMT recording the light emitted simultaneously from four different optical fiber viewlines.
Figure 3.
Scope trace with the signals of four pixels of the multi-anode PMT recording the light emitted simultaneously from four different optical fiber viewlines.

Figure 4.
A snapshot of the discharge region, imaged from above, showing the filament patterns elongating above the dielectric and with a bright spot at the edge of the exposed electrode (indicated by the black line). Also, the approximate location of the optical fiber viewline spots is shown.
Figure 4.
A snapshot of the discharge region, imaged from above, showing the filament patterns elongating above the dielectric and with a bright spot at the edge of the exposed electrode (indicated by the black line). Also, the approximate location of the optical fiber viewline spots is shown.
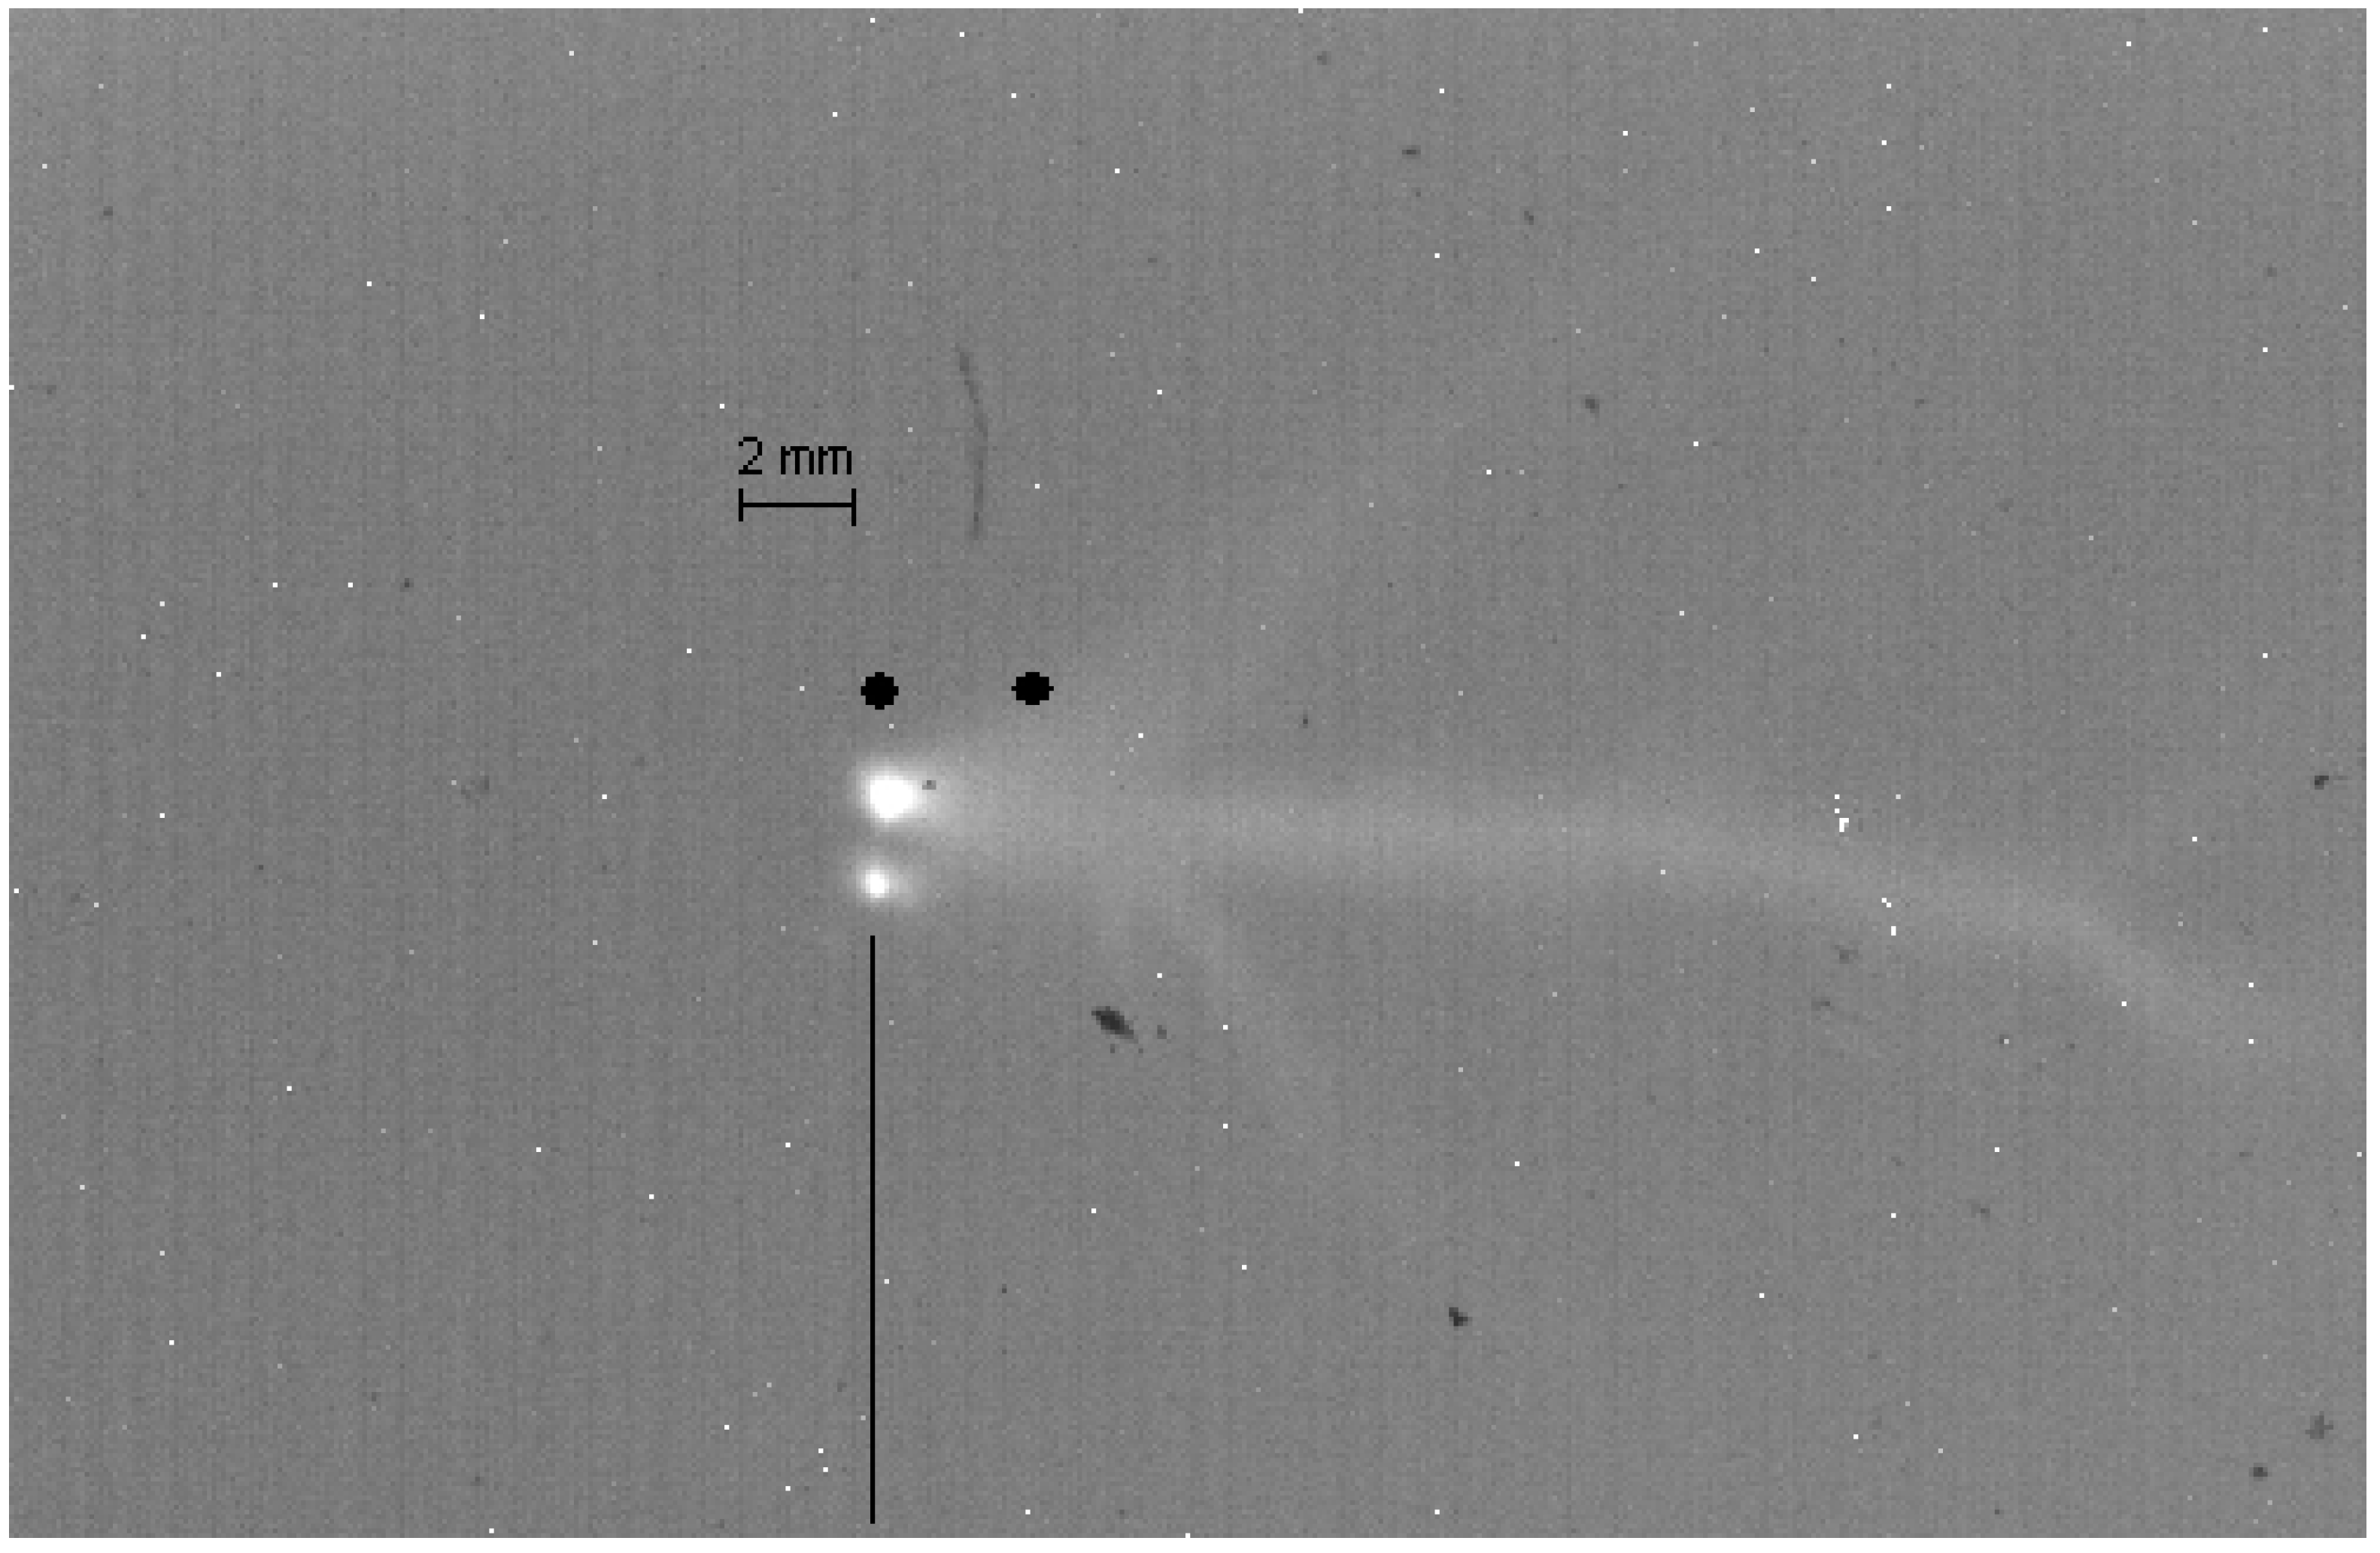
Figure 5.
Distribution of the delays measured between the time arrival of pulse signals recorded by two channels of the PMT enlighted by the emission collected from two parallel viewlines imaging the actuator surface.
Figure 5.
Distribution of the delays measured between the time arrival of pulse signals recorded by two channels of the PMT enlighted by the emission collected from two parallel viewlines imaging the actuator surface.
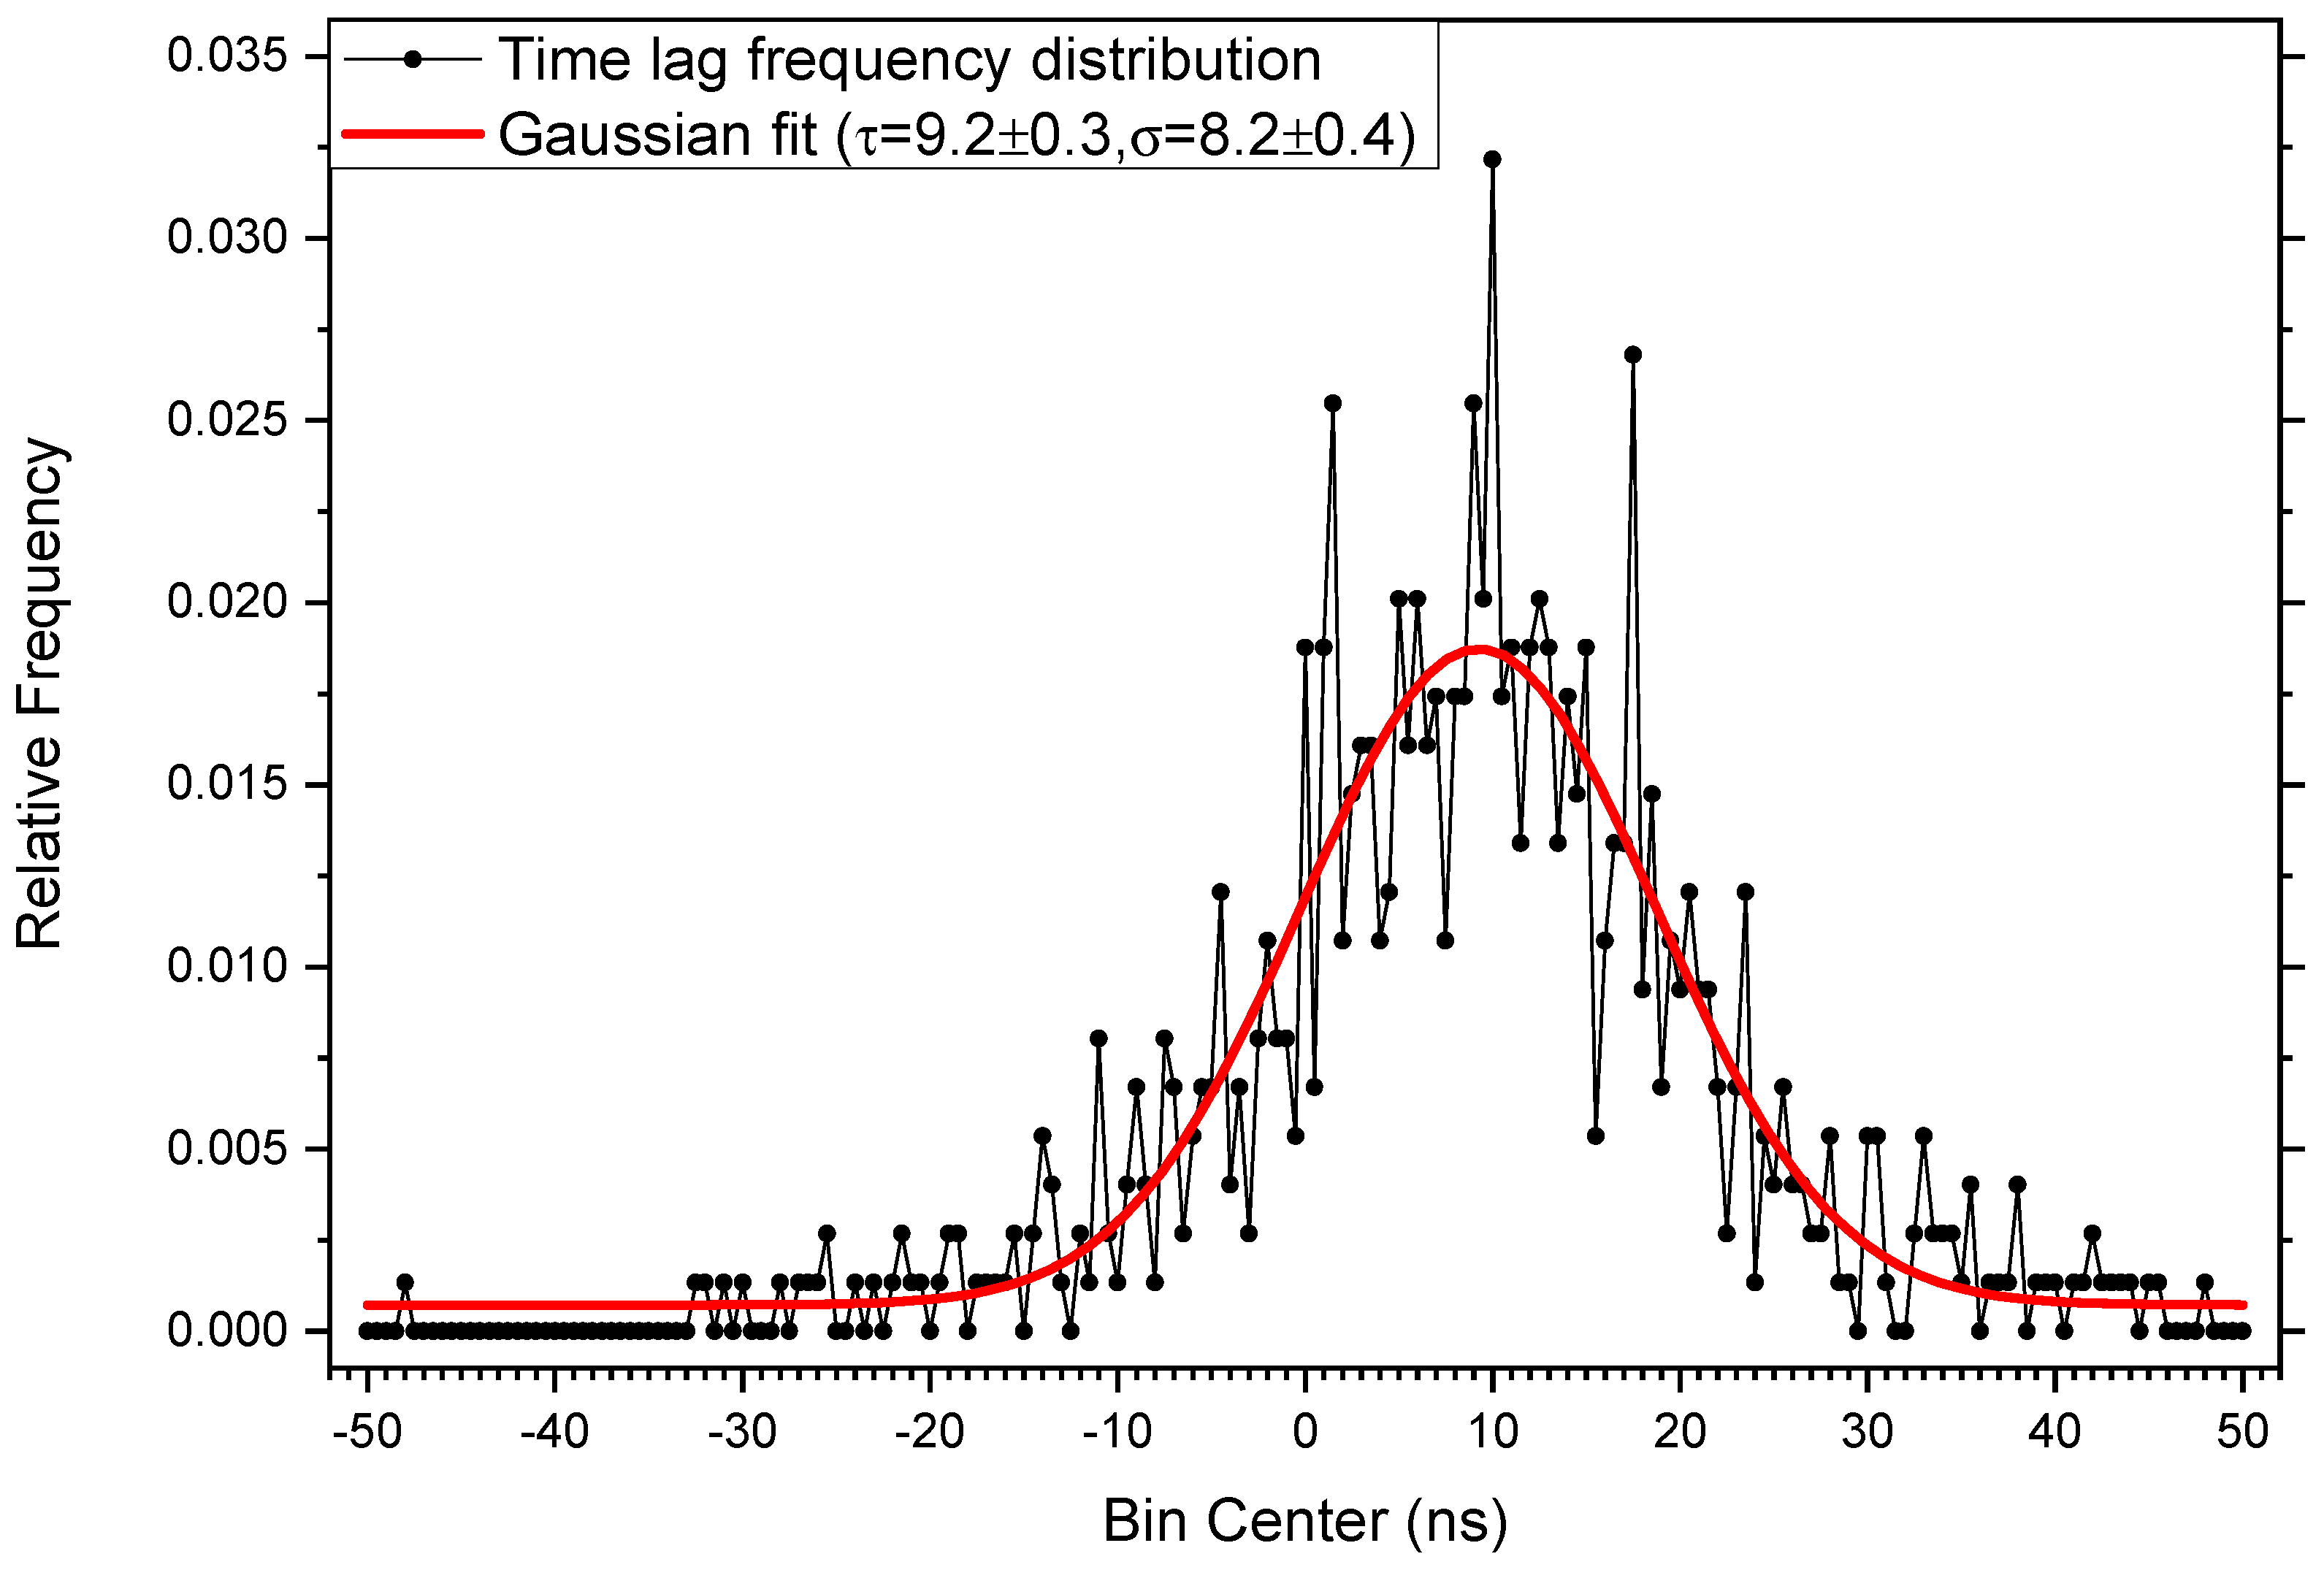
Figure 6.
Time lag between PMT pulses from two parallel viewlines (open) and the corresponding ionizing wave propagation rate (full) as a function of the voltage applied between the electrodes.
Figure 6.
Time lag between PMT pulses from two parallel viewlines (open) and the corresponding ionizing wave propagation rate (full) as a function of the voltage applied between the electrodes.
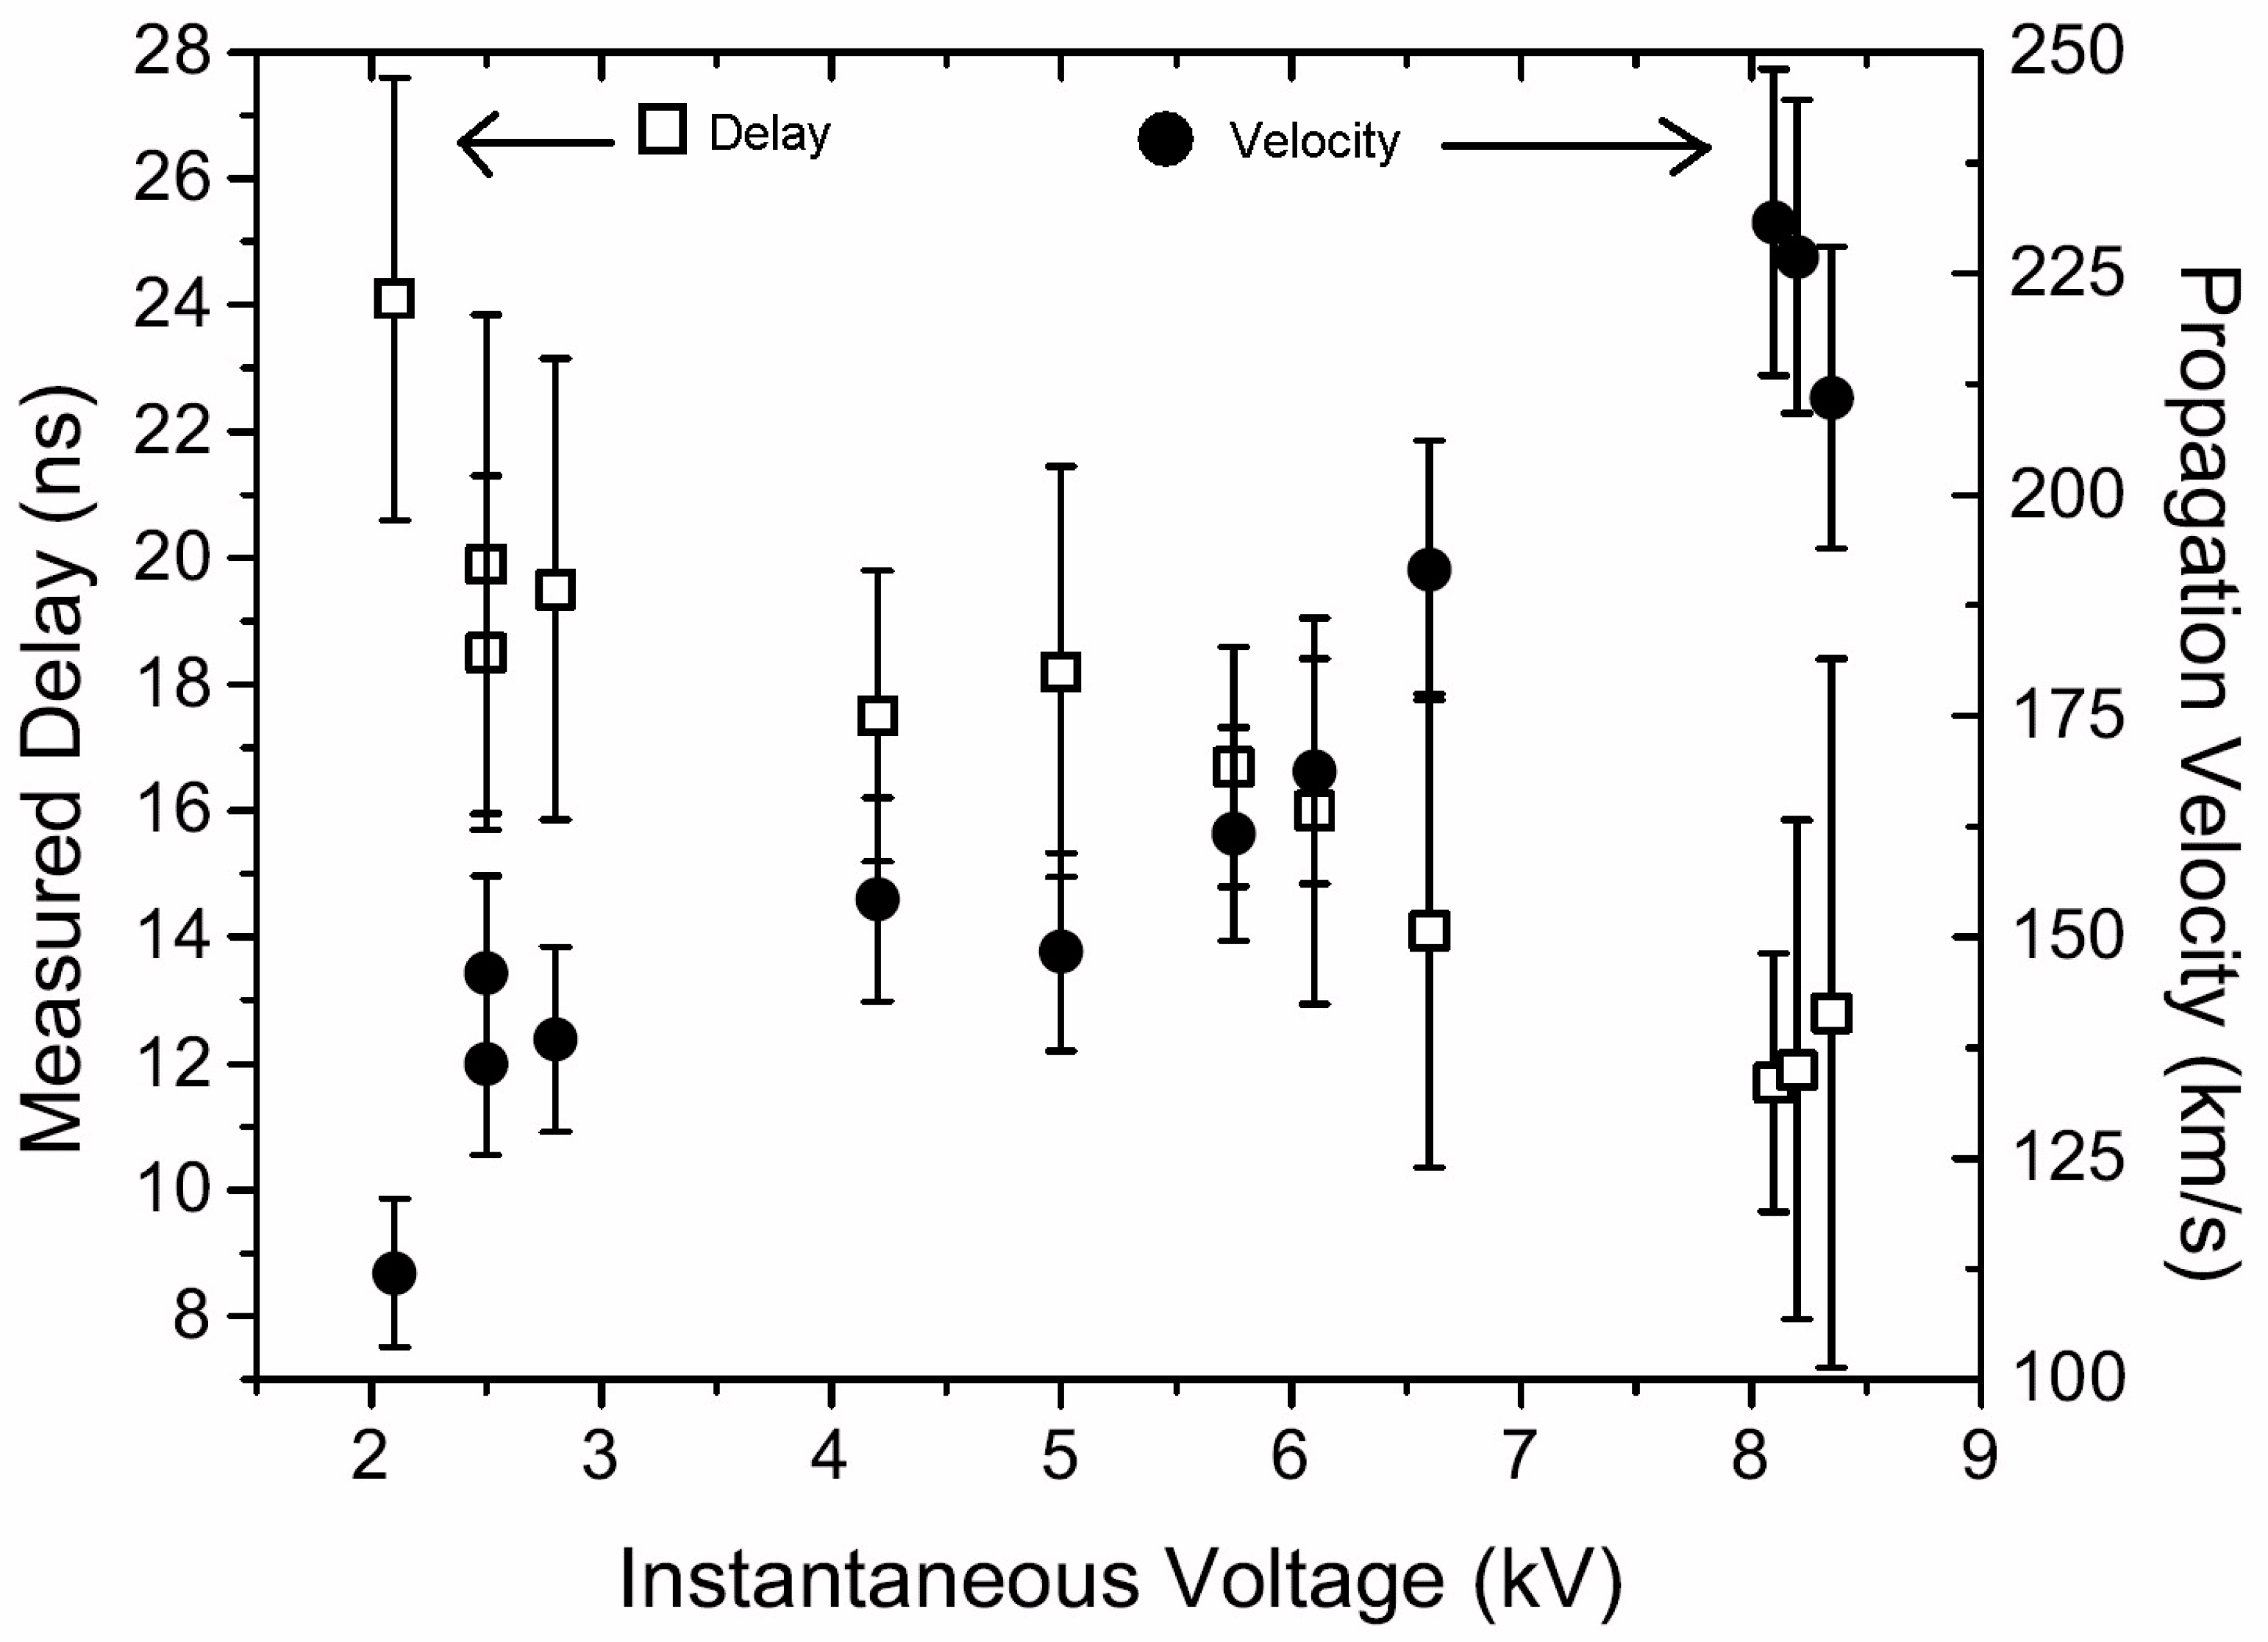
Figure 7.
Emission spectrum of a typical discharge in the plasma actuator.
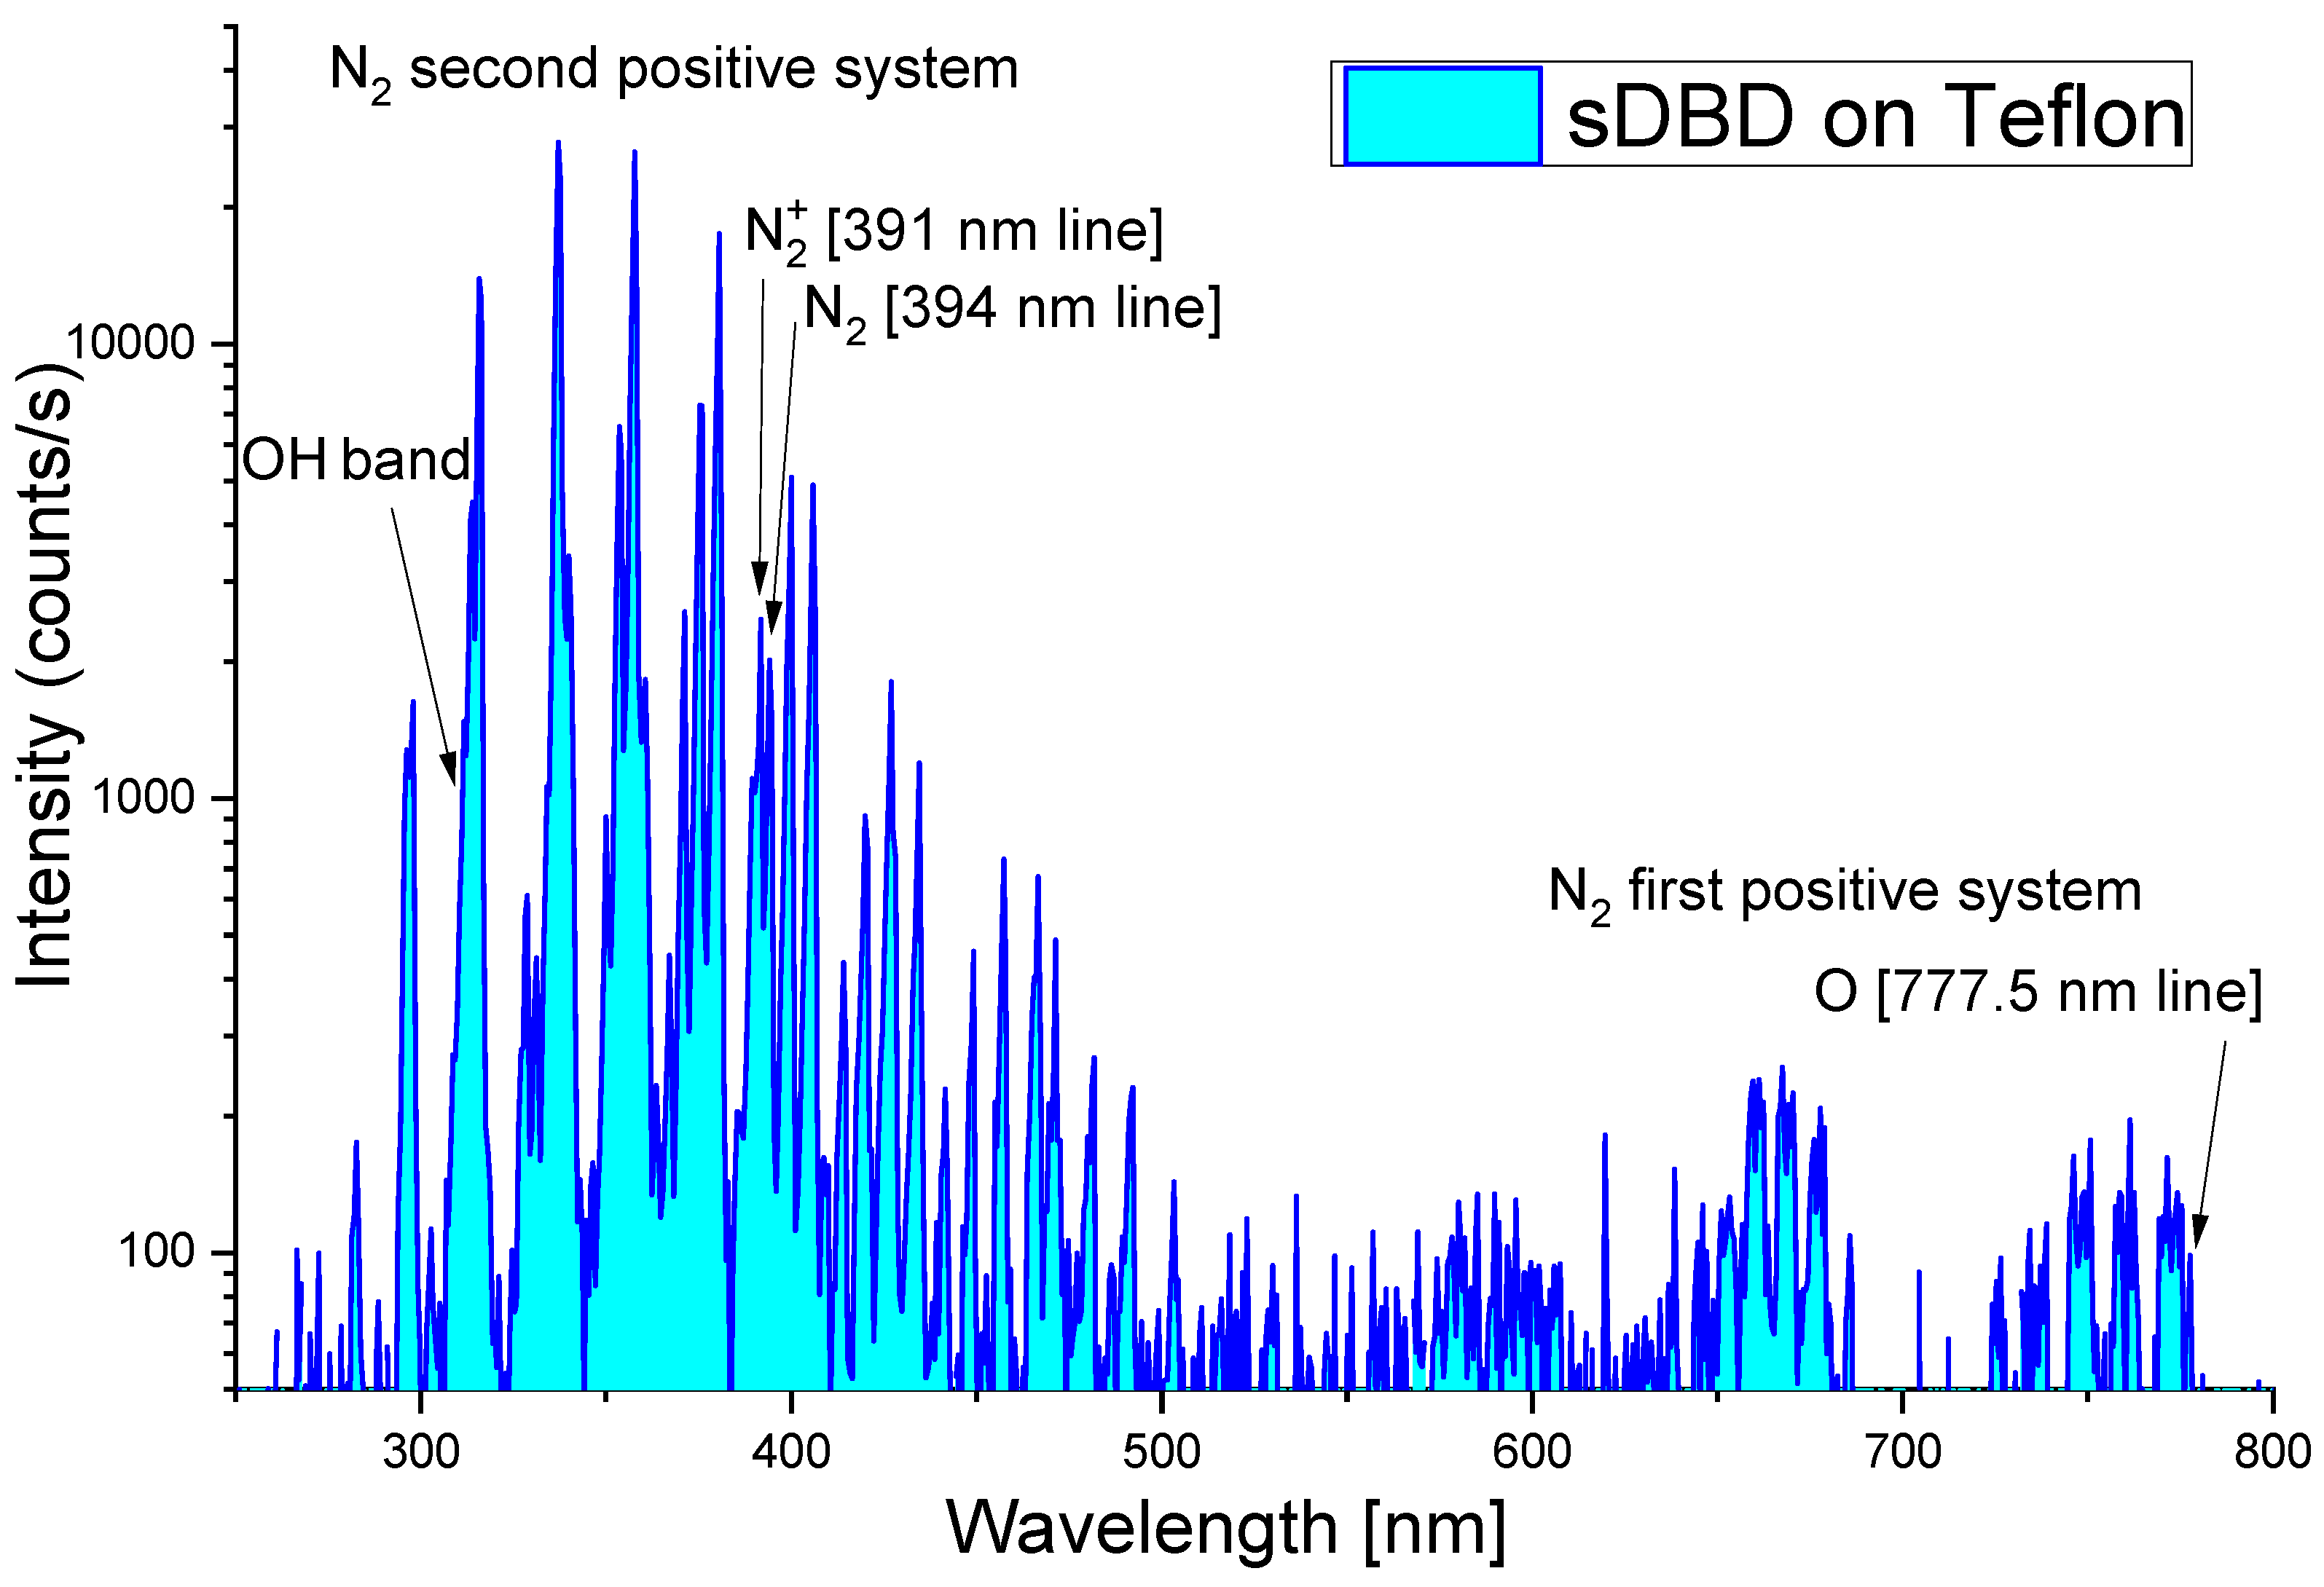
Figure 8.
Intensity of some emission lines of the second positive system of nitrogen (black, λ = 315.9 nm (v-vf) = (1-0) transition; blue, λ = 375.5 nm (1-3); red, λ = 399.8 nm (1-4)) as a function of the discharge amplitude and repetition frequency.
Figure 8.
Intensity of some emission lines of the second positive system of nitrogen (black, λ = 315.9 nm (v-vf) = (1-0) transition; blue, λ = 375.5 nm (1-3); red, λ = 399.8 nm (1-4)) as a function of the discharge amplitude and repetition frequency.
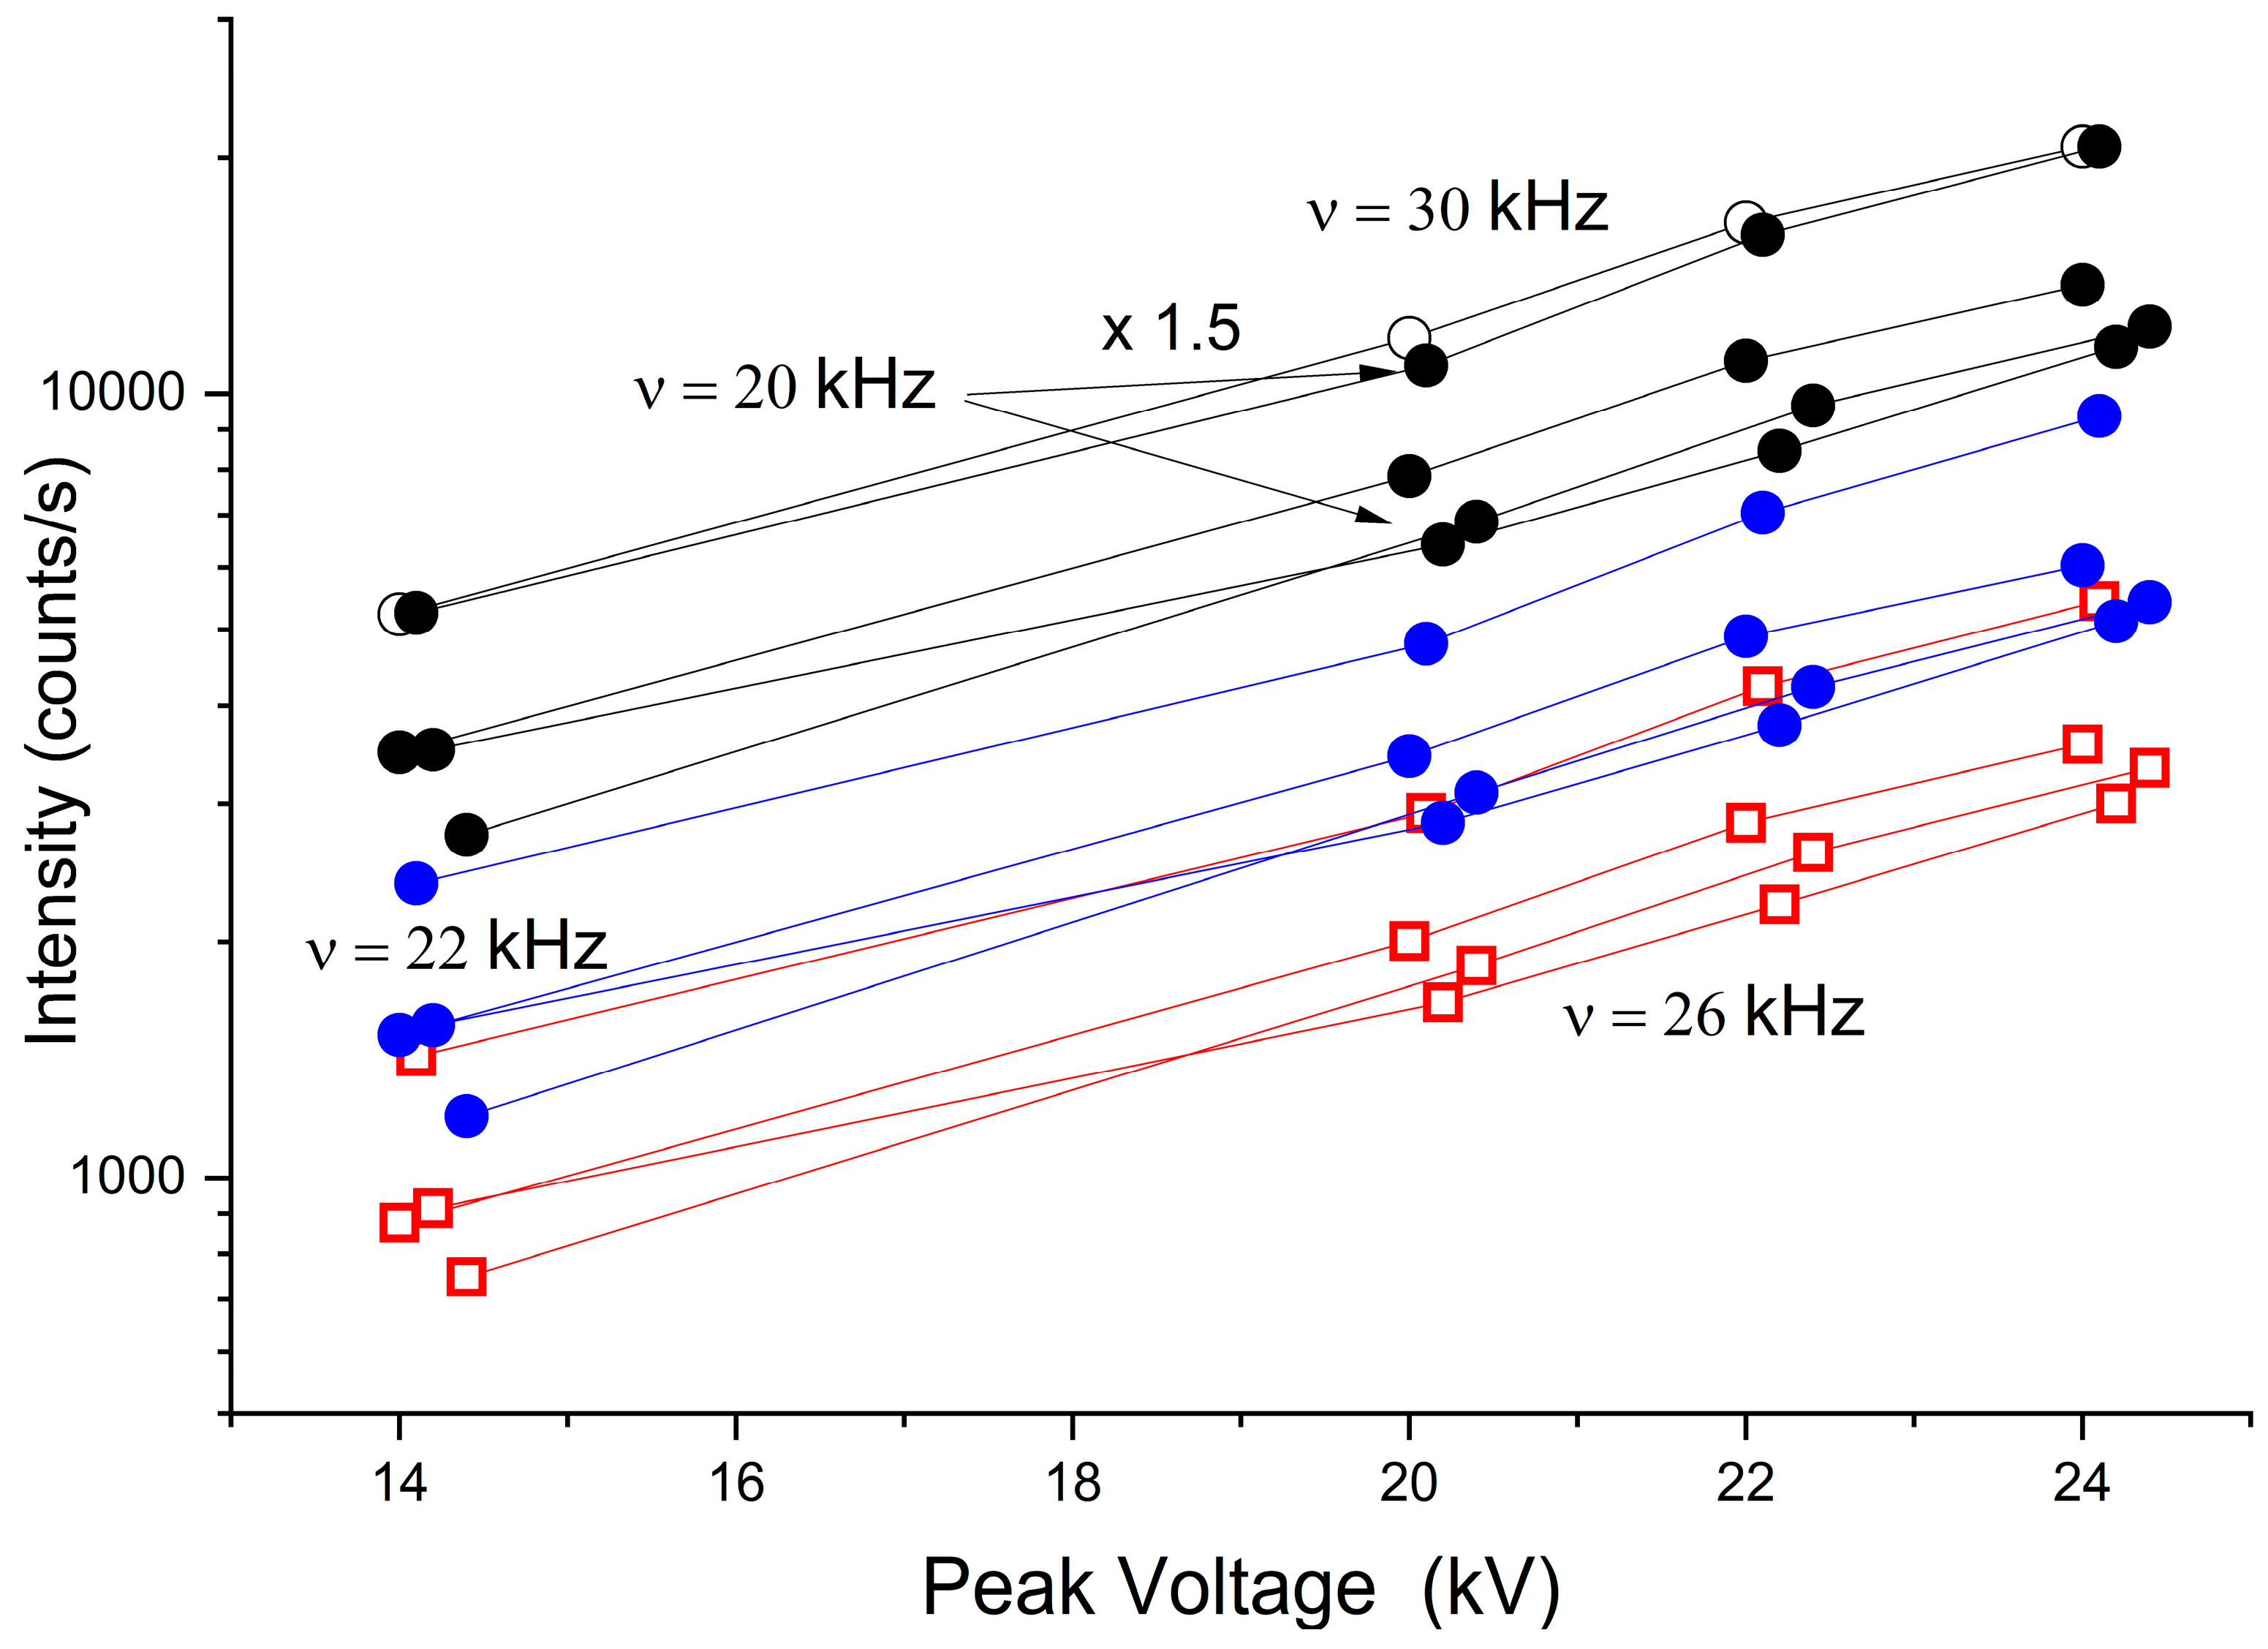
Figure 9.
Ratio of the emission lines intensities from ionized and excited nitrogen molecules.

Figure 10.
Simplified excitation model for the population of the ionized and excited nitrogen molecules.
Figure 10.
Simplified excitation model for the population of the ionized and excited nitrogen molecules.
Figure 11.
Peak velocity of the induced flow as a function of the applied voltage compared with the plasma emissivity.
Figure 11.
Peak velocity of the induced flow as a function of the applied voltage compared with the plasma emissivity.
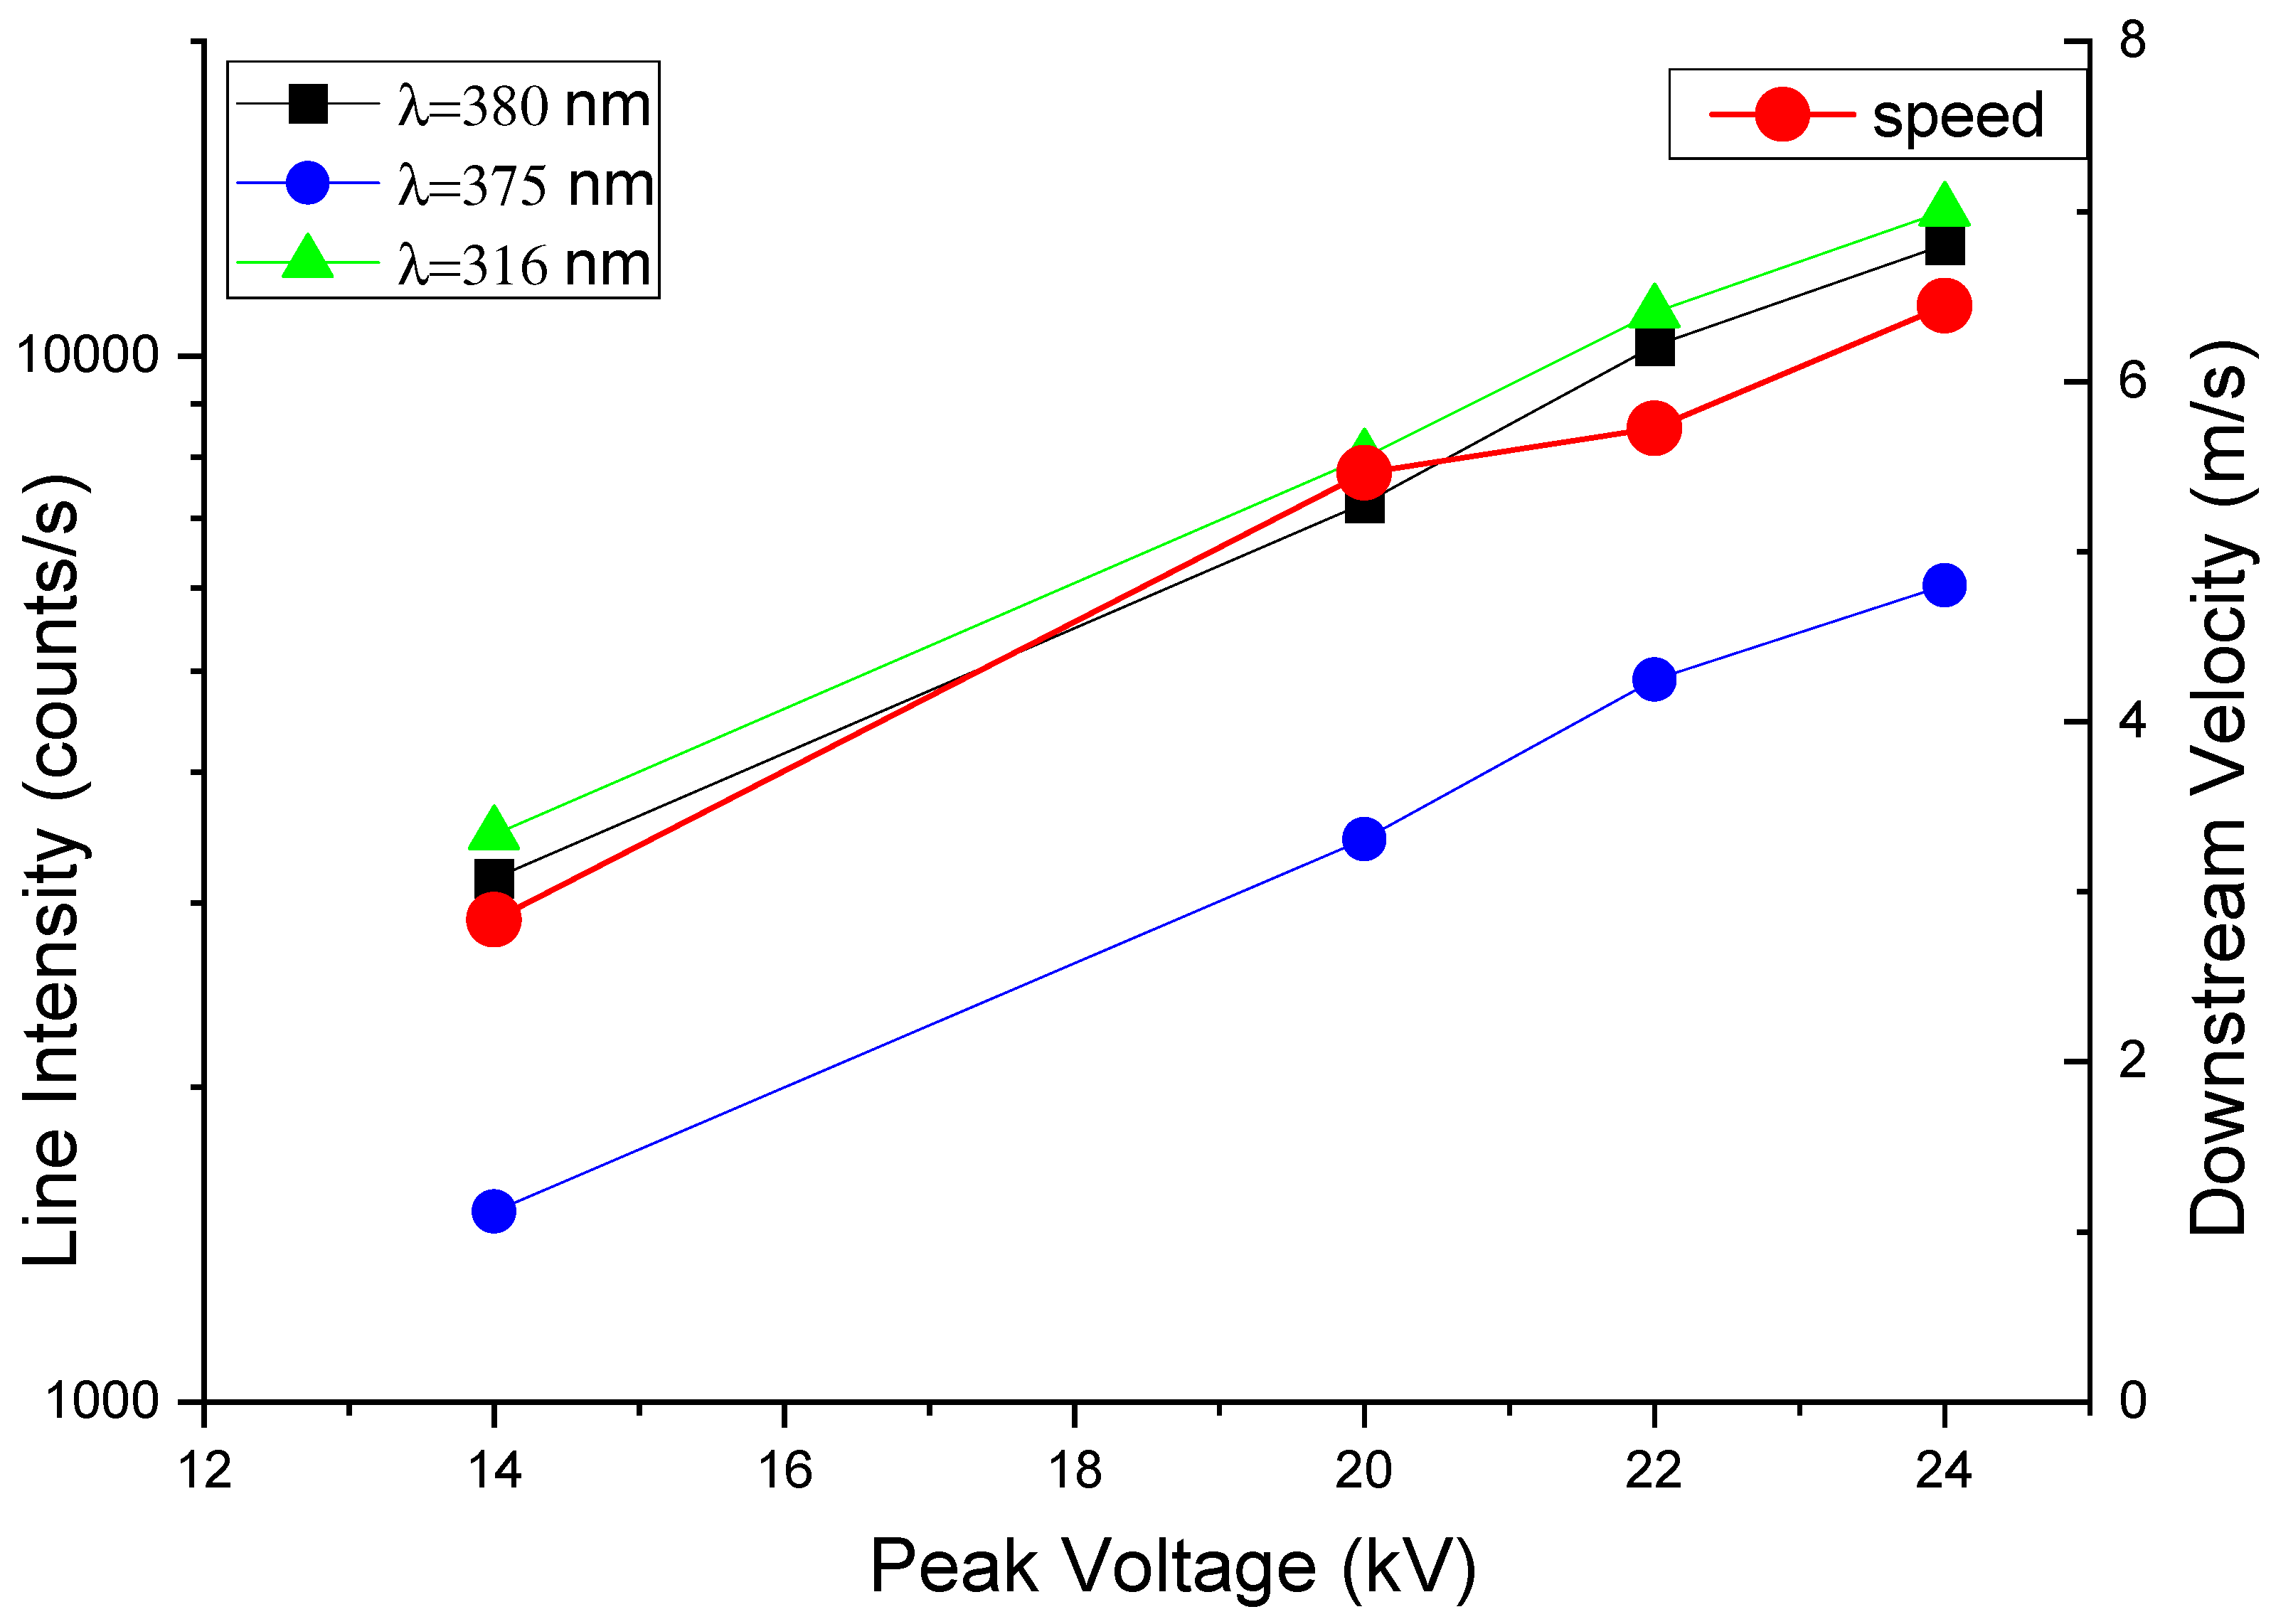
Figure 12.
Vertical profile of the velocity field of the induced flow at different positions D downstream the exposed electrode edge (black: D = 15, green: D = 20, red: D = 25 mm).
Figure 12.
Vertical profile of the velocity field of the induced flow at different positions D downstream the exposed electrode edge (black: D = 15, green: D = 20, red: D = 25 mm).

Disclaimer/Publisher’s Note: The statements, opinions and data contained in all publications are solely those of the individual author(s) and contributor(s) and not of MDPI and/or the editor(s). MDPI and/or the editor(s) disclaim responsibility for any injury to people or property resulting from any ideas, methods, instructions or products referred to in the content. |
© 2024 by the authors. Licensee MDPI, Basel, Switzerland. This article is an open access article distributed under the terms and conditions of the Creative Commons Attribution (CC BY) license (https://creativecommons.org/licenses/by/4.0/).
Share and Cite
MDPI and ACS Style
Barni, R.; Roman, H.E.; Riccardi, C. Ionizing Waves in Surface Dielectric Barrier Discharges Plasma Actuators. Actuators 2024, 13, 86. https://doi.org/10.3390/act13030086
AMA Style
Barni R, Roman HE, Riccardi C. Ionizing Waves in Surface Dielectric Barrier Discharges Plasma Actuators. Actuators. 2024; 13(3):86. https://doi.org/10.3390/act13030086
Chicago/Turabian StyleBarni, Ruggero, Hector Eduardo Roman, and Claudia Riccardi. 2024. "Ionizing Waves in Surface Dielectric Barrier Discharges Plasma Actuators" Actuators 13, no. 3: 86. https://doi.org/10.3390/act13030086
Note that from the first issue of 2016, this journal uses article numbers instead of page numbers. See further details here.