
Reliability Analysis and Optimization Method of a Mechanical System Based on the Response Surface Method and Sensitivity Analysis Method

1
College of Weapon Engineering, Naval University of Engineering, Wuhan 430033, China
2
Troop 92941, Huludao 125000, China
*
Author to whom correspondence should be addressed.
Actuators 2023, 12(12), 465; https://doi.org/10.3390/act12120465
Submission received: 10 November 2023
/
Revised: 7 December 2023
/
Accepted: 11 December 2023
/
Published: 15 December 2023
(This article belongs to the Section Control Systems)
Abstract
:Mechanical system reliability analysis constitutes a primary research focus in the field of engineering. This study aims to address the issue of complex mechanical systems with intricate mechanisms and nonlinear reliability equations that are challenging to solve. To this end, we present a reliability analysis and optimization methodology that merges the response surface and sensitivity analysis methods. A comprehensive formation of reliability assessment and optimization of complex mechanical systems is achieved by creating a response surface model to fit the complex state function and solving the reliability parameters, followed by an error sensitivity analysis to determine the mechanical system’s reliability adjustment strategy. Finally, these methods are applied to a cylindrical material transport device to preliminarily realize the reliability assessment and average reliability optimization goals. The study’s findings may offer a theoretical framework and research opportunities to evaluate and enhance the reliability of intricate mechanical systems.
1. Introduction
The mechanical system comprises various sub-systems that coordinate through continuous and intermittent movements to execute related operations. Institutional movement errors gradually accumulate during the continuous working process and become interdependent, diminishing the overall reliability level. Hence, the accuracy of a single institutional movement significantly impacts the system’s reliability. Reliability analysis and optimization of mechanical systems has long been a key research topic in engineering. As science and technology continue to advance and the market demands higher product quality, the reliability of mechanical systems has become a crucial measure for assessing performance, cutting down the incidence of failures, and minimizing maintenance expenses. However, the presence of numerous uncertainties in mechanical systems, including variations in material properties, manufacturing process errors, and fluctuations in the working environment, has made it a daunting task to locate effective and reliable means for optimizing reliability based on mechanical equipment’s features.
Traditional reliability analysis methods, such as failure mode and effects analysis (FMEA) and the reliability block diagram (RBD), can evaluate the reliability of mechanical systems to a certain extent. However, analyzing and optimizing complex systems for reliability can often present challenges. For the analysis of the reliability of complex systems, numerous methods have been widely employed by researchers: An et al. performed a validation of a first-order reliability method for suspension analysis to determine the uncertainty features that have the most significant influence on suspension structure reliability [1]. Lee presented a method for second-order reliability analysis using a non-central generalized chi-square distribution to address the limitations of the current SORM techniques [2]. Meanwhile, Chang developed a hierarchical response surface modeling and reliability analysis method based on composite functions [3], capable of precisely characterizing complex mechanical system performance and assessing system reliability and fault distribution. Tang developed a technique utilizing graph theory and Boolean functions to evaluate the dependability of mechanical systems [4]. Li et al. presented standby tasks and hybrid redundancy strategies in their analysis and optimization of multi-stage mission systems (PMS) to effectively enhance the reliability and efficiency of mission systems in the aerospace industry [5]. Echard et al. introduced an on-implementation active learning and Kriging-based importance sampling method, AK-IS, to address the challenge of computing reliability models for intricate structures. The AK-IS method is founded on the previously proposed AK-MCS algorithm [6,7]. Depina et al. introduced a metamodel line sampling (MLS) reliability analysis method for reducing the computational requirements associated with the reliability analysis of engineering structures, providing an effective way to analyze the reliability of engineering structures [8]. The works cited above have contributed various methods for analyzing the reliability of complex structures. However, these works are primarily concerned with static reliability analysis and overlook the kinematics and dynamic behavior of the structure. Therefore, they are not suitable for dynamic reliability analysis and optimization of the structure. Numerous analytical techniques have been developed by researchers to perform structural dynamic reliability analysis. For instance, Yang and colleagues presented a method for calculating and evaluating the kinematic reliability of industrial robots through motion function modules (MFMs) in response to the limitations of existing robot kinematic reliability analysis methods in terms of accuracy and efficiency [9]. Chen developed a practical method for evaluating the kinematic reliability of gear mechanisms over time using a sequential decoupling strategy and a saddle point approximation method [10]. Zhang et al. proposed a new approach to assess the reliability of kinematic trajectory accuracy in industrial robots by combining the sparse mesh technique, saddle point approximation method, and copula function [11]. Huang et al. proposed a reliability analysis method for localization accuracy based on differential kinematics and saddle point approximation for evaluating the effect of kinematic parameter uncertainty on robot motion [12]. Zhuang proposed an efficient wear prediction method in the framework of multi-body dynamics and combined it with Monte Carlo hair to analyze the kinematic reliability of a two-axis actuator mechanism with non-uniform joint clearance over time [13]. Zhao et al. developed a discrete optimization model with two objectives based on support vector machine training and error model computation and proposed an enhancement method for quantitatively adjusting the size of the support links of a planar closed-loop over-constrained expandable structure [14]. Weng et al. proposed an efficient post-processing simulation method for the stochastic structural reliability analysis: the conditional extreme value distribution (CEVD) method [15]. These methods have made many contributions in performing structural dynamic reliability analysis and provided a guiding direction for the reliability assessment of complex mechanical systems, but there is no corresponding reliability analysis or optimization method for specific complex mechanical systems. Marek Lampart and his colleagues examined the correlation between mechanism collisions and kinematic properties by integrating and contrasting the empirical outcomes of conveyor chaos with computer-aided simulation findings [16]. Qiang Tian et al. offer a thorough exploration of the literature pertaining to the analytical, numerical, and experimental methods applicable to studying the kinematics and dynamics of multi-body mechanical systems with gap joints. Furthermore, they provide a detailed analytical comparison of the most frequently used approaches for modeling gap joints in both planar and spatial multi-body mechanical systems [17]. Francesco Villecco presents a technique based on the maximum entropy in metric space (MEMS) that is useful in virtual prototyping and optimizing the design of mechanical systems [18]. These studies unveil numerous novel methodologies in mechanical system dynamics, kinematics simulation techniques, and analytical methods. They offer a technical foundation and research concepts for experimental and simulation-based investigation in the reliability assessment and optimization analysis of intricate mechanical systems.
The main objective of this study is to explore an effective means for reliability optimization, i.e., a reliability analysis and optimization method based on the response surface method and sensitivity analysis method (RSM-SAM). The approach combines the response surface method (RSM) with the sensitivity analysis method (SAM). Second-order polynomials are used to fit the mechanical system reliability state function. Subsequently, a simulation example is combined with the SAM to analyze the effects of motion errors in the mechanism. We employ the SAM to examine the impact of motion errors on mechanical system reliability and then determine the optimal approach to improve system reliability using sensitivity analysis and simulation results. Using a cylindrical material transfer system exposed to shock vibration as an illustration, this approach analyzes the transfer system’s reliability in a specific working condition. The accuracy of the mechanism’s motion error is adjusted iteratively based on sensitivity analysis results to ensure that the mechanical system’s reliability meets requirements. As a demonstration and verification of this methodology, this study serves as a valuable reference for researching reliability analysis and optimization of intricate mechanical systems. Additionally, it offers reference value for quantifying the level of reliability related to complex mechanical systems in diverse working conditions.
2. Basic Theories
Mechanical systems rely on the coordinated operation of multiple mechanisms, and the handover error between the mechanisms is the main factor affecting the reliability, which is the basis used to assess the reliability of mechanical systems. In order to address the difficult problem of reliability assessment of complex mechanical systems, the reliability of mechanical systems can be characterized by establishing a reliability state function on the basis of kinematics and dynamics error analysis, reducing the difficulty of solving the highly nonlinear reliability equations of complex mechanical systems using the response surface method, and calculating the reliability parameter using the primary second-order method of moments, to achieve the purpose of reliability assessment. In addition, with the help of sensitivity analysis to obtain the degree of influence of each error quantity on the reliability of the system, combined with the response surface method, reliability optimization can be achieved by adjusting the parameters one by one.
2.1. Reliability State Function
According to the definition of mechanical system reliability in [19], it pertains to the ability to perform the specified function under the specified conditions and within the specified time. Consequently, the primary problem in studying the reliability of mechanical systems is to determine the limit state of the mechanism, i.e., whether the positional error of the mechanism after transmission meets the allowable error requirements.
Taking a transport device as an example, the transport carrier position error accumulates gradually along the transport path, and the mode of its center-of-mass position error can be expressed as:
where the error vector of the transit system is represented by , while , , and denote the error components of the transport system in the x-, y-, and z-directions, respectively.
Define the maximum allowable error of the transit accuracy as , and the state function of the reliability of the transport system is expressed as:
where is the functional, is a combination vector of various error vectors generated during the operation of the mechanical system, and the system operating state can be characterized as:
in Equation (3) is the system reliability state function, which contains all the random error components in . is the limit state equation and the reliability index is defined as , which shows how many times the functional’s mean value’s standard deviation is away from the failure point. Statistically, the standard deviation is used to gauge the “distance” between the functional function’s mean value and the failure limit. The greater the “distance”, the less likely a failure will occur, resulting in a more dependable system [20]. Therefore, there are
in Equation (4), represents the mean value of , while represents the root-mean-square value of .
Assuming that each of the random variables follows a normal distribution, the system failure probability and reliability can be expressed as Equations (5) and (6), where is the system failure probability, is the reliability, and is the standard normal distribution function.
2.2. First-Order Second-Moment (FOSM) Method
The first-order second-moment (FOSM) method is a computational technique utilized when the functional of a failure mode is explicitly defined. The fundamental concept behind the FOSM [21,22] involves using Taylor’s formula to linearly expand the functional at the mean point. It also utilizes data from the first- and second-order moments of the underlying random variable to derive the reliability index. The nonlinear state function is expanded using the Taylor series up to the primary term based on the first- and second-order moments of the underlying random variable. Subsequently, the mean and standard deviation of the state function are approximated.
Assuming that the design acceptance point is and there exists , the limit state equation can be acquired by linearizing the expansion.
since is on the critical surface of the limit state function, there is . When the individual random error components are correlated with each other, the mean and root-mean-square values of H can be obtained:
When each random error component is independent of the others, the mean and root-mean-square values of H are:
the sensitivity coefficient, denoted by , represents the degree of influence of the i-th random error component on the root-mean-square value of the state function in the equation above. Additionally, denotes the correlation coefficient between and , while and are representative of the root-mean-square values of and , respectively. Substitute Equations (11) and (12) into Equation (4) to obtain:
there is
the and in the equation represent the mean and root-mean-square of the random error components, respectively.
In general, the calculation of the reliability index for complex mechanical systems can use the average value of the random error components as the initial value, represented as , with as the condition for convergence, and typically set at 1%. Please refer to Figure 1 for the iterative solution process.
During the iterative solution process, since does not fall on the critical surface , there are
and
This returns the value for the iterative process:
2.3. Response Surface Method (RSM)
The main idea behind the response surface method (RSM) is to utilize a simple polynomial function approximation to solve in place of a complicated state function or to present an approximate representation of an implicit state function [23]. To employ the response surface method, three essential aspects must be considered: Firstly, the polynomial form should be selected, and typically, the linear response surface function suffices to simplify calculations. Secondly, polynomials for the test point must be chosen, and in this study, the sample space is constructed using the classic Bucher sampling method. Finally, the iteration strategy should be devised, incorporating a reliable index to determine the solution’s accuracy, and the algorithm should terminate upon meeting the iteration condition.
In this study, we utilized a second-order polynomial to model the state function of the transport system. The classical Bucher sampling method was applied to construct the sample space [24]. Then, the unknown coefficients in the polynomials were determined using the least-squares method, resulting in an approximate expression of the state function. Finally, the reliability index of the system was calculated by applying the checkpoint method. The computational flow is illustrated in Figure 2.
On the basis of the reliability state function , a second-order polynomial without cross terms is selected to obtain an approximate fit of the state function.
the in Equation (18) denotes the fit coefficients that require determination.
The second-order response surface function of Equation (18) requires the determination of coefficients, which can be accomplished by selecting sample points. Bucher’s design of experiments method is used to extract sample points and is first selected as the sample center. As shown in Figure 3, sample points are selected at the position of deviation from the coordinate axis distance , is the deviation coefficient, which is generally taken as 1~3, and is for the root-mean-square of the error component .
The initial sampling center for the first iteration is selected as the mean value of each variable. The sampling center for the (k + 1)th iteration is obtained via interpolation. The ith coordinate of can be expressed as:
in Equation (19), represents the design checkpoint for the kth iteration, corresponds to the ith coordinate of the design checkpoint, and represents the mean value vector.
Using the primary second-order method of moments to compute the functional values corresponding to the sample points, a vector of these values can be obtained.
the coefficients are to be determined through the least-squares method and are expressed as:
the in Equation (21) denotes the interpolation matrix consisting of sample points .
Calculate the reliability index for the (k + 1)th iteration using the checkpoint method. Compare it with the reliability index calculated in the kth iteration. If the condition is satisfied, the iterative calculations have converged, and the reliability index serves as the final calculation result. Otherwise, repeat the iterative calculations until the results converge.
2.4. Sensitivity Analysis of Errors
The transport system has multiple actuators that enable the precise positioning and alteration of the target carrier’s attitude. However, this intricate structure affects the system’s dependability, as it is subject to various influencing factors. To enhance the dependability of the transportation system, it is vital to assess the system’s reliability sensitivity to the variation of error components. Depending on the magnitude of sensitivity, the error components with a more significant impact must be suitably adjusted, and the ones with a lesser impact can be deemed definite values, mitigating the intricacy of sensitivity analysis. This sensitivity analysis-based optimization study establishes a reliable foundation for designing, processing, manufacturing, and maintaining the transport system. The method involves acquiring the sensitivity of error variable means and variances to reliability using the response surface approximation model of the reliability state function. Additionally, the sensitivity of error variable means and variances to reliability is obtained via partial derivation of the means and variances of the geometrical error variables present in the model [25,26,27].
According to probability theory, if a random variable X has a mathematical expectation , then its variance is denoted as or and can be calculated using the expression:
if a random variable X follows a normal distribution , there exists:
there is .
Assuming that the random error components are independent of one another, the mean and variance of the reliability state function for the complex mechanical system are as follows:
Take the partial derivatives of Equations (26) and (27) for and , respectively:
From Equation (4), the reliability of the transportation system follows a normal distribution with E and T as parameters. The reliability can be expressed as:
taking partial derivatives of Equation (29) yields:
in Equation (30) represents the probability density function of the normal distribution. has partial derivatives with respect to parameters and , respectively:
Taking partial derivatives of Equation (29) provides the sensitivity of the error component mean R and root-mean-square T to the reliability:
3. Random Errors of Transport System
A transport system consists of a frame, a vertical conveyor system, a rotary storage silo, an oscillating conveyor, a rotating conveyor, and a push conveyor, as shown in Figure 4. The transport system makes a pitching and azimuthal rotary motion under the control of a follower system. The oscillating conveyor system relies on the upper connecting disk of a frame to be connected with the rotary portion of the frame, and it carries out an azimuthal motion together with the frame. The schematic diagram of the target carrier transfer is shown in Figure 5.
The transport system’s target carrier transportation process includes five main steps as per its transit path: A, silo rotary transportation; B, carrier uplift; C, carrier swing; D, carrier rotation; and E, carrier forward push. These steps are clearly depicted in Figure 5. Figure 6 illustrates the transformation relationships of the target carrier coordinate system while in transit. An error analysis of the working process of the transport system is performed:
(1) The coordinate systems are the geodetic coordinate system (central coordinate system), the frame coordinate system, and the center of mass coordinate system of the carrier. The rotation angle indicates the relative rotation angle between the two coordinate systems; for example, from the initial position, the rotation angle of the frame coordinate system relative to the geodetic coordinate system is called the azimuthal angle, which is expressed by ;
(2) In transit process A, the target carrier in the rotary storage silos rotates around the axis of the silos via a designated angle , resulting in the carrier moving one position along the transit route. As a result, the coordinate system of the carrier’s center of mass transforms from to during the process;
(3) For transfer process B, the vertical conveyor system initiates movement from the starting point of the carrier center of the mass coordinate system . The target carrier is clamped in the bracket and moved a h distance along the direction. The carrier center of the mass coordinate system moves from to during this process;
(4) Transfer process C: The oscillating conveyor swings in the plane and starts transferring from the oscillating arm’s carrier center of the mass coordinate system . The carrier follows the oscillating arm around the angle rotation axis. During this process, the carrier’s center of mass coordinate system changes from to , and the plane coincides with the plane;
(5) Transfer process D involves moving a carrier with a clamping frame on rotating conveyors in the plane. The movement starts from the coordinate system , which is the center of gravity of the carrier on the rotating conveyor. The carrier then rotates around the conveyor axis of rotation at angle . During this rotation, the carrier’s center of gravity coordinate system moves from to , and the plane ultimately overlaps with the plane;
(6) Transit process E: The transit carrier is leveling conveyor thrust along the axis, the carrier center of mass coordinate system as a starting point, along the direction of movement of the S distance, the entire E process, the carrier center of mass coordinate system from the coordinate system into the coordinate system, before and after the process of the axis coincides with the axis.
Comprehensively analyzing the operational process of the transportation system yields 12 primary random error components, which are displayed in Table 1.
4. Reliability Analysis and Optimization of Transport Systems
4.1. Reliability Assessment of Transport Systems under Shock Effects
Shock vibration serves as the mechanical environment for analyzing the reliability of the transportation system. The vertical motion phase and the swing phase are the two stages in the transportation process that experience the most significant impact from the shock. The mechanical system’s geometric error can be assumed to follow a normal distribution [28,29]. This study considers 12 normally distributed error components, where , , , , and relate to the mechanism’s dynamic characteristics, and the remaining 7 are influenced by the modulus of elasticity, contact stiffness, and shock vibration environment. The shock vibration test data were collected from a specific transfer mechanism test bench, and the corresponding test equipment is depicted in Figure 7. A shock response test was conducted under the condition of a shock excitation amplitude of 4 g. The resulting vertical motion error was 5.23 mm, which is the initial calculation condition for the swing. The angular displacement error of the upper pendulum at 0° of the height angle was 6.75 mrad, according to the kinetic simulation. This value represents the mean value of the up and down translations as well as the swinging error. The mean value of the rest of the error components was 0. The mean square deviation is shown in Table 2. The mean values of oscillation errors at various height angles were obtained through dynamic simulations, and the oscillation mechanism’s dynamic model is presented in Figure 8.
Using the orthogonal sampling method, we collected data samples consisting of 25 groups by selecting five points each from the range of high and low shooting angles (−7° to 78°) and the range of azimuthal shooting angles (−144° to 144°). These five points were −7°, 0°, 30°, 45°, and 60° for high and low shooting angles and −120°, −60°, 0°, 60°, and 120° for azimuthal shooting angles. We then computed the state function acceptance points using the one-time second-order moment method. The analysis compares the reliability of the transport system with the results obtained under the inertial system, revealing the reliability indexes of the transport system under varied firing environments. This information is displayed in Figure 9, while Table 3 presents the calculation results of organizing 25 data sample groups.
Analyzing Figure 9 reveals that the reliability index can be solved for any height and azimuthal shooting angle by fitting the state function using the response surface method. The transport system’s reliability is higher when functioning in an inertial system environment than in a shock vibration condition, as confirmed by simulation results that are consistent with practical experience. Additionally, when the height angle is small or negative, the pendulum motion error accumulates over a longer stroke, leading to a lower overall reliability level of the transport system.
According to Table 3, it is evident that the transport system’s minimum reliability index value under the inertial system is 1.5854, the minimum reliability index value is 94.36%, the average reliability index value is 2.0017, and the average reliability index value is 97.73%. The transport system’s reliability index under conditions of shock vibration has a minimum value of 1.3476, with a corresponding reliability rate of 91.11%, the average reliability index value is 1.5837, and the average reliability index value is 94.34%.
The simulation results reveal that the rise in the mean value of the transport system’s motion error under shock vibration conditions is the primary causative factor behind the target carrier’s reduced transport accuracy. To meet the technical index requirements, it is essential to control both the mean and variance of the transport system’s motion error under shock excitation. The following analyzes the adjustment strategy for the geometric error component in conjunction with the sensitivity analysis method, with the aim of enhancing the transport system’s reliability.
4.2. Reliability Optimization of a Transport System Based on Sensitivity Analysis
Determining the degree to which error components affect reliability is a crucial step in optimizing the transport system’s reliability. Due to the high degree of nonlinearity in the state function, sensitivity analysis poses some challenges. This study proposes combining the second-order response surface function with the sensitivity analysis method to determine the sensitivity of the error component’s mean and standard deviation. This approach can assist in prioritizing adjustments to improve the system’s performance. Combined with existing technical preparations and economic requirements, the adjustment range of error components is limited to 30%. Error components with greater sensitivity are adjusted step by step. After each adjustment, the reliability index is calculated using the primary second-order method of moments and compared to the target reliability index . The iterative process stops when the adjustment result meets the requirements; however, if it does not, the previously unadjusted error components are readjusted. The process of calculating the reliability index is repeated until the average reliability of the transportation system meets the requirements. See Figure 10 for the process of optimizing reliability.
The sensitivity analysis was performed under the working conditions of a height angle of 0 degrees and an azimuth angle of 0 degrees. Table 4 displays the obtained sensitivity results for each error component’s mean square. The optimization objective solely takes into account the impact on the mean value of vertical and swing motion errors. The selected working conditions outlined in Table 3 comprise 25 data sample sets for evaluating the transport system’s average reliability level. The system’s target reliability under shock vibration conditions is set at 97%, namely , based on the results derived from these 25 sample sets. Referring to Table 4’s sensitivity analysis results, we sequentially adjust the mean values of error components and , as well as the mean squared deviations of error components , , , , , and , reducing parameter values by up to 30%. Then, we calculate the reliability indices using the method of second-order moments in one pass for the different working conditions, and the results are shown in Figure 11.
Through the reliability optimization process of the transportation system, the average reliability of the system improved from 94.34% to 97.07% after adjusting the parameter values six times, successfully achieving the optimization goal. As shown in Table 5, adjusting the parameters individually resulted in a notable decrease in the mean motion error of the lifting machine and pendulum machine . However, the effect of the mean squared deviation of error components , , , and on the transport system’s average reliability was relatively minor. Continuing to fine-tune the mean squared errors of the unrevised error components with greater sensitivities can enhance the average reliability of the transportation system, although the impact of these adjustments will diminish gradually due to the reduced influence of the less sensitive parameters on the overall reliability level.
5. Discussion
Only the mean value of the motion error for the vertical conveyor system and oscillating conveyor is considered in this study. However, contact collisions, intermittent motion impacts, and elastic deformation often impact transport systems, among other disturbing factors. These factors result in a more complex distribution law for the mechanism’s motion error, which necessitates numerous statistical tests to accurately obtain its value. Therefore, it is necessary to take into account the influence of the mean value of other error components in the parameter sensitivity analysis. Incorporating additional error parameters into the state function of the transit system’s transit accuracy will result in a reduction in the overall level of reliability, making the task of improving reliability more challenging. The intricate state function and error distribution law of the mechanism indicate a gap between the mechanical reliability theory guiding engineering practice and the overall assessment of transport system reliability under specific working conditions. Further study is needed.
6. Conclusions
This study analyzes the state function of target carrier transit accuracy based on the transport system’s motion model. The response surface and sensitivity analysis methods are integrated to determine the adjustment method and geometric error component steps. Using the primary second-order method of moments, the research optimizes the reliability index step by step. As a result, the average reliability of the transport system has been improved. This research provides a theoretical foundation for the reliability evaluation of the transport system. The study’s conclusion shows that:
(1) The reliability of a single mechanism has a different connotation than that of system reliability. Evaluating the system’s level of reliability exclusively through a single mechanism is not feasible. The assessment process is much more complex and is influenced by the overall system’s error rate. By establishing a reliability model predicated on the dynamic characteristics of the mechanism and error analysis, one can overcome challenges such as testing difficulties in transport systems, lack of samples, and an inability to conduct destructive tests. Furthermore, this provides a theoretical model and foundation for reliability assessments. The reliability sensitivity model also indicates how to enhance dependability by addressing the issue of decreased reliability due to error types determined by distribution laws. By establishing a reliability model based on the mechanism’s dynamic characteristics and error analysis, the difficulties in the transit system, including testing challenges, sample shortages, and limitations in destructive testing, can be overcome. This approach provides a theoretical model and foundation for reliability assessment;
(2) Using a specific transportation system as an example and disregarding the impact of static deformation, this study presents a reliability assessment method that factors in dynamic errors. Through numerical simulation, it was discovered that the transport system’s reliability under the inertial system has a minimum value of 94.36% and an average value of 97.73%. The transport system’s reliability under a shock vibration environment has a minimum value of 91.11% and an average value of 94.34%. The mean reliability of the transportation system declined by 3.39% as a result of shock oscillations. The incorporation of a vibration-dampening design would promote increased reliability in the transportation system;
(3) According to our study employing the second-order response surface function and sensitivity analysis method, we determined the extent to which the distribution parameters of the normally distributed error variables impact the system’s reliability. We then adjusted the error mean and mean squared error in sequential order of sensitivity, from highest to lowest, ultimately reaching an optimization goal of increasing average reliability from 94.34% to 97.07%. This validates the feasibility of our reliability optimization method for the transport system.
Author Contributions
This research article was a collaborative effort of several co-authors, in which the division of labor for each work element was as follows: conceptualization, Y.Z. and L.Z.; methodology, Y.Z. and P.Y.; validation, L.Z. and P.Y.; formal analysis, P.Y.; formal analysis, L.Z.; sourcing, Y.Z.; data curation, L.Z.; writing—original draft preparation, L.Z.; writing—reviewing and editing, L.Z.; visualization, P.Y. and L.Z.; supervision, S.S. All authors have read and agreed to the published version of the manuscript.
Funding
This paper is supported by the National Natural Science Foundation Youth Foundation (Grant No. 62101579, Responsible person: Haidi Dong, 2022) and the Natural Science Foundation of Hubei Province (Grant No. 2023AFB900, Responsible person: Weige Liang, 2024).
Data Availability Statement
The research data were generated via both experimental and simulation calculations, but due to ethical and privacy constraints, we are currently unable to disclose the data. Our sincere apologies for any inconvenience caused.
Acknowledgments
The completion of this study is firstly due to the collaborative efforts of several co-authors, and in addition, special thanks to Haidi Dong and Weige Liang for providing funding support for this study, which made it possible to proceed smoothly.
Conflicts of Interest
The authors declare that there are no conflict of interest regarding the publication of this article.
References
- An, X.; Gosling, P.D.; Zhou, X. Analytical Structural Reliability Analysis of a Suspended Cable. Struct. Saf. 2016, 58, 20–30. [Google Scholar] [CrossRef]
- Lee, I.; Noh, Y.; Yoo, D. A Novel Second-Order Reliability Method (SORM) Using Noncentral or Generalized Chi-Squared Distributions. J. Mech. Des. 2012, 134, 100912. [Google Scholar] [CrossRef]
- Wang, Q.; Zhang, J.; Peng, W.; Yang, L. Hierarchical Response Surface Modeling and Reliability Analysis of Complex Mechanical System Based on Composite Function. Acta Armamentarii 2018, 39, 590. [Google Scholar] [CrossRef]
- Tang, J. Mechanical System Reliability Analysis Using a Combination of Graph Theory and Boolean Function. Reliab. Eng. Syst. Saf. 2001, 72, 21–30. [Google Scholar] [CrossRef]
- Li, X.-Y.; Li, X.; Feng, J.; Li, C.; Xiong, X.; Huang, H.-Z. Reliability Analysis and Optimization of Multi-Phased Spaceflight with Backup Missions and Mixed Redundancy Strategy. Reliab. Eng. Syst. Saf. 2023, 237, 109373. [Google Scholar] [CrossRef]
- Echard, B.; Gayton, N.; Lemaire, M. AK-MCS: An Active Learning Reliability Method Combining Kriging and Monte Carlo Simulation. Struct. Saf. 2011, 33, 145–154. [Google Scholar] [CrossRef]
- Echard, B.; Gayton, N.; Lemaire, M.; Relun, N. A Combined Importance Sampling and Kriging Reliability Method for Small Failure Probabilities with Time-Demanding Numerical Models. Reliab. Eng. Syst. Saf. 2013, 111, 232–240. [Google Scholar] [CrossRef]
- Depina, I.; Le, T.M.H.; Fenton, G.; Eiksund, G. Reliability Analysis with Metamodel Line Sampling. Struct. Saf. 2016, 60, 1–15. [Google Scholar] [CrossRef]
- Yang, B.; Yang, W. Modular Approach to Kinematic Reliability Analysis of Industrial Robots. Reliab. Eng. Syst. Saf. 2023, 229, 108841. [Google Scholar] [CrossRef]
- Chen, J.; Chen, L.; Qian, L.; Chen, G.; Zhou, S. Time-Dependent Kinematic Reliability Analysis of Gear Mechanism Based on Sequential Decoupling Strategy and Saddle-Point Approximation. Reliab. Eng. Syst. Saf. 2022, 220, 108292. [Google Scholar] [CrossRef]
- Zhang, D.; Shen, S.; Wu, J.; Wang, F.; Han, X. Kinematic Trajectory Accuracy Reliability Analysis for Industrial Robots Considering Intercorrelations among Multi-Point Positioning Errors. Reliab. Eng. Syst. Saf. 2023, 229, 108808. [Google Scholar] [CrossRef]
- Huang, P.; Huang, H.-Z.; Li, Y.-F.; Li, H. Positioning Accuracy Reliability Analysis of Industrial Robots Based on Differential Kinematics and Saddlepoint Approximation. Mech. Mach. Theory 2021, 162, 104367. [Google Scholar] [CrossRef]
- Zhuang, X. Time-Dependent Kinematic Reliability of a Dual-Axis Driving Mechanism for Satellite Antenna Considering Non-Uniform Planar Revolute Joint Clearance. Acta Astronaut. 2022, 197, 91–106. [Google Scholar] [CrossRef]
- Zhao, Q.; Guo, J.; Yu, D.; Hong, J.; Chen, F. An Enhanced Method of Resizing Support Links for a Planar Closed-Loop Overconstrained Deployable Structure Considering Kinematic Reliability and Surface Accuracy. Aerosp. Sci. Technol. 2020, 104, 105988. [Google Scholar] [CrossRef]
- Weng, Y.-Y.; Zhang, X.-Y.; Lu, Z.-H.; Zhao, Y.-G. A Conditional Extreme Value Distribution Method for Dynamic Reliability Analysis of Stochastic Structures. Struct. Saf. 2024, 106, 102398. [Google Scholar] [CrossRef]
- Lampart, M.; Zapoměl, J. Chaos Identification of a Colliding Constrained Body on a Moving Belt. Nonlinear Dynam. 2021, 104, 2723–2732. [Google Scholar] [CrossRef]
- Tian, Q.; Flores, P.; Lankarani, H.M. A Comprehensive Survey of the Analytical, Numerical and Experimental Methodologies for Dynamics of Multibody Mechanical Systems with Clearance or Imperfect Joints. Mech. Mach. Theory 2018, 122, 1–57. [Google Scholar] [CrossRef]
- Villecco, F. On the Evaluation of Errors in the Virtual Design of Mechanical Systems. Machines 2018, 6, 36. [Google Scholar] [CrossRef]
- Sun, Y.-Z.; Fan, W.-X. Computer simulation of the working process of chain thrust mechanism. China Mech. Eng. 1998, 9, 18–20. [Google Scholar]
- Liu, X.-L. Hybrid Reliability Analysis Method Based on Probabilistic and Non-Probabilistic Convex Model; Hunan University: Changsha, China, 2012. [Google Scholar]
- Zhang, Y.-M. Connotation and Development of Mechanical Reliability-based Design. J. Mech. Eng. 2010, 46, 167–188. [Google Scholar] [CrossRef]
- Dong, C. Modern Structural System Reliability Theory and Its Application; Science Press: Beijing, China, 2001. [Google Scholar]
- Khuri, A.I.; Mukhopadhyay, S. Response Surface Methodology. WIREs Comput. Stat. 2010, 2, 128–149. [Google Scholar] [CrossRef]
- Gao, S.; Zhao, Y.; Zhao, X.; Zhang, Y. Application of Response Surface Method Based on New Strategy in Structural Reliability Analysis. Structures 2023, 57, 105202. [Google Scholar] [CrossRef]
- Chen, L.-T. Study on the Computational Methods of the Structural Acoustic Sensitivity. Ph.D. Thesis, Hefei University of Technology, Hefei, China, 2013. Available online: https://kns.cnki.net/kcms2/article/abstract?v=0kbmF0AymBCizK60RwSW-vUwvDvb8KUvGP_RBQRb7o3A4Q6HqrM9TKbzIU6SsQa1iaNkmJcVcRz0BpeYsM7KL35T6n4WclY9VFGPtKfNcm_fZC1EUu3EX1BXdeNq5hS7&uniplatform=NZKPT&language=CHS (accessed on 8 December 2023).
- Wei, P.-F. Research on the Reliability and Sensitivity Analysis of Structural Systems. Ph.D. Thesis, Northwestern Polytechnical University, Xi’an, China, 2015. Available online: https://kns.cnki.net/kcms2/article/abstract?v=0kbmF0AymBDiz1rW-HjAC52AOASCQN15fmdC2g5LYhNkH-X5DKVtVcXi7UfV-UX_-oIx1hZt_zZdJFeCrW7PKHYxhJJhuR1gAJJVnfpEOAYUjhi2P1IHcFQ8cfTv0faHANZ4r5_LShk=&uniplatform=NZKPT&language=CHS (accessed on 8 December 2023).
- Yang, Z. Reliability-Based Sensitivity and Reliability-Based Robust Design for Mechanical Components with Non-Normal Random Variable. Ph.D. Thesis, Northeastern University, Shenyang, China, 2010. Available online: https://kns.cnki.net/kcms2/article/abstract?v=0kbmF0AymBCEL0fGXS5eqj89K-L8Iua1kc9GCF1LESNzr3BXfXvqAR233U1uFysW98mFB_mXTDJLrRGH8wgJoFfNWIlSPVNEKEYf-ld5A5p8v76_dxcCaI95sbp63gEG&uniplatform=NZKPT&language=CHS (accessed on 8 December 2023).
- Zhou, J.-Y.; Zhu, D.-W.; Wang, Z.-L. Reliability–based Design Optimization Strategy for Structures by Universal Generating Functions. China Mech. Eng. 2021, 32, 1442–1448. [Google Scholar]
- Li, H.-C.; Sun, Z.-L.; Wang, H. Analysis of Structural Reliability Sensitivity Based on Dimensionality Reduction and Visualization Technique. Acta Armamentarii 2014, 35, 1876–1882. [Google Scholar]
Figure 1.
Iterative calculation process.

Figure 2.
Calculation process of RMS (response surface model).
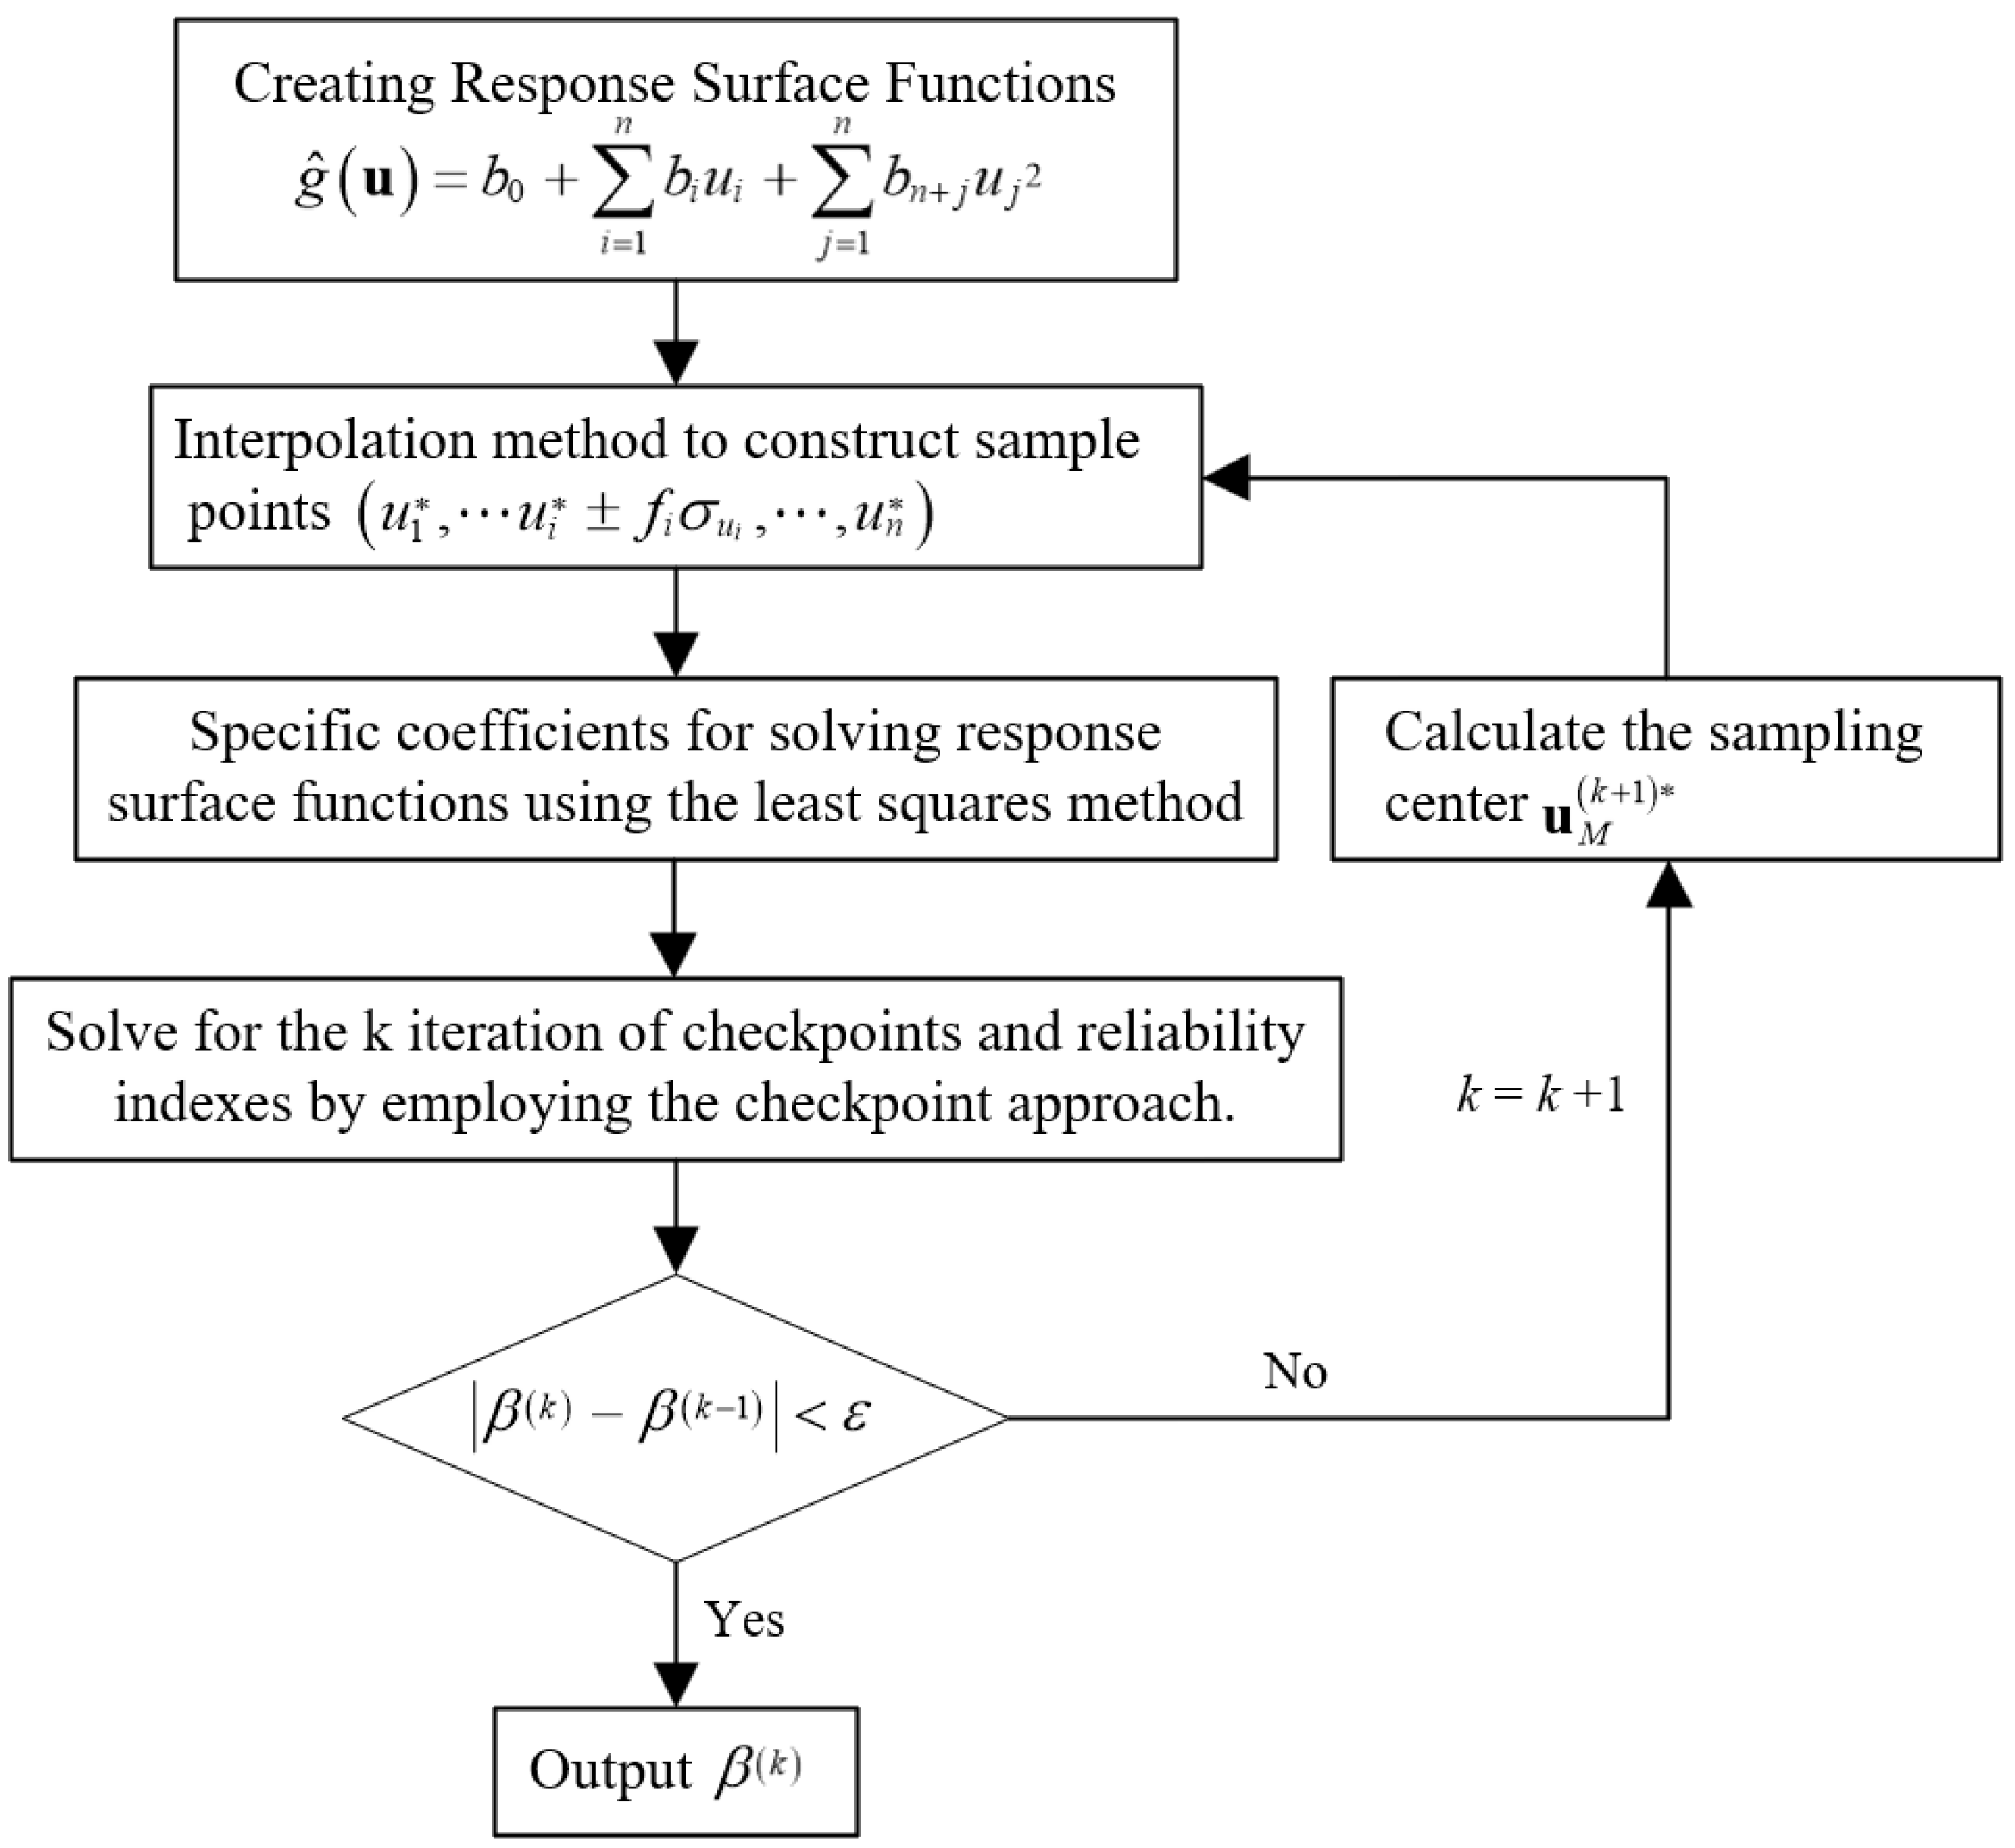
Figure 3.
Bucher sampling method.

Figure 4.
Composition of transfer system.
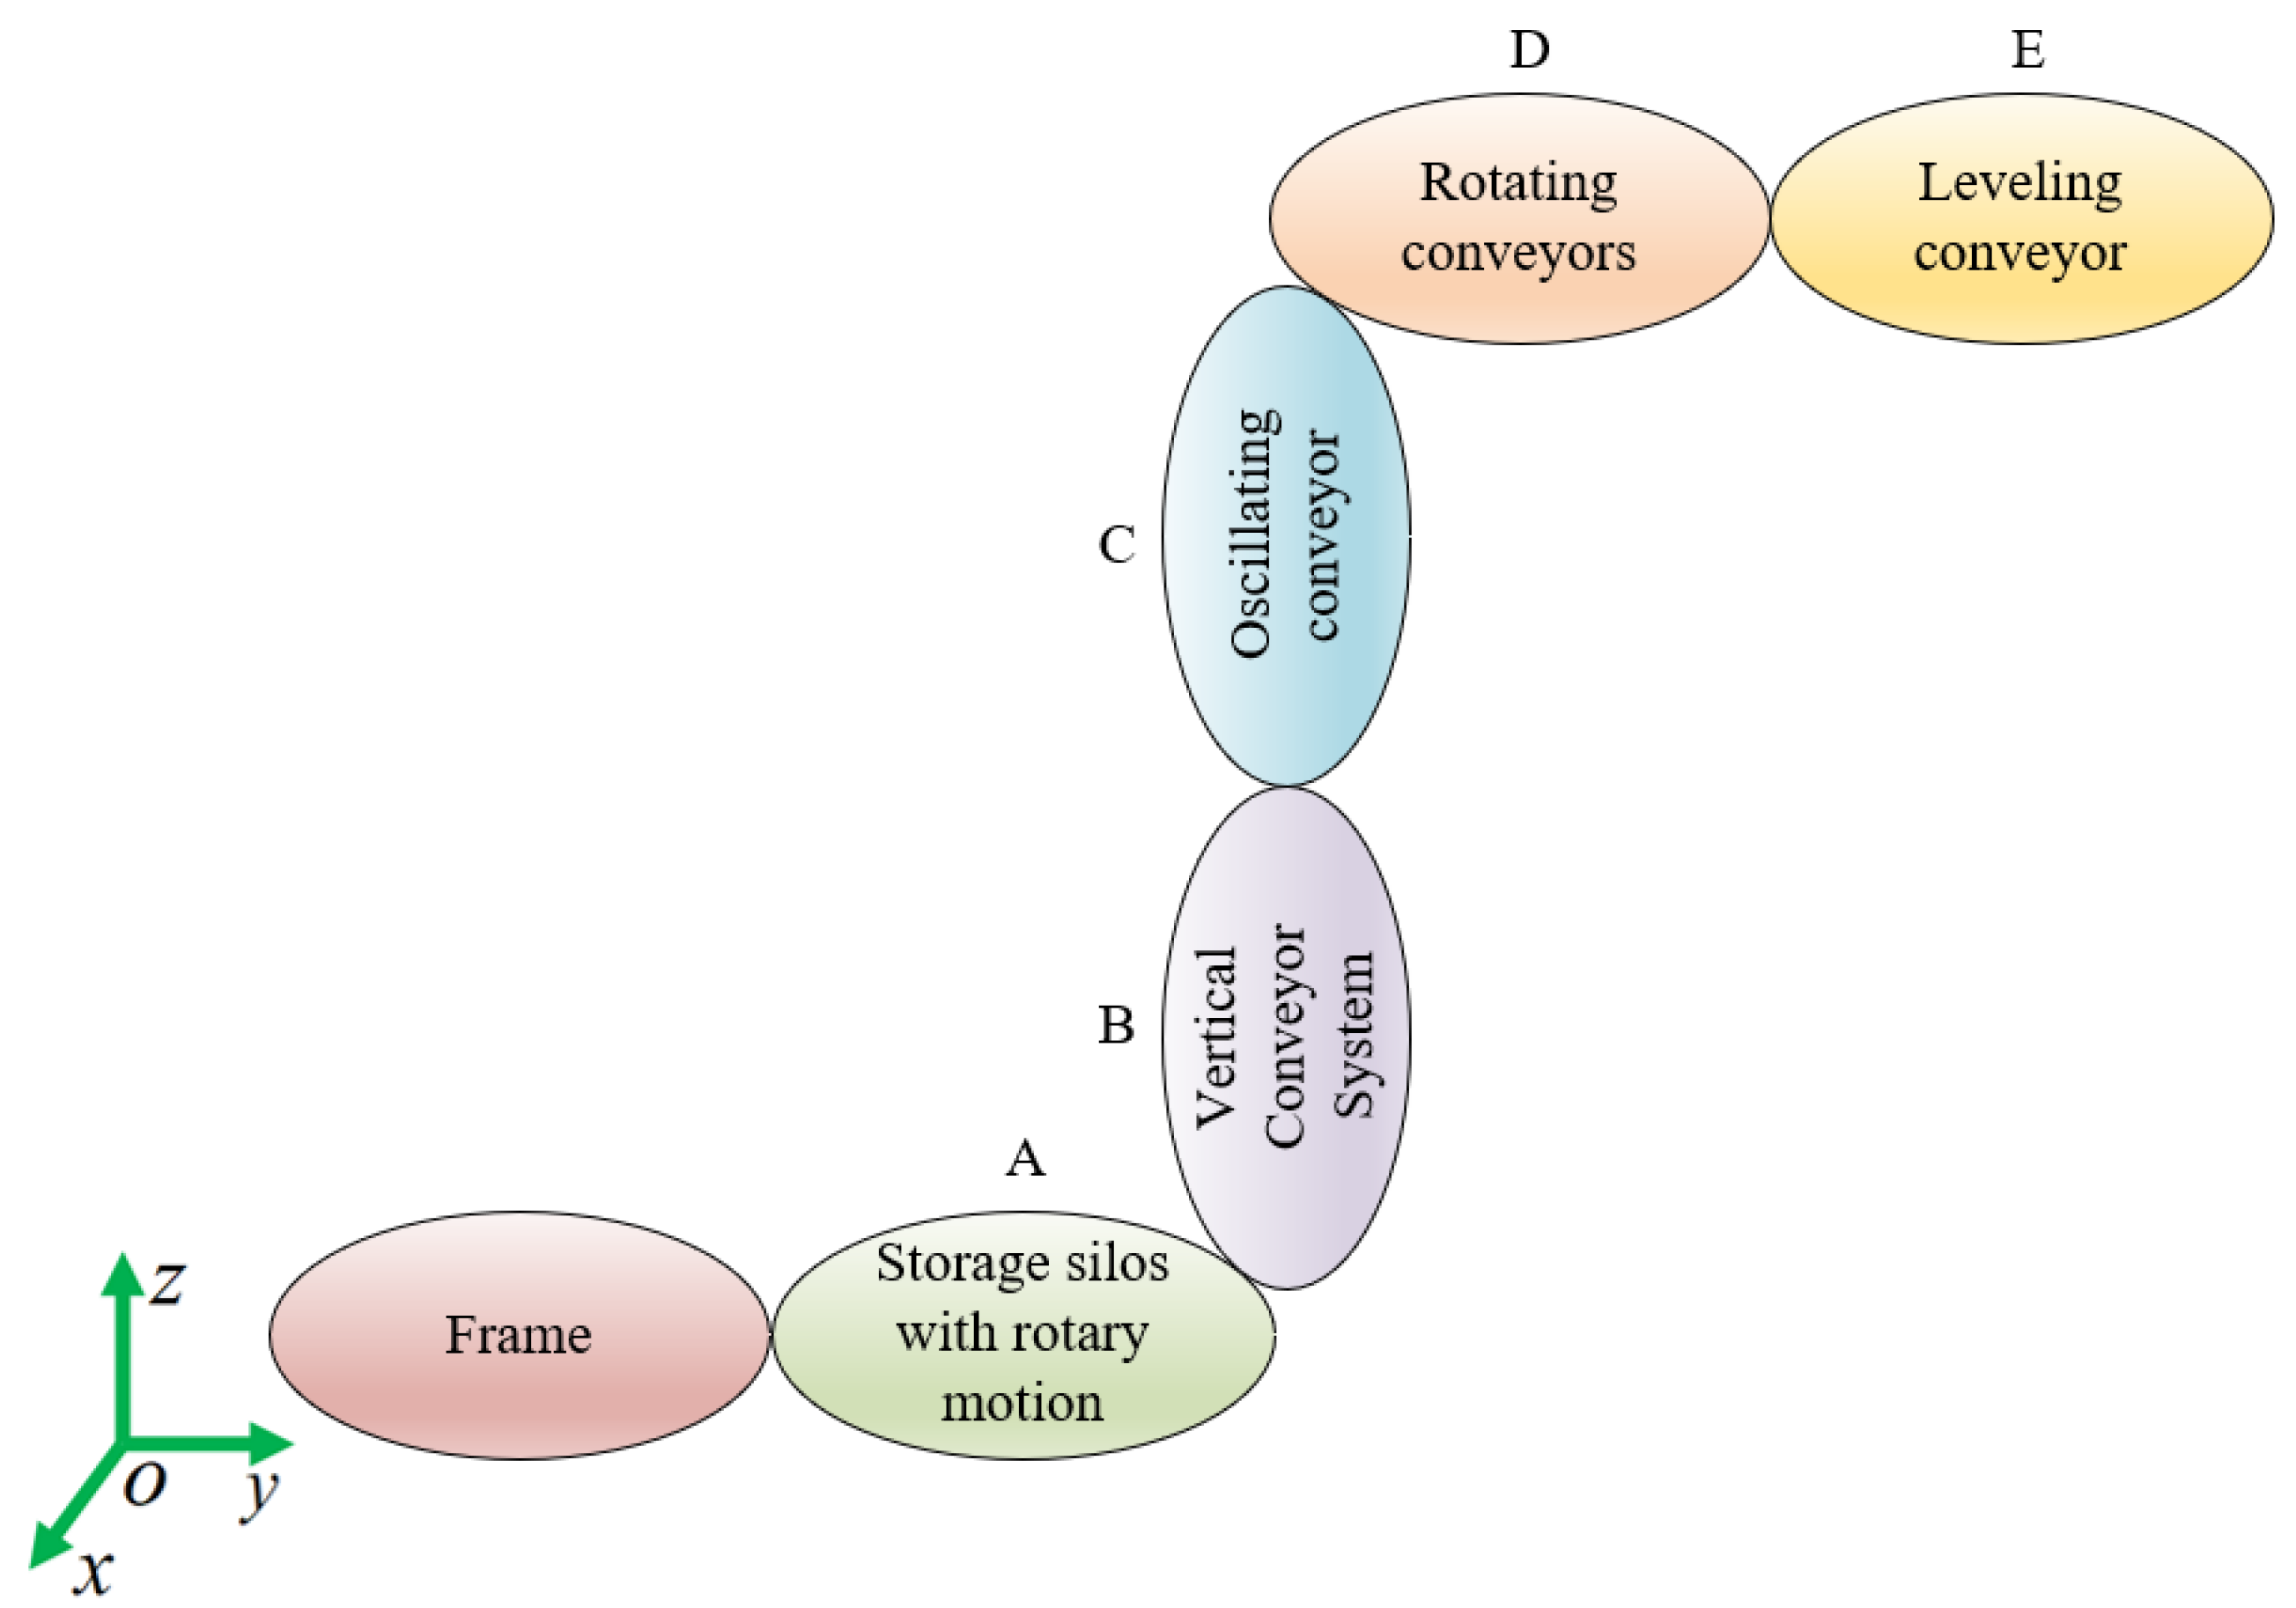
Figure 5.
Target carrier transportation process.
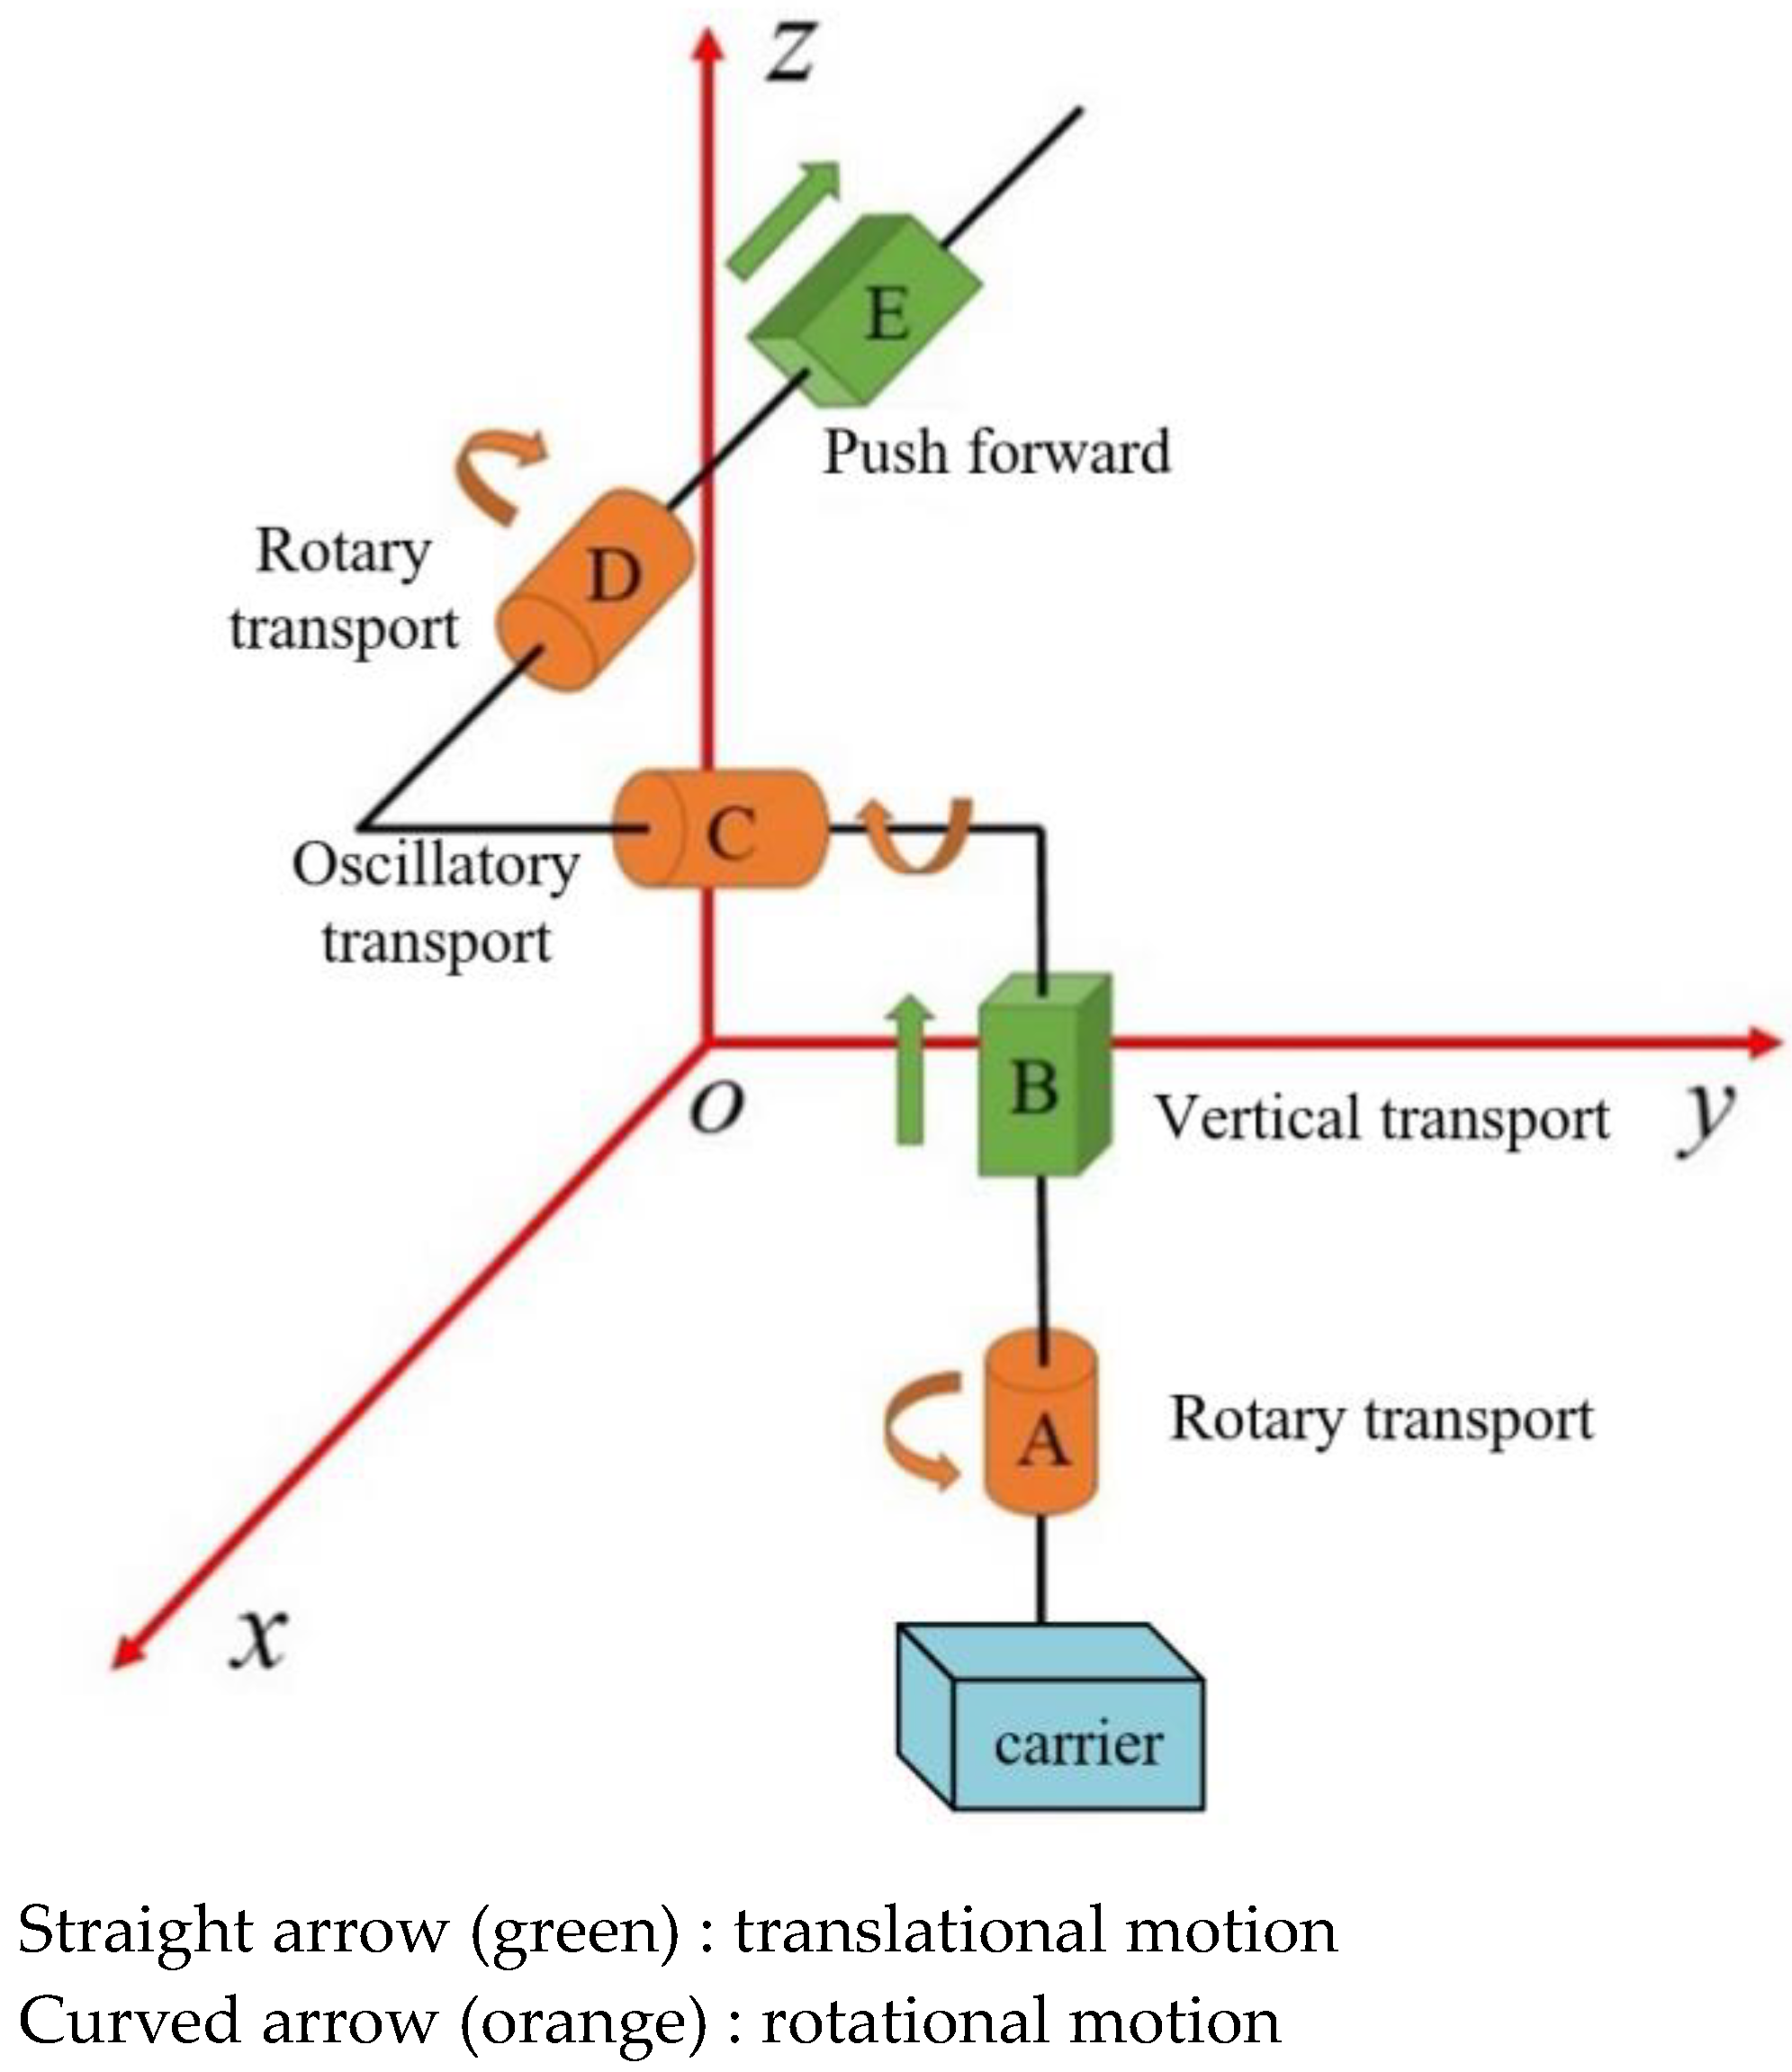
Figure 6.
Target carrier coordinate system transformation.
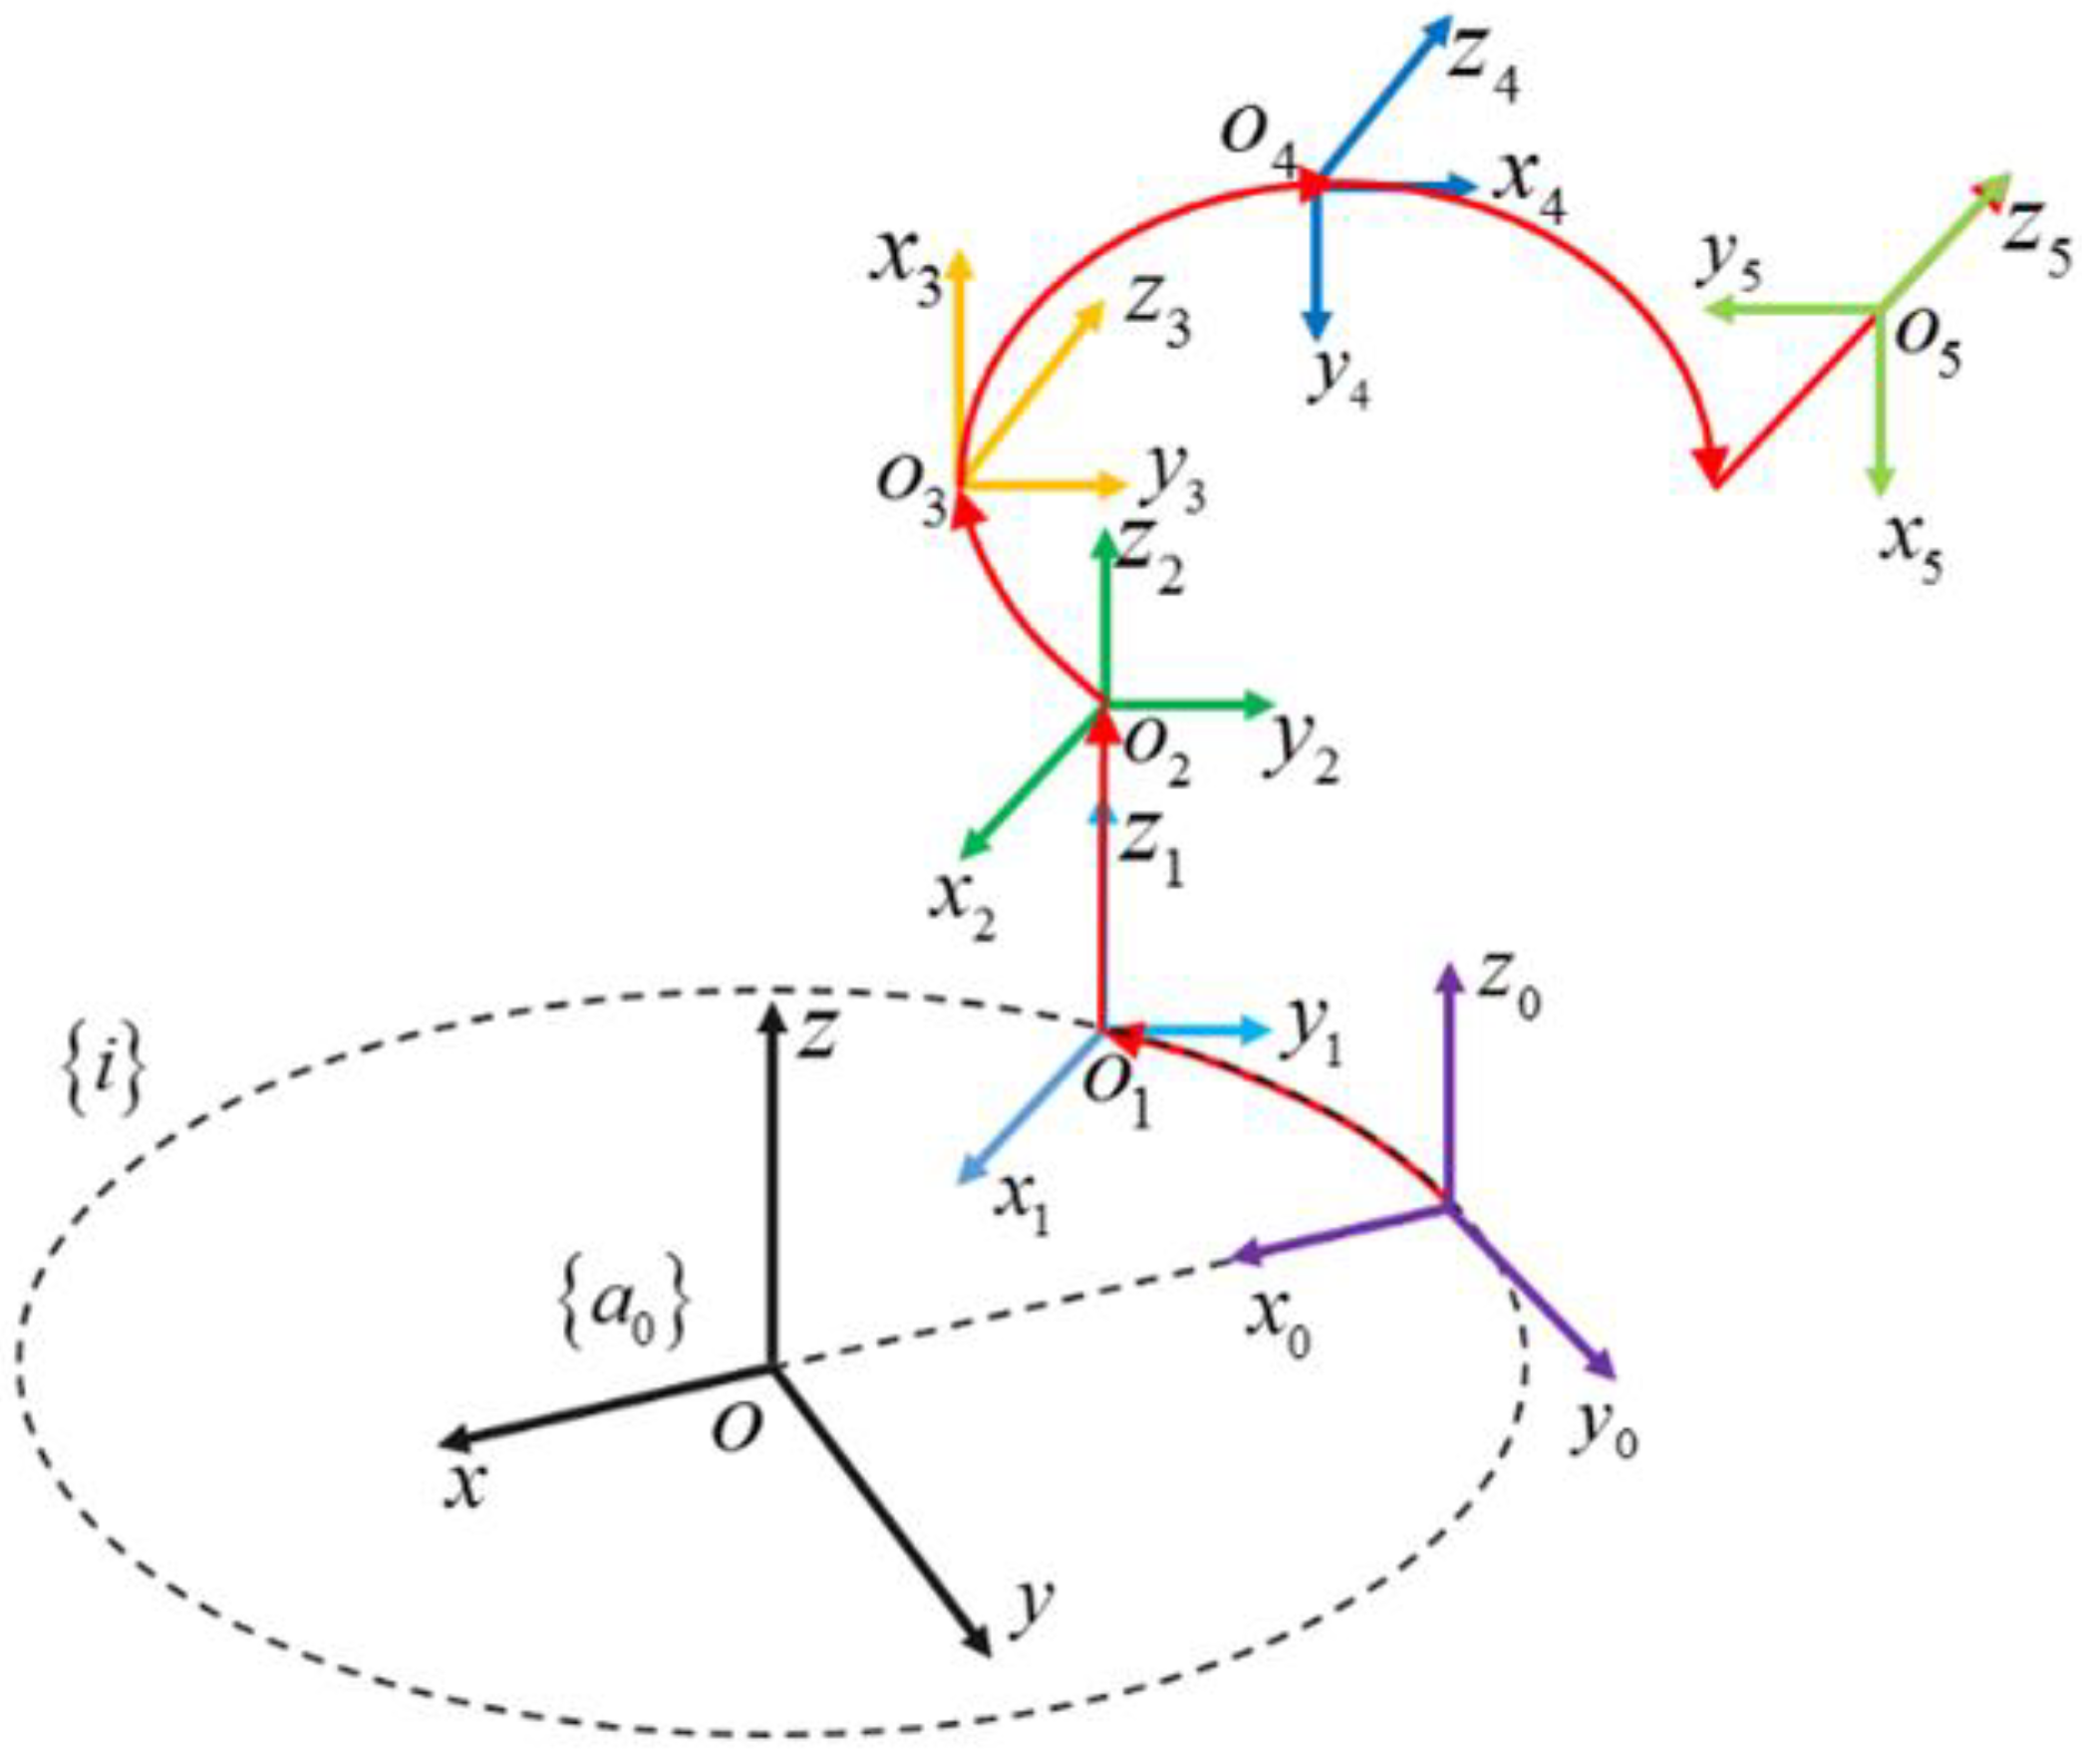
Figure 7.
Transfer system test bench.
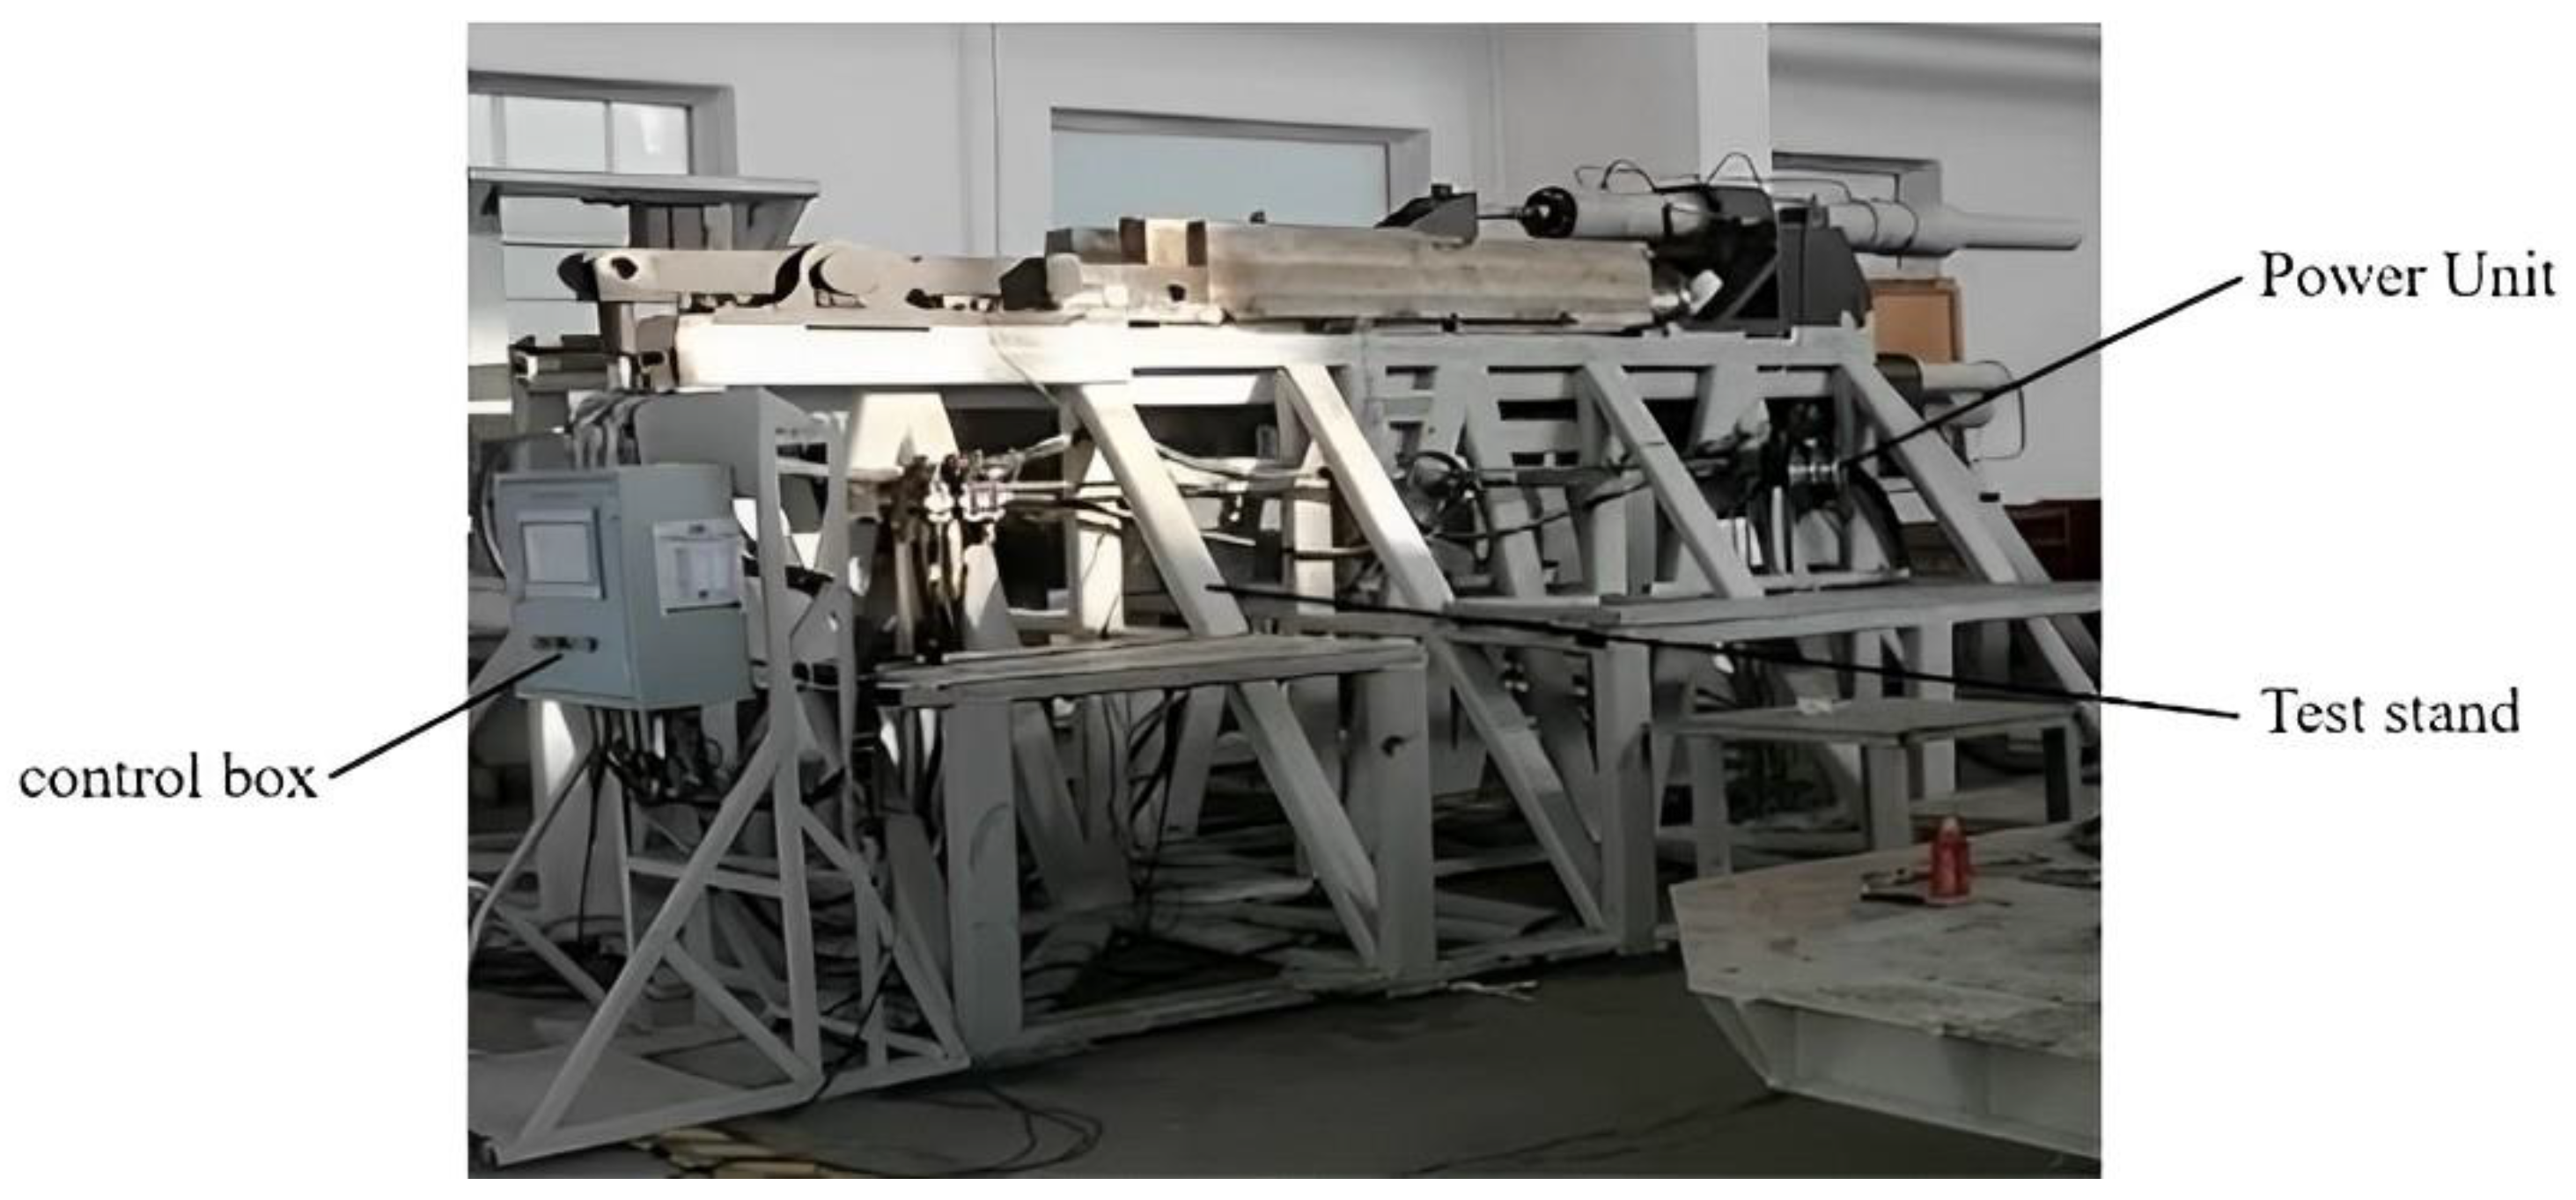
Figure 8.
Dynamic model of swing mechanism.

Figure 9.
Reliability index under different firing environments.
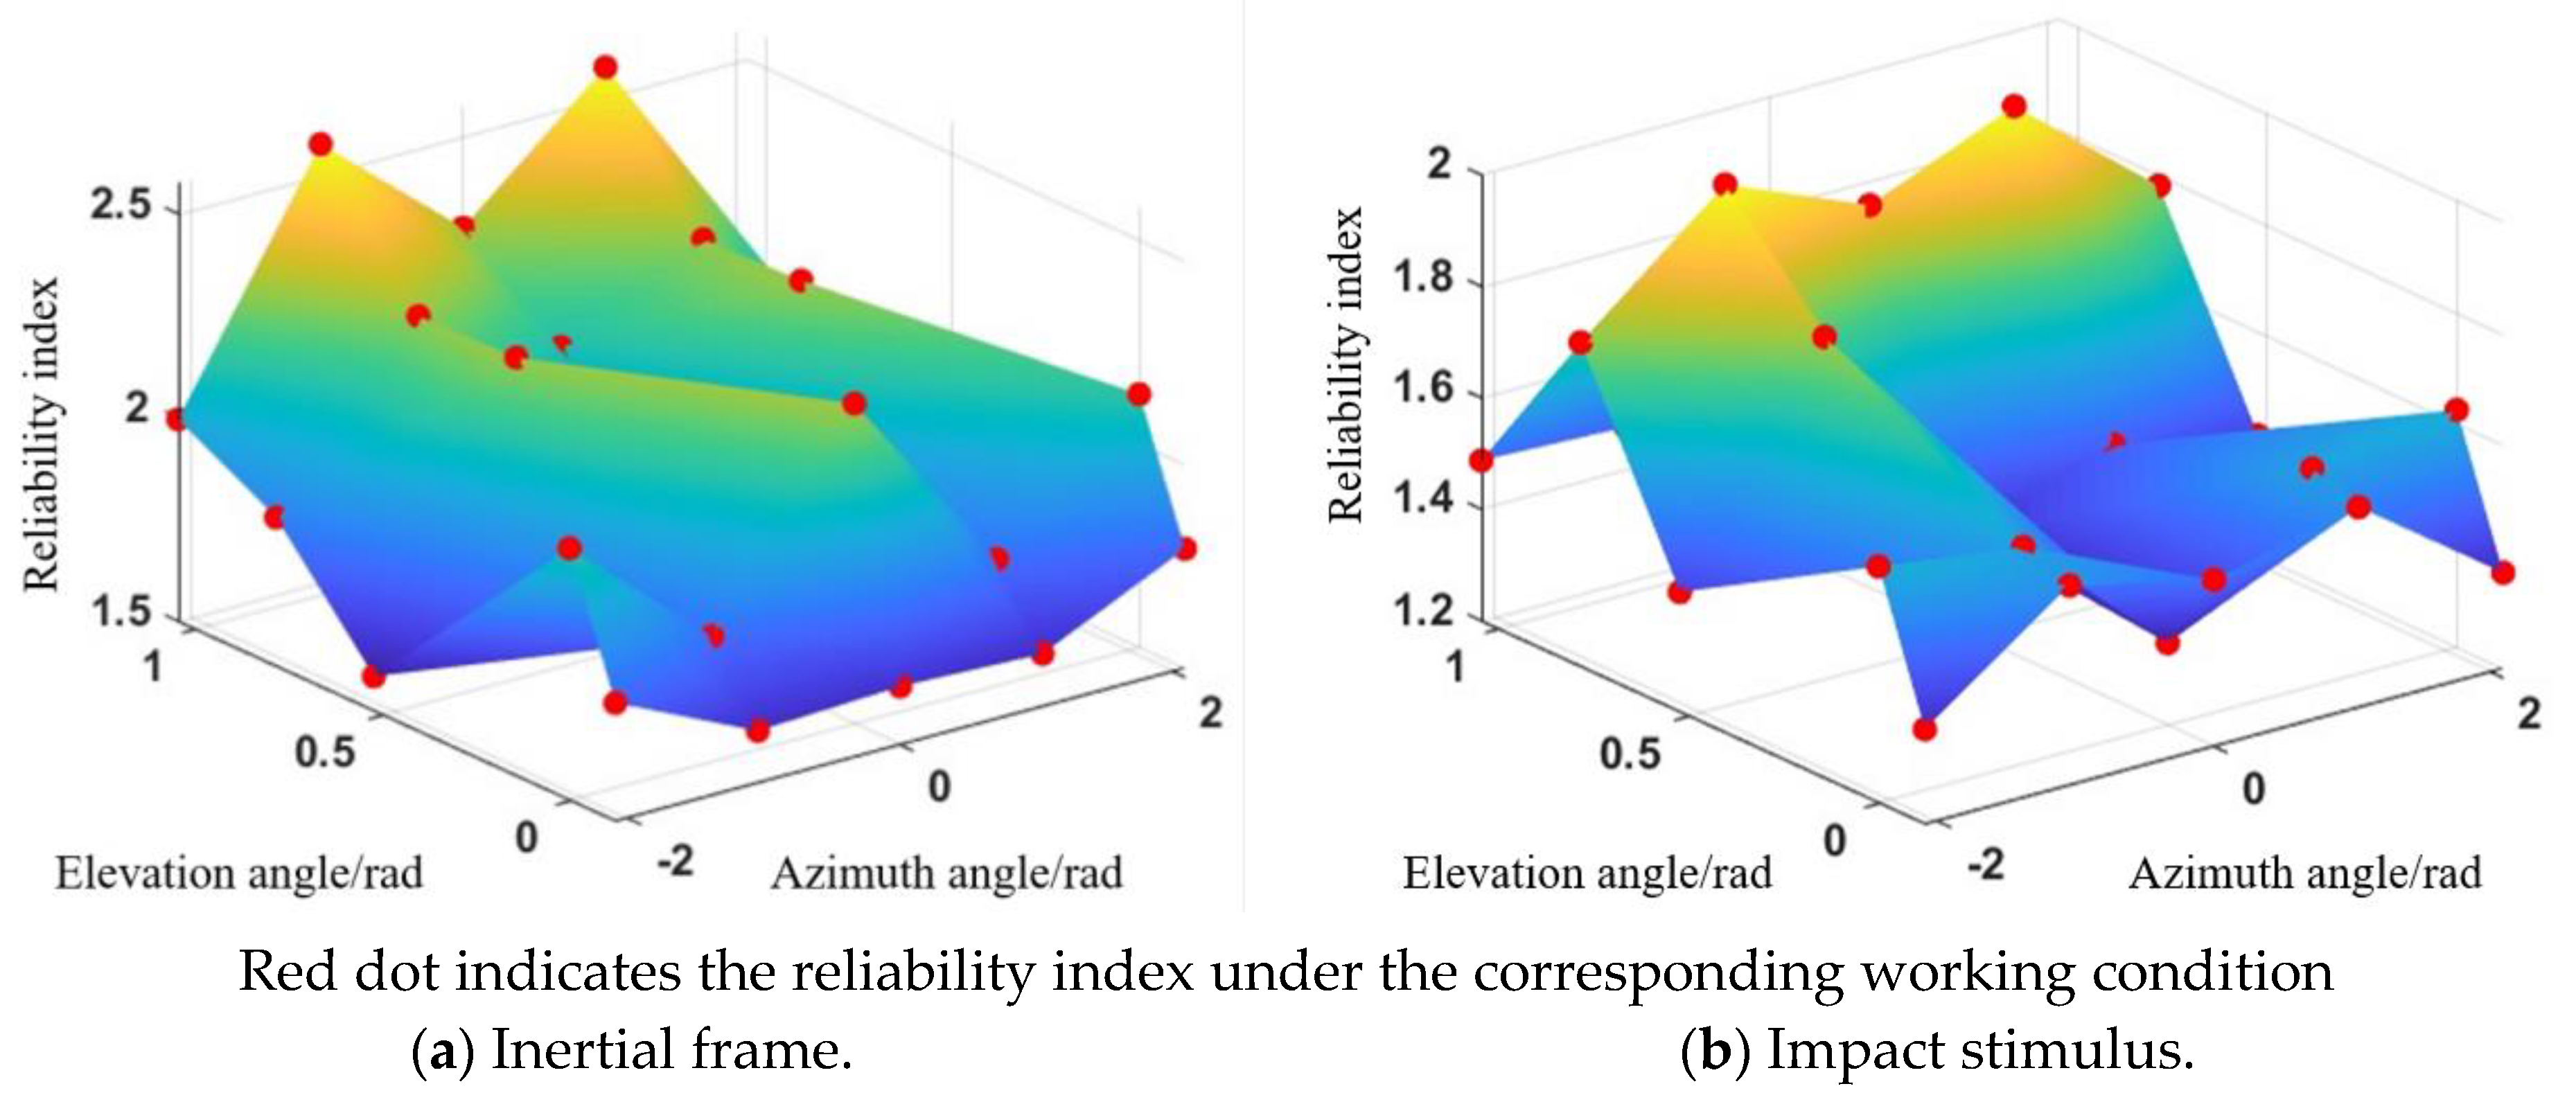
Figure 10.
Reliability optimization process.
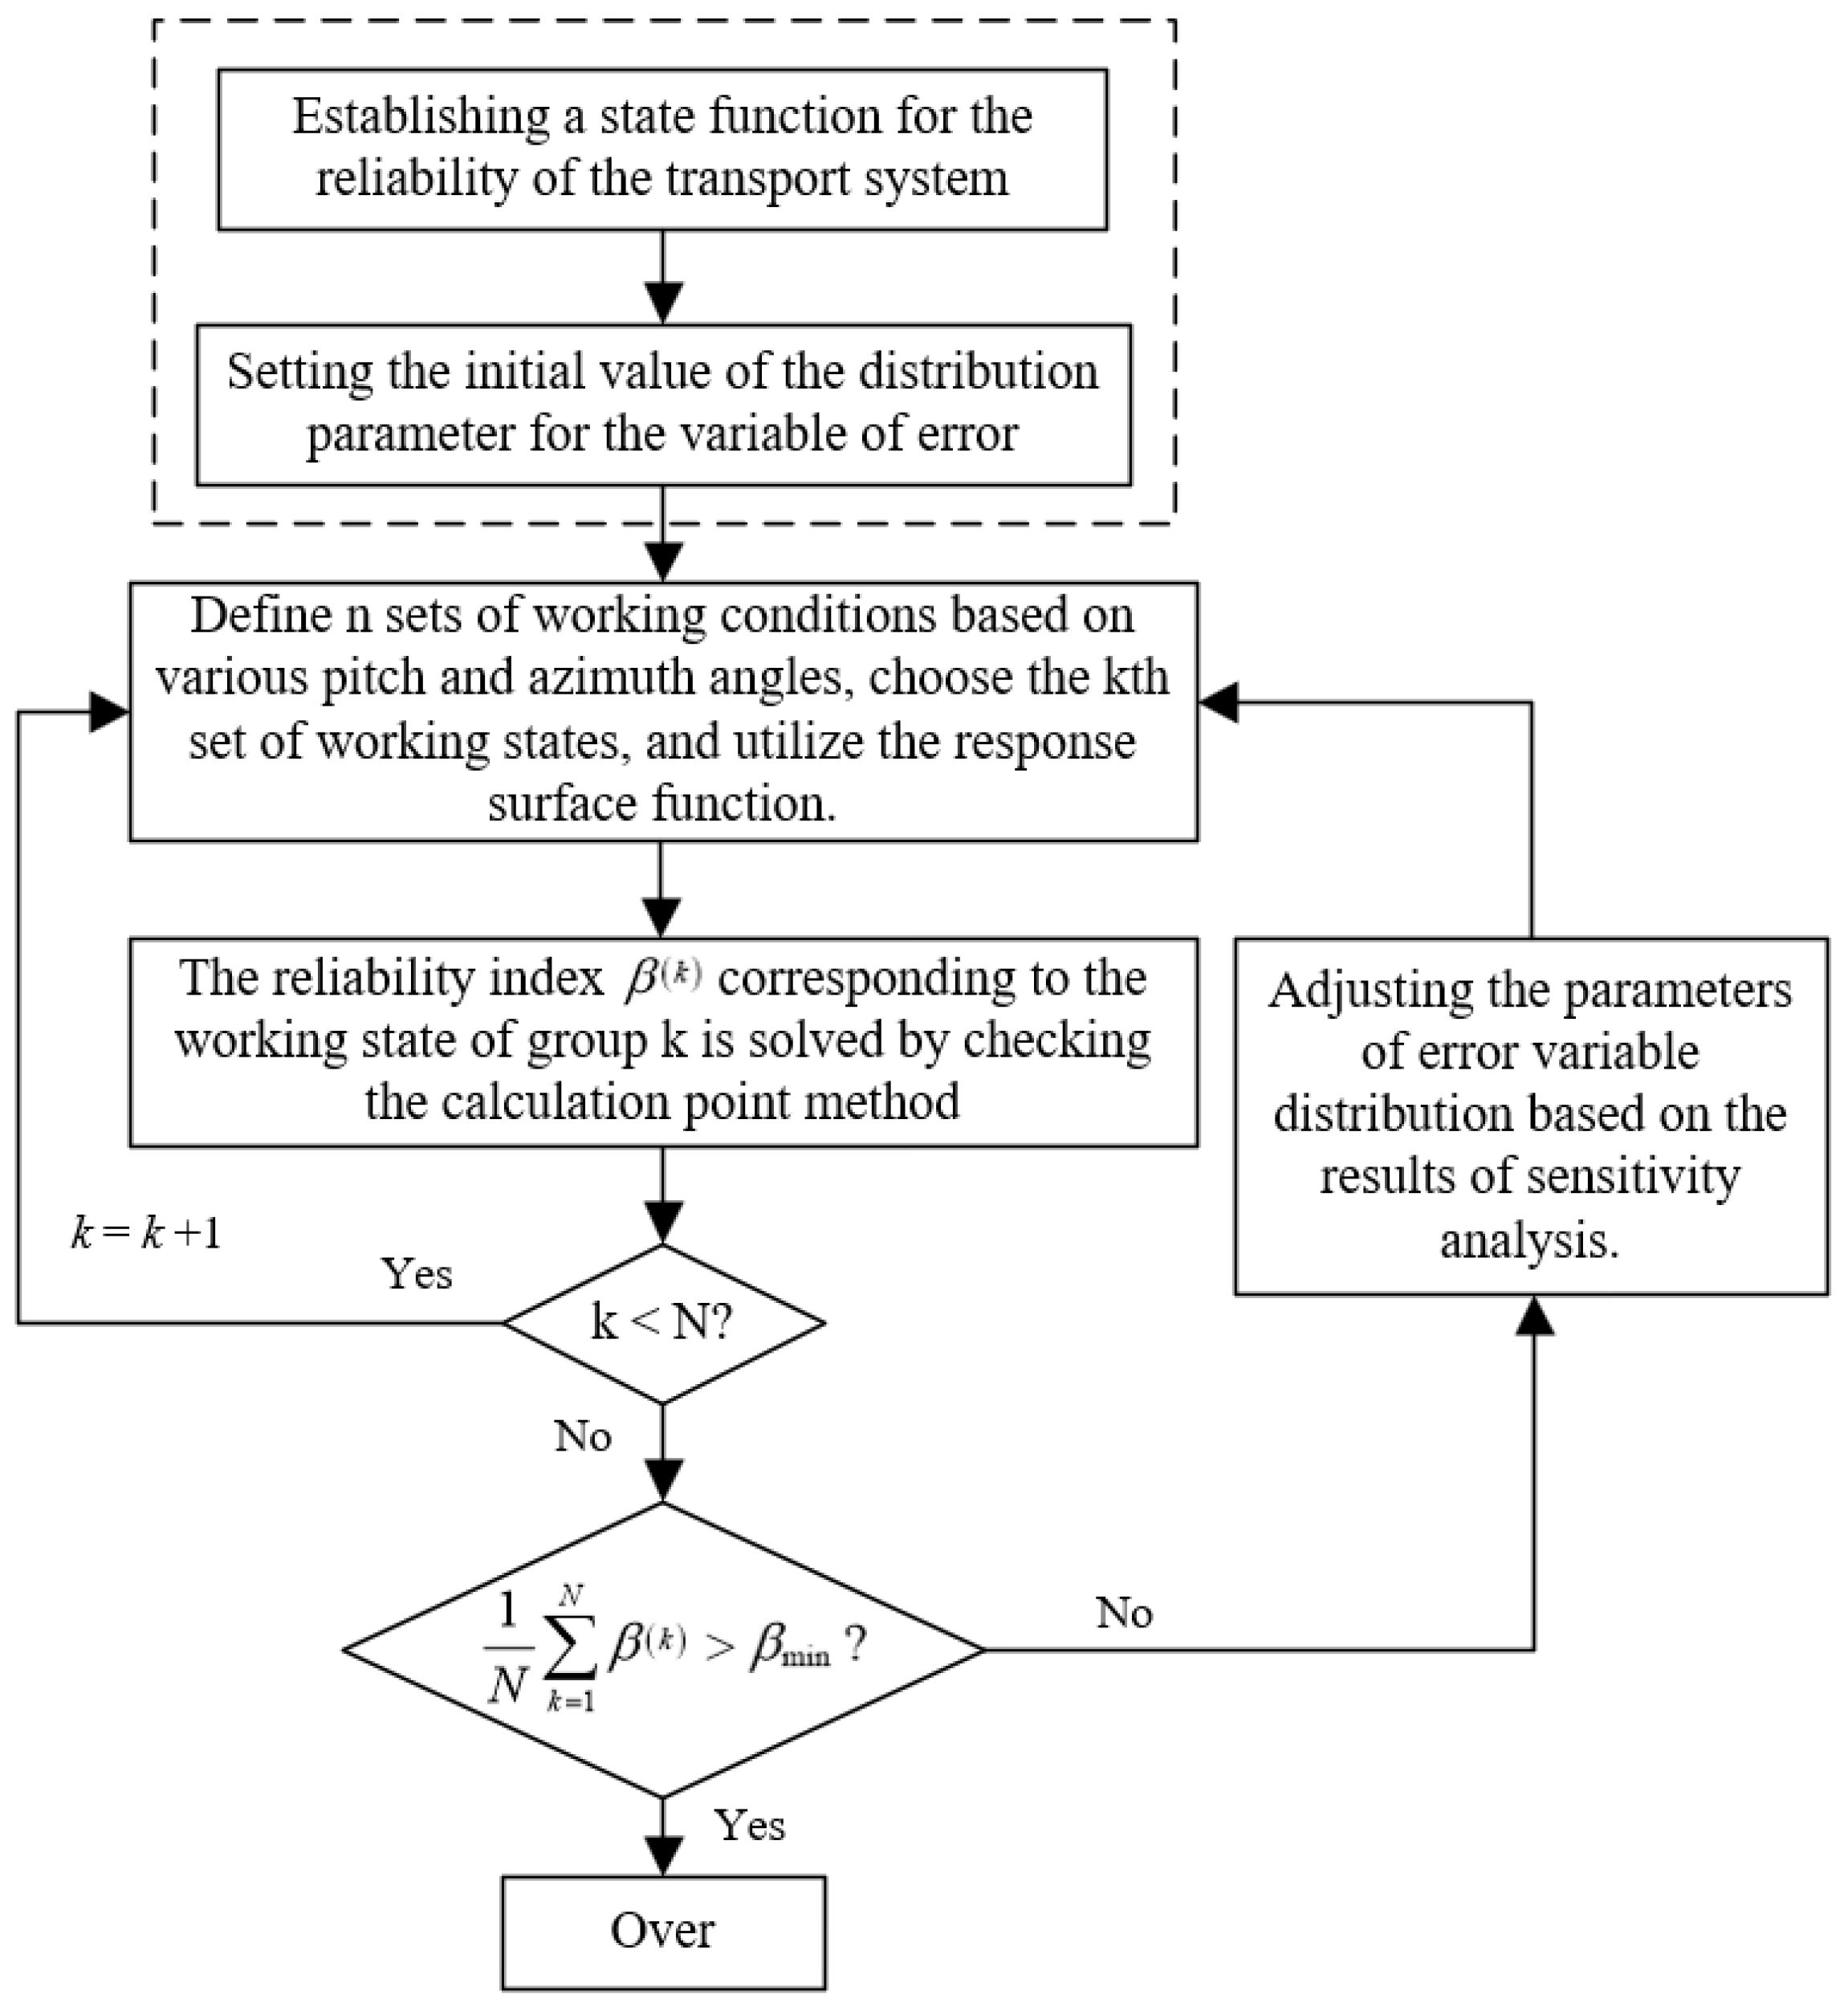
Figure 11.
Reliability optimization result.


Table 1.
Mean square error of error component.
| No. | Error | Error Item | No. | Error | Error Item |
|---|---|---|---|---|---|
| 1 | Azimuth angle error | 7 | Rotational error around y-axis | ||
| 2 | Rotational error around x-axis | 8 | Rotary error around y-axis | ||
| 3 | Displacement error in y-direction | 9 | Slewing error around z-axis | ||
| 5 | Rotational error around x-axis | 10 | Displacement error in z-direction | ||
| 6 | Travel Error of vertical conveyor system | 11 | Up-swing angle error of oscillating conveyor | ||
| 4 | Storage silos with rotary motion rotation error | 12 | Angle error of rotating conveyors rotating |
denote the rotation error around the n-axis for a carrier translating or rotating around the z-axis; denote the displacement error in the n-direction for a carrier translating or rotating along the z-axis.
Table 2.
Values of mean square deviation.
| No. | Symbol of Mean Square Deviation | Numerical Value | No. | Symbol of Mean Square Deviation | Numerical Value |
|---|---|---|---|---|---|
| 1 | 0.75 mrad | 7 | 1.5 mm | ||
| 2 | 0.05 mrad | 8 | 0.15 mrad | ||
| 3 | 0.5 mm | 9 | 0.15 mrad | ||
| 4 | 3.5 mrad | 10 | 0.25 mm | ||
| 5 | 0.25 mrad | 11 | 2.5 mrad | ||
| 6 | 0.25 mrad | 12 | 1.5 mrad |
Table 3.
Reliability parameters of the transfer system under different working conditions.
| No. | Azimuth Angle/rad | Elevation Angle/rad | Inertial Frame | Impact Stimulus | ||
|---|---|---|---|---|---|---|
| β | R | β | R | |||
| 1 | −2.0944 | −0.1222 | 1.7923 | 96.35% | 1.3716 | 91.49% |
| 2 | −2.0944 | 0 | 2.1205 | 98.30% | 1.6254 | 94.80% |
| 3 | −2.0944 | 0.5236 | 1.5854 | 94.36% | 1.4156 | 92.15% |
| 4 | −2.0944 | 0.7854 | 1.8649 | 96.89% | 1.7815 | 96.26% |
| 5 | −2.0944 | 1.0472 | 1.9955 | 97.70% | 1.4874 | 93.15% |
| 6 | −1.0472 | −0.1222 | 1.6290 | 94.83% | 1.5594 | 94.05% |
| 7 | −1.0472 | 0 | 1.8101 | 96.49% | 1.5904 | 94.41% |
| 8 | −1.0472 | 0.5236 | 2.2733 | 98.85% | 1.8031 | 96.43% |
| 9 | −1.0472 | 0.7854 | 2.2643 | 98.82% | 1.9943 | 97.69% |
| 10 | −1.0472 | 1.0472 | 2.5762 | 99.50% | 1.4770 | 93.02% |
| 11 | 0 | −0.1222 | 1.6437 | 94.98% | 1.4992 | 93.31% |
| 12 | 0 | 0 | 2.2865 | 98.89% | 1.3476 | 91.11% |
| 13 | 0 | 0.5236 | 1.8808 | 97.01% | 1.3820 | 91.65% |
| 14 | 0 | 0.7854 | 2.0945 | 98.19% | 1.8872 | 97.04% |
| 15 | 0 | 1.0472 | 2.2766 | 98.86% | 1.5993 | 94.51% |
| 16 | 1.0472 | −0.1222 | 1.6290 | 94.83% | 1.5594 | 94.05% |
| 17 | 1.0472 | 0 | 1.8101 | 96.49% | 1.5904 | 94.41% |
| 18 | 1.0472 | 0.5236 | 2.2733 | 98.85% | 1.4696 | 92.92% |
| 19 | 1.0472 | 0.7854 | 2.2643 | 98.82% | 1.9943 | 97.69% |
| 20 | 1.0472 | 1.0472 | 2.5762 | 99.50% | 1.4770 | 93.02% |
| 21 | 2.0944 | −0.1222 | 1.7923 | 96.35% | 1.3716 | 91.49% |
| 22 | 2.0944 | 0 | 2.1205 | 98.30% | 1.6254 | 94.80% |
| 23 | 2.0944 | 0.5236 | 1.5854 | 94.36% | 1.4156 | 92.15% |
| 24 | 2.0944 | 0.7854 | 1.8649 | 96.89% | 1.7815 | 96.26% |
| 25 | 2.0944 | 1.0472 | 1.9955 | 97.70% | 1.4874 | 93.15% |
| Min | — | — | 1.5854 | 94.36% | 1.3476 | 91.11% |
| Average | — | — | 2.0017 | 97.73% | 1.5837 | 94.34% |
(—) in the table indicates blank spac.
Table 4.
Sensitivity of mean square error of error component.
| No. | Error Symbol | Sensitivity/% | No. | Error Symbol | Sensitivity/% |
|---|---|---|---|---|---|
| 1 | 0.1360 | 7 | 0.1884 | ||
| 2 | 0.0042 | 8 | 0.0166 | ||
| 3 | 0.1331 | 9 | 0.0972 | ||
| 4 | 0.0522 | 10 | 0.1296 | ||
| 5 | 0.0497 | 11 | 0.0995 | ||
| 6 | 0.0508 | 12 | 0.0427 |
Table 5.
Reliability optimization design results.
| Name | Adjusted Parameters | Before Adjustment | After Adjustment | ||
|---|---|---|---|---|---|
| First optimization | 5.23 mm | 3.66 mm | 1.6839 | 95.39% | |
| Second optimization | 6.75 mrad | 4.73 mrad | 1.7708 | 96.17% | |
| Third optimization | 1.5 mm | 1.0 mm | 1.8132 | 96.51% | |
| Fourth optimization | 0.75 mrad | 0.50 mrad | 1.8494 | 96.78% | |
| Fifth optimization | 0.5 mm | 0.3 mm | 1.8735 | 96.95% | |
| Sixth optimization | 0.25 mm | 0.17 mm | 1.8912 | 97.07% |
Disclaimer/Publisher’s Note: The statements, opinions and data contained in all publications are solely those of the individual author(s) and contributor(s) and not of MDPI and/or the editor(s). MDPI and/or the editor(s) disclaim responsibility for any injury to people or property resulting from any ideas, methods, instructions or products referred to in the content. |
© 2023 by the authors. Licensee MDPI, Basel, Switzerland. This article is an open access article distributed under the terms and conditions of the Creative Commons Attribution (CC BY) license (https://creativecommons.org/licenses/by/4.0/).
Share and Cite
MDPI and ACS Style
Zhao, L.; Yue, P.; Zhao, Y.; Sun, S. Reliability Analysis and Optimization Method of a Mechanical System Based on the Response Surface Method and Sensitivity Analysis Method. Actuators 2023, 12, 465. https://doi.org/10.3390/act12120465
AMA Style
Zhao L, Yue P, Zhao Y, Sun S. Reliability Analysis and Optimization Method of a Mechanical System Based on the Response Surface Method and Sensitivity Analysis Method. Actuators. 2023; 12(12):465. https://doi.org/10.3390/act12120465
Chicago/Turabian StyleZhao, Lei, Pengfei Yue, Yang Zhao, and Shiyan Sun. 2023. "Reliability Analysis and Optimization Method of a Mechanical System Based on the Response Surface Method and Sensitivity Analysis Method" Actuators 12, no. 12: 465. https://doi.org/10.3390/act12120465
Note that from the first issue of 2016, this journal uses article numbers instead of page numbers. See further details here.