
Study on Characteristics of an AC Sliding Discharge Plasma Actuator Operating at Different Pressures

1
Key Laboratory of Unsteady Aerodynamics and Flow Control, Ministry of Industry and Information Technology, Nanjing University of Aeronautics and Astronautics, Yudao Street 29, Nanjing 210016, China
2
Science and Technology on Space Physics Laboratory, China Academy of Launch Vehicle Technology, Beijing 100076, China
*
Author to whom correspondence should be addressed.
Actuators 2023, 12(1), 34; https://doi.org/10.3390/act12010034
Submission received: 5 December 2022
/
Revised: 7 January 2023
/
Accepted: 8 January 2023
/
Published: 9 January 2023
(This article belongs to the Section Aircraft Actuators)
Abstract
:Dielectric barrier discharge (DBD) has been one of the most promising techniques for flow control, but the practical application needs a large plasma surface. A three-electrode sliding discharge plasma actuator (SDPA) can generate plasma filling the inter-electrode distance. In this study, the performance of an SDPA for practical flight at low pressures is reported. When the pressure decreases, plasma discharge becomes more intensive. Current peaks and power consumption of electrode 1 become higher at low pressure. Sliding discharge is fully developed at 54 kPa, and the plasma morphology resembles plumes. PIV results show vortex structures and an induced wall jet above the actuator surface. A ‘potential-arc-discharge’ is observed at 38 kPa, leading to an inhomogeneous surface temperature distribution and a velocity decrease of the jet.
1. Introduction
Because of the advantages of small size, low weight, fast reaction, and no moving parts, AC surface dielectric barrier discharge plasma actuators (AC-SDBDPA) have attracted much attention over the last decades [1,2,3,4]. The baseline plasma characteristics of AC-SDBDPAs have been widely studied. Benard and Moreau [5] investigated electrical aspects, plasma morphology, body force, and electric wind of an SDBDPA actuated by different waveforms. Results showed that waveform optimization could be performed according to the objective of the control strategy. Abe et al. [6] experimentally investigated the momentum-transfer performance of a DBD plasma actuator for the effects of ambient-gas pressure, ambient-gas species, and electrode configuration. As a result, the radiating plasma region and the power consumption of the actuator increase with decreasing air pressure. However, the momentum-transfer performance does not decrease monotonically with decreasing air pressure but increases initially and then decreases. Soni and Roy [7] verified the above results and further studied the effect of dielectric thickness, electric field, and ground electrode width on low pressure performance of DBD actuators. For different dielectric thicknesses, the thrust reaches a maximum at a pressure lower than the atmospheric, and the pressure at which the thrust peaks decrease with the dielectric thickness. The amplification in thrust at the peak ranges from 75% for 3.17 mm thick Teflon to 675% for 0.25 mm thick Teflon. Debien et al. [8] focused on the force and electric wind produced by SDBD actuators. They demonstrated that the actuator can produce a mean velocity of 10.5 m/s with a wire-to-plate design. Vortex structures were examined in the case of a plasma actuator without the presence of a free flow boundary [9]. Wu et al. [10] studied the optical emission spectra of an SDBDPA under different pressures. Rotational temperature, electron temperature, and density were used to quantify the plasma characteristics. Geuns et al. [11] experimentally designed and studied the characteristics of an SDBDPA under different conditions, including electric field and excited species population found by optical emission spectroscopy. The study contributes to characterizing SDBDPA and understanding plasma physics. Infrared thermography has also been used to characterize SDBD. Joussot R et al. [12] measured the surface temperature of the dielectric by infrared thermal imaging while an SDBD actuator was continuously running. Measurements with an external flow showed that heat dissipation resulted in a drop in the dielectric temperature. Durscher et al. [13] recorded the surface temperature of the actuator and the visible light emission of the plasma simultaneously. They found that the saturation effect could be manipulated by changing the surface temperature of the dielectric. With different infrared cameras, Meng et al. [14] obtained surface temperature in the still air and the corresponding temperature distributions over the airfoil model surface during the ice accumulation process. Infrared temperature contours from Tian et al. [15] indicated that SDBDPA is a promising anti-icing technique. In addition, similar actuators, such as a fluidic rolling robot using voltage-driven oscillating liquid [16] and an eccentric actuator driven by stacked electrohydrodynamic pumps [17], were studied for different applications.
Recently, Lilley et al. [18] demonstrated that DBD plasma actuators recovered quickly when they were subjected to direct water deposition on their surfaces such as rain conditions, indicating the potential of DBDPA for practical application. However, practical applications at full scale require a large interaction surface, while the plasma region of an SDBDPA is limited to a few centimeters. With the third electrode connected to a negative DC power supply, a three-electrode plasma actuator based on SDBDPA called sliding discharge plasma actuator (SDPA) can generate plasma, filling the inter-electrode distance. Bychkov et al. [19] analyzed the potential of sliding discharge in airflow control. Louste et al. [20] and Moreau et al. [21,22] investigated the electrical characteristics and ionic wind of SDPA. Particle image velocimetry (PIV) results from Song et al. [23] indicated that a starting vortex and a quasi-steady near-wall jet were induced by sliding discharge. Znamenskaya et al. [24] measured PIV velocity fields behind blast wave along two perpendicular directions. The results showed that 3D shapes of shock waves produced by sliding discharge channels were semi-cylindrical, and the flow fields behind them were homogeneous along the plasma channels directions. Further research showed that the direction of the induced jet could be adjusted by changing the applied voltage [25,26,27]. Zheng et al. [28] investigated a double-side sliding discharge plasma actuator and verified its flow control capability.
Most of the previous studies on SDPA focused on plasma actuation at atmospheric pressure. However, the pressure of practical flight is much lower than atmospheric pressure. The aim of this work is to investigate the characteristics of a sliding discharge plasma actuator at different operating pressures. Discharge morphologies, electrical characteristics, surface temperature distributions, and induced flow structures of an SDPA at different environmental air pressures ranging from 101 to 38 kPa are reported in this study. The study on the performance of sliding discharge under low pressures is helpful for its application to practical flow control, such as drag reduction, flow separation control, and anti-icing.
2. Experimental Setup
A schematic of an SDPA is shown in Figure 1a. The dielectric layer was a 2 mm thick PMMA (polymethyl methacrylate) plate with 200 mm in length and 150 mm in width. All three electrodes were made of thin copper foils with a thickness of about 0.06 mm and a span of 100 mm. These electrodes were symmetrically mounted on the dielectric layer with a lateral spacing of 1 mm. The width of the air exposed (electrode 1 and 3) and grounded (electrode 2) electrodes were 5 and 58 mm, respectively. The grounded electrode was encapsulated with two layers of Kapton tape to prevent plasma generation on the ground side.
An AC power supply (CTP-2000K, 0~30 kV, 5~25 kHz) and a negative DC power supply (CTP-2000 KB, −20–0 kV) were connected to electrodes 1 and 3, respectively, while electrode 2 was grounded. The applied voltage and discharge current of electrode 1 and 3 were measured by a high voltage probe (Tektronix P6015A, 1000:1, 75 MHz) and a current transducer (Pearson 6600, 0.1 V/A, 120 MHz) connected to an oscilloscope (Tektronix MSO56), respectively. A Nikon D750 camera with a 6016 × 4016 pixel resolution was placed 0.5 m above the actuator to photograph its discharge morphology. Surface temperature measurements were obtained with a FLIR T630sc infrared camera in the 7.5~13 μm spectral range at a room temperature of 10 ℃. The camera has a resolution of 640 × 480 pixels. Infrared emission of the dielectric surface, which is a function of its temperature, was recorded by the camera. The highest accuracy for T630sc is ±1 % of the reading with the standard temperature measurement range of −40~150 °C. A two-dimensional LaVision PIV system was applied to investigate the flow induced by the SDPA, see Figure 1b. One Vlite 2000 laser system was used to generate a pair of light sheets with a wavelength of 532 nm. The particle images were acquired by Imager ProX CCD camera with Nikon AF NIKKOR 50 mm f1:1.8D lens. The PIV system worked at a frequency of 7 Hz with a time delay between two image frames of 100 μs. A particle generator was used to seed the flow. PIV data processing was performed with DaVis 8.1 software. Each image was divided into a decreasing interrogation window size of 64 × 64–32 × 32 pixels with 50% overlap. Time-averaged velocity fields were computed with 100 instantaneous velocity fields. A sealed chamber adjustable in pressure with three optical observation windows mounted on the side was operated down to 20 kPa by connecting it to an external pump. An infrared emission transmissible window was embedded on the top plate of the chamber for surface temperature measurement. A digital manometer was used to measure the internal static pressure. The size of the pressure chamber was 340 × 340 × 340 mm. The exciting voltage and frequency of electrode 1 (V1) were fixed at 15 kV and 7.8 kHz, and the supplied voltage of electrode 3 (V3) was –15 kV in this work.
3. Results and Discussion
Figure 2 shows discharge morphology photographs under different pressures. A 3 mm discharge region was formed downstream electrode 1 at 101 kPa. It extended to about 10 mm with several bright spots at electrode 3 when the pressure dropped to 75 kPa. This plasma extension is consistent with previous studies [6,7]. At 54 kPa, the plasma region filled the 60 mm gap between electrodes 1 and 3, indicating the formation of stable sliding discharge. The discharge near electrode 1 was much stronger than electrode 3, and the plasma region seemed to be divided into a plume shape, which should be the visual superposition of filamentary discharge during the positive-going cycle and uniform glow mode discharge during the negative-going cycle. When the pressure was further reduced to 38 kPa, the discharge became more intense, and the plume division became more apparent, which could be determined from the stronger light emission. In addition, a discharge channel connected a bright spot at electrode 3 to the filament at electrode 1. This discharge channel changed into arc discharge connecting electrode 1 and 3 if the pressure decreased or the applied voltage rose, making it a ‘potential-arc-discharge’. Consequently, the sliding discharge was no longer stable because of the transition to arc discharge.
Voltage and current curves for a single cycle at different pressures are presented in Figure 3. Current pulses corresponding to micro-discharges at atmospheric pressure mainly appear during the positive-going cycle. Most of them have a lifetime of about 10 ns. As the ambient pressure decreased, the number and amplitude of the current pulses increased, and the plasma ignited earlier. Abe et al. [6] reported that lower pressure engenders a shorter pulse height. This difference is due to the discharge at electrode 3. In Figure 3d, many positive current pulses exceed 100 mA, much higher than that at 101 kPa (Figure 3a), and the width of a single pulse can reach microsecond level, which is in accord with the ‘potential-arc-discharge’ in Figure 2. Additionally, noticeable negative pulses emerge during the negative-going cycle. Based on the results above, a stronger plasma discharge is formed. Power consumption per unit length for one cycle can be computed with:
where and are voltage and current versus time, respectively, is the waveform period, and is the length of the electrode. The results are shown in Figure 3e. The maximum is 3.68 W/cm at 38 kPa, while the minimum is 0.35 W/cm at 101 kPa. The power consumption increases approximately linearly as pressure decreases.
Figure 4 shows the voltage and current of electrode 3 at different pressures. The time range of the x-axis in Figure 4 is the same as that in Figure 3a–d. As stated above, the negative DC supply connected to electrode 3 was fixed at –15 kV in all cases. Thus, only one voltage curve is shown in Figure 4. At 101 kPa, the actuator worked as a typical 2-electrode DBD actuator, and no discharge ignited at electrode 3 so that there was no apparent current pulse on the current curve. At 75 kPa, several bright spots can be seen at electrode 3 in Figure 2. Scattered current peaks corresponding to these discharge spots appear on the curve. When the pressure dropped to 54 kPa, the number and amplitude of current pulses increased during both positive and negative going cycles of V1. At 38 kPa, the current waveform of electrode 3 changed significantly. Compared with the current curve at 54 kPa, the current peaks at 38 kPa increased further during the positive going cycle of V1. The width of one single current pulse of electrode 3 at 38 kPa could reach the hundreds of nanoseconds level. However, pulses could hardly be seen during the negative-going cycle of V1, indicating that the discharge almost quenched during the negative-going cycle. Note that the high-width current pulses of electrode 1 and electrode 3 occurred at the same time in the current waveform, which indicates a discharge channel with more intensity on the surface of the actuator. This phenomenon is consistent with the ‘potential-arc-discharge’ presented above.
Figure 5 represents the surface temperature contours at 5 s after the actuation for the SDPA at different pressures. Figure 5a,b show that the temperature decreased gradually from electrode 1 to electrode 3. At 54 kPa, stable sliding discharge was developed between the two exposed electrodes, which led to a large area temperature rise covering the inter-electrode distance. Relative high-temperature spots occurred at electrode 3. The surface temperature further increased when the pressure was reduced to 38 kPa. However, a remarkable yellow line connecting the two exposed electrodes can be seen in Figure 5d. It represents an even higher temperature region than both sides. Additionally, higher temperature means more intensive discharge. Hence, the discharge in this region should be much stronger than dielectric barrier discharge and sliding discharge but not as intensive as arc discharge. Considering its position and shape, this remarkable yellow line is proof of the ‘potential-arc-discharge’ developed at 38 kPa in Figure 2. It can be explained by the theory proposed by Durscher et al. [13]. The electron temperature rise causes an increase in the ionization rate constant, electron number density, vibrational temperature, and air temperature. The air temperature rise will finally increase the electron temperature again. This positive feedback loop can result in an unbounded growth of these parameters and a contraction of streamers. Consequently, influenced by this phenomenon, a ‘low-temperature hole’ is produced, resulting in inhomogeneous temperature distribution on the actuator surface.
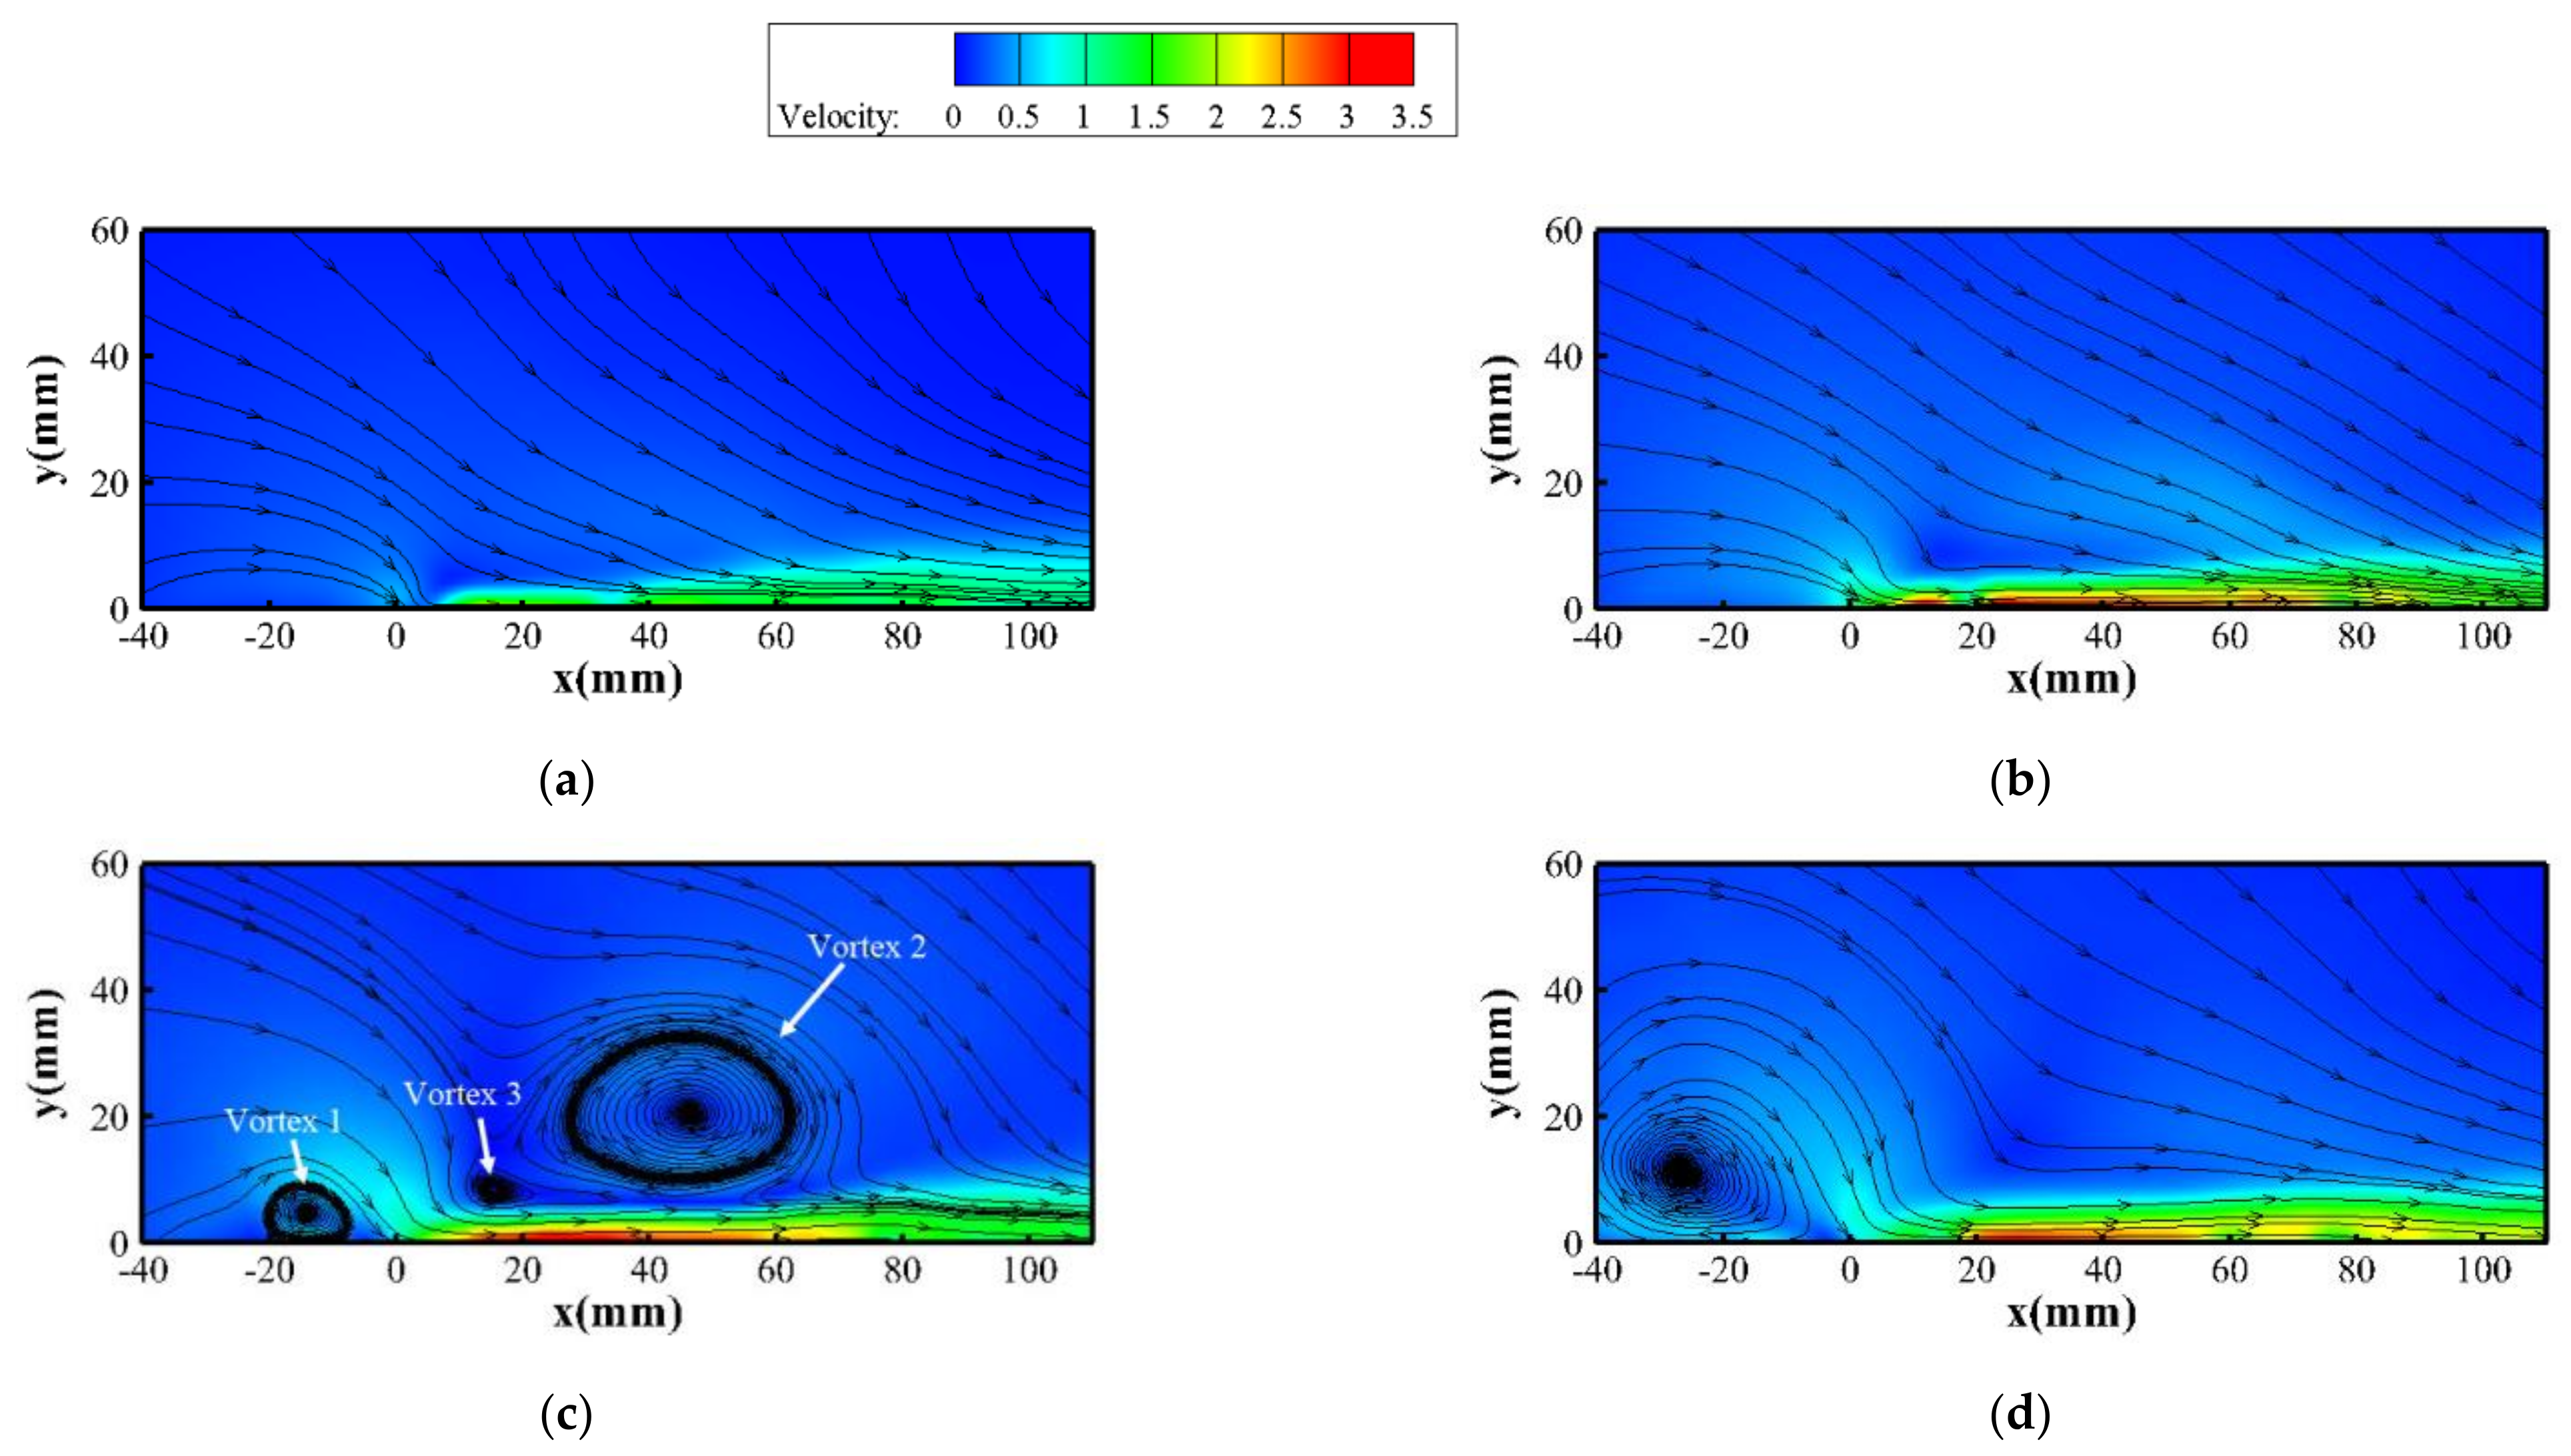
The flow structures induced by the SDPA at different pressures are shown in Figure 6. Electrodes 1 and 3 are located at x = 0 and 60 mm, respectively. A wall jet from electrode 1 to electrode 3, called ionic wind, was developed at 101 kPa and 75 kPa (Figure 6a and Figure 6b, respectively). Its thickness increased gradually due to diffusion and viscous effects. The maximum velocity at 75 kPa was 3.3 m/s, higher than at 101 kPa.
When the pressure dropped to 54 kPa, the induced flow changed significantly as different vortices arose in the flow field. In Figure 6c, Vortex 1 outside electrode 1, Vortex 2 above the wall tangential jet, and Vortex 3 between the main flow and Vortex 2 can be clearly observed in the measurement plane. The maximum velocity of the wall jet was 3.26 m/s. The maximum velocity barely decreased compared with that at 75 kPa. At 38 kPa (Figure 6d), Vortex 1 had a more extensive interaction area, and the vortex core moved upstream. The maximum velocity dropped to 3.04 m/s, yet still higher than that at 101 kPa. As pressure decreased, the maximum induced flow speed initially increased and then decreased. This result is consistent with the studies on DBD plasma actuators at low pressure [6,7].
As shown in Figure 2, at 101 kPa and 75 kPa, no plasma ignited outside electrode 1. However, bright plasma ignition could be seen at 54 kPa and 38 kPa. This outer discharge was responsible for the formation of Vortex 1. At 54 kPa, the inhomogeneous opposite discharge induced a weak wall jet from electrode 1 to the dielectric plate edge. Combined with the suction effect and main flow above electrode 1, Vortex 1 was then rolled up. At 38 kPa, the opposite discharge became homogeneous and more intensive. The induced wall jet attained a higher speed. Hence, Vortex 1 had a larger interaction area. The formation of Vortex 2 at 54 kPa can also be inferred from Figure 2. The main difference between the discharge morphology at 54 kPa and 75 kPa was the plasma discharge at electrode 3 under 54 kPa. Meanwhile, the main difference between the flow structures at 54 kPa and 75 kPa was the vortices above the wall jet at 54 kPa. It can be concluded that the opposite electrohydrodynamic (EHD) force produced by electrode 3 was responsible for forming Vortex 2. Consequently, Vortex 3 was induced under the friction and compression of the main flow and Vortex 2. As stated earlier in this work, a ‘potential-arc-discharge’ arose at 38 kPa. This unique phenomenon has spatial and temporal influences on the performance of sliding discharge. Spatially, the discharge filament formed at the edge of electrodes and weakened the discharge intensity at the central region of the actuator, including the PIV measurement plane. Temporally, this discharge occurred during the positive-going cycle of V1, leading to the discharge quench of electrode 3 during the negative-going cycle. Both the spatial and the temporal influence weakened the EHD force produced by electrode 3 in the laser plane. Therefore, there was no sufficient body force to oppose that from electrode 1. The flow between electrode 1 and electrode 3 at 38 kPa was then a wall jet and Vortex 2 and Vortex 3 in Figure 6c disappeared, similar to that at 101 kPa and 75 kPa.
4. Conclusions
This paper aimed to explore the characteristics of sliding discharge plasma actuators at different operating pressures, including discharge morphologies, electrical characteristics, surface temperature, and induced flow fields. As ambient pressure decreases, the plasma extension is elongated. A stationary sliding discharge is formed at 54 kPa, with the plasma region visually divided into several plumes. The amplitude, width, and number of current pulses for electrode 1 increase with decreasing pressure, leading to an approximately linear increase in power consumption. Vortex structures and a wall jet induced at 54 kPa by the SDPA prove the advantage of sliding discharge for practical flight flow control at low pressure. A ‘potential-arc-discharge’ generated at 38 kPa causes a velocity decrease compared to 54 kPa and an inhomogeneous surface temperature distribution composed of a high-temperature line and a ‘low-temperature hole.’ Methods of preventing ‘pre-arc-discharge’ need further investigation.
Author Contributions
Conceptualization, Q.S., X.G., Z.L., Z.S. (Zhiwei Shi), Z.S. (Zhikun Sun) and K.C.; methodology, Q.S., X.G. and Z.L.; software, Q.S.; validation, Q.S; formal analysis, Q.S.; investigation, Q.S. and Z.S. (Zhikun Sun); resources, X.G., Z.S. (Zhiwei Shi) and K.C.; data curation, Q.S.; writing—original draft preparation, Q.S.; writing—review and editing, Q.S., Z.S. (Zhikun Sun) and Z.S. (Zhiwei Shi); visualization, Q.S. and Z.L.; supervision, Z.S. (Zhiwei Shi) and K.C.; project administration, X.G., Z.S. (Zhiwei Shi), and K.C.; funding acquisition, Q.S. and Z.S. (Zhiwei Shi). All authors have read and agreed to the published version of the manuscript.
Funding
This work was supported by the Foundation of Graduate Innovation Center in NUAA (No. kfjj20170117). This work was supported by the Fundamental Research Funds for the Central Universities.
Institutional Review Board Statement
Not applicable.
Informed Consent Statement
Not applicable.
Data Availability Statement
The data presented in this study are available on request from the corresponding author.
Conflicts of Interest
The authors declare no conflict of interest.
References
- Roth, J.; Sherman, D.; Wilkinson, S. Boundary layer flow control with a one atmosphere uniform glow discharge surface plasma. In Proceedings of the 36th AIAA Aerospace Sciences Meeting and Exhibit, Reno, NV, USA, 12–15 January 1998; p. 328. [Google Scholar] [CrossRef] [Green Version]
- Corke, T.C.; Post, M.L.; Orlov, D.M. Single dielectric barrier discharge plasma enhanced aerodynamics: Physics, modeling and applications. Exp. Fluids 2009, 46, 1–26. [Google Scholar] [CrossRef]
- Benard, N.; Moreau, E. Electrical and mechanical characteristics of surface AC dielectric barrier discharge plasma actuators applied to airflow control. Exp. Fluids 2014, 55, 1–43. [Google Scholar] [CrossRef] [Green Version]
- Kotsonis, M. Diagnostics for characterisation of plasma actuators. Meas. Sci. Technol. 2015, 26, 092001. [Google Scholar] [CrossRef]
- Benard, N.; Moreau, E. Role of the electric waveform supplying a dielectric barrier discharge plasma actuator. Appl. Phys. Lett. 2012, 100, 193503. [Google Scholar] [CrossRef]
- Abe, T.; Takizawa, Y.; Sato, S.; Kimura, N. Experimental study for momentum transfer in a dielectric barrier discharge plasma actuator. AIAA J. 2008, 46, 2248–2256. [Google Scholar] [CrossRef]
- Soni, J.; Roy, S. Low pressure characterization of dielectric barrier discharge actuators. Appl. Phys. Lett. 2013, 102, 112908. [Google Scholar] [CrossRef] [Green Version]
- Debien, A.; Benard, N.; Moreau, E. Streamer inhibition for improving force and electric wind produced by DBD actuators. J. Phys. D: Appl. Phys. 2012, 45, 215201. [Google Scholar] [CrossRef]
- Procházka, P. Vortex Structures Generated by Plasma DBD Actuator; Scholars’ Press: Chisinau, Republic of Moldova, 2019. [Google Scholar]
- Wu, Y.; Li, Y.; Jia, M.; Song, H.; Liang, H. Effect of pressure on the emission characteristics of surface dielectric barrier discharge plasma. Sensors Actuators A Phys. 2013, 203, 1–5. [Google Scholar] [CrossRef]
- Geuns, R.; Goekce, S.; Plyushchev, G.; Leyland, P.; Pimentel, R. Understanding SDBD actuators: An experimental study on plasma characteristics. In Proceedings of the 45th AIAA Plasmadynamics and Lasers Conference, Atlanta, GA, USA, 16–20 June 2014. [Google Scholar]
- Joussot, R.; Boucinha, V.; Weber-Rozenbaum, R.; Rabat, H.; Leroy-Chesneau, A.; Hong, D. Thermal Characterization of a DBD Plasma Actuator: Dielectric Temperature Measurements Using Infrared Thermography. In Proceedings of the 40th Fluid Dynamics Conference and Exhibit, Chicago, IL, USA, 28 June–1 July 2010; p. 5102. [Google Scholar] [CrossRef]
- Durscher, R.; Stanfield, S.; Roy, S. Characterization and manipulation of the “saturation” effect by changing the surface temperature of a dielectric barrier discharge actuator. Appl. Phys. Lett. 2012, 101, 252902. [Google Scholar] [CrossRef] [Green Version]
- Meng, X.; Hu, H.; Li, C.; Abbasi, A.A.; Cai, J.; Hu, H. Mechanism study of coupled aerodynamic and thermal effects using plasma actuation for anti-icing. Phys. Fluids 2019, 31, 037103. [Google Scholar] [CrossRef] [Green Version]
- Tian, Y.; Zhang, Z.; Cai, J.; Yang, L.; Kang, L. Experimental study of an anti-icing method over an airfoil based on pulsed dielectric barrier discharge plasma. Chin. J. Aeronaut. 2018, 31, 1449–1460. [Google Scholar] [CrossRef]
- Mao, Z.; Asai, Y.; Yamanoi, A.; Seki, Y.; Wiranata, A.; Minaminosono, A. Fluidic rolling robot using voltage-driven oscillating liquid. Smart Mater. Struct. 2022, 31, 105006. [Google Scholar] [CrossRef]
- Mao, Z.-B.; Asai, Y.; Wiranata, A.; Kong, D.-Q.; Man, J. Eccentric actuator driven by stacked electrohydrodynamic pumps. J. Zhejiang Univ. A 2022, 23, 329–334. [Google Scholar] [CrossRef]
- Lilley, A.J.; Roy, S.; Michels, L. Performance recovery of plasma actuators in wet conditions. J. Phys. D Appl. Phys. 2022, 55, 155201. [Google Scholar] [CrossRef]
- Bychkov, V.; Kuz’min, G.; Minaev, I.; Rukhadze, A.; Timofeev, I. Sliding discharge application in aerodynamics. In Proceedings of the 41st Aerospace Sciences Meeting and Exhibit, Reno, NV, USA, 6–9 January 2003; p. 530. [Google Scholar]
- Louste, C.; Artana, G.; Moreau, E.; Touchard, G. Sliding discharge in air at atmospheric pressure: Electrical properties. J. Electrost. 2005, 63, 615–620. [Google Scholar] [CrossRef]
- Moreau, E.; Sosa, R.; Artana, G. Electric wind produced by surface plasma actuators: A new dielectric barrier discharge based on a three-electrode geometry. J. Phys. D Appl. Phys. 2008, 41, 115204. [Google Scholar] [CrossRef]
- Moreau, E.; Louste, C.; Touchard, G. Electric wind induced by sliding discharge in air at atmospheric pressure. J. Electrost. 2008, 66, 107–114. [Google Scholar] [CrossRef]
- Song, H.; Li, Y.; Zhang, Q.; Jia, M.; Wu, Y. Experimental Investigation on the Characteristics of Sliding Discharge Plasma Aerodynamic Actuation. Plasma Sci. Technol. 2011, 13, 608–611. [Google Scholar] [CrossRef]
- Znamenskaya, I.; Glazyrin, F.; Koroteeva, E. PIV investigation of low-pressure pulse discharge flow. In Proceedings of the 10th Pacific Symposium on Flow Visualization and Image Processing (PSFVIP-10), Naples, Italy, 15–18 June 2015; University of Naples Federico II: Naples, Italy, 2015; p. 153-1. [Google Scholar]
- Sosa, R.; Arnaud, E.; Mémin, E.; Artana, G. Study of the flow induced by a sliding discharge. IEEE Trans. Dielectr. Electr. Insul. 2009, 16, 305–311. [Google Scholar] [CrossRef] [Green Version]
- Debien, A.; Benard, N.; Moreau, E. Electric wind produced by sliding discharges. In Proceedings of the 2nd ISNPEDADM New Electrical Technologies for Environment, Nouméa, France, 15–16 January 2011. [Google Scholar]
- Dong, H.; Li, Z.; Geng, X.; Shi, Z.; Sun, Q. Study of the airflow induced by a sliding discharge plasma actuator. Mod. Phys. Lett. B 2019, 33, 1950011. [Google Scholar] [CrossRef]
- Zheng, B.; Ke, X.; Ge, C.; Zhu, Y.; Wu, Y.; Liu, F.; Luo, S. Electrical and Flow Characteristics of a Double-Side Sliding Pulsed Discharge Plasma Actuator. AIAA J. 2020, 58, 733–746. [Google Scholar] [CrossRef]
Figure 1.
A schematic of the SDPA. (a) w1, w2, w3, d1, d2, hd, and he are 5, 58, 5, 1, 1, 2, 0.06 mm, respectively; (b) PIV measurement position.
Figure 1.
A schematic of the SDPA. (a) w1, w2, w3, d1, d2, hd, and he are 5, 58, 5, 1, 1, 2, 0.06 mm, respectively; (b) PIV measurement position.
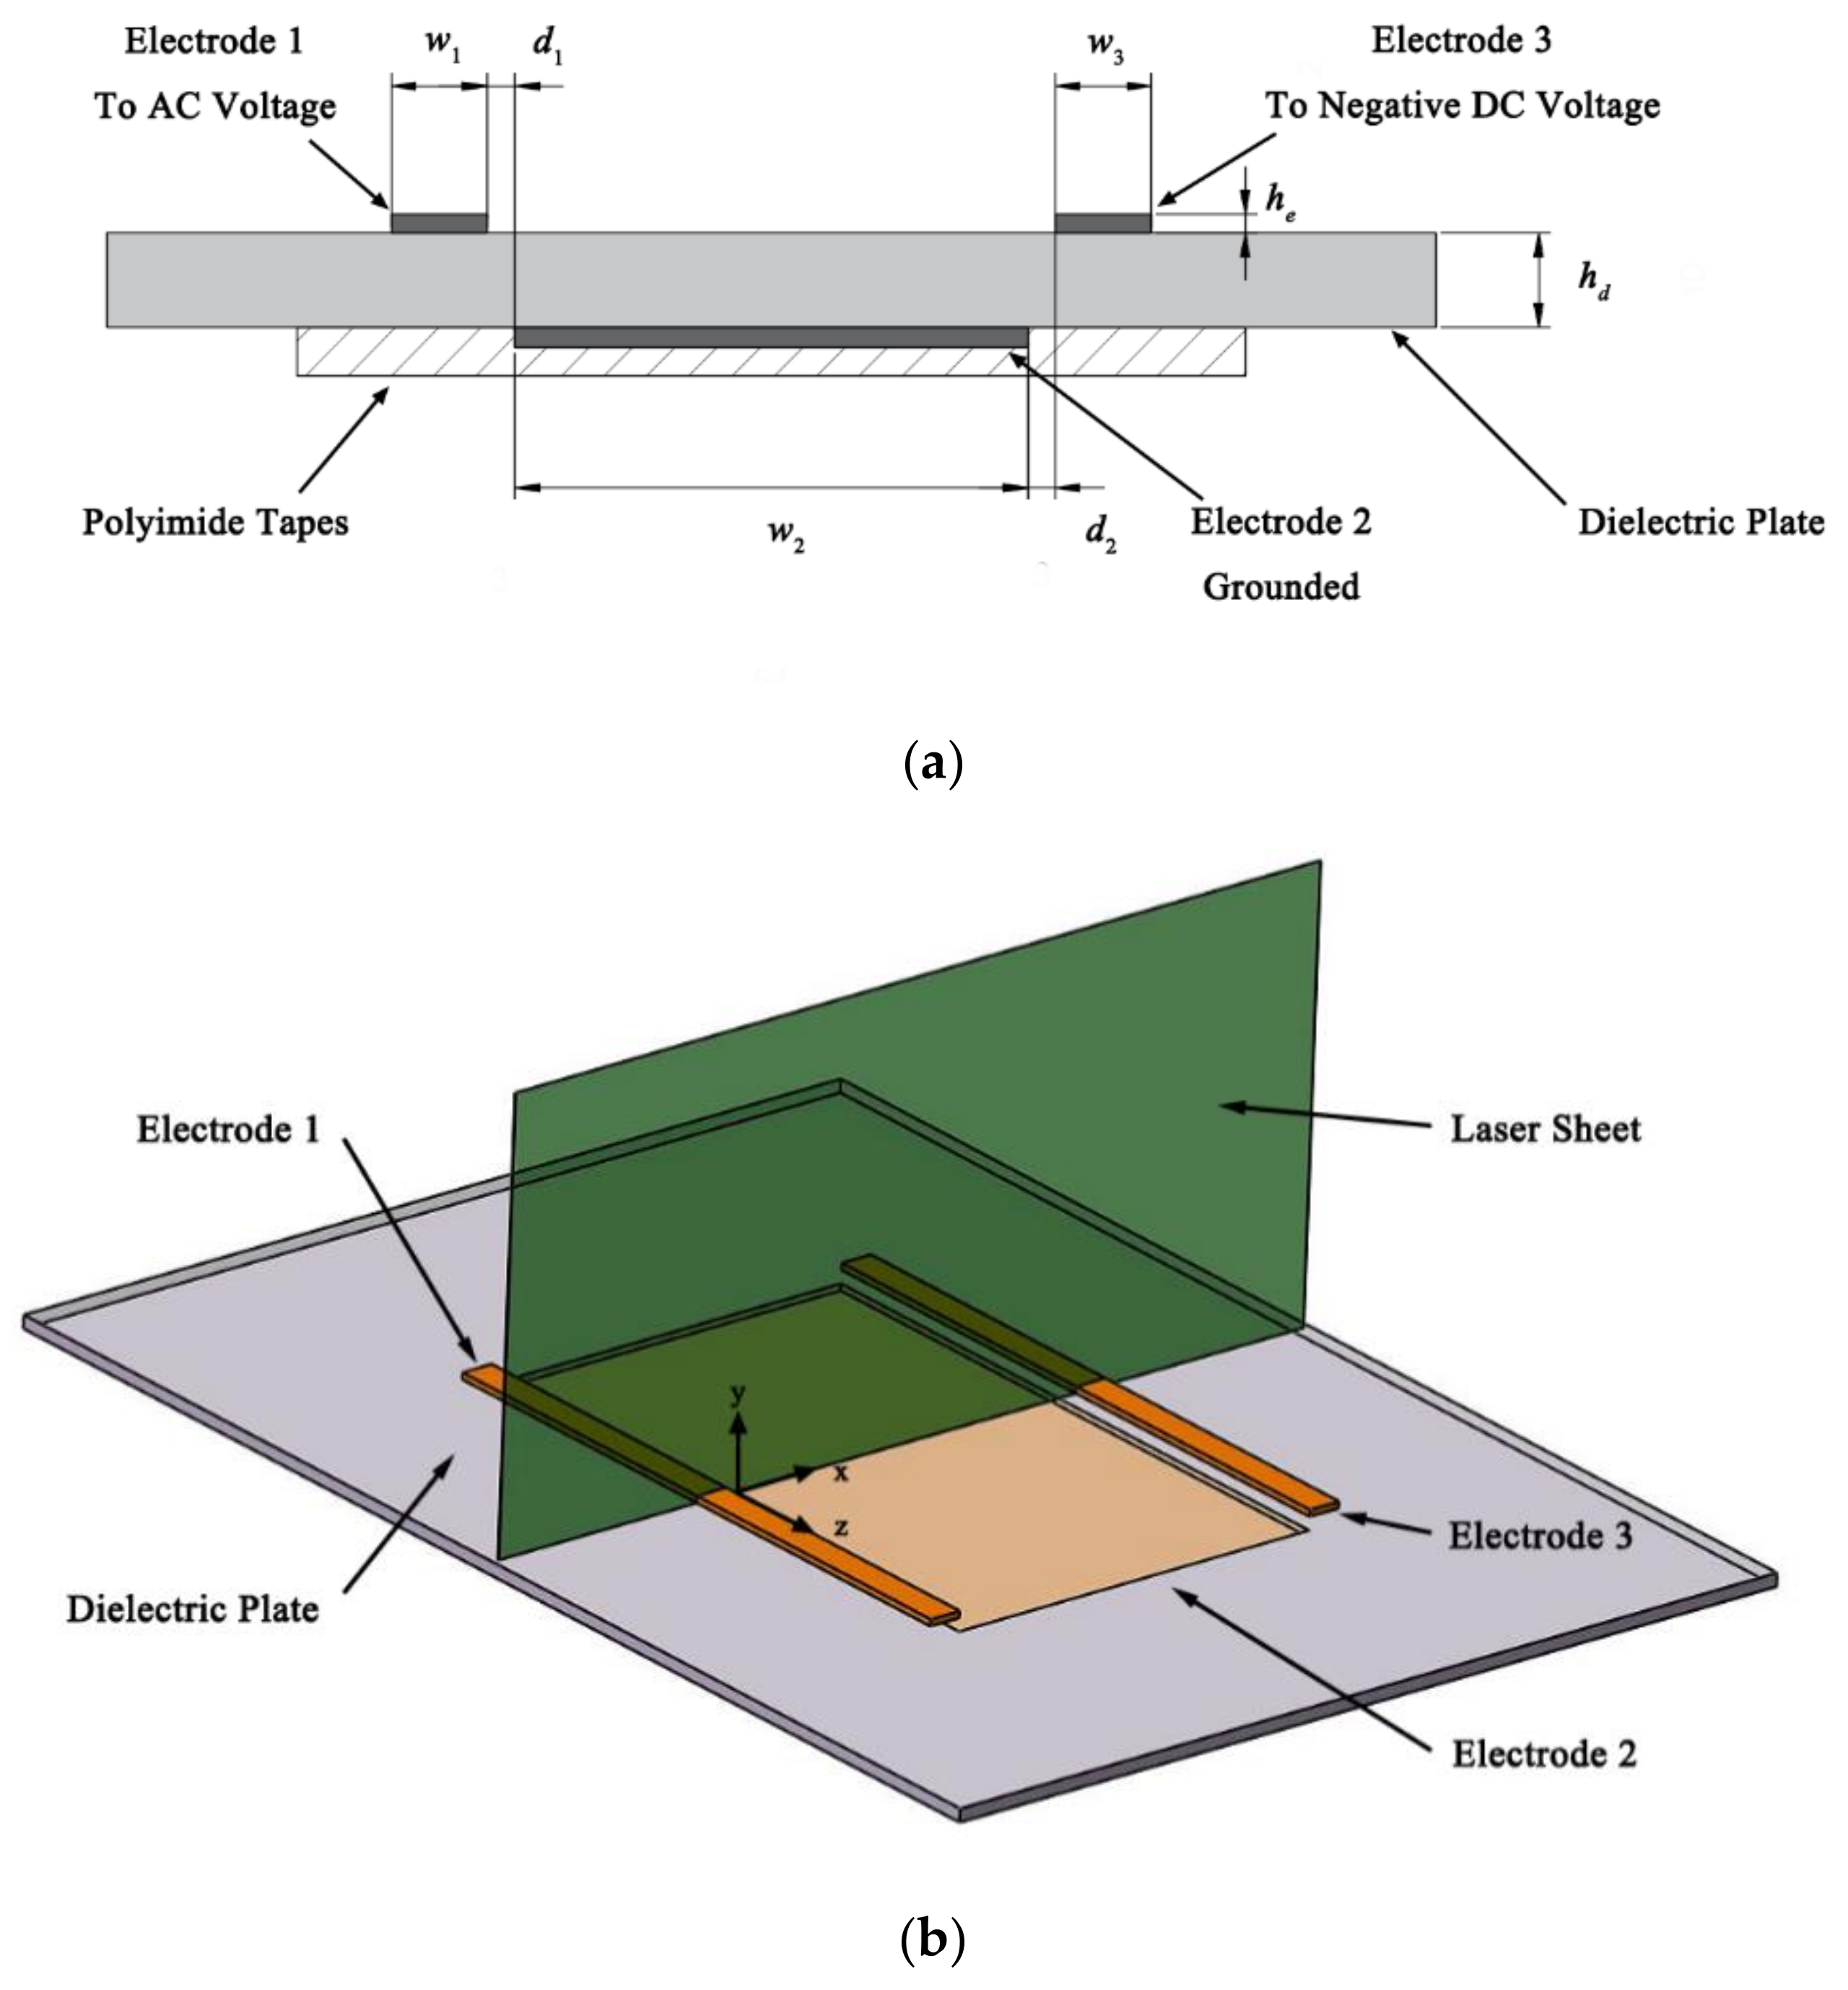
Figure 2.
Plasma discharge morphology at different pressures.

Figure 3.
Voltage and current of electrode 1 at (a) 101 kPa, (b) 75 kPa, (c) 54 kPa, (d) 38 kPa, and (e) power consumption per unit length.
Figure 3.
Voltage and current of electrode 1 at (a) 101 kPa, (b) 75 kPa, (c) 54 kPa, (d) 38 kPa, and (e) power consumption per unit length.

Figure 4.
Voltage and current of electrode 3 at different pressures.
Figure 5.
Surface temperature at (a) 101 kPa, (b) 75 kPa, (c) 54 kPa, and (d) 38 kPa.
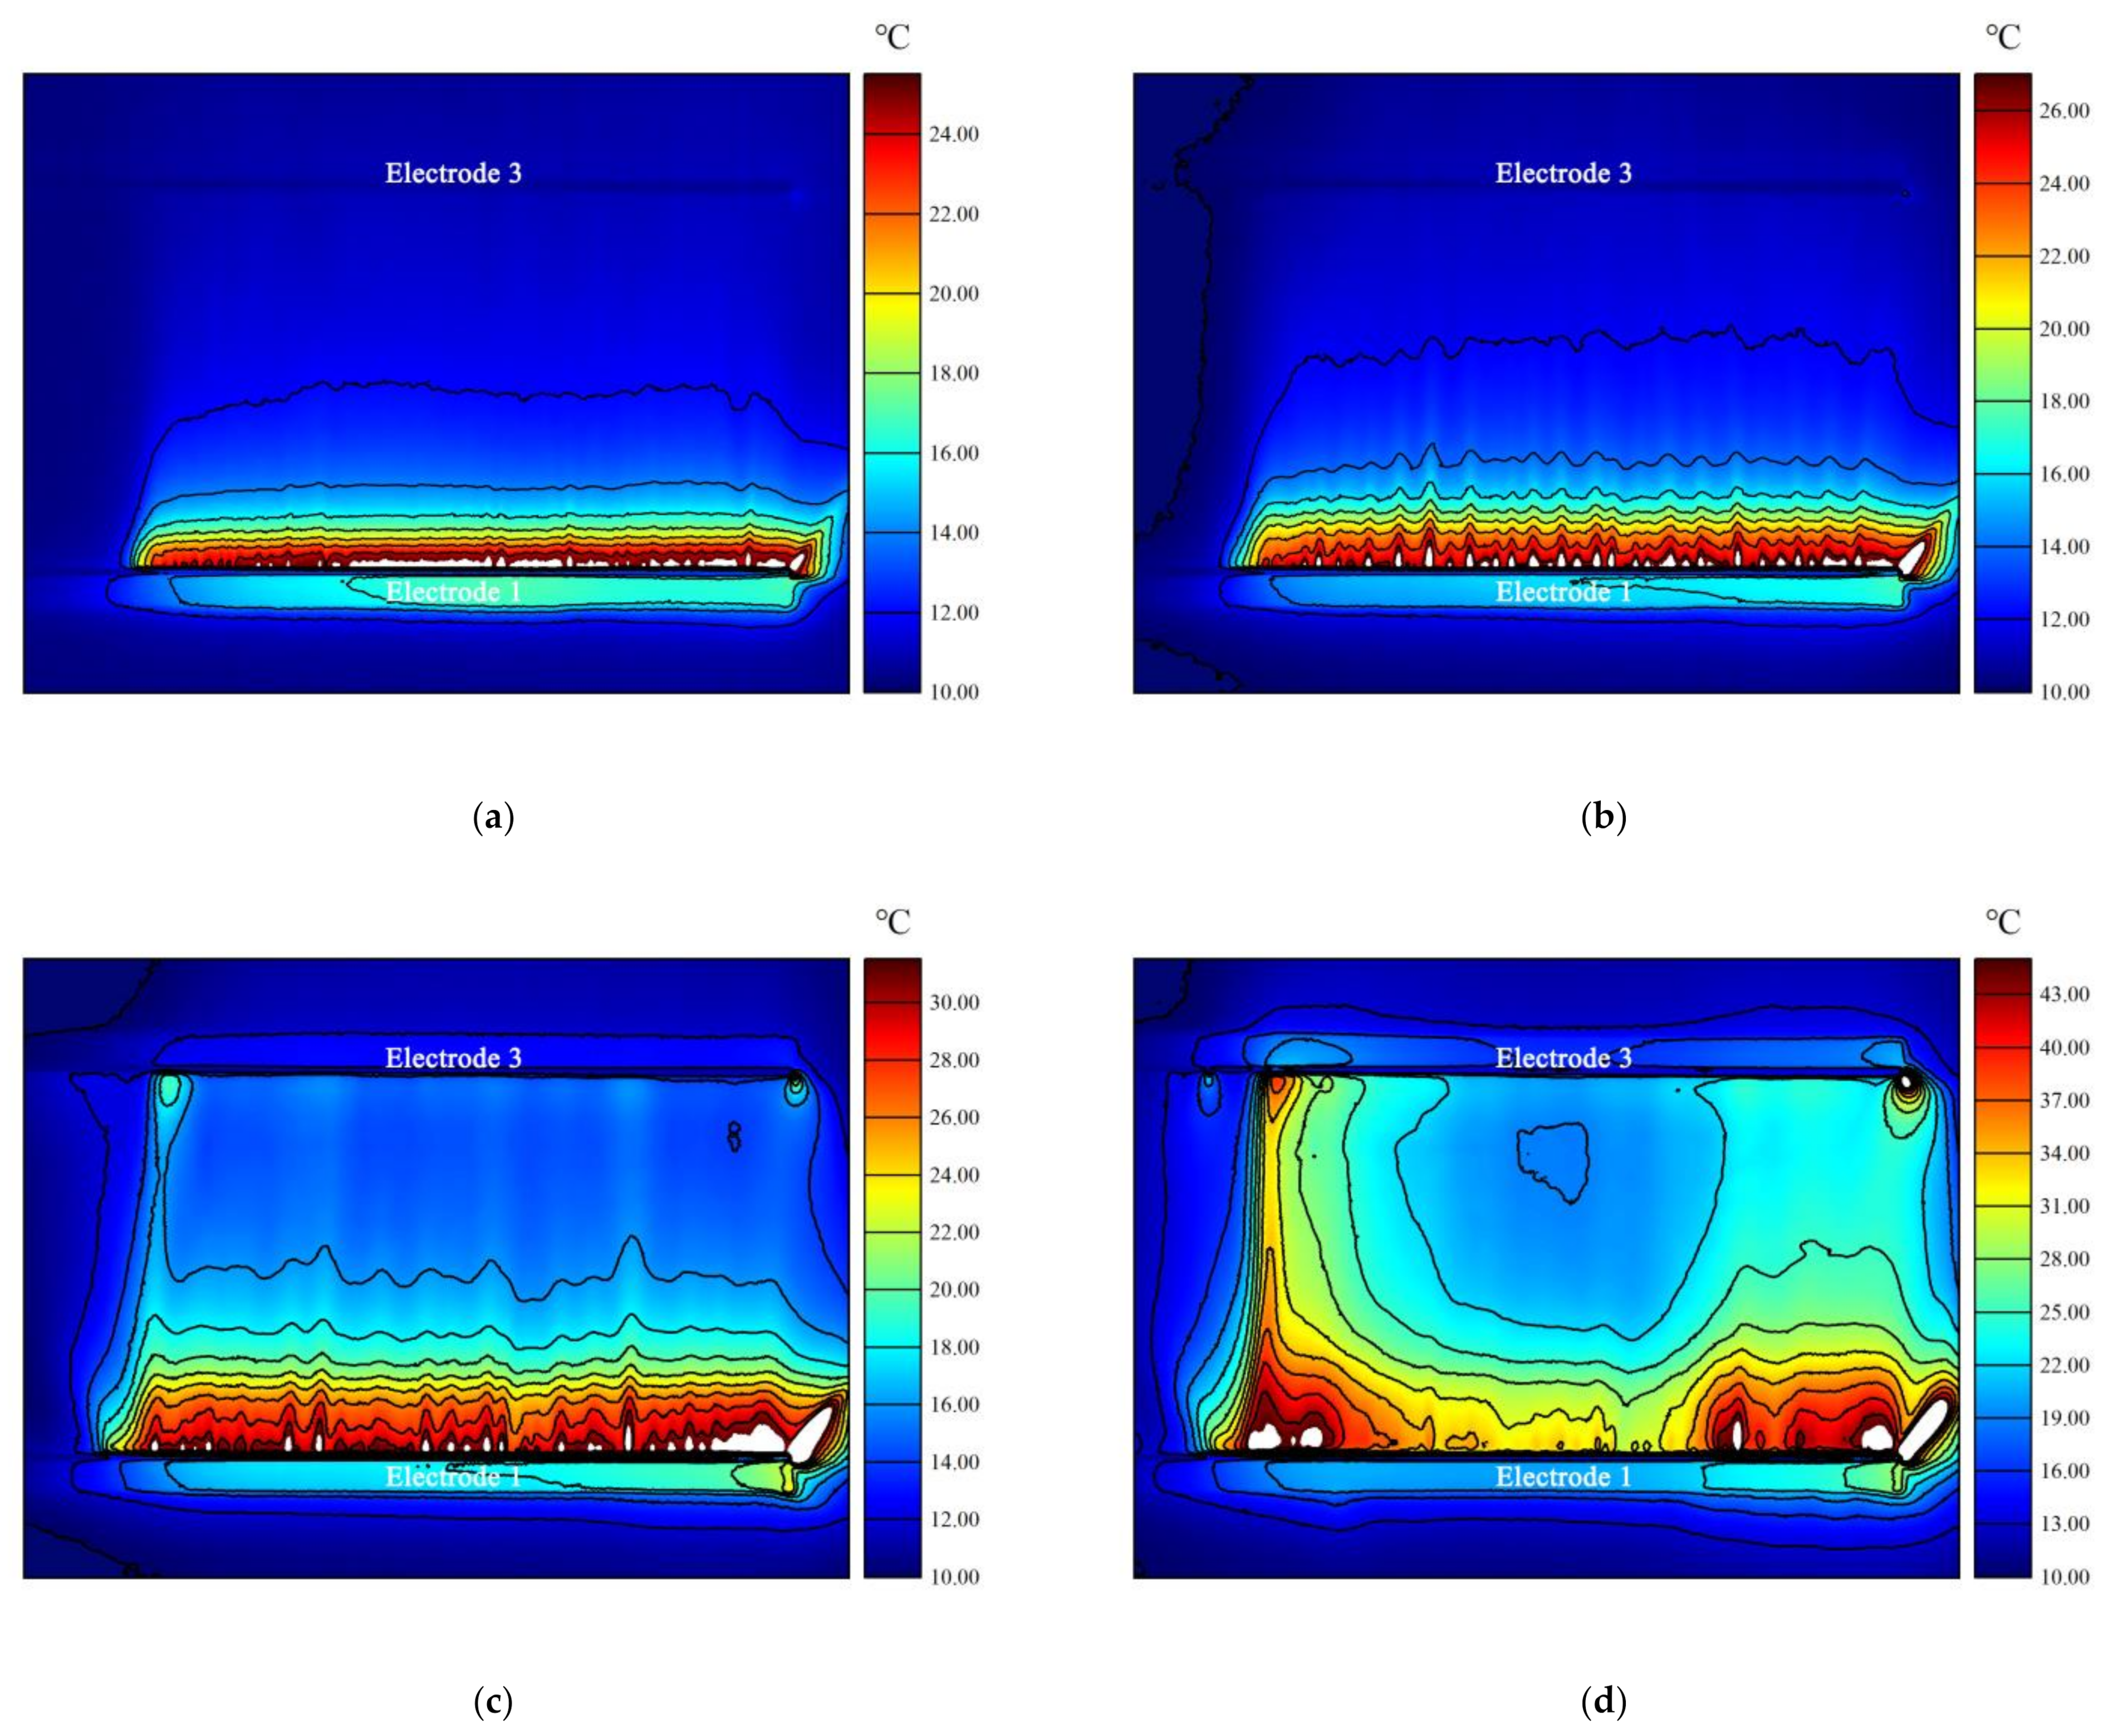
Figure 6.
Time-averaged PIV results at (a) 101 kPa, (b) 75 kPa, (c) 54 kPa, and (d) 38 kPa.
Disclaimer/Publisher’s Note: The statements, opinions and data contained in all publications are solely those of the individual author(s) and contributor(s) and not of MDPI and/or the editor(s). MDPI and/or the editor(s) disclaim responsibility for any injury to people or property resulting from any ideas, methods, instructions or products referred to in the content. |
© 2023 by the authors. Licensee MDPI, Basel, Switzerland. This article is an open access article distributed under the terms and conditions of the Creative Commons Attribution (CC BY) license (https://creativecommons.org/licenses/by/4.0/).
Share and Cite
MDPI and ACS Style
Sun, Q.; Geng, X.; Li, Z.; Shi, Z.; Sun, Z.; Cheng, K. Study on Characteristics of an AC Sliding Discharge Plasma Actuator Operating at Different Pressures. Actuators 2023, 12, 34. https://doi.org/10.3390/act12010034
AMA Style
Sun Q, Geng X, Li Z, Shi Z, Sun Z, Cheng K. Study on Characteristics of an AC Sliding Discharge Plasma Actuator Operating at Different Pressures. Actuators. 2023; 12(1):34. https://doi.org/10.3390/act12010034
Chicago/Turabian StyleSun, Qijie, Xi Geng, Zheng Li, Zhiwei Shi, Zhikun Sun, and Keming Cheng. 2023. "Study on Characteristics of an AC Sliding Discharge Plasma Actuator Operating at Different Pressures" Actuators 12, no. 1: 34. https://doi.org/10.3390/act12010034
Note that from the first issue of 2016, this journal uses article numbers instead of page numbers. See further details here.