
Toward the Trajectory Predictor for Automatic Train Operation System Using CNN–LSTM Network


1
National Engineering Research Center of Rail Transportation Operation and Control System, Beijing Jiaotong University, Beijing 100044, China
2
State Key Lab of Rail Traffic Control & Safety, Beijing Jiaotong University, Beijing 100044, China
*
Author to whom correspondence should be addressed.
Actuators 2022, 11(9), 247; https://doi.org/10.3390/act11090247
Submission received: 5 August 2022
/
Revised: 23 August 2022
/
Accepted: 28 August 2022
/
Published: 31 August 2022
(This article belongs to the Special Issue Advancing Actuators-Based Land Transport Systems: State of the Art and New Technologies)
Abstract
:The accurate trajectory of the train ahead with more dynamic behaviour, such as train position, speed, acceleration, etc., is the critical issue of virtual coupling for future railways, which can drastically reduce their headways and increase line capacity. This paper presents an integrated convolutional neural network (CNN) and long short-term memory (LSTM) hybrid model for the task of trajectory prediction. A CNN–LSTM hybrid algorithm has been proposed. The model employs CNN and LSTM to extract the spatial dimension feature of the trajectory and the long-term dependencies of train trajectory data, respectively. The proposed CNN–LSTM model has superiority in achieving collaborative data mining on spatiotemporal measurement data to simultaneously learn spatial and temporal features from phasor measurement unit data. Therefore, the high-precision prediction of the train trajectory prediction is achieved based on the sufficient fusion of the above features. We use real automatic train operation (ATO) collected data for experiments and compare the proposed method with recurrent neural networks (RNN), recurrent neural networks (GRU), LSTM, and stateful-LSTM models on the same data sets. Experimental results show that the prediction performance of long-term trajectories is satisfyingly accurate. The root mean square error (RMSE) error can be reduced to less than 0.21 m, and the hit rate achieves 93% when the time horizon increases to 4S, respectively.
1. Introduction
The increasing urban traffic congestion problem necessitates more rigorous requirements for train operation effectiveness. Railway transport is believed to have the potential to improve the efficiency of passenger and cargo transportation and alleviate traffic congestion. One efficient measure to improve the train operation capacity is to reduce the distance of train separation, allowing more trains to be configured under a fixed railway network structure.
The current principle, established in about 1870, is that the following train must always be able to stop within the distance known to be clear ahead, assuming that the train ahead might be stationary in its last know position. Therefore, the minimum headway during train operation is designed as the emergency braking distance, which limits the train operation density. The separation could be reduced on the assumption that the leading train is unlikely to stop dead. The concept of virtual coupling is thus gaining popularity because it builds on the principle that trains are separated by a relative braking distance. This concept requires trains to maintain train-to-train communication and keep the speed of the leading train and the following train synchronized and controlled within the safety margin, as shown in Figure 1a, in which the V2I means vehicle-to-infrastructure communication and V2V means comm vehicle-to-vehicle communication. is the safety margin to be maintained between two trains. For example, in the case of two trains with different characteristics, is the safety distance to be maintained under the difference of braking performance. Therefore, in the train operation scenario under this concept, it is necessary to refer to the future state of train A at the time the follower train B has crossed the entire coordination distance, as shown in Figure 1b. During the coupling operations, the train shall therefore consider such a trajectory prediction and not the current position and speed of the leading train [1].
In the past few decades, most of the research on trajectory prediction has been based on traditional physical model-based and machine learning methods. In the first category, the researchers focus on developing the moving object patterns and dynamic models [2,3,4].
Most of these methods are based on Newtonian mechanics models for squared measurements, so their control performance depends on the accuracy of the models. However, the actual train dynamics are pretty complex. For example, describing a conventional seven-body train car requires a complete set of 84 differential equations in addition to various uncertainties and disturbances in train operation [5]. These unmodeled dynamics are challenging to obtain an accurate model of train dynamics, and the application of model-based methods may lead to many unsafe severe events or other unsatisfactory situations [6,7,8]. Therefore, it is necessary and practical to design data-driven train trajectory predictive methods that use only the input and output measurements of the system rather than the physical model.
With the development of information technology, machine learning technologies such as artificial intelligence have been used in time series data prediction, such as stock market prediction [9], data mining [10], trajectory prediction [11], and spatial data mining [12]. Trajectory data also belongs to time series data, so deep learning methods are often used for the trajectory prediction of robots and autonomous driving. In recent years, some scholars have focused on the research of trajectory prediction algorithms based on data driving [13]. This paper deals with the trajectory prediction problem using classification and regression algorithms. The most direct method is to use a three-layer feedforward neural network, also known as multi-layer perceptron (MLP) [14]. The recurrent neural network (RNN) is also often used in trajectory prediction tasks [15,16]. Recurrent neural networks are commonly used to process sequence data and have been applied to a wide range of fields, such as speech recognition [17], text generation [18], and video subtitle [19]. The trajectory data also belongs to the time series data, so it can be processed by the recurrent neural network.
In this paper, inspired by the neural network in nonlinear model processing, we introduce the deep learning model to the train trajectory prediction problem. Deep learning has achieved remarkable results in trajectory prediction, but it usually requires a large amount of CPU power or GPUs, which may be costly. We introduce CNN into the prediction model to reduce the training time and computational overhead. We design five kinds of deep neural networks: recurrent neural network (RNN), gated recurrent units (GRU), LSTM, stateful-LSTM, and CNN–LSTM, to predict the trajectories of the train ahead. These methods have been proved to be effective in time-series prediction [20,21,22,23].
The key contributions of this article are summarized as follows:
- We focus on learning hidden patterns from the normal operation process characterized by high repetition schedules. Therefore, we introduce the convolution layer used to extract local interactions in our previous method [24].
- We implement a modified version of the LSTM trajectory prediction model, which combines the CNN algorithm to train and learn large numbers of trajectories accurately and efficiently when the time horizon rised to 4 s, which means the proposed model performs better in long-term prediction.
- We compared our proposed algorithm with four trajectory prediction algorithms: RNN, GRU, LSTM, and stateful-LSTM-based. Our experiments used seven real-life train trajectory datasets from Chengdu Metro Line 6. To the best of our knowledge, this is the first time such a comprehensive deep learning model has been tested and compared on many real-life railway network trajectories.
The organizational structure of this paper is as follows. Section 2 summarizes two kinds of trajectory prediction methods and mainly introduces the data-driven methods. Section 3 introduces our CNN–LSTM hybrid model. Section 4 introduces the details and results of our experiment in detail. Finally, in Section 5, we summarize our research results and discuss the future direction.
2. Related Work
The moving objects in trajectory prediction research are divided into three categories according to the spatial distribution characteristics: (1) the moving path is not limited, such as aircraft, ships, etc; (2) the moving track is restricted, such as vehicles running on roads; (3) the trajectory of the moving path is scattered, such as with mobile users. Location prediction is mainly divided into the recurrence of the past trajectory and the prediction of the current and future trajectory. The main research objects of this paper are the train with the limited moving track and solving the problem of the future track-prediction of the train simultaneously.
The core of data-driven trajectory prediction is to mine the trajectory characteristics of moving objects, match the trajectory of moving objects with the historical trajectory, find the most similar trajectory path, and predict the future trajectory.
2.1. Statistical Method-Based Trajectory Prediction
This kind of method regards the trajectory data as the sequence data that conforms to the specific distribution and fits the trajectory data based on statistical methods to mine the hidden trajectory patterns. The autoregressive integrated moving average (ARIMA) model predicts the future trajectory of time series through the linear combination of historical data values, data errors, and historical and current values of other time series. Yan et al. extended the ARIMA model with a spatial dimension and applied it to trajectory data constrained by network [25]. ARIMA is a time series analysis algorithm that can control the difference order to deal with a nonlinear trajectory. However, its disadvantage is that it has a poor prediction effect for long-distance trajectory. The Kalman filter (KF) can estimate the system’s state with uncertainties. The improved Kalman filter (IKF) algorithm proposed by Wang et al. [26] can predict the 4D trajectory with high accuracy by estimating the system noise in real-time. The KF model can accurately predict the short-term trajectory, but the initial state and assumptions of the model are crucial for the prediction performance.
Gaussian process regression (GPR) is also an essential method of trajectory prediction. The Gaussian mixture model is composed of several probability density functions based on Gauss and takes the historical motion model as the input condition to predict the future motion trajectory of the target [27,28]. Research [29] decomposes the ship motion into transverse and longitudinal, uses the Gaussian process to model the motion uncertainty in the transverse, estimates the longitudinal acceleration, and predicts the trajectory by the evaluation mean and covariance matrix to describe the ship’s lateral position and its uncertainty. Sean et al. [30] regard time and the trajectory as an independent variable and a one-dimensional Gaussian process, respectively, and define a priori continuous time through a nonlinear time-varying stochastic differential equation driven by white noise. They use a dynamic model to smooth trajectory estimation. GPR has strong applicability and is easy to understand, but the accuracy of prediction results will decline significantly with the passage of prediction time. The hidden Markov model (HMM) can also model time series data. In [31], HMM is used to describe the state transition between trajectory points to predict the trajectory and dynamically change the speed of moving objects. In this case, the model can automatically adjust important parameters to solve the problem of the discontinuous hidden state chain and state retention.
2.2. Deep Learning-Based Trajectory Prediction
The concept of deep learning originates from the artificial neural network. A large number of simulated neurons are combined into a complex system, and the self-learning and adaptive abilities of the neural network are realized by training the weights between neurons. In [32], an artificial neural network is constructed to predict the future trajectory of vehicles. This model inputs the longitudinal and transverse relative speed of the target vehicle and the vehicle position under different road conditions to realize the trajectory prediction of vehicles. Chen et al. [33] use the BP neural network to model the driver’s intention, identify the steering wheel angle corresponding to the driver’s intention, use the obtained steering angle as the control matrix of the Kalman filter model, and predict the vehicle trajectory through this matrix. The recurrent neural network (RNN) is a deep-seated neural network model in which the directional cycle has a specific memory function for input data. Min et al. [34] analyze sequential sensor data using RNN and predict short-term and long-term paths. Lee et al. [35] proposed a future trajectory prediction framework based on RNN, which combines the static and dynamic scene context with the deep inverse optimal control framework to effectively solve the uncertainty in the prediction task and realize the future prediction of multiple objects in complex scenes. RNN has a good effect on the fitting processing and short-term prediction of sequence data, but due to its structural characteristics, RNN has the problem of rapid memory decay. The growth of the input sequence will cause gradient explosion or disappearance.
Long short-term memory (LSTM) has improved RNN to overcome the disadvantage of rapid memory decay. Research [15,36] used an LSTM-based structure with time serial states of the target and ego vehicles. Jinet al. proposed a novel prediction model based on plane stream and a variational self encoder to process time series data [37]. Berenguer et al. [38] extends the social-LSTM model with a context-pooling layer. Altche et al.predict the future longitudinal and lateral trajectories of vehicles on the expressway by introducing long-term and short-term memory (LSTM) neural networks [16]. Alexandre et al. [39] use the LSTM model to predict the trajectory of pedestrians, which is outstanding in sequence prediction. The model adds a “social” pool layer between each step of the LSTM. The pooling layer integrates the hidden states of other pedestrians and passes them on as a part of the hidden states, finally forming the model social LSTM. The gate recurrent unit (GRU) is a simplification of LSTM. The GRU network includes an update gate and resets gate, which can also solve the ordinary RNN gradient disappearance or explosion problem. The algorithm proposed by Duives [40] uses the derivation of the cell sequence to express the discrete cell sequence as a spatial continuous GPS trajectory and then uses GRU to train it to predict the future position of pedestrians. Adege et al. [41] proposed a hybrid of the principal component analysis (PCA) and gated recurrent unit (GRU) algorithms for mobility predictions in a wireless urban area.
Inspired by these papers, which focus on using convolutional LSTM to learn spatiotemporal sequences, we proposed a spatial information representation for trains and a CNN–LSTM hybrid model to generate a long-term prediction trajectory with high accuracy.
3. Methodology
This section combines CNN and LSTM to propose a hybrid model for train-trajectory prediction, called hybrid CNN–LSTM. Before that, we give a brief overview of the fundamental theories of the LSTM and CNN model; these theories contain the essential fundamental theory of data modelling.
3.1. Problem Formulation
We formulate train trajectory prediction as a temporal regression task. Unlike the vehicle, the position on the track of the train is recorded by the odometer, transponder, and other equipment, so the position will continue to increase. At the end of the data sequence, the recorded train position is tens of thousands of times the initial position. In the experiment, we found that the vast data difference hinders the learning of the model and makes the learning effect poor. Therefore, we convert the original train trajectory data into the distance travelled by train in the sampling time.
where is the raw trajectory data. A brief description of the symbols we use is given below. At moment t, the i th train on the track is represented by an odometer as a one-dimensional coordinate . The state of the train is expressed as , where v and u are the velocity and control instruction, respectively. We observe the positions of all vehicles from to , and our goal is to predict their positions from to . Thus, train trajectory prediction can be defined as a sequence generation problem:
Given:
Objective:
Considering the train characteristics of rail trains running strictly according to the plan, we simplify the as , which is the coordinate of the first neighboring train ahead on the same track as our train.
In actual applications, the input for one prediction is only the input of the selected historical step length instead of all the input in the model training process. Therefore, the equation is expressed as
Input:
Output:
3.2. CNN Network
The standard CNN network has four components: the data input layer, the pooling layer, the convolution layer, and the full connection layer, as shown in Figure 2. The locally connected convolutional layers enable CNNs to deal with spatial correlation problems [42] efficiently. The pooling layer makes the CNN generalizable to large-scale problems.
Calculate the value w in the dot product between and the value in kernel matrix p:
where ⊙ denotes the eigenvectors multiplied element by element, is deviation, and f is a nonlinear mapping function that can be set to RELU activation function as follows:
In this paper, a one-dimensional convolution CNN is added to extract the local feature of the trajectory data. Meanwhile, the convolutional layer can accelerate the training speed of the network.
3.3. LSTM Network
The LSTM model was originally proposed by Hochreiter and Schemidhuber in 1997 in the literature [43], which is a variant of the RNN model for addressing long-term dependent information that RNNs cannot handle.
The structure of the LSTM model is shown in Figure 3. The key to LSTM is the state of the cells, where there are only a few linear interaction processes between cells throughout the processing link, and the flow of information can easily remain constant along the processing link. In order to solve the problem of gradient explosion, the LSTM model adds a gate structure to decide which data to remember or forget to change the current unit’s output.
The processing of the data in LSTM model consists of four parts:
3.3.1. Forget
In this part, the LSTM model decides which information to discard using the forget gate layer. The gate structure reads the input generated by the previous cell and the input at the current moment and outputs the result , which represents the degree of reception of the current input(1 means fully retained and 0 means fully discarded). The result represents the degree of reception of the current input data.
3.3.2. Remember
The second step determines which new information will be stored in the current cell’s state information. The sigmoid layer, called the input gate layer, determines the updates and outputs.
Then, the tanh function creates a vector of candidate values for the message:
3.3.3. Update
This part updates the cell state information from to state, and this step is related to the output of the two previous steps
3.3.4. Output
Ultimately, determine which information will be output, which is based on the cell state and also is a filtered version. Another sigmoid layer determines which part of the cell state will be output and multiplies it by the output of the tanh function, that is, between . Finally, the cell will only output the part that is determined to be output.
where ∗ denotes the Hadamard product; denotes the standard logistics sigmoid function; , , are the output of different gates; is the new state of memory cell; is the final state of memory cell; and is the final output of the memory unit. denote the weight matrices in each layer.
3.4. Hybrid CNN–LSTM Model
As mentioned above, CNN is a lightweight model that captures local features, while LSTM is good at dealing with the long memory of time series data. Therefore, we propose a hybrid neural network model integrating CNN and LSTM to solve the trajectory prediction problem. Therefore, a novel idea combines the merits of these two models for better accuracy and shorter time. The overall structure of this hybrid model is shown in Figure 4.
The model shows the process of train trajectory prediction: train historical trajectory data input, data processing, model training, and final predicted trajectory output. We need to perform preprocessing, such as data-anomaly detection and missing trapping, and normalize it before the input. The input data of a traditional neural network constitute a vector, while the input data of CNN and LSTM constitute a time series containing tensors. Hence, we need to add a time step dimension.
We set the historical time steps as 50, and the future time steps are 20, which means 50 consecutive train trajectory data are used to predict the following 20 trajectory data. So, each of our samples is a 50 × 3 matrix. Data processing will be covered in detail in the next section.
These 2n-dimensional input data composed of a series of trajectory points are first fed to the CNN model. We use one-dimensional convolution to extract the spatial feature of the trajectory. The process is shown in the Algorithm 1.
| Algorithm 1 CNN–LSTM model |
Input: observed trajectory data of trains: , where M is the historical time steps. Output: A set of predicted trajectories
|
In the convolution layer, the number of 1 × 3 kernels is 64. The data are sent to the max-pooling layer with a pool size of 2. After a series of repeated convolution pooling work, all of these data will be input to the LSTM model, which consists of three hidden layers with 128 cells in each layer, and a dropout layer is added between the hidden layers. Different activation functions and dropout layers are tested in this structure to get the best results. Finally, the data processed by the CNN and LSTM models will be input to the full connection layer that outputs 20 consecutive train trajectory data at future moments.
4. Experiment and Discussions
In this section, we conduct a comprehensive experimental and comparative study of the baseline and hybrid models proposed in Section 3. First, we introduce the train trajectory data set used in the experiment and the evaluation index used to evaluate the prediction effect. The second is the prediction effect of the RNN, GRU, LSTM, stateful-LSTM, and CNN–LSTM models on different prediction time steps.
4.1. Datasets
We use seven datasets from Chengdu Metro Line 6 to examine whether the prediction models can capture the embedded motion patterns. There are a total of 63,676 trajectories points sampled every 200 ms, with an average speed of 9.00871659 m/s. Since these datasets are sampled at different rates, we apply the existing data interpolation technique to fill the missing data by the proximity data. Then, we perform abnormal data detection based on the Z-score on the data. The Z-score is the standard score, and the distance between the data point and the average value is measured. If the data point is two standard deviations from the average value, the Z-score is 2. When Z-score = 3 is used as the threshold to eliminate abnormal issues, it is equivalent to 3 sigma. We normalized the data to reduce the impact of numerically large data on model learning. The most typical one is the normalization of data, that is, the unified mapping of data to the [0, 1] interval.
where is the normalized data, denotes the minimum value of the feature data, and denotes the maximum value of the feature data.
Our data include 12 different data sets with 187-dimensional features, and each data set has an average of 9000 pieces of data. In the learning and testing of the model, we use different data sets to ensure that the model has a strong generalization ability on the unexpected data set of the training set.
4.2. Evaluation Metrics
We evalute the accurcy of trajectory prediction from two perspectives. The first one is an RMSE that root mean square averages the Euclidean distance between the predicted location and truth location:
where is the truth trajectory point and is the predited locations by the model.
Another performance metric is hit rate. Set the tolerable predition error , which represents the prediction error acceptability we set. If the absolute error between and is smaller than , we call the prediction is a hit.
where hits represent the hit number in the total times and N is the total number of the raw trajectory data.
4.3. Evaluation Setup
In our experimental parameter setting, we use the historical data information of 50 steps to predict the position in the next N time steps, where N changes from 1 to 20. We set to 20 cm to measure the hit rate. All experiments were carried out under the same experimental conditions.
4.4. Comparative Analysis of Experimental Results
The experimental results presented in Figure 5 and Figure 6 are the predicted trajectory comparison of these five models. Table 1 and Table 2 are the RMSE and hit rate, respectively. Given 50 historical points, we report the RMSE and hit rate for the future n steps. We compare the performance of our model with state-of-art methods as well as multiple control settings.
While the performance differences between these models are not significant, it is worth noting that all of our model errors are already low, so some improvement is worthwhile. From the results, we derive the following observations:
The results show that stateful-LSTM produces the highest error in the n = 1 time steps for the root mean square error. RNN and GRU produce better predictions; especially, the RNN model produces the lowest error in prediction shorter than n = 3. In the case of prediction, the horizon is more extended than n = 10; the CNN–LSTM, GRU, and LSTM produce a lower error. As the future time steps n increase from 1 to 10, CNN–LSTM performs better than the other methods.
For the hit rate, in the case of a prediction horizon longer than 2.0 s, the RNN, GRU, and CNN–LSTM models produce a much higher rate. We note that the GRU model produces better predictions than the LSTM model. However, when n increases to 20, the CNN–LSTM model produces the highest rate.
In all experimental models, the change of RMSE shows the same trend; that is, RMSE increases with the increase in prediction steps n. At the same time, the hit rate also shows a similar pattern; that is, the accuracy decreases with the increase in N, which proves that the accurate prediction of long-term trajectory is more challenging than short-term prediction.
Simple-RNN obtains the worst performance in terms of RMSE. The curve may be over-fitting at some points. However, it is interesting that its hit rate is much higher than the stateful-LSTM and LSTM models. One of the possible reasons is that it performs better where the train trajectory is linear, and the prediction effect is poor in the nonlinear trajectory.
GRU also performs poorly in RMSE while performing better in the hit rate. As an improvement of the RNN network, the prediction performance of the LSTM model is predictably better than that of the RNN. The simplified model GRU based on LSTM presents the same performance as LSTM. This can be explained as the improvement of GRU and LSTM models on the gradient problem on the cyclic neural network. Simple-RNN obtains the highest hit rate when n = 1, as well as the GRU model. Moreover, its hit rate decreases more slowly than GRU as the time step increases.
We use CNN–LSTM as a hybrid model baseline. We can see that CNN-LTSM achieves the best performance in terms of RMSE when time steps and the highest hit rate when time steps . In order to better show the prediction effect and the details in Figure 6, we show the loss of CNN–LSTM and LSTM on the verification set in Figure 7. In addition, the training time of CNN–LSTM is shorter than that of other models. In the experiment, we recorded the time spent on training each model. The average time spent on CNN–LSTM was 1061.56 s, while the average time spent on LSTM was 3377.05 s (almost three times that of CNN–LSTM). Therefore, it can be verified that the CNN–LSTM model converges faster than other models (such as LSTM) in the training process. This helps us reduce the model training time and find the most suitable parameters faster. Moreover, we can observe a mountain-like structure; this is possible for the trajectory prediction with a sliding time window. The model is not the most accurate short-term forecasting but produces reliable prediction and control errors within a specific bound. This implies that, with a combination of CNN and LSTM, the hybrid model can handle the long-term prediction of the train trajectory data.
5. Conclusions
Train trajectory prediction is essential for intelligent transportation system (ITS) applications. The importance of this task is emphasized with the emergence of virtual coupling as it requires a future trajectory to plan the control of the following train. We propose to integrate the neural networks of CNN and LSTM as a hybrid model for the task of trajectory prediction.
We conduct detailed analyses of the characteristics of train trajectory in detail and explain how they differ from vehicle and pedestrian trajectory prediction. In addition, we compared RNN, GRU, LSTM, stateful-LSTM, and CNN–LSTM models in terms of predicted position, validation loss, prediction error RMSE, and hit rate. These models are learned and evaluated using the field data, which contains real-world train trajectories from Chengdu Metro Line 6. Our experiment results indicate that CNN–LSTM performs better than the state-of-art techniques. We find that the evolution of the proposed model shows the best prediction accuracy when the time rises to 4 s, while the RNN model shows smaller RMSE when the time horizon is shorter than 1.4 s (n = 7). Moreover, the hybrid CNN–LSTM model obtains the highest hit rate when the time horizon is more extended than 2.0 s (n = 10).
Our in-depth study of the hybrid deep learning methods for train trajectory prediction can potentially benefit the development of many ITS applications, such as the controller optimization of the ATO system and timetable optimization for train arrival time, which are not limited to virtual coupling. Many future research directions can stem from this work. First, we will continue to test the performance of CNN–LSTM over longer horizons. Second, it would be interesting that instead of using CNN to model the relationship between the local features, other types of hybrid models can be explored, such as Markov and MLP.
Author Contributions
Conceptualization, H.L. and T.T.; methodology, Y.H.; software, J.L.; validation, Y.H. and J.L.; formal analysis, Y.H. and J.L.; investigation, Y.H. and J.L.; resources, Y.H. and J.L.; data curation, J.L.; writing—original draft preparation, Y.H.; writing—review and editing, Y.H. and J.L.; visualization, J.L.; supervision, Y.H. and J.L.; project administration, Y.H. and J.L.; and funding acquisition, Y.H. All authors have read and agreed to the published version of the manuscript.
Funding
This research was funded by the Fundamental Research Funds for the Central Universities 2022JBXT000.
Institutional Review Board Statement
Not applicable.
Informed Consent Statement
Not applicable.
Data Availability Statement
Not applicable.
Conflicts of Interest
The authors declare no conflict of interest.
References
- Quaglietta, E.; Wang, M.; Goverde, R.M.P. A multi-state train-following model for the analysis of virtual coupling railway operations. J. Rail Transp. Plan. Manag. 2020, 15, 100195. [Google Scholar] [CrossRef]
- Helbing, D.; Molnár, P. Social force model for pedestrian dynamics. Phys. Rev. E 1995, 51, 4282. [Google Scholar] [CrossRef]
- Morzy, M. Mining Frequent Trajectories of Moving Objects for Location Prediction. In Proceedings of the Machine Learning and Data Mining in Pattern Recognition; Perner, P., Ed.; Springer: Berlin/Heidelberg, Germany, 2007; pp. 667–680. [Google Scholar]
- Qiao, S.; Han, N.; Wang, J.; Li, R.H.; Gutierrez, L.A.; Wu, X. Predicting Long-Term Trajectories of Connected Vehicles via the Prefix-Projection Technique. IEEE Trans. Intell. Transp. Syst. 2018, 19, 2305–2315. [Google Scholar] [CrossRef]
- Kortüm, R. Mechatronic developments for railway vehicles of the future. Control Eng. Pract. 2002, 10, 887–898. [Google Scholar]
- Wang, X.; Tang, T.; Su, S.; Yin, J.; Lv, N. An integrated energy-efficient train operation approach based on the space-time-speed network methodology. Transp. Res. Part E Logist. Transp. Rev. 2021, 150, 102323. [Google Scholar] [CrossRef]
- Shuai, S.A.; Xw, A.; Tao, T.A.; Gw, B.; Yuan, C. Energy-efficient operation by cooperative control among trains: A multi-agent reinforcement learning approach. Control Eng. Pract. 2021, 116, 104901. [Google Scholar]
- Sun, H.; Hou, Z.; Li, D. Coordinated Iterative Learning Control Schemes for Train Trajectory Tracking With Overspeed Protection. IEEE Trans. Autom. Sci. Eng. 2013, 10, 323–333. [Google Scholar] [CrossRef]
- Shahi, T.B.; Shrestha, A.; Neupane, A.; Guo, W. Stock Price Forecasting with Deep Learning: A Comparative Study. Mathematics 2020, 8, 1441. [Google Scholar] [CrossRef]
- Kong, J.; Yang, C.; Wang, J.; Wang, X.; Zuo, M.; Jin, X.; Lin, S. Deep-Stacking Network Approach by Multisource Data Mining for Hazardous Risk Identification in IoT-Based Intelligent Food Management Systems. Comput. Intell. Neurosci. 2021, 2021, 1194565. [Google Scholar] [CrossRef]
- Yin, J.; Ning, C.; Tang, T. Data-driven models for train control dynamics in high-speed railways: LAG-LSTM for train trajectory prediction. Inf. Sci. 2022, 600, 377–400. [Google Scholar] [CrossRef]
- Mishra, B.; Dahal, A.; Luintel, N.; Shahi, T.B.; Panthi, S.; Pariyar, S.; Ghimire, B.R. Methods in the spatial deep learning: Current status and future direction. Spatial Inf. Res. 2022, 30, 215–232. [Google Scholar] [CrossRef]
- Choi, D.; Yim, J.; Baek, M.; Lee, S. Machine learning-based vehicle trajectory prediction using v2v communications and on-board sensors. Electronics 2021, 10, 420. [Google Scholar] [CrossRef]
- Akiyama, T.; Inokuchi, H. Long term estimation of traffic demand on urban expressway by neural networks. In Proceedings of the 2014 Joint 7th International Conference on Soft Computing and Intelligent Systems (SCIS) and 15th International Symposium on Advanced Intelligent Systems (ISIS), Kita-Kyushu, Japan, 3–6 December 2014. [Google Scholar]
- Kim, B.D.; Kang, C.M.; Lee, S.H.; Chae, H.; Kim, J.; Chung, C.C.; Choi, J.W. Probabilistic Vehicle Trajectory Prediction over Occupancy Grid Map via Recurrent Neural Network. In Proceedings of the 2017 IEEE 20th International Conference on Intelligent Transportation Systems (ITSC), Yokohama, Japan, 16–19 October 2017. [Google Scholar]
- Altche, F.; Fortelle, A. An LSTM network for highway trajectory prediction. In Proceedings of the 2017 IEEE 20th International Conference on Intelligent Transportation Systems (ITSC), Yokohama, Japan, 16–19 October 2017. [Google Scholar]
- Graves, A.; Jaitly, N. Towards end-to-end speech recognition with recurrent neural networks. In Proceedings of the International Conference on Machine Learning, Beijing, China, 21–26 June 2014. [Google Scholar]
- Sutskever, I.; Martens, J.; Hinton, G.E. Generating Text with Recurrent Neural Networks. In Proceedings of the International Conference on Machine Learning, Bellevue, WA, USA, 29 June–1 July 2011. [Google Scholar]
- Gao, L.; Guo, Z.; Zhang, H.; Xu, X.; Shen, H.T. Video Captioning with Attention-based LSTM and Semantic Consistency. IEEE Trans. Multimedia 2017, 19, 2045–2055. [Google Scholar] [CrossRef]
- Xiong, X.; Bhujel, N.; Teoh, E.; Yau, W. Prediction of Pedestrian Trajectory in a Crowded Environment Using RNN Encoder-Decoder. In Proceedings of the ICRAI ’19: 2019 5th International Conference on Robotics and Artificial Intelligence, Singapore, 22–24 November 2019. [Google Scholar]
- Liu, H.; Wu, H.; Sun, W.; Lee, I. Spatio-Temporal GRU for Trajectory Classification. In Proceedings of the 2019 IEEE International Conference on Data Mining (ICDM), Beijing, China, 8–11 November 2020. [Google Scholar]
- Alahi, A.; Goel, K.; Ramanathan, V.; Robicquet, A.; Savarese, S. Social LSTM: Human Trajectory Prediction in Crowded Spaces. In Proceedings of the 2016 IEEE Conference on Computer Vision and Pattern Recognition (CVPR), Las Vegas, NV, USA, 27–30 June 2016. [Google Scholar]
- Tba, B.; Adma, C.; Az, A.; Eo, A.; Ph, B. A graph CNN–LSTM neural network for short and long-term traffic forecasting based on trajectory data. Transp. Res. Part C Emerg. Technol. 2020, 112, 62–77. [Google Scholar]
- He, Y.; Lv, J.; Zhang, D.; Chai, M.; Liu, H.; Dong, H.; Tang, T. Trajectory Prediction of Urban Rail Transit Based on Long Short-Term Memory Network. In Proceedings of the 2021 IEEE International Intelligent Transportation Systems Conference (ITSC), Indianapolis, IN, USA, 19–22 September 2021; pp. 3945–3950. [Google Scholar] [CrossRef]
- Yan, Z. Traj-ARIMA: A Spatial-Time Series Model for Network-Constrained Trajectory. In Proceedings of the CTS 10;ACM SIGSPATIAL International Workshop on Computational Transportation Science, Chicago, IL, USA, 1 November 2011. [Google Scholar]
- Wang, T.; Huang, B. 4D flight trajectory prediction model based on improved Kalman filter. J. Comput. Appl. 2014, 34, 1812. [Google Scholar]
- Wiest, J.; Hoffken, M.; Kresel, U.; Dietmayer, K. Probabilistic trajectory prediction with Gaussian mixture models. In Proceedings of the 2012 IEEE Intelligent Vehicles Symposium (IV), Madrid, Spain, 3–7 June 2012. [Google Scholar]
- Yoon, Y.; Kim, C.; Lee, J.; Yi, K. Interaction-Aware Probabilistic Trajectory Prediction of Cut-In Vehicles Using Gaussian Process for Proactive Control of Autonomous Vehicles. IEEE Access 2021, 9, 63440–63455. [Google Scholar] [CrossRef]
- Rong, H.; Teixeira, A.P.; Soares, C.G. Ship trajectory uncertainty prediction based on a Gaussian Process model. Ocean Eng. 2019, 182, 499–511. [Google Scholar] [CrossRef]
- Anderson, S.; Barfoot, T.D.; Tong, C.H.; Särkkä, S. Batch nonlinear continuous-time trajectory estimation as exactly sparse Gaussian process regression. Auton. Robots 2015, 39, 221–238. [Google Scholar] [CrossRef]
- Qiao, S.; Shen, D.; Wang, X.; Han, N.; Zhu, W. A Self-Adaptive Parameter Selection Trajectory Prediction Approach via hidden Markov Models. IEEE Trans. Intell. Transp. Syst. 2015, 16, 284–296. [Google Scholar] [CrossRef]
- Sushmitha, T.V.; Deepika, C.P.; Uppara, R.; Sai, R.N. Vehicle Trajectory Prediction using Non-Linear Input-Output Time Series Neural Network. In Proceedings of the International Conference on Power Electronics Applications and Technology in Present Energy Scenario, Mangalore, India, 29–31 August 2019. [Google Scholar]
- Chen, C.; Liu, L.; Qiu, T.; Ren, Z.; Hu, J.; Ti, F. Driver’s Intention Identification and Risk Evaluation at Intersections in the Internet of Vehicles. IEEE Internet Things J. 2018, 5, 1575–1587. [Google Scholar] [CrossRef]
- Min, K.; Kim, D.; Park, J.; Huh, K. RNN-Based Path Prediction of Obstacle Vehicles With Deep Ensemble. IEEE Trans. Veh. Technol. 2019, 68, 10252–10256. [Google Scholar] [CrossRef]
- Lee, N.; Choi, W.; Vernaza, P.; Choy, C.B.; Torr, P.; Chandraker, M. DESIRE: Distant Future Prediction in Dynamic Scenes with Interacting Agents. In Proceedings of the 2017 IEEE Conference on Computer Vision and Pattern Recognition (CVPR), Honolulu, HI, USA, 21–26 July 2017. [Google Scholar]
- Park, S.H.; Kim, B.D.; Kang, C.M.; Chung, C.C.; Choi, J.W. Sequence-to-Sequence Prediction of Vehicle Trajectory via LSTM Encoder-Decoder Architecture. In Proceedings of the 2018 IEEE Intelligent Vehicles Symposium (IV), Changshu, China, 26–30 June 2018. [Google Scholar]
- Jin, X.B.; Gong, W.T.; Kong, J.L.; Bai, Y.T.; Su, T.L. PFVAE: A Planar Flow-Based Variational Auto-Encoder Prediction Model for Time Series Data. Mathematics 2022, 10, 610. [Google Scholar] [CrossRef]
- Berenguer, A.D.; Alioscha-Perez, M.; Oveneke, M.C.; Sahli, H. Context-aware human trajectories prediction via latent variational model. IEEE Trans. Circuits Syst. Video Technol. 2020, 31, 1876–1889. [Google Scholar] [CrossRef]
- Gupta, A.; Johnson, J.; Li, F.F.; Savarese, S.; Alahi, A. Social GAN: Socially Acceptable Trajectories with Generative Adversarial Networks. In Proceedings of the 2018 IEEE/CVF Conference on Computer Vision and Pattern Recognition (CVPR), Salt Lake City, UT, USA, 18–23 June 2018. [Google Scholar]
- Duives, D.; Wang, G.; Kim, J. Forecasting Pedestrian Movements Using Recurrent Neural Networks: An Application of Crowd Monitoring Data. Sensors 2019, 19, 382. [Google Scholar] [CrossRef]
- Adege, A.B.; Lin, H.P.; Wang, L.C. Mobility Predictions for IoT Devices Using Gated Recurrent Unit Network. IEEE Internet Things J. 2019, 7, 505–517. [Google Scholar] [CrossRef]
- Lawrence, S.; Giles, C.; Tsoi, A.C.; Back, A. Face recognition: A convolutional neural-network approach. IEEE Trans. Neural Netw. 1997, 8, 98–113. [Google Scholar] [CrossRef]
- Hochreiter, S.; Schmidhuber, J. Long Short-Term Memory. Neural Comput. 1997, 9, 1735–1780. [Google Scholar] [CrossRef]
Figure 1.
Virtual coupling train-following model. (a) Schematic system architecture for virtual coupling. (b) virtual coupling with the prediction of position and speed of the leading train A.
Figure 1.
Virtual coupling train-following model. (a) Schematic system architecture for virtual coupling. (b) virtual coupling with the prediction of position and speed of the leading train A.
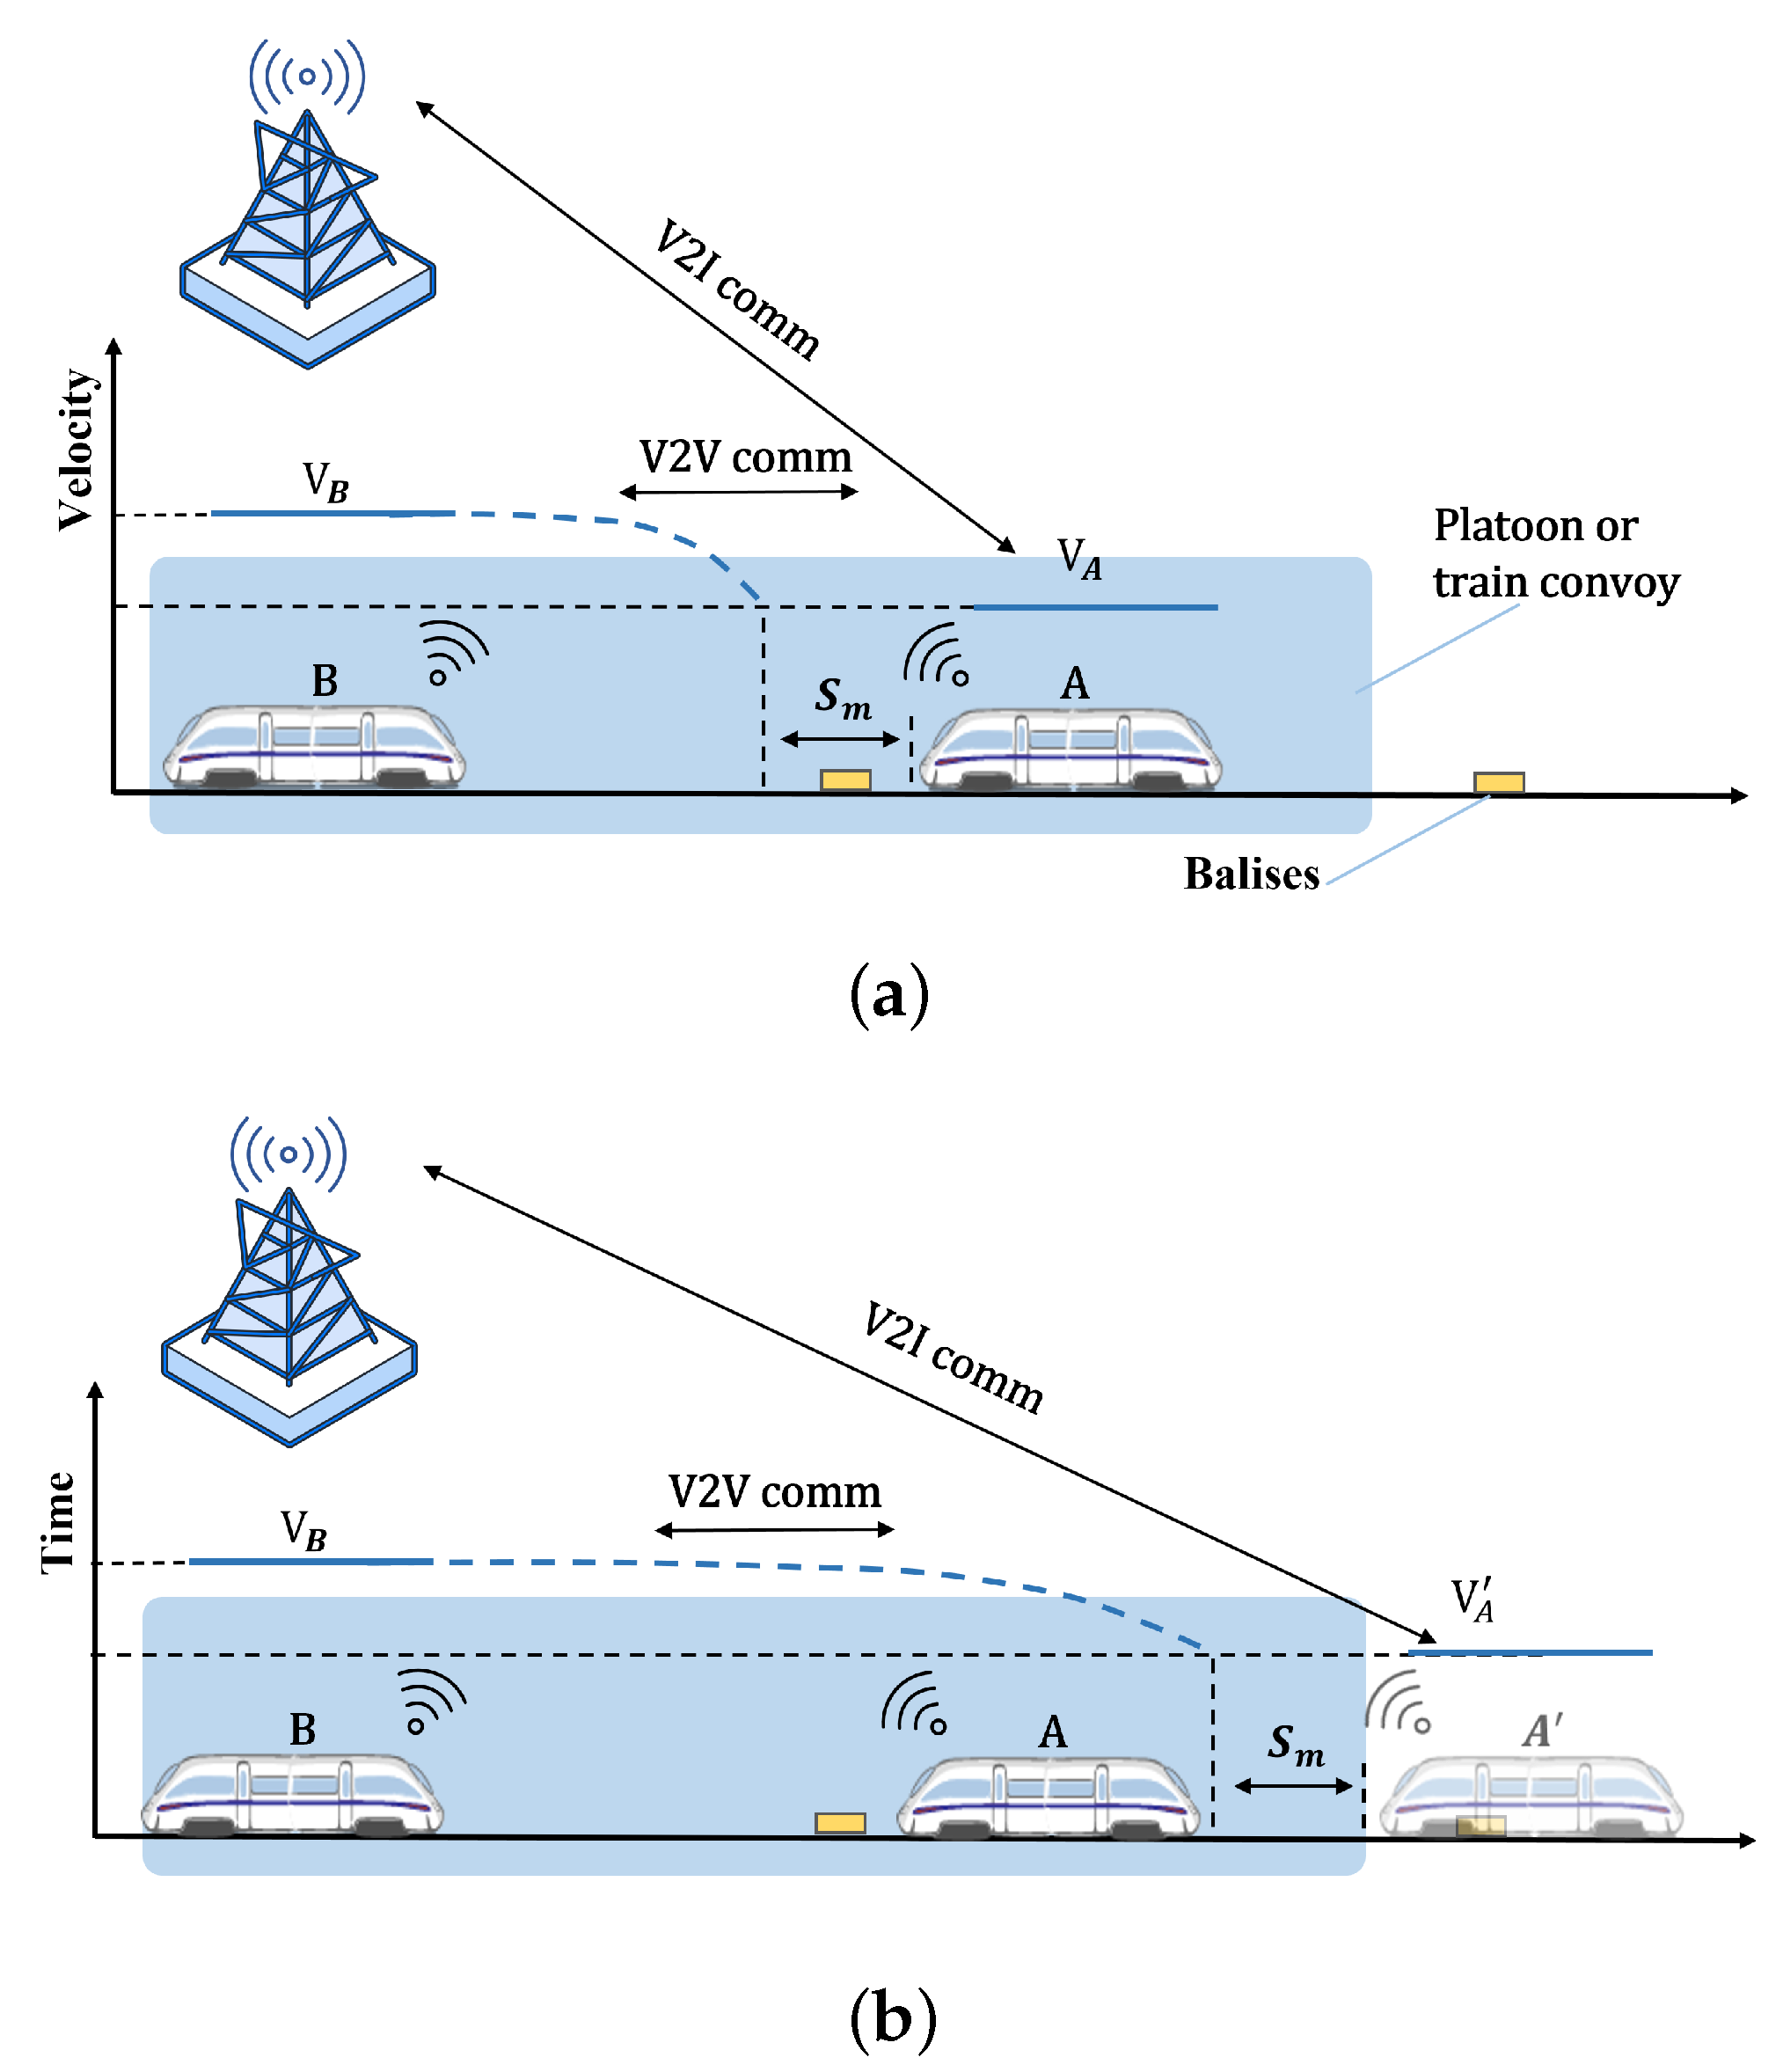
Figure 2.
Typical structure of CNN network.
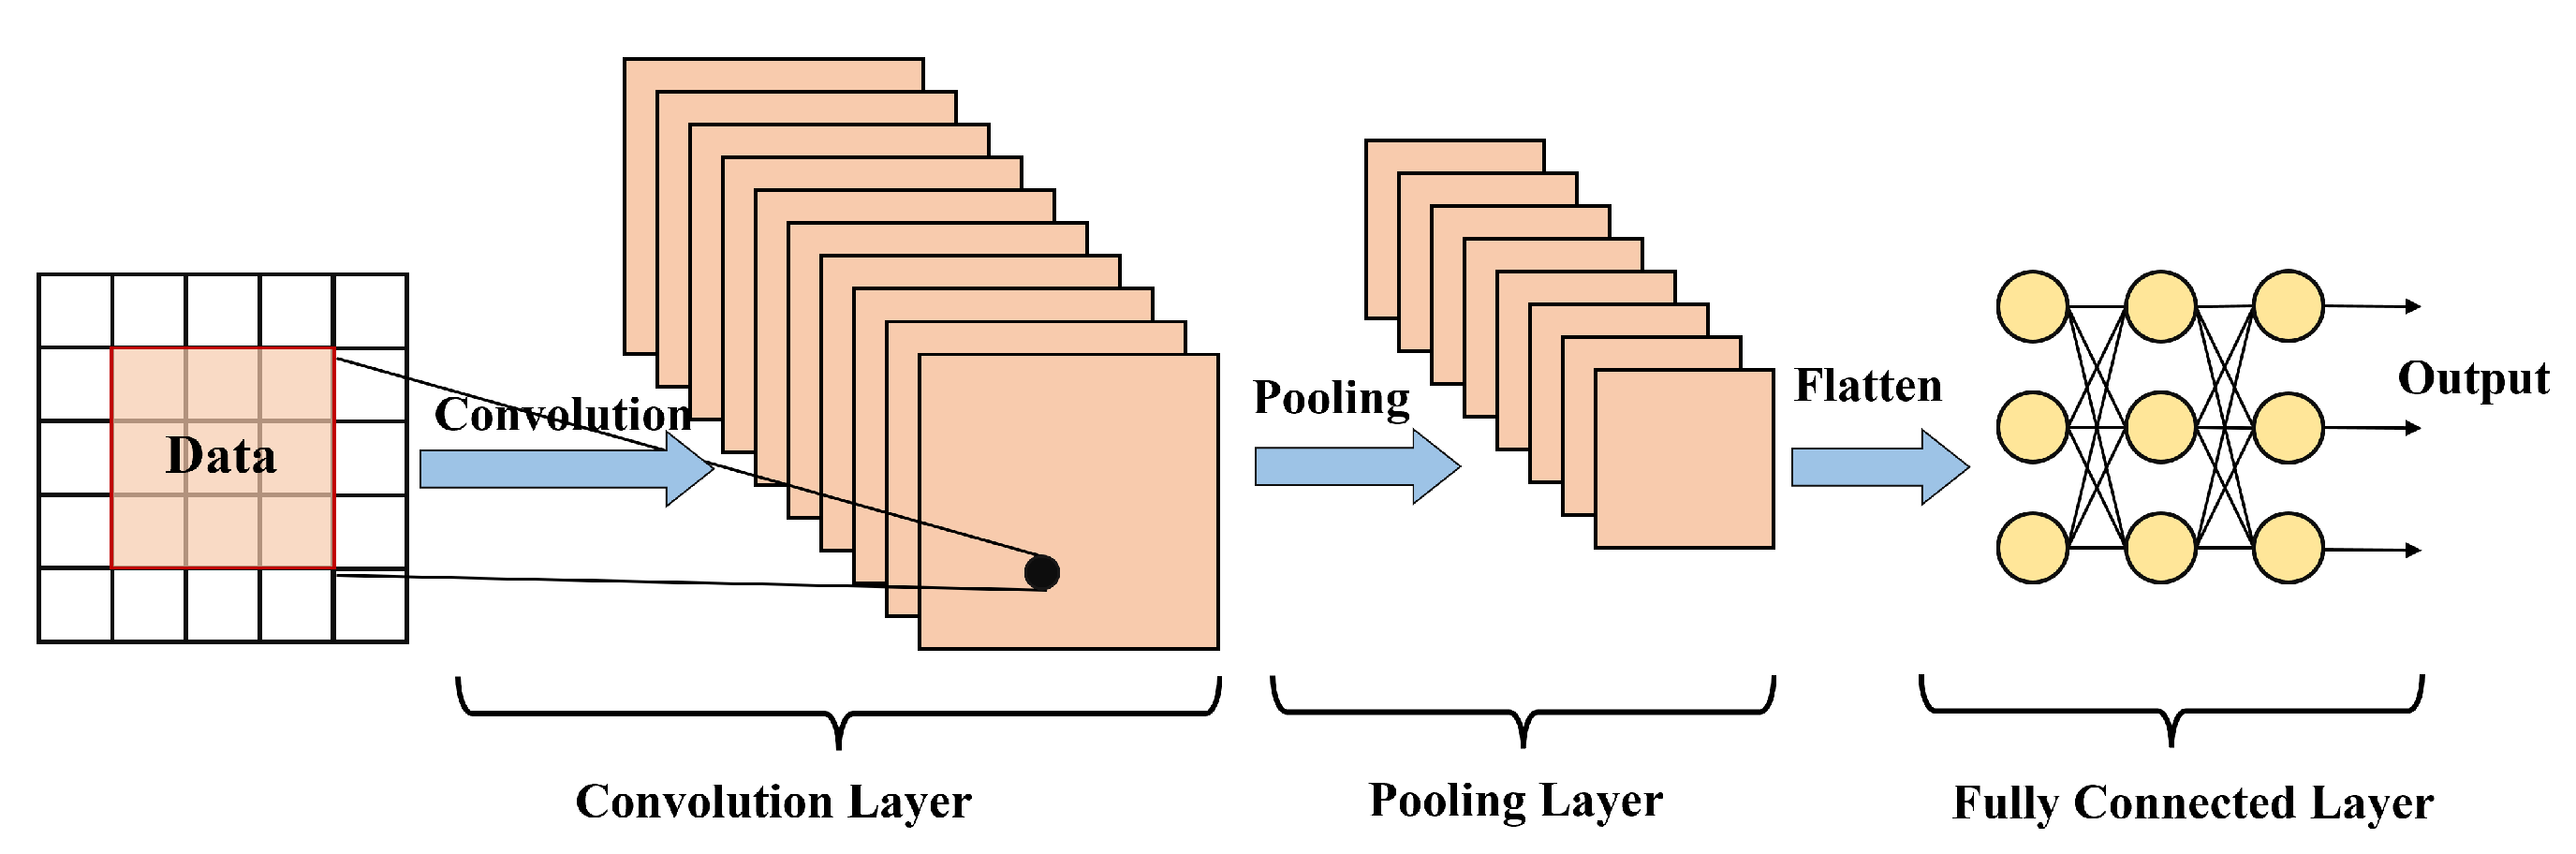
Figure 3.
Standard structure of LSTM unit.
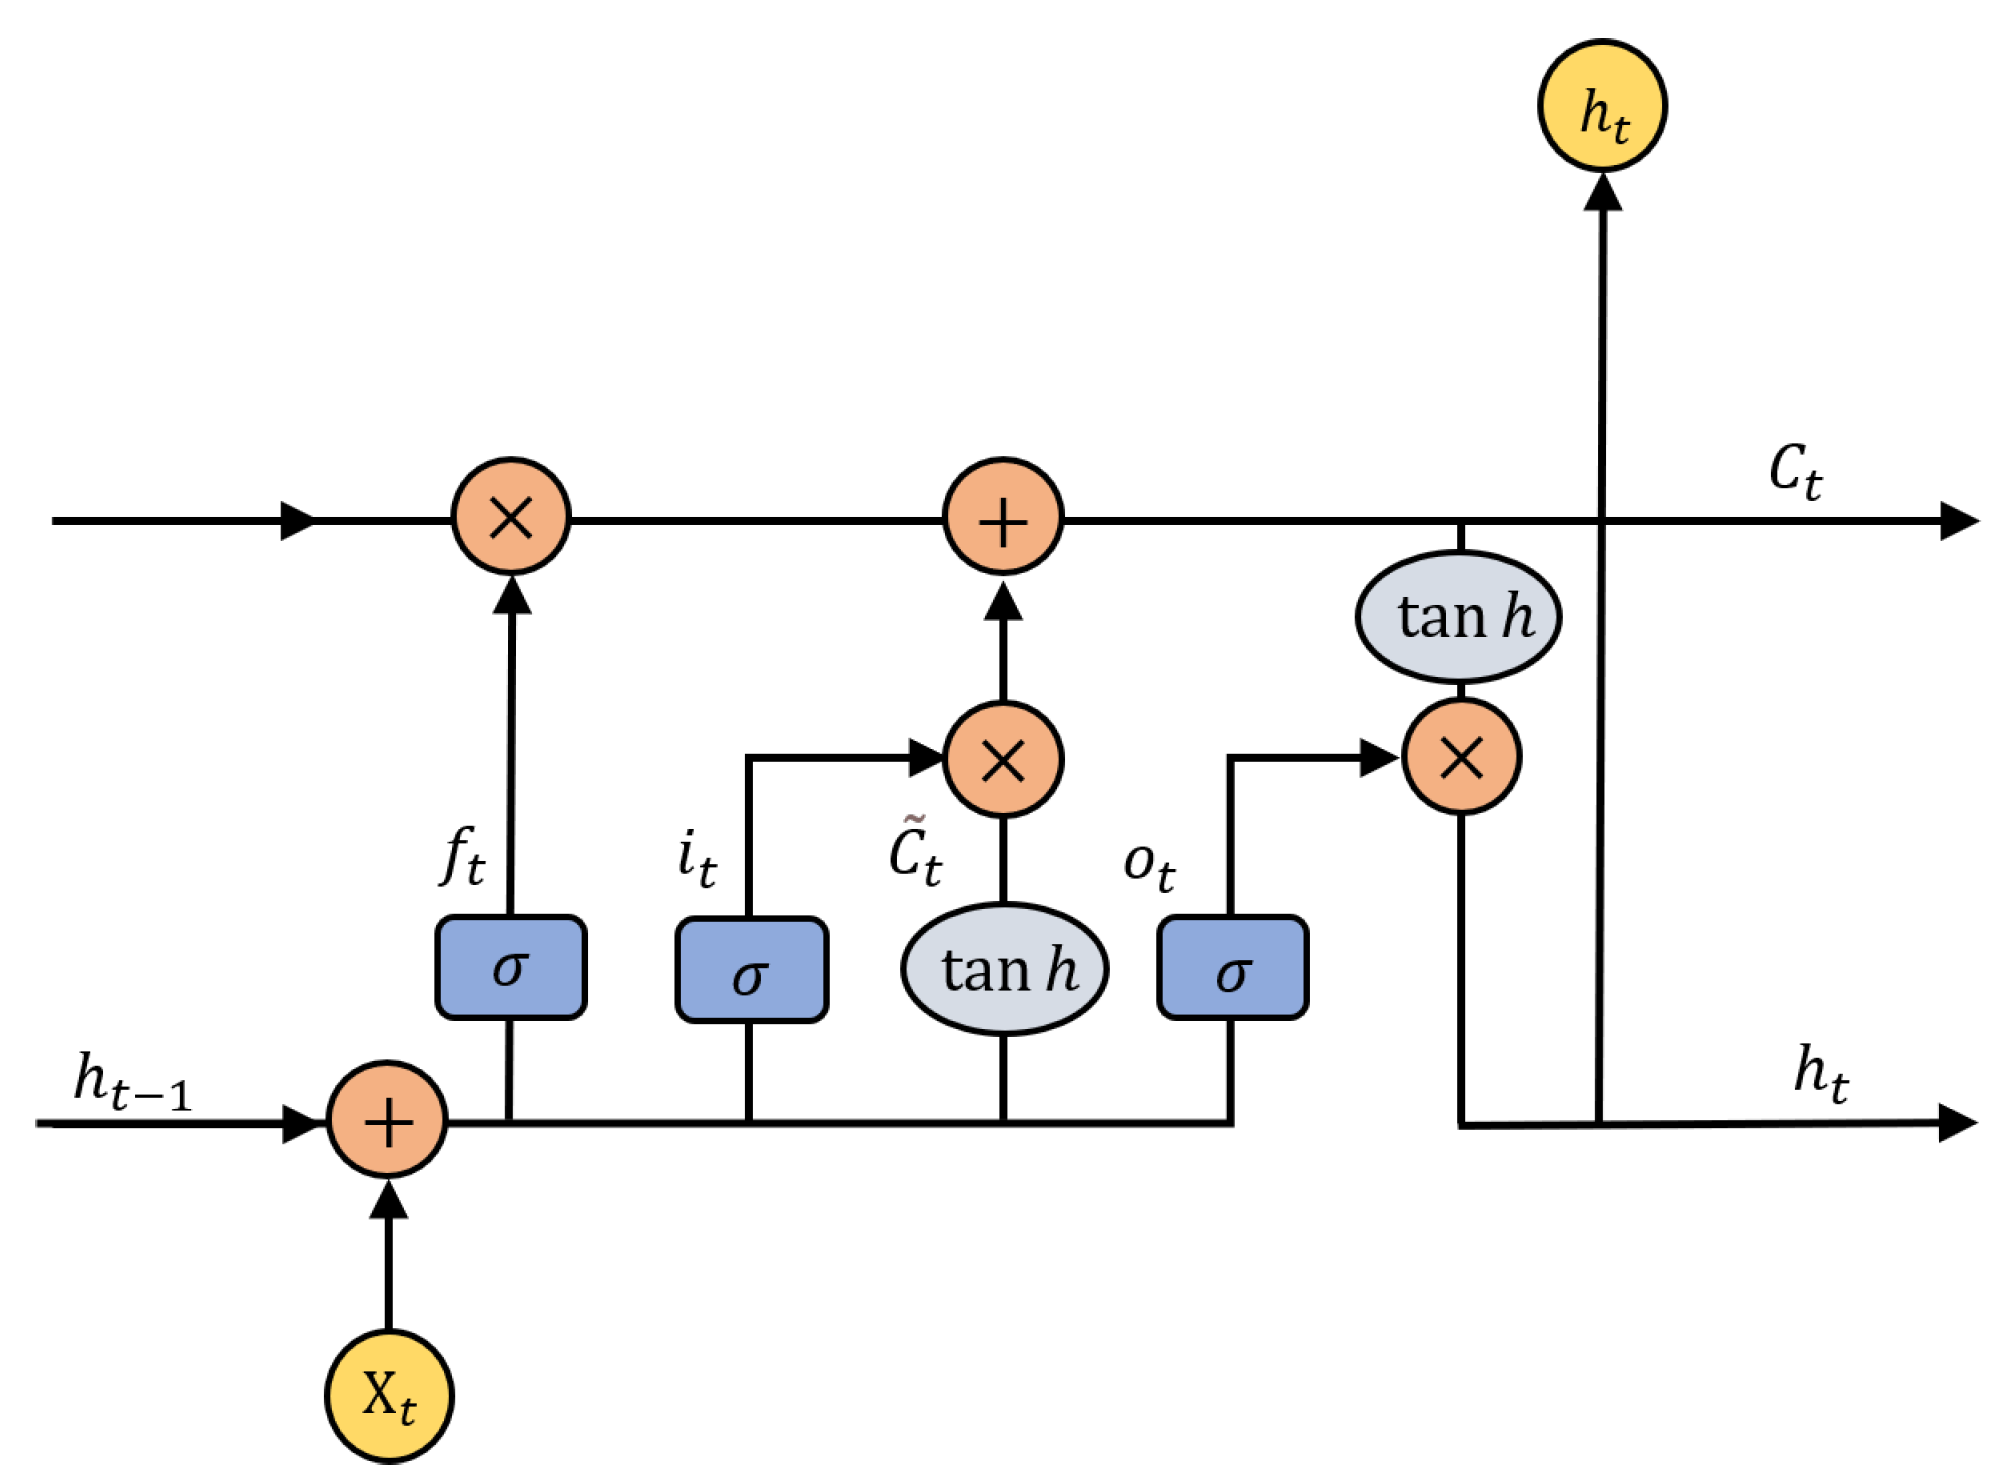
Figure 4.
The proposed hybrid model.

Figure 5.
Field data and predicted position. (a) Train position curve in the 0.2 s. (b) Train position curve in the 2.0 s.
Figure 5.
Field data and predicted position. (a) Train position curve in the 0.2 s. (b) Train position curve in the 2.0 s.
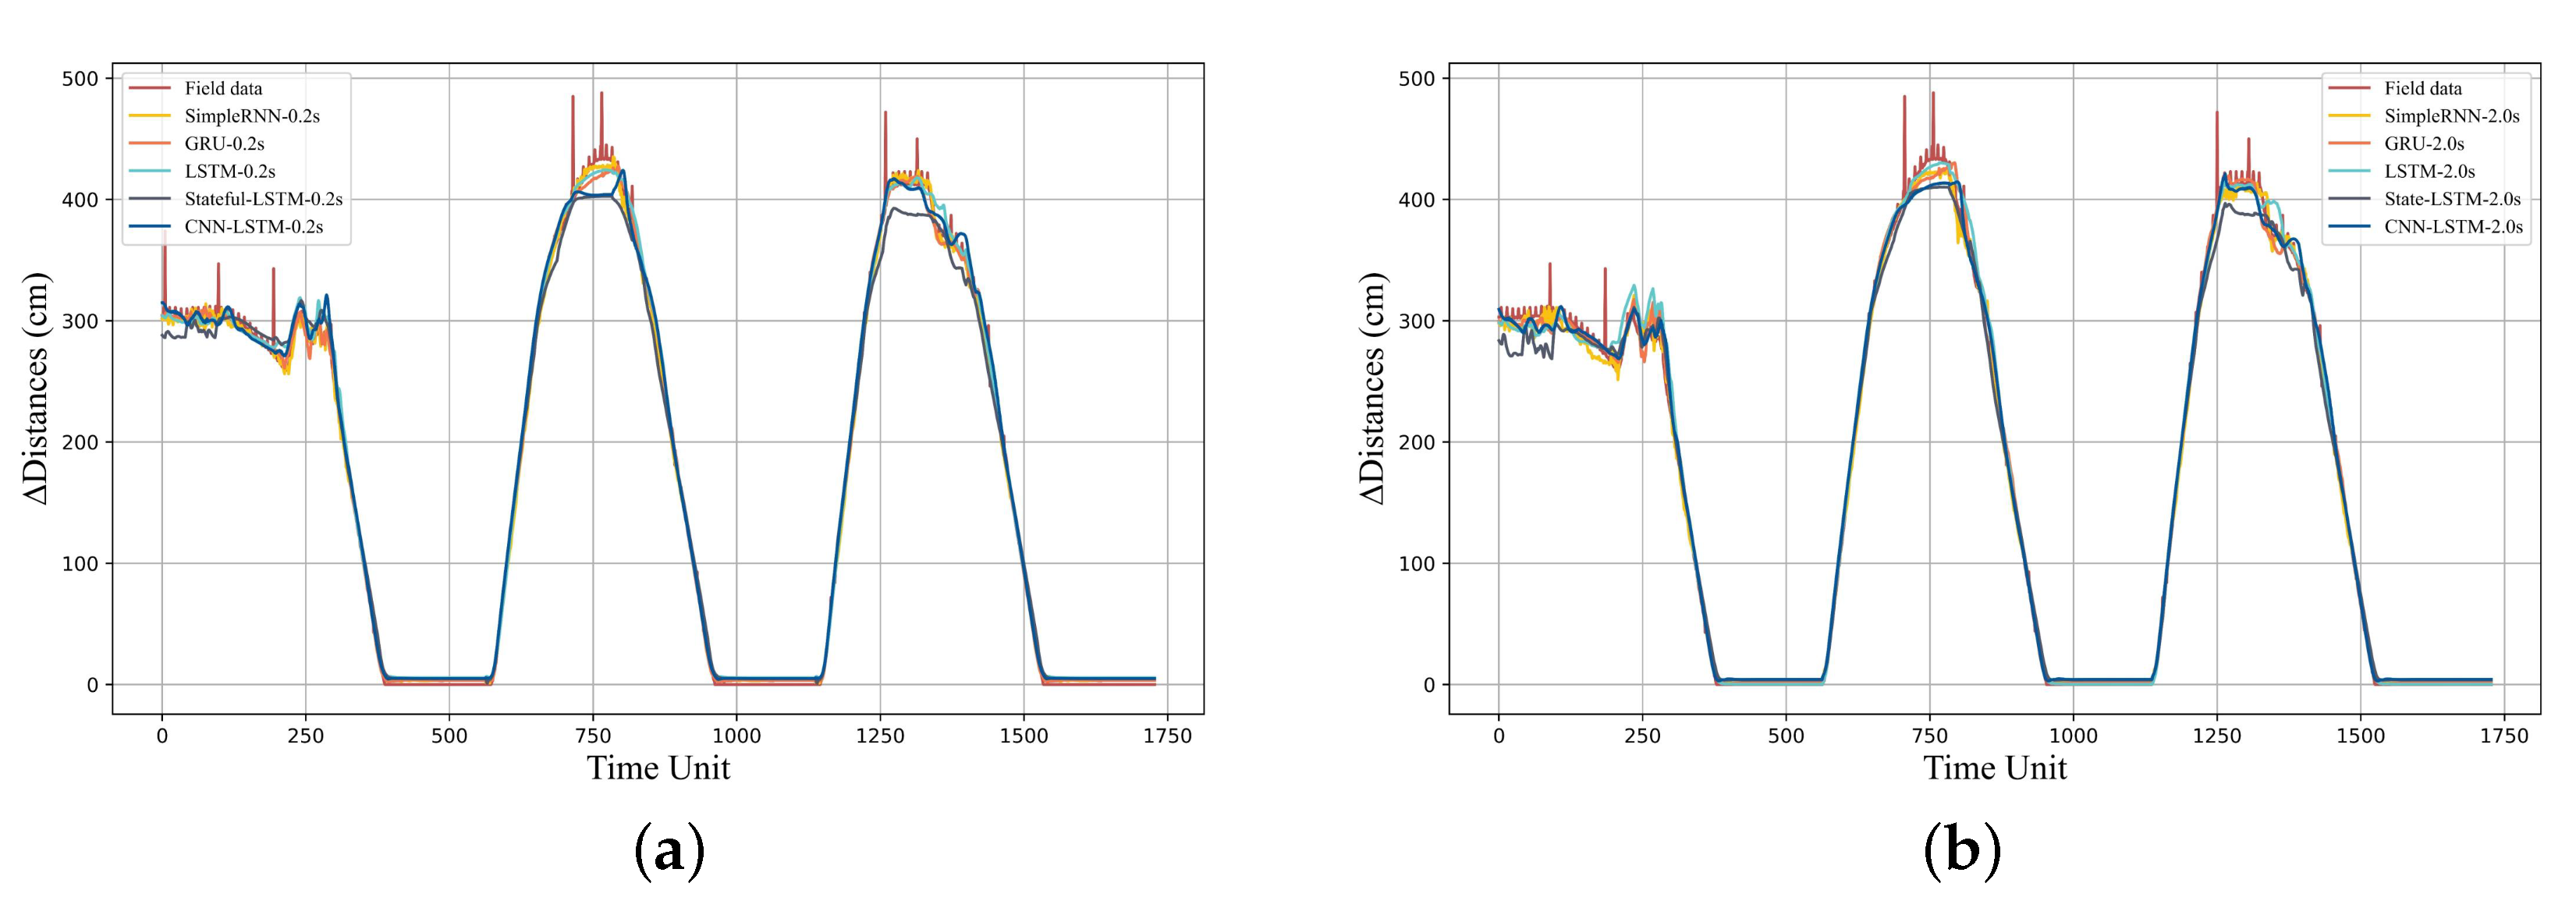
Figure 6.
Field data and predicted position. (a) Train position curve in the 4.0 s. (b) Train position curve between 1200 and 1450 units in the 4.0 s.
Figure 6.
Field data and predicted position. (a) Train position curve in the 4.0 s. (b) Train position curve between 1200 and 1450 units in the 4.0 s.
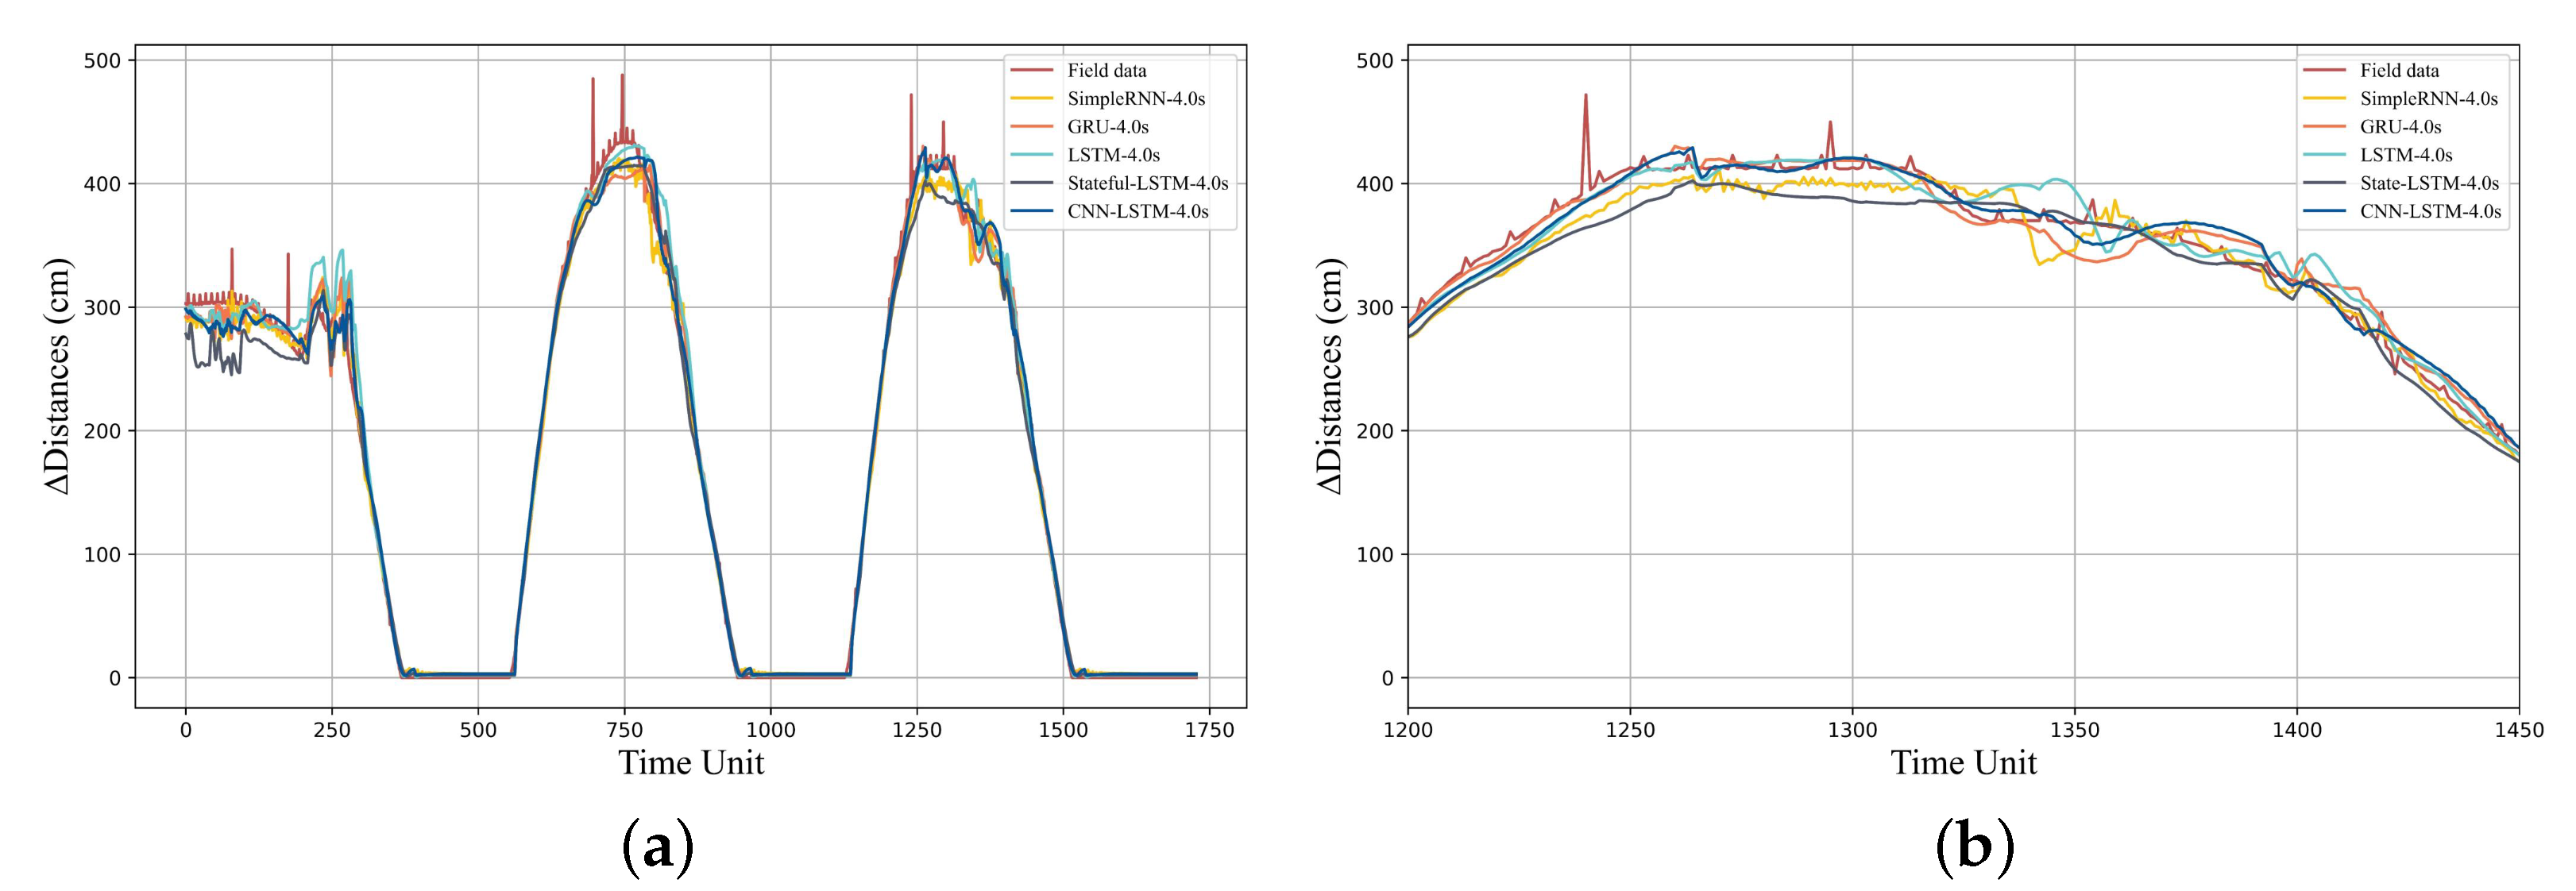
Figure 7.
The prediction loss at each step in 3d and 2d perspective. (a) The validation loss of CNN–LSTM. (b) The validation loss of LSTM. (c) The validation loss of CNN–LSTM. (d) The validation loss of LSTM.
Figure 7.
The prediction loss at each step in 3d and 2d perspective. (a) The validation loss of CNN–LSTM. (b) The validation loss of LSTM. (c) The validation loss of CNN–LSTM. (d) The validation loss of LSTM.


Table 1.
The RMSE performance comparison of trajectory prediction.
| Time Steps | RNN | GRU | LSTM | State-LSTM | CNN–LSTM |
|---|---|---|---|---|---|
| 1 | 4.18 | 4.53 | 6.07 | 8.85 | 5.37 |
| 2 | 4.29 | 4.86 | 6.46 | 8.68 | 5.67 |
| 3 | 5.55 | 5.72 | 5.55 | 10.12 | 5.27 |
| 4 | 6.60 | 6.25 | 6.81 | 9.92 | 6.51 |
| 5 | 7.42 | 7.00 | 7.64 | 9.95 | 7.39 |
| 6 | 8.49 | 7.38 | 9.05 | 10.92 | 8.26 |
| 7 | 8.79 | 9.12 | 9.86 | 11.26 | 8.64 |
| 8 | 9.94 | 10.02 | 10.47 | 12.38 | 9.72 |
| 9 | 11.54 | 11.65 | 12.35 | 13.08 | 11.12 |
| 10 | 12.80 | 11.98 | 11.76 | 13.47 | 11.53 |
| 11 | 13.34 | 13.54 | 13.36 | 14.59 | 13.08 |
| 12 | 14.73 | 14.14 | 13.86 | 15.61 | 13.58 |
| 13 | 15.45 | 16.11 | 15.13 | 16.53 | 15.48 |
| 14 | 16.24 | 16.89 | 16.73 | 17.02 | 15.69 |
| 15 | 18.36 | 18.00 | 17.51 | 18.61 | 15.93 |
| 16 | 18.80 | 18.43 | 17.64 | 19.01 | 17.94 |
| 17 | 20.50 | 20.02 | 18.54 | 20.10 | 19.33 |
| 18 | 20.61 | 20.75 | 20.40 | 21.07 | 19.71 |
| 19 | 23.21 | 22.20 | 21.02 | 22.39 | 20.79 |
| 20 | 24.17 | 23.63 | 21.81 | 23.28 | 21.33 |
Table 2.
Hit rate of trajectory prediction (n is the time step).
| Hit Rate | n = 1 | n = 5 | n = 10 | n = 15 | n = 20 |
|---|---|---|---|---|---|
| RNN | 0.98 | 0.97 | 0.96 | 0.93 | 0.91 |
| GRU | 0.98 | 0.98 | 0.96 | 0.94 | 0.89 |
| LSTM | 0.97 | 0.92 | 0.91 | 0.9 | 0.87 |
| state-LSTM | 0.9 | 0.88 | 0.88 | 0.88 | 0.83 |
| CNN–LSTM | 0.96 | 0.96 | 0.96 | 0.95 | 0.93 |
Publisher’s Note: MDPI stays neutral with regard to jurisdictional claims in published maps and institutional affiliations. |
© 2022 by the authors. Licensee MDPI, Basel, Switzerland. This article is an open access article distributed under the terms and conditions of the Creative Commons Attribution (CC BY) license (https://creativecommons.org/licenses/by/4.0/).
Share and Cite
MDPI and ACS Style
He, Y.; Lv, J.; Liu, H.; Tang, T. Toward the Trajectory Predictor for Automatic Train Operation System Using CNN–LSTM Network. Actuators 2022, 11, 247. https://doi.org/10.3390/act11090247
AMA Style
He Y, Lv J, Liu H, Tang T. Toward the Trajectory Predictor for Automatic Train Operation System Using CNN–LSTM Network. Actuators. 2022; 11(9):247. https://doi.org/10.3390/act11090247
Chicago/Turabian StyleHe, Yijuan, Jidong Lv, Hongjie Liu, and Tao Tang. 2022. "Toward the Trajectory Predictor for Automatic Train Operation System Using CNN–LSTM Network" Actuators 11, no. 9: 247. https://doi.org/10.3390/act11090247
Note that from the first issue of 2016, this journal uses article numbers instead of page numbers. See further details here.