
Control-Force Spectrum Considering Both Natural Period and Damping Ratio for Active Base-Isolated Building


1
Department of Architecture, Faculty of Engineering, Tokyo University of Science, Niijuku 6-3-1, Katsushika-ku, Tokyo 125-8585, Japan
2
Laboratory for Future Interdisciplinary Research of Science and Technology (FIRST), Tokyo Institute of Technology, Yokohama 226-8503, Japan
3
Institute of Technology, Shimizu Corporation, Koto, Tokyo 135-0044, Japan
4
School of Engineering, Tokyo University of Technology, Hachioji, Tokyo 192-0982, Japan
*
Author to whom correspondence should be addressed.
Actuators 2022, 11(6), 156; https://doi.org/10.3390/act11060156
Submission received: 19 May 2022
/
Revised: 6 June 2022
/
Accepted: 9 June 2022
/
Published: 11 June 2022
(This article belongs to the Special Issue Active, Semi-active and Passive Vibration Control)
Abstract
:The active structural control (ASC) has been applied to base-isolated buildings to achieve a high-damping system. The critical step for designing an ASC system is selecting control parameters and isolation parameters that satisfy the design restrictions. However, the conventional methods are limited in theoretically estimating the maximum control force, which requires great demand for trial-and-error approaches and numerical simulations. This paper constructed the equivalent model of the feedback control system that theoretically expresses the dependence of vibration characteristics (natural period and damping ratio) of the control system on the feedback gain. Then, the control-force spectrum is proposed that estimates the maximum control force for a feedback control system, adjusting both the natural period and damping ratio of the control system. The maximum responses and control force are estimated without additional numerical simulations and trial-and-error approaches using the equivalent model and control-force spectrum. Moreover, a design method was devised for determining the allowance range of the vibration characteristics of structures (damping ratio and natural period) and controllers that satisfy the design limitations (maximum responses and maximum control force). The design method does not require trial-and-error and numerical simulations, thus simplifying the design procedure. Finally, this paper uses numerical examples and a design example to verify the validity of the control-force spectrum and design method.
1. Introduction
Passive base-isolated (PBI) buildings protect people and household effects from earthquakes [1,2], and have been widely used since the Kobe earthquake (1995) in Japan [3]. PBI structures are popular for constructing hospitals, public buildings, and other essential facilities [4]. For example, some precision machine factories, which are very sensitive to the absolute acceleration response, have installed PBI structures [5]. The PBI structure suppresses the absolute acceleration response by increasing the natural period of the building. However, it is difficult for a long-period PBI building to suppress the maximum displacement of the isolation layer within the design criteria subjected to a long-period earthquake [6]. Increasing the damping of the isolation layer suppresses the displacement responses of the displacement, for example adding viscous dampers to the isolation layer. Adding viscous dampers reduces the displacement of the isolation layer, but it will significantly increase absolute accelerations and inter-story drifts in the superstructure [7]. To solve this problem, we need a device to add additional negative stiffness and positive damping to a PBI structure to achieve a long-period high-damping structure simultaneously.
Ibrahim summarized the performance and applications of passive negative stiffness isolators [8]. The negative stiffness provided by the passive devices is very complex to adjust; thus, their optimal performance is limited to a certain condition (disturbance and geometric parameters) [9]. Semi-active control systems vary real-time parameters of the structure, such as stiffness and damping coefficient, requiring limited external power to operate [10,11]. Semi-active variable stiffness dampers reduce bearing displacements while maintaining acceleration response at the same level as the long-period base-isolation. Their effectiveness has been validated via analytical and experimental studies [12,13]. However, semi-active control devices cannot dissipate energy to the structure [10]. The combination of base-isolation and active structural control (ASC) improves the control performance by adjusting the natural period and damping ratio of the control system and dissipating input energy in the structure [14].
The required control force for ASC is quite large, making the estimation of the maximum control force significant in designing controllers and actuators. The conventional process of designing the control system and estimating the maximum control force mainly uses trial-and-error approaches, which need much guessing, testing, and numerical simulations [15,16]. Kohiyama et al. developed a method to estimate the maximum response and control force for feedback control systems [17,18]. However, the methods proposed by Kohiyama et al. need to construct the modal expression for the dynamics of the system and did not present the spectrum of the maximum control force, making it difficult to apply in design. The authors proposed a method to achieve a high-damping ASC system using velocity-feedback control and precisely estimating the maximum control force of single-degree-of-freedom (SDOF) ASC systems without numerical simulations [19]. However, this method only adjusts the damping ratio of the system by ASC, meaning it cannot add additional negative stiffness to the system.
This study expands the spectra method to feedback control systems that simultaneously adjust the damping ratio and natural period for SDOF models. The equivalent model, which theoretically expresses the dynamic characteristics (natural period and damping ratio) of feedback control systems, is constructed, making it possible to estimate the maximum responses of the system only using the response spectra of the design earthquake wave. Moreover, this paper presents a new spectrum, the control-force spectrum, that estimates the maximum control force for feedback control systems. The presented control-force spectrum only uses displacement- and velocity- response-spectrum to estimate the maximum control force; thus, it requires no additional numerical simulations. The control-force spectrum describes the dependency of the maximum control force on all design parameters (the feedback gain and vibration characteristics of the structure). This paper also devises a design method for an SDOF control system using the control-force spectrum. The design method theoretically illustrates the possible design area for the feedback gain and the parameters of the structure (stiffness and damping coefficient) satisfying the design criteria without numerical simulations and trial-and-error approaches.
2. Mathematic Model
Figure 1 shows the mathematical model used in this paper.
The dynamics of the mathematical model are
with
where m is the mass of the structure; is the stiffness of the structure; is the damping coefficient of the structure; x is the displacement response; is the velocity response; is the relative acceleration response; d is the disturbance force; is the ground acceleration; u is the control force. and are defined by
where and are the natural period and damping ratio of the structure, respectively.
The state-space representation of (1) is shown bellow:
where is the state vector; is the system matrix; and are the input matrix for d and u, respectively. , , , and are defined by the following equations:
Figure 2 presents the block diagram of the control system.
Feedback control law
is used, where is the state-feedback gain; and are the feedback gain for displacement and velocity, respectively.
3. Equivalent Model
This paper defines the equivalent model as a linear spring-dashpot model (see Figure 3), and the responses of the equivalent model are the same as the active model (a passive model with an actuator, see Figure 1) under the same input. This section shows the construction of the equivalent model, and theoretically clarify the relationship between the vibration characteristics of the control system and feedback gain.
Representing (7) yields
where and are the equivalent stiffness and the equivalent damping coefficient (Figure 3):
From (9), it can be seen that the feedback gain for displacement, , affects the equivalent stiffness, , and the feedback gain for velocity, , affects the equivalent damping coefficient, . The calculation formulas for determining feedback gain to achieving the target vibration characteristics ( and ) are given below:
Moreover, the equivalent natural angular frequency, , equivalent natural period, , and equivalent damping ratio, , are
Using the vibration characteristics of the equivalent model determined by (11), the maximum responses of the control system can be estimated via response spectra without additional numerical simulations.
4. Control-Force Spectrum
This section devises the control-force spectrum for an ASC model, which expresses the dependency of the maximum control force on all parameters for designing the control system. This section also uses numerical examples to check the accuracy of the proposed control-force spectrum.
4.1. Derivation of the Control-Force Spectrum
Substituting (10) in the control law, (6), the control force can be estimated by the following equation:
Thus, the maximum control force, , is
Since the phase of displacement response is usually unequal to that of velocity response, the maximum displacement response and velocity response do not appear simultaneously in most cases. Therefore,
From the response spectra of the earthquake, the maximum responses are estimated without numerical simulations:
where and are the maximum displacement response and the maximum velocity response refer to the displacement response spectrum and the velocity response spectrum of the earthquake, respectively.
Substituting (15) into (14) yields
The maximum control force, , divided by the weight of the structure, , yields the maximum shear-force coefficient of the maximum control, :
where
From (17), the shear-force coefficient of the maximum control force contains both the displacement component, , and the velocity component, . Since the maximum displacement and velocity do not appear at the same time in most cases, this paper uses the square root of the sum of squares (SRSS) to estimate the maximum shear-force coefficient of the control force and defines the following estimation equation as the control-force spectrum, :
From (18) and (19), it can be seen that the maximum control force is estimated by the response spectra of the earthquake ( and ); thus, it does not require additional numerical simulations. The control force prediction spectrum, , is a function of the natural period of the structure, , the damping ratio of the structure, , the equivalent natural period, , and the equivalent damping ratio, .
Appendix A shows the accuracy verification of the control-force spectrum, (19). From Appendix A, the estimation errors of the presented response spectrum are less than 10% for most cases.
4.2. Numerical Example
This section uses several earthquake waves, Taft NS, El Centro 1940 NS, JMA Kobe NS, and Code Hachinohe, to calculate the control-force spectrum. The Code Hachinohe is reproduced from the real earthquake wave to minimize the effects of natural periods of the original waves. The pseudo-velocity response spectrum, , of Code Hachinohe is 100 cm/s for a structure with a damping ratio of 5% after a corner period of 0.64 s. The phase characteristic is the same as the earthquake wave of the Hachinohe 1968 EW. Figure 4, Figure 5, Figure 6 and Figure 7 show the accelerogram and pseudo-velocity response spectrum of Taft NS, El Centro 1940 NS, JMA Kobe NS, and Code Hachinohe.
The earthquake waves used in this section are standardized to 1.5 times Level II of the Japan earthquake resistance design standard [20]. The peak ground acceleration (PGA) and peak ground velocity (PGV) of the earthquakes used in this section are shown in Table 1. Table 2 shows the parameters of the model used in this section.
Figure 8 shows control-force prediction spectra for Taft NS, El Centro 1940 NS, JMA Kobe NS, and Code Hachinohe. From Figure 8, the following results are obtained, and the analysis of the following results is presented at Appendix B.
- 1.
- The maximum control force decreases as the equivalent damping, , ratio increases if .
- 2.
- The maximum control force increases as the equivalent damping ratio, , increases if .
- 3.
- The maximum control force increases as the equivalent natural period, , increases if only for the case of Code Hachinohe.
5. Design Method
This section devises a design method for PBI structures with ASC for determining the damping ratio and natural period of the structure, and maximum control force that satisfies these restrictions using the response spectra and control-force spectrum. This section also uses a design example to confirm the accuracy of the design method.
5.1. Design Algorithm
- Step 1.
- Specifies the design conditions:design earthquake wave,mass of the structure (m),restrictions of the maximum responses (displacement, , velocity, , and absolute acceleration, ),restrictions of natural period and damping ratio of structure ( and ), and restriction of shear-force coefficient of control force ().
- Step 2.
- Uses the response spectra of the design earthquake wave to select the target equivalent model (equivalent natural period, , and equivalent damping ratio, ) that satisfies the limitations on the maximum responses set at Step 1.
- Step 3.
- Uses the control force prediction spectrum to estimate the maximum control force of the equivalent model selected at Step 2. If all design limitations (, , and ) are satisfied, specifies appropriate values for and , then go to the next step. If not, go back to Step 2 and select another equivalent model.
- Step 4.
- Calculate the stiffness and damping coefficient by the following steps:
- Calculate the target equivalent stiffness and target equivalent damping coefficient ( and ) by substituting and , which were selected at Step 2, into (11).
- Calculate the stiffness and damping coefficient of the structure ( and ) by substituting and , which were selected at Step 3, into (10).
- Step 5.
- Calculate the feedback gain, , by substituting , , , and , which were obtained at Step 4, into (10).
5.2. Design Example
- Step 1.
- Design earthquake wave:Code Hachinohe wave (Figure 7).Mass of the structure:kg.Restrictions of the maximum response:,, and.Restrictions of natural period and damping ratio of structure:and.Restriction of shear-force coefficient of control force:.
- Step 2.
- Figure 9 shows the response spectra of the Code Hachinohe wave. Note that the blue plots in Figure 9a show the maximum responses of models with a specified equivalent natural period and equivalent damping ratio, and the plots with the same equivalent natural period are connected by the blue lines. From Figure 9, it can be seen that increasing the damping ratio over 40% cannot achieve a higher performance; thus, we do not consider the cases with a damping ratio large than 40%. We select the following equivalent model:andwhich satisfies the restrictions on the maximum responses set at Step 1.
- Step 3.
- Step 4.
- Substituting the target equivalent natural period, , and target equivalent damping ratio, into (11), the value of the target equivalent stiffness and target equivalent damping coefficient is obtained:N/m and Ns/m;.substituting the natural period of the structure, , and damping ratio of the structure, into (3), the value of the stiffness of the structure and damping coefficient of the structure is obtained:N/m and Ns/m.
- Step 5.
- Substituting the target equivalent stiffness, , stiffness of the structure, , target equivalent damping coefficient, , and damping coefficient of the structure, , into (10), the feedback gain is obtained: .
Figure 9.
Response spectra of Code Hachinohe wave: (a) – relationship, (b) .
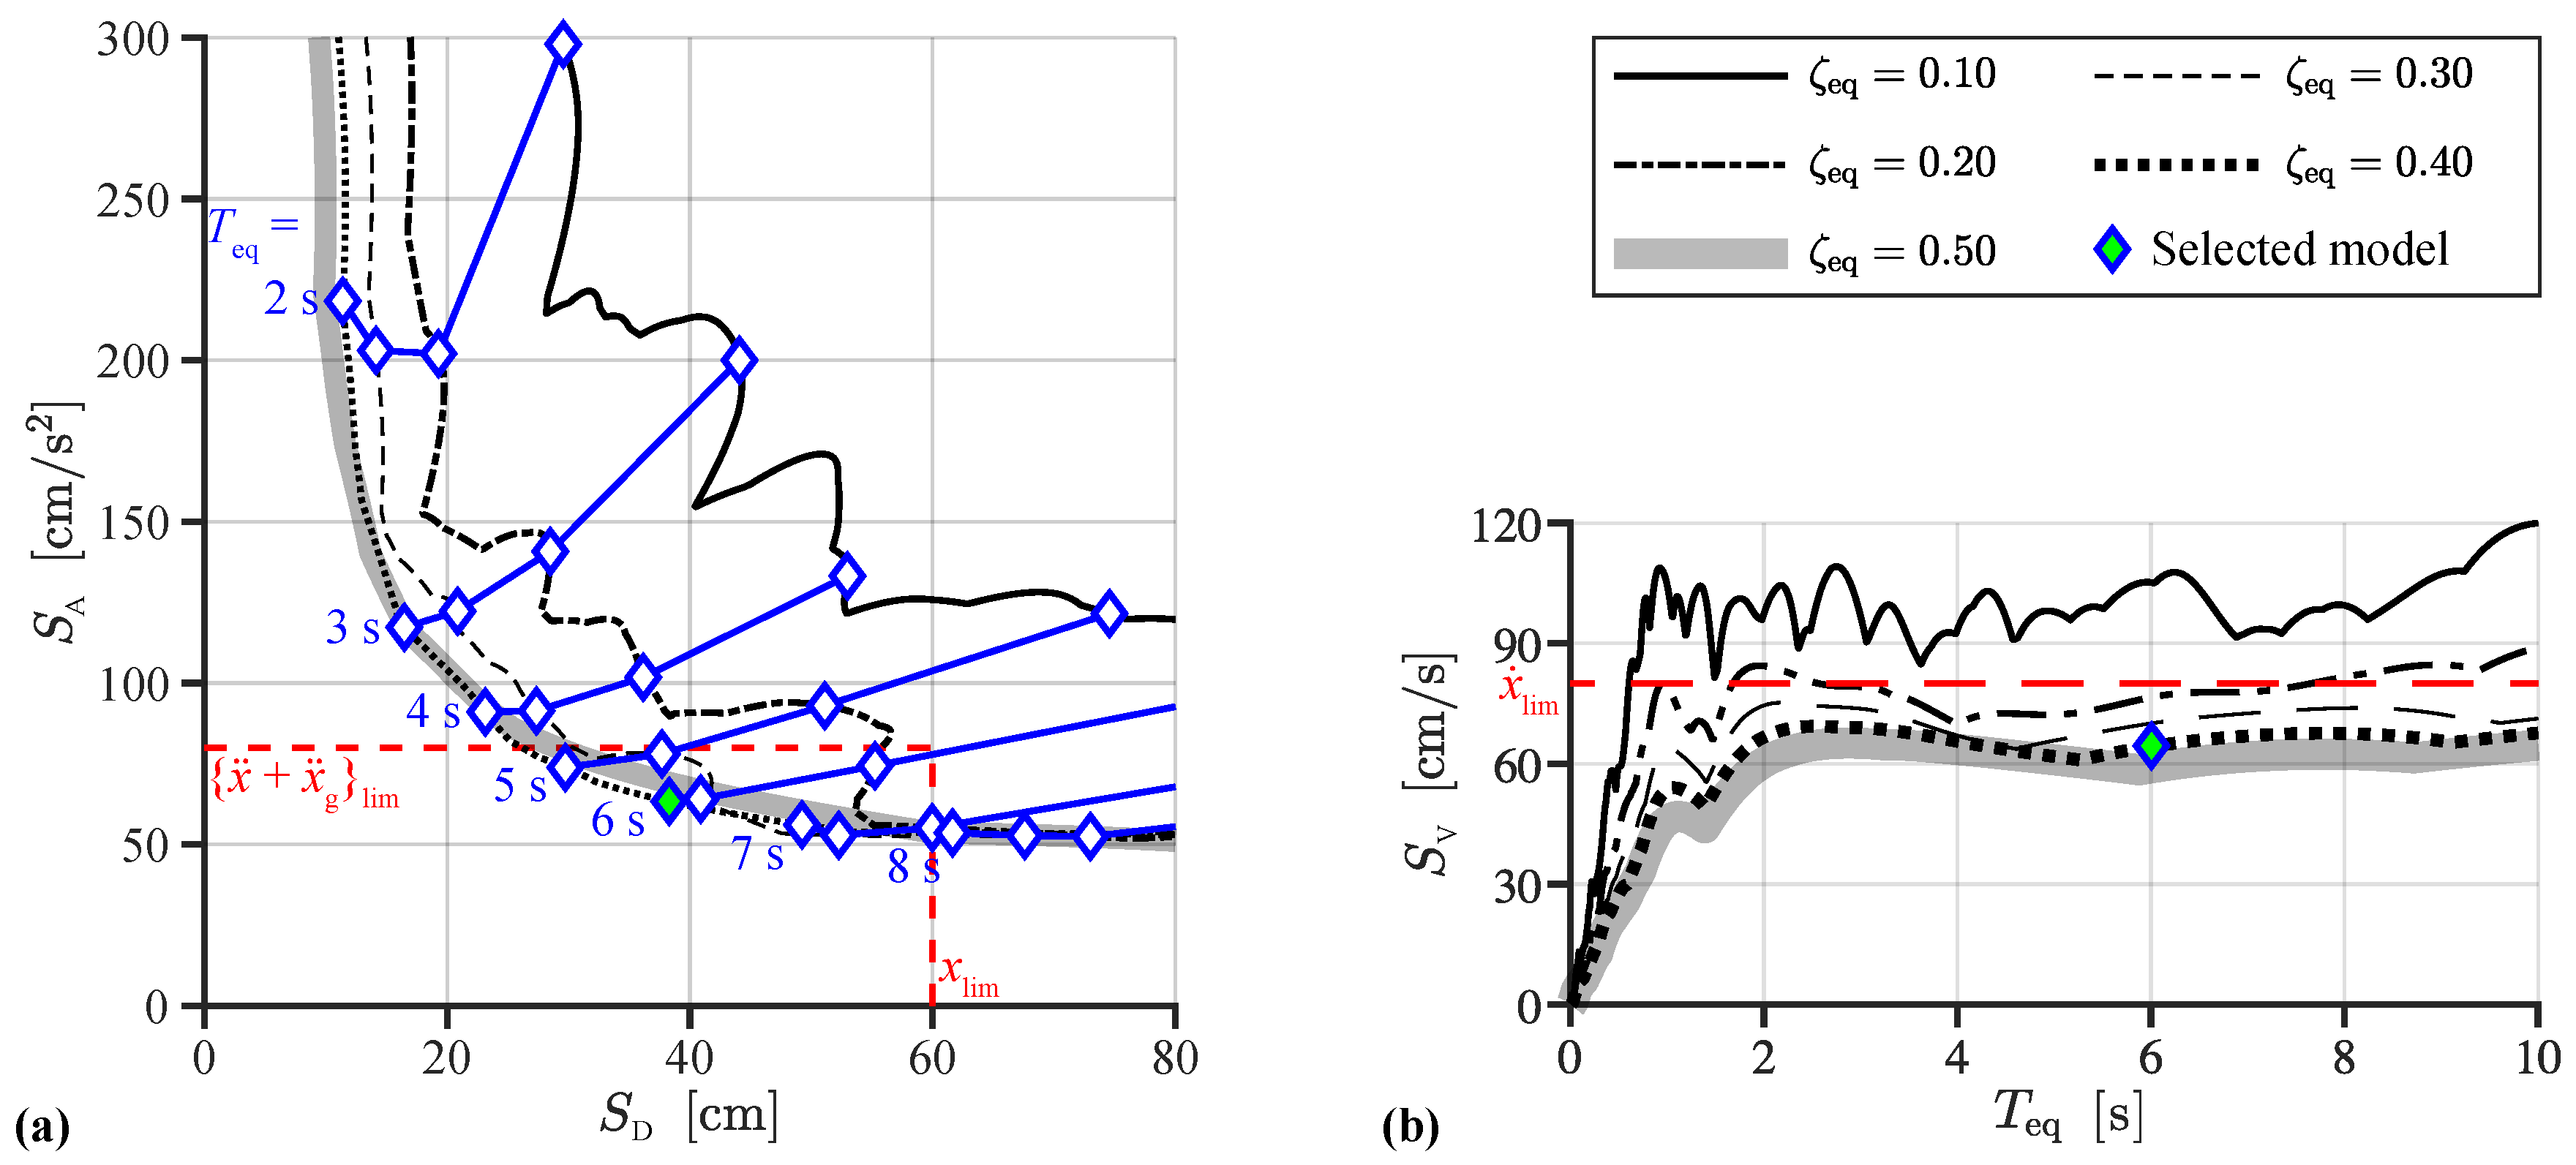
Figure 10.
Control-force spectrum of Code Hachinohe wave (design example).

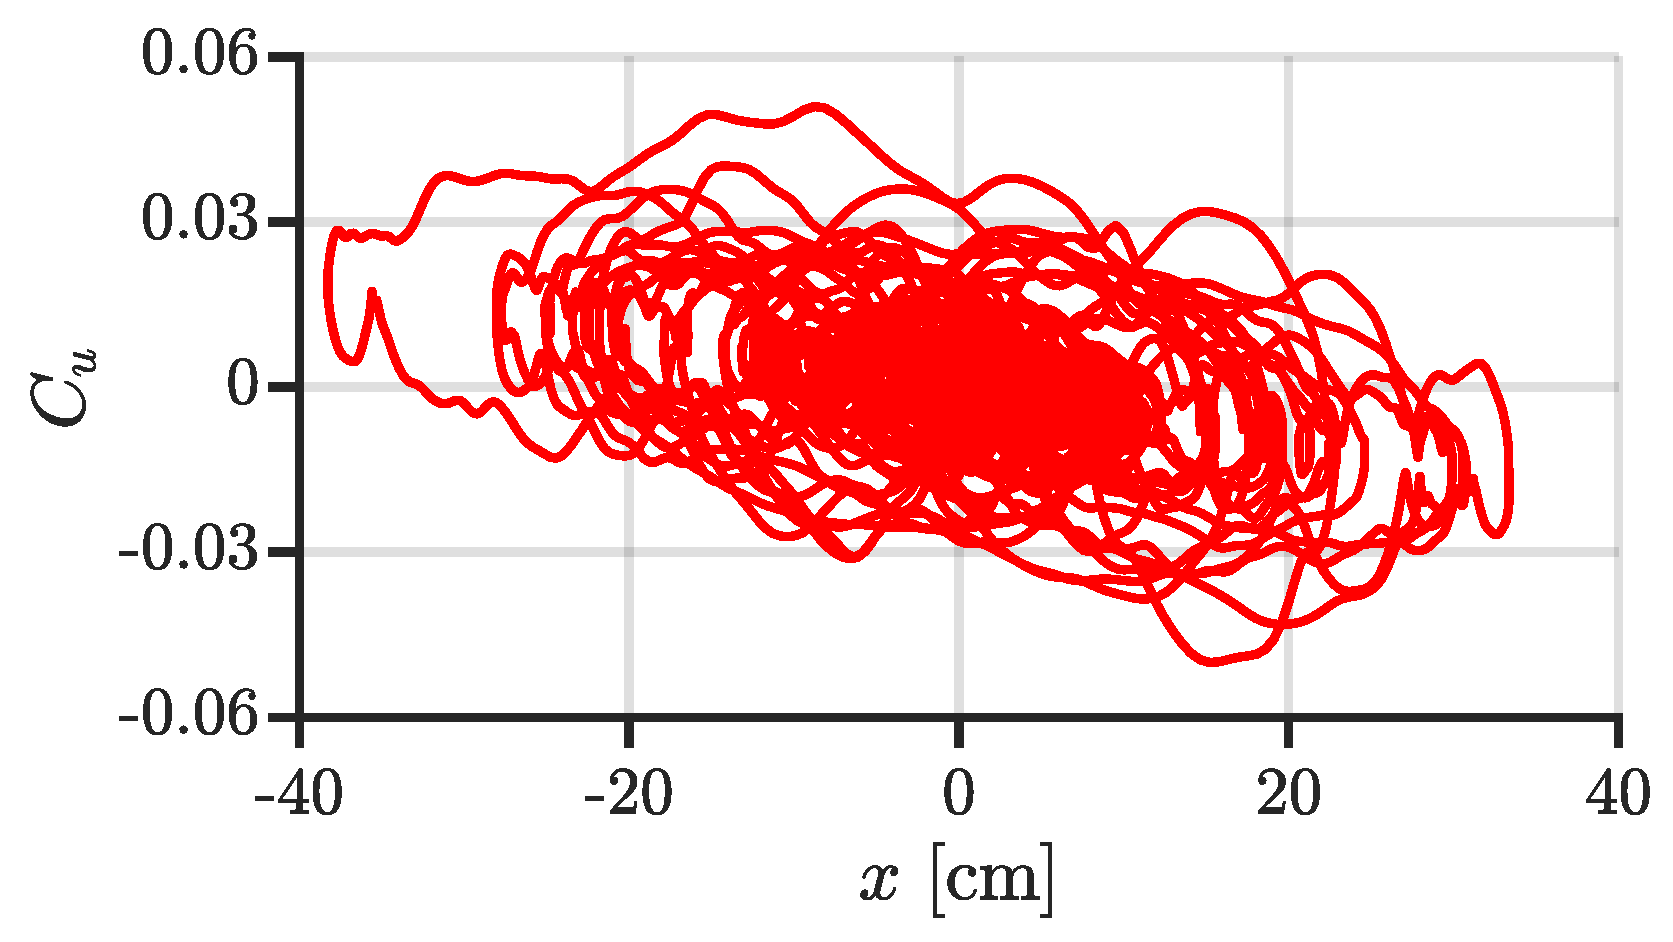
Figure 11 shows time–history waves of responses of the model selected in the design example of the design method. Figure 12 shows the relationship between displacement and control force. From Figure 11 and Figure 12, the following results are obtained:
- The responses of the control system are suppressed by ASC.
- The limitations on the maximum responses and maximum control force are met.
- The estimated maximum responses and maximum control force match simulation results.
- The controller provides additional negative stiffness and positive damping to the system.
Therefore, the effectiveness of the design method is validated.
Figure 11.
Time–history wave of design example (Code Hachinohe, , , , ): (a) displacement response, (b) velocity response, (c) absolute acceleration response, and (d) shear-force coefficient of control force.
Figure 11.
Time–history wave of design example (Code Hachinohe, , , , ): (a) displacement response, (b) velocity response, (c) absolute acceleration response, and (d) shear-force coefficient of control force.
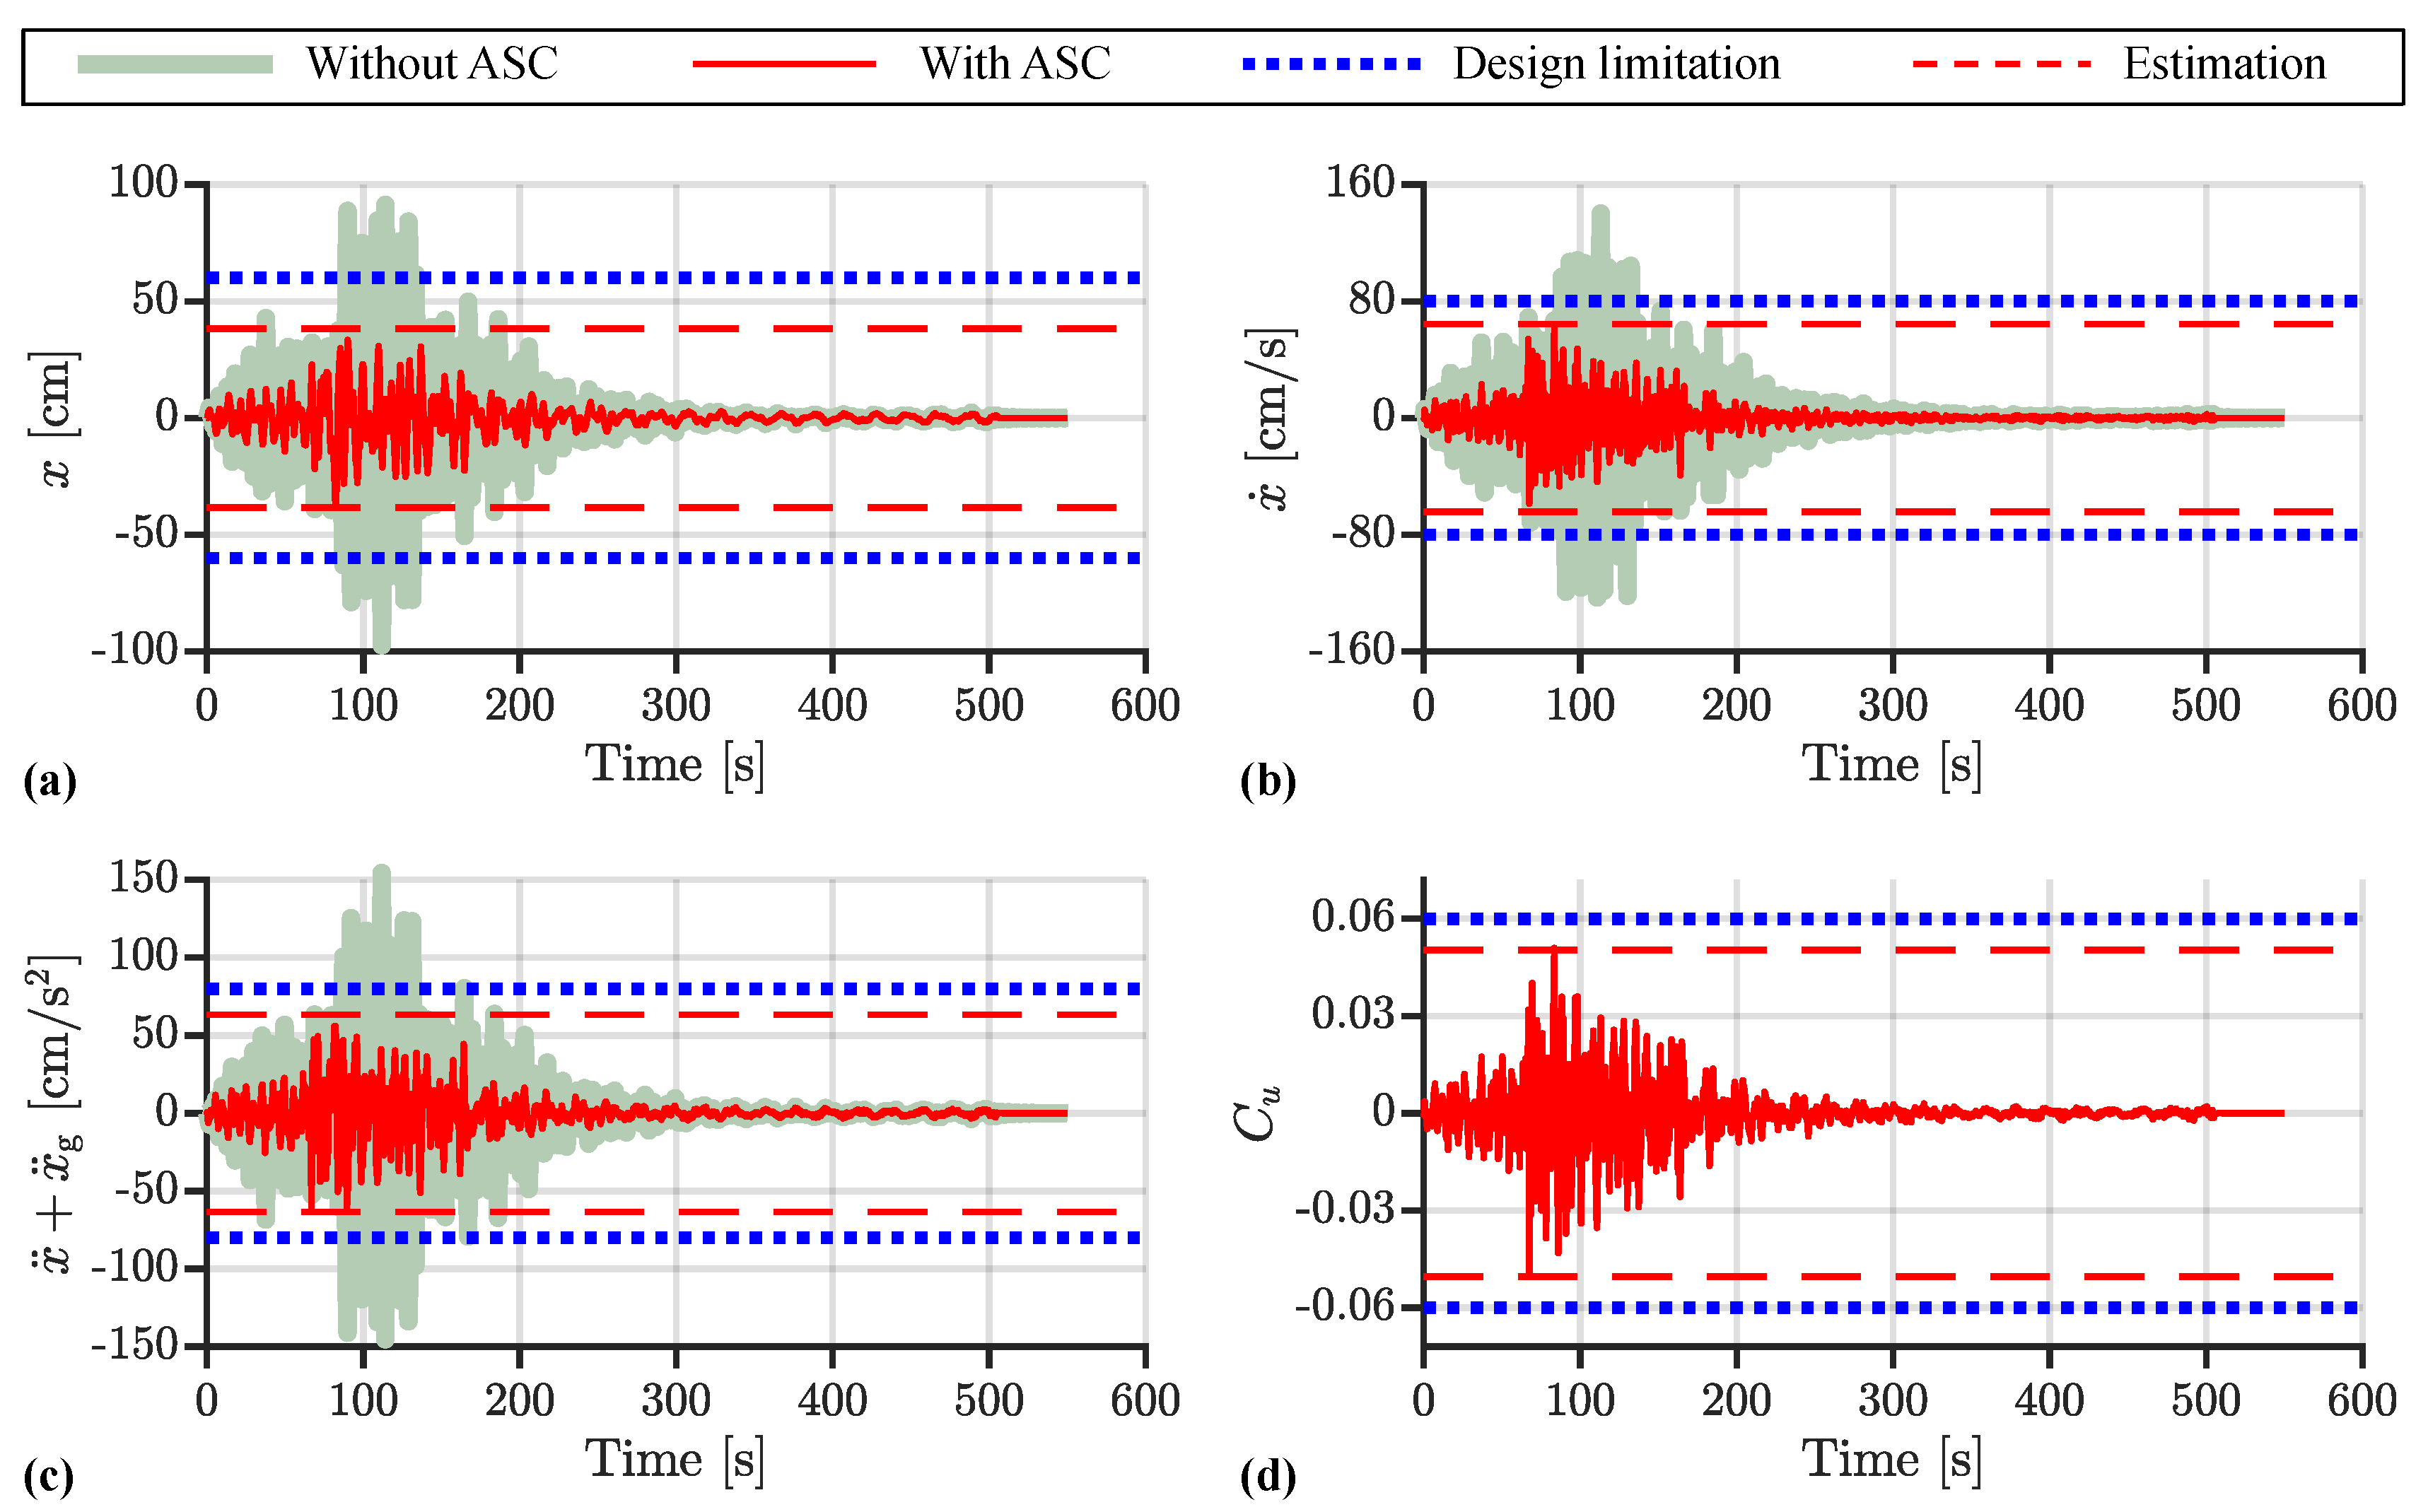
Figure 12.
Force–displacement loop: shear-force coefficient of control force.
6. Conclusions
This paper constructed the equivalent model to theoretically express the dynamic characteristics of feedback control systems. The maximum responses of feedback control systems are estimated via response spectra of the earthquake wave. Moreover, this paper devised the control-force spectrum, which expresses the dependency of the maximum control force for feedback control systems on the maximum responses. Thus, using the presented equivalent model and control-force spectrum, the maximum control force is theoretically estimated without additional numerical simulations. Numerical examples have shown that the estimation errors of the control-force prediction spectra are less than 10% for most cases. This paper also developed the design method, which illustrates the possible design area of the feedback gain and building, satisfying the design limitations and eliminating the trial-and-error approaches and numerical simulations. The effectiveness of the proposed design method was validated via a numerical design example. From the numerical examples, this paper clarified the following six points:
- (1)
- If , there are no estimation errors for all cases. The reason for this is that the control force only contains the velocity component when .
- (2)
- Since the phase difference usually occurs between the displacement and velocity, the estimation error may occur if .
- (3)
- The maximum control force decreases as the equivalent damping ratio increases in the resonance range.
- (4)
- The maximum shear-force coefficient of control force increases as the equivalent damping ratio, , increases if .
- (5)
- The responses of the design example are suppressed by ASC.
- (6)
- The controller of the design example provides additional negative stiffness and positive damping.
Author Contributions
Conceptualization, Y.C. and D.S.; methodology, Y.C., D.S, K.M. and J.S.; software, Y.C.; validation, D.S., K.M. and J.S.; formal analysis, D.S, K.M. and J.S.; investigation, Y.C.; data curation, Y.C.; writing—original draft preparation, Y.C.; writing—review and editing, Y.C.; visualization, Y.C.; supervision, D.S. and J.S.; project administration, D.S. All authors have read and agreed to the published version of the manuscript.
Funding
This research received no external funding.
Institutional Review Board Statement
Not applicable.
Informed Consent Statement
Not applicable.
Data Availability Statement
The data that support the findings of this study are available from the corresponding author, Y.C., upon reasonable request.
Conflicts of Interest
The authors declare no conflict of interest.
Appendix A. Accuracy Verification of the Control-Force Spectrum
This section uses the FEMA P695 wave list [21] to verify the accuracy of the control-force spectrum, . Table A1 shows the information of the FEMA P695 wave list. The parameters of the models used in this section are shown below:
: 2 s, 4 s, and 6 s;
: 0.01 and 0.05;
: 0.01∼10 s per 0.01 s;
: 0.1, 0.3, 0.5, and 0.7.

Table A1.
FEMA P695 wave list [21].
Table A1.
FEMA P695 wave list [21].
| No. | Name | Recording Station | Year-M. | PGA [cm/s2] | PGV [cm/s] | ||
|---|---|---|---|---|---|---|---|
| comp. 1 | comp. 2 | comp. 1 | comp. 2 | ||||
| 1 | Northridge | Beverly Hills—Mulhol | 1994-6.7 | 407.00 | 506.00 | 58.89 | 62.57 |
| 2 | Northridge | Canyon Country—WLC | 1994-6.7 | 344.00 | 472.00 | 22.00 | 44.86 |
| 3 | Duzce | Bolu | 1999-7.1 | 713.00 | 806.00 | 56.43 | 62.03 |
| 4 | Hector Mine | Hector | 1999-7.1 | 260.00 | 330.00 | 28.52 | 41.67 |
| 5 | Imperial Valley | Delta | 1979-6.5 | 233.00 | 344.00 | 25.93 | 32.93 |
| 6 | Imperial Valley | El Centro Array #11 | 1979-6.5 | 357.00 | 372.00 | 34.41 | 42.09 |
| 7 | Kobe | Nishi—Akashi | 1995-6.9 | 499.00 | 493.00 | 37.24 | 36.54 |
| 8 | Kobe | Shin—Osaka | 1995-6.9 | 238.00 | 208.00 | 37.77 | 27.85 |
| 9 | Kocaeli | Duzce | 1999-7.5 | 306.00 | 351.00 | 58.80 | 46.33 |
| 10 | Kocaeli | Arcelik | 1999-7.5 | 214.00 | 147.00 | 17.67 | 39.53 |
| 11 | Landers | Yermo Fire Station | 1992-7.3 | 240.00 | 148.00 | 51.27 | 29.72 |
| 12 | Landers | Coolwater | 1992-7.3 | 278.32 | 408.66 | 275.47 | 433.74 |
| 13 | Loma Prieta | Capitola | 1989-6.9 | 518.00 | 434.00 | 34.94 | 29.16 |
| 14 | Loma Prieta | Gilroy Array #3 | 1989-6.9 | 544.00 | 360.00 | 35.66 | 44.61 |
| 15 | Manjil | Abbar | 1990-7.4 | 504.70 | 487.06 | 42.41 | 50.69 |
| 16 | Superstition Hills | El Centro Imp. Co. | 1987-6.5 | 351.00 | 253.00 | 46.30 | 40.82 |
| 17 | Superstition Hills | Poe Road (temp) | 1987-6.5 | 437.00 | 294.00 | 35.65 | 32.74 |
| 18 | Cape Mendocino | Rio Dell Overpass | 1992-7.0 | 378.00 | 538.00 | 43.72 | 41.81 |
| 19 | Chi-Chi | CHY101 | 1999-7.6 | 346.00 | 431.00 | 70.52 | 114.93 |
| 20 | Chi-Chi | TCU045 | 1999-7.6 | 487.06 | 348.88 | 12.67 | 20.54 |
| 21 | San Fernando | LA—Hollywood Stor | 1971-6.6 | 206.00 | 171.00 | 18.81 | 14.81 |
| 22 | Friuli | Tolmezzo | 1976-6.5 | 344.00 | 309.00 | 22.00 | 30.75 |
Two methods, the absolute sum (ABS) method and the square root of the sum of squares (SRSS) method, are used to compare the estimation errors:
We select the cases of , component 1 of Imperial Vally wave of El Centro Array #11 recording (FEMA ID No. 6) and component 1 of Kobe wave of Nishi-Akasaki recording (FEMA ID No. 7) to show the estimation errors. Figure A1 presents the estimation errors of the ABS method, and Figure A2 presents those of the SRSS method. Furthermore, the estimation errors, e, are calculated by the following equation:
where is the shear-force coefficient of the maximum control force calculated by the numerical simulations (real value). From Figure A1 and Figure A2, the following results are obtained:
- (1)
- The estimation error of the ABS method is obviously larger than that of the SRSS method.
- (2)
- The estimation error of the ABS method is always larger than 0.
- (3)
- The estimation error of the SRSS method is less than 20% for the two selected cases.
- (4)
Figure A3 shows the mean value of the estimation errors, , and the standard derivation of the maximum estimation errors, , using the ABS method and the SRSS method for all equivalent natural periods (). In addition, the mean value and the standard derivation of the estimation errors for all equivalent natural periods, , are calculated by
where is the number of cases of the equivalent natural period (in this section, is 1000). From Figure A3, the following results are obtained:
- (1)
- The mean value and standard derivation of the maximum estimation errors of the SRSS method are larger than that of the ABS method.
- (2)
- The estimation errors of the SRSS method are less than 20% for most cases.
Table A2 shows the mean value of , , and the mean value of , for all waves of the ABS method and SRSS method:
where is the number of cases of the waves (in this section is 44).
From Table A2, the following results are obtained:
- (1)
- Both the mean value of the estimation error and the standard derivation of the estimation error of the SRSS method are obviously less than that of the ABS method.
- (2)
- The mean values of the standard derivation of the estimation error of the SRSS method for each case are less than 8%.
Thus, this paper uses the SRSS method to estimate the maximum control force.
Figure A1.
Accuracy of (): (a) component 1 of No. 6 wave, (b) component 1 of No. 7 wave.

Figure A2.
Accuracy of (): (a) component 1 of No. 6 wave, (b) component 1 of No. 7 wave.
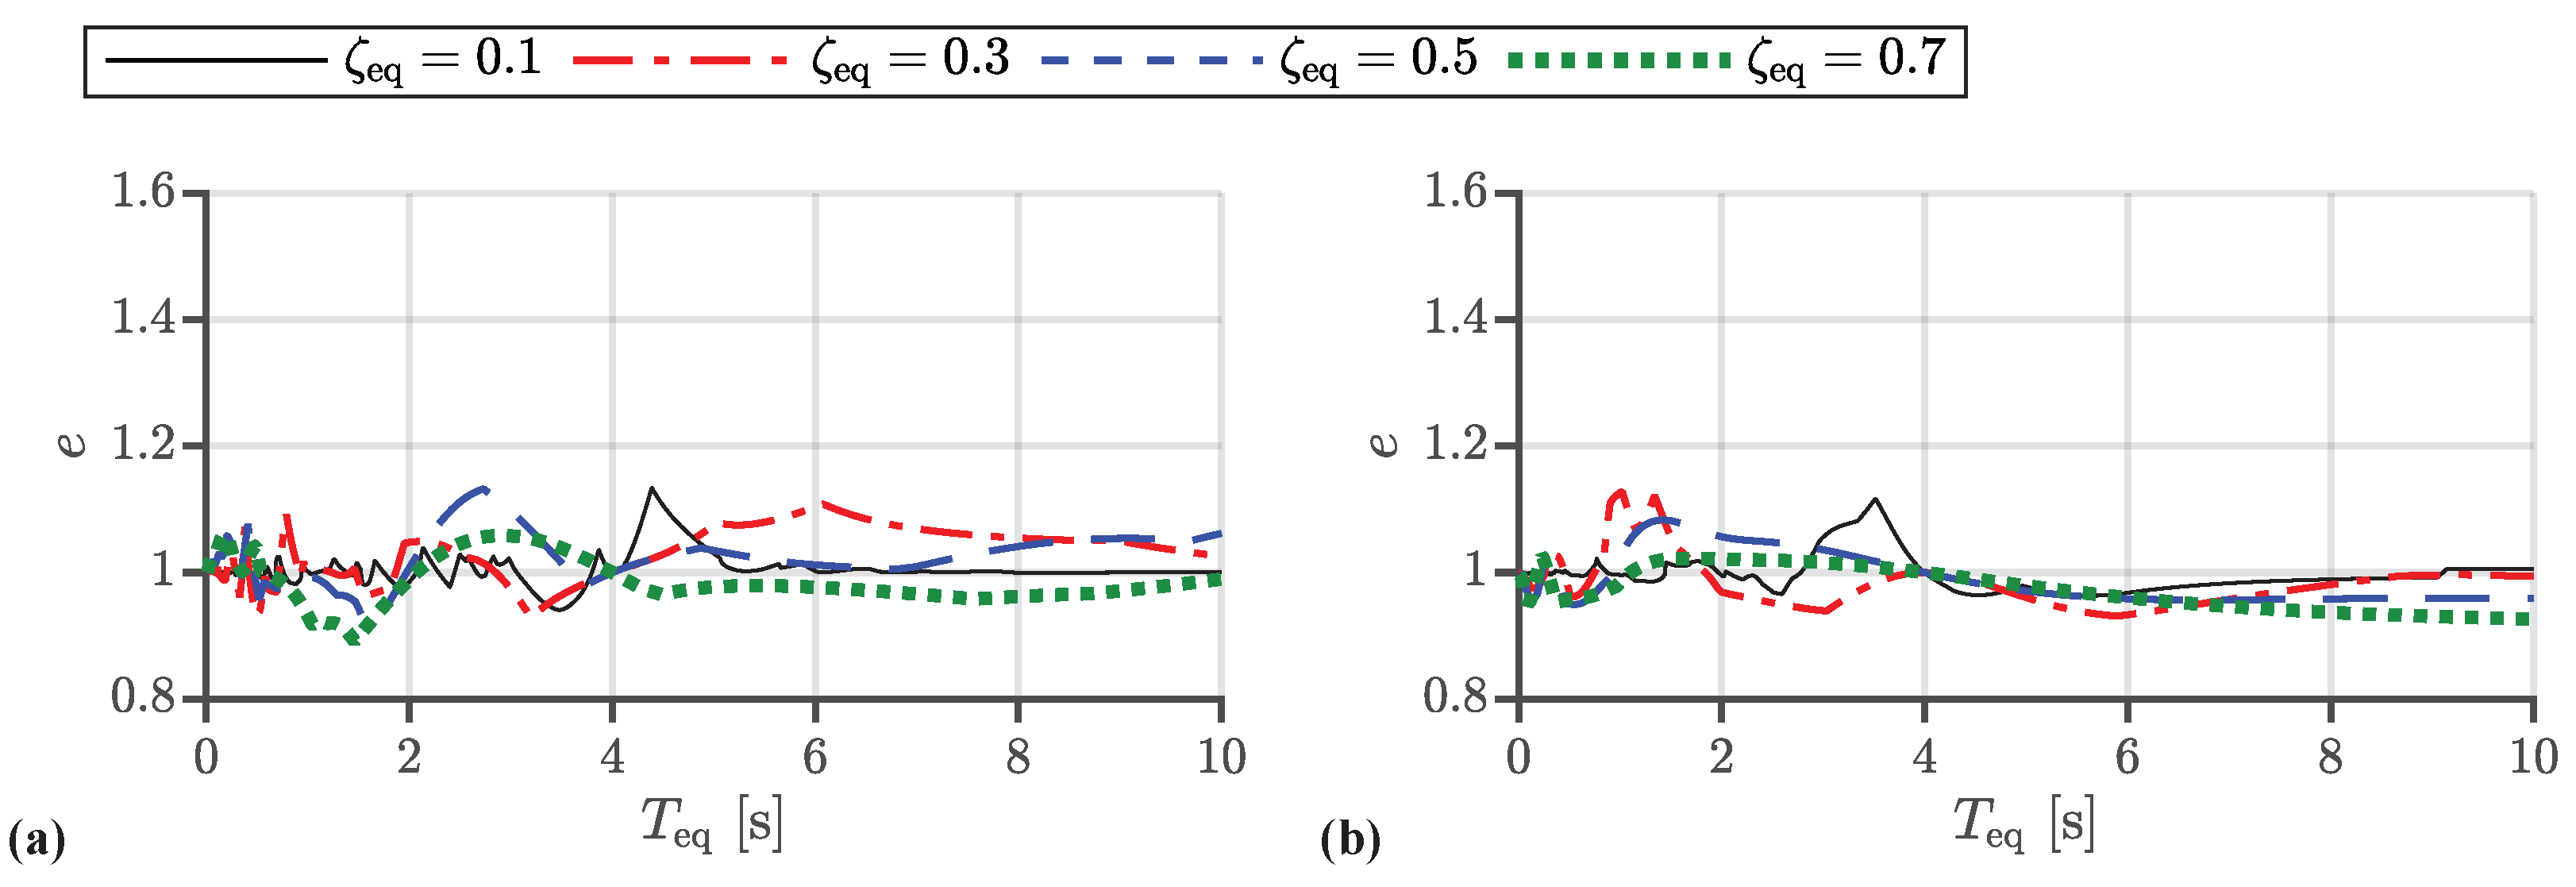
Figure A3.
Estimation error of control-force spectrum of FEMA waves (, , : 0.01∼10 s per 0.01 s): (a) , (b) , (c) , and (d) .
Figure A3.
Estimation error of control-force spectrum of FEMA waves (, , : 0.01∼10 s per 0.01 s): (a) , (b) , (c) , and (d) .
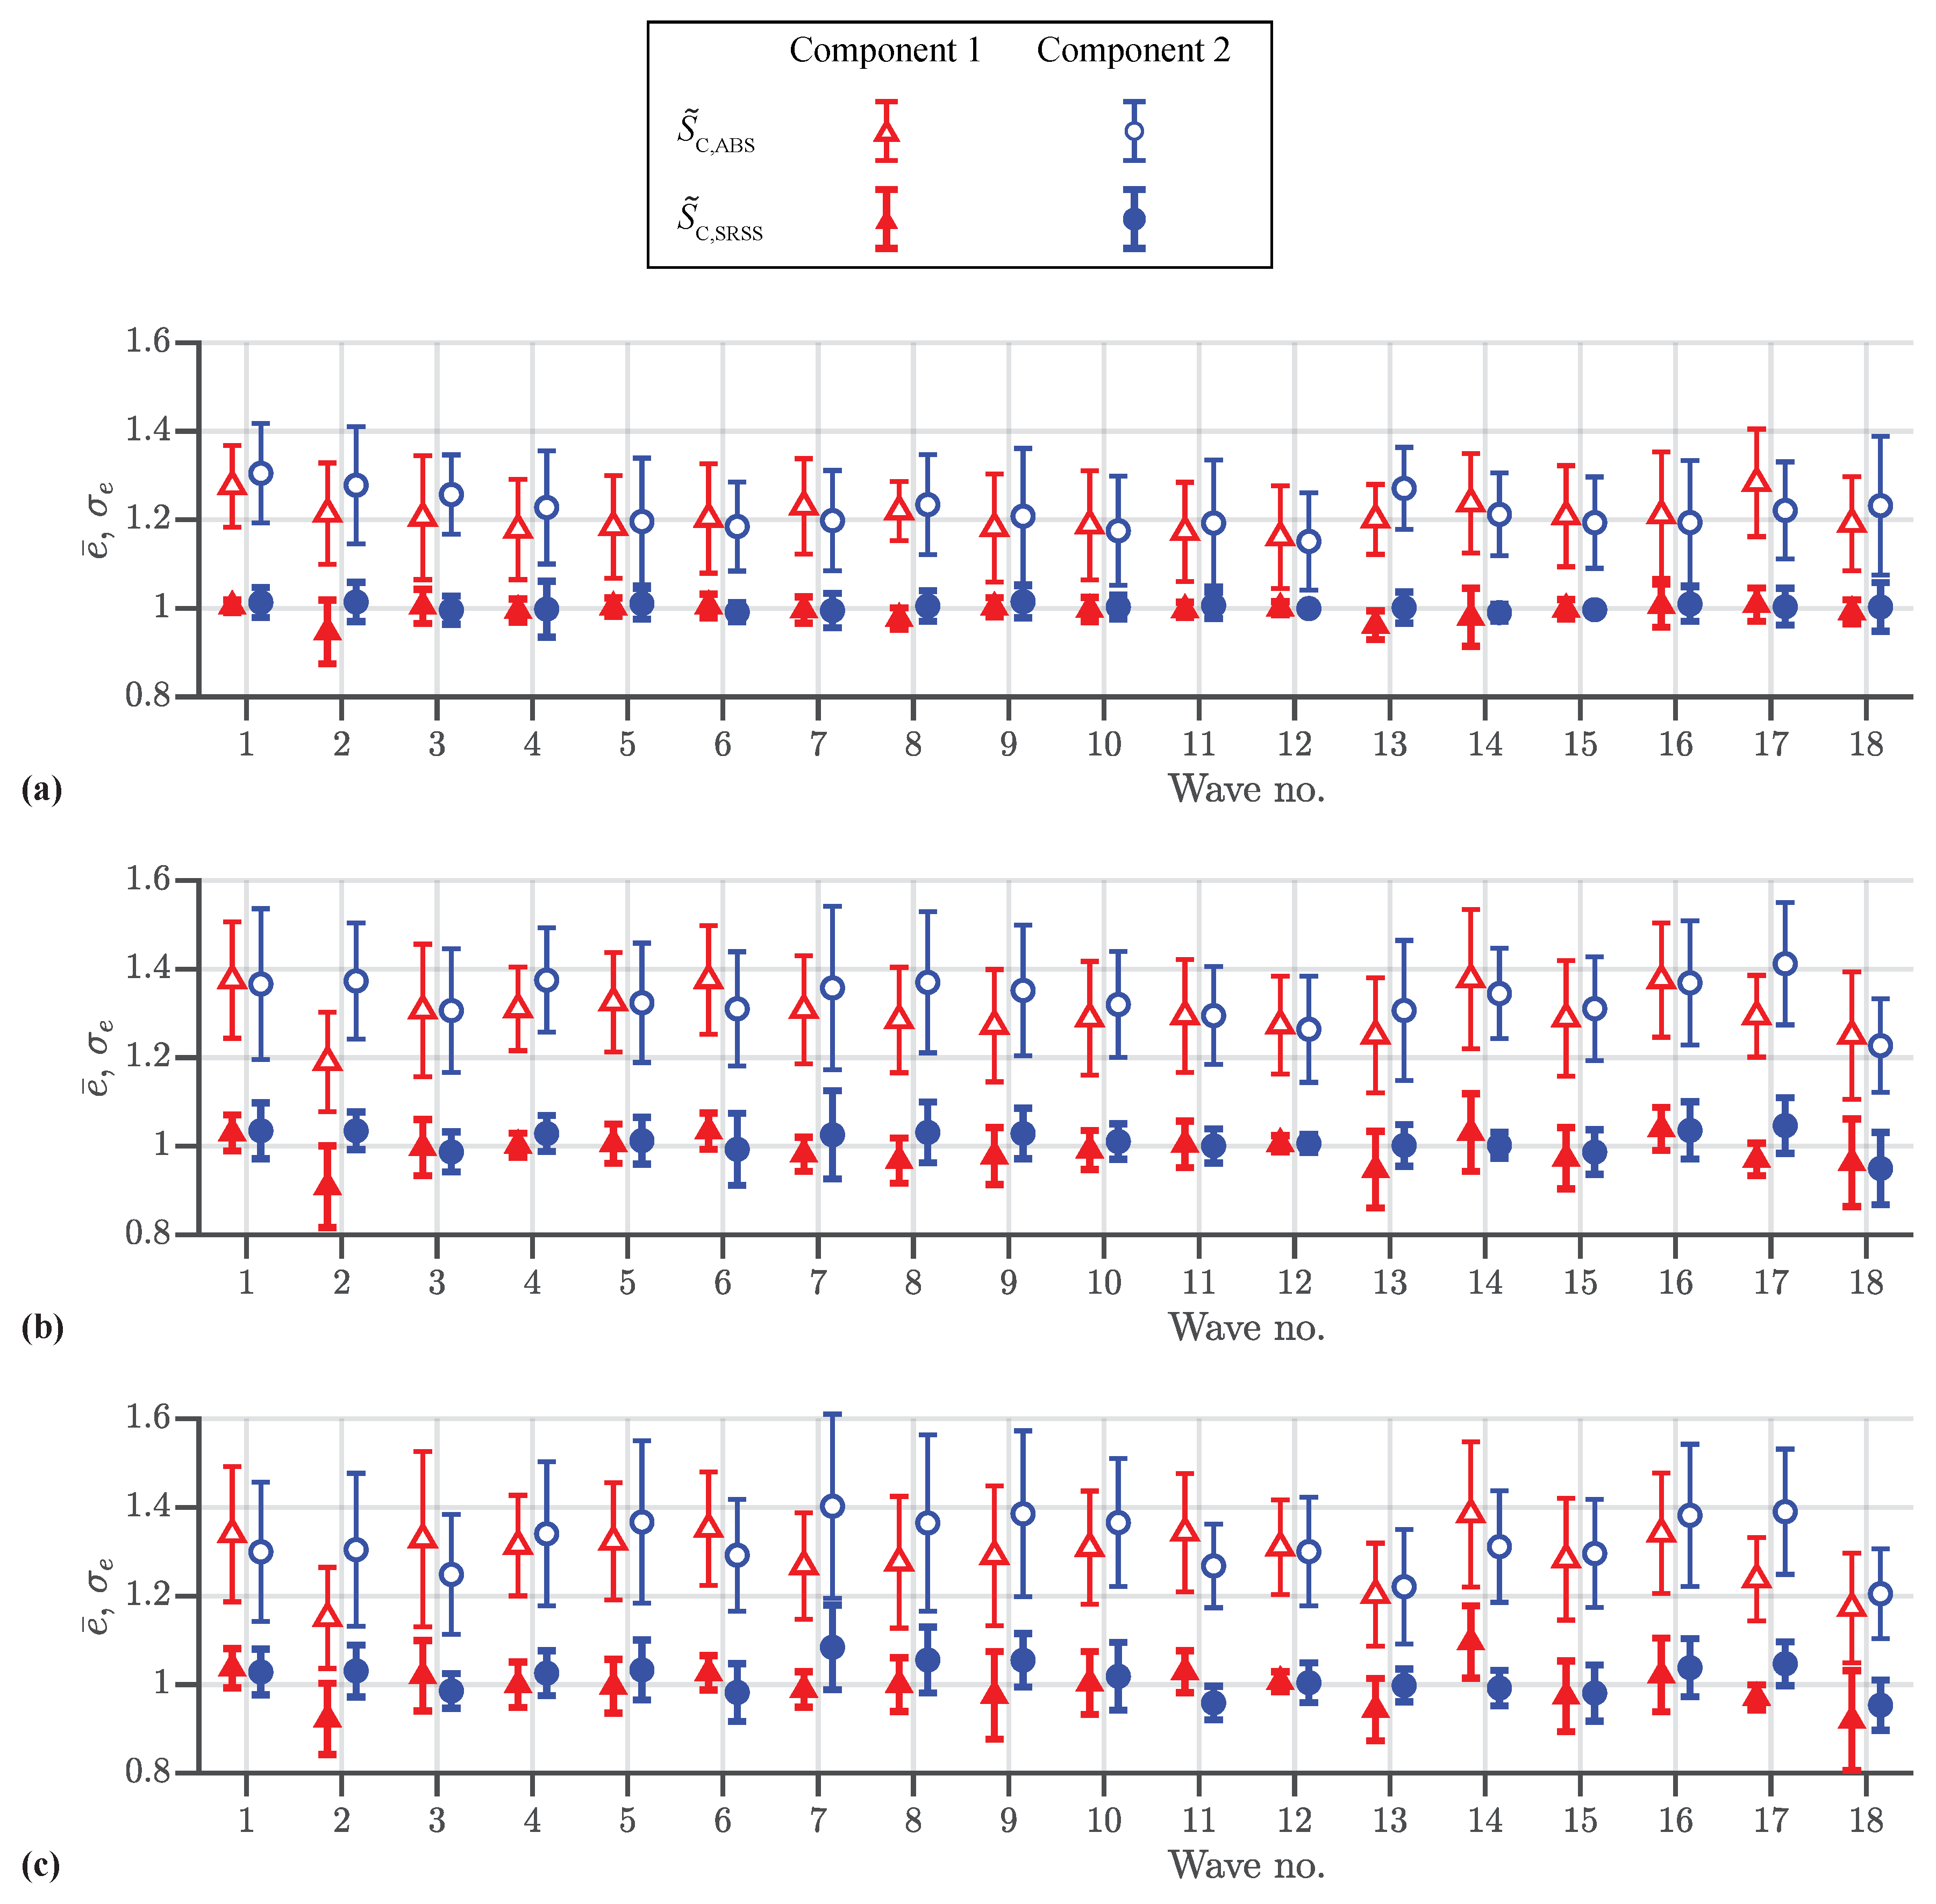
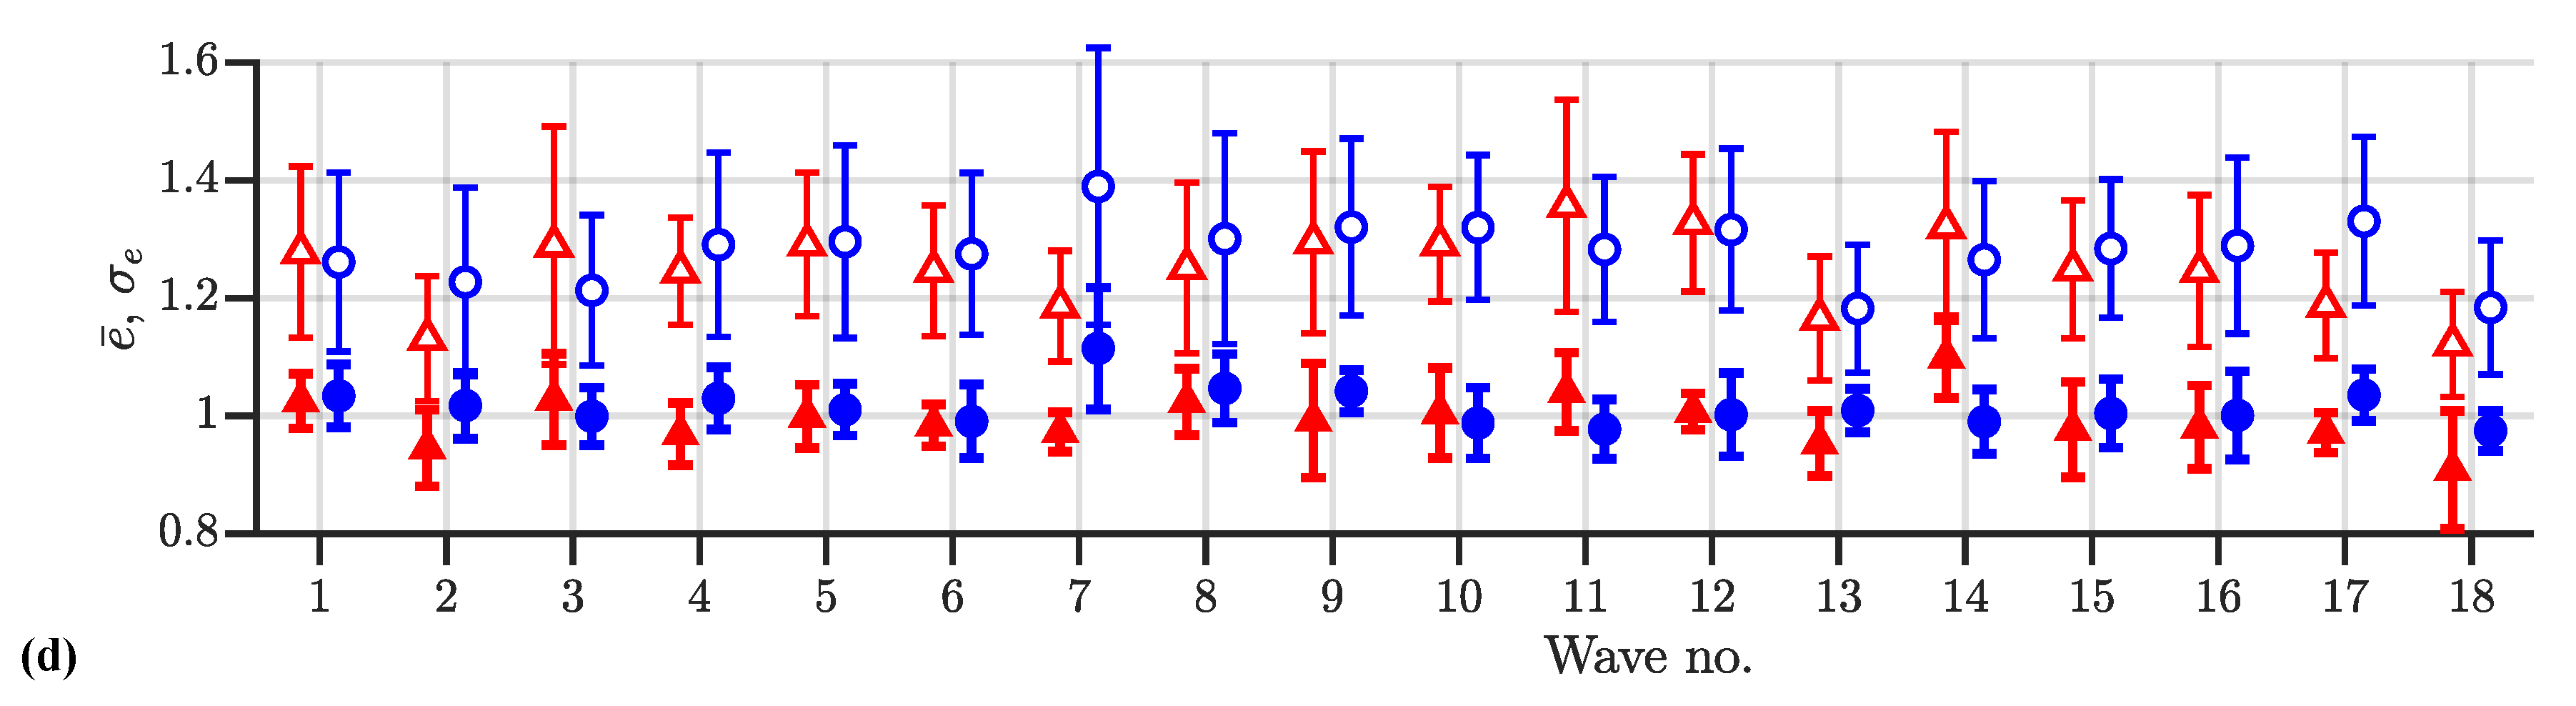
Table A2.
Standard derivation of estimation errors for 44 cases.
| ABS Method | SRSS Method | |||||
|---|---|---|---|---|---|---|
| 2 s | 0.01 | 0.10 | 10.79% | 11.92% | −0.04% | 2.26% |
| 0.30 | 21.21% | 14.00% | −0.26% | 4.46% | ||
| 0.50 | 25.93% | 14.22% | −0.30% | 6.04% | ||
| 0.70 | 27.74% | 14.26% | −0.64% | 6.86% | ||
| 0.05 | 0.10 | 7.98% | 10.17% | −0.04% | 1.69% | |
| 0.30 | 17.36% | 15.31% | −0.09% | 4.07% | ||
| 0.50 | 23.30% | 14.59% | −0.23% | 5.46% | ||
| 0.70 | 26.16% | 14.31% | −0.52% | 6.51% | ||
| 4 s | 0.01 | 0.10 | 21.47% | 12.46% | −0.27% | 4.16% |
| 0.30 | 31.56% | 14.05% | 0.04% | 6.82% | ||
| 0.50 | 30.23% | 15.89% | 0.49% | 7.88% | ||
| 0.70 | 26.06% | 15.33% | 0.23% | 7.45% | ||
| 0.05 | 0.10 | 14.52% | 13.42% | −0.10% | 3.10% | |
| 0.30 | 30.31% | 13.81% | −0.07% | 6.35% | ||
| 0.50 | 30.72% | 15.73% | 0.55% | 7.76% | ||
| 0.70 | 26.86% | 15.45% | 0.30% | 7.52% | ||
| 6 s | 0.01 | 0.10 | 27.40% | 12.53% | −0.32% | 5.60% |
| 0.30 | 29.21% | 15.03% | −0.26% | 7.30% | ||
| 0.50 | 23.45% | 15.54% | −0.28% | 6.70% | ||
| 0.70 | 19.23% | 14.82% | 0.16% | 6.25% | ||
| 0.05 | 0.10 | 22.58% | 12.32% | −0.23% | 4.22% | |
| 0.30 | 30.29% | 14.83% | −0.22% | 7.38% | ||
| 0.50 | 24.32% | 15.58% | −0.27% | 6.85% | ||
| 0.70 | 19.79% | 14.88% | 0.15% | 6.37% | ||
= 0.01~10 s per 0.01 s (1000 data for each wave).
Appendix B. Analysis of Numerical Examples of Control-Force Spectrum
This section analyzes the reason for the results for the numerical examples of the control-force spectrum (Figure 8) using response spectra. Figure A4, Figure A5, Figure A6 and Figure A7 present the displacement response spectra, , and velocity response spectra of Taft NS, El Centro 1940 NS, JMA Kobe NS, and Code Hachinohe, respectively.
Result 1:
The maximum control force decreases as the equivalent damping ratio, , increases if .
Reason for result 1:
From Equation (19), the maximum control force increases as the maximum displacement response or maximum velocity response increases. From Figure A4, Figure A5, Figure A6 and Figure A7, it can be seen that the maximum displacement response and the maximum velocity response decrease as the equivalent damping ratio increases. Thus the maximum control force decreases as the equivalent damping ratio increases if .
Result 2:
The maximum control force increases as the equivalent damping ratio, , increases, if .
Reason for result 2:
Since the values of m, g, , and ) in (A8) are constant for one case, the value of increases as equivalent damping increases.
Result 3:
The maximum control force increases as the equivalent natural period, , increases if only for the case of Code Hachinohe.
Reason for result 3:
The Code Hachinohe is a code design wave. The maximum displacement response of a structure increases as the equivalent natural period increases under the Code Hachinohe wave. Since the maximum control force increases as the maximum displacement response, the maximum control force increases as the equivalent natural period, , increases only for the case of Code Hachinohe.
Figure A4.
Response spectra of Tatf NS: (a) displacement response spectrum and (b) velocity response spectrum.
Figure A4.
Response spectra of Tatf NS: (a) displacement response spectrum and (b) velocity response spectrum.
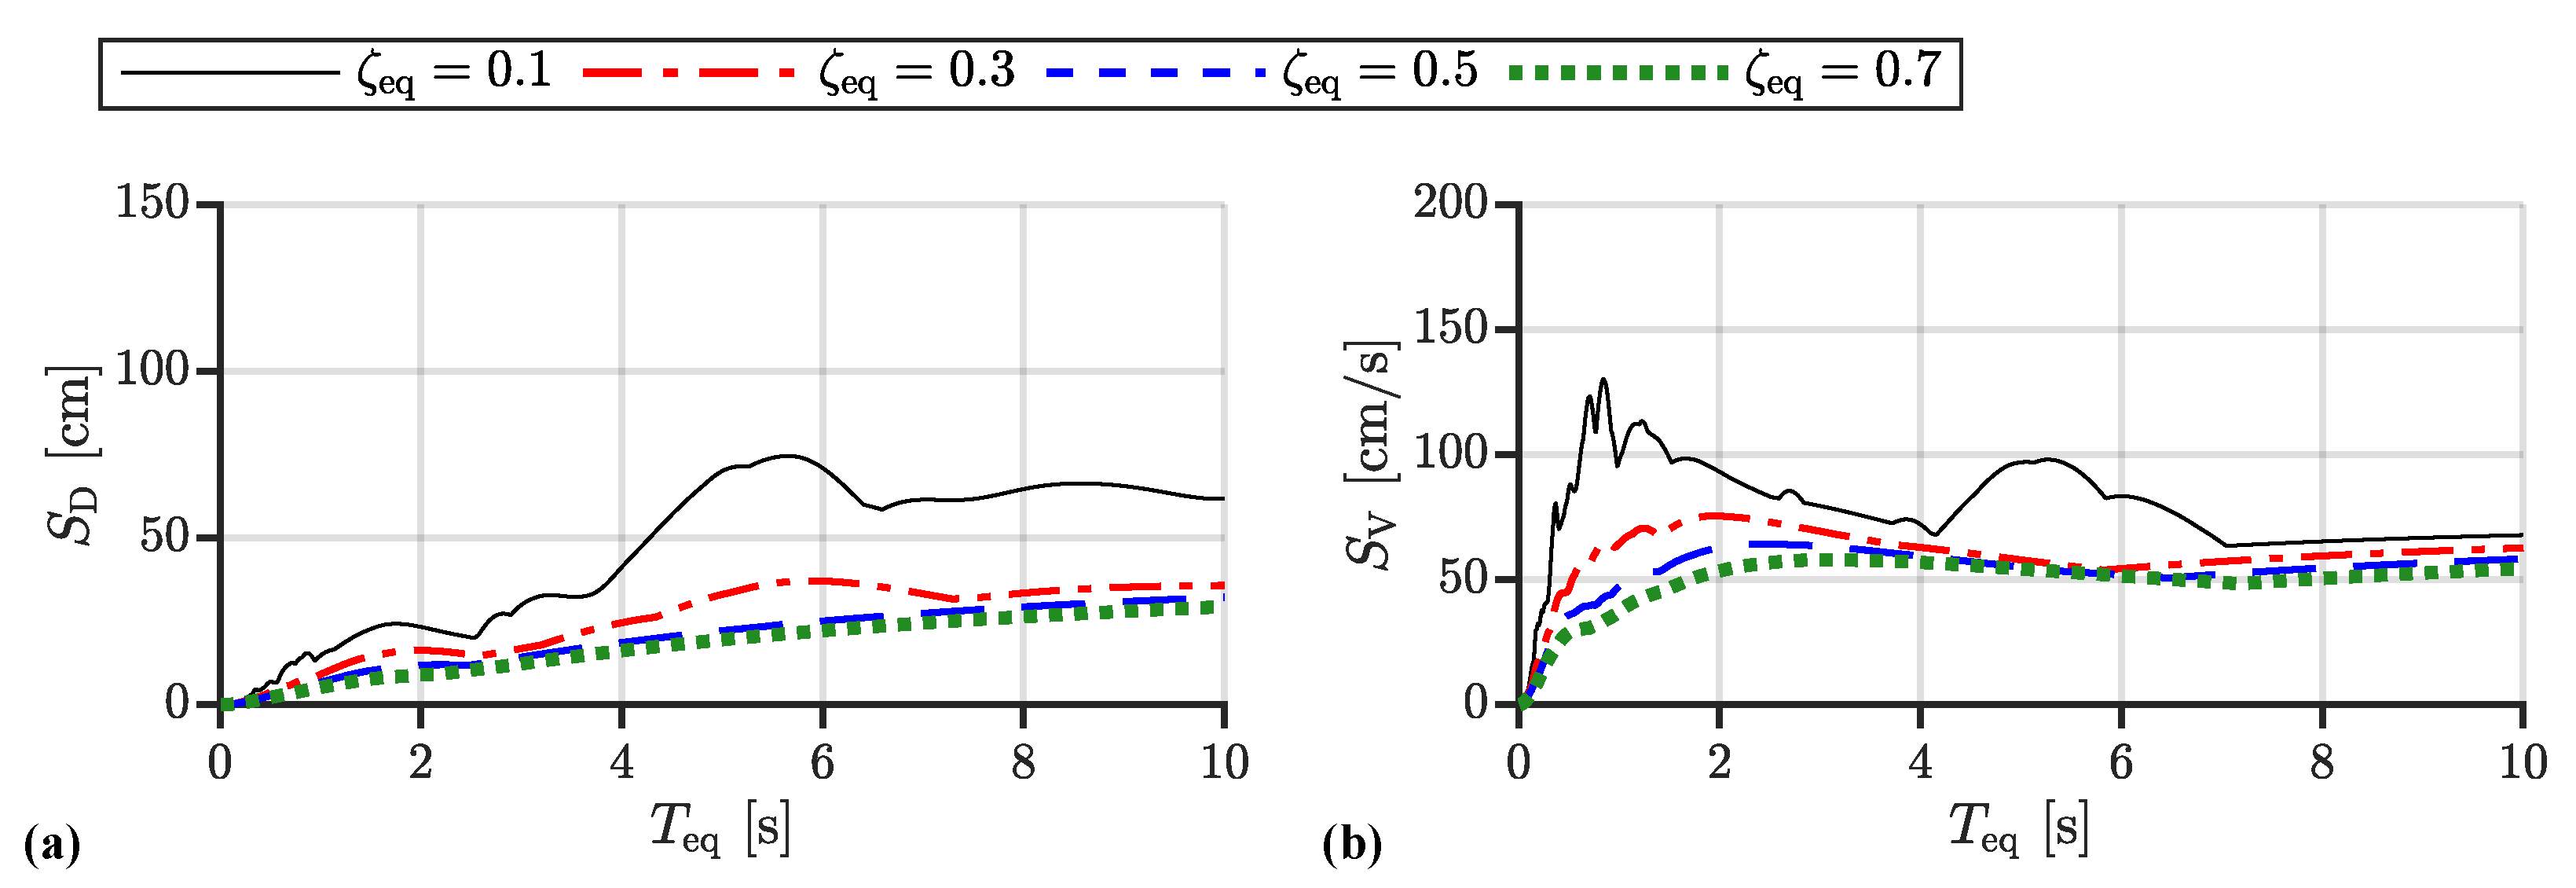
Figure A5.
Response spectra of El Centro 1940 NS: (a) displacement response spectrum and (b) velocity response spectrum.
Figure A5.
Response spectra of El Centro 1940 NS: (a) displacement response spectrum and (b) velocity response spectrum.
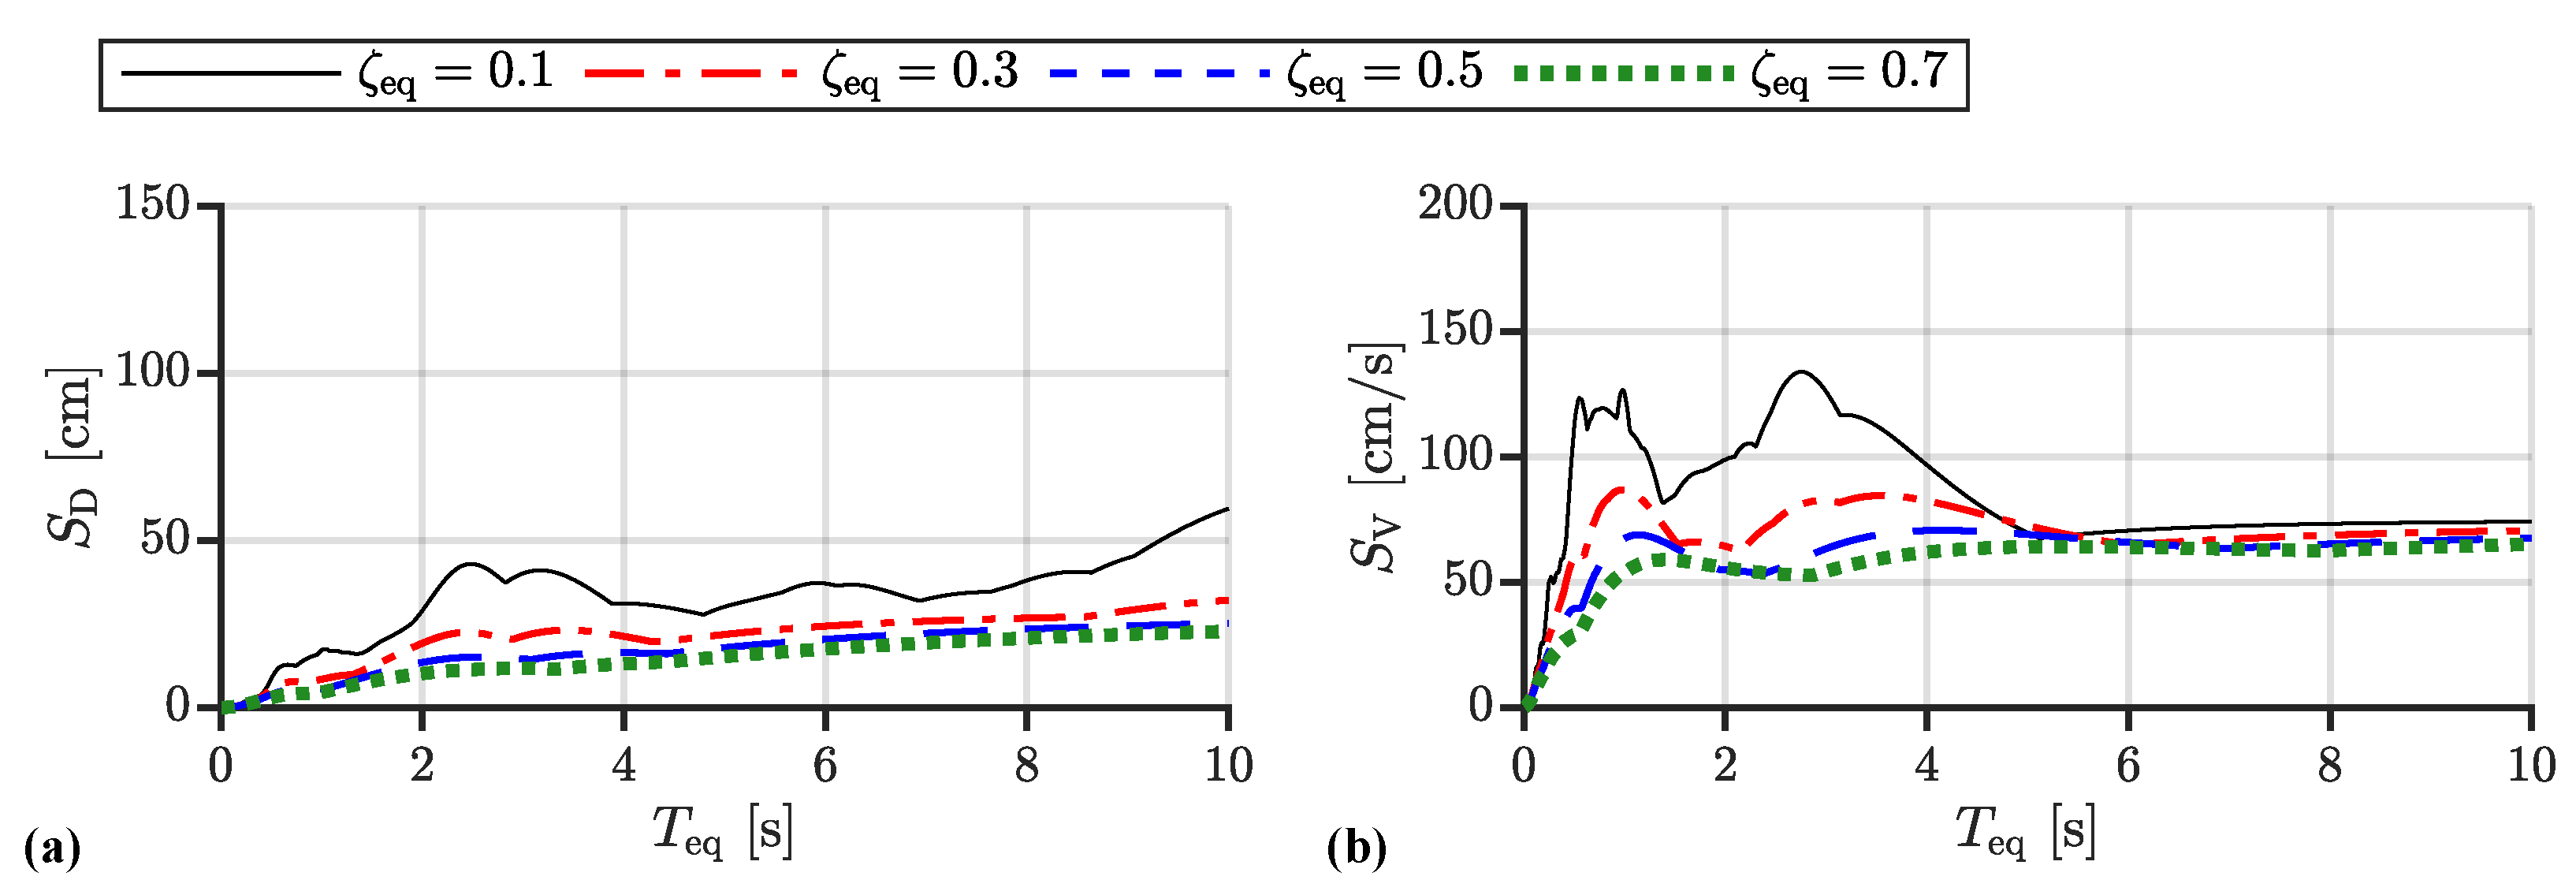
Figure A6.
Response spectra of JMA Kobe NS: (a) displacement response spectrum and (b) velocity response spectrum.
Figure A6.
Response spectra of JMA Kobe NS: (a) displacement response spectrum and (b) velocity response spectrum.
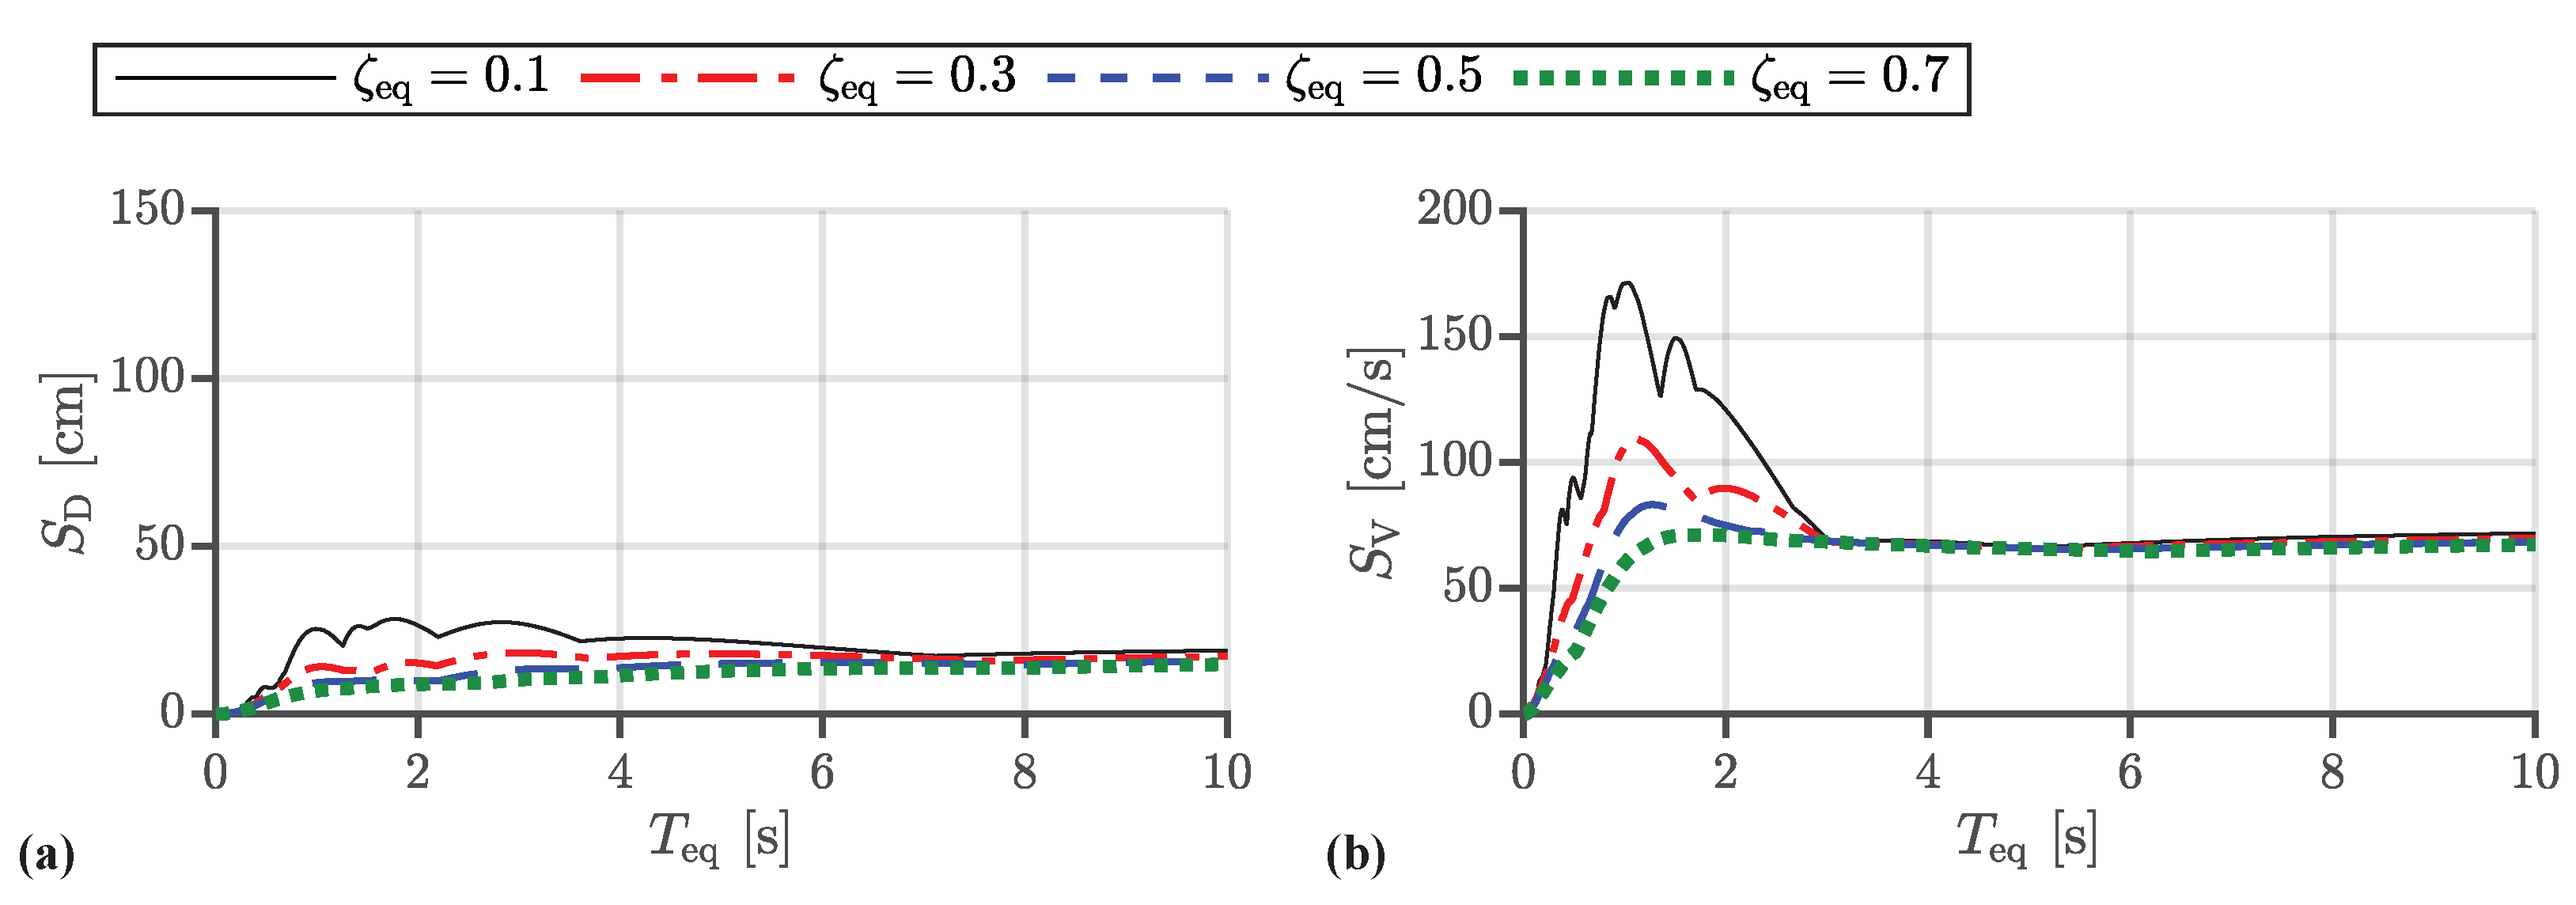
Figure A7.
Response spectra of Code Hachinohe: (a) displacement response spectrum and (b) velocity response spectrum.
Figure A7.
Response spectra of Code Hachinohe: (a) displacement response spectrum and (b) velocity response spectrum.

References
- Sheikh, H.; Van Engelen, N.C.; Ruparathna, R. A review of base isolation systems with adaptive characteristics. Structures 2022, 38, 1542–1555. [Google Scholar] [CrossRef]
- Beirami Shahabi, A.; Zamani Ahari, G.; Barghian, M. Base Isolation Systems—A State of the Art Review According to Their Mechanism. J. Rehabil. Civ. Eng. 2020, 8, 37–61. [Google Scholar] [CrossRef]
- Yutaka, N.; Keiichi, O. Review on seismic isolation and response control methods of buildings in Japan. Geoenviron. Disasters 2019, 6, 7. [Google Scholar] [CrossRef]
- Mazza, F. Base-isolation of a hospital pavilion against in-plane-out-of-plane seismic collapse of masonry infills. Eng. Struct. 2021, 228, 111504. [Google Scholar] [CrossRef]
- Warn, G.P.; Ryan, K.L. A Review of Seismic Isolation for Buildings: Historical Development and Research Needs. Buildings 2012, 2, 300. [Google Scholar] [CrossRef]
- Architectural Institute of Japan. Design Recommendations for Seismically Isolated Buildings; Architectural Institute of Japan: Tokyo, Japan, 2016. [Google Scholar]
- Kelly, J.M. The role of damping in seismic isolation. Earthq. Eng. Struct. Dyn. 1999, 28, 3–20. [Google Scholar] [CrossRef]
- Ibrahim, R. Recent advances in nonlinear passive vibration isolators. J. Sound Vib. 2008, 314, 371–452. [Google Scholar] [CrossRef]
- Zhao, Y.; Cui, J.; Zhao, J.; Bian, X.; Zou, L. Improving Low Frequency Isolation Performance of Optical Platforms Using Electromagnetic Active-Negative-Stiffness Method. Appl. Sci. 2020, 10, 7342. [Google Scholar] [CrossRef]
- Septimiu, L.; Chira, F.; Roşca, V.O. Passive, Active and Semi-Active Control Systems in Civil Engineering. Constr. Arhit. 2005, 3, 23–32. [Google Scholar]
- Fisco, N.; Adeli, H. Smart structures: Part I—Active and semi-active control. Sci. Iran. 2011, 18, 275–284. [Google Scholar] [CrossRef]
- Nagarajaiah, S.; Sahasrabudhe, S. Seismic response control of smart sliding isolated buildings using variable stiffness systems: An experimental and numerical study. Earthq. Eng. Struct. Dyn. 2006, 35, 177–197. [Google Scholar] [CrossRef]
- Kataria, N.P.; Jangid, R. Seismic protection of the horizontally curved bridge with semi-active variable stiffness damper and isolation system. Adv. Struct. Eng. 2016, 19, 1103–1117. [Google Scholar] [CrossRef]
- Chen, Y.; Sato, D.; Miyamoto, K.; She, J. Estimating the maximum response and maximum control force for high-rise base-isolated buildings with active structural control in along-wind direction. Eng. Struct. 2020, 216, 110712. [Google Scholar] [CrossRef]
- Miyamoto, K.; She, J.; Sato, D.; Yasuo, N. Automatic determination of LQR weighting matrices for active structural control. Eng. Struct. 2018, 174, 308–321. [Google Scholar] [CrossRef]
- Shivashankar, P.; Gopalakrishnan, S. Review on the use of piezoelectric materials for active vibration, noise, and flow control. Smart Mater. Struct. 2020, 29, 053001. [Google Scholar] [CrossRef]
- Horiguchi, C.; Kohiyama, M. Simultaneous optimization of structural and control systems of a SDOF buildings with a linear quadratic regulator controller aiming at performance-based design. J. Struct. Constr. Eng. 2012, 77, 715–722. (In Japanese) [Google Scholar] [CrossRef]
- Kohiyama, M. Prediction of maximum control force of PD-controlled system under stationary white noise. In Proceedings of the 11th International Conference on Structural Safety and Reliability, New York, NY, USA, 16–20 June 2013; pp. 3871–3878. [Google Scholar] [CrossRef]
- Sato, D.; Chen, Y.; Miyamoto, K.; She, J. A spectrum for estimating the maximum control force for passive-base-isolated buildings with LQR control. Eng. Struct. 2019, 199, 109600. [Google Scholar] [CrossRef]
- Architectural Institute of Japan. AIJ Recommendations for Loads on Buildings; Architectural Institute of Japan: Tokyo, Japan, 2015. [Google Scholar]
- Federal Emergency Management Agency. Quantification of Building Seismic Performance Factors-FEMA P695; Federal Emergency Management Agency: Washington, DC, USA, 2009.
Figure 1.
Mathematical model (active model).
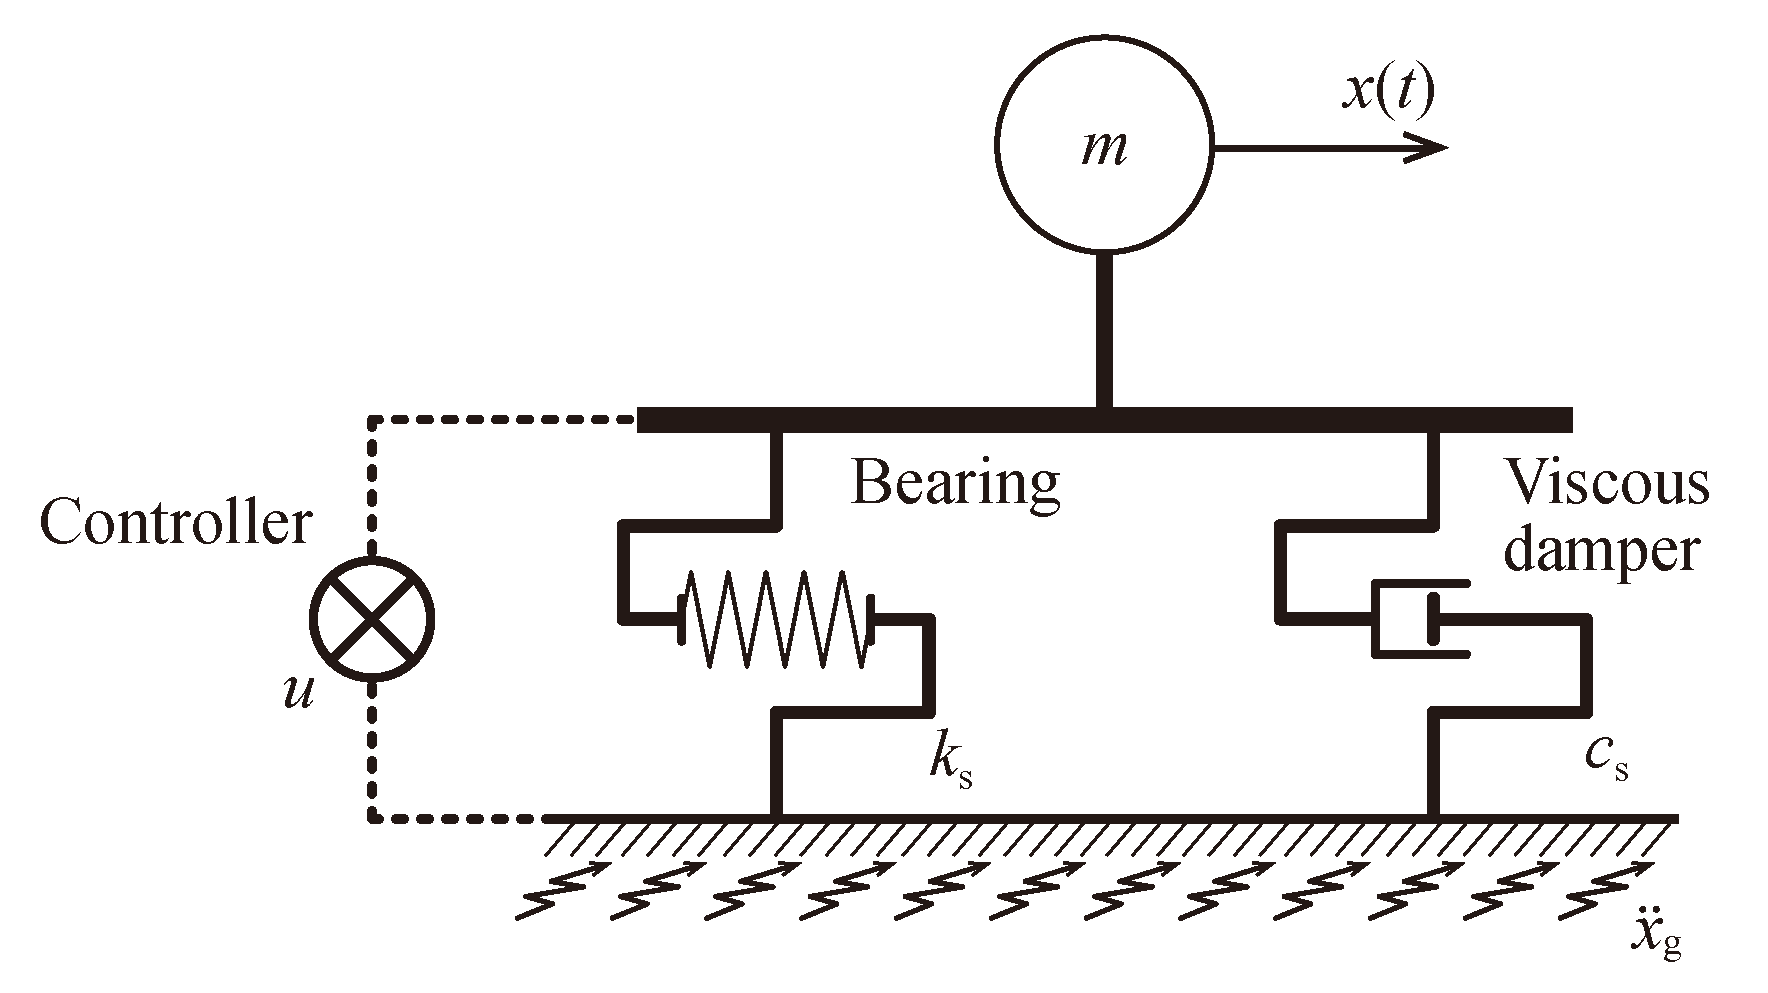
Figure 2.
Block diagram of control system.
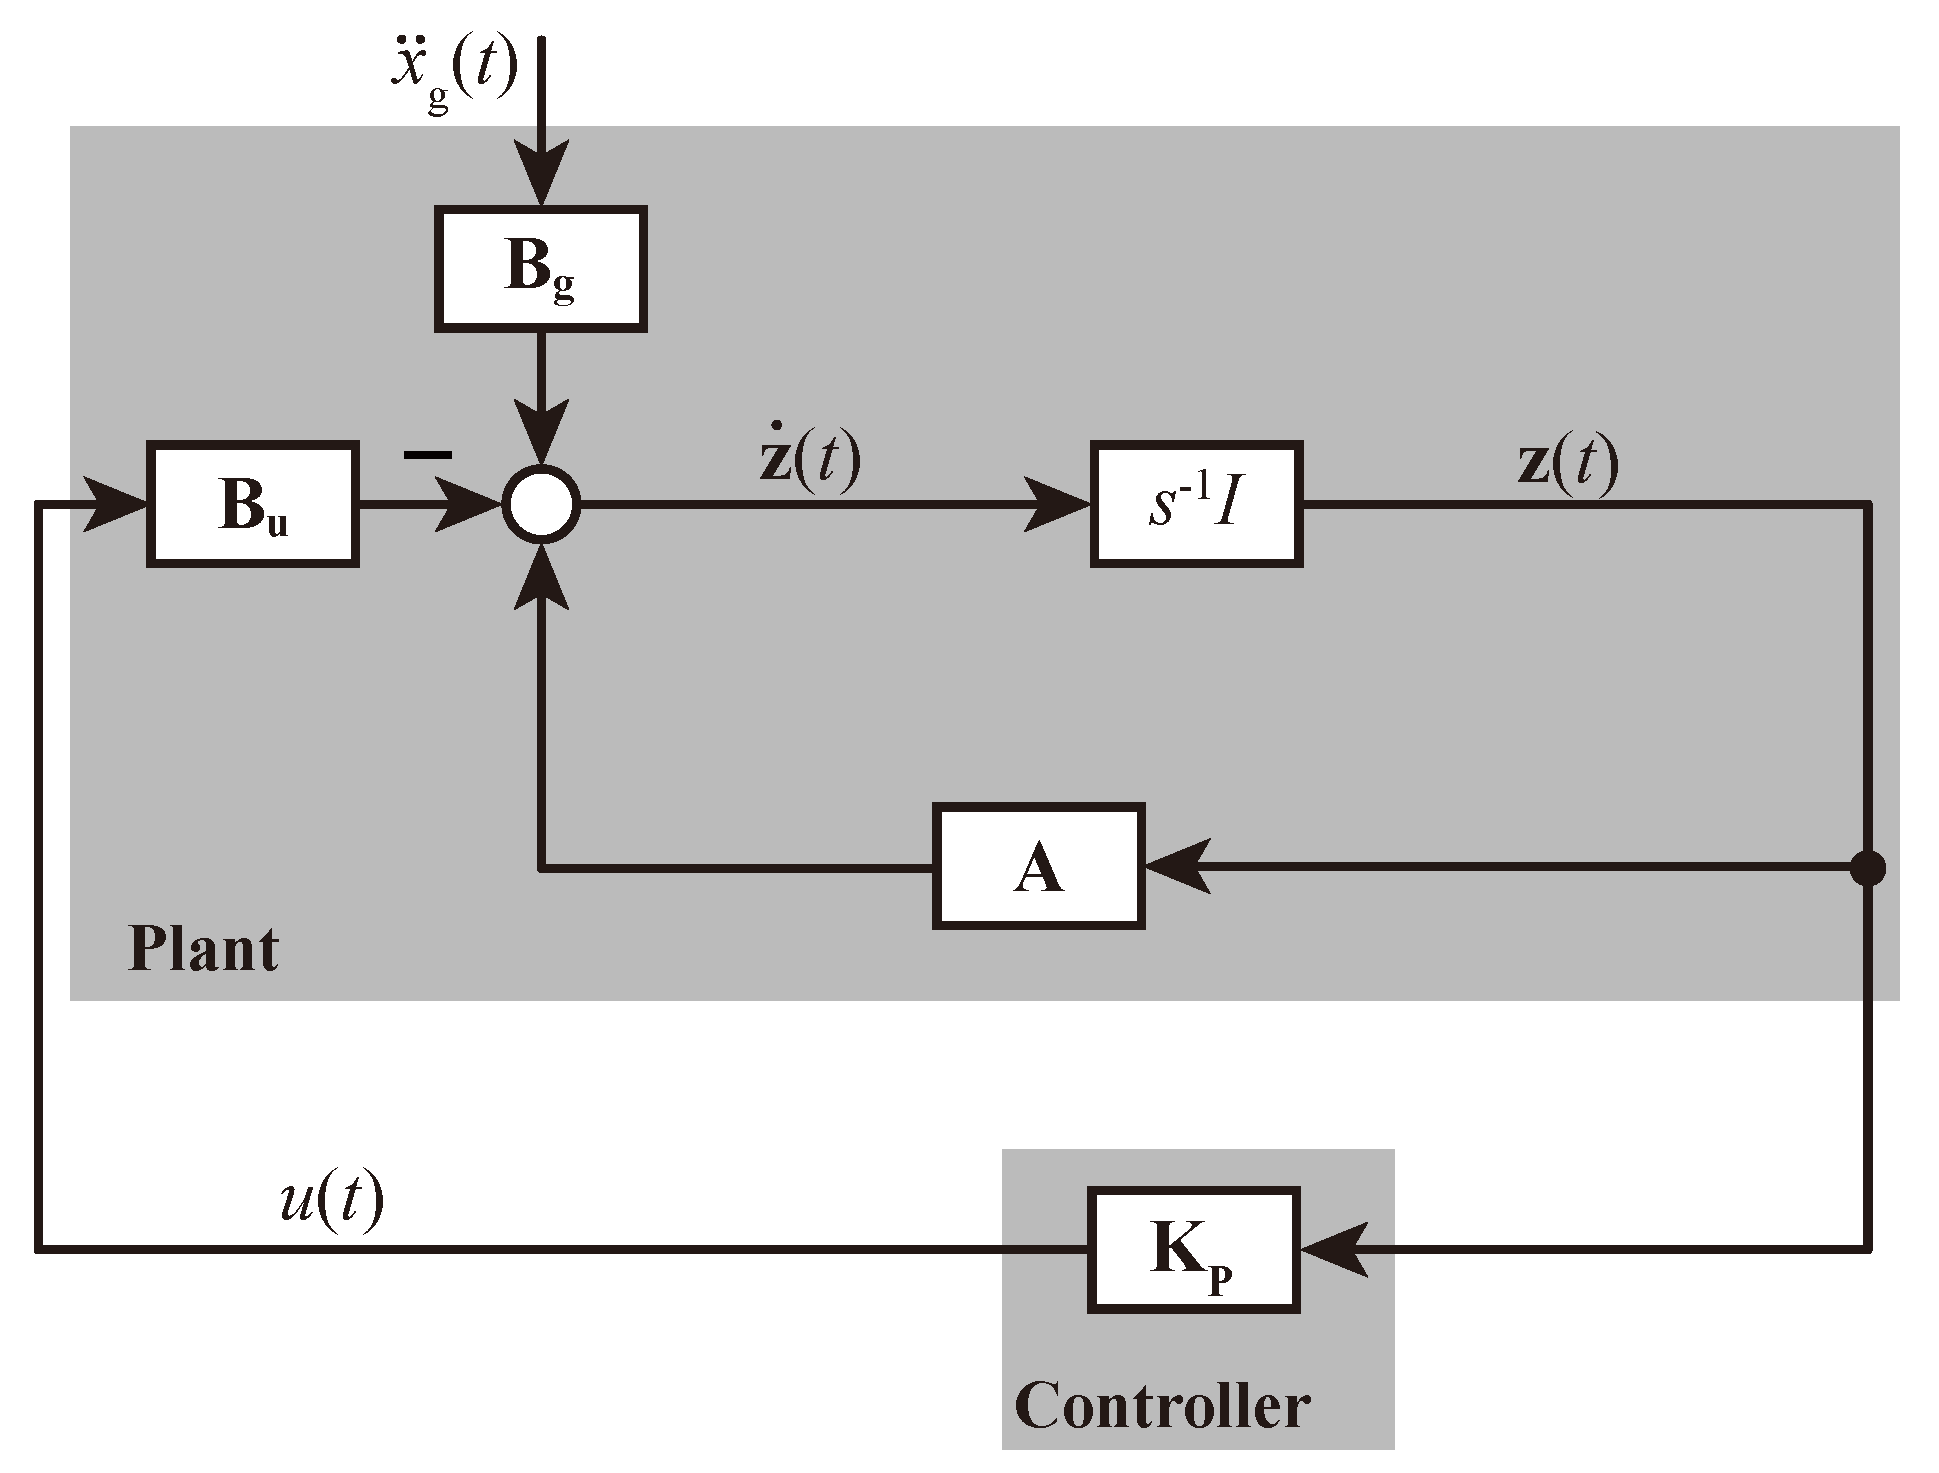
Figure 3.
Equivalent model of (a) control system, (b) equivalent model .
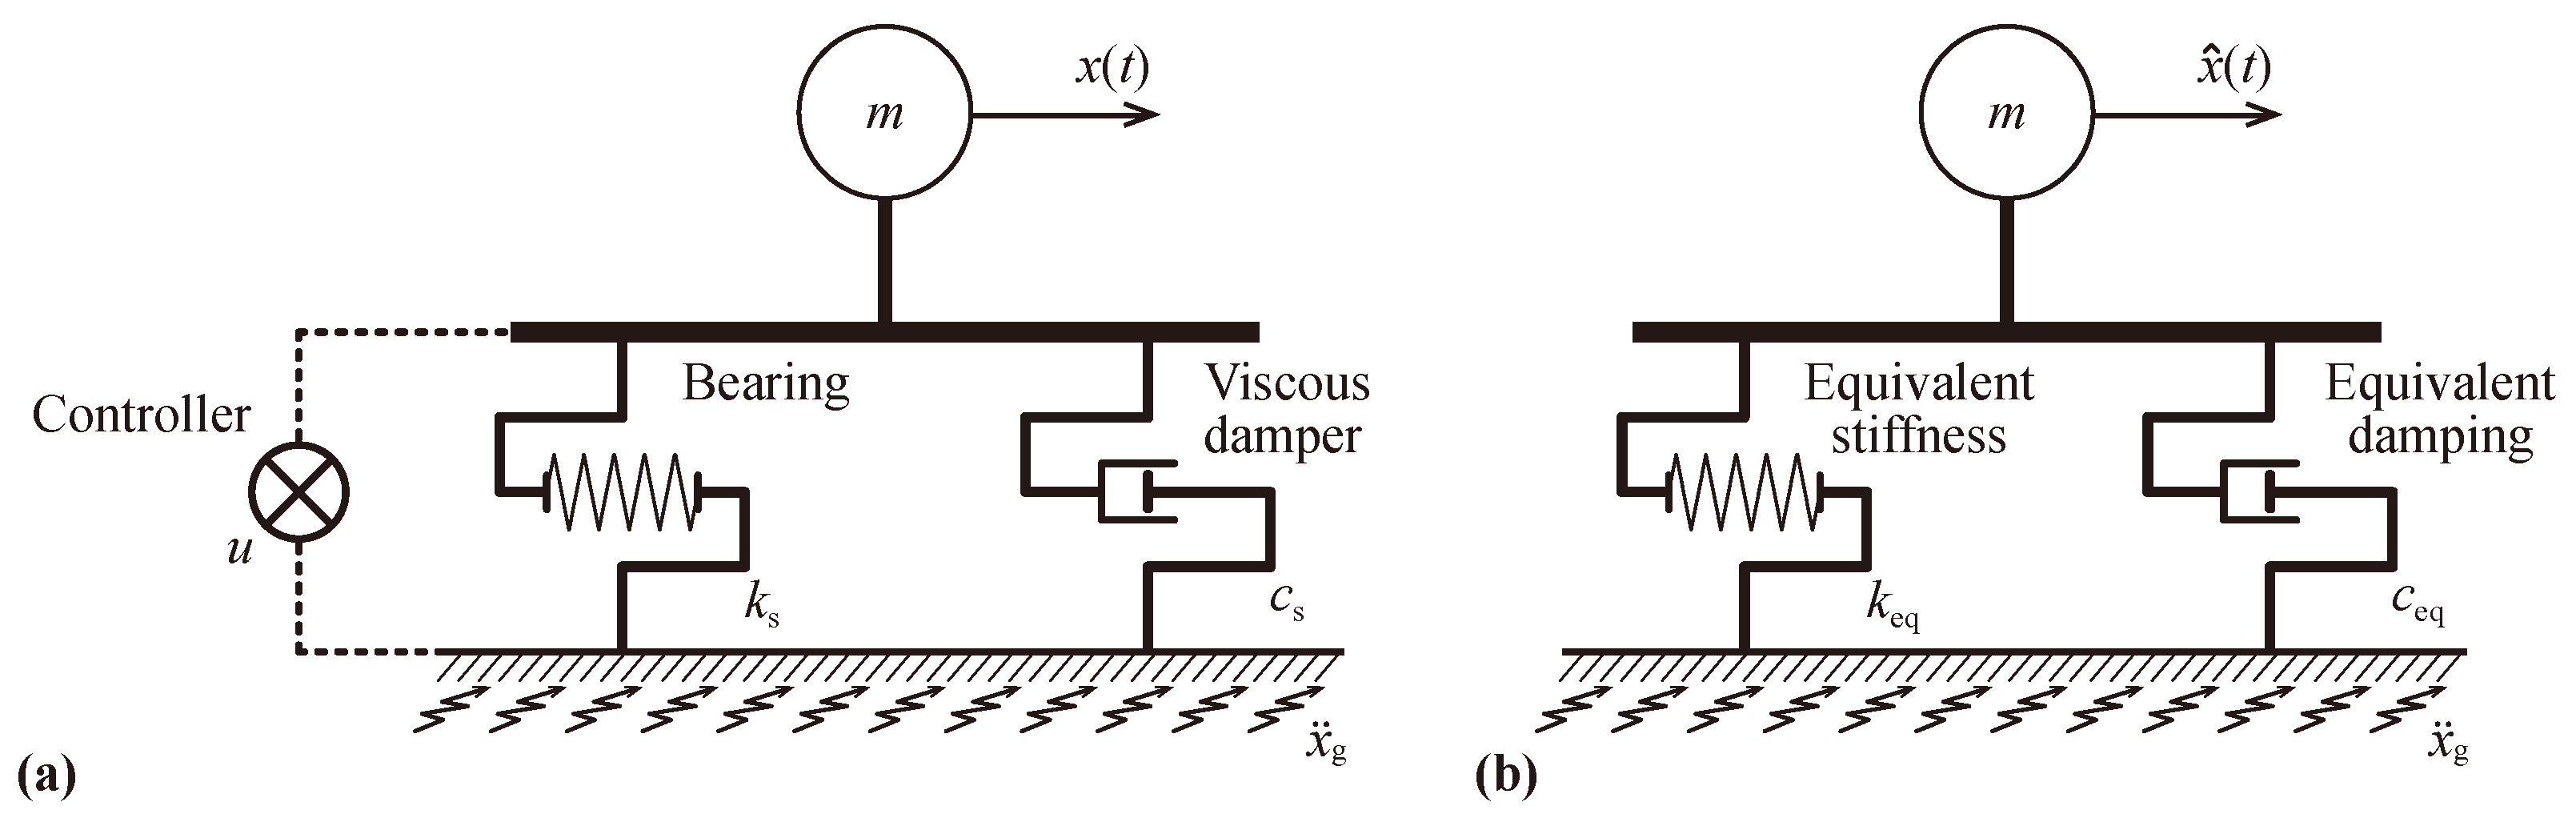
Figure 4.
Tatf NS wave (PGV = 75.0 cm/s): (a) accelerogram, (b) pseudo–velocity response spectrum.
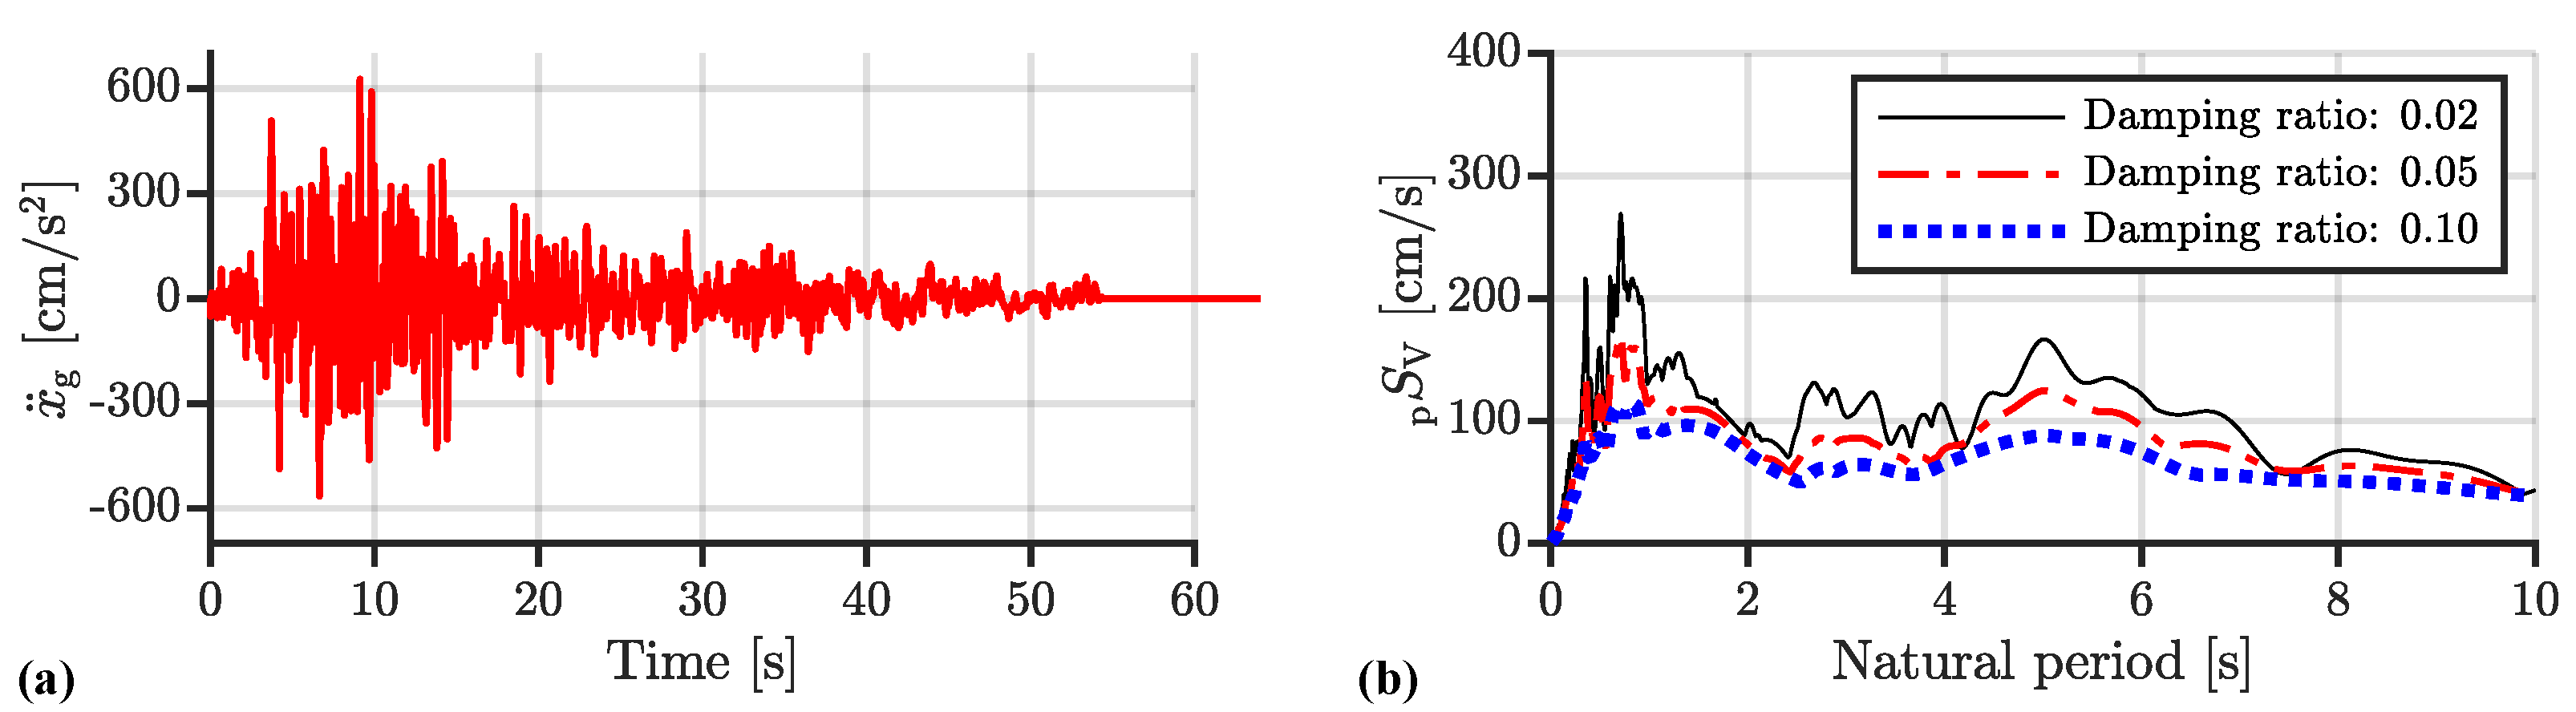
Figure 5.
El Centro 1940 NS wave (PGV = 75.0 cm/s): (a) accelerogram, (b) pseudo–velocity response spectrum.
Figure 5.
El Centro 1940 NS wave (PGV = 75.0 cm/s): (a) accelerogram, (b) pseudo–velocity response spectrum.

Figure 6.
JMA Kobe NS wave (PGV = 75.0 cm/s): (a) accelerogram, (b) pseudo–velocity response spectrum.
Figure 6.
JMA Kobe NS wave (PGV = 75.0 cm/s): (a) accelerogram, (b) pseudo–velocity response spectrum.
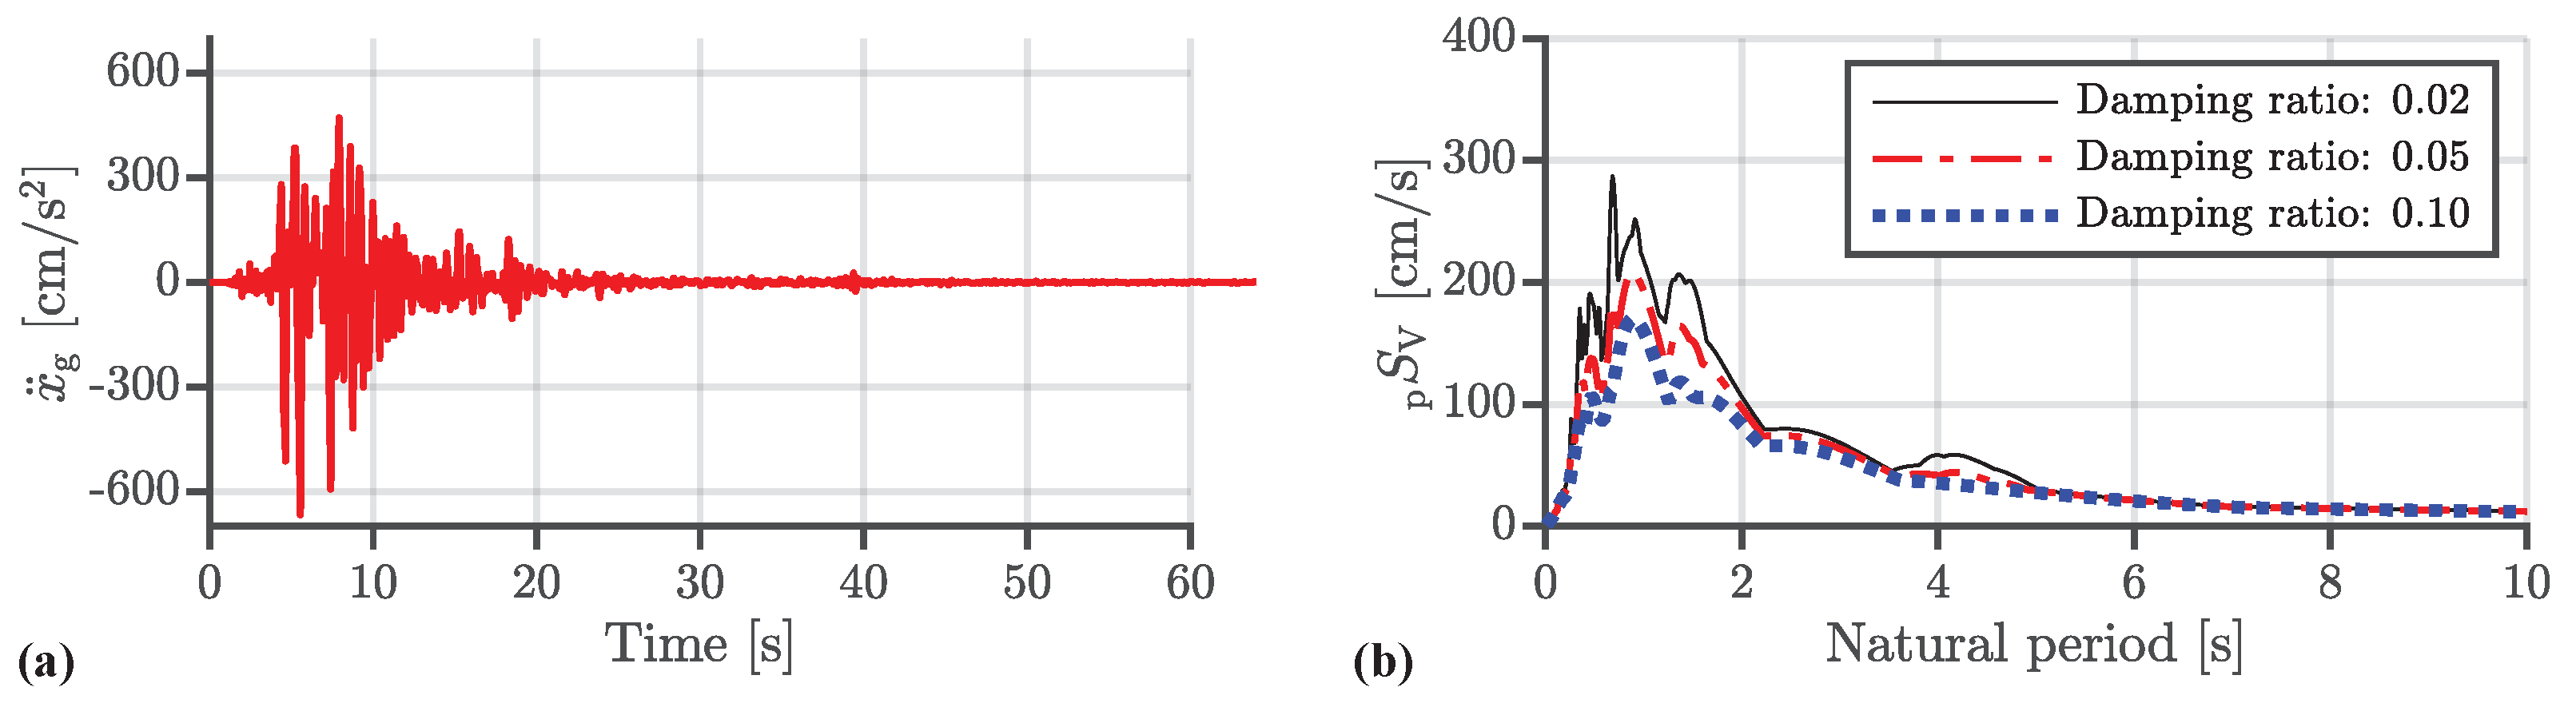
Figure 7.
Code Hachinohe wave (1.5 times Level II of the Japan earthquake resistance design standard): (a) accelerogram, (b) pseudo–velocity response spectrum.
Figure 7.
Code Hachinohe wave (1.5 times Level II of the Japan earthquake resistance design standard): (a) accelerogram, (b) pseudo–velocity response spectrum.
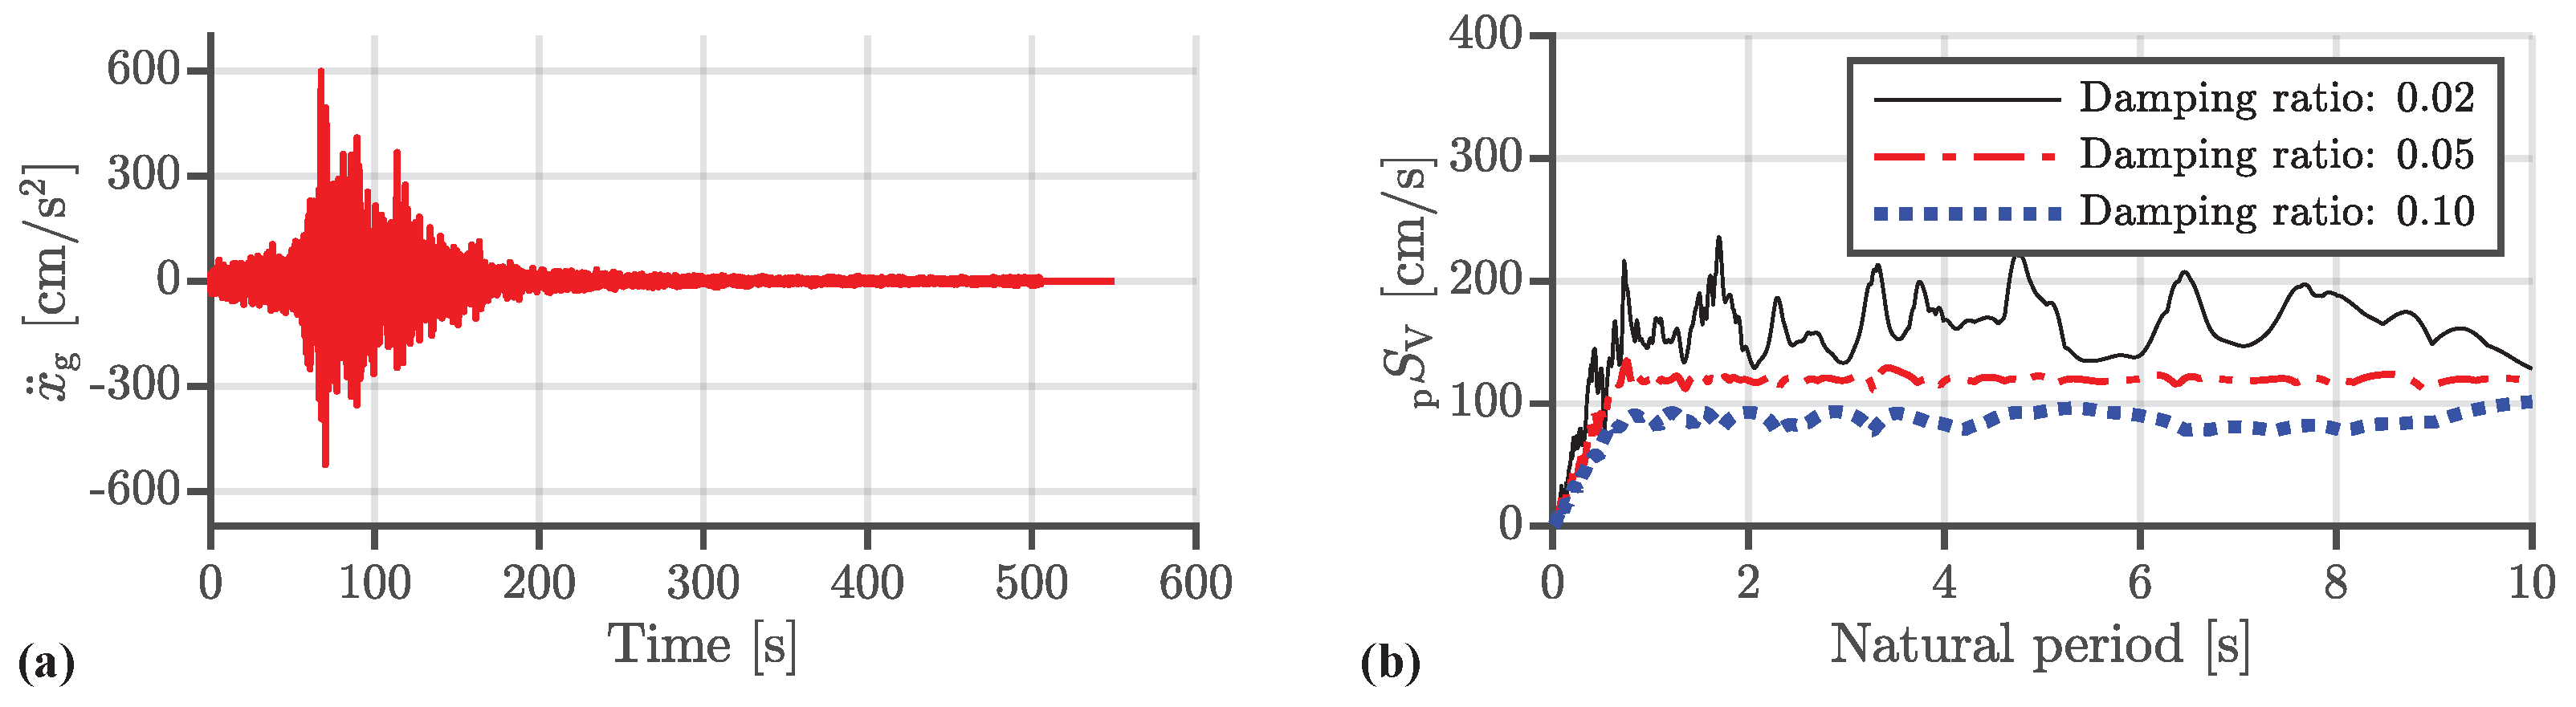
Figure 8.
Control-force spectrum (): (a) Taft NS, (b) El Centro 1940 NS, (c) JMA Kobe NS, and (d) Code Hachinohe.
Figure 8.
Control-force spectrum (): (a) Taft NS, (b) El Centro 1940 NS, (c) JMA Kobe NS, and (d) Code Hachinohe.
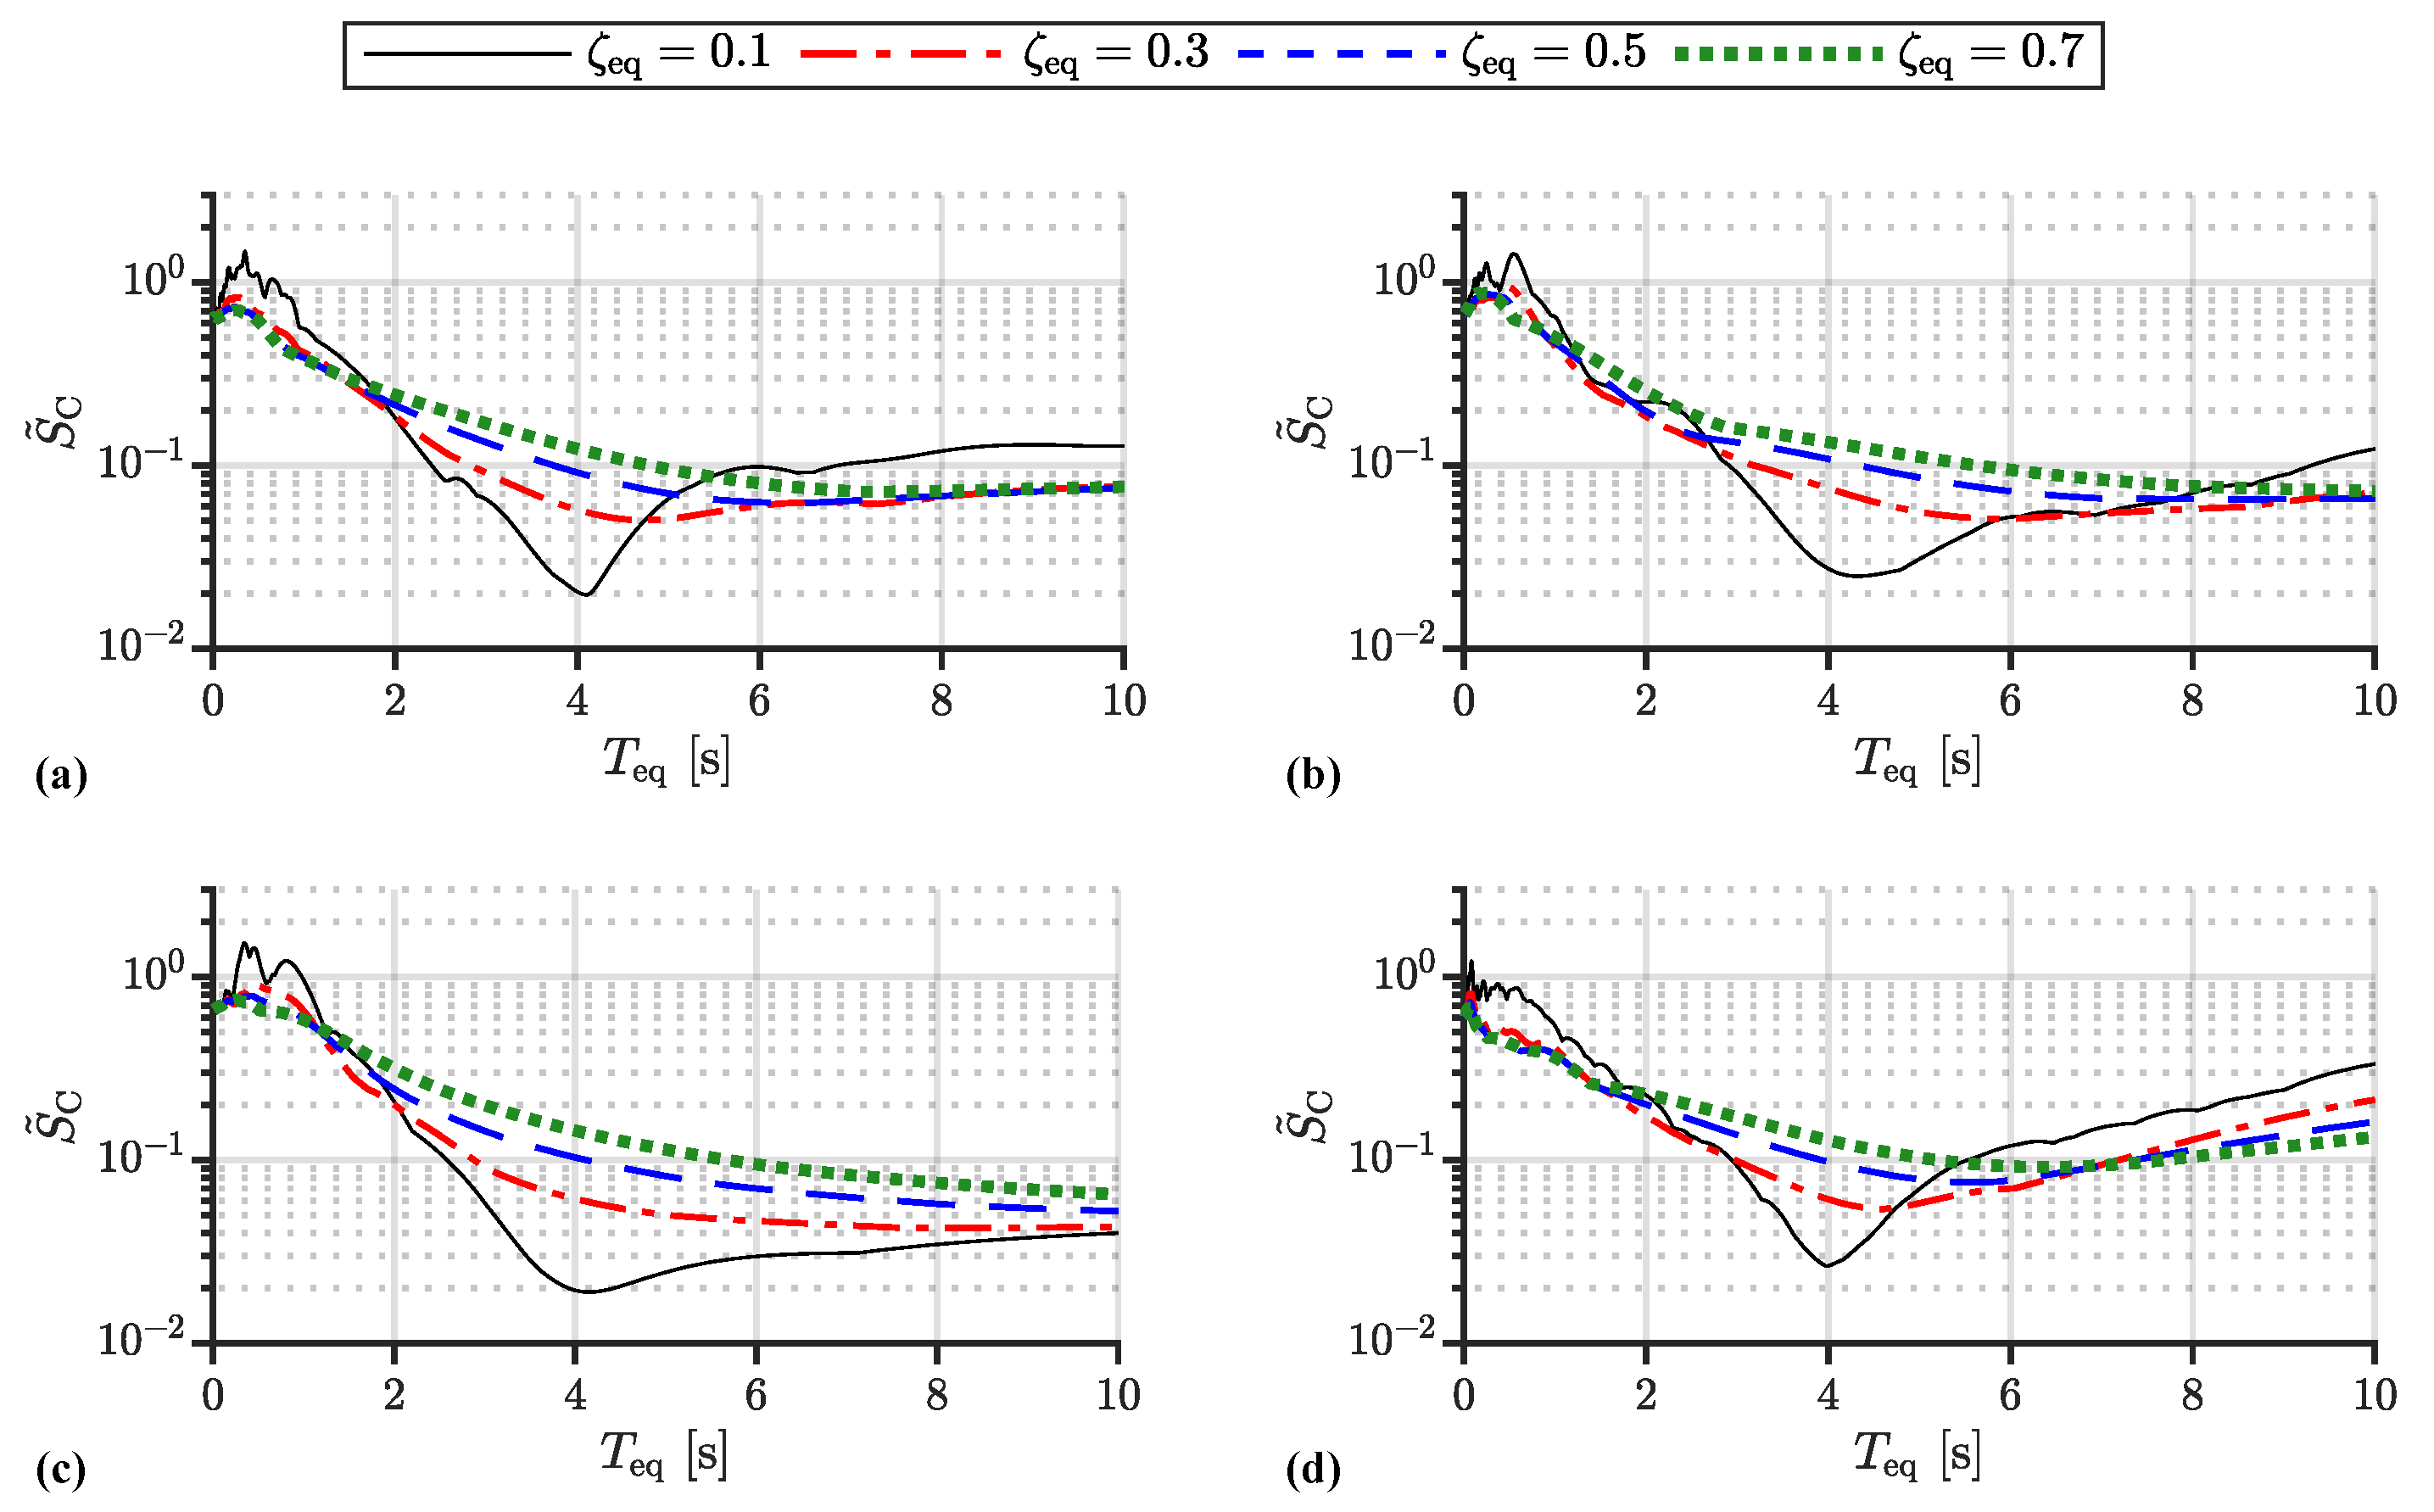
Table 1.
Earthquake waves for numerical verification.
| Earthquake Wave | PGA [cm/s2] | PGV [cm/s] |
|---|---|---|
| Taft NS | 626.6 | 75.0 |
| El Centro 1940 NS | 748.5 | 75.0 |
| JMA Kobe NS | 667.2 | 75.0 |
| Code Hachinohe | 599.1 | 65.6 |
1.5 times Level II of Japan earthquake resistance design standard.
Table 2.
Parameters of model for numerical verification.
| Parameter | Symbol | Value |
|---|---|---|
| mass | m | 1.00 kg |
| stiffness | 2.46 N/m | |
| damping coefficient | 0.03 Ns/m |
.
Publisher’s Note: MDPI stays neutral with regard to jurisdictional claims in published maps and institutional affiliations. |
© 2022 by the authors. Licensee MDPI, Basel, Switzerland. This article is an open access article distributed under the terms and conditions of the Creative Commons Attribution (CC BY) license (https://creativecommons.org/licenses/by/4.0/).
Share and Cite
MDPI and ACS Style
Chen, Y.; Sato, D.; Miyamoto, K.; She, J. Control-Force Spectrum Considering Both Natural Period and Damping Ratio for Active Base-Isolated Building. Actuators 2022, 11, 156. https://doi.org/10.3390/act11060156
AMA Style
Chen Y, Sato D, Miyamoto K, She J. Control-Force Spectrum Considering Both Natural Period and Damping Ratio for Active Base-Isolated Building. Actuators. 2022; 11(6):156. https://doi.org/10.3390/act11060156
Chicago/Turabian StyleChen, Yinli, Daiki Sato, Kou Miyamoto, and Jinhua She. 2022. "Control-Force Spectrum Considering Both Natural Period and Damping Ratio for Active Base-Isolated Building" Actuators 11, no. 6: 156. https://doi.org/10.3390/act11060156
Note that from the first issue of 2016, this journal uses article numbers instead of page numbers. See further details here.