Article

Remaining Useful Life Prediction of an Aircraft Turbofan Engine Using Deep Layer Recurrent Neural Networks

Intelligent Robotic and Energy Systems Research Group, Faculty of Engineering and Design, Carleton University, Ottawa, ON K1S 5B6, Canada
*
Author to whom correspondence should be addressed.
Actuators 2022, 11(3), 67; https://doi.org/10.3390/act11030067
Submission received: 29 January 2022 / Revised: 16 February 2022 / Accepted: 19 February 2022 / Published: 22 February 2022
(This article belongs to the Section Aircraft Actuators)

Abstract

:
The turbofan engine is a pivotal component of the aircraft. Engine components are susceptible to degradation over the life of their operation, which affects the reliability and performance of an engine. In order to direct the necessary maintenance behavior, remaining useful life prediction is the key. This research uses machine learning to provide a prediction framework for an aircraft’s remaining useful life (RUL) based on the entire life cycle data and deterioration parameter data (ML). For the engine’s lifetime assessment, a Deep Layer Recurrent Neural Network (DL-RNN) model is presented. The suggested method is compared to Multilayer Perceptron (MLP), Nonlinear Auto Regressive Network with Exogenous Inputs (NARX), and Cascade Forward Neural Network (CFNN), as well as the Prognostics and Health Management (PHM) conference Challenge dataset and NASA’s C-MAPSS dataset. Mean Absolute Error (MAE) and Root Mean Square Error (RMSE) are calculated for both the datasets, and the values are in the range of 0.15% to 0.203% for DL-RNN, whereas for the other three topologies, they are in the range of 0.2% to 4.8%. Comparative results show a better predictive accuracy with respect to other ML algorithms.

1. Introduction

The engine is a heart of an airplane. With the emergence of action cycles, system faults and the deterioration process would inevitably occur. To improve the system’s performance and dependability, it is also important to determine how frequently such breakdowns will occur. Prognostics and Health Management (PHM) is a framework for health system management that provides integrated yet individualized approaches. The most complex and technically demanding comprehensive technique in prognosis and health management is aircraft engine prognostics, as it determines an engine’s actual health [1]. The length from the current time to the failure of a system is characterized as remaining useful life (RUL), and its forecast methodologies are classed as follows: the model-based technique (also known as the physics of failure technique), data-driven technique, and hybrid technique are all examples of model-based techniques [2]. The model-based method uses an accurate physical model that represents the system’s dynamics and combines it with calculated data to determine model parameters and predict potential behavior. The Corrosion Model, Abrasion Model, Taylor Tool Wear Model, and Hidden Markov Models (HMMs) are examples of model-based techniques [3,4]. The model-based approach is simple to implement and maintain, and the model may be reused. Model development, on the other hand, necessitates a detailed understanding of the system, and high-fidelity models are computationally demanding [5]. The data-driven method analyzes the characteristics of the current damage condition and models the future trend using a portion of the previously gathered data (training data). Regression analysis, neural networks, fuzzy logic, Bayesian, Random Forest (RF), Gradient Boosting (GB), Support Vector Machine (SVM), Genetic Algorithm (GA), and Relevance Vector Machine (RVM) are examples of data-driven methodologies [6]. The data-driven technique is simple and quick to deploy, and it can uncover relationships that were previously overlooked. However, it necessitates a balanced approach, and there is a risk of overlearning and overgeneralization [7,8]. For Li-ion battery health management, a capacity estimation study based on the class of Support Vector Regressors (SVR) models is proposed in [9]. To build the capacity estimate framework, NASA’s publicly accessible battery information, which has limited data, is used to extract the multi-channel profile of voltage, current, and temperature. To detect abnormalities in the wind turbine gearbox, a technique based on adaptive threshold and Twin Support Vector Machine (TWSVM) is used. Data from Supervisory Control and Data Acquisition (SCADA) are sampled every 10 min and checked for abnormalities [10]. The significance of feature selection for wind turbine condition monitoring is discussed in [11]. There are a lot of variations in today’s SCADA data; therefore, it is important to eliminate any unnecessary information. SVR, neural networks, decision trees, and logistic regression are among the approaches being tested for regression analysis [11]. A hybrid technique combines model and data-driven approaches. The data are used to train the model parameters, and knowledge about the physical process is used to choose which type of regression analysis to utilize (linear, polynomial, exponential, etc.). Particle filters, Kalman filters, and other hybrid techniques are examples [12]. The hybrid technique takes the best of both approaches, relying on data when system understanding is inadequate and physics where data are scarce. On the other hand, it necessitates a thorough understanding of the system as well as the collection of relevant data [13]. For structural health monitoring, a novel technique based on convolutional neural networks and deep transfer learning has been suggested to recognize distinct types of acoustic emissions sources [14]. Damage detection is handled using Convolutional Neural Network (CNN) and deep learning classifiers that are entirely trained by numerically generated structural responses, resulting in a revolutionary structural health monitoring technique [15]. The lack of suitable data labels, i.e., fault categories, in experimental data obtained provides a significant obstacle for practical gear malfunction diagnosis. To address this issue, one study develops a novel fuzzy classification algorithm for diagnosing gear faults with few data labels [16]. An unsupervised deep learning network (UDLN) technique for fault diagnostics of rotating machinery is presented in [17]. The suggested technique takes full advantage of the benefits of unsupervised learning to increase fault diagnostic accuracy and automatic diagnosis capacity.
In comparison to model-based approaches, the impression that most initiatives are centered on data-driven approaches appears to reflect the need to extract low-hanging targets, despite the difficulty of obtaining statistically significant quantities of run-to-failure data and common metrics that allow different approaches to be compared. Neural networks are one of the most widely utilized data-driven methodologies for prognostics. Artificial Neural Networks (ANN) have become increasingly popular in recent years because of their superior capacity to approximate functions [18]. ANN is based on data from continuous monitoring programs, which include preparation samples [18]. The most widely used method for calculating the useful life of turbofan engines is Artificial Neural Networks (ANN) [19]. In certain literature, related work has been conducted. Long Short-Term Memory (LSTM) is one of the methods used to estimate the RUL of turbofan engines; it can figure out how long old data should be remembered, when it should be forgotten, and when new data should be used. In order to increase estimation accuracy, an initial RUL of 97 was chosen, and it performed better than an initial RUL of 130 [20]. LSTM outperformed other methods such as Multilayer Perceptron (MLP), Support Vector Regression (SVR), Relevance Vector Regression (RVR), and Convolutional Neural Network (CNN). With time-series data, LSTM performs well, but it takes a long time to converge [21]. Convolution Neural Networks (CNN) were developed to forecast the RUL of the same engine [22]. It uses a time window technique for sample processing, which may yield more deterioration detail. As a result, the number of model inputs grows, making the building of a neural network model a difficult task: how to set up network nodes and network layers to avoid overfitting. Recurrent Neural Network based on Statistical Recurrent Unit (SRU) was proposed for the RUL prediction of the C-MAPSS dataset of a turbofan engine [23]. It can find hidden partners from multivariate time-series sensor data with varied operating state faults and defects, and it outperforms other dynamic deep learning algorithms because it uses linear combinations of few averages to obtain a plurality of historical perspectives. RUL prediction of turbofan engines using Recurrent Neural Network (RNN) has been proposed, in which the recurrent neural network is trained with back-propagation by time gradient calculations, an Expanded Kalman Filter training process, and evolutionary algorithms to create an accurate and compact algorithm [24]. When compared to MLP, the results reveal a higher level of accuracy. Various topologies, such as MLP, SVR, RVR, CNN, and LSTM, have been employed for RUL prediction of the turbofan engine, as previously noted.
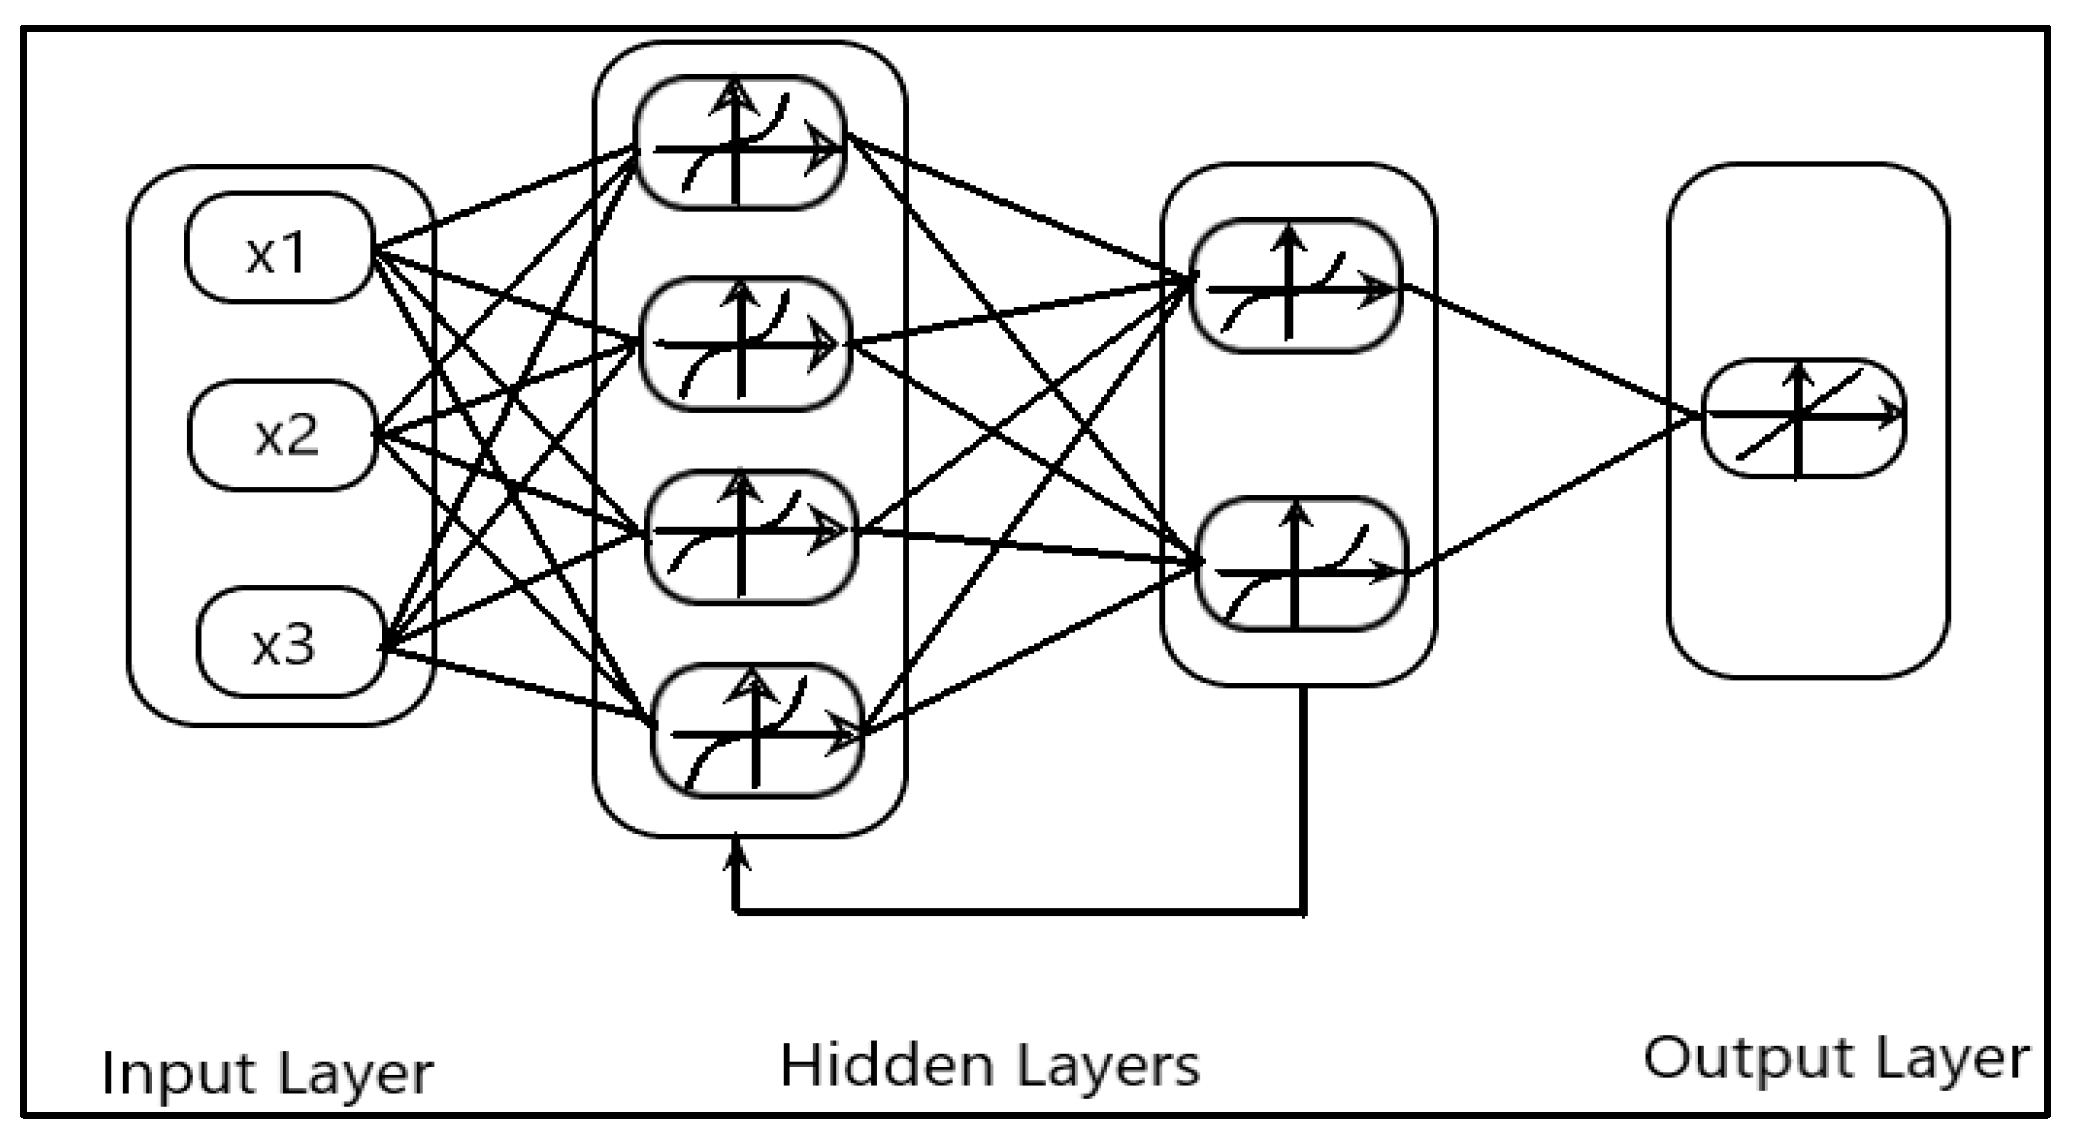
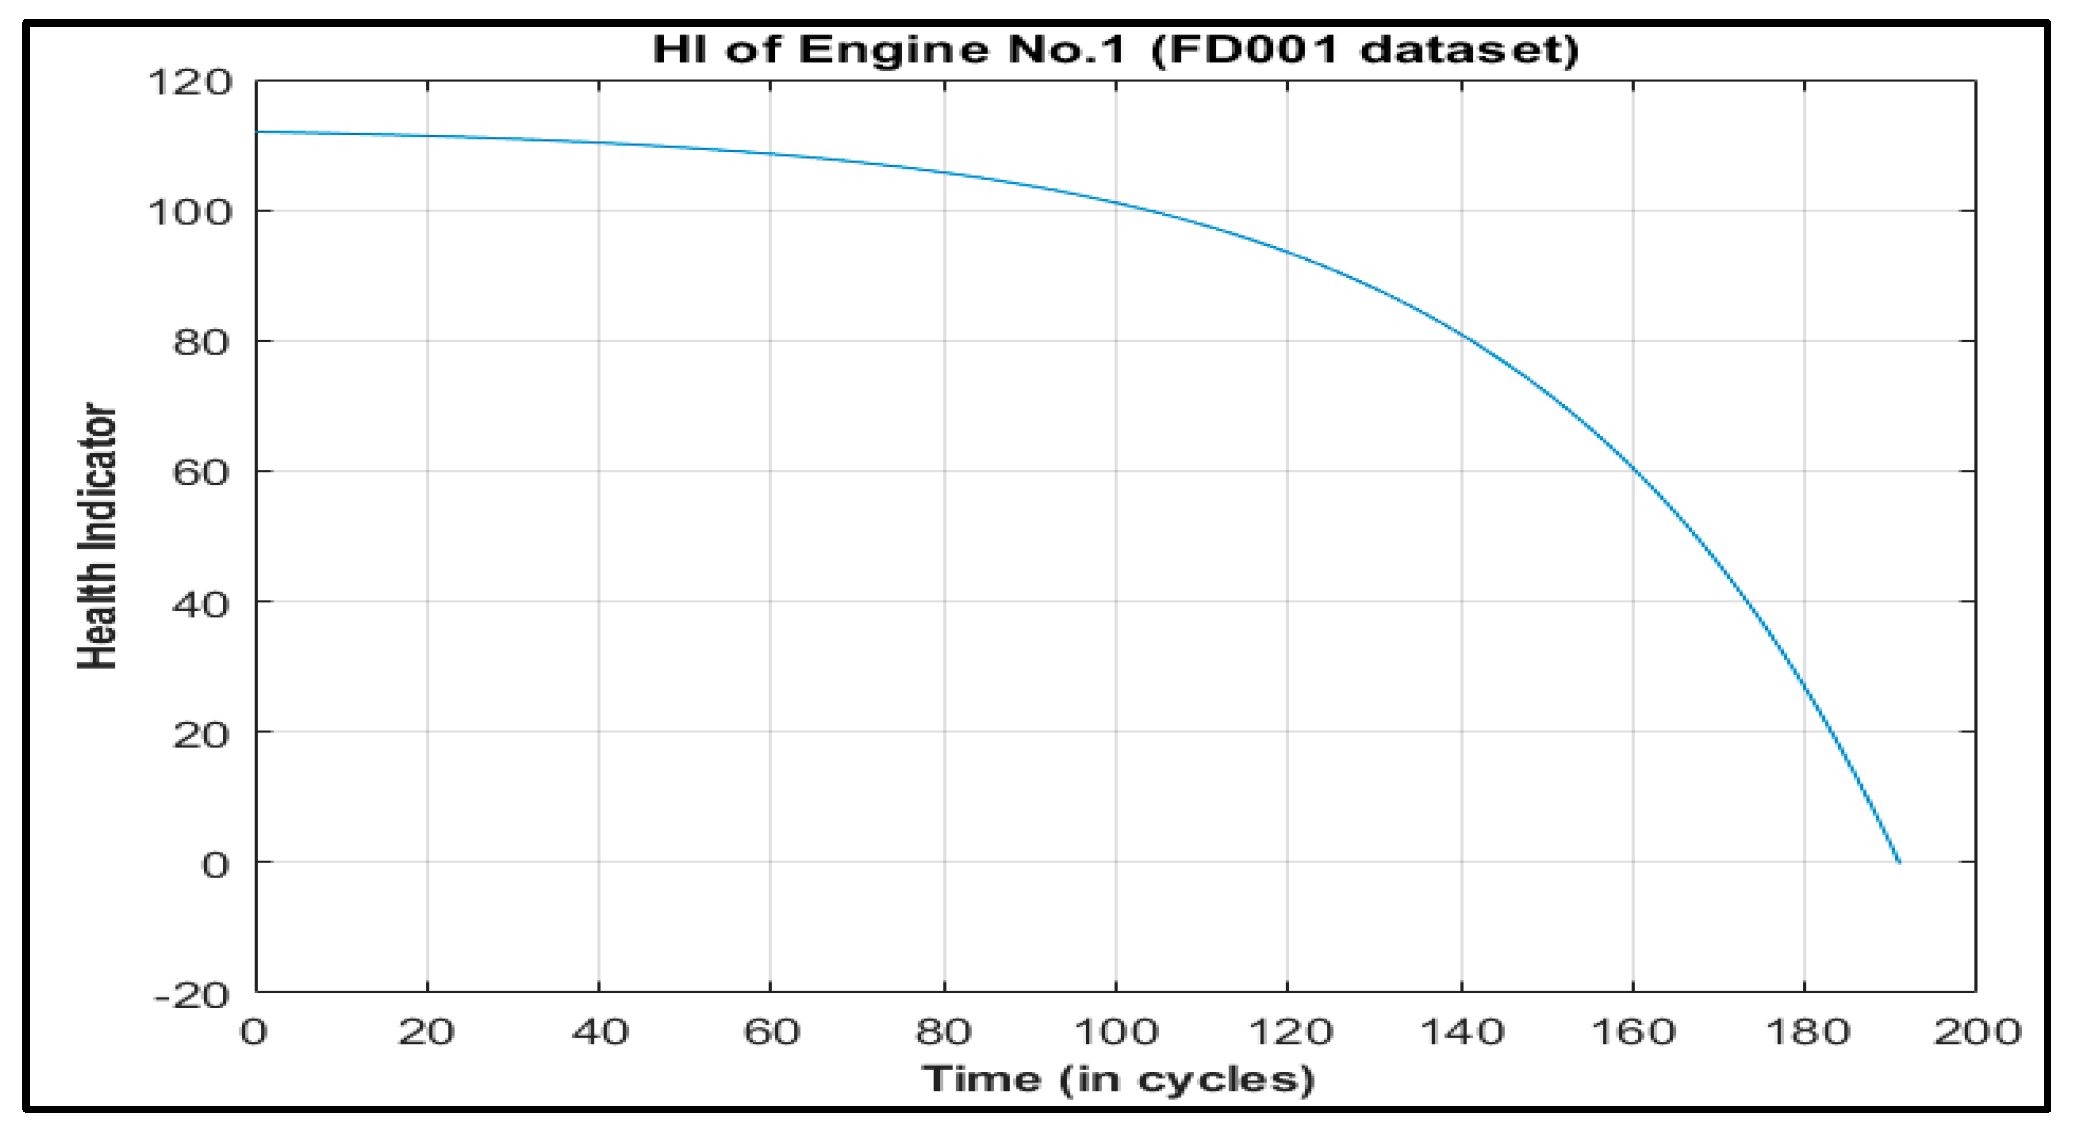
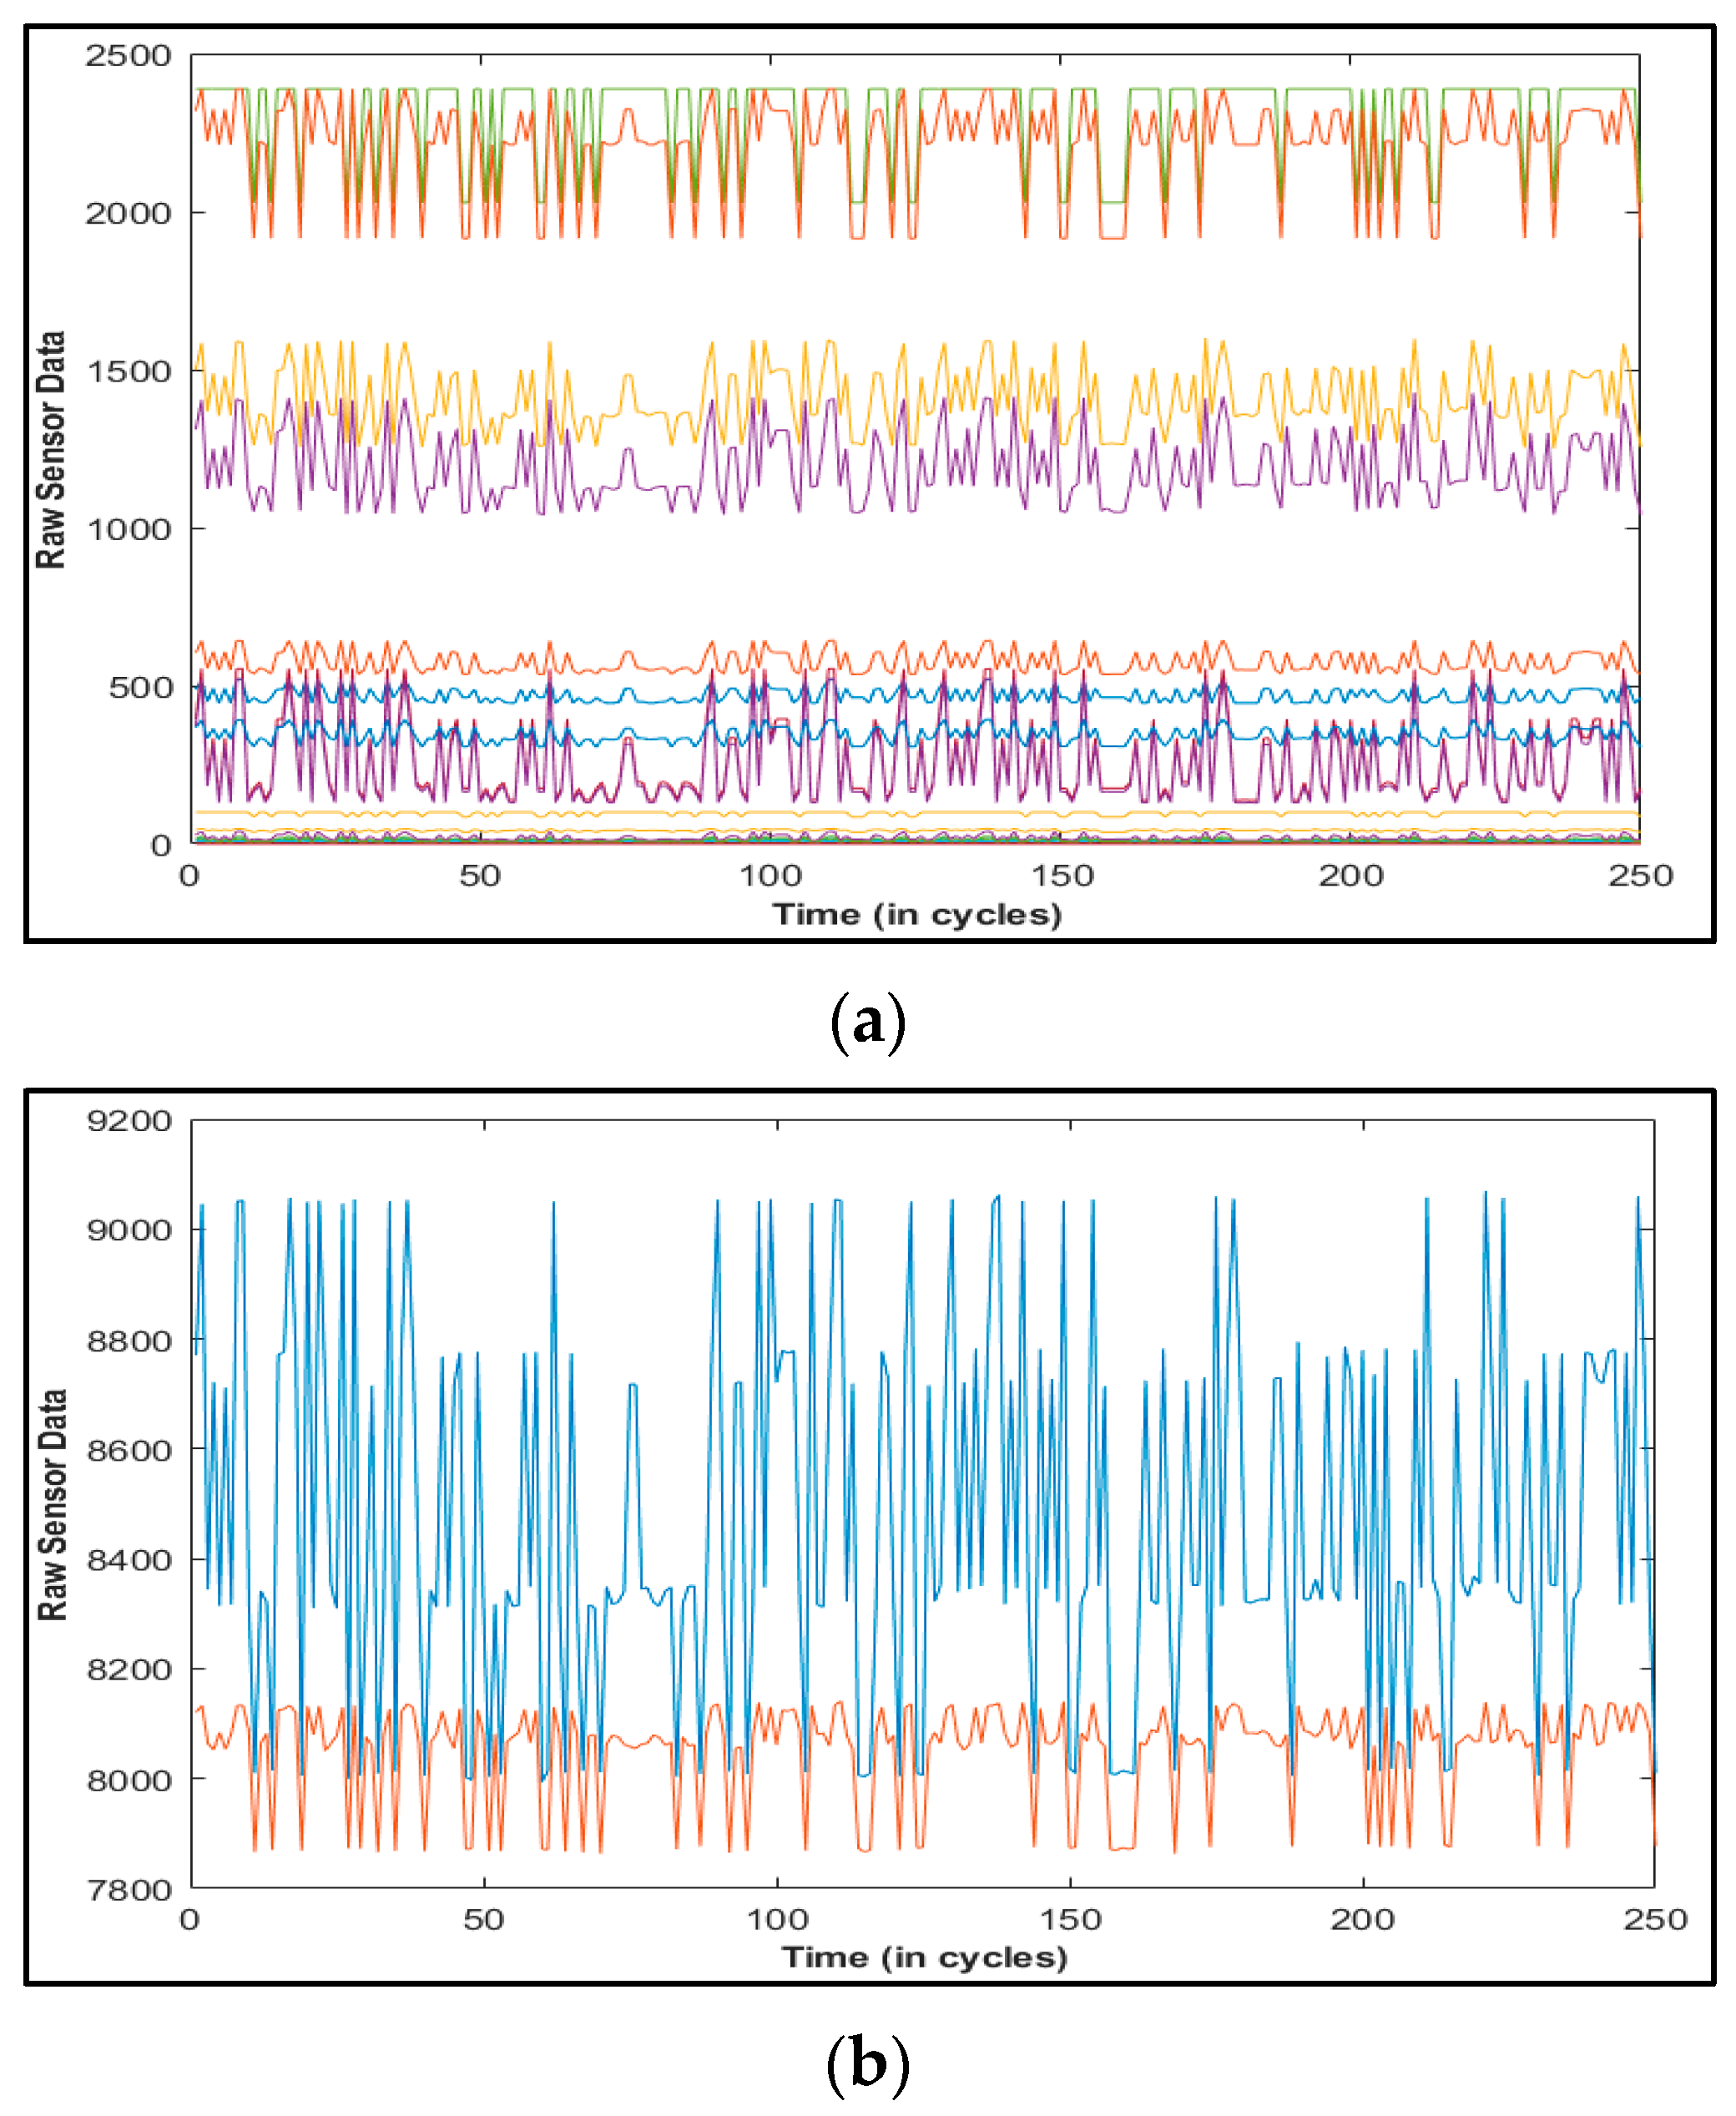
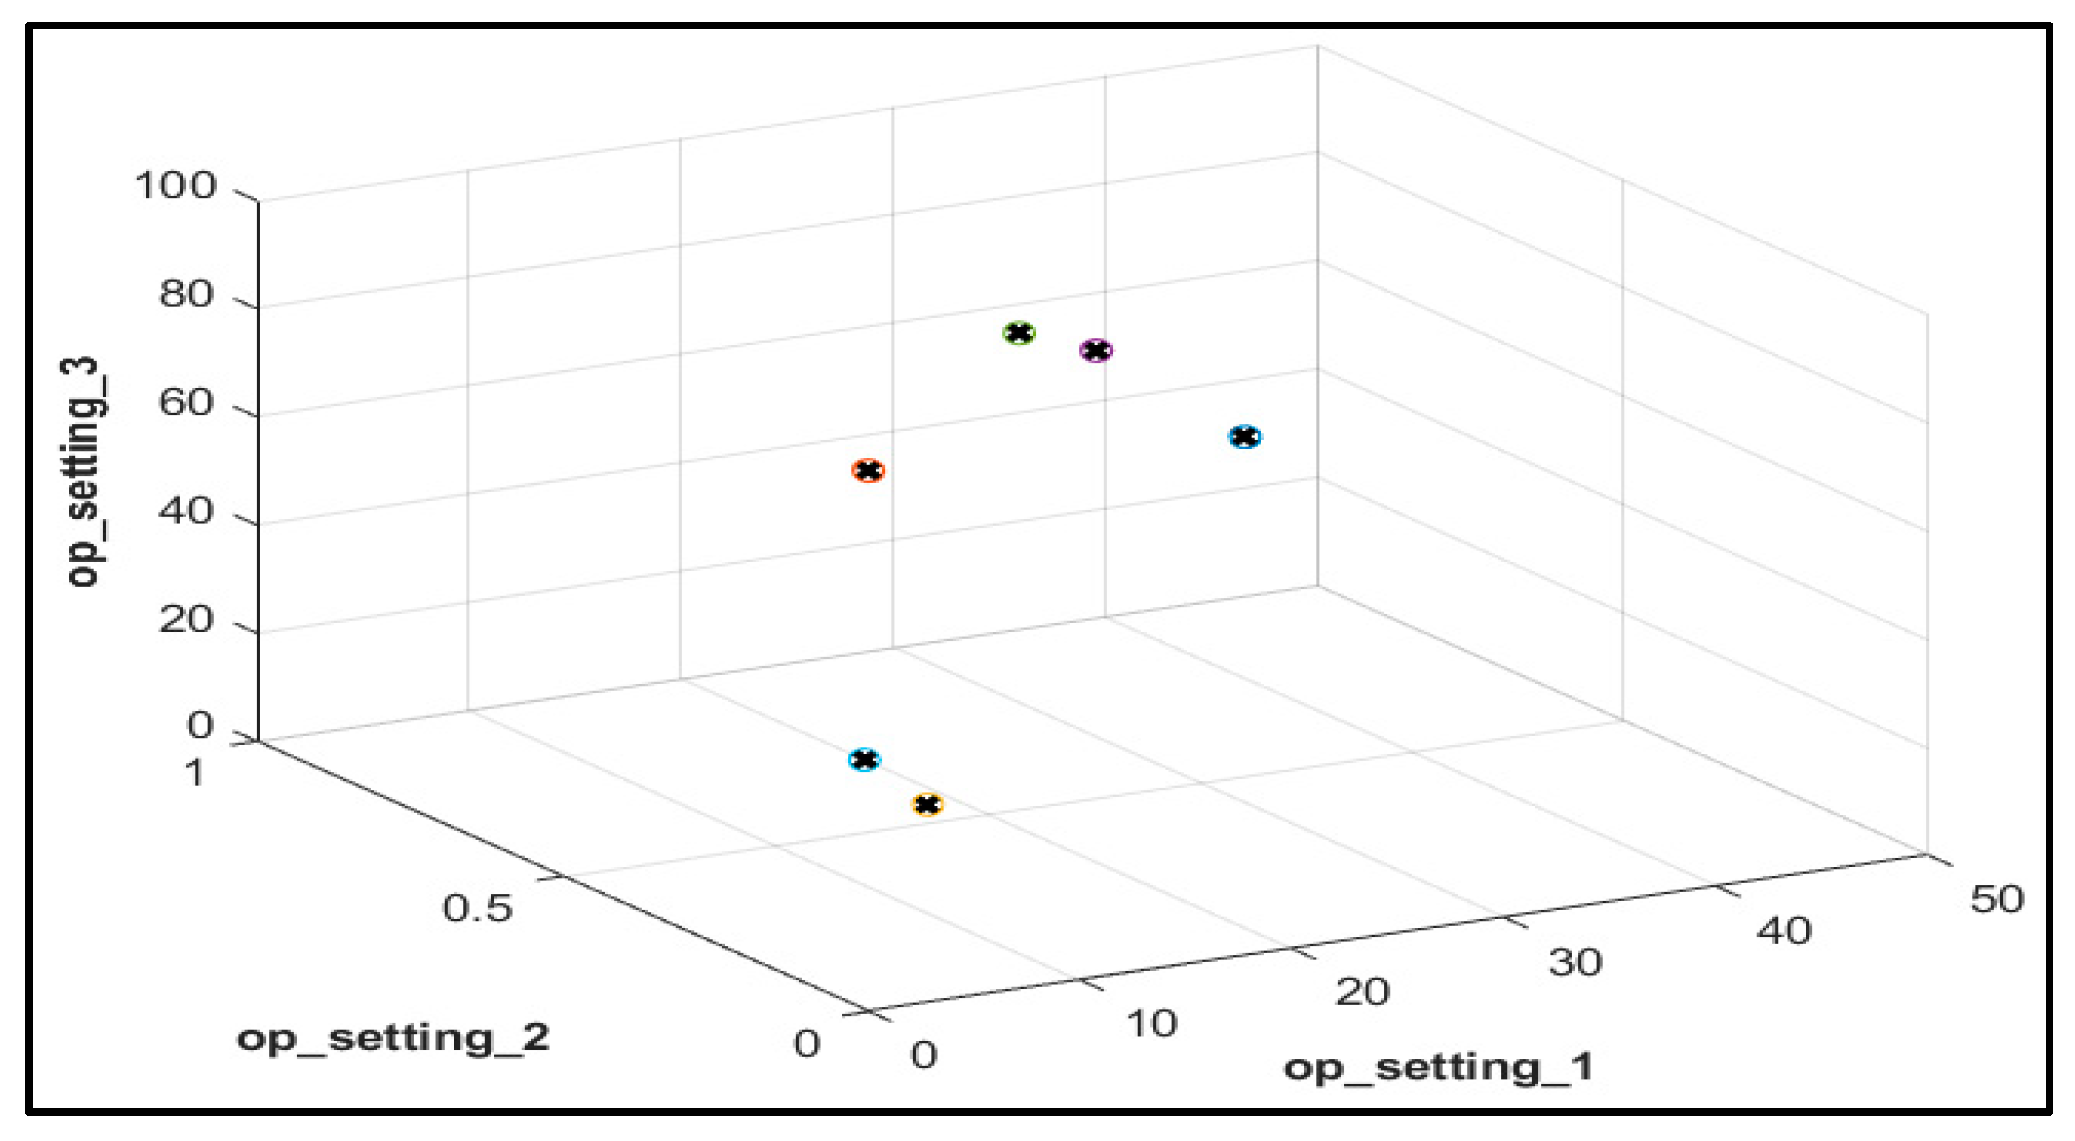
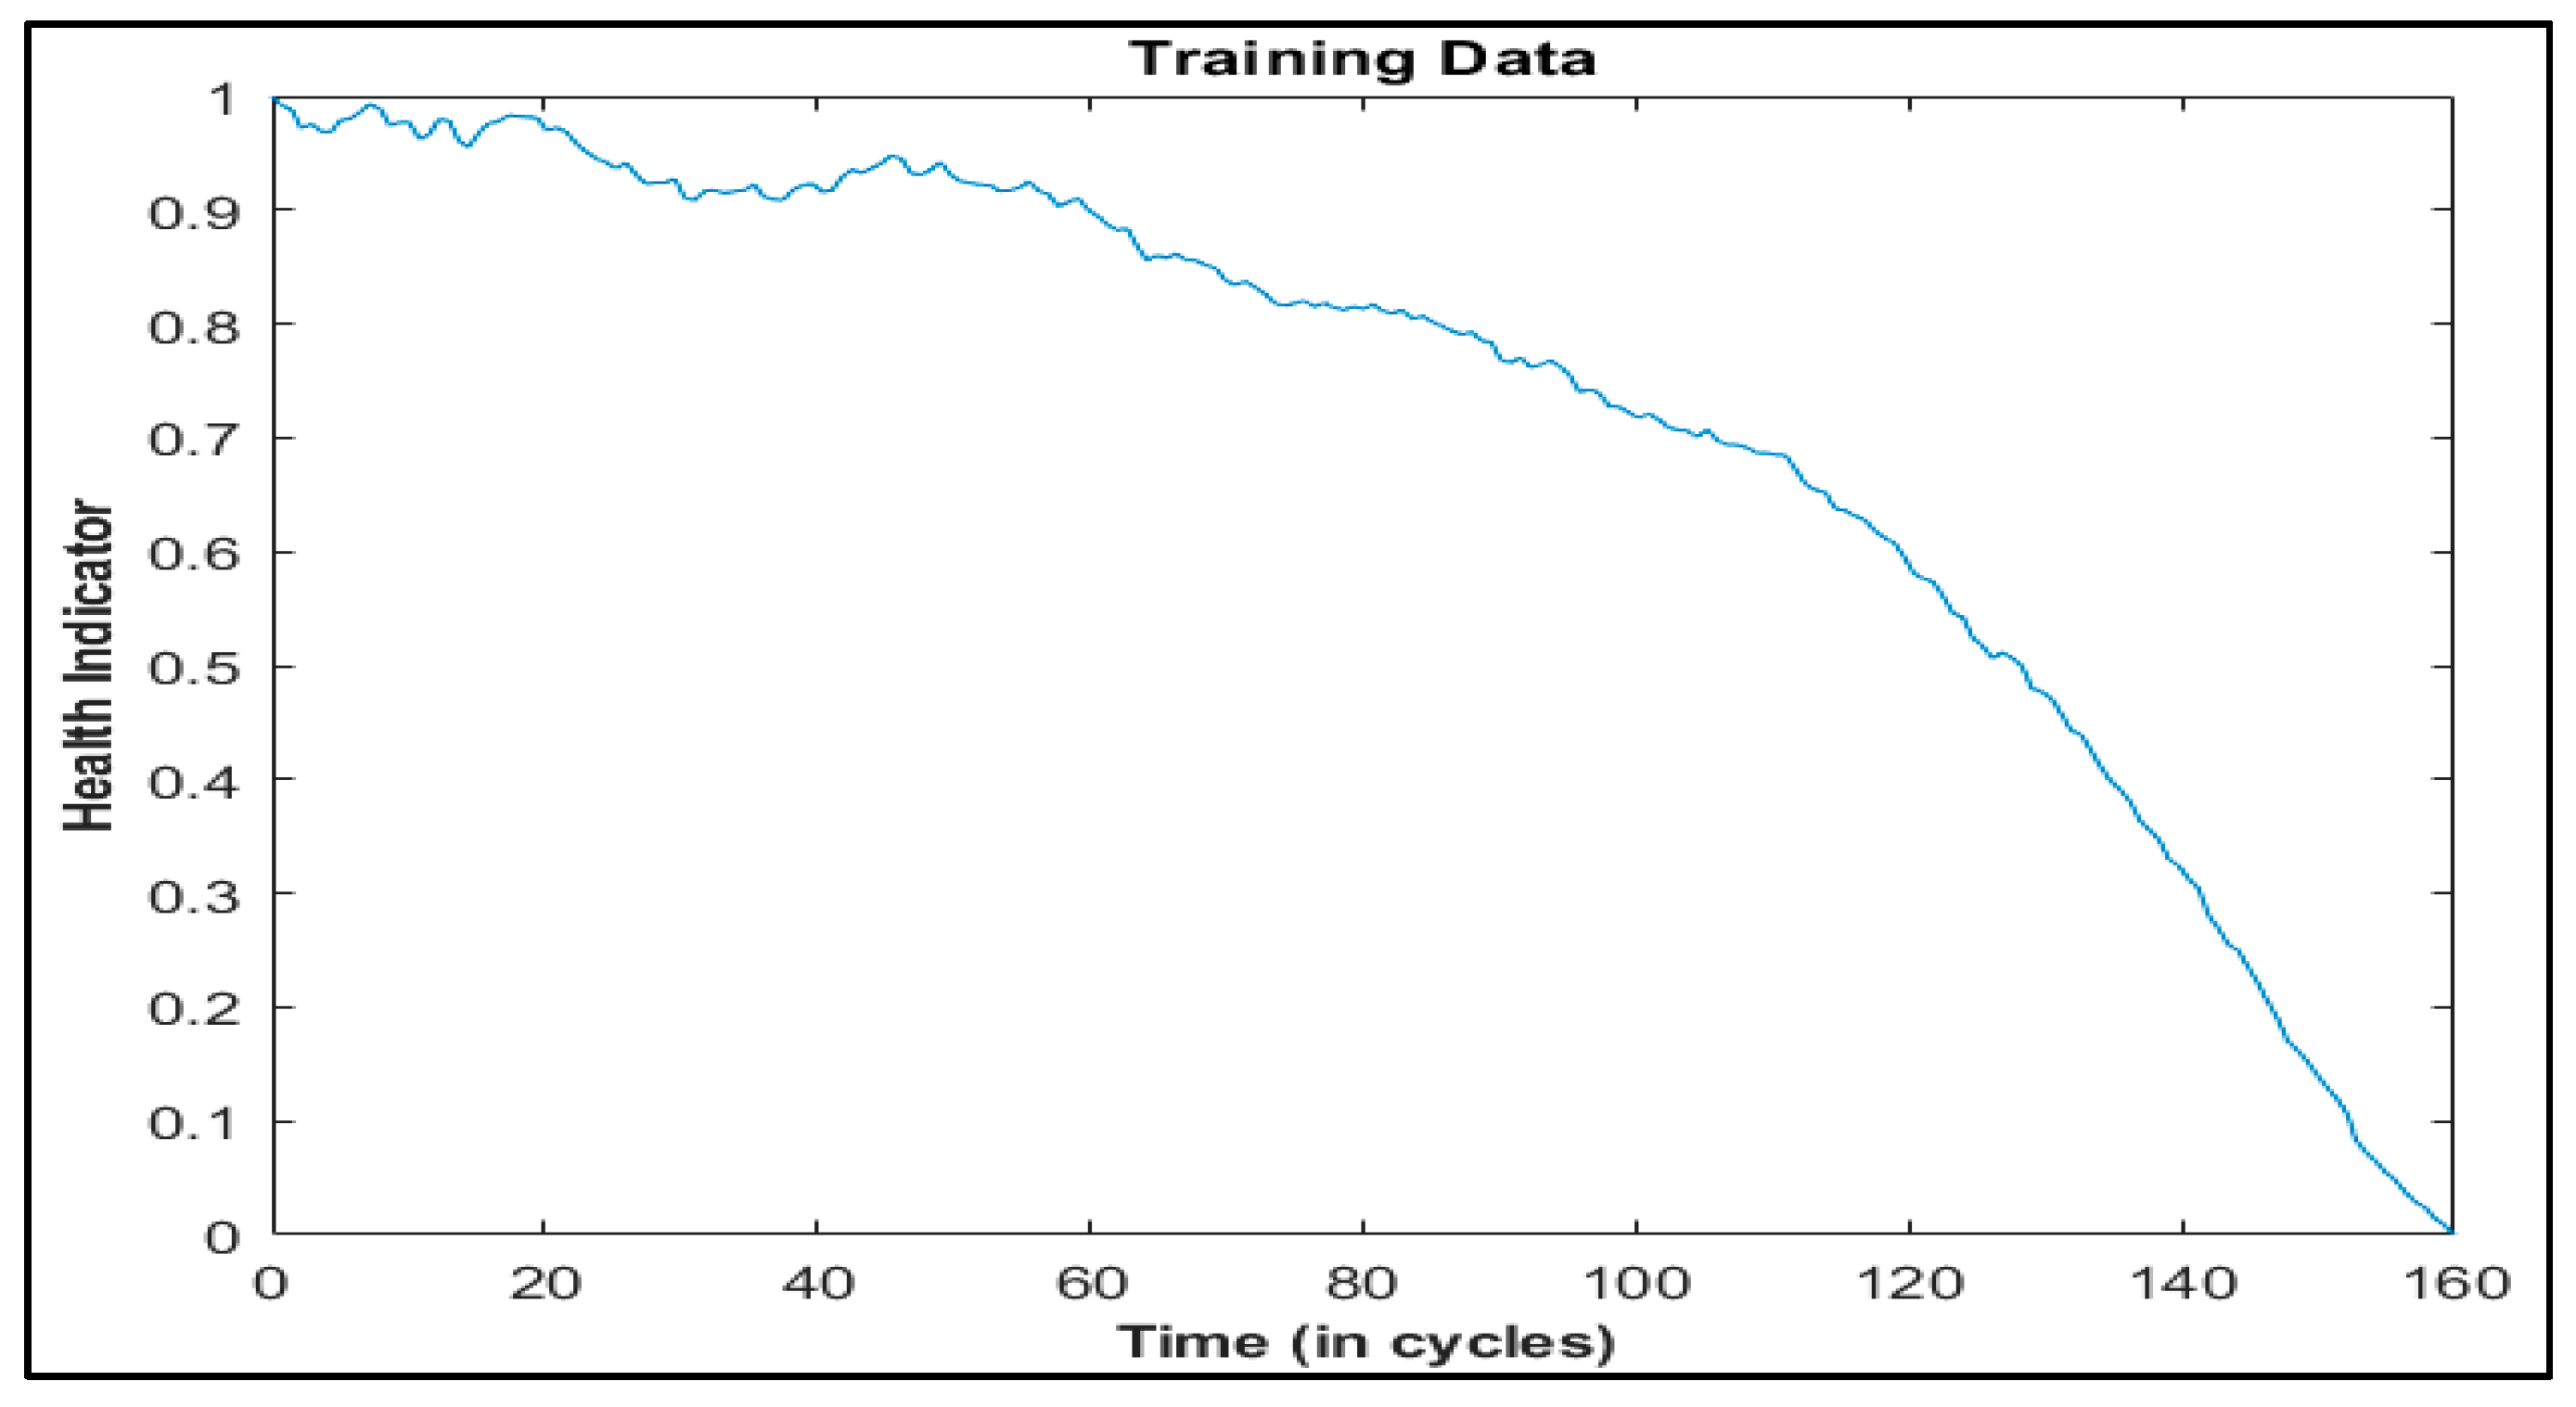
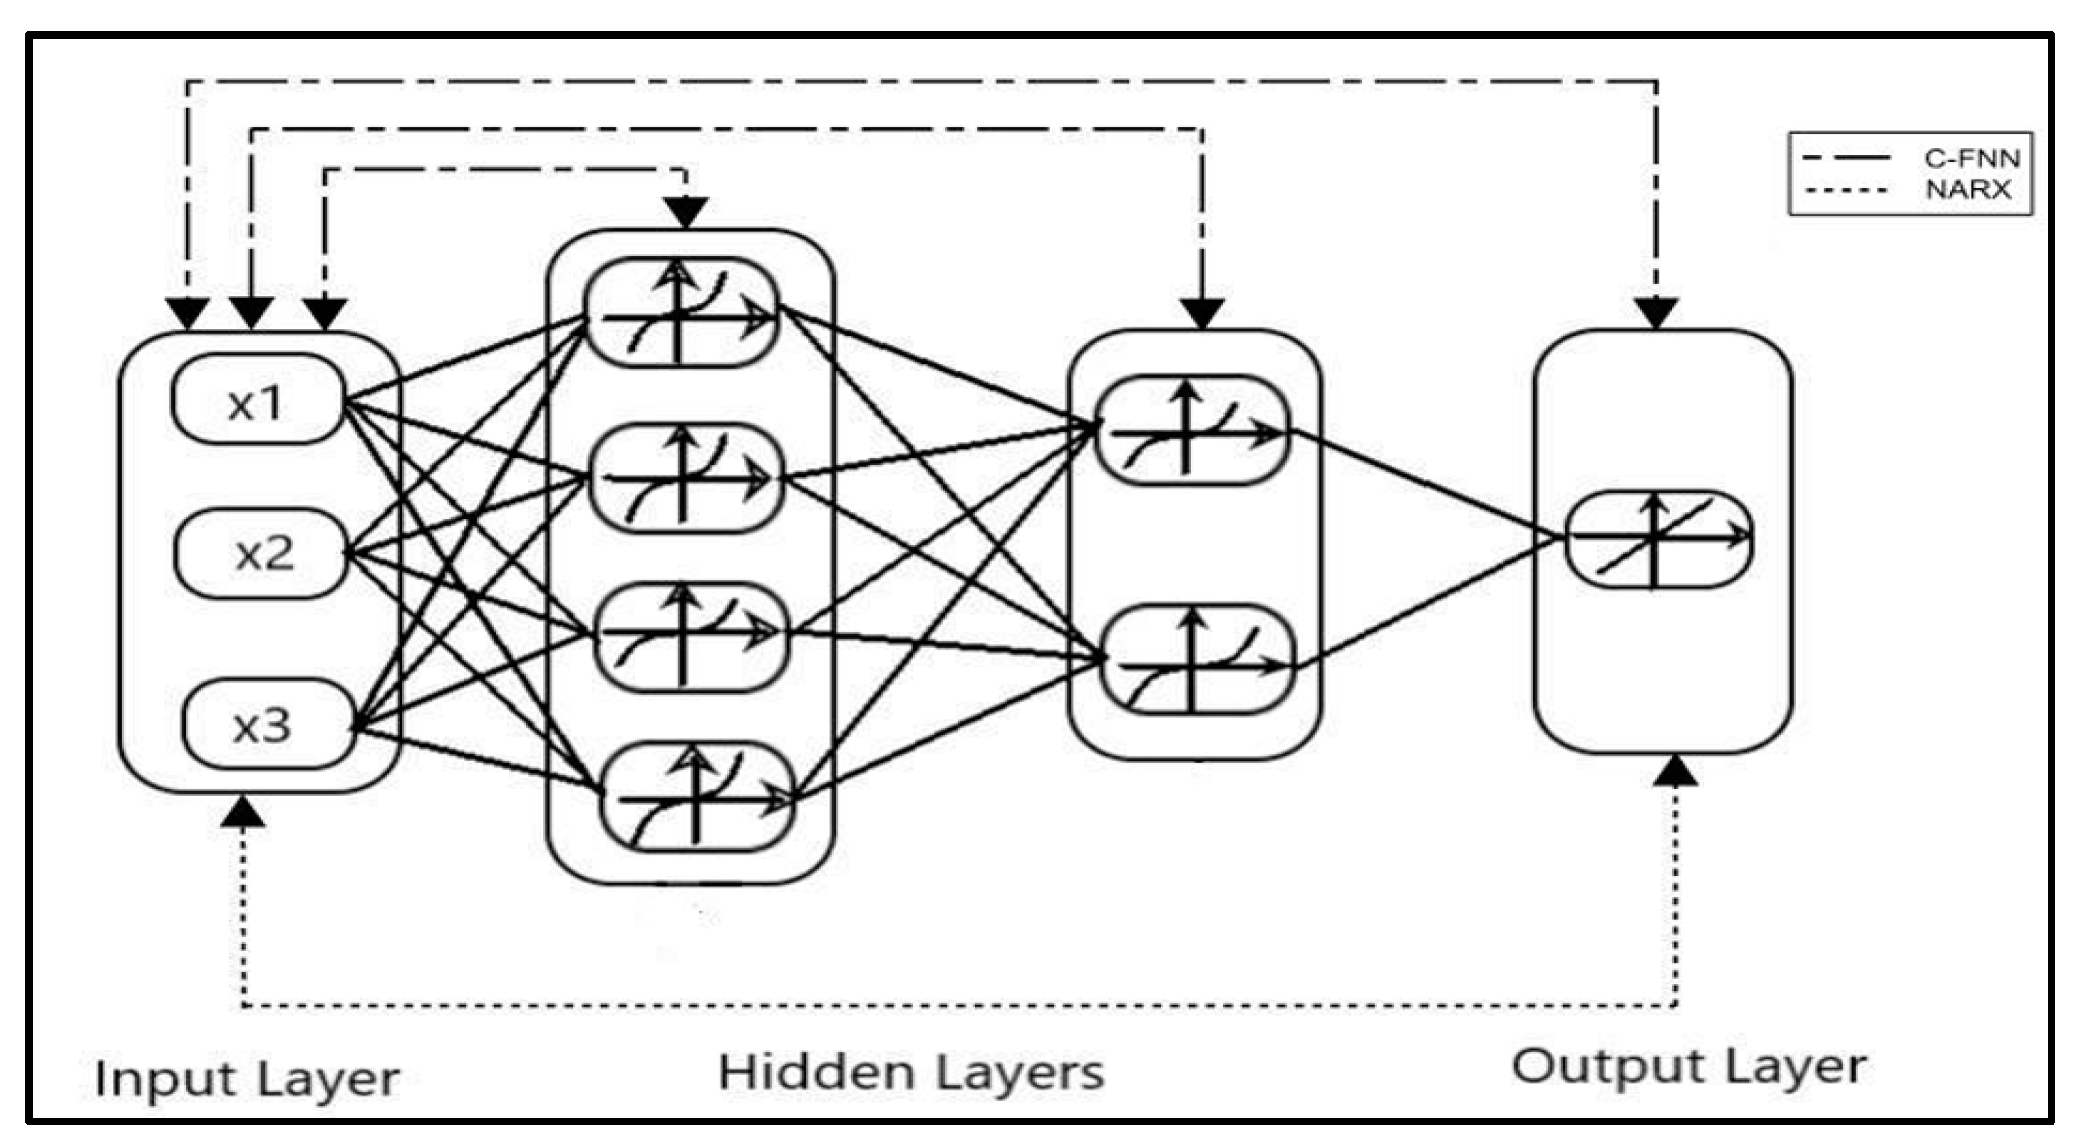
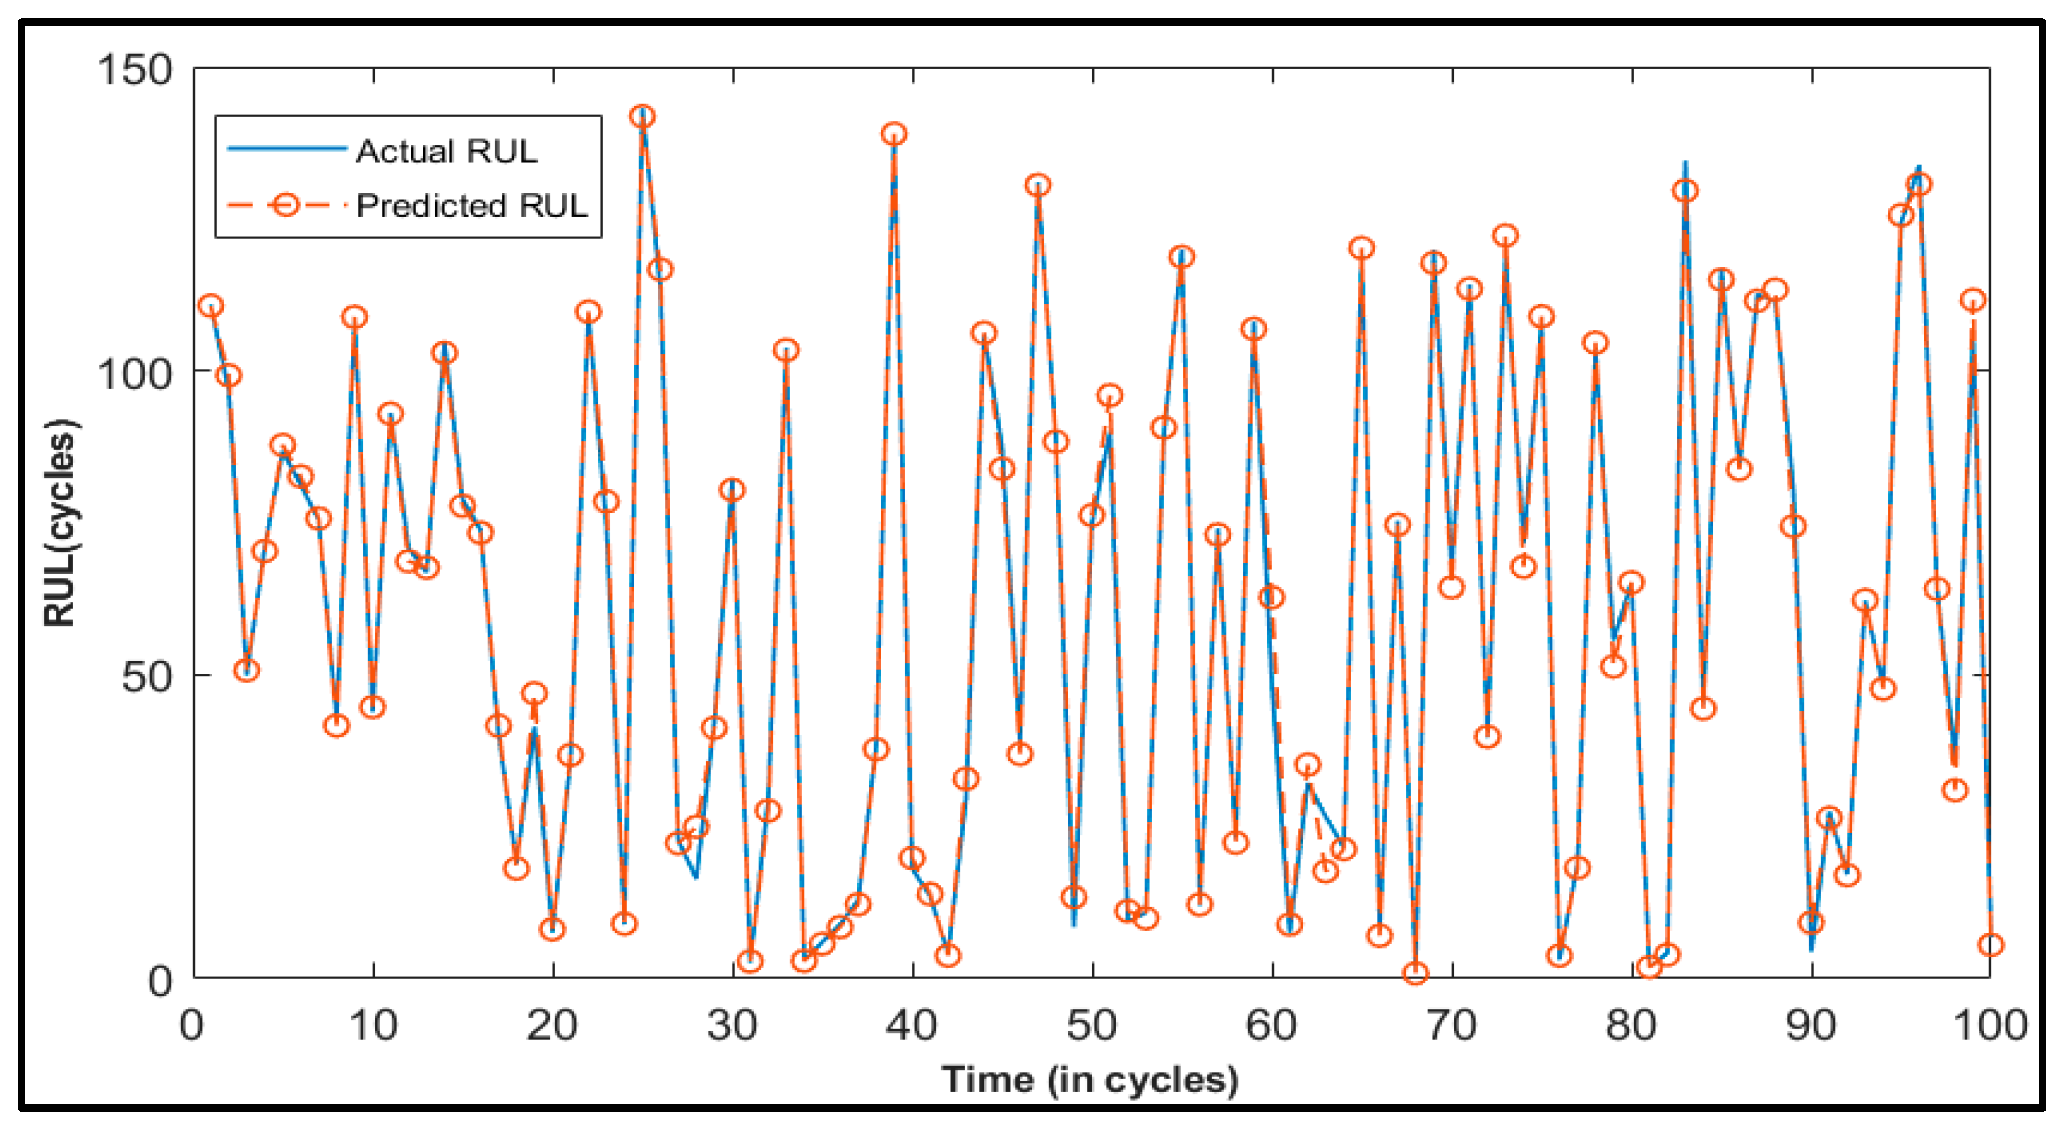
Unlike these methods, this paper presents Deep Layer-Recurrent Neural Network (DL-RNN) as a novel topology to predict the RUL of the turbofan engine. To the best of the authors’ knowledge, this is one of the few, if not the only, attempts to use DL-RNN to estimate RUL for a turbofan engine. A thorough comparison is also made against three topologies: MLP, NARX, and CFNN. The performance of our proposed method and the current method are compared. Comparative results reveal that the proposed strategy is superior in terms of accurately predicting RUL. The turbofan engine failure experimental data collection from the US National Aeronautics and Space Administration (NASA) Prognostics Center of Excellence is the subject of this article’s data analysis. Firstly, this paper illustrates the pre-processing steps performed on raw sensor data of run-to-failure engines, followed by the health indicator construction, and then, it matches test data based on data from the model library. Analysis of similarity enables having the RUL according to the outcome that fits.

2. The Turbofan Engine

A jet engine, commonly known as a gas turbine engine, is a type of turbine engine that spins pressurized gas to create power or supply kinetic energy to an airplane [25]. Turbojet, turbofan, turboprop, turboshaft, and ramjet engines are the five most common kinds of gas turbine engines [25]. The turbofan engine, often known as a fanjet, is a contemporary gas turbine engine that is commonly employed in aviation propulsion. The net force generated by the thrust that propels the item forward is referred to as propulsion. As a result of their tremendous thrust and efficiency, turbofan engines power practically all commercial aircraft. The engine is the device that converts the energy of the fuel into shaft power and uses that shaft power to propel the automobile. The engine consists of an air intake, a low and high-pressure compressor, a combustor or combustion chamber, a high and low-pressure turbine, and an outlet or exhaust nozzle. The air enters the compressor and then travels through the compressor to the air intake, where it is compressed to a high pressure. Then, it increases the temperature of the high-pressure air that is burned (mixed) with the gasoline in the combustor. The combustion produces high-velocity gases that pass through the turbines, generating energy to power the turbines through a compressor. The compressor exhausts such elevated hot gases to the turbine. The turbine’s high-velocity gas is drained out via the jet nozzle, creating push to propel the engine ahead outside through the outlet. Turbofan engines have the benefit of being more fuel efficient and producing less noise than turbojet engines. The two downsides are that it is larger than a turbojet and that it is inefficient at very high altitudes.

2.1. Components of Gas Turbine Engine

The operation of a turbofan engine is described in depth below. There are five major elements of a gas turbine engine, each of which plays a critical function in the engine’s operation.

2.1.1. Air Inlet

The air passes through the fan as it goes from left to right through the engine. The fan is in charge of producing the majority of the thrust generated by the turbofan engine. The shaft connects the fan to the low-pressure compressor and the low-pressure turbine. The majority of air traveling through the fan travels past the engine’s core, which is known as bypass air, and never interacts with other engine components. It is propelled straight from the back of an engine [26]. The leftover air reaches the heart of an engine before entering the low-pressure compressor.

2.1.2. Compressor

The compressor’s main job is to add energy to the air in the form of pressure and heat, preparing it for combustion. The temperature of the air rises as the pressure rises. Low-pressure compressors (LPC) and high-pressure compressors (HPC) are the two main types of compressors (HPC). The low-pressure shaft connects the low-pressure compressor, the fan, and the low-pressure turbine. The high-pressure compressor is placed directly downstream of the LPC and diagonally upstream of the combustor, and it is linked to the high-pressure turbine via a high-pressure shaft [26].

2.1.3. Combustor

The fuel is mixed with the hot pressure air that travels through the compressor and burnt in the combustion chamber. This is where the reaction occurs, resulting in extremely high-temperature, high-velocity gases that are utilized to power the turbine [26]. The combustion chamber is located immediately behind the compressor and is composed of materials that can endure high temperatures caused by combustion. It may be located in the heart of an engine.

2.1.4. Turbine

Turbines are made up of a row of spinning blades. The turbine takes energy from the high-temperature, high-velocity gas from the combustor and delivers it to the compressor and fan through the connecting shaft. This energy assists in the rotation of the compressor and fan. As a result of the energy extracted by the turbine, the temperature and pressure of the air exiting the turbine are comparatively low. There are two types of turbines: high-pressure turbines (HPT) and low-pressure turbines (LPT). The high-pressure turbine is placed upstream of the low-pressure turbine and downstream of the combustor or burner. The low-pressure turbine, on the other hand, is placed downstream of the high-pressure turbine and upstream of the exhaust nozzle [26].

2.1.5. Exhaust Nozzle

The exhaust nozzle is positioned on the engine’s right side, just after the turbine. It is also the final component through which air goes before exiting the engine. It is a tube-shaped part that helps the engine go ahead by producing more thrust [26]. It also aids in pressure regulation within the engine, which aids in the appropriate operation of other components.

2.2. Failure of Turbofan Engine

Human life is influenced by health, and all systems deteriorate as a result of time, usage, and environmental factors. If a run-to-failure approach is being used, gas-turbine engines may be subjected to harsh environmental and operational conditions such as corrosion, wear, buckling, erosion, and so on, which can lead to costly and catastrophic breakdowns [27]. As a result, each gas turbine engine has over two hundred sensors attached to check its condition. Over time, the health of an engine deteriorates significantly. Engine health is influenced by several engine characteristics, sometimes known as health parameters. The health parameters of various engines vary. As a result, it is critical to monitor and assess these health metrics to optimize the engine’s life, performance, and dependability, among other things. However, due to the complexity of aircraft and sometimes the lack of instruments to assess certain characteristics, direct measurements of health parameters are not possible [27]. As a result, having problem diagnostics, Prognostics, and Health Management (PHM) on the engine is critical. The most complex and challenging aspect of PHM is prognostics on an engine’s remaining usable life (RUL).

3. Data Brief Description

As part of the PHM 2008 prognostics data challenge [28], over 200 multivariant time-series datasets were made available. With unknown beginning wear and production variance, each dataset is unique. Three operating settings and twenty-one sensor readings polluted by sensor noise are included in the datasets. “Training”, “testing”, and “final” are the three datasets offered. The training trajectories, which are made up of entire run-to-failure data, are used to train the algorithm to anticipate remaining usable life. Each time series is from a distinct engine, implying that the data from a fleet of engines might be of the same type. Then, the trained algorithm is used to create test trajectories, which are made up of brief instance time series that finish a certain amount of time before deterioration. Each column represents a different variable, and each row represents a snapshot of data received during a single cycle of operation. Each engine is equipped with 21 different types of sensors (e.g., pressure, temperature, and shaft speed) that collect data on various engine parameters. C-MAPSS [29] is made up of two datasets: training and testing. The training trajectories provide operational examples with full run-to-failure data, which will be utilized to train the algorithms. Test trajectories, on the other hand, can only be made up using smaller amounts of data until the approach fails. A set of trajectories is used to model four distinct operation circumstances. Only the first sub-dataset, FD001, is considered in this paper. The first two columns provide the unit number and operating duration in cycles, while the third, fourth, and fifth columns contain operational parameters. As seen in Table 1, the rest of the columns are sensor measurements. Table 2 lists the sensors used for the C-MAPSS and PHM08 datasets

3.1. Data Preprocessing

A min–max normalization is used for both the training and testing trajectories of the C-MAPSS dataset along each variable to standardize the data and prevent overfitting the model over variables with a high order of magnitude [30]. The scaled value X s c a l e d of a vector X is evaluated using the equation. Each column function’s lowest and maximum values are represented by X m i n   and X m a x , respectively.
X s c a l e d = X X m i n X m a x X m i n
In addition, variables that do not alter over time and thus could affect the results are removed. Some of the 21 sensors have consistent outputs for the engine’s life; hence, they cannot give any helpful information for prediction. As a result, the C-MAPSS data do not include the outputs of these sensors. In this paper, 14 useful sensors measurements—2, 3, 4, 7, 8, 9, 11, 12, 13, 14, 15, 17, 20, 21—are selected, and the irregular/unchanged sensor data are abandoned, as shown in [31,32].
Since the real RUL values in the C-MAPSS dataset are only provided for test data, it is critical to appropriately identify the training data. Setting the RUL to the form of (2) is a simple and straightforward method. The health equation is as follows [33]:
h t = 1 + d exp a t ^ b
where d is the non-zero initial degradation, index t is the number of cycles, a and b are the coefficients from which b is set to 1 as a default value, and a can be written as (3) at the end of cycle when h t is 0.
a = log 1 + d / t
The deterioration of an engine system, on the other hand, is negligible until the failure arises after the engine has been operating for a while. As a result, the engine system’s RUL should begin at a constant value and steadily decline as the failure proceeds. However, how can you figure exactly how much the RUL is worth when you are just starting out? In the literature, it was estimated that there were around 130 cycles [29]. On the other hand, the justification behind picking 130 as the starting RUL is rarely explained. In this study, we proposed a technique for determining an acceptable starting RUL. The coefficient a is calibrated to provide an initial RUL value for that engine at zero-time cycle and zero RUL at the end of the cycle. Figure 1 depicts the RUL of engine no.1, which demonstrates that when the time cycle is zero, the RUL value is 112, which is the beginning RUL of engine no.1, and it degrades as the time cycle increases until the RUL is zero at the end of the cycle or when the maximum threshold is achieved. This approach is used to train the algorithm for all 100 engines in FD001, and the produced health indicator is used as a target.
The challenge dataset is approached in a similar manner. To have an HI that is useful for prognosis, a data processing strategy that includes feature extraction, data cleansing, and feature selection is required. NASA’s collection includes 21 sensors that measure characteristics such as temperature, pressure, and bypass ratio. Furthermore, the training dataset’s sensor data are contaminated with a fair amount of noise. As can be seen in Figure 2, the raw data are directly from the engine source and have not been processed or cleaned in any way. In addition, each trajectory has its own initial wear pattern and is tainted by noise. As a result, the raw data must be pre-processed, which includes regime clustering, normalization, and sensor selection. Before switching on to the remaining usable life, raw data were pre-processed to change it into un-understandable data. Regime clustering, regime normalization, sensor selection, trendability analysis, and health indicator construction are all phases in the pre-processing process [34]. The pre-processing was carried out on both the training and test trajectories. The stages for pre-processing are shown below.

3.1.1. Regime Clustering

This is the initial phase in the data pre-processing process, and it is used to determine operating regimes. The operational parameters in the engine data have a direct influence on the sensors, and establishing the ideal number of clusters in these settings can lead to the discovery of multiple regimes. It is unlikely that all operational parameters in distinct data would respond in the same manner to a clustering technique. Some people will react more positively than others, while others will remain unresponsive. Clustering, on the other hand, should be approached as a generic problem to solve rather than a one-size-fits-all approach to operational settings. Clustering is a technique for identifying and grouping similar data points in huge datasets. By counting the number of clusters, the number of regimes may be determined. k-means clustering, hierarchical clustering, grid-based clustering, and more techniques of regime clustering exist. Since it is straightforward to implement and assures convergence, the k-means method is used in this research. As shown in Figure 3, the k-means method revealed that there are six cluster points, indicating that there are six operational regimes with three operational settings [34].

3.1.2. Regime Normalization

The process of converting raw data to a standard scale and normalizing it is known as normalization. This involves computing the z-score, which is just the difference between each regime’s population average and each individual raw sensor, divided by the population’s standard deviation. The following is the formula for calculating z-score normalization:
Z s c o r e = x μ σ
where x is the raw data value of the regimes, μ   is the population average, and σ is the standard deviation of the population. The population mean is given by:
μ = 1 n i = 0 n x
where   n is the number of observations and standard deviation is given as:
σ = i = 1 n ( x μ ) 2 n .
The results of normalization for the first five sensors, i.e., sensor 1 to 5, are shown in Figure 4 [34].

3.1.3. Sensor Selection

We can observe the trend of all 21 sensors after executing regime normalization. Furthermore, sensors with the same deterioration trend were chosen. Trendability analysis was used to do this. The most trendable sensors values were chosen to create the health indicator (HI), and the deterioration pattern of each sensor was calculated [34]. As a result of the trendability study, 10 sensors with the same deterioration pattern were chosen: 2, 3, 4, 7, 11, 12, 15, 17, 20, and 21. These eleven sensors were discovered to be beneficial in calculating health indicators. Figure 5 depicts the deterioration pattern of five usable sensors out of ten.

3.1.4. Health Indicator

This section focuses on combining all 21 sensors to create a single health indicator. The health indicator is considered to decline linearly from 1 to 0 over time. As a result, the health status at the start is presumed to be 1, and at the end, it is assumed to be 0 [34]. In addition, for the 10 usable sensors used as regressors, a fit linear regression model was built. Figure 6 shows the fused health indicator for training data, which is then employed as a neural network output. Both training and test trajectories went through this process.

4. Neural Network Training

A model is trained using neural networks to map between raw data as an input and health indicator (HI) as an output. Artificial intelligence includes ANN. Deep learning approaches such as Convolutional Neural Networks (CNNs), Recurrent Neural Networks (RNNs), Long Short-Term Memory Networks (LSTMS), self-organizing maps (SOMs), Radial Basis Function Networks (RBFNs), and others have outperformed classic RUL prediction algorithms. The design specifics of MLP, NARX, CFNN, and DL-RNN are presented in this section.

4.1. Multilayer Perceptron

Multilayer perceptron (MLP) is a feedforward Artificial Neural Network augmentation. It is made up of three layers: input, hidden, and output. From the first layer on the left, the input layer, each perceptron provides outputs to all perceptrons on the second layer, the hidden layer, and all perceptrons on the second layer transmit outputs to the last layer on the right, the output layer [35]. Figure 7 shows the basic construction of MLP along with NARX and C-FNN. With 10 inputs and one target for the challenge data and fourteen inputs and one target for the C-MAPSS dataset, the multilayer perceptron method was implemented in MATLAB. The inputs and output (target) were all standardized using min–max normalization between the ranges of [0, 1]. The aim was HI, and the inputs were normalized raw sensor data from usable sensors. In the first layer, four hidden nodes were employed, whereas in the second layer, five hidden nodes were used. The learning rate is set to default 0.01, and batch size is set to 64. The Levenberg–Marquardt training function was used to train the method, which takes less time than Bayesian regularization but requires more memory to train and prevents overfitting. Min–max normalization was used to map both the inputs and the target between the ranges of [0, 1]. For each node, a hyperbolic tangent activation function is utilized. The mean square error was used as the performance function (MSE). The method was trained using 18,000 epochs for 58 s to 1 min 26 s, and then, the same training raw data were put into the received network feature to ensure that the learnt neural network accuracy was appropriate. The validation produced a similar pattern; however, the findings were not adequate when compared to the initial aim. When the machine was near to failure, the MLP network was quite accurate in forecasting remaining usable life at the end of the run. During the early and middle sections of the race, however, projecting RUL is considerably more difficult, and the performance is not as excellent. To increase the network’s performance, many improvements were performed, including the use of different training functions, such as Bayesian regularization, scaled conjugate gradient backpropagation, RPROP backpropagation, and so on.

4.2. Nonlinear Autoregressive Network with Exogenous Inputs

The nonlinear autoregressive network with exogenous inputs is a persistent hierarchical network with feedback relationships spanning many levels. This means that the model relates the current value of a time series to both historical values of the same series and current and historical values of the (exogenous) driving sequence [36]. Figure 8 depicts NARX’s basic construction. NARX has been employed in several dynamic systems with complicated nonlinearities. Following the MLP neural network’s poor accuracy, the NARX algorithm was implemented in MATLAB. A NARX network can be trained in two ways [36]:
(a)
Series-parallel mode sequence or open loop mode NARX network in which the actual output is directly used instead of the approximate output being fed back.
(b)
The parallel mode of the NARX network or the closed loop network is to feed the expected performance back to the network.
For the Challenge data, inputs were defined as a “10*time” cell of useable raw sensor data and a “14*time” cell for the C-MAPSS dataset, while the target series was specified as a 1*time HI cell in the preceding segment. The input and feedback delays were both set to two, with a total of two concealed layers. There are five nodes in the first hidden layer and five nodes in the second hidden layer. The learning rate is set to default, 0.01, and the batch size is set to 64. Using min–max normalization, both the inputs and the target were mapped in the range [0, 1]. The algorithm was first trained in an open loop form before being switched to a closed loop mode. With hyperbolic tangent sigmoid as an activation function, the convergence time was approximately 1 min 50 s to around 1 min 4 s with Levenberg–Marquardt as a training function. After training the algorithm, validation was performed on the same raw inputs to ensure that the trained neural network was accurate. The validation resulted in the network’s performance being extremely bad. Smooth data were utilized to smooth the output and filter the noise.

4.3. Cascade Forward Neural Network

Cascade forward neural networks are similar to feedforward neural networks in that they include a link from the input to each successive layer. Figure 7 depicts the basic C-FNN construction [37]. The output layer of a three-layer network is directly connected to the input layer as well as the secret layer [38]. A cascade forward neural network can be utilized for any type of input to output mapping. This method has the benefit of accepting nonlinear input–output relationships while maintaining the linear connection. In this analysis, we employ a network in the field of time series. The best architecture was calculated utilizing the incremental search procedure in both the input and hidden units. The inputs for the Challenge data were set to a “10*time” cell of accessible raw sensor data and a “14*time” cell for the C-MAPSS dataset, with a 1*time HI cell as the target. In all, two inputs, feedback delays, and two hidden layers were employed. The learning rate is set to default, 0.01, and the batch size is set to 64. The convergence duration ranged from about 1 min 8 s using hyperbolic tangent sigmoid as an activation function to around 1 min 35 s with Levenberg–Marquardt as a training function.

4.4. Deep Layer-Recurrent Neural Network

Feedforward networks are similar to recurrent neural networks with layers, except that each layer has a recurrent connection coupled with a tap delay. This allows the network to respond to input data from the time series in an infinitely dynamic manner [39]. It is divided into two parts: recurrent layers and feedforward. RNNs (Recurrent Neural Networks) have shown to be a powerful tool for modeling sequential data. They have paved the way for considerable advancement in a range of fields, including language processing and voice recognition. Fully recurrent networks, recursive neural networks, Hopfield networks, Elman and Jordan neural networks, continuous-time RNNs, and bidirectional RNNs are a few examples of DL-RNNs. The fully recurrent network was established in the 1980s and is a network of neuron-like units. Each unit is linked to the others in a guided manner. Each connection has a real-valued weight that can be modified. The Hopfield neural network is a form of recurrent Artificial Neural Network that was first developed in 1982. John Hopfield, the inventor, was given the name. It has an important function in that it ensures that all its dynamics can converge to the local minimum. However, it does often converge to a false local minimum. It is a unique neural network, since it does not use sequences of patterns. Figure 8 depicts the DL-basic RNN’s construction. When stacking multiple RNN cells on top of each other, the hidden state of the lower level is passed on as input to the next-higher level. After testing with the MLP and NARX, the Layer-Recurrent Neural Network was utilized to train the algorithm and forecast the RUL. The dynamic data from 14 separate variables of raw usable sensor data are expressed in the inputs as a “14*t” cell of a matrix for the C-MAPSS dataset, as mentioned in the preceding section. The Deep Layer-Recurrent Neural Network is built in a triple loop with an increasing number of hidden layers in the outer loop, a default value for layer delays, and a scaled conjugate gradient as the training function. The learning rate is set to default, 0.01, and the batch size is set to 64. There are two nodes in the second hidden layer and fourteen nodes in the third hidden layer. In other words, the buried layers do not have a default value. For each node, a hyperbolic tangent activation function is utilized. To ensure that the learnt neural network accuracy is appropriate, the same training raw data are integrated into the received network feature. A similar trend ended in confirmation, but it was tainted with noise, so smooth data were used to filter it out, and the network was able to attain high accuracy for the C-MAPSS dataset after only 57 s of training and 1 min 19 s of training for challenge dataset. With DL-RNN, the network’s accuracy increased considerably. Since the answer matches the initial HI used in network training, the network may now be utilized for fresh inputs. The network’s performance is assessed using a test trajectory. While the network feature trained with this data gives the expected results, there is a chance that if the network is trained with other input and output values, there would be unwelcome predictions owing to differing weight and bias values. As a result, numerous neural networks from various trajectories are trained with inputs and outputs and saved in the network library, which can then be tested using the test.txt untrained data.
Figure 8. Basic architecture of DL-RNN [40].
Actuators 11 00067 g008

5. Validation and Discussion

This section discusses the suggested method’s prognostic performance. To demonstrate the superiority of Deep Layer-Recurrent Neural Network over other ensemble methods such as Multilayer Perceptron (MLP), Nonlinear Autoregressive Network with Exogenous Inputs (NARX), and Cascade Forward Neural Network (CFNN), comparisons with other ensemble methods such as Multilayer Perceptron (MLP), Nonlinear Autoregressive Network with Exogenous Inputs (NARX), and Cascade Forward Neural Network (CFNN) are made (with DL-RNN). By default, MLP fails to recall patterns in sequential data, and multi-dimensional data processing needs many parameters. When compared to MLP and CFNN, NARX makes use of its memory capacities by utilizing the previous values of the time series, i.e., dynamic mapping rather than static mapping, and it has a faster convergence rate, making it more powerful in time-series prediction. Furthermore, recurrent neural networks with layers are similar to feedforward networks, with the exception that each layer has a recurrent relationship connected with a tap delay. This allows the network to respond to input data from the time series in an infinitely dynamic manner. When compared to the other three topologies, NARX, MLP, and CFNN, DL-RNN considers prior values throughout the training phase, making it better. All of the tests are carried out on a PC with an Intel Core i5 processor and 8 GB of RAM, as well as on the MATLAB environment.
For all four topologies, the Mean Absolute Error (MAE) and Root Mean Square Error (RMSE) are employed for performance evaluation and are calculated both for training and testing. These two functions will help us to understand the model’s performance better. The RMSE highlights greater mistakes more, since the errors are squared before being averaged. The lower the MAE and RMSE values, the better a network’s performance. Table 3 shows the mean and standard deviation of many runs for each of the four topologies. Table 4 shows that the performance of the NARX network is better than that of the MLP and CFNN networks, since the MAE and RMSE values are lower than those of the other two. Table 4 further shows that the DL-RNN model produced the greatest results when compared to the other three topologies. Experiments were carried out utilizing Levenberg–Marquardt (LM), Bayesian Regularization (BR), and Scaled Conjugate Gradient (SCG) to examine the four topologies separately. SCG requires less time to converge than the LM and BR, and it produces better results than the other two training methods. When trained using SCG, the Mean Square Error (MSE) and Integral Square Error (ISE) calculations, as well as the number of iterations, are shown in Table 5.
MAE and RMSE are evaluated for all four topologies and are presented in Table 6. As can be seen, the RMSE and MAE values of DL-RNN are lowest compared to the other three.
Table 7 shows the comparison of the SCG algorithm for all four methods. Using the SCG algorithm, the network gives better estimation results, and it converges fast compared to the other algorithms. The number of iterations is set to 18,000 to train the algorithm.
The remaining useful life of 100 testing engines is estimated after successfully training the model. The estimated RUL is compared with the actual RUL values, and the results are shown in Figure 9 below where the blue line indicates the actual RUL and the red line is the predicted RUL. As can be seen, the expected values closely match the true values.

6. Conclusions

Over the last decade, deep learning methods have gained popularity in engineering applications, particularly in data analysis for reliability evaluation, which was previously inefficient due to the requirement of expert knowledge on the studied system as well as the limitations of traditional PHM techniques. There are still many obstacles for reliability-related, data-driven applications to maintain improving the estimate of health status metrics that can provide an accurate diagnostic for systems and facilities. Using massive machinery data, this research proposes a deep learning approach for predicting the health condition of complex systems. The framework uses a unique topology layer-recurrent neural network to train the algorithm, which has been verified using two independent datasets. Through the training and testing of several models, the proposed framework is validated using the C-MAPSS and Challenge datasets. The suggested approach has proven to be reliable in predicting the remaining usable life of both datasets. The training and testing for the C-MAPSS dataset is performed on all 100 engines in the first subset. The suggested DL-RNN-based model beat all three topologies when the average result for both metrics, MAE and RMSE, was compared to the other three topologies. For the challenge dataset, training and testing are carried out on all 218 engines, and MAE and RMSE are calculated for all four topologies. A comparison of SCG algorithms is also shown, demonstrating the superiority of the suggested topology.

7. Future Work

The findings shown and described above show that the framework can extract features and sequential analysis can be performed on raw data. The method is flexible and gives consistent outcomes in a range of settings. However, there are certain aspects that may be improved. The training procedure is fully supervised, which is one of the major drawbacks of the topologies utilized in this work. While the model may be directly applied to a wide range of situations, there are still several reliability-related phenomena for which the needed amount of labeled data to train a fully supervised model is not available. A further step in the suggested research would be to use an unsupervised data preprocessing approach, such as clustering, to create labels for the training data.

Author Contributions

Conceptualization, U.T. and H.C.; methodology, U.T.; software, U.T.; validation, U.T. and H.C.; formal analysis, U.T. and H.C.; investigation, U.T. and H.C.; resources, H.C.; data curation, U.T.; writing—original draft preparation, U.T.; writing—review and editing, U.T. and H.C.; visualization, U.T.; supervision, H.C.; project administration, H.C.; funding acquisition, H.C. All authors have read and agreed to the published version of the manuscript.

Funding

This research was funded by Natural Sciences and Engineering Research Council of Canada (NSERC) grant number: 315082.

Institutional Review Board Statement

Not applicable.

Informed Consent Statement

Not applicable.

Data Availability Statement

The datasets used in this study are openly available on NASA repository and they are called Turbofan Engine Degradation Simulation Dataset and PHM08 Challenge Dataset (https://ti.arc.nasa.gov/tech/dash/groups/pcoe/prognostic-data-repository/, accessed on 28 January 2022).

Conflicts of Interest

The authors declare no conflict of interest.

References

  1. Goebel, K.; Saha, B.; Saxena, A. A comparison of three data driven techniques for prognostics. In 62nd Meeting of the Society for Machinery Failure Prevention Technology (MFPT); NASA Ames Research Center: Moffett Field, CA, USA, 2008. [Google Scholar]
  2. Okoh, C.; Roy, R.; Mehnen, J.; Redding, L. Overview of Remaining Useful Life Prediction Techniques in Through-Life Engineering Services. Procedia CIRP 2014, 16, 158–163. [Google Scholar] [CrossRef] [Green Version]
  3. Chaoui, H.; Kandidayeni, M.; Boulon, L.; Kelouwani, S.; Gualous, H. Real-Time Parameter Estimation of a Fuel Cell for Remaining Useful Life Assessment. IEEE Trans. Power Electron. 2021, 36, 7470–7479. [Google Scholar] [CrossRef]
  4. El Mejdoubi, A.; Chaoui, H.; Sabor, J.; Gualous, H. Remaining Useful Life Prognosis of Supercapacitors under Temperature and Voltage Aging Conditions. IEEE Trans. Ind. Electron. 2018, 65, 4357–4367. [Google Scholar] [CrossRef]
  5. Luo, J.; Namburu, M.; Pattipati, K.; Qiao, L.; Kawamoto, M.; Chigusa, S. Model-based prognostic techniques [maintenance applications]. In Proceedings of the AUTOTESTCON 2003. IEEE Systems Readiness Technology Conference, Anaheim, CA, USA, 22–25 September 2003. [Google Scholar]
  6. Chaoui, H.; Ibe-Ekeocha, C. State of Charge and State of Health Estimation for Lithium Batteries using Recurrent Neural Networks. IEEE Trans. Veh. Technol. 2017, 66, 8773–8783. [Google Scholar] [CrossRef]
  7. Wang, Y.; Peng, Y.; Zi, Y.; Jin, X.; Tsui, K. A Two-Stage Data-Driven-Based Prognostic Approach for Bearing Degradation Problem. IEEE Trans. Ind. Inform. 2016, 12, 924–932. [Google Scholar] [CrossRef]
  8. Dong, G.; Yang, F.; Wei, Z.; Wei, J.; Tsui, K.-L. Data-Driven Battery Health Prognosis Using Adaptive Brownian Motion Model. IEEE Trans. Ind. Inform. 2020, 16, 4736–4746. [Google Scholar] [CrossRef]
  9. Dhiman, H.S.; Deb, D.; Muyeen, S.M. Lithium-Ion Battery Prognostics based on Support Vector Regression and Time-Series Analysis. In Proceedings of the IEEE 4th International Conference on Computing, Power and Communication Technologies (GUCON), Kuala Lumpur, Malaysia, 24–26 September 2021; pp. 1–4. [Google Scholar]
  10. Dhiman, H.S.; Deb, D.; Muyeen, S.M.; Kamwa, I. Wind Turbine Gearbox Anomaly Detection Based on Adaptive Threshold and Twin Support Vector Machines. IEEE Trans. Energy Convers. 2021, 36, 3462–3469. [Google Scholar] [CrossRef]
  11. Dhiman, H.S.; Deb, D.; Carroll, J.; Muresan, V.; Unguresan, M.-L. Wind Turbine Gearbox Condition Monitoring Based on Class of Support Vector Regression Models and Residual Analysis. Sensors 2020, 20, 6742. [Google Scholar] [CrossRef] [PubMed]
  12. El Mejdoubi, A.; Oukaour, A.; Chaoui, H.; Slamani, Y.; Sabor, J.; Gualous, H. Online Supercapacitor Diagnosis for Electric Vehicle Applications. IEEE Trans. Veh. Technol. 2016, 65, 4241–4252. [Google Scholar] [CrossRef]
  13. Rodriguez-Guerrero, M.A.; Jaen-Cuellar, A.Y.; Carranza-Lopez-Padilla, R.D.; A Osornio-Rios, R.; Herrera-Ruiz, G.; Romero-Troncoso, R. Hybrid Approach Based on GA and PSO for Parameter Estimation of a Full Power Quality Disturbance Parameterized Model. IEEE Trans. Ind. Inform. 2018, 14, 1016–1028. [Google Scholar] [CrossRef]
  14. Hesser, D.F.; Mostafavi, S.; Kocur, G.K.; Markert, B. Identification of acoustic emission sources for structural health monitoring applications based on convolutional neural networks and deep transfer learning. Neurocomputing 2021, 453, 1–12. [Google Scholar] [CrossRef]
  15. Seventekidis, P.; Giagopoulos, D.; Arailopoulos, A.; Markogiannaki, O. Structural Health Monitoring using deep learning with optimal finite element model generated data. Mech. Syst. Signal Process. 2020, 145, 106972. [Google Scholar] [CrossRef]
  16. Zhou, K.; Tang, J. Harnessing fuzzy neural network for gear fault diagnosis with limited data labels. Int. J. Adv. Manuf. Technol. 2021, 115, 1005–1019. [Google Scholar] [CrossRef]
  17. Zhao, X.; Jia, M. A novel unsupervised deep learning network for intelligent fault diagnosis of rotating machinery. Struct. Health Monit. 2020, 19, 1745–1763. [Google Scholar] [CrossRef]
  18. Qasim, M.; Khadkikar, V. Application of Artificial Neural Networks for Shunt Active Power Filter Control. IEEE Trans. Ind. Inform. 2014, 10, 1765–1774. [Google Scholar] [CrossRef]
  19. Hong, C.W.; Lee, C.; Lee, K.; Ko, M.-S.; Kim, D.E.; Hur, K. Remaining Useful Life Prognosis for Turbofan Engine Using Explainable Deep Neural Networks with Dimensionality Reduction. Sensors 2020, 20, 6626. [Google Scholar] [CrossRef] [PubMed]
  20. Lan, G.; Li, Q.; Cheng, N. Remaining Useful Life Estimation of Turbofan Engine Using LSTM Neural Networks. In Proceedings of the IEEE CSAA Guidance, Navigation and Control Conference (CGNCC), Xiamen, China, 10–12 August 2018. [Google Scholar]
  21. Yuan, M.; Wu, Y.; Lin, L. Fault diagnosis and remaining useful life estimation of aero engine using LSTM neural network. In Proceedings of the IEEE International Conference on Aircraft Utility Systems (AUS), Beijing, China, 10–12 October 2016. [Google Scholar]
  22. Li, X.; Ding, Q.; Sun, J.-Q. Remaining useful life estimation in prognostics using deep convolution neural networks. Reliab. Eng. Syst. Saf. 2018, 172, 1–11. [Google Scholar] [CrossRef] [Green Version]
  23. de Miranda, A.R.; Barbosa, T.M.G.D.A.; Conceicao, A.G.S.; Alcala, S.G.S. Recurrent Neural Network Based on Statistical Recurrent Unit for Remaining Useful Life Estimation. In Proceedings of the 8th Brazilian Conference on Intelligent Systems (BRACIS), Salvador, Brazil, 15–18 October 2019. [Google Scholar]
  24. Heimes, F.O. Recurrent neural networks for remaining useful life estimation. In Proceedings of the International Conference on Prognostics and Health Management, Denver, CO, USA, 6–9 October 2008. [Google Scholar]
  25. Fornlof, V.; Galar, D.; Syberfeldt, A.; Almgren, T.; Catelani, M.; Ciani, L. Maintenance, prognostics and diagnostics approaches for aircraft engines. In Proceedings of the IEEE Metrology for Aerospace (MetroAeroSpace), Florence, Italy, 22–23 June 2016. [Google Scholar]
  26. Enright, M.P.; McClung, R.C. A Probabilistic Framework for Gas Turbine Engine Materials With Multiple Types of Anomalies. J. Eng. Gas Turbines Power 2011, 133, 082502. [Google Scholar] [CrossRef]
  27. Lu, F.; Wu, J.; Huang, J.; Qiu, X. Restricted-Boltzmann-Based Extreme Learning Machine for Gas Path Fault Diagnosis of Turbofan Engine. IEEE Trans. Ind. Inform. 2020, 16, 959–968. [Google Scholar] [CrossRef]
  28. Saxena, A.; Goebel, K. PHM08 challenge data set. In NASA Ames Prognostics Data Repository; NASA Ames Research Center: Moffett Field, CA, USA, 2008. [Google Scholar]
  29. Goebel, K.; Saxena, A. Turbofan Engine Degradation Simulation Dataset. In NASA Ames Prognostics Data Repository; NASA Ames Research Center: Moffett Field, CA, USA, 2008. [Google Scholar]
  30. Patro, S.; Sahu, K.K. Normalization: A preprocessing stage. arXiv 2015, arXiv:1503.06462. [Google Scholar] [CrossRef]
  31. Zhang, C.; Lim, P.; Qin, A.K.; Tan, K.C. Multiobjective Deep Belief Networks Ensemble for Remaining Useful Life Estimation in Prognostics. IEEE Trans. Neural Netw. Learn. Syst. 2017, 28, 2306–2318. [Google Scholar] [CrossRef] [PubMed]
  32. Lim, P.; Goh, C.K.; Tan, K.C. A Time Window Neural Network Based Framework for Remaining Useful Life Estimation. In Proceedings of the 2016 International Joint Conference on Neural Networks (IJCNN), Vancouver, BC, Canada, 24–29 July 2016. [Google Scholar]
  33. Saxena, A.; Goebel, K.; Simon, D.; Eklund, N. Damage propagation modeling for aircraft engine run-to-failure simulation. In Proceedings of the 2008 International Conference on Prognostics and Health Management, Denver, CO, USA, 6–9 October 2008. [Google Scholar]
  34. Wang, T.; Yu, J.; Siegel, D.; Lee, J. A similarity-based prognostics approach for Remaining Useful Life estimation of engineered systems. In Proceedings of the 2008 International Conference on Prognostics and Health Management, Denver, CO, USA, 6–9 October 2008. [Google Scholar]
  35. Zhang, B.; Wang, D.; Song, W.; Zhang, S.; Lin, S. An Interval-Valued Prediction Method for Remaining Useful Life of Aero Engine. In Proceedings of the 2020 39th Chinese Control Conference (CCC), Shenyang, China, 27–29 July 2020. [Google Scholar]
  36. Zainorzuli, S.M.; Abdullah, S.A.C.; Adnan, R.; Ruslan, F.A. Comparative Study of Elman Neural Network (ENN) and Neural Network Autoregressive with Exogenous Input (NARX) For Flood Forecasting. In Proceedings of the IEEE 9th Symposium on Computer Applications & Industrial Electronics (ISCAIE), Kota Kinabalu, Malaysia, 27–28 April 2019. [Google Scholar]
  37. Warsito, B.; Santoso, R.; Suparti; Yasin, H. Cascade Forward Neural Network for Time Series Prediction. J. Phys. Conf. Ser. 2018, 1025, 012097. [Google Scholar] [CrossRef]
  38. Tamulionis, M.; Serackis, A. Comparison of Multi-Layer Perceptron and Cascade Feed-Forward Neural Network for Head-Related Transfer Function Interpolation. In Proceedings of the 2019 Open Conference of Electrical, Electronic and Information Sciences (eStream), Vilnius, Lithuan, 25–25 April 2019. [Google Scholar]
  39. Li, G.; Yan, Z.; Wang, J. A one-layer recurrent neural network for constrained nonsmooth invex optimization. Neural Netw. 2014, 50, 79–89. [Google Scholar] [CrossRef] [PubMed]
  40. Turabieh, H.; Abu Salem, A.; Abu-El-Rub, N. Dynamic L-RNN recovery of missing data in IoMT applications. Futur. Gener. Comput. Syst. 2018, 89, 575–583. [Google Scholar] [CrossRef]
Figure 1. Health indicator of engine no. 1 of FD001 dataset.
Actuators 11 00067 g001
Figure 2. (a) Raw data from the engine source in the range of [0, 2500]; (b) Raw data from the engine source in the range of [7000, 9000].
Actuators 11 00067 g002
Figure 3. Operational regimes for three operational settings.
Actuators 11 00067 g003
Figure 4. Result of normalization for first five sensors.
Actuators 11 00067 g004
Figure 5. Degradation pattern of five useful sensors.
Actuators 11 00067 g005
Figure 6. Fused health indicator for training data.
Actuators 11 00067 g006
Figure 7. Basic architecture of MLP [35] along with the architecture of NARX [36] and C-FNN [37].
Actuators 11 00067 g007
Figure 9. RUL of 100 test engines.
Actuators 11 00067 g009
Table 1. Specifications of dataset.
IndexData Description
1Unit number
2Time (in cycles)
3Operational setting 1
4Operational setting 2
5Operational setting 3
6Sensor measurement 1
7Sensor measurement 2
8Sensor measurements 3–20
9Sensor measurement 21
Table 2. Selection of sensors.
DatasetSensors Selected
C-MAPSS2, 3, 4, 7, 8, 9, 11, 12, 13, 14, 15, 17, 20, 21
PHM082, 3, 4, 7, 11, 12, 15, 17, 20, 21
Table 3. Mean and standard deviation of multiple runs.
MeanStandard Deviation
DL-RNN0.9710.764
NARX2.5310.559
MLP2.810.328
CFNN3.720.445
Table 4. Performance comparison of different methods (FD001 dataset).
TrainingTesting
MAE (%)RMSE (%)MAE (%)RMSE (%)
DL-RNN0.1740.1990.1770.121
NARX0.7711.040.7751.08
MLP1.7242.541.7542.295
CFNN3.434.623.844.84
Table 5. Results of testing (SCG algorithm, FD001 dataset).
Scaled Conjugate Gradient
IterationsMSE (%)ISE (%)
DL-RNN18,0000.000020.0004
NARX18,0000.00020.0038
MLP18,0000.08140.0156
CFNN18,0000.01550.081
Table 6. Performance comparison of different methods (Challenge dataset).
TrainingTesting
MAE (%)RMSE (%)MAE (%)RMSE (%)
DL-RNN0.1590.2030.1270.135
NARX0.2930.4550.5140.597
MLP1.4591.6251.5161.772
CFNN1.442.391.362.45
Table 7. Results of testing (SCG algorithm, Challenge dataset).
Scaled Conjugate Gradient
IterationsMSE (%)ISE (%)
DL-RNN18,0000.000080.0018
NARX18,0000.00040.0095
MLP18,0000.00360.0804
CFNN18,0000.00530.1187
Publisher’s Note: MDPI stays neutral with regard to jurisdictional claims in published maps and institutional affiliations.

