
A Robust Model Predictive Control for Virtual Coupling in Train Sets

Mechanical Engineering Department, Universidad Politécnica de Madrid, Jose Gutierrez Abascal 2, 28006 Madrid, Spain
*
Author to whom correspondence should be addressed.
Actuators 2022, 11(12), 372; https://doi.org/10.3390/act11120372
Submission received: 26 October 2022
/
Revised: 5 December 2022
/
Accepted: 8 December 2022
/
Published: 10 December 2022
(This article belongs to the Special Issue 10th Anniversary of Actuators)
Abstract
:In recent decades, the demand for rail transport has been growing steadily and faces a double problem. Not only must the transport capacity be increased, but also a more flexible service is needed to meet the real demand. Both objectives can be achieved through virtual coupling (VC), which is an evolution of the current moving block systems. Trains under VC can run much closer together, forming what is called a virtually coupled train set (VCTS). In this paper, we propose an approach in which virtual coupling is implemented via model predictive control (MPC). For this purpose, we define a robust controller that can predict, based on a dynamic model of the train, the state of the system at later moments of time and make the appropriate control decisions. A robust MPC (RMPC) is obtained by introducing two uncertain variables. The first uncertain variable is added to the acceleration equation of the dynamic model, while the second uncertain variable is used to define the uncertainty in the train positioning. To test the RMPC for virtual coupling, two simulation cases are performed for a metro line, analysing the influence of both the uncertainties. In all cases, the results obtained show a safer operation of the virtual coupling without significantly affecting the service.
1. Introduction
In recent decades, the demand for transport has been progressively increasing in both the public and private sectors. The railroad, as an essential, efficient, and sustainable service to reduce congestion in other modes of transport, has been affected by this tendency [1] and must, therefore, face a double problem. On the one hand, it is necessary to increase the transport capacity to meet this demand. In this case, the solutions proposed involve reducing the minimum intervals between trains instead of building expensive new lines. On the other hand, it is necessary to make the service more flexible by reducing the operating costs and maintaining the quality of service required to always meet the real demand.
An interesting solution to address both problems is virtual coupling between trains [2] forming a virtually coupled train set (VCTS), which is an evolution of the current moving block systems. These systems, such as Communication-Based Train Control (CBTC) and European Train Control System (ETCS) Level 3, require that a train be able to brake and stop before the last known position of the preceding train. However, this assumption is conservative as it does not consider the speed and braking capability of the preceding train. Thus, in this context, based on the principle of spacing trains in a relative braking distance, as well as the basic principles of autonomous vehicles and platoon cars, a new concept has emerged: a train convoy, virtual coupling, or virtually coupled train sets (VCTSs) [2].
The authors in [3] presented initial estimations showing that virtual coupling can reduce the distance between trains by 64% compared to the European Train Control System (ETCS) Level 2 and by 43% compared to the ETCS Level 3, thereby increasing the line capacity significantly.
The VCTS has two main advantages. First, the VCTS significantly improves the current capacity limit imposed by automatic train protection (ATP) by allowing trains to run safely over a shorter distance. This significantly reduces the costs of an additional capacity, as it uses mainly on-board equipment rather than major infrastructure changes, such as the installation of new tracks or signalling systems.
Second, besides improving the capacity, the VCTS concept aims, above all, to benefit from operational flexibility and robustness by enabling an interoperability between different rail vehicles and replacing sensitive mechanical couplings. The VCTS enables a more flexible operation of the trainsets since it allows for the circulation of a train set as if it were mechanically coupled, but with no real physical connection. This allows for a more flexible service under an optimized infrastructure by connecting or disconnecting units from the train set in a fast and efficient way. This fact is especially relevant, e.g., in situations with two lines featuring shared tracks in some sections, but different terminal stations and in stations with less traffic, as seen in [4,5]. The main idea of this second advantage is twofold: to be able to operate with smaller configurations adapted to the traffic needs and to increase flexibility to serve heterogeneous demands, also enabling an interoperability between different rail vehicles.
In this paper, we propose an approach in which virtual coupling is implemented via model predictive control (MPC) for solving the control problems of the VCTS. MPC is an advanced control method that can control a system while satisfying a set of constraints. One of the main advantages of this system is that it can be formulated in a simple way since its dynamics and constraints have a real physical meaning. On the other hand, the response of the current control system is also optimized based on the future predictions, so this feature allows the MPC to anticipate future events and, consequently, take the necessary control actions in advance.
Due to this prediction capability, MPC is one of the most widely used control techniques in autonomous vehicle driving and vehicle platoons, as noted in [6,7,8], and its results form the basis and foundation for most of the research on virtual coupling control in railroads.
The accuracy of the prediction and, therefore, the control actions taken depends on the accuracy of the dynamic model used by the controller, requiring a balance between the complexity of the controller formulation and the computational load required. In this sense, there are two traditional approaches to deal with errors in the control model [9].
The first approach formulates a controller that does not consider the possible errors committed using a nominal MPC (NMPC). Subsequently, the behaviour of this controller under the existence of these errors is studied using a robustness analysis. If the behaviour is still acceptable, the errors can be ignored, and the nominal MPC will be considered adequate.
The second approach formulates an MPC controller that considers the possible errors made within its own formulation, i.e., synthesizing what is called a robust MPC (RMPC). This approach is typically used when an accuracy is required or when a dynamic disturbance or error has a large impact on the behaviour of the controller.
There are several works that use an NMPC to address the work at hand. In this way, the authors in [10] provided a proof of concept for the VCTS by introducing a specific operating mode within the ERTMS/ETCS standard specification and defining a coupling control algorithm accounting for the time-varying delays affecting the communication links. Likewise, the authors in [11] developed a distributed nominal MPC for high-speed trains, evaluated its stability, and derived sufficient feasibility and stability conditions for a platoon of up to two trains by designing the terminal controller and invariant set. Additionally, for high-speed trains, the authors in [12] proposed a control strategy focused on both the local and string stability under variant manoeuvres in high-speed scenarios using an analytical algorithm based on Pontryagin’s maximum principle. Similarly, the authors in [13,14] applied an NMPC in metro lines.
However, there are a few examples in the literature of RMPC being applied to the VCTS. For example, the authors in [15] implemented a robust event-triggered model predictive control based on the equations of longitudinal train dynamics and a communication switching topology characterized as a Markov chain. However, this study only focused on the communication problems with a constant-speed leader and, therefore, did not test the changing operating conditions as a function of the speed and track parameters. In addition, the authors in [16] proposed a robust gap controller based on sliding mode control with a nonlinear train model featuring uncertainties. However, as in the previous study, the uncertainties were limited to the consideration of a small Davis formula and track resistances. On the other hand, the authors in [17] presented consensus-based robust cooperative control schemes for both homogeneous and heterogeneous train platoons by using robust strictly negative–imaginary controllers considering the network topology to track a predefined motion reference. Recently, the authors in [18] developed an alternative way to manage the uncertainties using a tube-based MPC, but also expressed the need to incorporate uncertainties in the train dynamics and consider and study factors such as the weather conditions, positioning errors, and communication delays.
Finally, the authors in [19] formulated a nominal MPC, showing its application in metro lines. According to this study, VCTSs can be implemented through two different control architectures: centralized control and decentralized control. In the former, a single controller makes the trains cooperate to optimize the overall platoon strategy. In the latter, each train has its own individual controller, and, as a result, each train optimizes its own strategy according to the trajectory estimation of the preceding vehicle. The authors in [19] also expressed the need to improve the nominal MPC through uncertainties and the development of a robust MPC.
The main objective and contribution of this work is the development of a decentralized RMPC for virtual coupling in railways, considering the effects of adhesion loss and positioning errors. The research in [19] serves as a starting point for this work, from which the design of a nominal MPC is taken. Unlike this previous work, the implemented robust MPC considers the external disturbances with uncertainties that consider the previously mentioned positioning errors and a loss of the adhesion during braking. In this way, the proposed controller is compared with a nominal MPC in different simulations under the different applied disturbances. The results will be studied from an operational point of view, i.e., by analysing the distance between the trains and the overall behaviour of a two-train VCTS.
Ultimately, the objective of this work is to improve the line capacity under the condition of virtual coupling. In this sense, we consider that the VCTS fulfils its function and that all the components of the VCTS work as connected when all of them arrive and stop at the same time at the same station with a minimum delay time between them. In this way, the convoy operationally behaves as a single train since, from the users’ point of view, all the VCTSs’ components arrive at the station at the same time and behave as if they were a single complete train. Although when the convoy is running the distance between the components increases due to the safety conditions which have been set, we consider that the convoy preserves its integrity, operating as a single train, when the communication between trains is maintained and the above-mentioned condition of all the components arriving at the station at the same time is respected. The figures included in the simulations section illustrate this phenomenon.
2. System Dynamics
The model defining the train motion of this work is based on the principles of longitudinal train dynamics (LTD). Then, the train is considered as a point mass with one degree of freedom, where the traction/brake system, rolling resistances, air intake, aerodynamic drag, and slope and curve resistances are applied. The dynamic equations considered are as follows:
where s (m) and v (m/s) denote the position and train speed, u (N) is the controlled driving/braking force, F (N) is the integrated driving/braking force, is the resistance force due to the track, τ is the inertial lag of the longitudinal dynamics, M (kg) is the train’s mass, a (N) is a term that includes the rolling resistance plus the bearing resistance, b (Ns/m) is a coefficient related to the air intake, c (Ns2/m2) is the aerodynamic coefficient, and (m/s2) represents the uncertainty in the acceleration contemplated in the robust control.
The resistance force includes two components, and , which are defined as follows:
where is the component of the gravity force due to the slope of the track, the slope (m⁄m) is the slope of the track, is the acceleration of gravity, is the resistance in the curve, and is the radius of the curve.
The values of the slope and R depend on the line profile and the position s of the train on the line and are, therefore, known at each time. Figure 1 shows as an example of the value of the slope and R used in this work.
Starting from the dynamic equations, a linearized set of equations at the operating point will be used to handle uncertainties in the RMPC optimization algorithm [20].
Thus, the vector of states X and outputs Y, that will be used for a linearization, are defined as follows:
where (m/s2) is the maximum possible deceleration of the controlled train.
By linearizing Equations (1)–(3), these equations are transformed into (9)–(11), thereby formulating the linearized dynamics as the first-order Taylor polynomial of the nonlinear model as follows:
and
where (m/s) and (N) corresponds to the state and the control force at the operating point, respectively; , , and are the state vector , the decision vector , and the output vector at the operating point, respectively; and is Equations (1)–(3) evaluated at the operating point.
In the above Equations (1)–(11), the states ; the controlled driving/braking force ; and the uncertainty are time dependent. Therefore, and are also time dependent. The matrices are constant, but and depend on the operating point at which the equations are linearised. In addition, the values of and are known at each time and dependent on the line profile and train location on the line, i.e., the train position , as shown in Figure 1. The remaining variables in (1)–(11) are constant parameters that depend on the train’s characteristics.
3. MPC Controller Design
3.1. Control Architecture
We consider a convoy (Figure 2) composed of a leader and n followers, all of them with length L. The superscript indicates the train, with 0 for the leader and i, where i = 1, …, n, for the followers.
We consider a decentralized VCTS control problem, with independent controllers for the leader and each follower. Figure 2 represents this control architecture. In this figure, index represents the leader; therefore, represents the current measured states for the leader; represents the leader’s speed; is the leader’s current position; and represents the vector containing the driving/braking force for the leader. represents the current measured states for the follower i in the platoon, which is virtually coupled to its previous train; and represent, respectively, the speed and current position of the follower i; and represents the driving/braking force for the follower i. As seen in Section 2 for the linearized control model, is the value of at the operating point.
The end-front distance between two consecutive trains at any time is calculated using (12), where is the train length:
Furthermore, represents the predicted states for the preceding train (i − 1) calculated by the follower’s Preceding Train Predictor (PTP) module, which will be described in Section 3.5. For the followers, we design an MPC robust controller that ensures a safety and control efficiency while considering the parameter uncertainties.
With the proposed control strategy, the leader will track a given speed curve, and the followers will guarantee a safe minimum distance between trains and the string stability of the VCTS with parameter uncertainties. Consequently, as seen in Figure 2, the follower needs information about the preceding train to ensure its safety. This information ( and ) is used by the follower’s controller for its calculations because the predicted states for the preceding train are calculated using the PTP embedded in each follower based on the information received from the preceding train.
3.2. Leader Controller
When using a decentralized control architecture, the leader can operate under any control and signalling method. Therefore, the leader can use any conventional control method based on Automatic Train Control, Communication-Based Train Control, or the ETCS.
For simplicity, for the leading train, we use a driving mechanism based on an Automatic Train Control system that tracks a given speed curve. This speed curve is obtained using a Dynamic Programming (DP) approach (Figure 3).
Because the role of the leader is to set the VCTSs’ movement policy, we use the DP approach to precompute the reference behaviour of the leader. Then, the result of the DP establishes the general policy followed by the train’s convoy. This general control policy can have different objective functions such as minimizing the energy consumption or maximizing the convoy speed. In this paper, we use the second policy with an optimal speed profile that finds the maximum velocity permitted by the speed limitations imposed by the line operation, thereby satisfying the speed constraints at all times.
Figure 3 shows the speed profile obtained for the leader, corresponding to the convoy policy of the maximum possible velocity allowed by the speed limitations established for the line’s operation. In this figure, the curve labelled “Max speed” represents the maximum limitations set in the line design. In this figure, it can be seen where the stations are located and that the speed at these stations is limited to 12.5 m/s (45 km/h). The other speed limitations depend on the design of the railway line.
On the other hand, the curve labelled “DP speed” represents the maximum speed at which it is possible to run without exceeding at any time the speed allowed on the line and represents the result of the DP calculation. On this curve, the stopping point of the leading train at the end of each station can also be seen. A detailed explanation of the implementation of this DP approach can be found in [19].
3.3. Follower Controller
For the controller design, a model predictive control (MPC) approach is used. The MPC optimizes over a finite time horizon but implements only the current time window of the finite horizon optimization problem solution.
For the MPC formulation, a prediction horizon with origin at time t is considered. The notation represents the state vector at time t + k predicted at time t, obtained from the current state , while denotes the unknown input variables (or inputs) to be optimized.
The RMPC for virtual coupling is obtained by introducing two uncertain variables.
The first uncertain variable is (m/s2) and is added to the acceleration equation of the dynamic model, as seen in (9).
The second uncertain variable (m) is considered in the virtual coupling specific constraints and the follower cost functions, and it is used to define the uncertainty in the positioning, as will be seen later.
As a result of introducing uncertain variables, the optimization problem for the follower is formulated as the min–max problem given in (13):
The controller’s objective for each follower is to try to keep the trains running as close together as possible by minimising the difference in the distance between trains and a desired separation while maintaining safe conditions. Therefore, we can formulate the following optimization problem:
subject to:
Superscript i is related to the corresponding follower.
In the cost function (14), is a dimensionless coefficient representing the weight that penalizes the deviation from the desired distance , and is the predicted speed of the preceding train, which is pre-calculated according to the PTP module that will be described later in Section 3.5.
The equations in (15) represent the train dynamics updates for the model obtained in (9)–(11) according to the integration time step. The initial state is set in (16).
Equation (17) corresponds to the velocity constraint (Max speed in Figure 3).
Equation (18) represents the jerk constraint established for .
Equations (19) and (20) represent the input constraints, including the maximum driving/braking force and the maximum power on traction/braking, with representing the estimated component of vector at instant k calculated at time according to (11).
Equation (21) represents a terminal constraint. The upper speed limit is obtained by pre-calculating the maximum speed at which the train can run while respecting the speed limits set for the line (DP speed in Figure 3). This terminal constraint is used because the train must always respect the speed limit, and there are areas above the blue line in Figure 3 where if the train runs under these conditions, it may not respect the speed limits at future times.
Equation (22) represents the safety condition, stating that the distance between the trains must be greater than at any time.
Equations (23) and (24) are the terminal constraints. These constraints are imposed to ensure that the controller is recursively feasible and safe (see Section 3.6). These equations guarantee that the follower can come to a complete stop without collision by applying a maximum service deceleration when the preceding train performs emergency braking with the maximum deceleration . Note that the terminal constraint (24) functions as an operational constraint, while the terminal constraint (23) works as a safety constraint. The safe train-to-train distance is used to define a constraint to avoid a collision if the leader brakes. The distance is used in the cost function as a target to maintain a safe desired driving distance greater than the minimum safe distance . Finally, constraint (25) bounds the acceleration uncertainty and (26) bounds the second uncertain variable (m), which addresses the distance error from the preceding train. Both constraints are handled through the traditional method of robust optimization based on the duality theory (for more details, see [20]).
The first uncertain variable (m/s2) is added to the dynamic model’s acceleration equation, as seen in (2). By means of this uncertainty, we can consider different phenomena. For instance, using this variable, an additional resistance due to the start resistance can be taken into account, thus solving the lack of accuracy of the Davis formula at speeds below 3 m/s. In addition, this variable can counteract the additional resistance introduced by the tunnel factor and the longitudinal component of lateral wind’s impact. Moreover, this variable can avoid the risky situations produced by perturbation, such as a loss of adhesion during braking. This variable also enables the correction of the modelling errors produced by incorrect estimations of the Davis coefficients. The specific values that limit this uncertain variable will be discussed in Section 4.1.
Finally, the second uncertain variable (m) addresses the positioning error that can influence the estimation of the follower’s distance from the preceding train. The specific values that limit this uncertain variable will be discussed in Section 4.2.
3.4. Control Loop
For each train, the resulting optimal states and inputs of (13)–(26) are denoted as follows:
Since constraints (16), (17), and (21) are space-dependent, to avoid numerical problems and reduce the computational burden, they can be estimated a priori by :
where is the input predicted from (27) at the previous time step t − 1 with .
To close the loop, the first input is applied to system (9)–(11) during the time interval :
At the next time step t + 1, a new optimal problem in the form of (13)–(26) based on a new state measurement will be solved over a shifted horizon.
3.5. Preceding Train Predictor
To establish the control loop, it is necessary to estimate a prediction of the preceding train’s movement (train i − 1). This task is performed by the module, called the Preceding Train Predictor (PTP), which is described in this section.
Since both vehicles are equipped with a communication module, and intervehicular communication is available, the prediction task is executed by the follower based on the information received from the preceding train. For the prediction, the preceding train communicates to the follower its position , speed , and the driving/braking force . In this way, the distance between trains is determined by the difference in the positions of the two trains. On the other hand, and as a redundancy, the follower has a sensor that can measure the distance to the front train. Therefore, for the estimation of the position of the preceding train, the worst case is considered, which corresponds to the lower of the two calculated values above.
Then, the MPC assumes that the preceding train’s information can be predicted over a short horizon . The corresponding expressions for the prediction of and are
where
Here, and are the measured position and velocity of the leader at t, respectively; is the force at time t predicted from (27) at the previous time step t − 1 initialized with ; and is the input predicted from (27) at the previous time step t − 1, with .
In (34), is calculated from the expressions of (9)–(11), particularly (10), and the disturbance is considered to be the lower limit , which is the most unfavourable situation corresponding to the highest risk of a collision between the two consecutive trains.
3.6. Min-Max Recursive Feasibility
To ensure the recursive feasibility of the RMPC, we define set as the robust control invariant set. According to [21], set is said to be a robust control invariant set for the system (9)–(11) subject to constraints (13)–(25) if
where is the set of the valid decision variable values given by (18)–(20), and is the set that bounds the uncertain variables, i.e., the set given by (25) and (26).
As in [22], set can be introduced by the constraints (21)–(23), which define a robust control invariant set because (21) ensures a proper decision of the train’s controller according to the track profile, while (22)–(24) ensure a safe reaction to the emergency braking of the preceding train. In other words, these constraints ensure that there exists an output value for the control variables that satisfies (37).
4. Simulations
This section compares the results obtained with the nominal controller developed in [19] with those obtained with the robust controller developed in this paper. To test the robust MPC for the VCTS, two simulation cases were used for a metro line. The first simulation case analyses the influence of an uncertainty in acceleration , while the second one studies the uncertainty in the train’s positioning .
The parameters considered for the rolling stock can be found in Table A1 of Appendix A. The profile of the selected line can be found in Figure 1, and its corresponding speed profile can be found in Figure 3.
The simulations were performed by comparing the results between an NMPC (without uncertainties) and an RMPC, where uncertainties are considered.
Simulations were performed in MATLAB and Yalmip [23] on a computer with an i7-1165G7 processor at 2.8 GHz and with 8 GB of RAM. For the different simulations, we determined that the average CPU computation time of the solver was 0.17 s for the RMPC. Moreover, the total CPU computation time was found to be 302 s, which is lower than the total simulated time (345 s). Therefore, the RMPC presents promising results for a hardware implementation that needs to be solved in real time.
4.1. Simulation 1: Uncertainty in Acceleration
At the end of Section 3.3, we introduced what the first uncertain variable (m/s2) can represent. Now, from a practical point of view in the train operation, we bound the values of the acceleration uncertainty (25) according to Section 3.3.
The start resistance of a train on a track with a null slope is 50 N/t, i.e., 0.05 m/s2. Since this resistance is applied against the movement (negative), −0.05 m/s2 is established as the lower limit . Even though this value is lower because the Davis formula (2) is still applied in our controller, it allows for the simultaneous consideration of additional small resistances. For instance, the maximum errors in the estimation of the Davis coefficients for passenger trains are small (below 0.01 m/s2 for this train) and would be equally compensated by the controller thanks to this setting. Therefore, this value corrects the modelling errors introduced by the Davis formula: both above 3 m/s (Davis coefficients) and lower speeds (start resistance and Davis coefficients).
Additional resistances under 0.05 m/s2 will also be correctly compensated at speeds above 3 m/s, which is the case for an external perturbation, such as the resistance introduced by either the tunnel factor or the longitudinal component of a lateral wind’s impact.
Conversely, is established to counteract an extreme loss of adhesion of 10% during braking. If a friction factor of 0.1 is considered, this loss will produce a reduction in the deceleration of 0.1 m/s2. This reduction works as an additional traction force during braking. Therefore, 0.15 m/s2 is established as the upper bound as a conservative approximation.
Among all the external perturbations, only the extreme perturbation of a 10% loss of adhesion will be studied in the simulation cases of this paper, but these results can be extrapolated to any of the acceleration uncertainty effects mentioned above.
In Simulation 1, the behaviour of the uncertain variable has been assessed and corresponds to a disturbance involving a loss of adhesion at the entrance of the third station. This situation is extremely unfavourable since the disturbance was applied only to the follower, and the train in front was considered to continue braking without any loss of adhesion.
Figure 4, Figure 5 and Figure 6 represent the behaviour of the convoy when the follower experiences a 10% loss of adhesion during braking.
The upper plot in Figure 4 represents the time–velocity curve and shows the speed of the leader, which is the same for both the nominal and robust controllers. Moreover, in acceleration (i.e., the increasing parts of the curves), the leader has a slightly higher velocity than the followers, thus increasing the distance between the trains. However, in braking (i.e., the decreasing part of the curve), when the velocity of the leader decreases, the follower becomes closer as it has a higher speed, always maintaining the safe distance imposed by the constraints. It is also possible to observe the stop at the stations.
In Figure 4, it can also be seen how the integrity of the convoy is maintained, as the two trains stop at the station at almost the same time. This effect can be seen in the time–velocity plot, where both trains in the convoy stop at the stations at almost the same time. The plot below shows the distance between the leader and the follower. Here, the most critical moment occurs at the entrance of the stations, where the leader stops, and the follower must also stop maintaining a safe distance.
The curves labelled “no adhesion loss” include the distance between the leader and the follower for the NMPC and RMPC when there is no disturbance, i.e., no adhesion loss. These curves show a very similar behaviour in both cases.
If the behaviour of the robust controller is compared with that of the nominal controller without disturbances, it can always be observed that the distance between two consecutive trains is always larger in the case of the robust controller. This result is logical since the controller contemplates the presence of uncertainty in its own design. In this case, the minimum distance between the trains is obtained at the station entrance, when the leader has stopped. It can also be seen that in the NMPC, this distance is 5 m, while the RMPC is more conservative and maintains a distance of approximately 8 m.
However, in the case of a loss of adhesion, differences are observed. In the simulation, a 10% loss of adhesion is considered in the entrance area of the third station. In this case, while the RMPC can maintain a minimum distance of 8 m between the trains at the entrance to the station, a distance of 0.5 m is obtained with the NMPC. This situation seriously compromises safety because a collision is about to occur, and the safety conditions for which the nominal control was designed are not respected.
Figure 5 represents the speed and distance between the trains versus the distance travelled. How and when the trains stop at the station is accurately visualized in this figure. It can also be seen that the front train stops at the end of the station, and the rear train stops somewhat further back at the desired distance. Additionally, Figure 6 represents the driving/force obtained as a controlled variable.
4.2. Simulation 2: Uncertainty in Positioning Error
At the end of Section 3.3, we introduced the second uncertain variable (m), which represents the positioning error that can influence the estimation of the follower’s distance from the preceding train. Now, from a practical point of view in the train operation, we bound the values of the positional uncertainty (26) according to Section 3.3.
The positioning error is produced by two components. To begin with, ATO (Automatic Train Operation) controllers have a specified maximum positioning error of ±0.5 m [24]. Additionally, a velocity sensor usually has a maximum error of 1% of the real speed. If a metro line with a 110 km/h maximum speed is considered, the velocity error will be ±0.3 m/s.
Hence, the maximum distance error produced by the follower predictor appears at the end of the prediction horizon (38), where the error is more critical in the constraints. In (38), this result is multiplied by two to consider an extreme situation in which the preceding train is nearer, and the follower is farther. Since this distance error implies that the preceding train might be nearer, this value is considered in the lower bound. Therefore, −3.5 m is estimated as the lower bound of as a conservative approximation of (38). Nevertheless, 0 m is set as the upper bound in order to avoid a distance reduction above virtual coupling conditions, which could end in a collision between the trains:
This simulation focuses on testing the uncertain variable , which is applied to test the performance of the system when there is noise in the positioning information used by the follower. In this simulation, two sinusoidal signals are introduced in the positioning and speed information of the leading train ( and ). These signals have a period of 90 s and amplitudes of 0.8 m and 0.6 m/s, respectively. In addition, a random noise is superimposed on the previous wave. This noise is uniformly distributed and has an amplitude of 0.001 in each signal (m and m/s, respectively).
The simulation was performed in both the nominal MPC and robust MPC. The results presented in Figure 5 under the label “errors” correspond to the simulation with disturbances, while the results without the label “errors” correspond to the simulation without disturbances.
Figure 7 shows that an error in the estimation of the position of the preceding train, e.g., due to a failure in the odometry or noise in the position information of the preceding train, can cause a collision with the NMPC (green dashed line in Figure 7). This collision can occur at the end of braking from high speeds, i.e., near stations.
The results of the simulations show that in the case of the NMPC, the minimum distance reached with this disturbance was found to be 0.8 m near the 300 s instant of the simulation time.
In contrast, in the case of the RMPC, these risk situations are avoided (the solid magenta line in Figure 7). Additionally, Figure 8 represents the driving/force obtained as a controlled variable. In this simulation, the RMPC was found to achieve a minimum safe distance of 5.1 m, whereas the NMPC presented 0.8 m in the same situation.
The most important result of this simulation is that the nominal MPC control system tends to lead to risky situations when the environment in which it operates is not a nominal one. This statement is corroborated in Figure 7, which illustrates that, at the station entrance, trains approach up to an absolute distance of 0.8 m, which is an undesirably risky situation.
However, the robust controller results in a minimum distance of 5.1 m compared to 7.5 m for an operation without disturbances. Nevertheless, despite the unfavourable situation, a distance greater than the specified odometry error (3.5 m) is maintained at 48.6%, thereby ensuring a safe traffic flow. Furthermore, with respect to the NMPC, the minimum distance achieved by the RMPC in this unfavourable situation is almost six times greater. In other words, the NMPC reduces the distance in this situation by 83% due to its lack of robustness, which leads to risky situations.
5. Conclusions
In this paper, a decentralized RMPC for the VCTS in railroads was developed. Two types of uncertainties were included in the controller. We compared the proposed RMPC controller with an NMPC in different simulations that consider the positioning errors and a loss of adhesion during braking.
The result is a more conservative controller than a nominal controller, which is nevertheless capable of guaranteeing collision safety in situations which the nominal controller is not able to overcome, such as under a 10% loss of adhesion during braking and in the case of errors in the position information of the front train.
However, it is possible to improve the estimation of the virtual coupling predictor. In future research, fewer conservative solutions could be proposed based on the leader’s braking estimates calculated from the last known information instead of using only the last known information directly in the controller.
On the other hand, the decentralized control architecture is acceptable as an advanced railway signalling system that improves the current train operations but not from the perspective of the VCTSs’ concept, since in the proposed solution, the leader sets the VCTSs’ movement policy but is not affected by the behaviour of the followers. Therefore, in the near future, we will use these results to design a robust centralized MPC for the VCTSs’ strategy where all the elements of the VCTS can interact.
Author Contributions
Conceptualization, J.F., M.A.V.-S. and J.d.D.S.; methodology, J.F. and M.A.V.-S.; software, J.F. and M.A.V.-S.; investigation, J.F., M.A.V.-S. and J.d.D.S.; writing—original draft preparation, J.F. and M.A.V.-S.; writing—review and editing, J.F. and M.A.V.-S.; supervision, J.F. All authors have read and agreed to the published version of the manuscript.
Funding
This work was supported in part by the H2020 ECSEL EU Project Intelligent Secure Trustable Things—InSecTT (www.insectt.eu, (accessed on 7 December 2022)) receiving funding from the ECSEL Joint Undertaking (JU) under grant agreement No 876038, and in part by the Spanish Science and Innovation Ministry—State Research Agency under Grant PCI2020-112126/AEI/10.13039/501100011033. The JU receives support from the European Union’s Horizon 2020 research and innovation programme and Austria, Sweden, Spain, Italy, France, Portugal, Ireland, Finland, Slovenia, Poland, Netherlands, Turkey. The document reflects only the author’s view and Commission is not responsible for any use that may be made of the information it contains.
Institutional Review Board Statement
Not applicable.
Informed Consent Statement
Not applicable.
Data Availability Statement
Not applicable.
Conflicts of Interest
The authors declare no conflict of interest.
Appendix A

Table A1.
Parameters used in the simulation.
| Parameter | Value | Parameter | Value |
|---|---|---|---|
| M (kg) | 99.972 × 10³ | (s) | 0.2 |
| L (m) | 54.9 | 20 | |
| a (N) | 1216.13 | (m/s) | 30.6 |
| b (N/(m/s) | 117.39 | (m/s3) | 0.98 |
| c (N/(m/s)2) | 2.97 | (m) | 10 |
| (s) | 0.7 | (m) | 5 |
| (N) | 150.0 × 10³ | (m/s2) | −0.05 |
| (W) | 1.584 × 10⁶ | (m/s2) | 0.15 |
| (m/s2) | 1.25 | (m) | −3.5 |
| (m/s2) | 1 | (m) | 0 |
References
- ERRAC. Rail 2050 Vision. 2017. Available online: https://errac.org/wp-content/uploads/2019/03/122017_ERRAC-RAIL-2050.pdf (accessed on 30 September 2022).
- Mitchell, I.; Goddard, E.; Montes, F.; Stanley, P.; Muttram, R.; Coenraad, W.; Poré, J.; Andrews, S.; Lochman, L. ERTMS Level 4, Train Convoys or Virtual Coupling. IRSE News. 2016. Available online: https://webinfo.uk/webdocssl/irse-kbase/ref-viewer.aspx?Refno=1882928268&document=ITC%20Report%2039%20Train%20convoys%20and%20virtual%20coupling.pdf (accessed on 7 October 2022).
- Quaglietta, E.; Wang, M.; Goverde, R. A multi-state train-following model for the analysis of virtual coupling railway operations. J. Rail Transp. Plan. Manag. 2020, 15, 100195. [Google Scholar] [CrossRef]
- X2Rail-3 Grant agreement ID: 826141. Advanced Signalling, Automation and Communication System (IP2 and IP5)—Prototyping the future by means of capacity increase, autonomy and flexible communication. Cordis database. Available online: https://cordis.europa.eu/project/id/826141 (accessed on 7 October 2022).
- Schumann, T. Increase of capacity on the shinkansen high-speed line using virtual coupling. Int. J. Transp. Dev. Integr. 2017, 1, 666–676. [Google Scholar] [CrossRef]
- Zheng, Y.; Li, S.E.; Li, K.; Borrelli, F.; Hedrick, J.K. Distributed Model Predictive Control for Heterogeneous Vehicle Platoons Under Unidirectional Topologies. IEEE Trans. Control. Syst. Technol. 2016, 25, 899–910. [Google Scholar] [CrossRef] [Green Version]
- Guanetti, J.; Kim, Y.; Borrelli, F. Control of connected and automated vehicles: State of the art and future challenges. Annu. Rev. Control. 2018, 45, 18–40. [Google Scholar] [CrossRef] [Green Version]
- Lan, J.; Zhao, D. Min-Max Model Predictive Vehicle Platooning With Communication Delay. IEEE Trans. Veh. Technol. 2020, 69, 12570–12584. [Google Scholar] [CrossRef]
- Bemporad, A.; Morari, M. Robust model predictive control: A survey. In Robustness in Identification and Control; Springer: London, UK, 2007; pp. 207–226. [Google Scholar] [CrossRef]
- Di Meo, C.; Di Vaio, M.; Flammini, F.; Nardone, R.; Santini, S.; Vittorini, V. ERTMS/ETCS Virtual Coupling: Proof of Concept and Numerical Analysis. IEEE Trans. Intell. Transp. Syst. 2019, 21, 2545–2556. [Google Scholar] [CrossRef]
- Liu, Y.; Liu, R.; Wei, C.; Xun, J.; Tang, T. Distributed Model Predictive Control Strategy for Constrained High-Speed Virtually Coupled Train Set. IEEE Trans. Veh. Technol. 2021, 71, 171–183. [Google Scholar] [CrossRef]
- Liu, Y.; Zhou, Y.; Su, S.; Xun, J.; Tang, T. An analytical optimal control approach for virtually coupled high-speed trains with local and string stability. Transp. Res. Part C Emerg. Technol. 2021, 125, 102886. [Google Scholar] [CrossRef]
- Luo, X.; Liu, H.; Zhang, L.; Xun, J. A Model Predictive Control Based Inter-Station Driving Strategy for Virtual Coupling Trains in Railway System. In Proceedings of the 2021 IEEE International Intelligent Transportation Systems Conference (ITSC), Indianapolis, IN, USA, 19–22 September 2021; pp. 3927–3932. [Google Scholar] [CrossRef]
- Luo, X.; Tang, T.; Liu, H.; Zhang, L.; Li, K. An Adaptive Model Predictive Control System for Virtual Coupling in Metros. Actuators 2021, 10, 178. [Google Scholar] [CrossRef]
- Zhao, H.; Dai, X.; Zhang, Q.; Ding, J. Robust Event-Triggered Model Predictive Control for Multiple High-Speed Trains With Switching Topologies. IEEE Trans. Veh. Technol. 2020, 69, 4700–4710. [Google Scholar] [CrossRef]
- Park, J.; Lee, B.-H.; Eun, Y. Virtual Coupling of Railway Vehicles: Gap Reference for Merge and Separation, Robust Control, and Position Measurement. IEEE Trans. Intell. Transp. Syst. 2020, 23, 1085–1096. [Google Scholar] [CrossRef]
- Li, C.; Wang, J.; Shan, J.; Lanzon, A.; Petersen, I.R. Robust Cooperative Control of Networked Train Platoons: A Negative-Imaginary Systems’ Perspective. IEEE Trans. Control. Netw. Syst. 2021, 8, 1743–1753. [Google Scholar] [CrossRef]
- Liu, Y.; Zhou, Y.; Su, S.; Xun, J.; Tang, T. Control strategy for stable formation of high-speed virtually coupled trains with disturbances and delays. Comput. Civ. Infrastruct. Eng. 2022, 1–19. [Google Scholar] [CrossRef]
- Felez, J.; Kim, Y.; Borrelli, F. A Model Predictive Control Approach for Virtual Coupling in Railways. IEEE Trans. Intell. Transp. Syst. 2019, 20, 2728–2739. [Google Scholar] [CrossRef]
- Löfberg, J. Automatic robust convex programming. Optim. Methods Softw. 2012, 27, 115–129. [Google Scholar] [CrossRef] [Green Version]
- Borrelli, F.; Bemporad, A.; Morari, M. Predictive Control for Linear and Hybrid Systems, 1st ed.; Cambridge University Press: Cambridge, UK, 2017. [Google Scholar] [CrossRef] [Green Version]
- Turri, V.; Kim, Y.; Guanetti, J.; Johansson, K.H.; Borrelli, F. A model predictive controller for non-cooperative eco-platooning. In Proceedings of the 2017 American Control Conference (ACC), Seattle, WA, USA, 24–26 May 2017; pp. 2309–2314. [Google Scholar] [CrossRef]
- Löfberg, J. YALMIP: A toolbox for modeling and optimization in MATLAB. In Proceedings of the CACSD Conference, New Orleans, LA, USA, 2–4 September 2004; pp. 284–289. [Google Scholar]
- IEEE. IEEE 1474.1-2004 Standard for Communications-Based Train Control (CBTC). Performance and Functional Requirements. 2004. Available online: https://standards.ieee.org/ieee/1474.1/3552/ (accessed on 7 October 2022).
Figure 1.
Slope and radius considered in the simulation scenario.

Figure 2.
Control architecture.
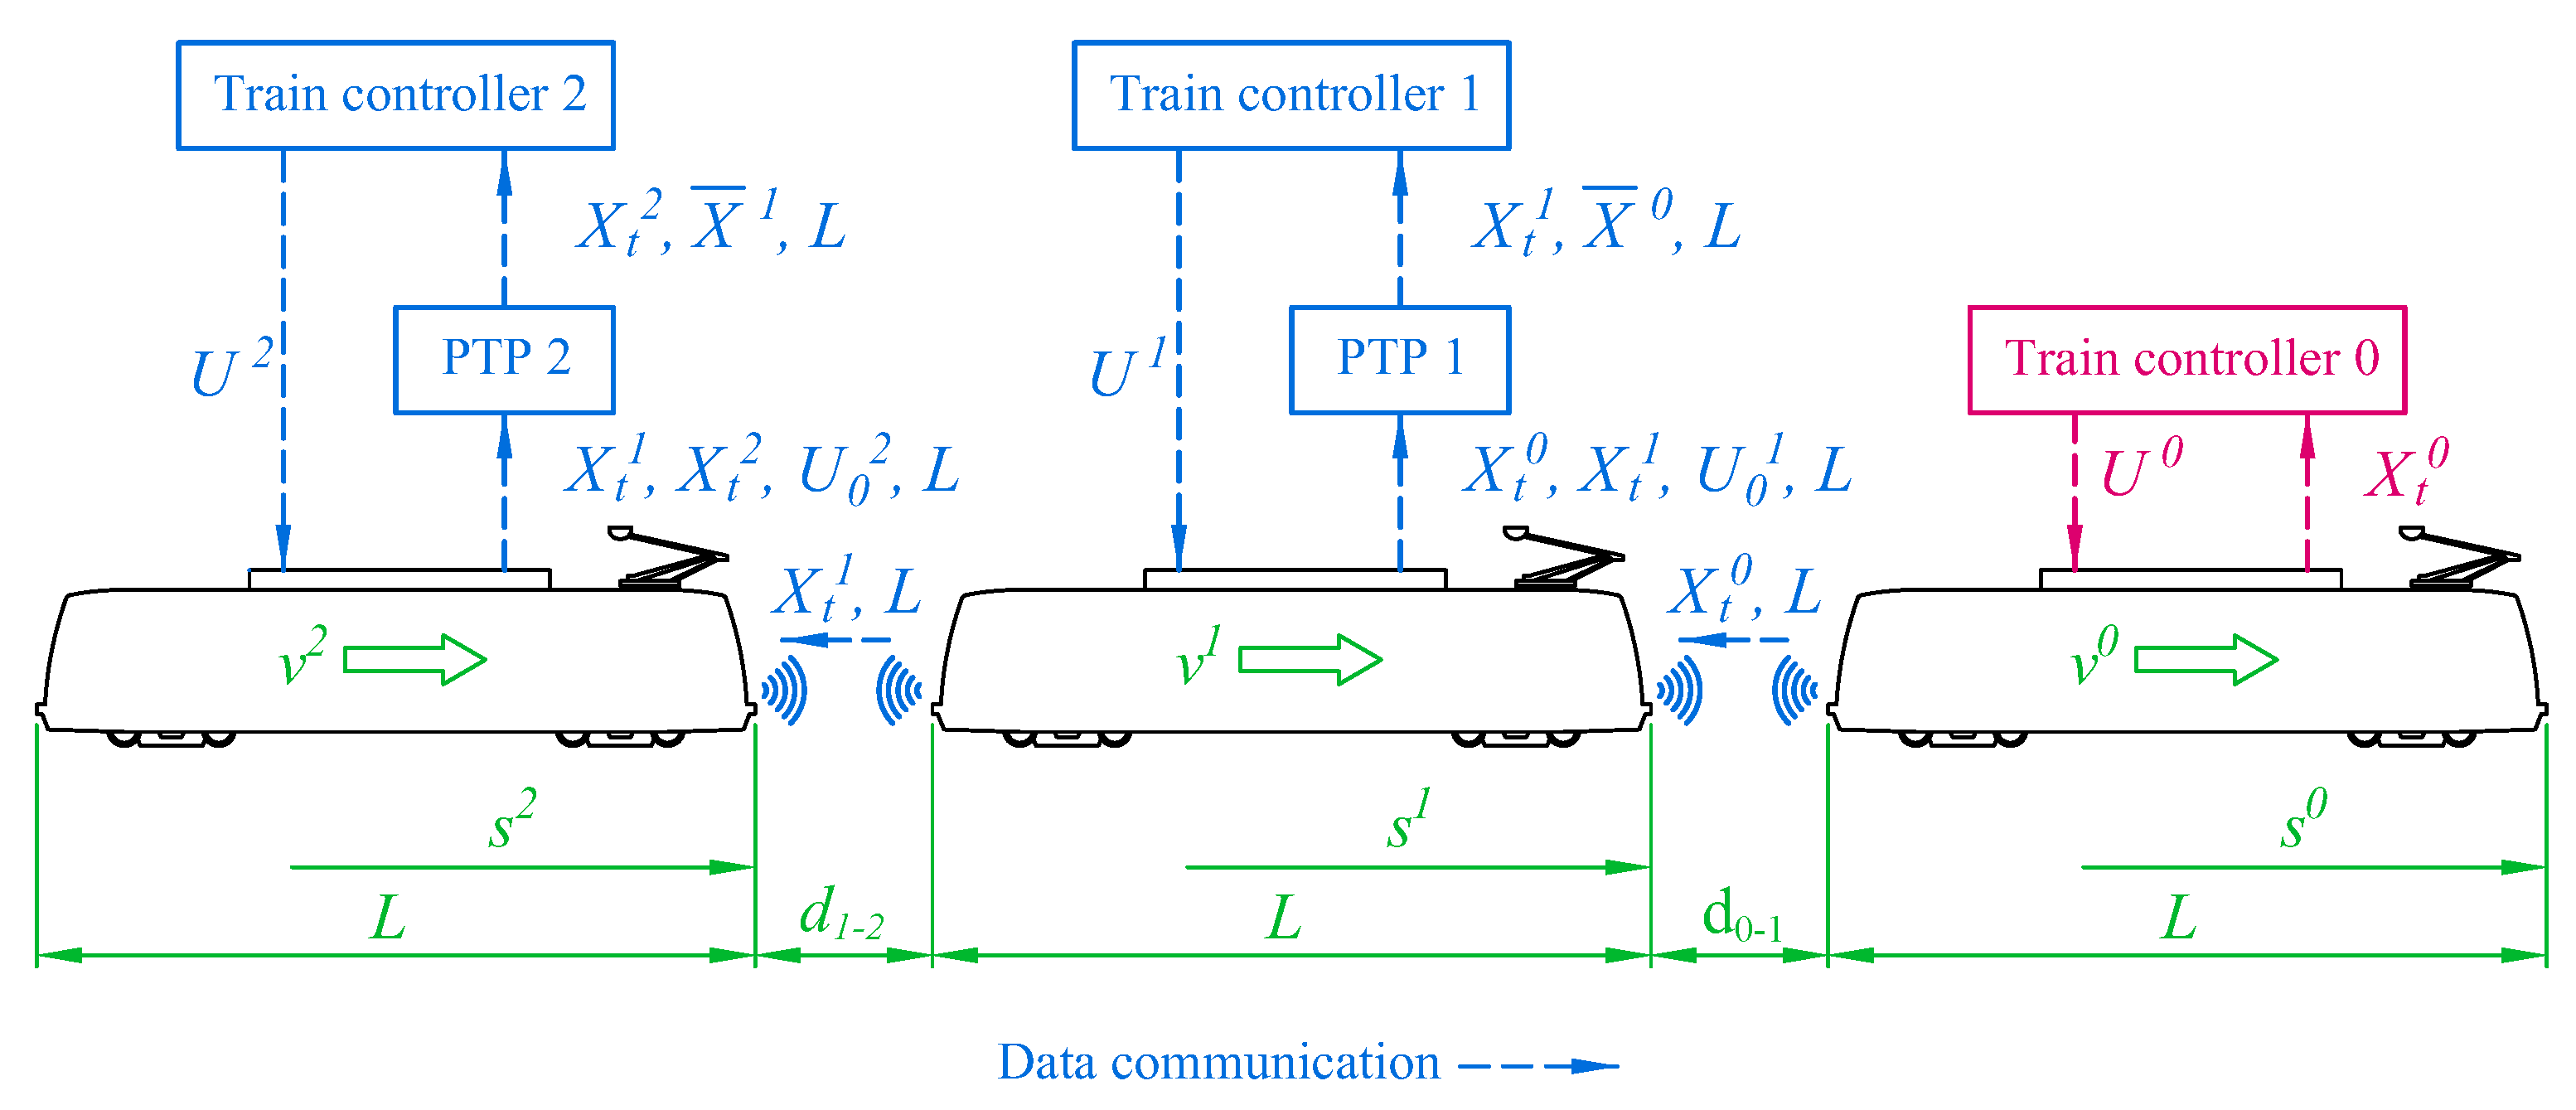
Figure 3.
Maximum driving speed in compliance with speed limits.
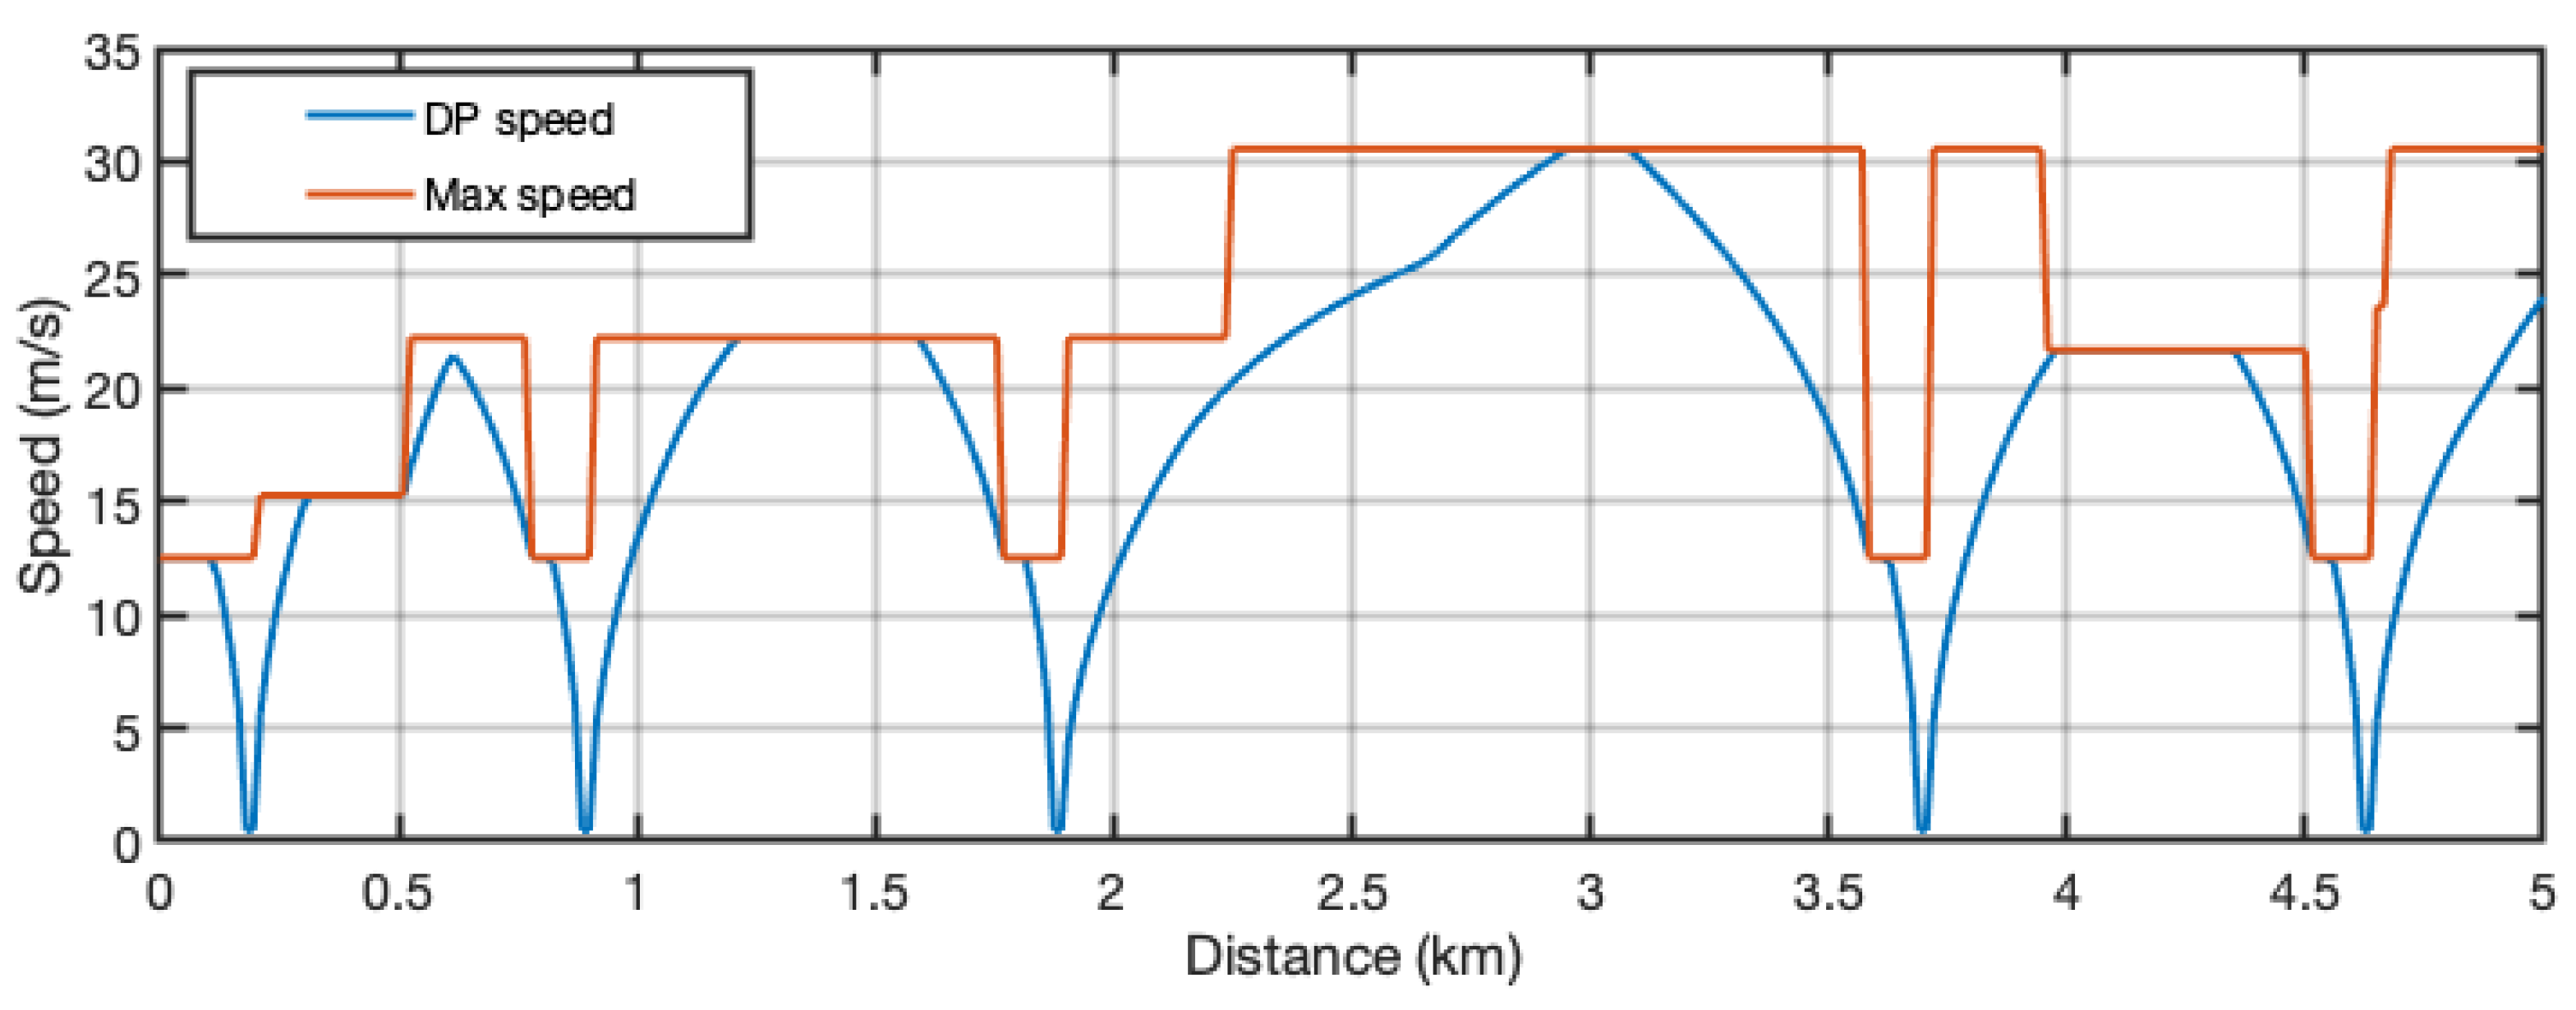
Figure 4.
Results of simulation 1: 10% adhesion loss. Variables versus time.

Figure 5.
Results of simulation 1: 10% adhesion loss. Variables versus distance travelled.
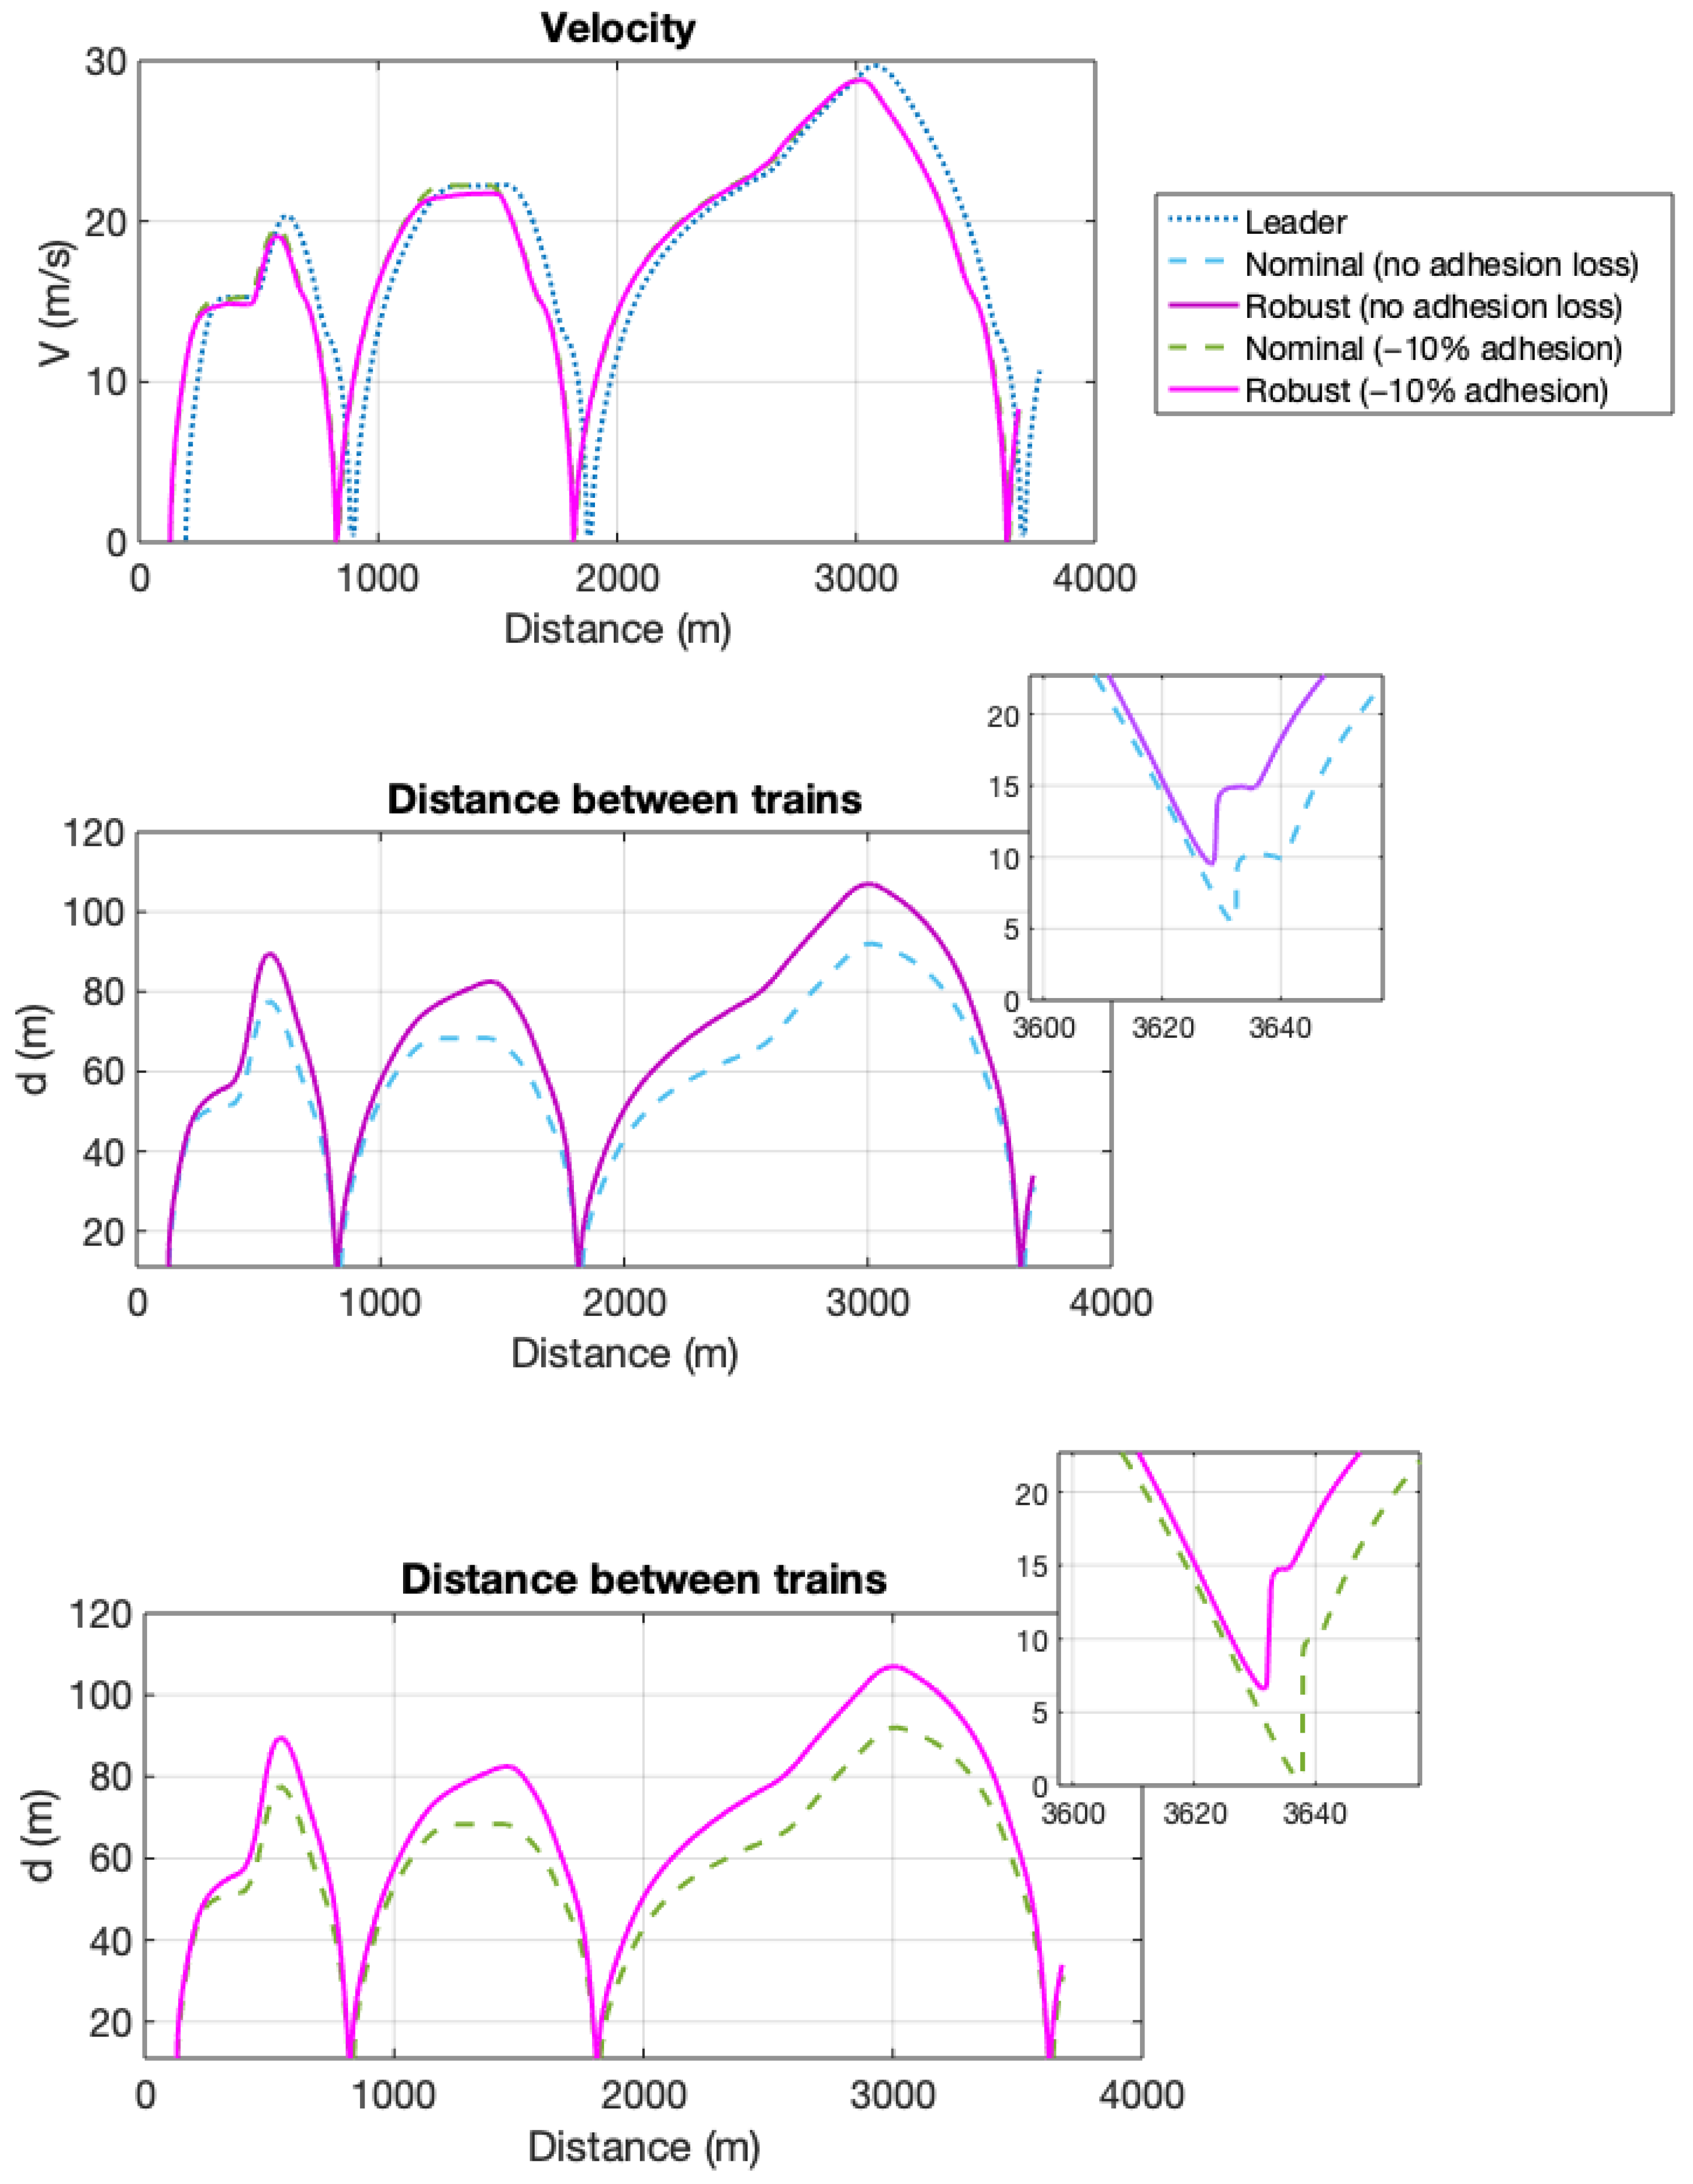
Figure 6.
Results of simulation 1: 10% adhesion loss. Force vs. time.

Figure 7.
Simulation results 2: Errors in the preceding train information.

Figure 8.
Results of simulation 2: errors in the preceding train information. Force vs. time.

Publisher’s Note: MDPI stays neutral with regard to jurisdictional claims in published maps and institutional affiliations. |
© 2022 by the authors. Licensee MDPI, Basel, Switzerland. This article is an open access article distributed under the terms and conditions of the Creative Commons Attribution (CC BY) license (https://creativecommons.org/licenses/by/4.0/).
Share and Cite
MDPI and ACS Style
Felez, J.; Vaquero-Serrano, M.A.; de Dios Sanz, J. A Robust Model Predictive Control for Virtual Coupling in Train Sets. Actuators 2022, 11, 372. https://doi.org/10.3390/act11120372
AMA Style
Felez J, Vaquero-Serrano MA, de Dios Sanz J. A Robust Model Predictive Control for Virtual Coupling in Train Sets. Actuators. 2022; 11(12):372. https://doi.org/10.3390/act11120372
Chicago/Turabian StyleFelez, Jesus, Miguel Angel Vaquero-Serrano, and Juan de Dios Sanz. 2022. "A Robust Model Predictive Control for Virtual Coupling in Train Sets" Actuators 11, no. 12: 372. https://doi.org/10.3390/act11120372
Note that from the first issue of 2016, this journal uses article numbers instead of page numbers. See further details here.