
Comparison between Density and Velocity Fields in Burst Modulation of a Dielectric-Barrier-Discharge Plasma Actuator

Department of Mechanical Systems Engineering, Tokyo University of Agriculture and Technology, Tokyo 184-8588, Japan
*
Author to whom correspondence should be addressed.
Actuators 2022, 11(11), 340; https://doi.org/10.3390/act11110340
Submission received: 2 October 2022
/
Revised: 12 November 2022
/
Accepted: 18 November 2022
/
Published: 21 November 2022
(This article belongs to the Special Issue Dielectric Barrier Discharge Plasma Actuator for Active Flow Control)
Abstract
:The flow field produced by a dielectric-barrier-discharge plasma actuator using burst modulation was experimentally investigated in quiescent air from two viewpoints: density and vorticity fields. A wide range of burst signal parameters were evaluated using particle-image velocimetry and background-oriented schlieren measurements. Four types of flow-field patterns were found: Type 1 was a wall jet, similar to continuous operation; Type 2 was a periodical, independent vortex moving along the wall surface; Types 3 and 4 demonstrated a feature wherein the periodic shedding of the vortex pair (primary and secondary vortices) occurred while moving over the surface. While Types 3 and 4 demonstrated a shared feature, they had different density and vorticity structures. The change of the flow-field pattern from Type 1 to Type 4 was triggered by a lower burst frequency and ratio, as well as a higher base frequency. In addition, the vorticity strength and density were strongly negatively correlated and depended on the rate of power consumption to generate one vortex.
1. Introduction
Dielectric-barrier-discharge plasma actuators (DBDPA) [1] are one of the most promising devices in aerodynamic flow-control. The actuator comprises two electrodes divided by a dielectric layer with high insulation; one electrode on the flow surface is exposed to the air, while the other on the opposite side is isolated by the dielectric layer. When a high alternating voltage is supplied between the high- and low-side electrodes (see Figure 1), a wall jet is induced due to the body force generated by the numerous collisions of neutral air molecules with plasma particles formed by the electrical discharge. The DBDPA follows the quick response of electrical signals with high frequency driving, it has a thin and simple construction with no rotating body such as a fan motor; hence, there are several ways to demonstrate flow-separation controllability, especially for aerodynamic control applications for airfoils [2,3]. On the other hand, DBDPA is exposed to adverse weather conditions in practical use and there is concern that the controllability performance may be significantly affected by weather conditions such as water droplets from rain, wind gusts, and freezing temperatures, which inhibit the discharge of DBDPAs. However, recent studies have suggested that these problems can be overcome. Lilley et al. [4] studied the effects of droplets on the surface of a DBDPA and showed that the wet actuator quickly recovers plasma glow and then gradually regains performance comparable to that of the dry actuator. Tanaka et al. [5] examined a DBDPA in a 300 KW, medium-sized, wind turbine and demonstrated, in a field test, that the efficiency of the DBDPA improved in high-wind speed environments. Tanaka et al. [6] demonstrated that high-durability DBDPAs with titanium electrodes and silicone rubber dielectric layers could control the snowfall flow and reduce the amount of accumulated snow.
Flow separation control technology using DBDPAs has potential industrial applications, such as the aerodynamic improvement of airfoils, turbines, and automotive vehicles. However, the wall jet generated by the DBDPA is normally up to 10 m/s; therefore, the capacity to enhance the induced jet is limited [3,7,8]. In contrast, the vortices and multidimensional complex flow can be generated by curving the electrode shape of the DBDPA or by combining it with burst modulation. These methods lead to an enhancement of the effectiveness of flow separation control. For example, Durscher and Roy [9] found that serpentine electrodes generated three-dimensional flow. Riherd and Roy [10] found that shaped electrodes could promote the transition from laminar to turbulent flow and increase unsteady kinetic energy compared to linear electrode shapes. Furthermore, Gupta and Roy [11] showed that a tortuous geometry, using localized low amplitude forcing, significantly reduced skin friction over the plate. Other electrode shapes have been proposed, such as annular electrodes and multi-electrodes [12], fan-shaped electrodes [13]. As shown in Figure 2, another approach is burst modulation in which a high alternating voltage applied between the two electrodes is cyclically turned on and off. Burst-mode actuation causes periodic vortex flow and provides significant energy savings and better flow-separation controllability than the continuous operation of a high alternating voltage [14]. Several studies on burst modulation have focused on controllability with varying burst frequencies (f+). It has been reported that high controllability of flow separation can be achieved by controlling a f+ equivalent to the instability frequency of the separated shear layer [15,16,17,18]. However, one of the burst parameters, the burst ratio (BR), has also been reported to have an effective influence on the controllability of flow separation. The optimal operating conditions for flow-separation control through burst modulation depends on the Reynolds number and experimental conditions. Flow-separation control is a complicated mechanism that has been discussed in some studies [19,20,21]. In addition, the mechanism is intimately correlated with the vortex structure produced by DBDPAs. Chains of small-scale vortices that are produced by a high f+ consequently drive the turbulent transition; periodical large-scale vortices produced by a low f+ cause momentum mixing between the main flow and shear layer [17,19,22,23]. A detailed study of the behavior driven by the vortex structure and motion under varying burst modulations is required to understand this complexity. Nevertheless, the flow fields of vortices generated in burst modulation have not been studied in detail.
Basic features of vortex structures produced by DBDPAs on a smooth surface in quiescent air have been reported in several studies. Whalley and Choi [24] used smoke flow visualization and particle image velocimetry (PIV) to focus on the starting vortex in continuous actuation in quiescent air. They proposed that the starting vortex followed a self-similarity law, and the vortex-core trajectory was scaled as t2/3. On the other hand, the starting vortex, in the initial operation of continuous actuation, and the periodic vortices, in quasi-steady states during burst modulation, demonstrated significantly disparate features. Mishra and Panigrahi [25] reported the vortex behavior and the averaged velocity field in quiescent air as observed by high-speed schlieren photography (HS-SP) and PIV. They compared the behavior of the initial starting and repeating vortices in burst modulation and indicated that the advection velocity of the periodical independent vortex was higher than that of the starting vortex. Additionally, they reported that the ejected angle of the repeating-vortices trajectory was shallower than that of the initial starting vortex. Moreover, they indicated that the advection velocity of the vortex increased with BR. Mishra and Panigrahi [26] also studied the effects of f+ and BR using the bi-orthogonal decomposition (BOD) technique and discussed the temporal and spatial evolution of the flow field produced by DBDPAs. They indicated that the energy content of the mean mode, which approximates the time-averaged behavior of an induced flow, increases with an increase in both BR and f+. In contrast, global entropy increases at lower f+ and BR. Xue et al. [27] demonstrated vortex behavior in burst modulation through HS-SP and PIV measurements. Their report indicated the effects of BR and f+ in quiescent air and discovered the scaling law for the trajectory of vortex cores. They reported that a periodical, independent vortex exhibited a self-similar pattern after forming a vortex. In addition, the advection velocity of the vortex is invariant to the BR, but the velocity component along the wall increases congruently with increasing f+. However, these studies only focus on advection away from the wall surface, with limited experimental conditions (f+ and BR), where independent vortices are periodically generated. Using computational-fluid-dynamics [28,29] and PIV measurement [30], the varying flow-field patterns were studied and vortex behaviors were found to depend significantly on the parameters of the burst modulation. The vortex patterns can be categorized into three types of flow field, including the periodical generation of independent vortices. Mishra et al. [31] experimentally investigated the flow field induced by the continuous and burst actuation of an annular-shape electrode and found that there were three different types of vortices in the induced flow. They also found that the wall-normal jet generated during continuous operation shows low-frequency vortical structures. Alternatively, fluctuations in a low burst-frequency actuation are locked in with the burst frequency, while the flow field behavior for a higher burst frequency approaches continuous operation behavior.
Emori et al. [32] investigated flow fields induced by BR and f+ in burst modulation over a wide range of values using the background-oriented schlieren (BOS) measurement to address the mechanism of the flow-pattern classification. The BOS measurement, which is a noncontact, optical, flow-visualization technique that can quantitatively measure density fields [33,34,35,36,37], has been applied to the measurement of plasma actuators [38,39,40,41]. They successfully characterized the traveling vortex motion using a modified scaling law and found that the change of the flow-field could be expressed by the following two parameters: the energy consumed for the generation of one vortex and the distance between the vortices [32].
Our literature review reveals that previous studies have been conducted considering only density- or flow-velocity fields. However, the flow fields induced using DBDPAs must be investigated considering both density and flow velocity fields because while both the body force and air heating are crucial for vortex generation, the vortex generation mechanism is different between them [21]. The periodical flow acceleration generated by the body force directly leads to vortex generation. On the other hand, the density change caused by the heating of the air induces flow instability through the interaction with the mainstream, thereby resulting in vortex generation. Therefore, to understand the flow control mechanism of the burst mode actuation, it is important to compare the flow velocity field caused by the body force acceleration to the changes to the density field resulting from the increased air temperature and clarify the differences between them. The objective of this research is to clarify the flow field structure induced through burst modulation from the viewpoints of both the flow-velocity and density fields. To this end, we employed BOS and PIV measurements to perform flow visualization experiments under quiescent air conditions over a wide range of base frequencies F, BR, and f+ values.
2. Experimental Methods and Conditions
2.1. Experimental Settings and Details of DBDPA
The power supply setting used to drive the DBDPA is illustrated in Figure 3. The BR and f+ were controlled using a function generator (FG410; Yokogawa Electric, Tokyo, Japan), and the burst signal input was amplified by a high-voltage power amplifier (PSI-PG1040F; Powers System Integrate, Saitama, Japan) and supplied to the DBDPA. The amplified voltage was monitored using a digital oscilloscope (MDO3054; Tektronix, OR, USA) with a high-voltage probe (P6015A; Tektronix, OR, USA). A monitor capacitor (Cm) was placed between the low-voltage side of the DBDPA and ground line. Figure 4 shows the dimensional configuration of the DBDPA. The DBDPA was composed of a 1-mm thick glass epoxy plate and two asymmetric 0.05-mm thick electrodes made of foil copper tape. One electrode was positioned on the exposed top side and the other on the back side capped by polyimide tape. The DBDPA contained electrodes with a length of 130 mm. The top and bottom electrodes were arranged asymmetrically with no overlap. Furthermore, to prevent discharge to the surface electrode, the bottom electrode (low-voltage side) was masked with polyimide tape. The DBDPA’s power consumption in continuous operation Ec was calculated from the voltage and capacitance of the monitor capacitor using the V–Q Lissajous method [42]. Specifically, in the V–Q Lissajous method the electric charge QPA must be equivalent to the measured voltage of the monitor capacitor (Cm). The Ec is subsequently determined by integrating the Lissajous pattern from QPA and the amplified high-voltage, as shown in Equation (1).
The velocity field was measured using the PIV measurement system. The schematic of the PIV system setting is shown in Figure 5. The experiments were conducted inside an acrylic duct (600 mm in length, 120 mm in width, and 120 mm in height), and the DBDPA was assembled into the bottom of the duct to avoid the generation of steps. A seeding generator (FTK-70A; Honda Dynamics, Osaka, Japan) and water-soluble glycol (PS-2006; Dainichi, Niigata, Japan) were used to generate seed particles with a particle size of 1 μm or less. The Stokes number and mobility ratio of water-soluble glycol can be estimated to be 0.002 and 0.004, respectively; hence, the seeding has little effect in the flow field. The seed particles were illuminated by a continuous-wave YVO4 laser with an angle unit (G2000; Kato Koken, Kanagawa, Japan); a laser with a maximum power of 2 W and sheet thickness of approximately 1 mm. The camera used was a high-speed camera (Phantom VEO710, 1280 × 800 pixel; Vision Research, NJ, USA) with a green bandpass filter on the lens. Table 1 lists the conditions of the image correlation for PIV. The vorticity fields ωz = ∂v/∂x − ∂u/∂y can be calculated from the velocity vector field obtained by PIV, and the vorticity core can be identified from the vorticity field.
The BOS measurement system is illustrated in Figure 6. A BOS experiment was conducted to measure the density of the field. The BOS system consists of a green light-emitting diode (pseudo-parallel light) attached with a background image of a random-dot pattern, a camera, and a DBDPA. The high-speed camera was the same as that used for PIV measurements. The displacement field of the dots on the background image owing to the density gradient was calculated using the image-correlation method, which is often used in PIV. Table 2 lists the conditions of the image correlation for BOS. The density field can be calculated from the displacement field by numerically solving the Poisson equation for the density and displacement fields. Density field calculations were conducted using the algorithm proposed by Komuro et al. [38] and the calculation code developed by Kaneko et al. [40]. The uncertainty of the BOS measurement in this experiment is estimated to be, at most, 0.35% in all conditions against the reference density (ambient air). The uncertainty of the BOS measurement was discussed in detail by Kaneko et al. [40].
2.2. Experimental Conditions for Driving the DBDPA
Table 3 lists the experimental conditions in quiescent air, and we employed three burst-signal parameters (F, BR, and input time of burst signal Ton (see Figure 2)). The corresponding f+ (Hz) for each case is listed in the table. The strength of the body force produced by the DBDPA (i.e., the strength of wall jet) can be changed by controlling the base frequency F. Therefore, the three base frequencies, F, varied up to 3 times; 3.6 (1×), 7.2 (2×), and 14.4 kHz (3×). The voltage waveform was maintained at 15 kVpp. The conditions cover a wide range of F, BR, and f+ in comparison to previous studies [26,28] and are identical to our previous study [32].
3. Experimental Results
3.1. Classification of Flow-Field Patterns and Comparison of Density and Vorticity Fields
In this section we categorize the four types of flow-field patterns identified by the BOS measurements and compare the density and vorticity fields obtained by the PIV measurements.
The first flow-field pattern shown was a wall jet, similar to that of the continuous operation pattern. Figure 7 shows the instantaneous (t = 400 ms) density contours at F = 7.2 kHz (a) in continuous operation (BR = 100%) and (b) in burst modulation with Ton = 1 ms and BR = 40% (f+ = 400 Hz) in a quasi-steady state. A wall jet was generated in the continuous operation and the density decreased along the wall surface. This was because the accelerated air and Joule heating in the discharge resulted in a density decrease around the electrode edge, which resulted in the low-density fluid being carried by the wall jet [38]. By contrast, the density in the flow–suction area increased because the air was being compressed. The density field in burst modulation is like that in continuous operation as shown in Figure 7b. This flow-field pattern was categorized as Type 1. Notably, the burst modulation has a weaker jet than the continuous operation model because of the lower total momentum input. On the other hand, it can be said that the burst modulation must have had an efficient momentum input to produce a continuous wall jet. Figure 8 shows the vorticity contours under the same condition as in Figure 7; at F = 7.2 kHz (a) in the continuous operation (BR = 100%) and (b) in burst modulation with Ton = 1 ms and BR = 40% (f+ = 400 Hz) in the quasi-steady state. In addition, in the vorticity field a wall jet was observed in continuous operation, as shown in Figure 8a. Similarly, for the burst modulation in Figure 8b, although the vorticity is lower than that in Figure 8a, a wall jet was observed.
The second flow-field pattern features periodical independent vortices moving on the wall surface without detaching from the wall surface. Figure 9 shows the time series of (a) density field contours and (b) vorticity contours at F = 7.2 kHz in burst modulation with BR = 40% and Ton = 2 ms (f+ = 200 Hz) in the quasi-steady state. Figure 9a shows that the density contours at 2–25 ms exhibit independent vortex formation. At 25 ms, the vortex travels while in contact with the surface and gradually dissipates in travel. In contrast, Figure 9b vorticity contours at 2–25 ms show difficulty in determining independent vortices and a distribution similar to that in Figure 8 for the wall jet. The dotted arrows in Figure 9 indicate the direction of vortex advection. Initially, the air is accelerated by the body force due to plasma, then the wall jet appears as shown in Figure 9a,b at 2 ms. The vortex increases while moving on the surface in Figure 9a,b at 5 ms. Thereafter, the vortex does not detach from the wall surface but continues to move in a shape of lateral ellipse on the wall surface at 10–15 ms, as shown in Figure 9a. However, Figure 9b vorticity contours (after 10–25 ms) do not identify the location of the vortex. The fluid in the density field was Joule heated and simultaneously accelerated by body force. Burst modulation periodically heats the fluid and because the periodically heated fluid expands during advection it forms a periodic structure. However, the velocity field is considered less likely to have a periodic structure owing to the effects of inertia. As shown in Figure 9a, at 25 ms the vortex gradually dissipates as it moves along the wall’s surface. This flow pattern is categorized as Type 2. The width of the Type 2 wall jet is also similar for both the density and vorticity fields.
The third flow pattern shows the independent vortex splitting into two vortices and leaving the wall surface. Figure 10 shows the time series of (a) the density field and (b) vorticity contours from vortex formation at 2 ms and by vortex advection from the wall surface at 25 ms. The actuation conditions are F = 7.2 kHz, BR = 40%, and Ton = 4 ms (f+ = 100 Hz) in the quasi-steady state. Initially, a body force is produced by the actuation of the DBDPA, and the wall jet flow appears near the wall surface at 2 ms as shown in Figure 10a. The wall jet grows while traveling along the surface (Figure 10a at 5 ms) and then the vortex shape grows into a semicircle (Figure 10a at 10 ms). In Figure 10a, at 15 ms the vortex separates into primary and secondary vortices, and the secondary vortex has a lower density than the primary vortex. The separated vortex detaches from the wall surface, moves to the upper right, and finally disappears at 25 ms, as shown in Figure 10a. This flow pattern is classified as Type 3. However, in Figure 10b, vorticity contours at 2–25 ms show that the field pattern is not significantly different from the continuous induced flow, as shown in Figure 8b or Figure 9b. Type 3 fields can be identified as separate vortices more clearly in terms of the density field.
The fourth flow field pattern features the periodical generation of independent vortices in both the density and vorticity fields. Figure 11 shows the time series of (a) density and (b) vorticity contours at F = 7.2 kHz in burst modulation with BR = 20% and Ton = 8 ms (f+ = 25 Hz) in the quasi-steady state, from the beginning of vortex formation at 2 ms to vortex advection from the wall surface at 25 ms. In Figure 11a,b, after the jet flow appears as a result of actuation at 2 ms, it can be observed in both the density and vorticity contours that a vortex starts to appear at 5 ms and grows in the shape of a circle at 10 ms. The apparent structure of the primary and secondary vortices can be observed in the vorticity field at 10 ms (Figure 11b); however, the secondary vortex is not clearly seen in the density field at 10 ms (Figure 11a). The vortex detaches from the wall surface and advects to the upper right at 15 ms. In this phase, the secondary vortex can also be identified in the density field. The density of the primary vortex is lower than that of the secondary vortex, and the vortex pair structure can be observed more clearly in the vorticity field. This characteristic differs from that of Type 3. Finally, the vortices gradually dissipate during convection and disappear in both the density and vorticity fields at 25 ms. This flow-field pattern is categorized as Type 4. This flow pattern has been discussed in previous studies [25,27].
In the previous study, focus was only on the density field [32] and the flow field was categorized into three types instead of four. This is because it is difficult to distinguish the secondary vortex in the density field, so Type 2 and 3 patterns in the current study were categorized as the same type in the previous work [32]. Especially in Type 4, the secondary vortex clearly observed in the vorticity field cannot be identified in the density field, and the vortex structure is totally different between the density and vorticity field.
Table 4 classifies the flow-field pattern into four types for all the experimental conditions. Each type of flow-field pattern can be recognized by the color in each table. The lower BR and f+ values indicate that the flow field transitioned from Type 1 to Type 2, then to Type 3, and ultimately to Type 4. When BR and f+ are sufficiently high, the flow field is similar to that of a continuous wall jet (Type 1). When BR and f+ decrease, the flow field turns into separate independent vortices and the vortices move away from the wall surface. Furthermore, when F increases from (a) 3.6 kHz to (c) 14.4 kHz, the change from Type 1 to Type 4 shifts to the lower left in Table 4. The change of the flow-field pattern was discussed in detail in our previous study [32].
3.2. Comparison of Density and Vorticity Fields
This section presents a comparison of the density and vorticity fields. First, the maximum values of the positive and negative vorticities obtained by averaging five burst cycles for all the experimental conditions are shown in Figure 12. The color of the dot in Figure 12 indicates the energy consumed to generate one vortex, Ev. The positive and negative values of vorticity are strongly correlated; moreover, the larger the value of Ev, the higher the positive and negative values. Furthermore, the larger the Ev is, the higher the positive vorticity for equal negative values.
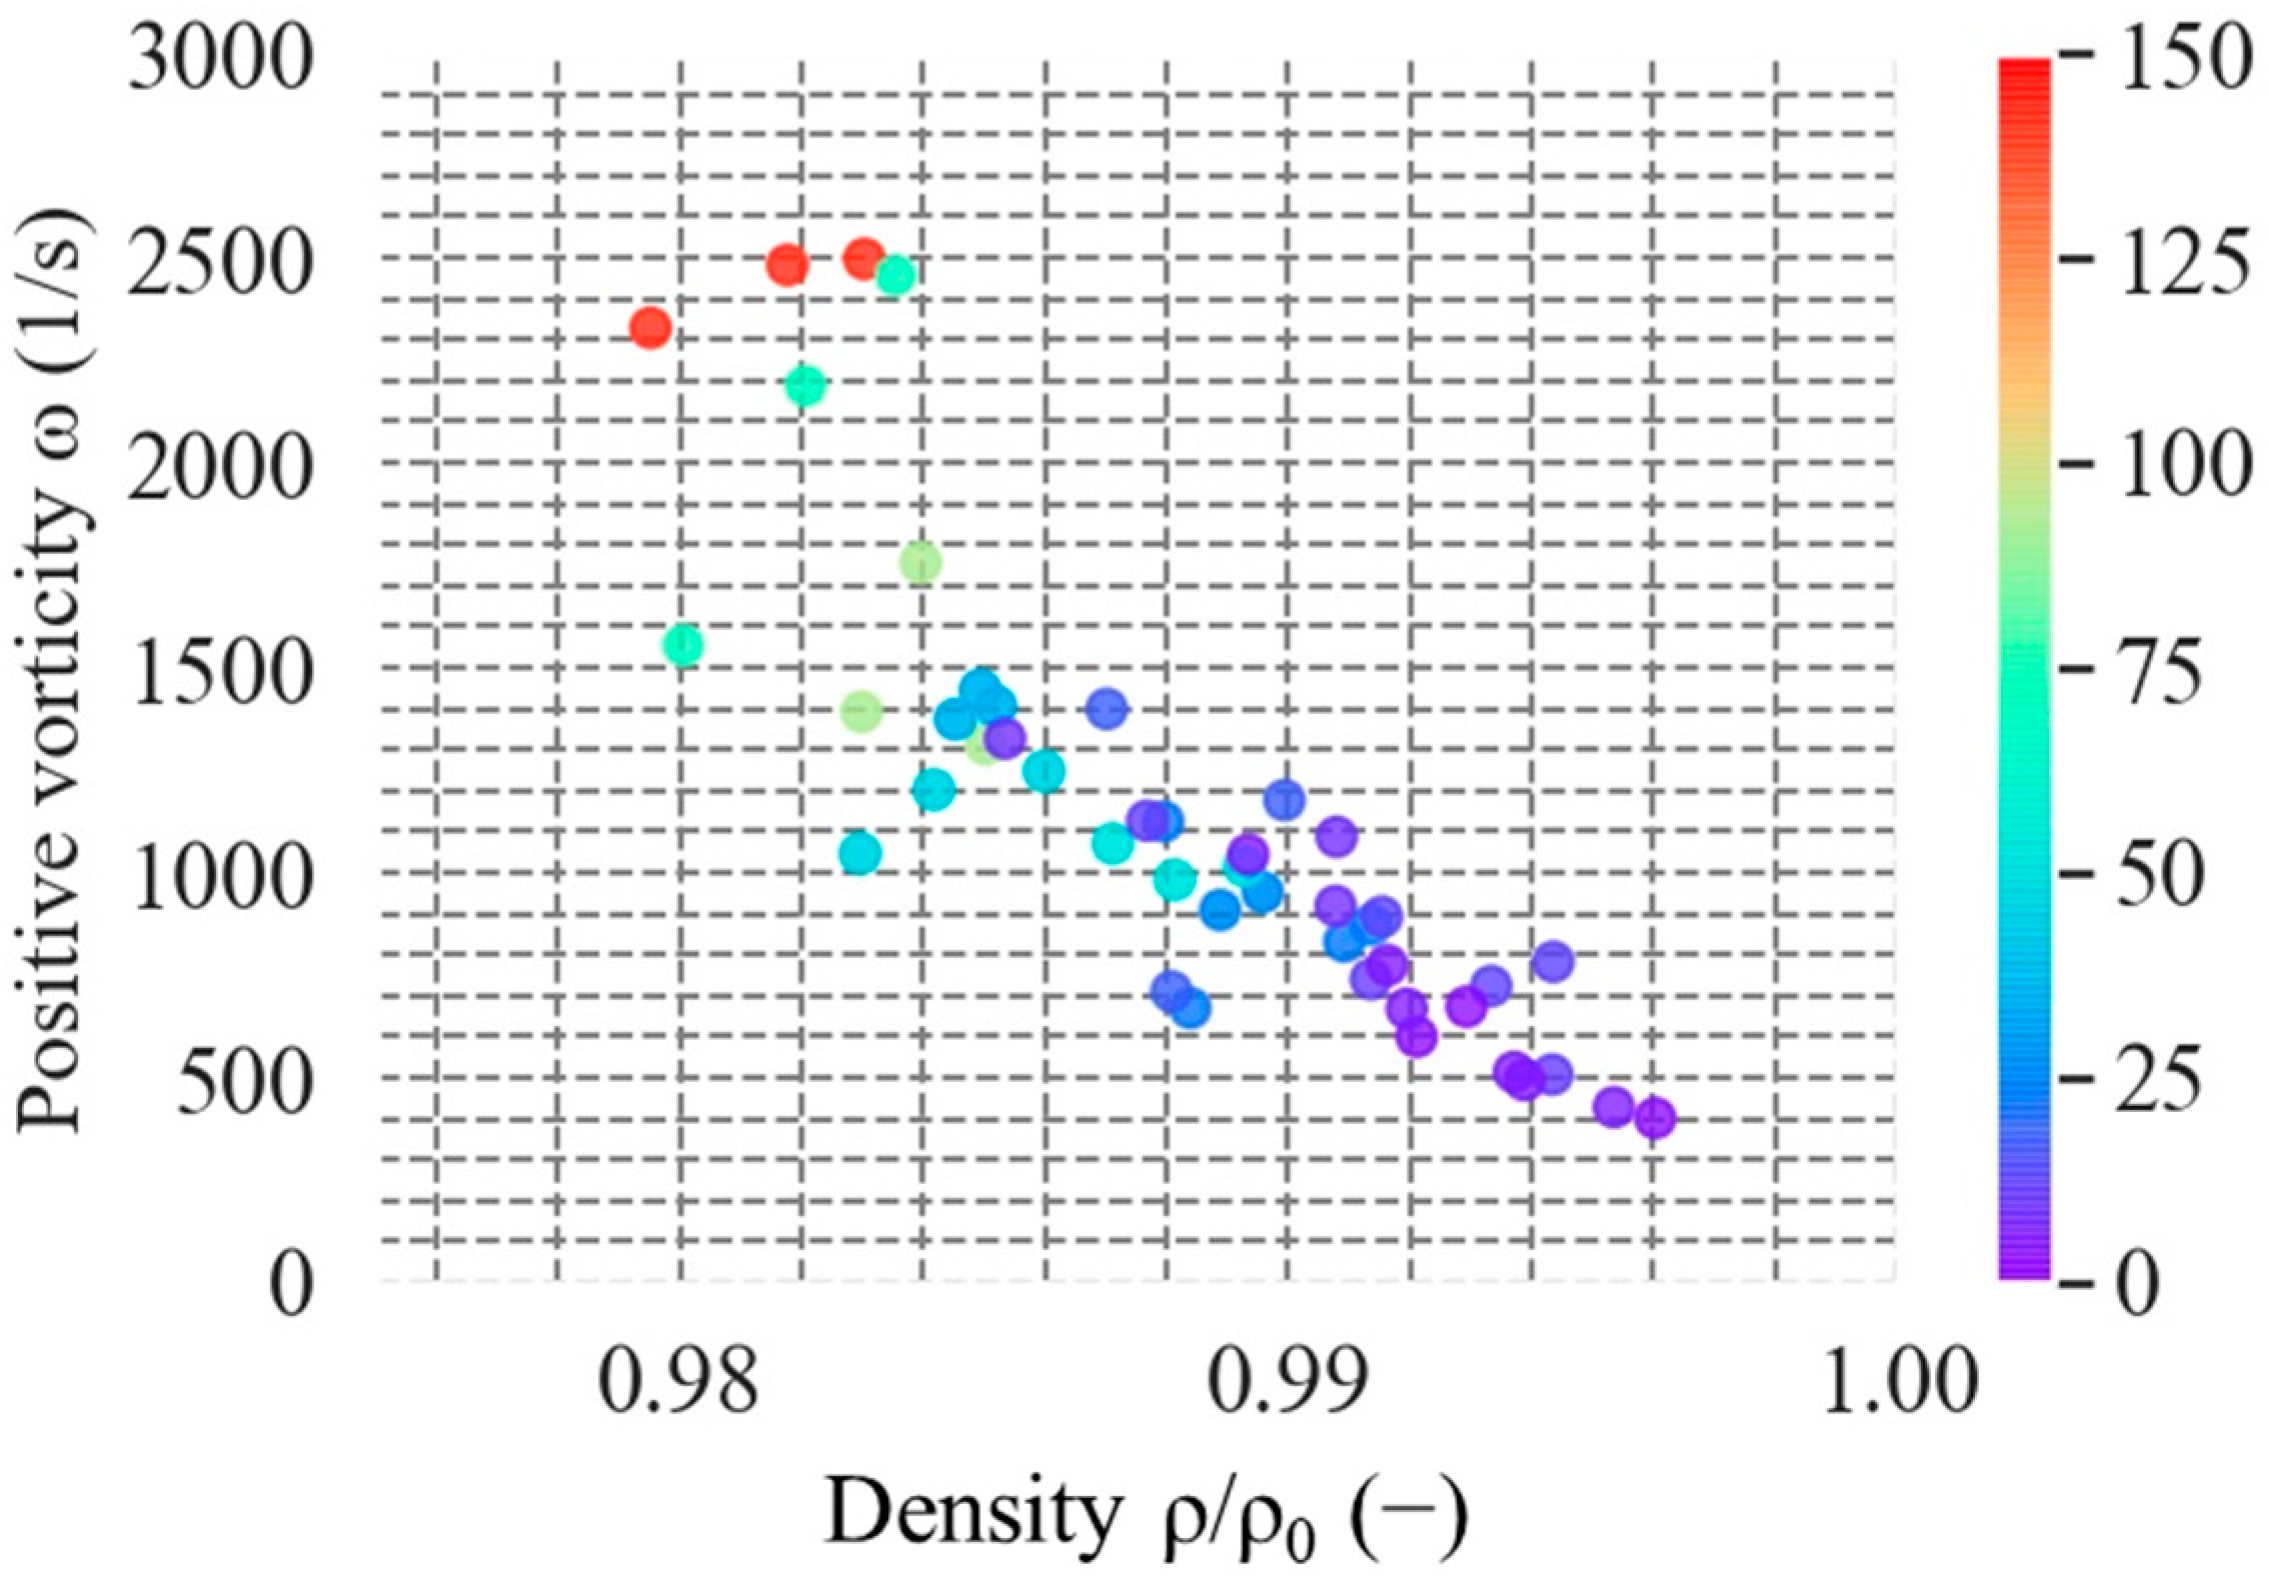
Figure 13 plots the comparison of the maximum values of positive vorticity and the minimum values of density by averaging five burst cycles for all the experimental conditions. The color of the dot in Figure 13 also indicates the energy consumed to generate one vortex Ev. The positive vorticity is also strongly correlated with the density, which is lower when positive vorticity is high depending on Ev.
4. Conclusions
The present study experimentally investigates the characteristics of flow fields produced using burst modulation from a DBDPA in quiescent air from the perspectives of both density and vorticity fields. The PIV and BOS methods were used to investigate the density and vorticity fields, respectively. A series of experiments were conducted by varying three key parameters of burst modulation: (1) base frequency F, (2) burst ratio BR, and (3) input time of the burst signal Ton.
We found that there are four types of flow-field patterns: Type 1 was a wall jet with no distinct vortices in both the density and vorticity fields. Type 2 showed vortices moving on the wall surface in the density field; however, a distinct vortex was not identified in the vorticity field. In Type 3, it was observed in the density field that the vortex split into two vortices and the primary vortex traveled away from the wall surface. However, although periodic perturbations were observed in the vorticity field, they were not significantly different from those of Types 1 and 2. Type 4 showed periodic shedding of two independently separated vortices (the primary and secondary vortices) leaving from the wall surface. The vortex pair structure could be observed more clearly in the vorticity field, and these characteristics were different from those of Type 3. The flow-field pattern transitioned from Type 1 to Type 2, then to Type 3, and ultimately to Type 4 for low BR and f+ values. Moreover, the increment in F also transitioned the flow-field pattern from Type 1 to Type 4.
The relationship between the maximum value of vorticity and the minimum value of density was investigated and we observed a strong positive correlation between the positive and negative vorticities. More importantly, a strong negative correlation was observed between the positive vorticity and density. Finally, the power consumed to generate one vortex, Ev, determined the vorticity strength and density reduction of the vortex.
Author Contributions
Conceptualization, H.N.; methodology, H.N., Y.K. and K.E.; validation, K.E.; formal analysis, K.E.; investigation, K.E.; data curation, K.E.; writing—original draft preparation, K.E.; writing—review and editing, H.N.; software, K.E. and Y.K.; visualization, K.E.; supervision, H.N.; resources, H.N.; project administration, H.N.; funding acquisition, H.N. All authors have read and agreed to the published version of the manuscript.
Funding
This work was supported by JSPS KAKENHI Grant Numbers JP19H02062, JP22H01683.
Data Availability Statement
The data supporting the findings of this study are available from the corresponding author upon reasonable request.
Conflicts of Interest
The authors declare no conflict of interest.
References
- Benard, N.; Moreau, E. Electrical and mechanical characteristics of surface AC dielectric barrier discharge plasma actuators applied to airflow control. Exp. Fluids 2014, 55, 1–43. [Google Scholar] [CrossRef] [Green Version]
- Moreau, E. Airflow control by non-thermal plasma actuators. J. Phys. D: Appl. Phys. 2007, 40, 605. [Google Scholar] [CrossRef]
- Thomas, F.O.; Corke, T.C.; Iqbal, M.; Kozlov, A.; Schatzman, D. Optimization of Dielectric Barrier Discharge Plasma Actuators for Active Aerodynamic Flow Control. AIAA J. 2009, 47, 2169–2178. [Google Scholar] [CrossRef] [Green Version]
- Lilley, A.J.; Roy, S.; Michels, L.; Roy, S. Performance Recovery of Plasma Actuators in Wet Conditions. J. Phys. D Appl. Phys. 2022, 55, 155201. [Google Scholar] [CrossRef]
- Tanaka, T.; Matsuda, H.; Takahashi, T.; Chiba, T.; Watanabe, N.; Sato, H.; Takeyama, M. Experimental Study on the Snowfall Flow Control of Backward-Facing Steps Using a High-Durability Designed Plasma Electrode. Actuators 2022, 11, 313. [Google Scholar] [CrossRef]
- Tanaka, M.; Kubo, N.; Kawabata, H. Plasma actuation for leading edge separation control on 300-kW rotor blades with chord length around 1 m at a Reynolds number around 1.6 × 10⁶. J. Phys.: Conf. Ser. 2020, 1618, 052013. [Google Scholar] [CrossRef]
- Enloe, C.L.; McLaughlin, T.E.; Dyken, R.V.; Kachner, K.D.; Jumper, E.J.; Corke, T.C.; Post, M.; Haddad, O. Mechanisms and Responses of a Dielectric Barrier Plasma Actuator: Geometric Effects. AIAA J. 2004, 42, 595–604. [Google Scholar] [CrossRef]
- Nakano, A.; Nishida, H. The effect of the voltage waveform on performance of dielectric barrier discharge plasma actuator. J. Appl. Phys. 2019, 126, 173303. [Google Scholar] [CrossRef]
- Durscher, R.J.; Roy, S. Three-dimensional flow measurements induced from serpentine plasma actuators in quiescent air. J. Phys. D: Appl. Phys. 2012, 45, 035202. [Google Scholar] [CrossRef] [Green Version]
- Riherd, R.; Roy, S. Serpentine geometry plasma actuators for flow control. J. Appl. Phys. 2013, 114, 083303. [Google Scholar] [CrossRef]
- Gupta, A.D.; Roy, S. Modification of energetic modes for transitional flow control. AIP Adv. 2022, 12, 035149. [Google Scholar] [CrossRef]
- Wang, J.J.; Choi, K.S.; Feng, L.H.; Jukes, T.N.; Whalley, R.D. Recent developments in DBD plasma flow control. Prog. Aerosp. Sci. 2013, 62, 52–78. [Google Scholar] [CrossRef]
- Portugal, S.; Choudhury, B.; Lilley, A.; Charters, C.; Porrello, C.; Lin, J.; Roy, S. A fan-shaped plasma reactor for mixing en-hancement in a closed chamber. J. Phys. D: Appl. Phys. 2020, 53, 22LT01. [Google Scholar] [CrossRef]
- Sato, M.; Nonomura, T.; Okada, K.; Asada, K.; Aono, H.; Yakeno, A.; Abe, Y.; Fuji, K. Mechanisms for laminar separated-flow control using dielectric-barrier-discharge plasma actuator at low Reynolds number. Phys. Fluids 2015, 27, 117101. [Google Scholar] [CrossRef]
- Corke, T.C.; He, C.; Patel, M.P. Plasma flaps and slats: An application of weakly-ionized plasma actuators. J. Aircr. 2009, 46, 864–873. [Google Scholar] [CrossRef]
- Sidorenko, A.; Zanin, B.; Postnikov, B.; Budovsky, A.; Starikovskii, A.; Roupassov, D.; Zavialov, I.; Malmuth, N.; Smereczniak, P.; Silkey, J. Pulsed Discharge Actuators for Rectangular Wings Separation Control. In Proceedings of the AIAA Aerospace Sciences Meeting and Exhibit, Reno, NV, USA, 8–11 January 2007. [Google Scholar] [CrossRef]
- Fujii, K. Three Flow Features behind the Flow Control Authority of DBD Plasma Actuator: Result of High-Fidelity Simula-tions and the Related Experiments. Appl. Sci. 2018, 8, 546. [Google Scholar] [CrossRef] [Green Version]
- Greenblatt, D.; Schneider, T.; Schule, C.Y. Mechanism of flow separation control using plasma actuation, Phys. Fluids 2012, 24, 077102. [Google Scholar] [CrossRef]
- Sekimoto, S.; Tanaka, N.; Nonomura, T.; Nishida, H.; Fujii, K. Experimental Study of Burst Ratio Effect for Dielectric-Barrier-Discharge Plasma Actuator for Separation Control. Proceedings of 55th AIAA Aerospace Sciences Meeting, Grapevine, TX, USA, 9–13 January 2017. [Google Scholar] [CrossRef]
- Sekimoto, S.; Nonomura, T.; Fujii, K. Burst-Mode Frequency Effects of Dielectric Barrier Discharge Plasma Actuator for Separation Control. AIAA J. 2017, 55, 1385 1392. [Google Scholar] [CrossRef]
- Suzuki, K.; Komuro, A.; Nonomura, T.; Asai, K.; Ando, A. Effect of burst ratio on flow separation control using a dielectric barrier discharge plasma actuator at Reynolds number 2.6 × 10⁵. J. Phys. D: Appl. Phys. 2021, 54, 315204. [Google Scholar] [CrossRef]
- Vukasinovic, B.; Glezer, A. Transitory Fluidic Control of Turbulent Shear Flows. In Proceedings of the 36th AIAA Fluid Dynamics Conference and Exhibit, Washington, DC, USA, 5–8 June 2006. [Google Scholar] [CrossRef] [Green Version]
- Chen, D.; Asada, K.; Sekimoto, S. A high-fidelity body-force modeling approach for plasma-based flow control simulations. Phys. Fluids 2021, 33, 037115. [Google Scholar] [CrossRef]
- Whalley, R.D.; Choi, K.S. The starting vortex in quiescent air induced by dielectric-barrier-discharge plasma. J. Fluid Mech. 2012, 703, 192–203. [Google Scholar] [CrossRef] [Green Version]
- Mishra, B.K.; Panigrahi, P.K. Formation and characterization of the vortices generated by a DBD plasma actuator in burst mode. Phys. Fluids 2017, 29, 024104. [Google Scholar] [CrossRef]
- Mishra, B.K.; Panigrahi, P.K. Flow field induced by a dielectric barrier discharge plasma actuator analyzed with bi–orthogonal decomposition. Phys. Fluids 2020, 32, 087112. [Google Scholar] [CrossRef]
- Xue, M.; Gao, C.; Xi, H.D.; Liu, F. Vortices Induced by a Dielectric Barrier Discharge Plasma Actuator Under Burst-Mode Actuation. AIAA J. 2020, 58, 2428–2441. [Google Scholar] [CrossRef]
- Aono, H.; Sekimoto, S.; Sato, M.; Yakeno, A.; Nonomura, T.; Fujii, K. Computational and experimental analysis of flow structures induced by a plasma actuator with burst modulations in quiescent air. Mech. Eng. J. 2015, 2, 1–16. [Google Scholar] [CrossRef] [Green Version]
- Hasegawa, D.; Nakano, K.; Nakano, A.; Nishida, H. Numerical Study on Flow Field Produced by Burst Mode Actuation of DBD Plasma Actuator. In Proceedings of the Ninth JSME-KSME Thermal and Fluids Engineering Conference, Okinawa, Japan, 27–30 October 2017. TFEC9-1109. [Google Scholar]
- Emori, K.; Kaneko, Y.; Nishida, H. Influence of Main Flow on Vortex Structure Generated by Burst Mode Actuation of DBD Plasma Actuator. In Proceedings of the AIAA SCITECH 2022 Forum, San Diego, CA, USA, 3–7 January 2022. [Google Scholar] [CrossRef]
- Mishra, B.K.; Gupta, A.; Panigrahi, P.K. Near-wall characteristics of wall-normal jets generated by an annular dielec-tric-barrier-discharge plasma actuator. Phys. Rev. Fluids 2022, 7, 033702. [Google Scholar] [CrossRef]
- Emori, K.; Kaneko, Y.; Nishida, H. Classification of Flow-Field Patterns in Burst-Mode Actuation of a Dielec-tric-Barrier-Discharge Plasma Actuator. Phys. Fluids 2022, 34, 023601. [Google Scholar] [CrossRef]
- Raffel, M. Background-oriented schlieren (BOS) techniques. Exp. Fluids 2015, 56, 1–17. [Google Scholar] [CrossRef] [Green Version]
- Settles, G.S.; Hargather, M.J. A review of recent developments in Schlieren and shadowgraph techniques. Meas. Sci. Technol. 2017, 28, 042001. [Google Scholar] [CrossRef]
- Hayasaka, K.; Tagawa, Y.; Liu, T.; Kameda, M. Optical-flow-based background-oriented Schlieren technique for measuring a laser-induced underwater shock wave. Exp. Fluids 2016, 57, 179. [Google Scholar] [CrossRef] [Green Version]
- Yamamoto, S.; Tagawa, Y.; Kameda, M. Application of background-oriented schlieren (BOS) technique to a laser-induced underwater shock wave. Exp. Fluids 2015, 56, 93. [Google Scholar] [CrossRef] [Green Version]
- Hayasaka, K.; Tagawa, Y. Mobile visualization of density fields using smartphone background-oriented schlieren. Exp. Fluids 2019, 60, 171. [Google Scholar] [CrossRef] [Green Version]
- Komuro, A.; Tahashima, K.; Suzuki, K.; Kanno, S.; Nonomura, T.; Kaneko, T.; Ando, A.; Asai, K. Influence of discharge energy on the lift and drag forces induced by a nanosecond-pulse-driven plasma actuator. Plasma Sources Sci. Technol. 2019, 28, 065006. [Google Scholar] [CrossRef]
- Komuro, A.; Ogura, N.; Ito, M.; Nonomura, T.; Asai, K.; Ando, A. Visualization of density variations produced by alternat-ing-current dielectric-barrier-discharge plasma actuators using the background-oriented schlieren method. Plasma Sources Sci. Technol. 2019, 28, 055002. [Google Scholar] [CrossRef]
- Kaneko, Y.; Nishida, H.; Tagawa, Y. Background-oriented schlieren measurement of near-surface density field in surface dielectric-barrier-discharge. Meas. Sci. Technol. 2021, 32, 125402. [Google Scholar] [CrossRef]
- Kaneko, Y.; Nishida, H.; Tagawa, Y. Visualization of the Electrohydrodynamic and Thermal Effects of AC-DBD Plasma Ac-tuators of Plate- and Wire-Exposed Electrodes. Actuators 2022, 11, 38. [Google Scholar] [CrossRef]
- Pons, J.; Moreau, E.; Touchard, G. Asymmetric surface dielectric barrier discharge in air at atmosphere pressure: Electrical properties and induced airflow characteristics. J. Phys. D Appl. Phys. 2005, 38, 3635–3642. [Google Scholar] [CrossRef]
Figure 1.
Schematic of a DBDPA.
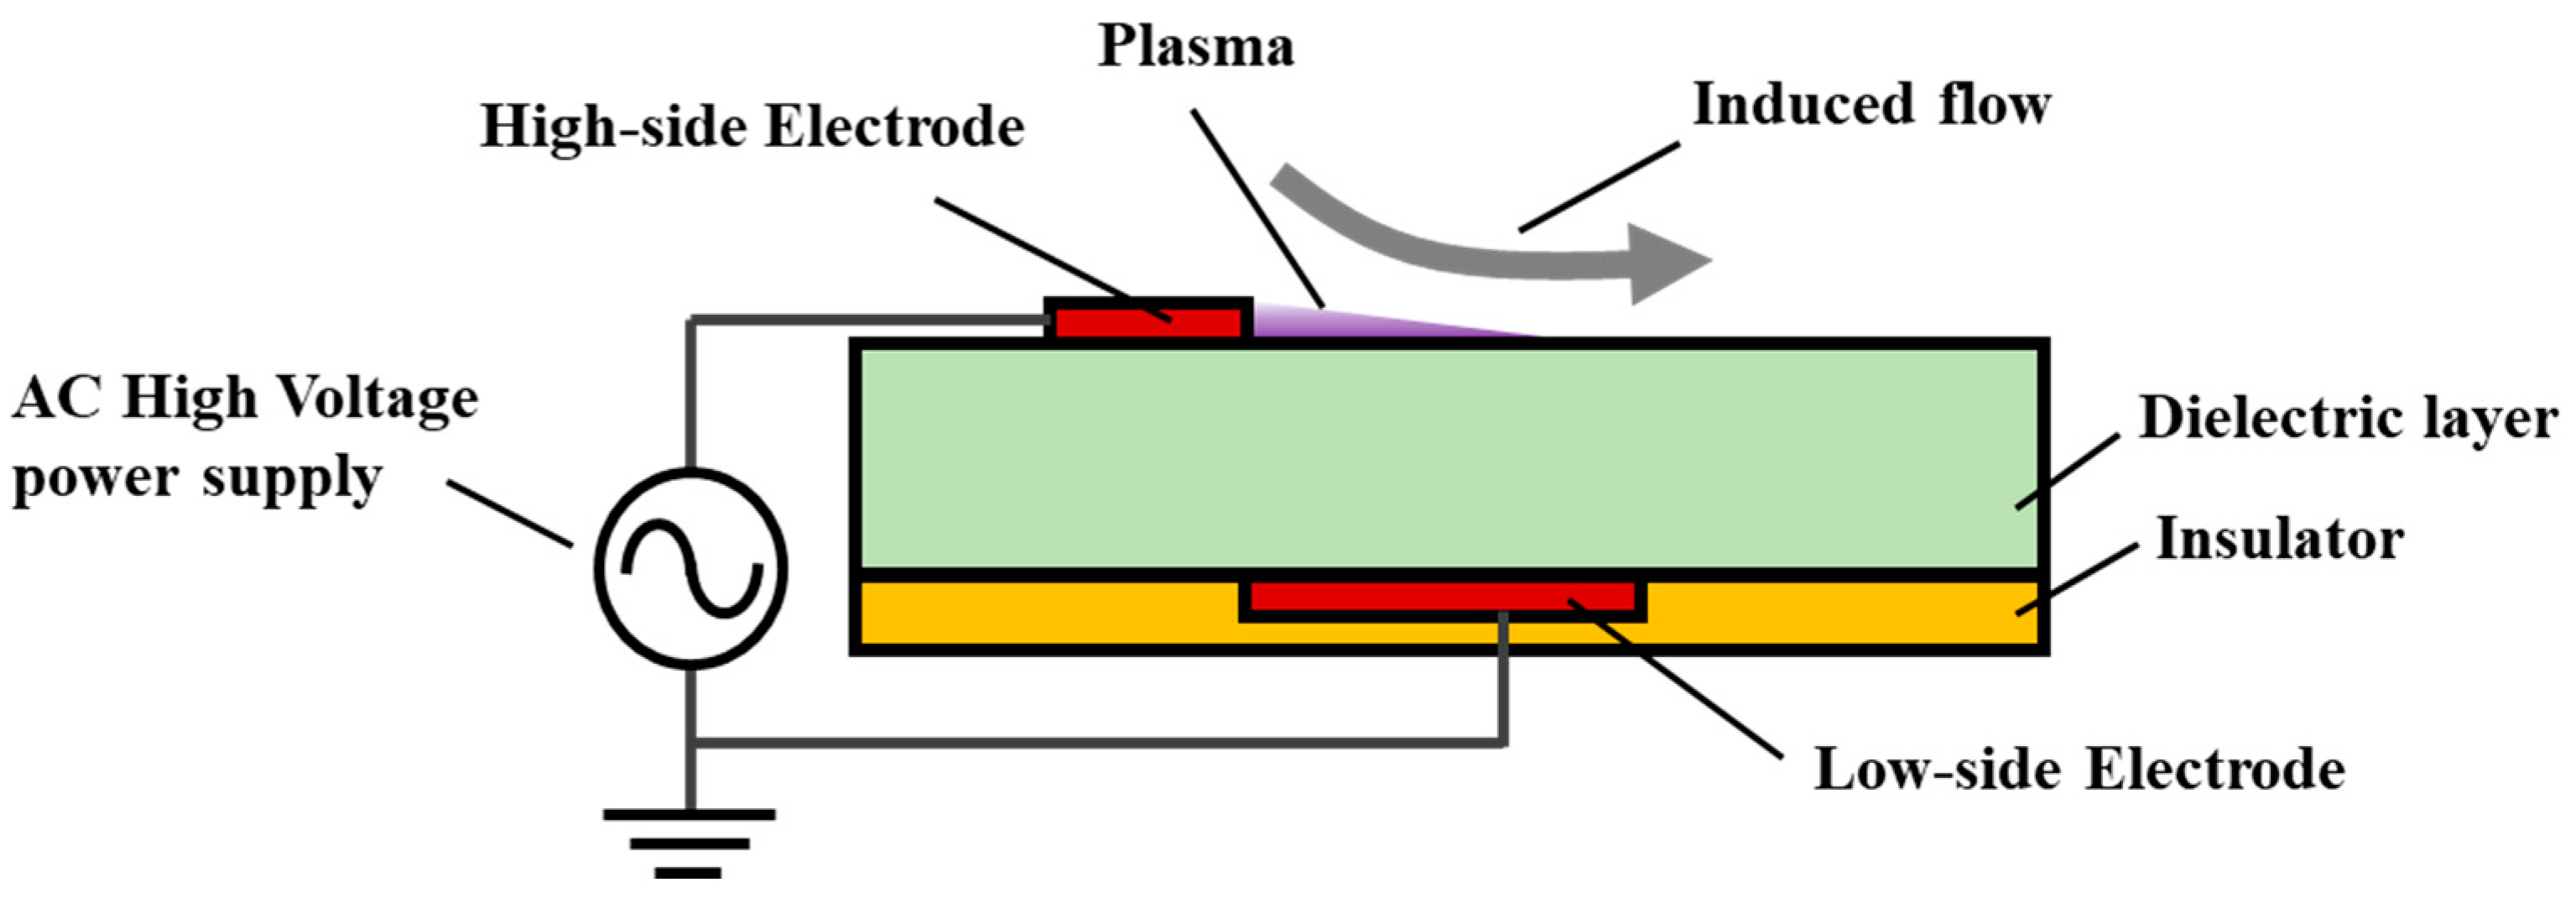
Figure 2.
Waveform of burst signal input.

Figure 3.
Schematic showing the experimental settings of the DBDPA.
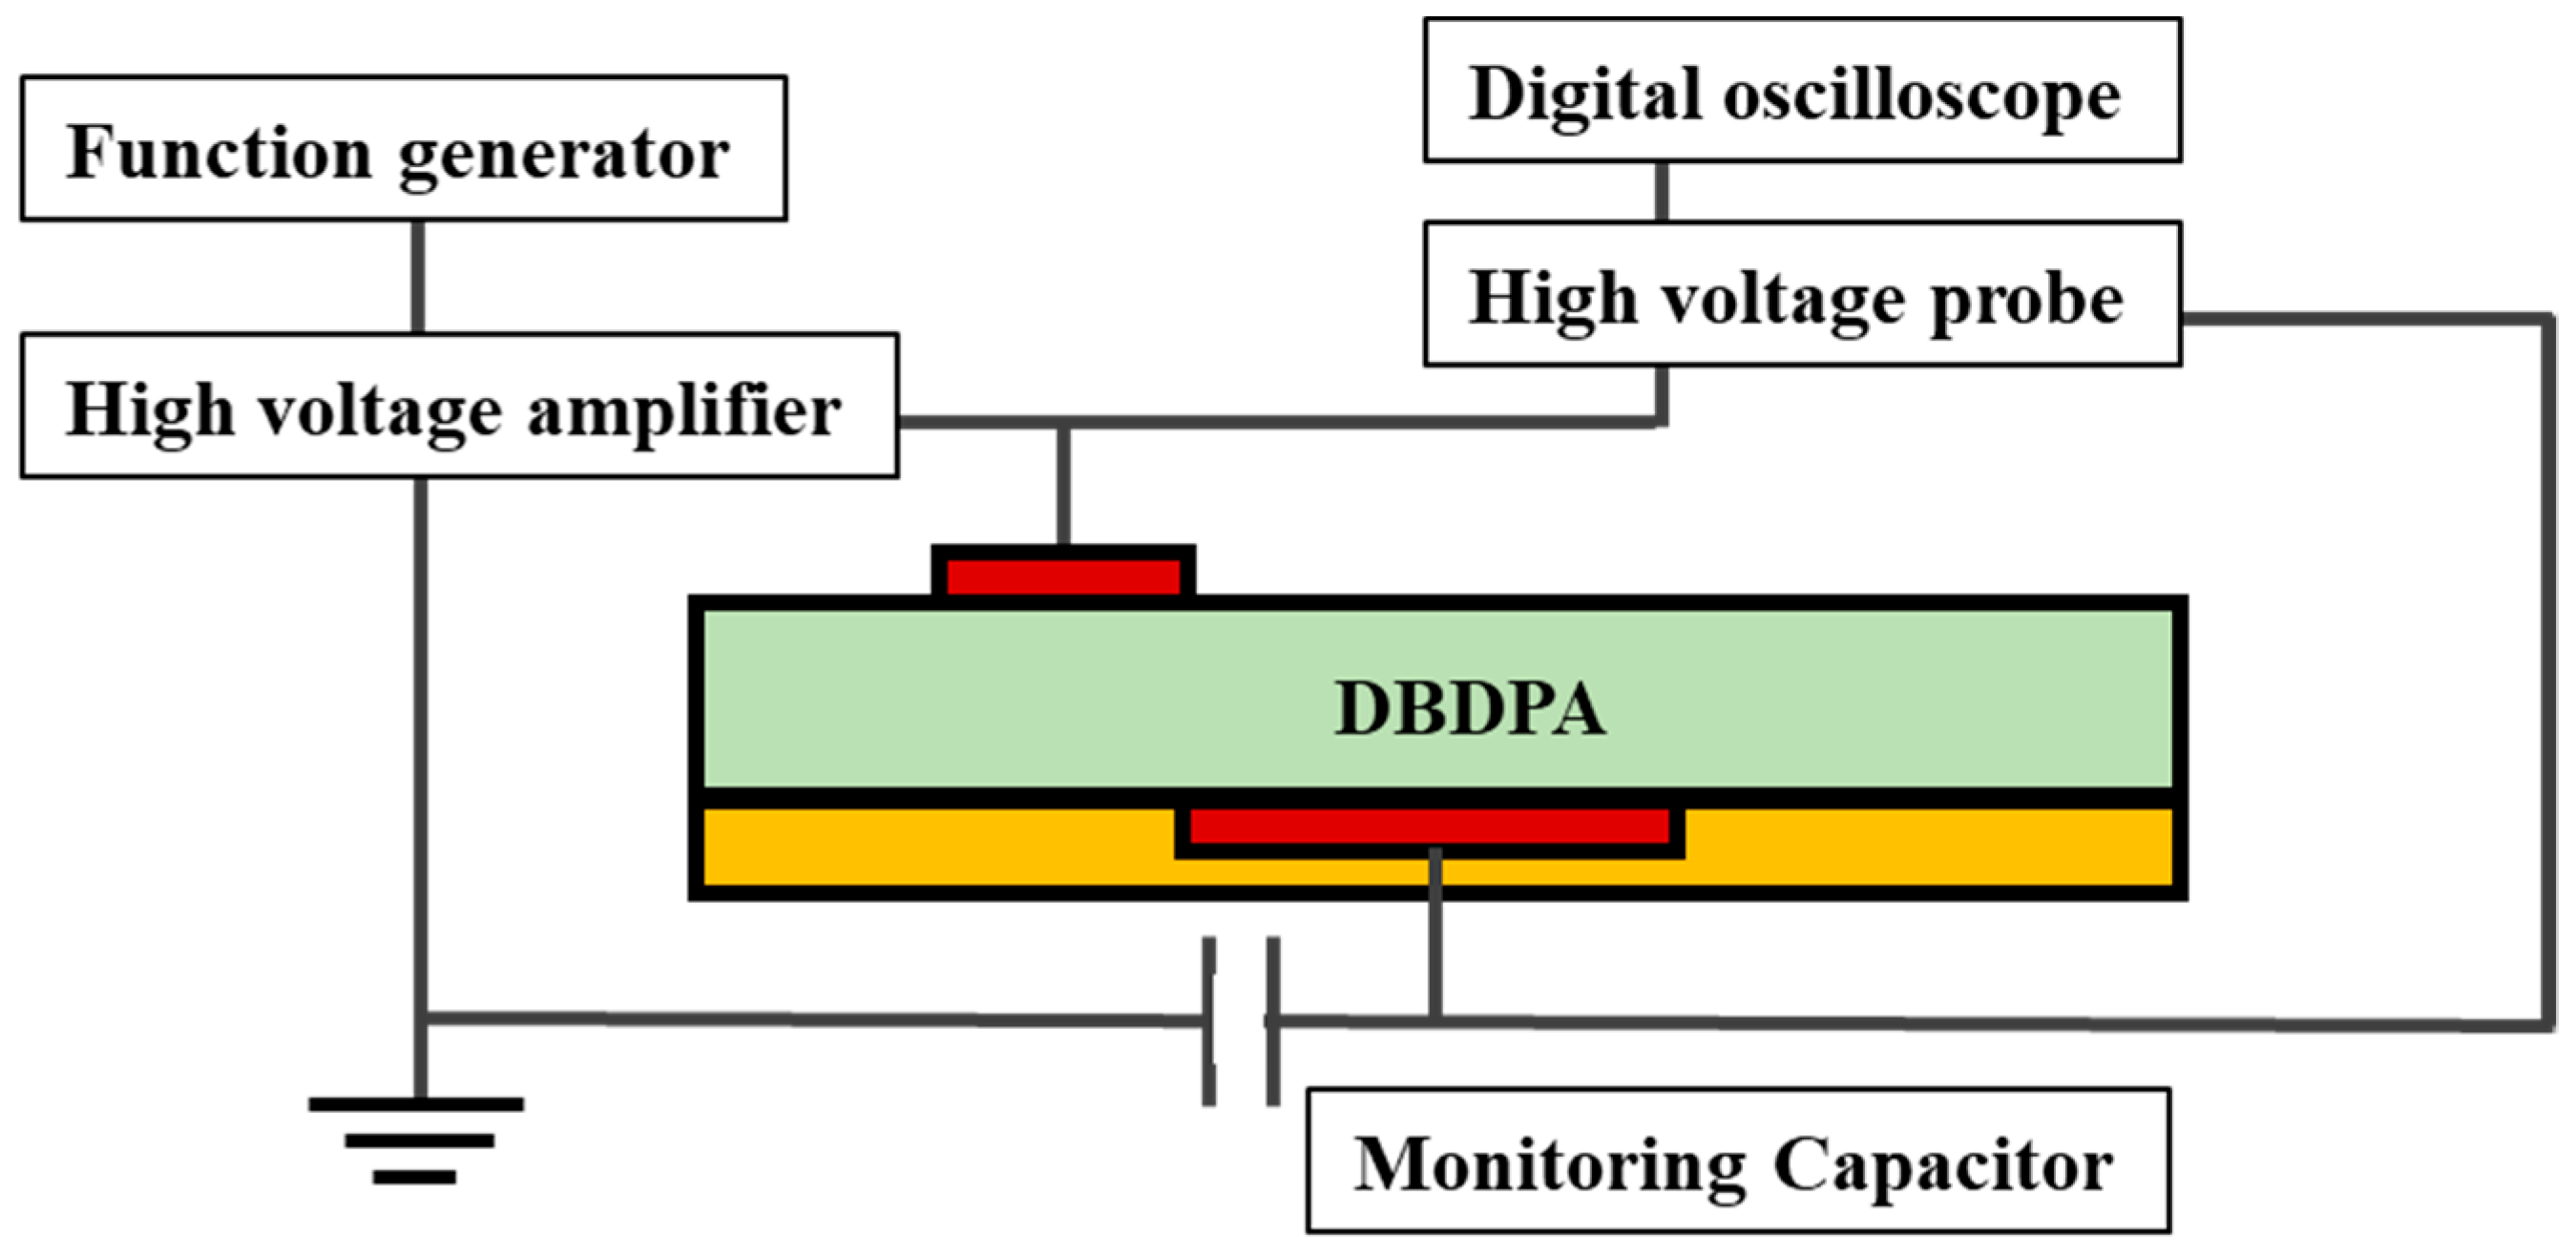
Figure 4.
Dimensional configuration of the DBDPA.
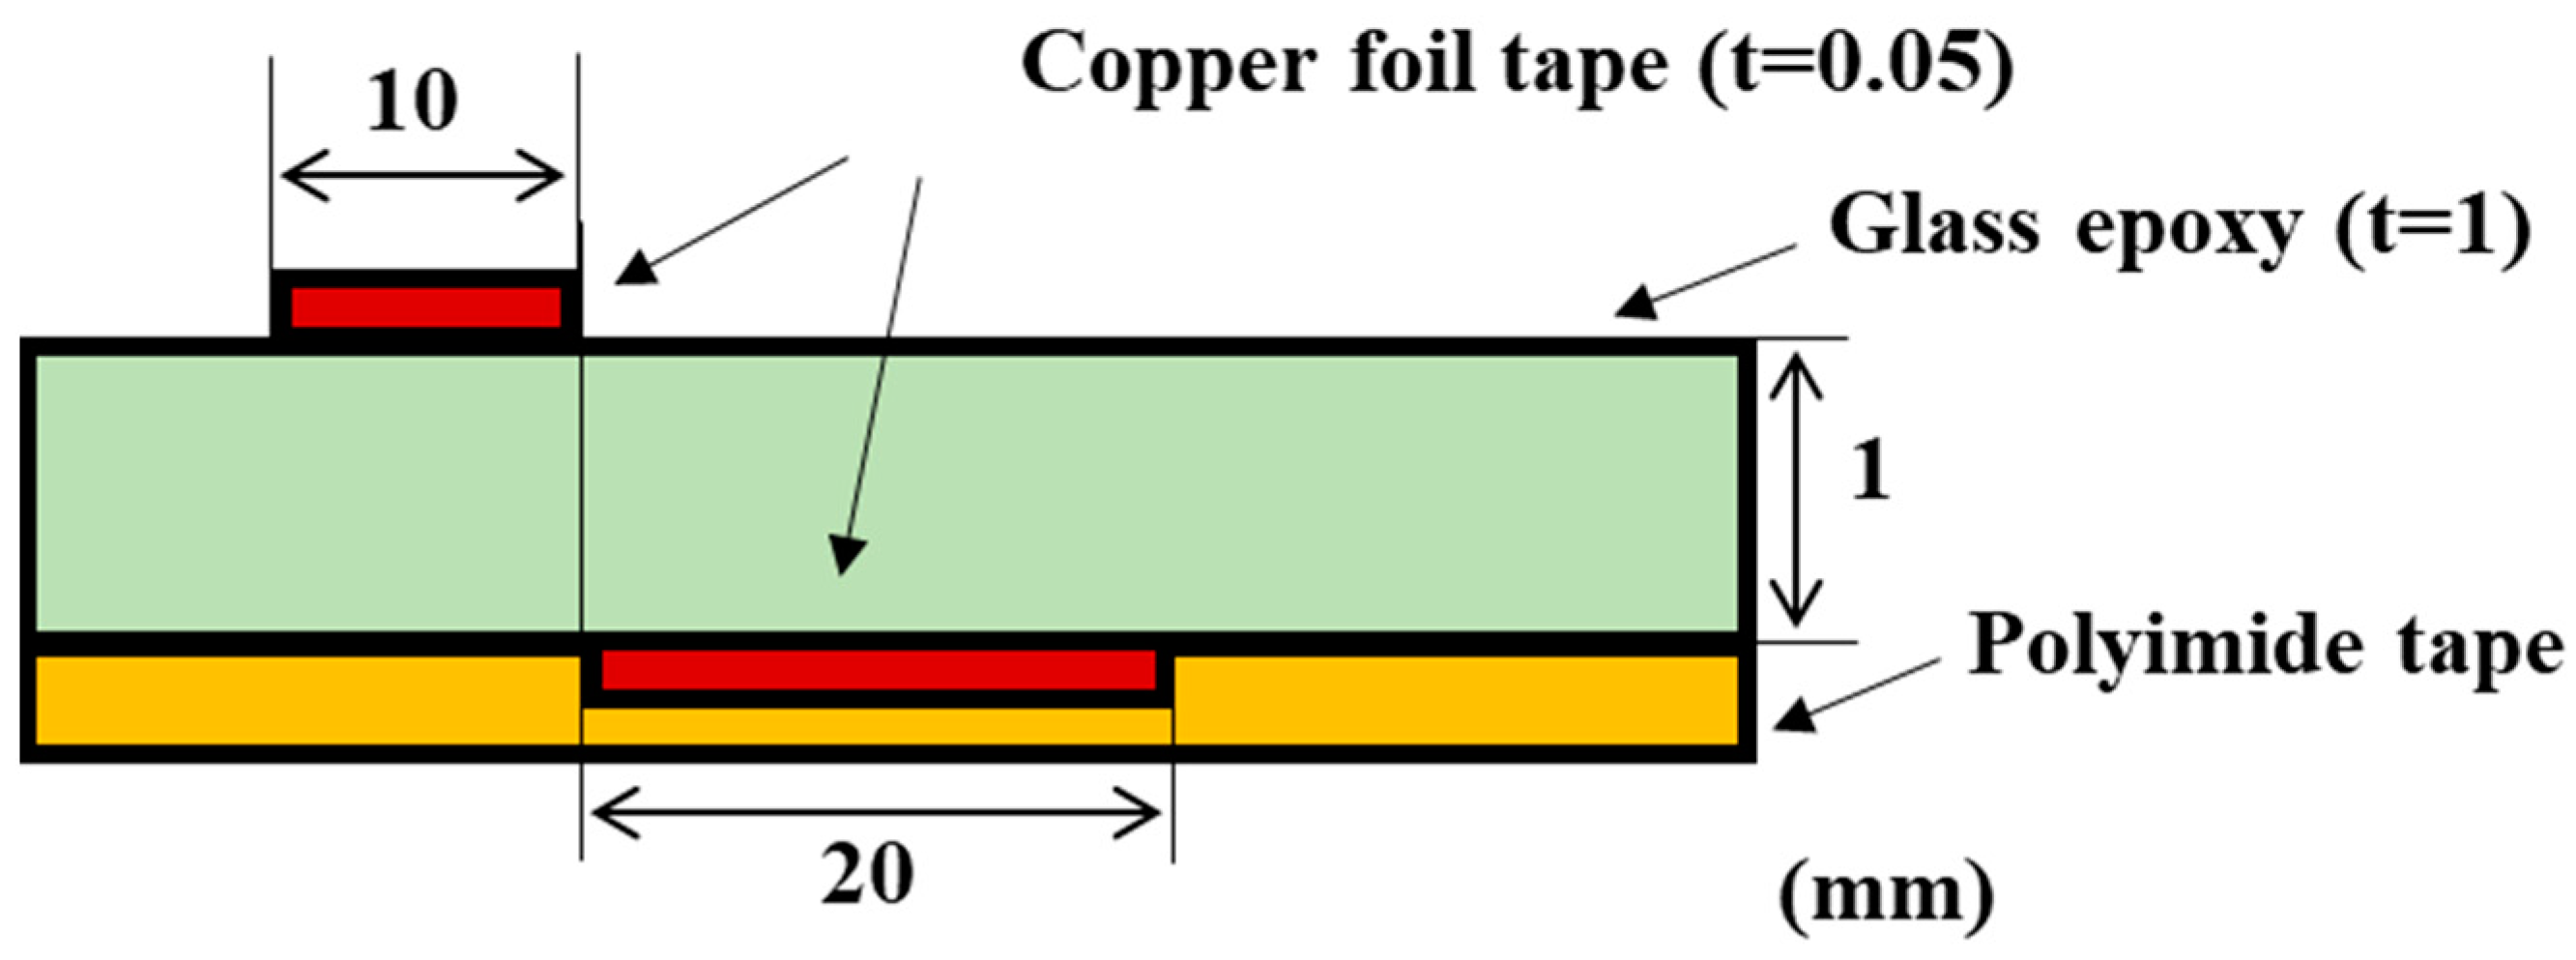
Figure 5.
Experimental setup for the PIV measurement system.
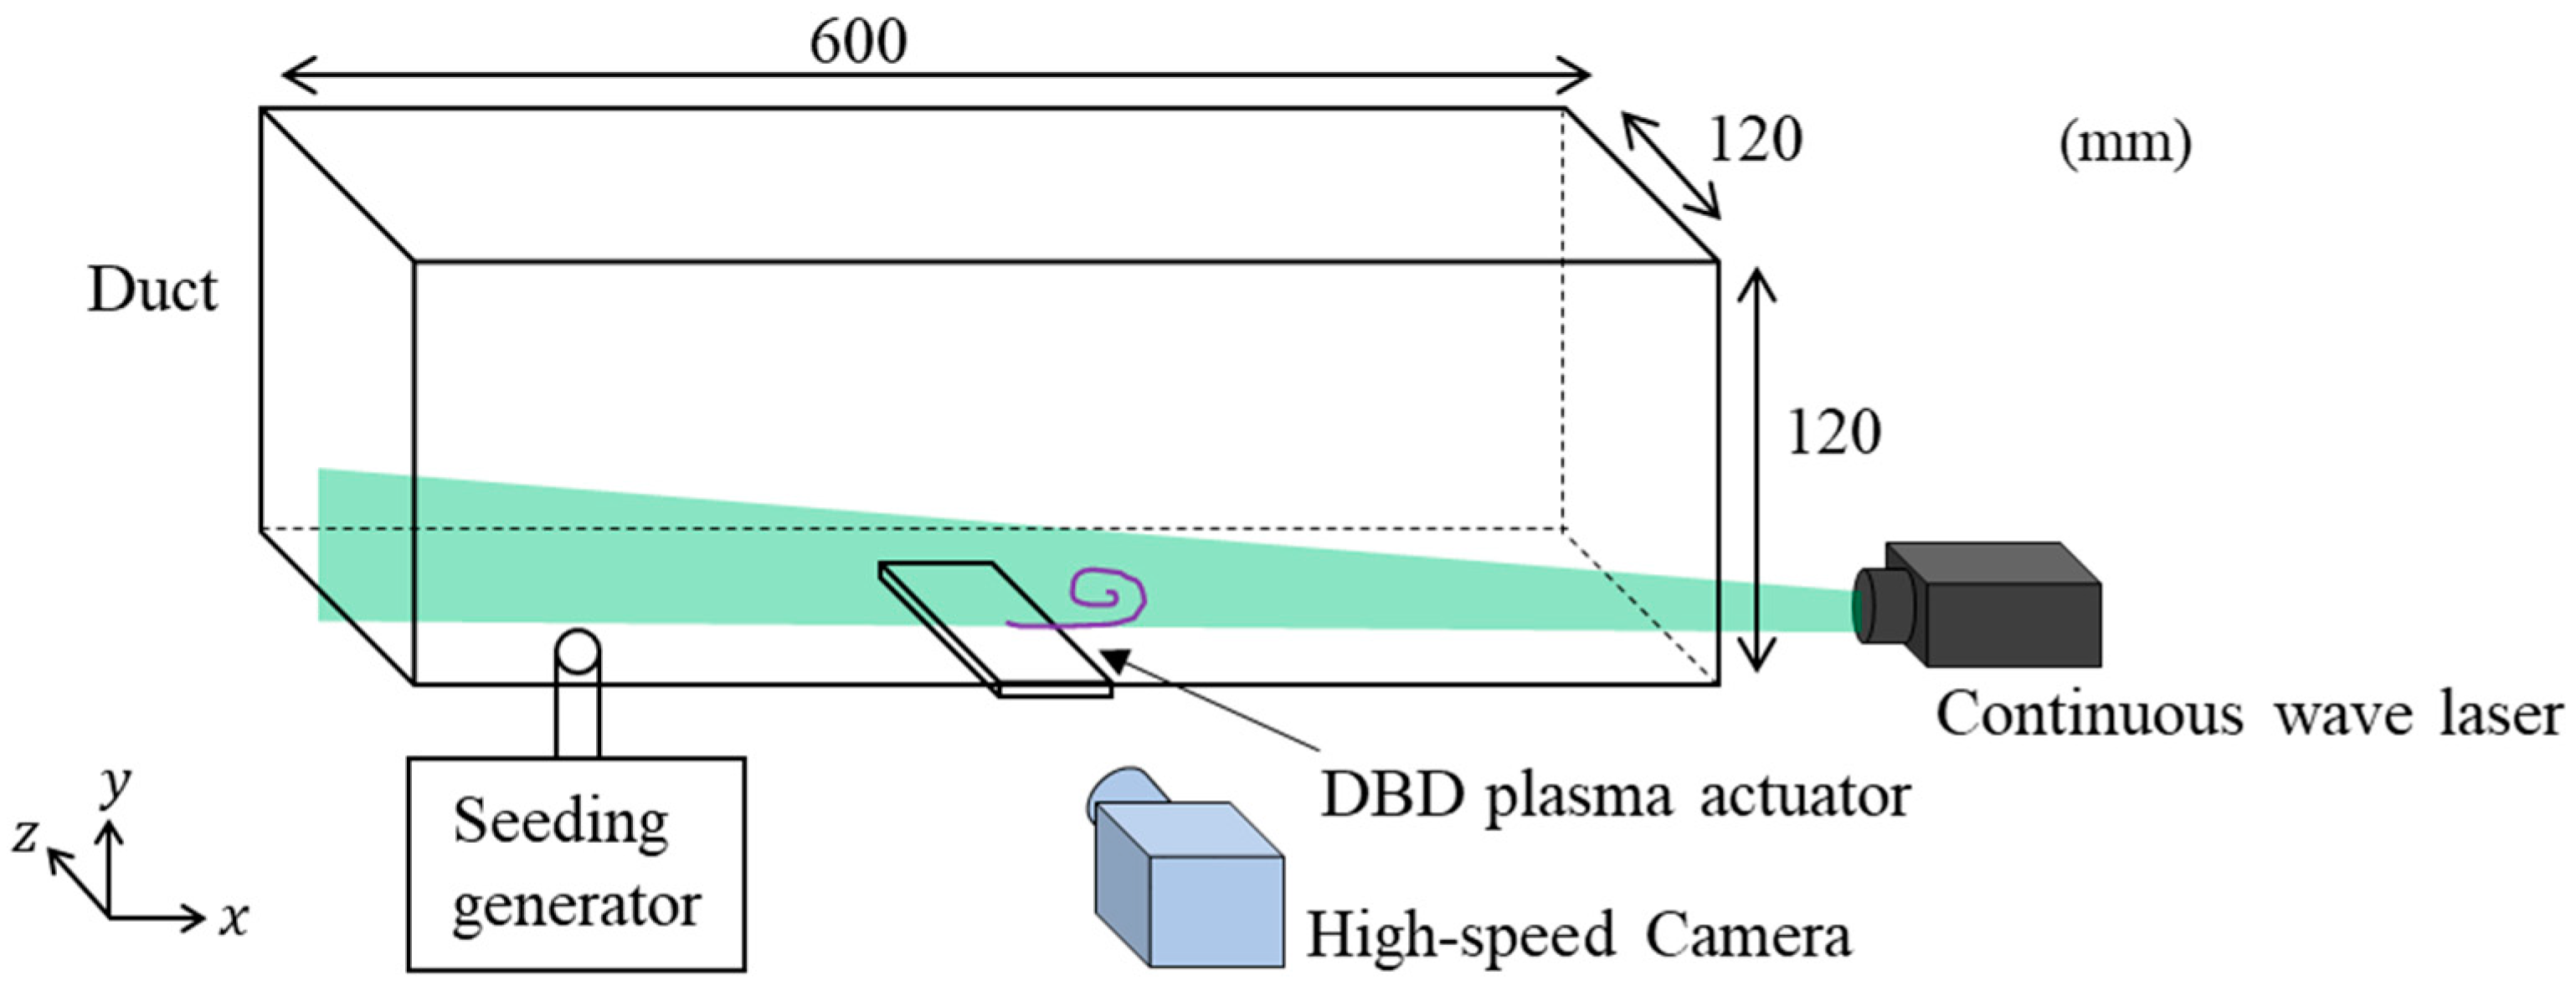
Figure 6.
Experimental setup for the BOS measurement system.
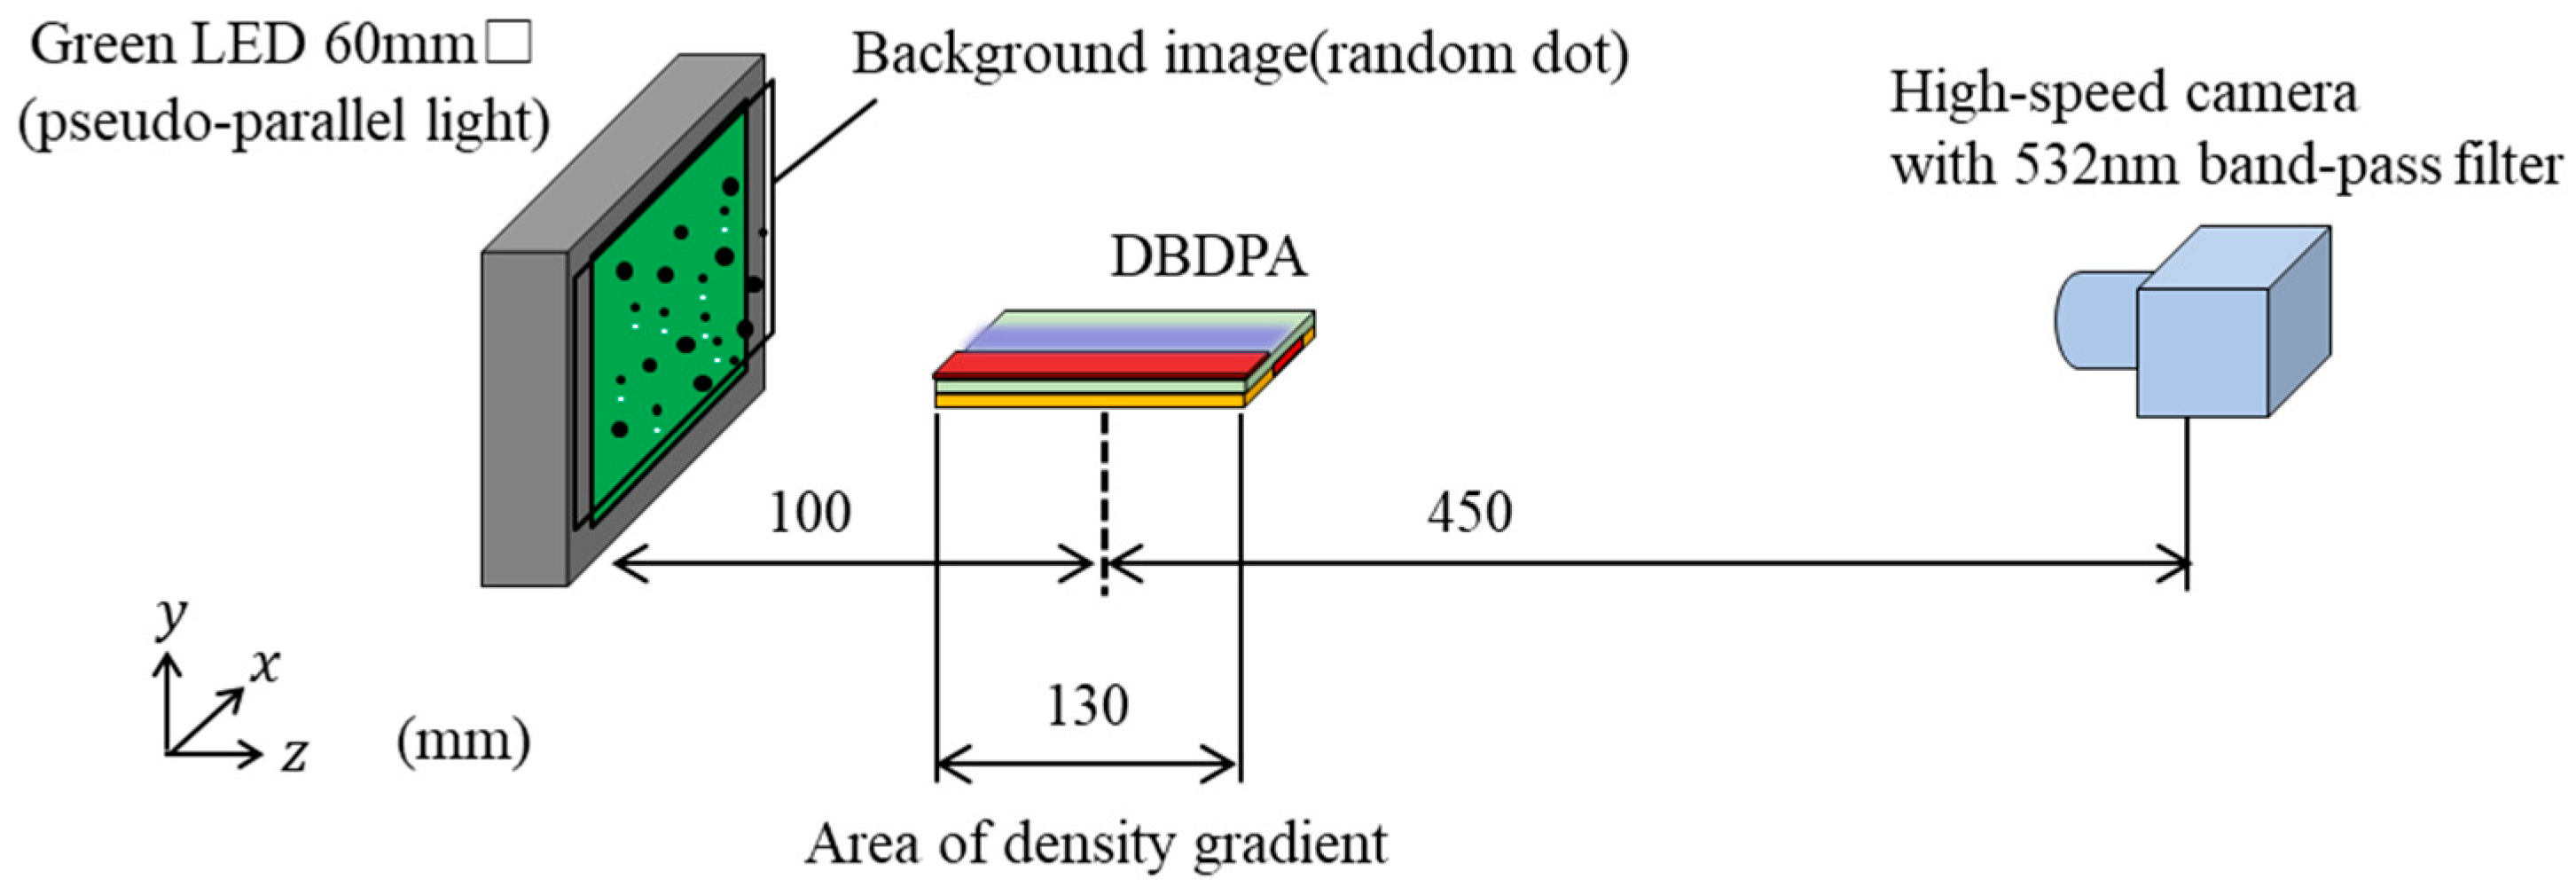
Figure 7.
Density-field contours for the case of (a) continuous operation with F = 7.2 kHz and BR = 100% and (b) burst modulation with F = 7.2 kHz, BR = 40%, and Ton = 1 ms (f+ = 400 Hz).
Figure 7.
Density-field contours for the case of (a) continuous operation with F = 7.2 kHz and BR = 100% and (b) burst modulation with F = 7.2 kHz, BR = 40%, and Ton = 1 ms (f+ = 400 Hz).
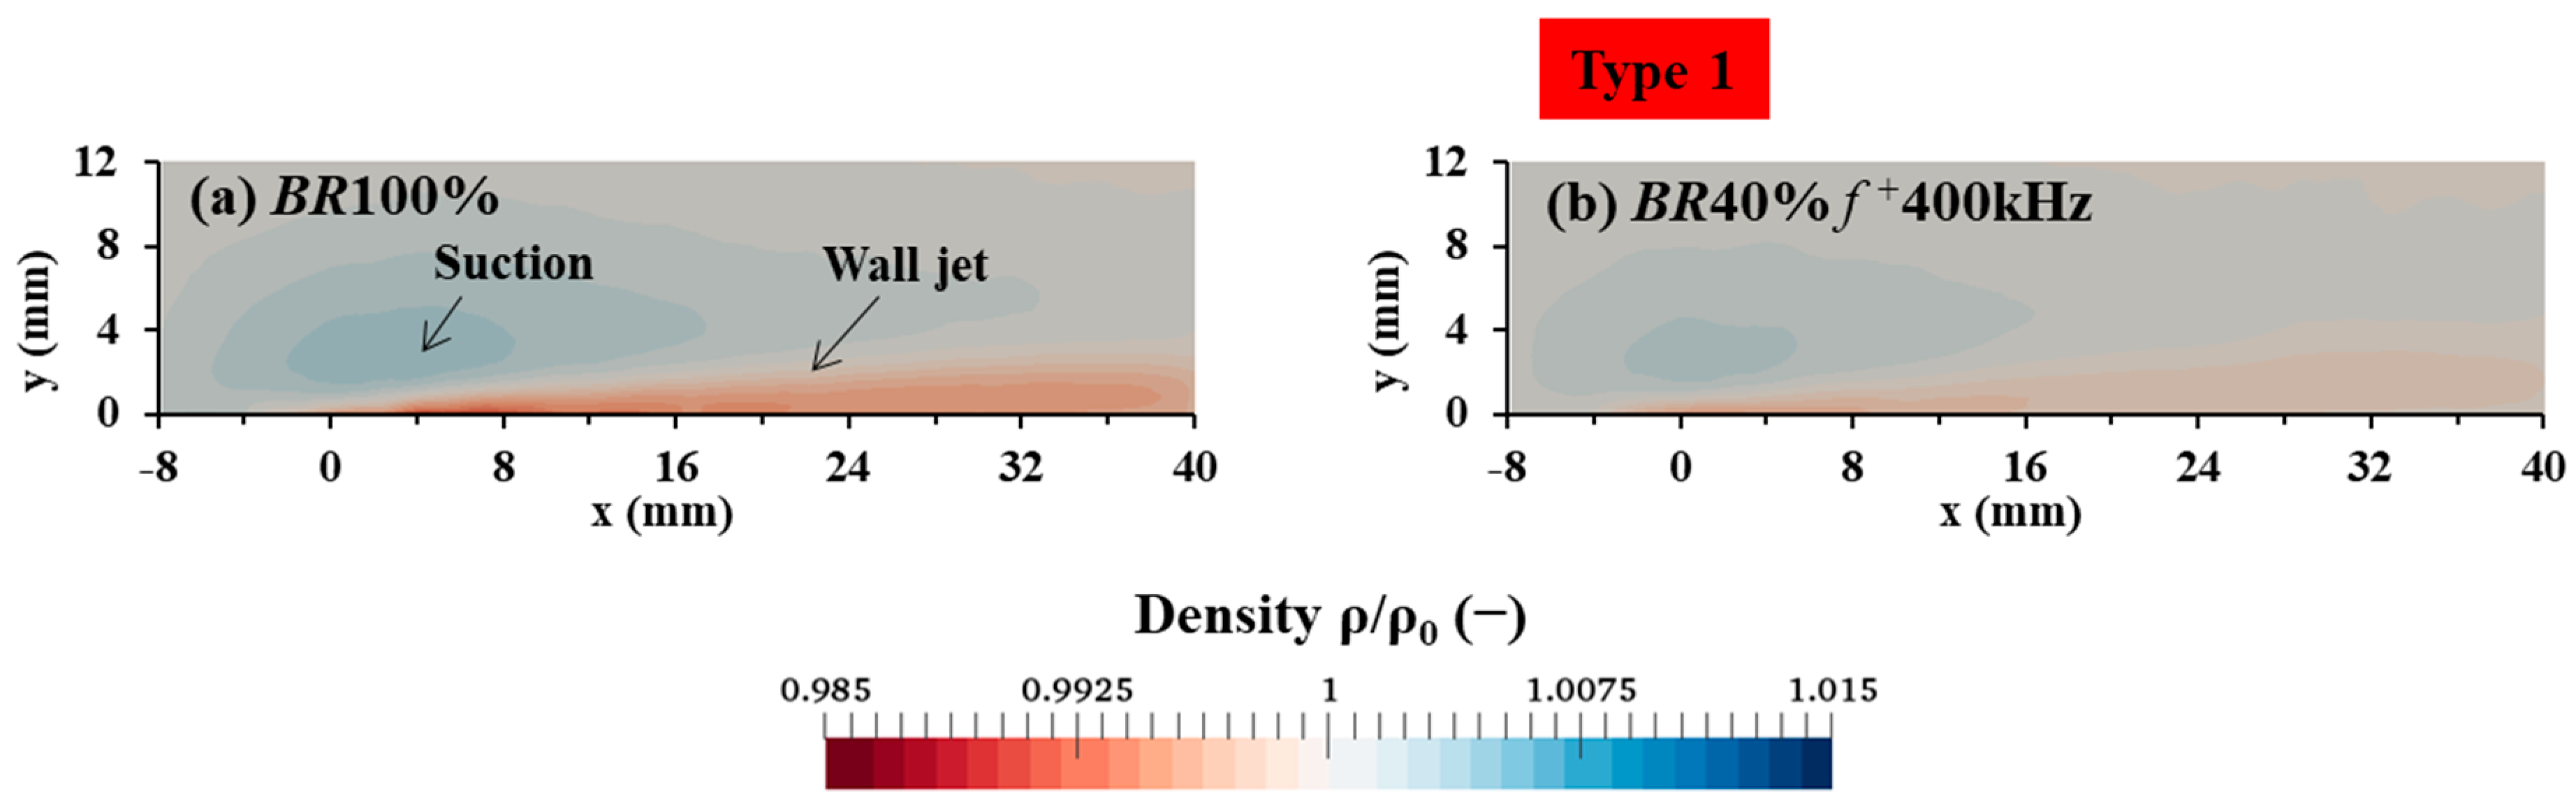
Figure 8.
Vorticity-field contours for the case of (a) continuous operation with F = 7.2 kHz and BR = 100% and (b) burst modulation with F = 7.2 kHz, BR = 40% and Ton = 1 ms (f+ = 400 Hz).
Figure 8.
Vorticity-field contours for the case of (a) continuous operation with F = 7.2 kHz and BR = 100% and (b) burst modulation with F = 7.2 kHz, BR = 40% and Ton = 1 ms (f+ = 400 Hz).
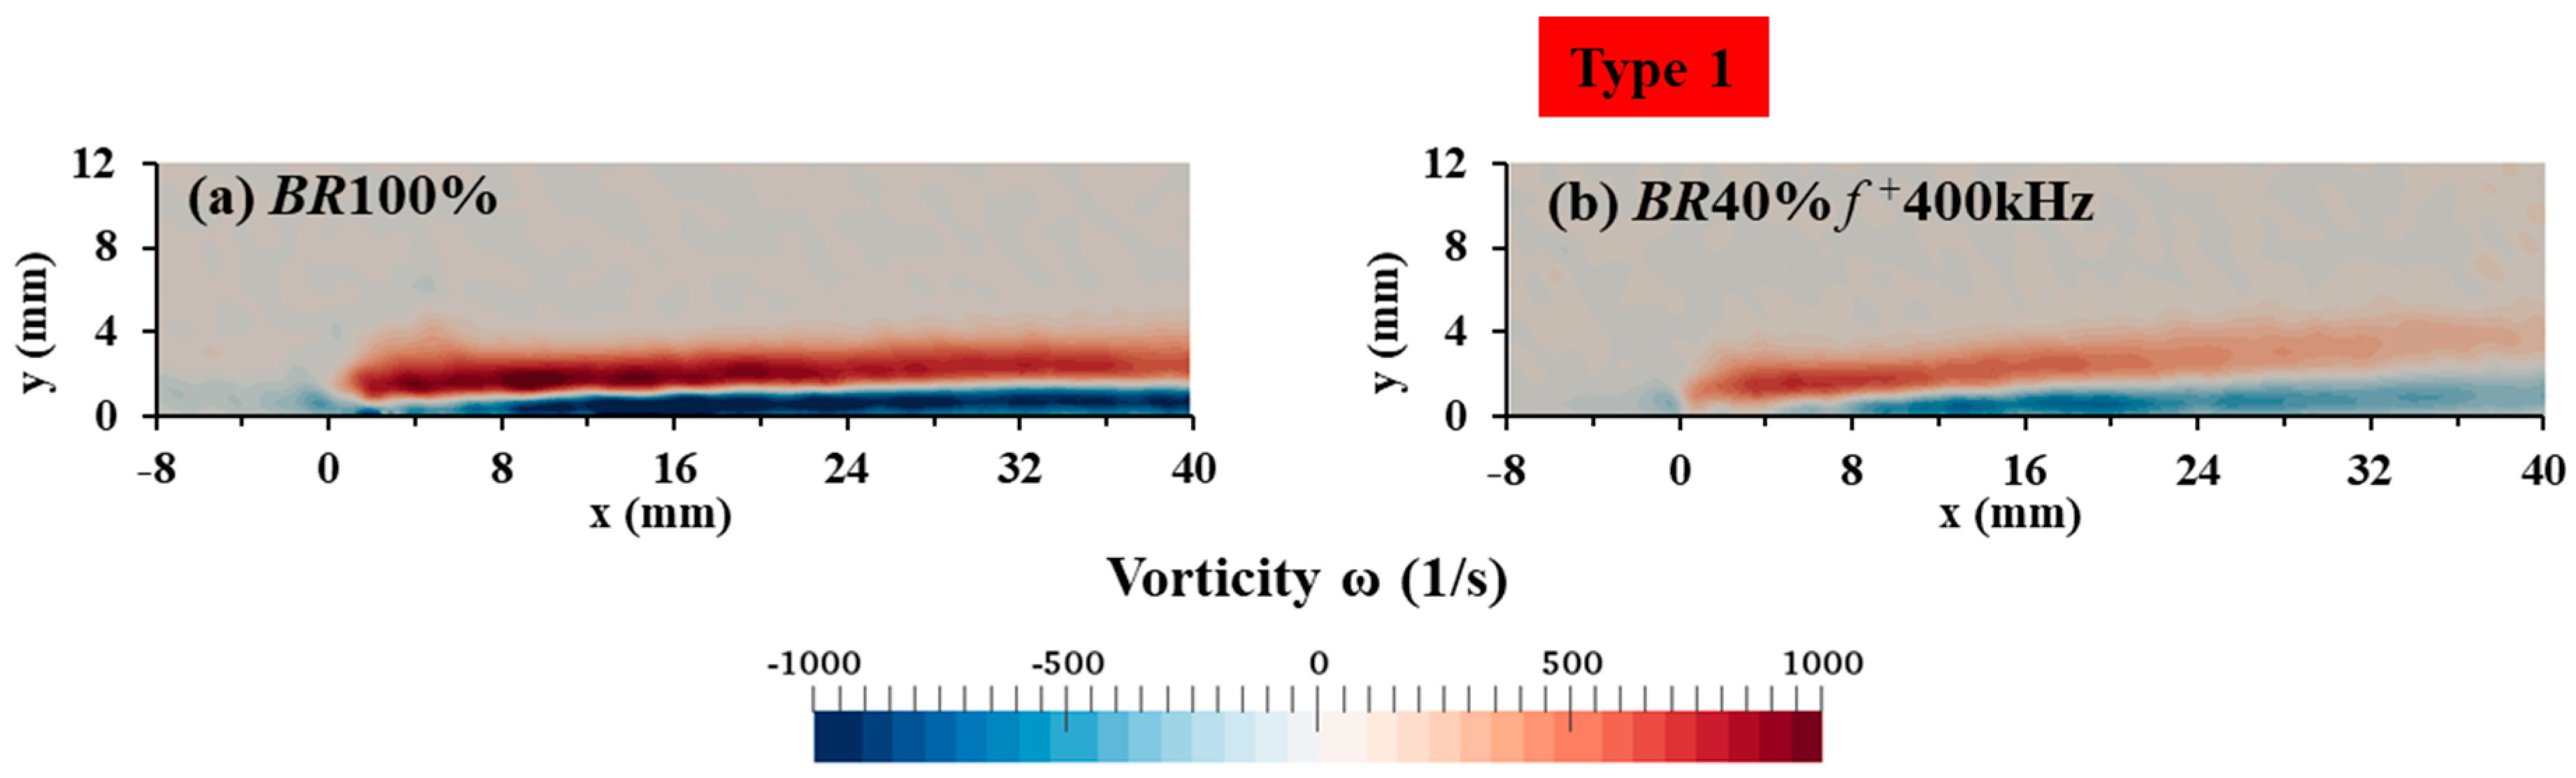
Figure 9.
Time-series of (a) density field and (b) vorticity field contours in burst modulation at F = 7.2 kHz, BR = 40%, and Ton = 2 (f+ = 200 Hz), 5, 10, 15, and 25 ms after turning on the burst signal input.
Figure 9.
Time-series of (a) density field and (b) vorticity field contours in burst modulation at F = 7.2 kHz, BR = 40%, and Ton = 2 (f+ = 200 Hz), 5, 10, 15, and 25 ms after turning on the burst signal input.

Figure 10.
Time-series of (a) density field and (b) vorticity field contours in burst modulation at F = 7.2 kHz, BR = 40% and Ton = 4 (f+ = 100 Hz), 2, 5, 10, 15, and 25 ms after turning on the burst signal input.
Figure 10.
Time-series of (a) density field and (b) vorticity field contours in burst modulation at F = 7.2 kHz, BR = 40% and Ton = 4 (f+ = 100 Hz), 2, 5, 10, 15, and 25 ms after turning on the burst signal input.
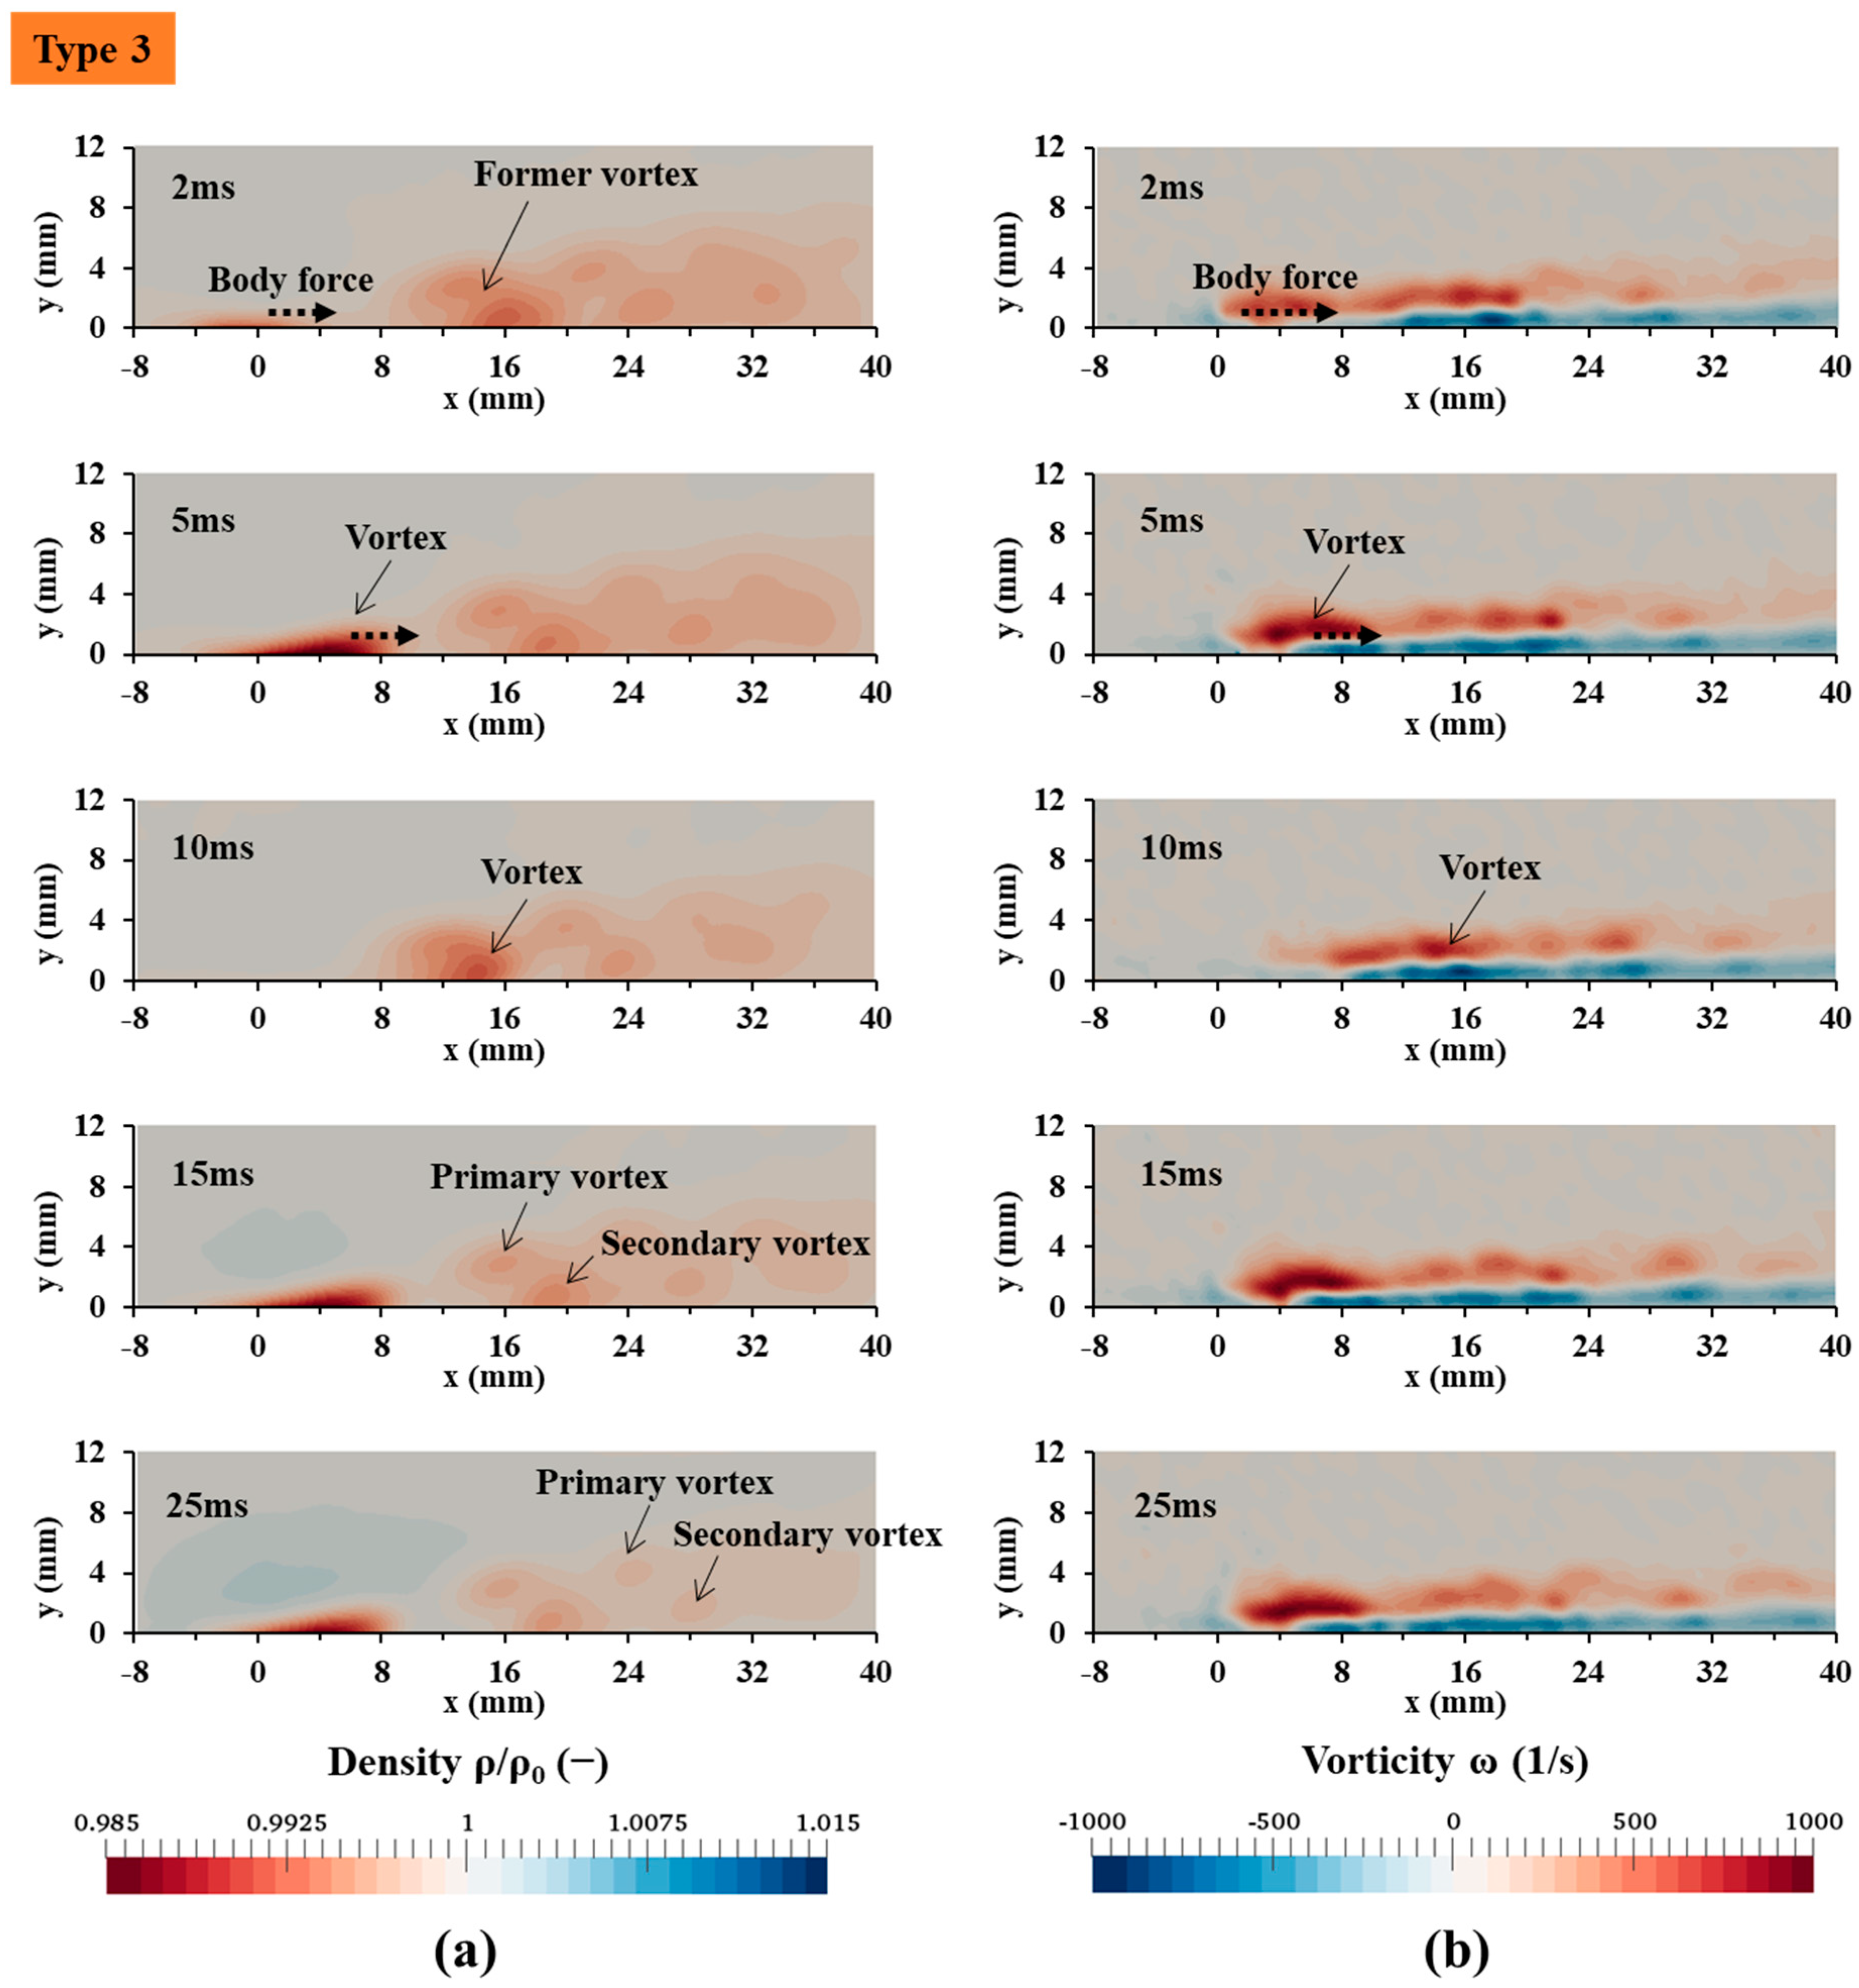
Figure 11.
Time-series of (a) density field and (b) vorticity field contours in burst modulation at F = 7.2 kHz, BR = 20% and Ton = 8 (f+ = 25 Hz), 2, 5, 10, 15, and 25 ms after turning on the burst signal input.
Figure 11.
Time-series of (a) density field and (b) vorticity field contours in burst modulation at F = 7.2 kHz, BR = 20% and Ton = 8 (f+ = 25 Hz), 2, 5, 10, 15, and 25 ms after turning on the burst signal input.

Figure 12.
Comparison of positive and negative vorticities.

Figure 13.
Comparison of positive vorticity and density.

Table 1.
Conditions for calculating the velocity field.
| Image-Correlation Algorithm | Window Deformation Iterative Multigrid |
|---|---|
| Interrogation window size | 1st: 96 pixels 2nd: 16 pixels |
| Overlapping Area | 25% |
| Field of view | 40 mm × 12 mm |
Table 2.
Conditions for calculating the displacement field.
| Image-Correlation Algorithm | Window Deformation Iterative Multigrid |
|---|---|
| Interrogation window size | 1st: 48 pixels 2nd: 32 pixels |
| Overlapping Area | 25% |
| Field of view | 40 mm × 12 mm |
Table 3.
Experimental conditions: Base frequency F (kHz), burst ratio BR, voltage input time of burst signal Ton and Burst frequency f+ (Hz); show in gray.
Table 3.
Experimental conditions: Base frequency F (kHz), burst ratio BR, voltage input time of burst signal Ton and Burst frequency f+ (Hz); show in gray.
| F (kHz); 3.6, 7.2, 14.4 | Ton (ms) | |||||
|---|---|---|---|---|---|---|
| 0.5 | 1.0 | 2.0 | 4.0 | 8.0 | ||
| BR (%) | 20 | 400 | 200 | 100 | 50 | 25 |
| 40 | 800 | 400 | 200 | 100 | 50 | |
| 80 | 1600 | 800 | 400 | 200 | 100 | |
Table 4.
Classification of flow-field patterns by density field based on the experimental conditions in Table 3, with F = (a) 3.6, (b) 7.2, and (c) 14.4 kHz. Type 1 Type 2 Type 3 Type 4
Table 4.
Classification of flow-field patterns by density field based on the experimental conditions in Table 3, with F = (a) 3.6, (b) 7.2, and (c) 14.4 kHz. Type 1 Type 2 Type 3 Type 4
| F = 3.6 (kHz) | Ton (ms) | |||||
| 0.5 | 1 | 2 | 4 | 8 | ||
| BR (%) | 20 | 400 | 200 | 100 | 50 | 25 |
| 40 | 800 | 400 | 200 | 100 | 50 | |
| 80 | 1600 | 800 | 400 | 200 | 100 | |
| (a) | ||||||
| F = 7.2 (kHz) | Ton (ms) | |||||
| 0.5 | 1 | 2 | 4 | 8 | ||
| BR (%) | 20 | 400 | 200 | 100 | 50 | 25 |
| 40 | 800 | 400 | 200 | 100 | 50 | |
| 80 | 1600 | 800 | 400 | 200 | 100 | |
| (b) | ||||||
| F = 14.4 (kHz) | Ton (ms) | |||||
| 0.5 | 1 | 2 | 4 | 8 | ||
| BR (%) | 20 | 400 | 200 | 100 | 50 | 25 |
| 40 | 800 | 400 | 200 | 100 | 50 | |
| 80 | 1600 | 800 | 400 | 200 | 100 | |
| (c) | ||||||
Publisher’s Note: MDPI stays neutral with regard to jurisdictional claims in published maps and institutional affiliations. |
© 2022 by the authors. Licensee MDPI, Basel, Switzerland. This article is an open access article distributed under the terms and conditions of the Creative Commons Attribution (CC BY) license (https://creativecommons.org/licenses/by/4.0/).
Share and Cite
MDPI and ACS Style
Emori, K.; Kaneko, Y.; Nishida, H. Comparison between Density and Velocity Fields in Burst Modulation of a Dielectric-Barrier-Discharge Plasma Actuator. Actuators 2022, 11, 340. https://doi.org/10.3390/act11110340
AMA Style
Emori K, Kaneko Y, Nishida H. Comparison between Density and Velocity Fields in Burst Modulation of a Dielectric-Barrier-Discharge Plasma Actuator. Actuators. 2022; 11(11):340. https://doi.org/10.3390/act11110340
Chicago/Turabian StyleEmori, Kenta, Yutaka Kaneko, and Hiroyuki Nishida. 2022. "Comparison between Density and Velocity Fields in Burst Modulation of a Dielectric-Barrier-Discharge Plasma Actuator" Actuators 11, no. 11: 340. https://doi.org/10.3390/act11110340
Note that from the first issue of 2016, this journal uses article numbers instead of page numbers. See further details here.