Article

Measuring Peripherality as a Proxy for Autonomous Community Coping Capacity: A Case Study from Bua Province, Fiji Islands, for Improving Climate Change Adaptation

School of Social Sciences, University of the Sunshine Coast, Maroochydore, Queensland 4558, Australia
*
Author to whom correspondence should be addressed.
Soc. Sci. 2019, 8(8), 225; https://doi.org/10.3390/socsci8080225
Submission received: 8 May 2019 / Revised: 9 July 2019 / Accepted: 25 July 2019 / Published: 26 July 2019

Abstract

:
Over the past thirty years, externally-driven interventions for climate-change adaptation in rural Pacific Island contexts have largely failed to be effective or sustained. One reason is that traditional (culturally-grounded) autonomous community coping capacity has been overlooked, many external agencies viewing all such communities as both homogenous and helpless. A community’s autonomous coping capacity can be proxied by peripherality, a measure of the degree to which a particular community in archipelagic (island) countries engages with core agendas. In order to gauge the depth, breadth and efficacy of autonomous coping capacity, three indices of community peripherality were developed from research within thirteen communities in (peripheral-biased) Bua Province in Fiji. Index 1 concerns geography (travel time/cost to town), Index 2 concerns population and employment (community size, age distribution, employment), and Index 3 concerns tradition and global awareness (mobile phones per capita, traditional/western healthcare preferences, inherent coping capacity, diet, water and energy security). Mapping of Indices 1–3 allows the nature of community peripherality in Bua to be captured using a readily-reproducible tool for rapid assessment in similar contexts. It is demonstrated that an understanding of peripherality (as a proxy for autonomous community coping capacity) can inform the design of future interventions for climate-change adaptation.

1. Introduction

Among rural communities in developing countries, research suggests that autonomous community coping with environmental shocks (from rapid-onset disasters to slow-onset manifestations of climate change) varies with peripherality. Defined as a measure of a community’s engagement with global agendas and coarsely proxied by distance from national developmental cores (Maru et al. 2014; Nunn and Kumar 2018), peripherality is a measure that is commonly used in economic geography at a range of scales from the local to national-regional to global (e.g., Copus et al. 2008; Mao et al. 2014; Sofer 2015; Wallerstein 2004). The principal utility of such models has been the ready characterization of uneven development, whether this refers to such factors as income and investment potential, education and opportunity, or global networking through communications. Although large-scale spatial planning invariably glosses over intra-regional differences, the importance of more accurate spatial data, to capture diversity and inform policy, has become increasingly acknowledged (Lu and Fan 2010; Seltzer and Carbonell 2011).
This paper reports on how the effectiveness and sustainability of climate-change interventions in rural island communities might be improved by understanding and acknowledging their autonomous coping capacity, something that can be achieved by measuring their peripherality. The study area is part of the Fiji archipelago (Southwest Pacific) and comprises communities strung out along a core–periphery gradient. In recent years, many of these communities have experienced livelihood impacts consistent with the effects of climate change, which is expected to have even more profound livelihood impacts in this part of the world in the future.
Over the last thirty years, there have been numerous interventions for climate-change adaptation in Fiji and other Pacific Island countries. Externally designed and funded, most such interventions have failed in the sense that, when measured objectively, they have neither achieved their medium-term goals nor have they been sustained (McNamara 2013; Nunn 2009). While there may be many reasons for this (Piggott-McKellar et al. 2019a), it seems likely that failure is largely due to a lack of sustained community support (human and financial) for particular external interventions, something that in turn is attributable to a lack of understanding by those designing these interventions about community coping capacity, aspirations and worldviews (Nunn et al. 2016; Oakes 2019). Many attempts at underwriting the costs of climate-change adaptation in such situations assume that all communities are the same—that ‘one size fits all’—when in fact there is a significant diversity in the nature of communities and their ability to adapt, either autonomously or assisted (Nunn et al. 2014).
With the goal of improving the efficacy of external interventions for climate-change adaptation, this paper proposes that effective measurement of the peripherality of a particular community, which proxies its autonomous coping capacity, will permit such interventions to be tailored to its particular strengths and weaknesses, compared to others. To test this proposition, a series of 13 rural communities in western Bua Province in Vanua Levu Island, (Figure 1), the second largest in Fiji and an area representative of many rural (peripheral) parts of Pacific Island countries, was studied in depth. Data obtained allowed the development of indices to measure community peripherality that proxy autonomous coping capacity.

2. The Study Area

Fiji is an archipelago in the tropical Southwest Pacific that has been inhabited for more than three millennia. Despite almost half of its ~895,000 people living in towns and cities, mostly on the largest island (Viti Levu), some 90 islands are inhabited. Most income is generated and earned in core (urban) areas where population densities are highest. In contrast, many peripheral (rural) communities are subsistence-focused, often participating only marginally in the cash economy. Successive governments have funded improvements to rural living, including a network of schools and health centres, better access to clean drinking water and electricity, more opportunities for income generation (especially in agriculture and fisheries), and a reliable transport infrastructure.
Such interventions have made rural Fiji life more attractive but such gains are threatened by climate change (and ‘natural’ disasters) which has the potential to force a fundamental reconfiguration of how and where people live in island countries like Fiji and developing countries more generally. The effects of rising temperatures over the past few decades have become manifest in Fiji, especially in terms of their impacts on coral reefs which are key to coastal subsistence. Yet it is the associated sea-level rise that has had the most visible and widespread impacts in Fiji; the current rate of sea-level rise in Fiji is about 5.5 mm/year, almost twice the global mean (Dangendorf et al. 2017). These effects include shoreline erosion and increasing instances of coastal-lowland flooding as well as groundwater salinization (Nunn 2013). Over the last 20–50 years, the combined effect of these processes has resulted in a progressive loss of (usable) coastal land which has impacted livelihoods in rural areas like those in the study area in and off western Vanua Levu Island (Charan et al. 2017; Dumaru 2010; Martin et al. 2018; Piggott-McKellar et al. 2019b).
It would be wrong to suggest that climate change is the sole stressor on livelihoods in Fiji or even the principal driver of societal change in all its rural parts. Globalization has made steady ingress into rural Fiji, shuffling decision-making priorities and exposing people to new information that is leading to a subordination of traditional goals and knowledge (Brown et al. 2017; Janif et al. 2016). Yet climate change is likely to overshadow such changes in the next few decades unless its likely manifestations are anticipated and their impacts minimized through effective and sustained adaptation.
The study area in western Vanua Levu Island falls wholly within the province of Bua (Figure 1), which is governed at subnational level by the District Office that falls under the Commissioner Northern’s Office. Dominated by iTaukei people (79% in 2007 Census), much effective control on development in Bua is exercised by the Bua Provincial Council and traditionally through the chiefly hierarchy. Whether on the main island or a smaller one, most people in Bua live along its coasts and subsist at least in part from foods that they produce or acquire from their own land as well as nearshore (ocean) areas; coral-reef and mangrove ecosystems are key to most subsistence livelihoods. The Labasa-Nabouwalu highway—the only sealed road on Vanua Levu Island—runs through Bua. There is a full-service hospital in Labasa, a sub-divisional hospital in Nabouwalu, and a scatter of ‘nursing stations’ with a resident medical professional.
Of the 13 communities studied (see Figure 1), three are on smaller islands (Denimanu, Galoa, Yaqaga), two are on the main island but without road access (Logana and Naivaka), five have weather-dependent road access (Driti, Koroinasolo, Naviqiri, Navunievu and Tacilevu), two are ten minutes drive on reliable roads from the highway (Dalomo, Tausa), while the last straddles the highway (Lekutu). The closest ‘core’ place to all these communities is Labasa Town, the largest urban centre on Vanua Levu Island.

3. Methods

The first stage of research (Section 4.1) was to measure simple peripherality of the thirteen Bua communities using various measures of distance of each along the core–periphery gradient (community—Labasa) in this part of Fiji.
The second stage (Section 4.2) was to obtain answers from each community to a series of wide-ranging questions that would allow calculation of a range of proxies for community peripherality in Bua. Incorporating lessons from comparable peripherality research (notably Beer 2004; Copus et al. 2008), a questionnaire (Supplementary Materials) was developed that asked about eight distinct aspects of life in each target community in Bua: population and economy; transport and infrastructure; government services and education; health; communications and technology; culture, tradition and religion; climate, disaster prediction and response; water, diet and food production. In using the results from this to develop key peripherality proxies, it is important to bear in mind that the goal was to develop a simple yet effective way of measuring peripherality that might eventually be employed by persons wanting a rapid (rather than time-consuming) measurement of this.
The third and final stage (Section 4.3) was to develop peripherality indices and to then demonstrate their efficacy as measures of autonomous community coping in Buan communities.
All data were collected by the authors using one or more indigenous languages in cultural contexts in which community members were comfortable. As is common practice in rural Pacific Island communities, base data about a particular community were generally supplied by the turaga-ni-koro (headman), the usual custodian of such information, who also signed an Informed Consent form on behalf of all community members, ethically acceptable practice in such situations. Other questions were answered during group discussions. Typically involving ceremonial-social kava consumption, these groups generally comprised 6–20 adult males and females with two or three pre-designated spokespeople. Some questions elicited debate within the group, occasionally allowing an individual to recount a particular anecdote. In some cases, questions were asked separately of key community members, particularly the nurse, the schoolteacher/s, the church minister, or elders whose store of traditional knowledge tends to be much greater than that of community members aged fifty and under. Group discussions lasted three to four hours in most cases; interviews with key individuals usually lasted less. Discussions with community members were supplemented with observations of the community and the way it functions.

4. Results and Analysis

As explained above, this research was divided into three stages, each discussed in a subsection below.

4.1. Measuring Peripherality by Distance along the Core–Periphery Gradient in Bua

The purpose of this section is to measure distance along the core–periphery gradient that exists for Bua communities relative to the core location of Labasa. Straight-line and actual distances are shown in Table 1 and are simple measures of peripherality implicit in many comparable studies. Yet in Bua, travel along different parts of particular routes is not able to be carried out at the same rate. The only sealed road in the area, the Labasa-Nabouwalu highway (see Figure 1), can be reached by people from most Buan communities only if unsealed road or cross-ocean (not exclusively river) boat journeys are first taken. Many unsealed roads are periodically washed out or blocked by landslides, particularly after storm rains, or otherwise rendered impassable except by specialized vehicles; thus the risk involved in depending on them is higher than for sealed roads. Likewise, all boat travel in the area utilizes fibreglass ‘punts’ with outboard motors that periodically break down or sometimes cannot take to sea because of rough conditions that may endure for several days; the risk of utilizing these is considered four times higher than use of sealed roads, and significantly more than unsealed roads along which people can walk (or ride horses) if required. Thus, weighted distances in Table 1 acknowledge the portions of the journey (in 2016–2017) on sealed roads (unweighted), unsealed roads (weighted × 2) and by boat (weighted × 4). The authors used their expert judgement to determine these weightings, based on a combined 70+ years acquaintance with rural Fiji communities.
Straight-line distance is quite distinct from actual and weighted distances (Table 1). All three distance measures are used to evaluate potential proxies in the following section.

4.2. Identifying Proxy Measures of Peripherality for Bua Communities

It is expected that the closer the community is to town, the better its access to services and markets, (government) outreach, and information. Conversely, the further a community is from town, it is more likely to be globally uninformed/unaware although it might have considerable autonomous (traditional) coping ability (Nunn and Kumar 2018). Results are presented for each of the eight sections in the questionnaire below and in more detail in Appendix A.
In Bua, for population and economy, there is no simple relationship between community size and distance from core. There is a strong relationship between the numbers of people >65 years and distance from core, signalling a potential for traditional knowledge to be preserved, passed on to younger people, and utilized (as in the past) to autonomously cope with environmental challenges. Like peripheral communities in developing countries elsewhere, where in-situ opportunities for paid employment are few, many in Bua are dominated by grandparents and grandchildren because adults of working age are living and employed elsewhere. In terms of transport and infrastructure, accessing cores from peripheral communities generally becomes more time-consuming and expensive with distance. Similarly, issues of clean drinking water and affordable regular electricity supply often become more acute with increasing peripherality. Conversely, a lack of environmental pollutants in more-remote areas often means that their communities have cleaner water than those in less-remote areas where polluting activities are greater; the use of fertilisers and pesticides is a good example. Additionally, in many more-peripheral communities, often with government aid, household solar systems are becoming common; these typically involve a single pole-mounted panel (300-watt) beside each dwelling, enough to power an overnight light and daily charge small devices.
The nature of government services and education is less clearly linked to peripherality because of the existence of schools and health centres in many peripheral areas. In addition, the fact that schooling is free means that the uptake is high throughout Bua irrespective of peripherality. It was found that persons gaining tertiary qualifications did not normally return to their home communities during their working lives. For many rural Fiji communities, such as those in Bua, education is an investment not only for an individual and their family but also for the entire community (Kline et al. 2013). It has been noted that traditional methods of decision-making, especially related to environmental governance, in rural Pacific Island communities and others are becoming increasingly recognized as inadequate to deal with modern challenges, such as those associated with climate change (Kuruppu and Willie 2015; Nunn et al. 2014; Williams and Hardison 2013). It has also been argued that building national capacity in developing countries, such as most in the Pacific Islands region, does little to inform or improve environmental decision-making in their rural parts; in other words, in-country capacity for effective management of climate change, for example, focuses on the most densely-populated (core) areas rather than on their commonly vast peripheries. It seems likely that this situation will continue into the future, meaning that a priority for adapting to climate change in places like Bua is to empower communities to make decisions about their (environmental) futures that are both science-informed and effectively localized (Scott-Parker and Kumar 2018).
In terms of health, while community-based health centres were routinely accessed, the time and cost involved in reaching hospital facilities in town often proved prohibitive. Traditional remedies, sometimes prepared by specialist healers, were widely used, especially in more peripheral communities although the inefficacy of these remedies for treating ‘new’ ailments (like NCDs) is leading to a loss of trust in them. Questions about communications and technology found that, while many people in Buan communities are linked (mostly through phones) to internet, this is used mostly for social (rather than formal information acquisition) purposes. Radio remains the most widespread medium for knowledge transfer accessed in Bua as televisions are expensive and signals often unreliable. In terms of culture, tradition and religion, all people in Bua routinely utilize practices that could be regarded as ‘culturally-grounded’ in the sense that they derive from historical precedent; these range from house-building to food acquisition to coastal protection. All people in Bua are also religious to an extent where much everyday decision-making is spiritually informed; examples include food acquisition and consumption, the development or sustaining of familial/clan alliances, and a range of healing methods. All communities have some degree of climate, natural disaster prediction and response that is a legacy of their history. That said, in most communities, externally-sponsored responses (from Government or other external agencies) are often privileged, both on the grounds of perceived efficacy and ease. For example, when tropical cyclones approach, the people of Naivaka “want to trust what our ancestors told us but we listen to the radio”, a sentiment symptomatic of the subordination of traditional knowledge, at least at community (rather than household) level in many Buan communities. Finally, for diet and food production, it is clear that the more peripheral a particular community, the greater the amount of locally-produced food it consumes. Conversely, the closer a community is to ‘town’, the more imported (often nutritionally-poor) food it consumes. This situation is amplified by the opportunities for less-peripheral communities to grow/sell cash/surplus crops and to use the proceeds to buy (rather than grow) the food they routinely consume.
For the purpose of calculating easily-usable proxy measures of peripherality, data were reviewed in order to identify just a few variables likely to allow the rapid/simple measurement of peripherality in Bua and comparable island contexts in the Pacific. Some measures that were initially anticipated to be good measures of peripherality proved otherwise; straight-line distance from community to core is one such example, the routine cost of travel to school (paid by government) another. Some groups of questions yielded information that appears to have no bearing on the comparative peripherality of a community, so data analysis focused only on those that did measure this.
A practical proxy for accessibility of core areas is time/cost taken to reach these from particular communities. This is not something readily measured by straight-line distance but rather how communities engage with the various challenges of crossing a particular distance, challenges whose magnitude will determine how often they (can/might) access services available only in core areas. These two variables (time and cost) form the basis of Index 1, discussed in Section 5.
While it is difficult to justify excluding community size from any peripherality measure, notwithstanding its indifferent correlations with distance, a better measure of the nature of a particular community is found in the proportion of residents younger than 21 and those older than 65 (a dependency ratio). Rather than household income, which has only low correlations with distance, the proportion of community residents in fulltime employment was found to be a better measure of engagement with ‘core’ opportunities. While it is not particularly robust for Bua (where most communities have no residents in fulltime employment), this is considered a variable that would show up peripherality at larger scales, such as for the entire island of Vanua Levu. These variables (community size, dependency ratio, proportion employed fulltime) form the basis of Index 2, discussed in Section 5.
Finally, it was found that there is a number of variables which measure peripherality by the types of knowledges routinely used/accessed for decision-making by communities that in turn help identify their resilience-dependence character, something critical to measuring peripherality in many contexts (Felzensztein et al. 2013; Nunn and Kumar 2018). The number of mobile phones per capita, while admittedly not adequately capturing global knowledge access/use in Bua, is nevertheless considered key to measuring peripherality; a stage is likely to be reached in the future when novelty/social uses of mobile phones may be replaced by largely practical ones (Walshe et al. 2018; Watson and Duffield 2016). The use of (and implicit trust in) traditional versus ‘western’ healthcare is also considered a measure of actual peripherality (rather than simply distance along a core–periphery gradient). Similarly, the existence (or not) of locally-grounded traditional knowledge for coping with environmental shocks, whether short-onset (disasters) or longer-onset (like climate change), is considered a sound measure of peripherality. Diet is also considered as a measure of actual (rather than crude distance-measured) peripherality, specifically the degree of both access to and consumption of non-local foods by community members; the more peripheral a community, the less imported food it consumed. Finally, peripherality was considered measurable by the water and energy security of a particular community, especially the reliability, quality and quantity of drinking water and the ways the community produces electricity. These five variables (mobile phones, traditional medicine, traditional coping, diet, water and energy security) form the basis of Index 3, discussed in Section 5.

4.3. Development of Peripherality Indices

The dataset obtained for the 13 communities in Bua is intended to allow the formulation of quantitative indices that can be used to measure peripherality among (non-urban) communities in (archipelagic) Pacific Island and other developing-nation situations. Based on the findings above, three peripherality indices have been developed. The first index deals with Geography, the second with Population and Employment, the third with Tradition and Global Awareness. The ways in which these three indices are calculated are explained in Appendix B.

5. Discussion

The first part (Section 5.1) of this Discussion assesses the robustness of Indices A–C by demonstrating their relationships with various distance measures (from Table 1). The second part (Section 5.2) of this Discussion maps Indices A–C, which confirms that they capture distance-modulated peripherality yet also hints at the presence of complexities within the dataset that are likely attributable to small sample size and an unanticipated attractiveness of certain peripheral communities, especially for income generation from fishing. The final part (Section 5.3) of this Discussion links peripherality to autonomous coping capacity and argues that peripherality measurements are useful tools for assessing both a community’s needs and its strengths (for challenges like climate change) in such contexts.

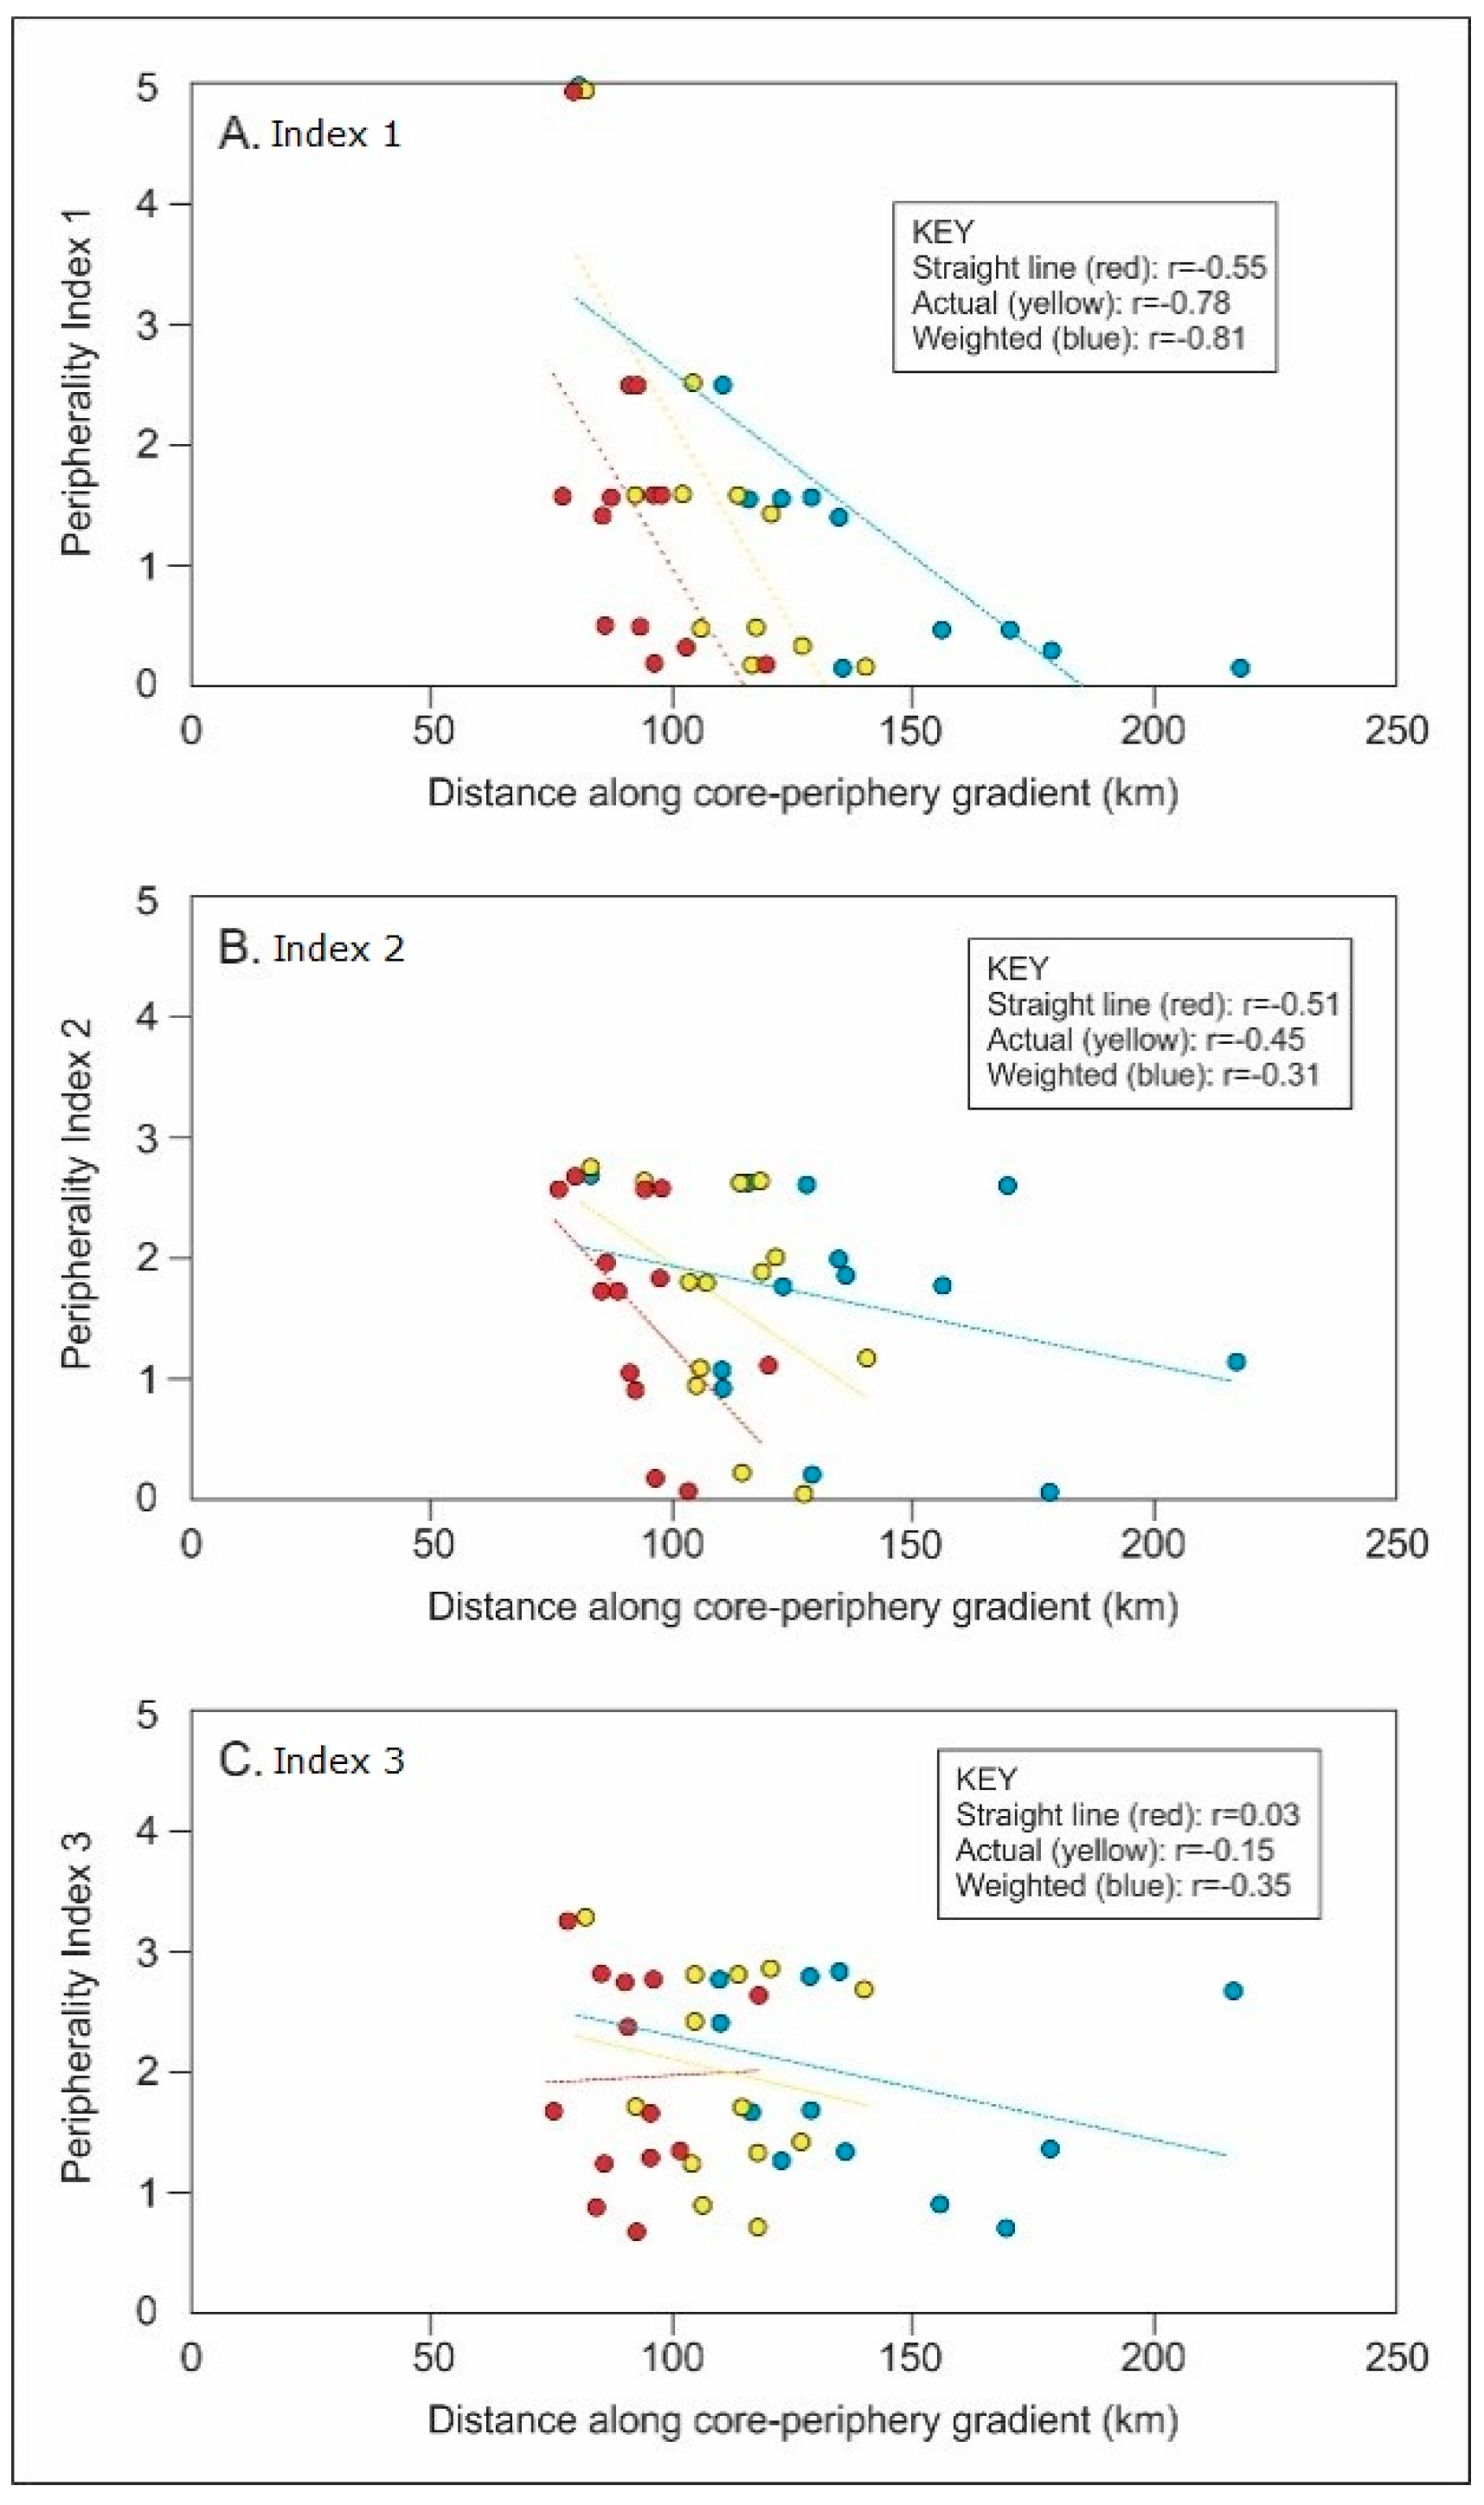
5.1. Relating Indices A–C to Distance along Core–Periphery Gradient

Data used to calculate Indices A–C are tabulated in Table 2 and plotted against the three distance measures in Figure 2.
Figure 2 shows that the three peripherality indices calculated are robust proxies for peripherality measured by distance, given the generally strong negative correlations exhibited. Of the three indices, the strongest correlations (−0.55, −0.78 and −0.81) are shown by Index 1 (Figure 2A); the lower the Index 1 value, the great the peripherality of a particular community. This is unsurprising, given that travel time and cost are expected to be linked to distance, yet it affirms the use of these variables to measure peripherality in places like Bua. Index 2 (Figure 2B) also shows strong correlations (−0.51, −0.45 and −0.31) that again confirm the validity of the three variables used to calculate this index as measures of peripherality. Aside from straight-line distance, similar comments apply to the correlations (Figure 2C) between distance and Index 3 (−0.15, −0.35), justifying the use of the variables behind it. With this validation of variables selected to measure peripherality in Bua, it is now possible to discuss the precise nature of this phenomenon here and its practical applications.

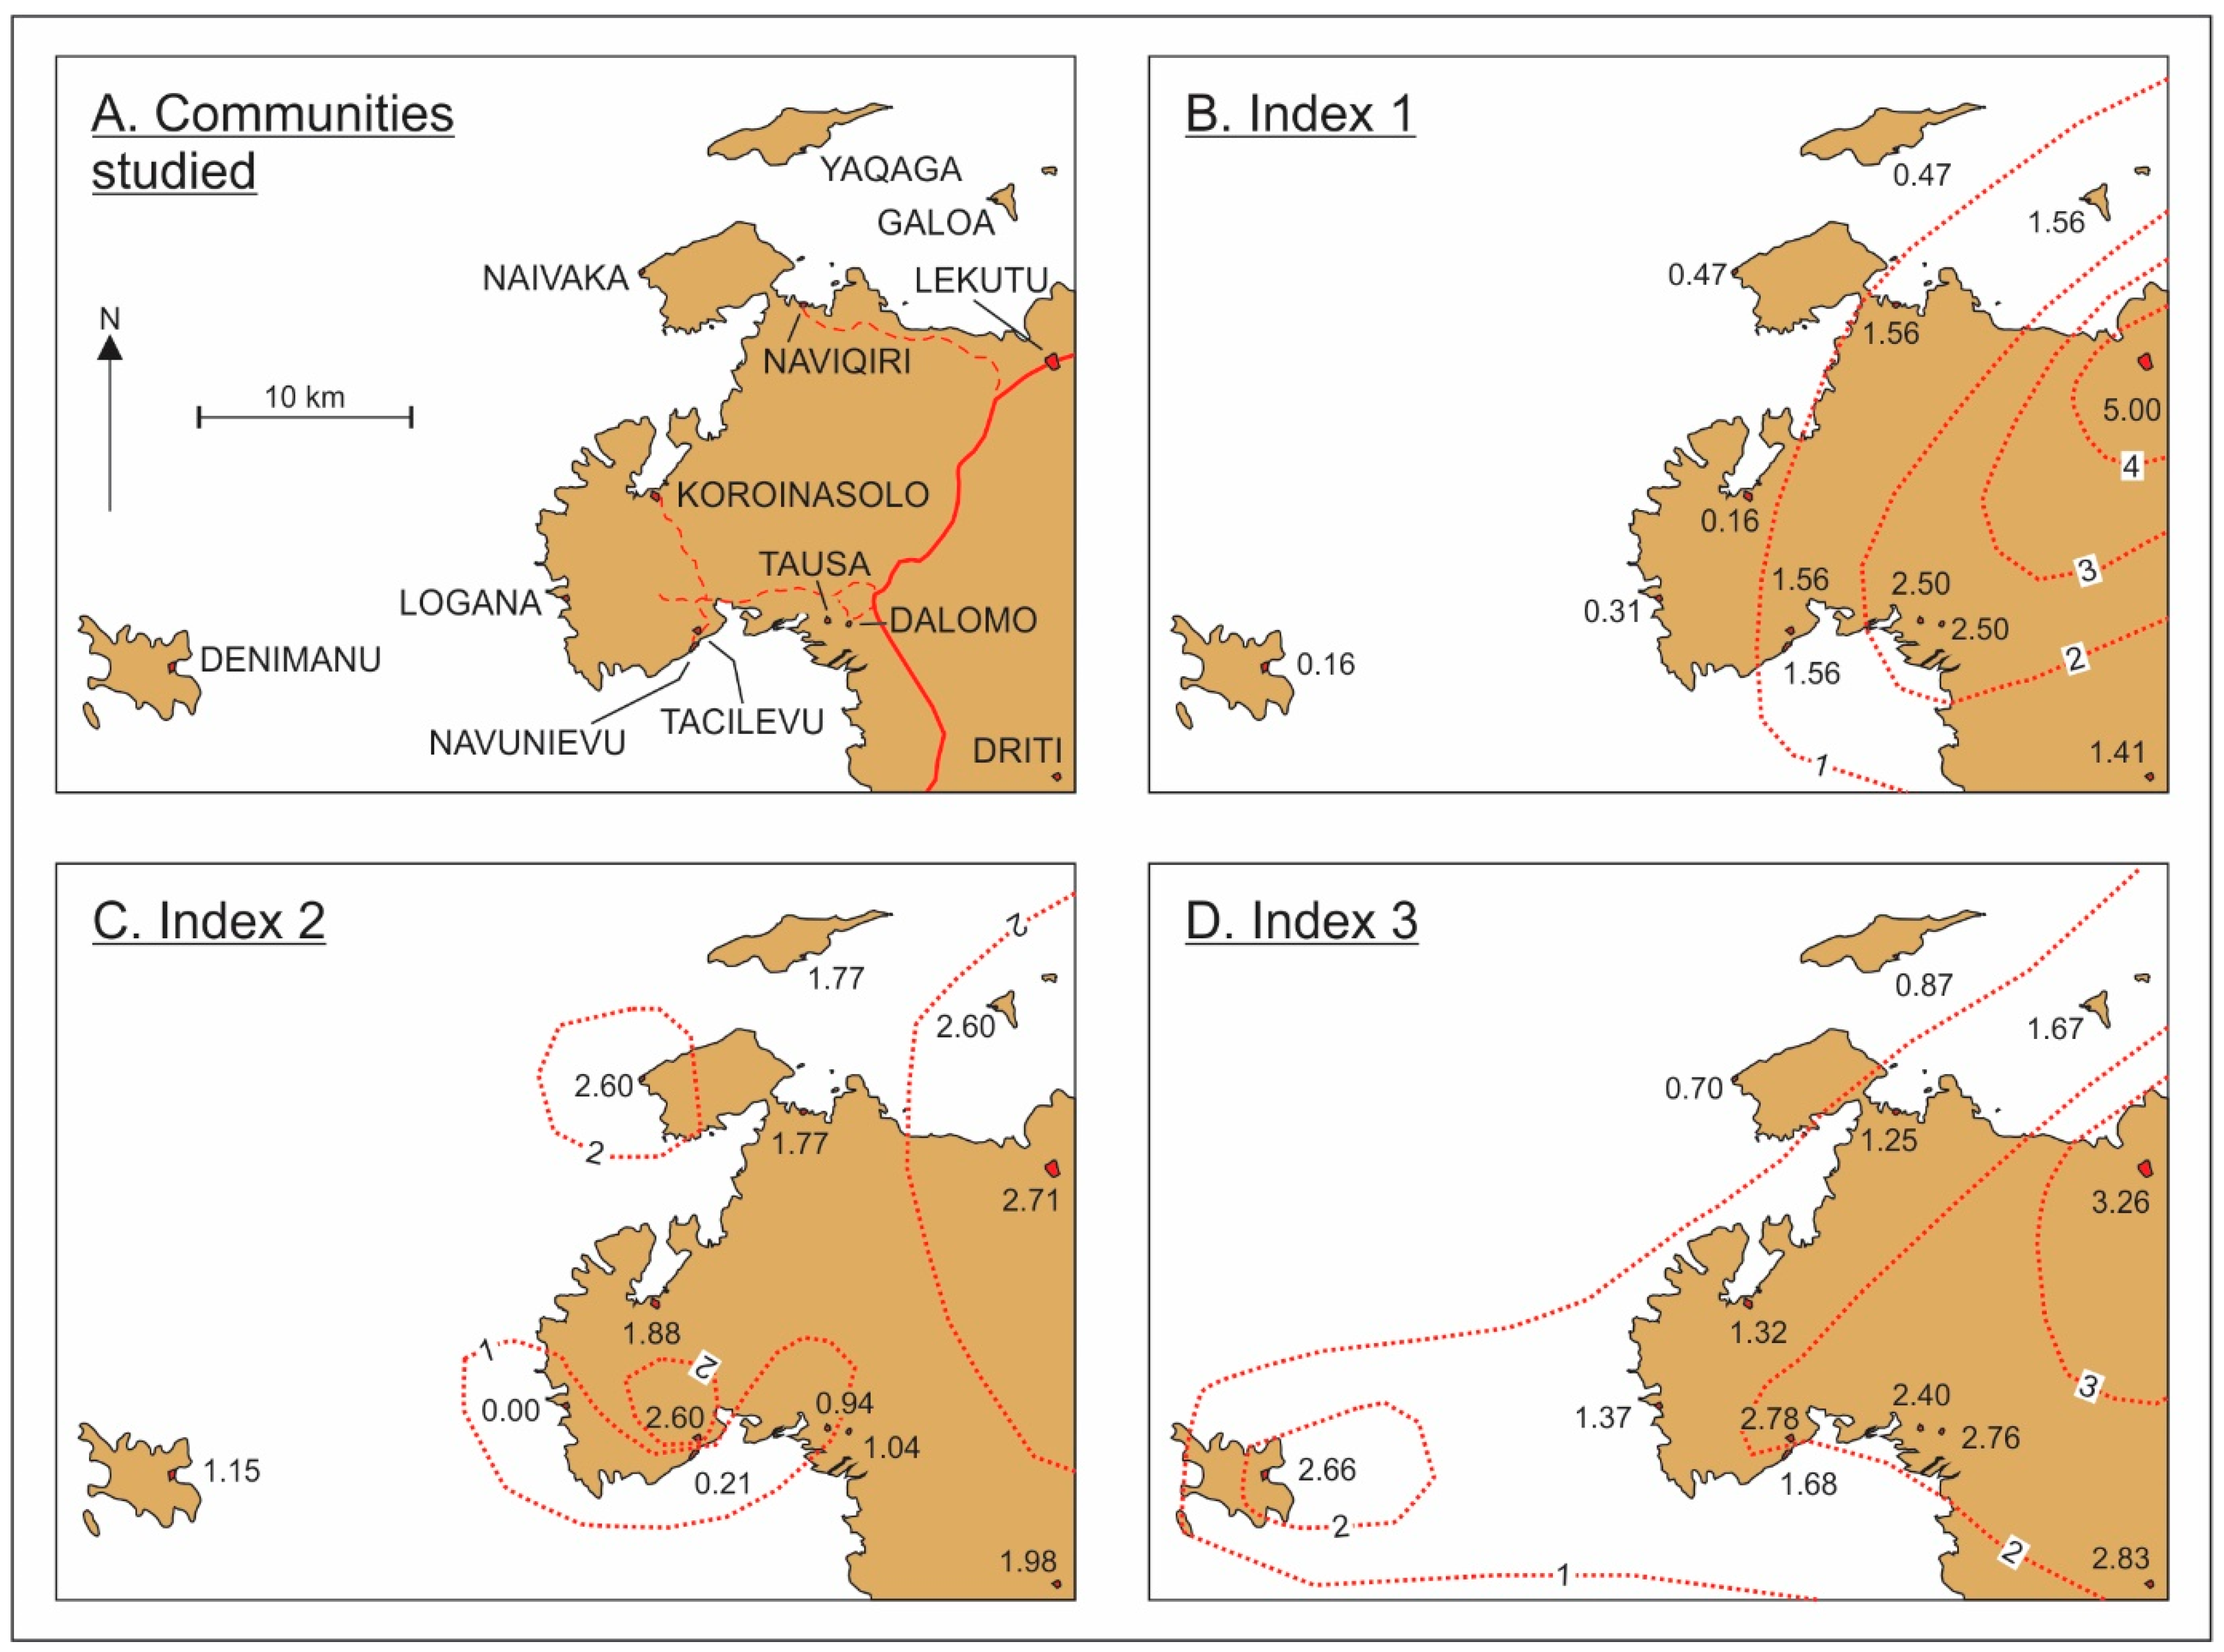
5.2. Insights from Mapping Indices A–C

Figure 3 shows maps (B–C) plotting the values of the three peripherality indices calculated above (see Table 2). The map of Index 1 (Figure 3B), the simplest of the three, shows a neat relationship between index and distance, with increasing peripherality from east to west. Yet it is interesting to note that Index 1 does not exhibit a simple relationship with distance or whether a particular community is located on the mainland or on a smaller island. Denimanu and Koroinasolo, one offshore, the other on the mainland, both have the same Index 1 values while offshore Yaqaga has a much higher value. Distance is clearly the key variable giving Denimanu its low value while access difficulties explain why Koroinasolo also has a low value. The high value for Yaqaga is because the distance to the sub-centre at Lekutu is far less than it is for Denimanu and even mainland locations like Logana and Koroinasolo from which access is more difficult.
Mapping of Index 2 gives a far less uniform picture (Figure 3C) that is superficially difficult to interpret, largely because of apparently anomalously high values for Naivaka and Tacilevu, something emanating from their comparatively large proportion of younger compared to elderly people. There may be many reasons for such situations, including those where life span is comparatively low. Similarly, Index 2 for many apparently more peripheral communities (like Denimanu, Driti, Koroinasolo, Naviqiri and Yaqaga) is higher than for others (like Dalomo, Logana, Navunievu and Tausa) that might be expected to have higher values. In most instances, this appears to be largely a function of community size, demonstrating that many apparently more isolated communities may in fact have quite large populations, perhaps representing community coherence (or a low desire to move out), a high proportion of returnees from living elsewhere, or even—as is the case for Denimanu, Driti and Yaqaga—the possibility of earning better wages (from fishing or kava growing) in the village than through employment in urban centres.
Index 3 gives a more conventional picture of peripherality in Bua (Figure 3D) similar to Index 1. Denimanu is the major anomaly, largely because of its relative prosperity endowed by commercial small-scale fishing and the excellence of its mobile phone signal availability.

5.3. Linking Peripherality to Autonomous Community Coping Capacity

Survey results show that peripherality is linked to autonomous community coping capacity; the more peripheral a community, the better equipped it feels to cope unaided with environmental adversity. This conclusion is based on four findings.
First, the dominance of older adults (grandparents) in more-peripheral communities ensures that traditional knowledge remains current in these communities, a tendency that is assisted by distance (as in Table 1) which typically reduces the amount of global knowledge reaching these communities. The converse is true. In less-peripheral (near-core) communities, the dominance of wage-earners means that there is less time to learn/indulge traditional (often time-consuming) behaviours; in consequence there is a preference for quick solutions (often unsustainable) ranging from methods of food acquisition, food choices as well as behaviour in advance of expected environmental adversity (from tropical cyclones to drought and climate change). The researchers stayed in many communities, noting that evenings in more-peripheral communities were often spent in socially-interactive group discussions whereas in less-peripheral communities it was more usual for people to stay in their own houses watching television.
Second, the time/cost it takes for residents of more-peripheral communities to access services in core locations is commonly prohibitive. This tendency is also exacerbated by peripherality; members of the most peripheral communities need the most cash to access these services—so they rarely do. It is therefore no surprise that people residing in more-peripheral communities in Bua tend to utilize more traditional ways of coping, a tendency that applies to healthcare as well as other ‘ways of doing things’ including responding to environmental threats.
Third, while schools are reasonably well distributed throughout Bua (see Figure 1), it is clear that the more academically-able school students will often be moved by their parents/communities from schools in more-peripheral locations to those—perceived as superior—in core locations. These students rarely return as adults to reside in their home communities. This leads to a situation in which young adults in peripheral communities are generally less well educated in ‘western’ ways and concomitantly inculcated more in traditional ways. The converse also applies.
Fourth, particular attention was given in this study to community knowledge about the causes of environmental change (especially disasters and climate change) and the optimal responses to this. People in more-peripheral communities invariably demonstrated a greater knowledge about the types of environmental change they had experienced; for example, several such communities recognized a link between rising sea level and shoreline erosion that was empirical rather than framed within a broader understanding of climate change. Such communities also identified appropriate local responses, including set-back, shoreline revegetation, and even iterative relocation; for example, the Navunievu community has a local law that requires every new dwelling (typically for a newly-married couple) to be built on higher ground at the rear of the coastal village, something that will drive its autonomous adaptation over the next few decades. In addition, knowledge in more-peripheral communities about the precursors of impending climate-linked events (especially tropical cyclones) was comparatively widespread and, while not always verifiable, points to a familiarity with environmental change that was conspicuously absent in less-peripheral communities; similar findings were reported from Malaysia and Samoa (Garay-Barayazarra and Puri 2011; Lefale 2010).
The practical nature of this research is in developing an easily-calculated and effective tool for measuring the diversity of rural communities in island nations, especially archipelagic ones like Fiji. The motivation for this research was the discovery that many agencies, both national and supranational in island countries, tend to treat all rural communities as having the same strengths and frailties, an approach that ignores community diversity of the kind explored here. Given the long history of failed interventions for livelihood sustainability, particularly in the face of future climate change, it was felt important that the efficacy of external investments of time and money should be optimized. Through the calculation of tools like Indices 1–3, it is possible to capture the diversity of autonomous community coping capacity. In this way, it should also be possible to design interventions that acknowledge strengths and weaknesses of a particular community through measurement of its peripherality.
For example, it seems clear that many of the communities that score low on Index 3 have considerable ability to help themselves and are in fact accustomed to doing so. Any externally-driven approach that seeks to sideline the autonomous coping ability of such communities will endanger their sustainability and may prove maladaptive. It is much better for external interventions in such communities to acknowledge inherent community coping capacity and incorporate it into their design.

6. Conclusions

This research explains how three indices that adequately capture community peripherality were calculated in rural archipelagic contexts, something applicable to other peripheral contexts, particularly in developing countries. This approach provides a tool for the rapid assessment of peripherality in similar geographical situations. Among the main applications of calculating peripherality in this way is the demonstration that the autonomous (traditional) capacity of such rural communities to cope with environmental adversity (like climate change or disasters) is something that varies. Such information could be used to inform policy and the design of strategies for disaster risk management or climate change adaptation rather than making glib assumptions about all rural/remote communities being equally unequipped to deal with such challenges compared to their core/urban counterparts (Maru et al. 2014; Nunn et al. 2014).
As the pace of 21st-century climate change increases over the next few decades, it will become increasingly important to devise and implement pathways for sustaining such communities in the face of its multifarious impacts. Understanding community peripherality, its implications for vulnerability and resilience, and all this implies permits the development of precise (community-specific) interventions for community sustainability. In addition, as external funding for climate-change adaptation diminishes—as appears probable as problems multiply in donor countries—it will become increasingly important to support the autonomous coping capacity of such rural communities by engaging with their strengths and underwriting their frailties.

Supplementary Materials

The following are available online at https://www.mdpi.com/2076-0760/8/8/225/s1, Questionnaire.

Author Contributions

Conceptualization, funding acquisition, project oversight by P.N.; Methodology including field surveys and validation of indices by P.N. and R.K.; Writing by P.N. and R.K.

Funding

This research was funded by Asia-Pacific Network for Global Change Research (APN) grant CRRP2015-FP02.

Acknowledgments

We are grateful to the people of Bua for their hospitality and support of the project goals. Oru sa vakavinavinaka vakalevu vei kemiau a turaga kaya marama ni vanua vakaturaga ko Cakaunitabua ina omiau veivakaitaukeitaki kaya veitokoni ina sasaga ni vakadidike qoi.

Conflicts of Interest

The authors declare no conflict of interest.

Appendix A. Detailed Results

Appendix A.1. Population and Economy

Key data are shown in Table A1 and illustrated in Figure A1. Community size is generally considered an important measure of peripherality; in almost every comparable situation, community size (often population density) decreasing with increasing peripherality. In the Bua area, the relationship between population size and distance from core is clearly not a simple linear one (Figure A1A). For example, more-peripheral Koroinasolo has the largest population count and yet the smallest proportion of people under the age of 19, allegedly because it is an environment where older people are healthier and live longer than elsewhere. Logana has the fewest number of residents—it is an isolated community occupying land belonging to a single extended family (rather than being communally owned)—compared to the other communities and half its population is comprised of persons over 65; many adults of working age live away from Logana but, as elsewhere, leave their children to be raised by their grandparents.
Table A1. Population and employment data for Bua communities.
NumberCommunityPopulation (Total and % ≤ 21 and % > 65)Persons Employed FulltimeAverage Household Income (Fiji$/US$) 1
1Dalomo623111272004536
2Denimanu2083218210,0006300
3Driti125534110,0006300
4Galoa262379110,0006300
5Koroinasolo3001712130001890
6Lekutu20033209035002205
7Logana203050040002520
8Naivaka204501011250787.5
9Naviqiri1883914140002520
10Navunievu633325020001260
11Tacilevu155528262403931.2
12Tausa333312075004725
13Yaqaga189356120001260
1 1 Fiji dollar equals 0.63 US$, the conversion rate at the time of study.
Figure A1. The three distance measures (see Figure 2 and Table 1) plotted against community population (A), community residents <21 years (B) and >65 years (C), and average household income (D).
Socsci 08 00225 g0a1
Over one third (37%) of the population in the 13 communities studied in Bua Province are teenagers and children under the age of 18. There are likely to be various reasons for the lack of correlation between the number of young people and distance from core (Figure A1B), including numbers and genders of young adults, yet the presence of moderately strong relationships between elderly people and distance from core (Figure A1C) is more interesting. It would be expected that the more peripheral a community, the higher its proportion of elderly residents. Even though they may have worked elsewhere, many such people have retired back to their roots, where they own cultivatable land, and where they can contribute to their community. This observation is important to future planning for climate change adaptation because it means that older people, often with a greater stock of traditional knowledge, are disproportionately represented in more peripheral communities and able to contribute that knowledge to site-specific planning; it is widely acknowledged that such ‘localization’ of adaptation planning is key to its effectiveness and sustainability (Forsyth 2013; Ireland and McKinnon 2013).
Other than the community of Lekutu, an important government centre in Bua Province, the other 12 communities studied engage predominantly in subsistence agriculture and fishing. Relative to their total populations, only a handful of people (0.6%) are in full-time waged employment in these communities, largely because there are few opportunities for this. There are weak positive correlations between income and distance from core (Figure A1D) that reflect this but also incorporate some anomalies. For example, three of the more peripheral communities (Denimanu, Driti, Galoa) report comparatively high household incomes. This is both because of remittances (from community members working elsewhere and sending money back home) and because of community entrepreneurship. In the case of Denimanu and Galoa, both small island communities, this is because of the diversity and richness of marine foods (especially fish and sea cucumber) sold outside those communities, while for Driti, this is largely because of the sale of kava1 supplemented by community fishponds from which tilapia (Oreochromis mossambicus) are sold regularly to surrounding communities.

Appendix A.2. Transport and Infrastructure

People in the communities studied use a variety of means of transport for moving within the area and also accessing services in core locations (Labasa and Nabouwalu). People on smaller islands use motorized punts to access the mainland, typically at points closest to the highway. The same is true of most residents of Logana and Naivaka where there is no road access, although they also utilize horses, which are used by other communities when roads become impassable, as they often do following tropical cyclones; after Severe Tropical Cyclone Winston (February 2016), landslides closed the Koroinasolo access road for several months, so the people used horses and boats to reach other places from which they might access core locations. Communities closest to the highway sometimes own or can readily access a range of road vehicles; most common are ‘carriers’, pickup trucks with seats at the back covered with canvas that can carry 10–25 passengers. A public bus service connects Bua Village with Labasa and back once every day.
As shown in Table A2 below, usual one-way travel times to Labasa, the largest town on Vanua Levu, may be as much as 3–6 h (excluding waiting times) for residents of smaller-island communities or those without road access. Costs for shared transport may exceed F$85 (US$54) for round trips, a sharp contrast to round-trip costs of F$7.50 (US$5) for communities living on the bus route. Such costs are prohibitive for many residents of more geographically-peripheral communities and the researchers encountered several adolescents in Bua district who had never visited Labasa; many older people had not been there for a decade or more.
Questions were also asked about water and electricity supply. It was found that most larger, more prosperous communities (like Denimanu, Driti, Lekutu and Yaqaga) had a clean adequate water supply; Lekutu receives mains water, Denimanu and Yaqaga—both notoriously drought-prone ‘outer-island’ communities in the rain shadow of Vanua Levu—have government-subsidized boreholes. Most other communities use rainwater for drinking and well-water for other purposes; sometimes drinking water is treated, more often not in more geographically-peripheral communities. Outbreaks of typhoid have occurred.
Table A2. Time and cost required to access western health solutions for the people of Bua, together with the number of times they had recourse to either western or traditional medicine.
NumberCommunityUsual One-Way Travel Time and Cost to Labasa (Full-Service) HospitalUsual One-Way Travel Time and Cost to Nabouwalu (Limited-Service) HospitalNumber of Times Per Household/Year Western Healthcare Is AccessedNumber of Times Per Household/Year That Traditional Medicine Is Used
HoursFiji$US$HoursFiji$US$
1Dalomo3.5106185248
2Denimanu685544.5100633240
3Driti45032185660
4Galoa3.528183.528182180
5Koroinasolo 15-825–7016–443.520–5013–324.5180
6Lekutu2.57.552.57.55396
7Logana5.56843450323200
8Naivaka560384.55535260
9Naviqiri433213.530194144
10Navunievu3.840252.53019460
11Tacilevu3.840252.53019348
12Tausa3.51061853.584
13Yaqaga4.543274.543274180
1 The variations in time and cost reflect the difference between ‘normal’ conditions and those that followed the washing-away of the access road for several months after Cyclone Winston in February 2016 necessitating use of more time-consuming and expensive options.
All communities have electricity but only Lekutu is linked to the national grid. Most other electricity is generated using diesel fuel or by solar; owing to the recent price reduction in solar home systems (typically comprising 2 × 50 W panels and a 12 V battery), their use is spreading in rural areas of Fiji like Bua. That said, most communities visited had electricity available in only a few households for 3–5 h per day, something that inevitably restricts use of electrical devices.

Appendix A.3. Government Services and Education

All 13 communities are home to students attending primary, secondary and tertiary/vocational institutions. While there are nine primary schools in the area, there are just three secondary/vocational schools, all located close to the highway that helps them access students from large population catchments. In more peripheral communities such as Denimanu, Driti, Galoa, Koroinasolo, Naivaka, Naviqiri, and Yaqaga Island, where the cost of travel for school students is comparatively high, boarding for a week/month/term in school dormitories is common. Almost all students attending tertiary or vocational institutions in town stayed (with relatives) near these places rather than commuting regularly from their home communities. Many informants noted that, on completion of secondary or tertiary education, most tertiary-qualified students chose not to come back home because of a lack of employment opportunities.
Although children may leave school at the age of 12 in Fiji, education is free and around 90% of Bua residents between 7–17 years old regularly attend school. The Government of Fiji also pays the costs of students travelling to school, whether this occurs daily (when the nearest school is close) or weekly/termly (when the nearest school is comparatively distant). In effect, this means that cost is not an issue and that education participation and completion are not linked to community peripherality.
With this in mind, questions were asked about the educational qualifications of community residents in Bua. Most under-50s had been educated to the ages of 12–14 or above; most under-30s had completed high-school education. Except for Lekutu, no communities had anyone resident who had completed a university degree although several people had technical (tertiary) qualifications. Persons posted temporarily to particular communities (like schoolteachers and nurses and pastors) were not counted in this although their roles in community-level environmental governance can be significant (“persons of influence”, Nunn 2013, p. 165).
Several possible indicators of peripherality that invoked government services and education were trialed, but none found to be reliable in the sense of being transferable to comparable situations elsewhere. This is largely because the Government of Fiji has effectively spread its services throughout this region as part of a long-term strategy to boost the attractiveness of living in rural parts of the country (compared to urban parts), such that almost every community has ready access to a school (and basic healthcare—see below) that is unrelated in almost any way to community peripherality.

Appendix A.4. Health

For several decades, the Government of Fiji has been promoting the benefits of ‘western’ health solutions, particularly to address the alarming growth in non-communicable diseases (like diabetes, cardiovascular and respiratory diseases and cancer), and has put in place a healthcare infrastructure intended to be accessible to all Fijians. Largely because of the trust many Fijians place in traditional remedies, some of which are demonstrably effective (Leguillier et al. 2015; Singh 1986), the engagement of people, especially rural dwellers in places like Bua, with western health solutions has been less than optimal (Russell 2011). In Bua district, there is a network of medical centres, usually ‘nursing stations’ with a resident nurse. For emergencies, there is a doctor in Lekutu, a limited-treatment (only minor surgical) hospital in Nabouwalu, and a full-service hospital in Labasa where there is also a number of private clinics.
Data were collected from communities in Bua to understand the degree of engagement their residents have with western medicine and the degree of their reliance on traditional remedies. Data were also collected about how often Buans accessed western healthcare and what investment of time and money this access entailed (see Table A2 above).
In general, the further a community is located from a public hospital, the longer is the travel time and the higher is the cost of travel. This is true for all smaller-island communities, which use a boat for at least part of the journey to access the hospital, and mainland communities at Koroinasolo and Naivaka. The cost decreases for communities if their members visit a nursing station, generally for less critical medical needs. Communities such as Denimanu, Lekutu, Naviqiri, and Tausa are all within walking distance of nursing stations that provide less critical medical service but, according to all informants, for more serious conditions almost everyone is referred by the resident nurse to a public hospital, which they often find prohibitively expensive to reach.
Lekutu and Tausa are the only communities studied that have access to an ambulance service. Navunievu can only access the ambulance service when the road is in good condition. Naviqiri is another community that can call for ambulances but they mentioned these services are not always or promptly provided. Yadua has a boat for medical emergencies, provided by the government, that will transport patients to the mainland for critical medical evacuations. Communities that are located several kilometres inland from the main road, such as Driti, Koroinasolo, Naviqiri and Navunievu, and can be accessed only via unsealed road either in vehicles or by boat (or both), are often more vulnerable to changes in the weather. According to these communities, bad-weather conditions affect those of the roads, often making it impossible to use them to transport patients to a public hospital.
Like most people in rural communities in developing countries who are comparatively far from government-provided healthcare facilities (e.g., Towns et al. 2014), the people of Bua employ a blend of western and traditional remedies for many of their ailments. A prolonged discussion with one community nurse confirmed people’s trust in traditional medicine2. The nurse also emphasized that people normally presented themselves with non-communicable diseases only when they were in the later stages of these, having previously tried traditional cures that proved ineffective. The nurse also mentioned that critical patients suffering from heart diseases, cancer, Type II diabetes, kidney failure, and stroke were often hospitalised for medical treatment but she noted that family members would invariably discharge the patients early and not allow the treatment to take its course. She explained it was not a case of the patients being told that the treatment was proving unsuccessful but simply they felt it was time for them to bring the patients home and use traditional remedies in the efficacy of which they had inherently more faith. It is not clear whether distance/cost to government hospitals or a lack of faith in western medicine is linked to the almost unanimous preferencing of traditional medicine over western medicine in Bua communities.
The reliance on traditional medicine over western medicine is a good indicator of community peripherality (Figure A2). For those communities in Bua that have the longest travel times to reach the full-service hospital in Labasa (Figure A2A), traditional remedies are most commonly used whereas for those communities with the shortest travel times, traditional medicines are less commonly used (r = 0.61). A similar conclusion can be drawn when travel cost is used instead of travel time (Figure A2B: r = 0.51). When the use of traditional medicine is compared to the three distance measures of peripherality (see above), good correlations (r = 0.3–0.56) are obtained (Figure A2C). The less clear picture for western medicine use (Figure A2D) is best explained by the incidence and treatment of ‘western’ ailments, perhaps largely lifestyle-related, which are often perceived as untreatable using traditional remedies. The contrasts between traditional and western medicine use shown in Figure A2 show clearly that the former are preferred over the latter in all communities.
Figure A2. Graphs illustrating the comparative usage of traditional and ‘western’ medicines in the communities of Bua. Graphs (A,B) show that there is a strong relationship between traditional medicine usage and peripherality (as measured respectively by time and cost involved in reaching the full-service hospital in Labasa). This relationship is borne out by the correlations between the three distance measures and traditional medicine use in Graph (C); note that the strongest relationship is with weighted distance. The absence of clear relationships between distance and ‘western’ medicine use (Graph D) suggests the latter is not readily explainable by community peripherality, a conclusion also suggested by Graphs (A and B).
Socsci 08 00225 g0a2

Appendix A.5. Communications and Technology

Global awareness among people in peripheral locations depends largely on access to appropriately-delivered information (Crone 2012). In Bua, radio is one of the most widespread and effective ways for people to access information but television/video for entertainment has become more popular in recent decades. Internet services have been available for about a decade here although it is important to appreciate that internet use does not automatically equate to improved access to global knowledge, especially that of relevance to environmental planning, in such contexts (Austin 2014; Bolton 1999).
Most households have radios which are played for several hours every weekday and are listened to by house-tethered community members, mostly adult females, although some adult males will sometimes take radios with them to their food gardens where they might spend more than six hours a day. Apart from Lekutu, where there are an estimated thirty television sets (and where the television signal is comparatively strong), no communities visited had more than eight sets. Of these, only Denimanu, Galoa and Yaqaga described their television reception as sufficient (at least occasionally, commonly in good weather) to watch television programmes. The remaining communities used their televisions only to play DVDs, signal strength being inadequate to capture television signals.
Twenty years ago in Bua, almost every community had a radiotelephone; in 2017, only Denimanu had one and this was reported to be unreliable, especially during bad weather. Almost every household in each community visited has a mobile phone, despite reception quality and accessibility varying enormously. Lekutu and Navunievu people both reported excellent mobile reception; Galoa and Tausa as adequate; Denimanu and Yaqaga as variable; and the rest as poor. Often phones in such places have to be used in specific spots (like hilltops or several metres wading distance out to sea) in order to ‘catch’ a signal. Most mobile phones are used to enhance networking; Facebook is ubiquitous. While secondary schools in Bua use internet to aid instruction, its use as an educational tool outside such formal settings is negligible.

Appendix A.6. Culture, Tradition and Religion

As manifested by the almost-universal use of non-western languages in Bua communities and by the degree to which traditional ‘ways of doing things’ are practiced, it is clear that culture remains robust throughout the area. Yet culture has also made numerous concessions to globalization, ranging from the increasing use of English over the past decade, especially among younger people, to the consumption of imported foods, many of which are implicated in the increasing incidence of NCDs (Kline et al. 2013; Lako et al. 2006).
This survey focused on ways of building houses and ways of cropping, hunting and fishing as indicative of the tenacity of traditional practice in Bua. Most houses in Bua are built from modern materials, typically with roofs and walls of corrugated iron on wooden frames; church and school buildings are commonly brick-built. Thatch-roofed and reed-walled houses (bure) constructed in traditional ways are commonest in more geographically-peripheral locations (Figure A3A). While most subsistence agriculture in Bua utilizes imported tools, it favours traditional methods, ranging from the construction of (bamboo) frames and mounds for yam cultivation, to intentional intercropping to maximize shade and conserve water. Feral pigs and goats are either caught using traps made from rope and wood or hunted with spears and dog packs, methods that have remained essentially unchanged for centuries. While spears and (woven) nets are commonly used for fishing, more modern methods such as spear guns and plastic nets are widespread, especially with people who practice commercial fishing.
Figure A3. Photos from Bua (photos by authors). (A) Traditional housing in Denimanu Village on Yadua Island is preferred by many residents because it is cooler in hot weather and warmer in cool weather compared to many stronger house designs that are easier to construct. (B) The effects of sea-level rise over the past few decades are clearly visible along the shorefront of Navunievu Village, where seawalls built in the 1970s and 1990s have both now collapsed and the land on which the village is built is being slowly eroded.
Socsci 08 00225 g0a3
Christianity, Hinduism and Islam were the religions practiced by people in the ten communities. Christianity was the common religion of practice. Regardless of the religious beliefs and availability of either a medical centre or hospital, all the communities widely utilized traditional medicine for a variety of conditions and in most cases opted to use this over western medicine (see above).

Appendix A.7. Climate, Natural Disaster Prediction and Response

All communities visited are affected regularly by short-onset disasters, such as flooding, tropical cyclone (hurricane), landslides, extreme waves, the latter mostly storm surges (ualevu) rather than tsunami (loka). All communities suffered from ‘natural’ disasters and reported major associated losses to agricultural production, houses, livestock and apiaries, damages to roads and their closures, loss of telecommunication services, and residual debris accumulation in their aftermath.
Longer-onset environmental changes, as are more commonly linked to climate change, are typically recognized less readily although several (coastal) villages had observed the progressive erosion and submergence of their coast. At Denimanu on Yadua Island, the powerful waves during Tropical Cyclone Evan (December 2012) removed several metres from the fringe of the coastal plain, including two rows of houses, which resulted in one of Fiji’s first relocations in January 2014; a landslide behind the village in December 2016 carried away school classrooms (Martin et al. 2018). Shoreline loss was especially remarked upon at Denimanu, Galoa, Koroinasolo, Logana, Naivaka, Naviqiri and Yaqaga (Figure A3B above).
Owing largely to radio updates, all communities knew when a disaster was about to strike yet some informants noted the imprecision of such information that occasionally inhibited proactive responses. Almost all informants described traditional signs of changing weather, including excessive breadfruit fruition, curling of plantain leaves, and the formation of beehives at ground level rather than in the trees. Most communities related numerous signs of imminent weather change, especially the arrival of a tropical cyclone, which they used in conjunction with radio bulletins to determine appropriate responses. These signs included unusual movements of bamboo leaves (Koroinasolo); flocks of frigate birds and swallows flying onshore close to the ground (Logana); upright positions of sea cucumbers on the shallow seabed (Galoa and Yaqaga); infestations of insects and the sudden efflorescence of usually slow flowering trees (Denimanu); and decreased times between high and low tides (Denimanu). Similar research was reported from Fiji by others (Janif et al. 2016; Johnston 2015).
Nearly all communities noted ruefully that they were not as able as their ancestors had been to cope autonomously with the effects of disasters, often claiming that traditional solutions worked slowly whereas access to outside help in the aftermath of disasters allowed livelihoods to be restored comparatively quickly. For example, the people of Naivaka explained that “we want to trust what our ancestors told us but we listen to the radio”. Following warnings of an imminent disaster, community members did describe preparing themselves by securing their homes, moving to higher ground, storing root crops in pits in expectation of loss of food (and delay in post-disaster food handouts by the government). Most communities admitted relying heavily on government assistance for food rations, clothing, seeds for planting, and construction materials after disasters had passed. On the other hand, people from Tausa stated that they could be self-sufficient after disasters, crushing grains to make flatbread (roti) and manufacturing coconut oil to light their homes. Hibiscus bark (vau) is used for a similar purpose when the main electricity generator in Denimanu fails.

Appendix A.8. Diet and Food Production

All 13 communities visited in Bua province have adequate land on which to plant food crops and (except Driti) sufficient access to the sea for marine food. Yet none of these communities are self-provisioning to the extent that they live wholly without goods manufactured externally–although a few informants stated they could do so if they had no choice. Lekutu is served by three general stores where most items found in Labasa supermarkets can be found. Apart from Logana, all other communities have ‘canteens’ within them where a small range of essential items can be purchased while Dalomo, Navunievu, Tacilevu and Tausa each have a larger shop within thirty minutes walk. Many adults in more peripheral communities periodically travel to Bua, Lekutu or Nabouwalu, often around the start of school terms, to purchase essential items not readily available closer to home.
All communities in Bua plant staples like taro, tapioca (cassava), plantain and yams as well as vegetables including spinach, slippery cabbage and corn. Most protein comes from seafoods (fish, shellfish, crab, octopus) with some chicken, pork and beef consumed fresh on special occasions. The most common food items purchased from local shops were flour, sugar, rice, cooking oil, tinned fish, tinned corned beef/mutton, tea leaves, salt and dry noodles; of these, only sugar and rice are manufactured in Fiji. This reflects a trend found in other parts of the Pacific Islands that is implicated in the increasing incidence of NCDs, together with the consumption of tobacco and alcohol (Lako 2001; McIver et al. 2014).

Appendix B. Calculation of Indices A–C

Each of the ten variables (contributing to three indices) discussed below are scored linearly or non-linearly, depending on what the researchers–through expert knowledge (see above)—consider to be appropriate values for separating the range of Bua communities along a notional core–periphery gradient. For example, there are four scores available for variable 3A (mobile phones per capita) that weight low numbers disproportionately, something considered to capture difficulties of mobile phone reception in a particular community as well as the often prohibitive cost of purchasing phone credit by its residents. In another example, again reflecting the nature of the periphery-biased Bua data, variable 2C (% community residents in fulltime employment) is weighted towards lower numbers yet gives disproportionately high scores to higher numbers (>35%) both because this is an unusual situation in such geographical contexts but also because it proxies community income which is itself considered a good proxy for engagement with ‘cores’ irrespective of distance.
Note that some of the ways in which particular variables below are scored are specific to the (periphery-weighted) situation in Bua; it is anticipated that these variables might be scored slightly differently in other situations.

Appendix B.1. Index 1: Geography

Travel time to nearest town (A) is the first variable in Index 1, measured in hours of usual/normal (not express) travel from the community to town. Note this is travel time not waiting time (for buses, for example). Thus, A = 0.6 if usual travel time is >6 h; A = 0.75 if usual travel time is >5–6 h; A = 0.9 if usual travel time is >4–5 h; A = 1.8 if usual travel time is 3–4 h; and A = 3 if usual travel time is <3 h. The underlying assumption is that the closer a community is to town, the better its access to services, (government) outreach, and global information sources. Conversely, the further a community is from town, the more likely it is to be globally uninformed/unaware.
Cost of travel to nearest town (B) is the second variable in Index 1 and is the one-way cost (in US$) for an adult using the usual/normal method of travel. Thus, B = 0.6 if cost is ≥US$50; B = 0.75 if cost is US$ > 25 < 50; B = 0.9 if cost is US$ > 15–25; B = 1.8 if cost is US$ > 5–15; and B = 3 if cost is <US$5. The assumption is that the cheaper it is for members of a community to reach town, the more likely they are to access services available there. Conversely, the costlier it is for members of a community to reach town, the less likely they are to (routinely) access the services available there.
In order to scale Index 1 for direct comparison with other peripherality indices in this study, the sum of A and B is adjusted as follows:
Index 1 = [(A + B) − 1.2]/0.96
Low scores (≤2) suggest comparatively high peripherality while high scores (≥4) suggest the opposite3.

Appendix B.2. Index 2: Population and Employment

Community size (A) is the first variable used in Index 2 and is the usual number of residents excluding temporary ones like children boarding to attend school. It is clear that this variable does not necessarily correlate with distance along the core–periphery gradient because community size is determined not only by opportunities (for wage employment, for perceived high quality of education, better access to services) that can be realized close to core areas but also by land and (food) resource availability, by livelihood opportunities, and by traditional ties to place and obligations to those living there. Five categories are recognized: A = 0.6 if community size is <30; A = 0.75 if size is 30–79; A = 0.9 if size is 80–149; A = 1.8 if size if 150–249; and A = 3 if size is ≥250. Note that the use of a non-linear scale here weights higher community sizes more than lower ones, a reflection of the finding from Bua that a large community is–irrespective of location–potentially more coherent and generally better able to cope as a unit with environmental challenges.
Age distribution (B) is the second variable used in Index 2 and is calculated from the percentage (plus 100) of the population over 65 years minus the percentage of the population below 21 years of age. The older population crudely measures the amount of traditional knowledge available while the younger population crudely measures amount of global knowledge available. Thus, B = 0.6 if calculated age distribution is <95; B = 0.75 if calculated age distribution is >90–95; B = 0.9 if calculated age distribution is >85–90; B = 1.8 if calculated age distribution is >70–85; and B = 3 if calculated age distribution is ≤70. The assumption is that the higher the proportion of older people in a community, the greater its potential autonomous (tradition-based) coping ability. Conversely, the higher the proportion of younger people, who commonly undervalue the efficacy of traditional coping strategies, the more dependent the community is likely to be on external guidance, especially for coping with environmental adversity.
Persons in fulltime waged employment (C) is the third and final variable used to calculate Index 2 and is calculated as a percentage of the total population in a community. Thus, C = 0.6 if waged proportion is 0; C = 0.75 if waged proportion is >0 but <5%; C = 0.9 if waged proportion is 5 < 15%; C = 1.8 if waged proportion is 15–35%; and C = 3 if waged proportion is >35%. The assumption is that the more wage earners in a community, the more financial resources it has available to cope with environmental adversity and to adopt adaptive solutions informed by global knowledge.
In order to scale Index 2 for direct comparison (lowest possible value of 0, maximum 5) with other peripherality indices in this study, the sum of A, B and C is adjusted as follows:
Index 2 = [(A + B + C) − 1.8]/1.44
Low scores (≤2) suggest comparatively high peripherality while high scores (≥4) suggest the opposite4.

Appendix B.3. Index 3: Tradition and Global Awareness

Mobile phones per capita (A) is the first variable used to calculate Index 3. Thus, A = 1.5 if mobile phones per capita is <20%; A = 1.8 if mobile phones per capita is >20 < 30%; A = 2.2 if mobile phones per capita is >30 < 50%; and A = 3 if mobile phones per capita is ≥50%. The assumption is that the more (routinely functional) mobile phones in a community, the more globally exposed it is—and thus more potentially able to access global knowledge for coping with environmental adversity. The fewer the mobile phones in a community, the less globally exposed it is expected to be—and therefore less informed about non-traditional ways for coping with environmental adversity.
The use of western versus traditional health solutions (B) is the second variable used to calculate Index 3 and is measured by answers to three questions (B1–B3) about preferences, uses, and the number of (traditional) healers in a community. Thus, B1 = 1 if people prefer traditional over western medicine; or B1 = 2 if people prefer western over traditional medicine. Then B2 = 1 if people frequently/routinely use traditional medicines; or B2 = 2 if people rarely/never use traditional medicines. Then B3 = 1 if the community has resident traditional healers; or B3 = 2 if the community does not have traditional healers. Thus,
B = (B1 + B2 + B3)/2
The assumption is that greater the use of traditional medicines and the existence of people practiced in their use, the more traditional knowledge the community is likely to have, knowledge that probably extends to other aspects of community life and is therefore a measure of traditional community resilience.
The nature of coping with disasters (C) is the third variable used to calculate Index 3 and is measured by answers to four questions (C1–C4) about the traditional knowledge of disaster precursors, post-disaster external/government support, traditional coping, and the use of outside advice/support. Thus, C1 = 1 if people have meaningful traditional knowledge of disaster precursors; or C1 = 2 if people do not have meaningful traditional knowledge of disaster precursors. Then C2 = 1 if government assistance was received promptly in the aftermath of <70% of disasters; or C2 = 2 if the government assistance was received promptly in the aftermath of >70% of disasters. Then C3 = 1 if the community uses traditional coping methods; or C3 = 2 if the community does not use traditional coping methods. Then C4 = 1 if the community has not received outside support/advice about how to cope with the impacts of disasters; or C4 = 2 if the community has received such support/advice. Thus,
C = (C1 + C2 + C3 +C4)/2.67
The assumption is that the greater the traditional knowledge and (autonomous) coping capacity of a community, the less dependent it is on external assistance. Conversely, a community that has no or little traditional knowledge is likely to be more dependent on outside assistance for coping with environmental adversity–and to make uninformed decisions when that assistance is absent.
Diet (D) is the fourth variable used in the calculation of Index 3 and reflects the relative use of locally-acquired foods and shop-bought foods, as measured by answers to four questions (D1–D4) about the consumption of local produce, the number of nearby shops, the frequency of shop-bought food consumption, and the number of shop food-based meals per week. Thus, D1 = 1 if the community produces/catches ≥80% of the food it routinely consumes; or D1 = 1.5 if the community produces/catches 60- < 80% of the food it routinely consumes; or D1 = 2 if the community produces/catches <60% of the food it routinely consumes. Then D2 = 1 if there are no shops within 30 min walk of the community; or D2 = 1.5 if there is one shop within 30 min walk of the community; or D2 = 2 if there is more than one shop within 30 min walk of the community. Then D3 = 1 if an average household buys food from shops ≤3 times a week; or D3 = 1.5 if an average household buys food from shops 4–5 times a week; or D3 = 2 if an average household buys food from shops more than 5 times a week. Then D4 = 1 if an average household eats mostly shop-bought food for 0–6 meals (out of 21) each week; or D4 = 1.5 if an average household eats mostly shop-bought food for 7–11 meals (out of 21) each week; or D4 = 2 if an average household eats mostly shop-bought food for ≥12 meals (out of 21) each week. Thus,
D = (D1 + D2 + D3 + D4)/2.67
The assumption is that the less reliant a community is on shop-bought food, the more resilient it is to economic challenges although, conversely, the more vulnerable it may be to environmental ones.
Water and energy security (E) is the fifth and final variable used to calculate Index 3. It reflects the adequacy of water and energy (electricity) in particular communities, based on the answers to five questions (E1–E5) about water supply/quality and electricity. Thus, E1 = 1 if the community obtains its drinking water from a single source; or E1 = 2 if the community obtains its drinking water from more than one source. Then E2 = 1 if the supply of water is adequate for the community’s needs; E2 = 2 if the supply of water is inadequate for the community’s needs. Then E3 = 1 if the quality of water is generally suitable for drinking (and/or if the water is treated); or E3 = 2 if the quality of water is often unsuitable for drinking (and perhaps requires boiling before consumption). Then E4 = 1 if <10% households in the community have regular electricity; or E4 = 1.5 if 10–60% households in the community have regular electricity; or E4 = 2 if >60% households in the community have regular electricity. Then E5 = 1 if the community receives electricity from a single source (multiple household generators count as just one source); or E5 = 2 if the community receives electricity from more than one source (multiple household generators count as just one source, community generators count as one, solar as one, mains as one). Thus,
E = (E1 + E2 + E3 + E4 + E5)/3.33
The assumption is that the fewer the sources and less reliable the water supply, the fewer houses with electricity and the fewer the electricity supply sources, the more vulnerable a community is to economic and environmental changes that impact water and energy.
In order to scale Index 3 for direct comparison with other peripherality indices in this study, the sum of A, B, C, D and E is adjusted arithmetically as follows:
Index 3 = [(A + B + C + D + E) − 7.5]/1.5
Low scores (≤2) suggest comparatively high peripherality while high scores (≥4) suggest the opposite5.

References

  1. Austin, Linda. 2014. Faith-based community radio and development in the South Pacific Islands. Media International Australia 150: 114–21. [Google Scholar] [CrossRef]
  2. Beer, Sue. 2004. Information flow and peripherality in remote island areas of Scotland. Libri 54: 148–57. [Google Scholar] [CrossRef]
  3. Bolton, Lissant. 1999. Radio and the redefinition of kastom in Vanuatu. Contemporary Pacific 11: 335–60. [Google Scholar]
  4. Brown, P., A. Daigneault, and D. Gawith. 2017. Climate change and the economic impacts of flooding on Fiji. Climate and Development 9: 493–504. [Google Scholar] [CrossRef]
  5. Charan, Dhrishna, Manpreet Kaur, and Priyatma Singh. 2017. Customary land and climate change induced relocation—A case study of Vunidogoloa Village, Vanua Levu, Fiji. In Climate Change Adaptation in Pacific Countries. Edited by Walter Leal Filho. Berlin: Springer International Publishing, pp. 19–33. [Google Scholar]
  6. Copus, Andrew, Dimitris Skuras, and Kyriaki Tsegenidi. 2008. Innovation and peripherality: An empirical comparative study of SMEs in six European Union member countries. Economic Geography 84: 51–82. [Google Scholar] [CrossRef]
  7. Crone, Michael. 2012. Re-thinking ‘peripherality’ in a knowledge-intensive service-dominated economy. In Regional Development in Northern Europe: Peripherality, Marginality and Border Issues. Edited by Michael Danson and Peter De Souza. London: Routledge, pp. 49–64. [Google Scholar]
  8. Dangendorf, Sonke, Marta Marcos, Guy Woppelmannc, Clinton P. Conrad, Thomas Frederikse, and Riccardo Riva. 2017. Reassessment of 20th century global mean sea level rise. Proceedings of the National Academy of Sciences of the United States of America 114: 5946–51. [Google Scholar] [CrossRef] [PubMed]
  9. Dumaru, Patrina. 2010. Community-based adaptation: Enhancing community adaptive capacity in Druadrua Island, Fiji. Wiley Interdisciplinary Reviews-Climate Change 1: 751–63. [Google Scholar] [CrossRef]
  10. Felzensztein, Christian, Eli Gimmon, and Claudio Aquev eque. 2013. Entrepreneurship at the Periphery: Exploring Framework Conditions in Core and Peripheral Locations. Entrepreneurship Theory and Practice 37: 815–35. [Google Scholar] [CrossRef]
  11. Forsyth, Tim. 2013. Community-based adaptation: A review of past and future challenges. Wiley Interdisciplinary Reviews-Climate Change 4: 439–46. [Google Scholar] [CrossRef]
  12. Garay-Barayazarra, Gotzone, and Rajindra K. Puri. 2011. Smelling the monsoon: Senses and traditional weather forecasting knowledge among the Kenyah Badeng farmers of Sarawak, Malaysia. Indian Journal of Traditional Knowledge 10: 21–30. [Google Scholar]
  13. Ireland, Philip, and Katharine McKinnon. 2013. Strategic localism for an uncertain world: A postdevelopment approach to climate change adaptation. Geoforum 47: 158–66. [Google Scholar] [CrossRef]
  14. Janif, Shaiza, Patrick D. Nunn, Paul Geraghty, William Aalbersberg, Frank R. Thomas, and Mereoni Camailakeba. 2016. Value of traditional oral narratives in building climate-change resilience: Insights from rural communities in Fiji. Ecology and Society 21: 7. [Google Scholar] [CrossRef]
  15. Johnston, Ingrid. 2015. Traditional warning signs of cyclones on remote islands in Fiji and Tonga. Environmental Hazards 14: 210–23. [Google Scholar] [CrossRef]
  16. Kline, Michelle A., Rober Boyd, and Joseph Henrich. 2013. Teaching and the life history of cultural transmission in Fijian villages. Human Nature-an Interdisciplinary Biosocial Perspective 24: 351–74. [Google Scholar] [CrossRef] [PubMed]
  17. Kuruppu, Natasha, and Reenate Willie. 2015. Barriers to reducing climate enhanced disaster risks in Least Developed Country-Small Islands through anticipatory adaptation. Weather and Climate Extremes 7: 72–83. [Google Scholar] [CrossRef] [Green Version]
  18. Lako, Jimaima V. 2001. Dietary trend and diabetes: Its association among indigenous Fijians 1952 to 1994. Asia Pacific Journal of Clinical Nutrition 10: 183–87. [Google Scholar] [CrossRef]
  19. Lako, Jimaima V., Naiyana Wattanapenpaiboon, Mark L. Wahlqvist, and Craige Trenerry. 2006. Phytochemical intakes of the Fijian population. Asia Pacific Journal of Clinical Nutrition 15: 275–85. [Google Scholar] [PubMed]
  20. Lefale, Penehuro Fatu. 2010. Ua ‘afa le Aso, Stormy weather today: Traditional ecological knowledge of weather and climate. The Samoa experience. Climatic Change 100: 317–35. [Google Scholar] [CrossRef]
  21. Leguillier, Teddy, Marylin Lecso-Bornet, Christelle Lemus, Delphine Rousseau-Ralliard, Nicolas Lebouvier, Edouard Hnawia, Mohammed Nour, William Aalbersberg, Kamelia Ghazi, Phila Raharivelomanana, and et al. 2015. The wound healing and antibacterial activity of five ethnomedical Calophyllum inophyllum oils: An alternative therapeutic strategy to treat infected wounds. PLoS ONE 10: e0138602. [Google Scholar] [CrossRef]
  22. Lu, Dadao, and Jie Fan, eds. 2010. Regional Development Research in China: A Roadmap to 2050. Beijing: Chinese Academy of Sciences, Science Press/Springer. [Google Scholar]
  23. Mao, Qiliang, Fei Wang, Jun Li, and Suocheng Dong. 2014. Evolving a core–periphery pattern of manufacturing industries across Chinese provinces. Journal of Geographical Sciences 24: 924–42. [Google Scholar] [CrossRef]
  24. Martin, Piérick C. M., Patrick D. Nunn, Javier Leon, and Neil Tindale. 2018. Responding to multiple climate-linked stressors in a remote island context: The example of Yadua Island, Fiji. Climate Risk Management 21: 7–15. [Google Scholar] [CrossRef]
  25. Maru, Yiheyis Taddele, Mark Stafford Smith, Ashley Sparrow, Patricia F. Pinho, and Opha Pauline Dube. 2014. A linked vulnerability and resilience framework for adaptation pathways in remote disadvantaged communities. Global Environmental Change-Human and Policy Dimensions 28: 337–50. [Google Scholar] [CrossRef]
  26. McIver, Lachlan, Alistair Woodward, Seren Davies, Tebikau Tibwe, and Steven Iddings. 2014. Assessment of the health impacts of climate change in Kiribati. International Journal of Environmental Research and Public Health 11: 5224–40. [Google Scholar] [CrossRef] [PubMed]
  27. McNamara, Karen Elizabeth. 2013. Taking stock of community-based climate-change adaptation projects in the Pacific. Asia Pacific Viewpoint 54: 398–405. [Google Scholar] [CrossRef]
  28. Nunn, Patrick D. 2009. Responding to the challenges of climate change in the Pacific Islands: Management and technological imperatives. Climate Research 40: 211–31. [Google Scholar] [CrossRef]
  29. Nunn, Patrick D. 2013. The end of the Pacific? Effects of sea level rise on Pacific Island livelihoods. Singapore Journal of Tropical Geography 34: 143–71. [Google Scholar] [CrossRef]
  30. Nunn, Patrick D., and Roselyn Kumar. 2018. Understanding climate-human interactions in Small Island Developing States (SIDS): Implications for future livelihood sustainability. International Journal of Climate Change Strategies and Management 10: 245–71. [Google Scholar] [CrossRef]
  31. Nunn, Patrick D., William Aalbersberg, Shalini Lata, and Marion Gwilliam. 2014. Beyond the core: Community governance for climate-change adaptation in peripheral parts of Pacific Island Countries. Regional Environmental Change 14: 221–35. [Google Scholar] [CrossRef]
  32. Nunn, Patrick D., Kate Mulgrew, Bridie Scott-Parker, Donald W. Hine, Anthony D. G. Marks, Doug Mahar, and Jack Maebuta. 2016. Spirituality and attitudes towards Nature in the Pacific Islands: Insights for enabling climate-change adaptation. Climatic Change 136: 477–93. [Google Scholar] [CrossRef]
  33. Oakes, Robert. 2019. Culture, climate change and mobility decisions in Pacific Small Island Developing States. Population and Environment 40: 480–503. [Google Scholar] [CrossRef]
  34. Piggott-McKellar, Annah, Karen McNamara, Patrick D. Nunn, and James Watson. 2019a. What are the barriers to successful community-based climate change adaptation? A review of grey literature. Local Environment. [Google Scholar] [CrossRef]
  35. Piggott-McKellar, Annah, Karen E. McNamara, Patrick D. Nunn, and Seci Sekinini. 2019b. Moving people in a changing climate: Lessons from two case studies in Fiji. Social Sciences 8: 133. [Google Scholar] [CrossRef]
  36. Russell, Lesley. 2011. Poverty, Climate Change and Health in Pacific Island Countries. Sydney: Menzies Centre for Health Policy. [Google Scholar]
  37. Scott-Parker, Bridie, and Roselyn Kumar. 2018. Fijian adolescents’ understanding and evaluation of climate change: Implications for enabling effective future adaptation. Asia Pacific Viewpoint 59: 47–59. [Google Scholar] [CrossRef]
  38. Seltzer, Ethan, and Armando Carbonell, eds. 2011. Regional Planning in America: Practice and Prospect. Cambridge: Lincoln Institute of Land Policy. [Google Scholar]
  39. Singh, Yadhu N. 1986. Traditional medicine in Fiji–some herbal folk cures used by Fiji Indians. Journal of Ethnopharmacology 15: 57–88. [Google Scholar] [CrossRef]
  40. Sofer, Michael. 2015. Kadavu Island: Adaptation and stagnation in the Fijian periphery. Miscellanea Geographica 19: 14–20. [Google Scholar] [CrossRef]
  41. Towns, Alexandra M., Sandra Mengue Eyi, and Tinde van Andel. 2014. Traditional medicine and childcare in Western Africa: mothers’ knowledge, folk illnesses, and patterns of healthcare-seeking behavior. PLoS ONE 9. [Google Scholar] [CrossRef] [PubMed]
  42. Wallerstein, Immanuel Maurice. 2004. World-Systems Analysis: An Introduction. Durham: Duke University Press. [Google Scholar]
  43. Walshe, Rory A., Denis Chang Seng, Adam Bumpus, and Joelle Auffray. 2018. Perceptions of adaptation, resilience and climate knowledge in the Pacific: The cases of Samoa, Fiji and Vanuatu. International Journal of Climate Change Strategies and Management 10: 303–22. [Google Scholar] [CrossRef]
  44. Watson, Amanda H. A., and Lee R. Duffield. 2016. From garamut to mobile phone: Communication change in rural Papua New Guinea. Mobile Media & Communication 4: 270–87. [Google Scholar] [CrossRef]
  45. Williams, Terry, and Preston Hardison. 2013. Culture, law, risk and governance: Contexts of traditional knowledge in climate change adaptation. Climatic Change 120: 531–44. [Google Scholar] [CrossRef]
1
Kava (Piper methysticum) is used to make the eponymous drink, widely consumed socially and ceremonially in Fiji, and increasingly valued as an export crop.
2
Most common uses of traditional medicine are heart attack, diabetes, hypertension, kidney problems, epilepsy, diarrhoea, fever, fever in infants, asthma, headache, migraine, toothache, choking on bones, abscesses, treating burns, muscle and joint pain, sprain, cough, stroke, tuberculosis, Crown of Thorns starfish sting, constipation, cracked heels, gashes from coral, undescended testicles, eczema, mumps, cervical cancer, common cold and stomach ache.
3
Note that the arithmetic changes to the sum of A and B first require that the lower bound is set to zero (the lowest possible score is 0.6 + 0.6 = 1.2) by subtracting 1.2 from the total. Then to make the total out of 5, scores are in this case divided by 0.96.
4
Note that the arithmetic changes to the sum of A and B and C first require that the lower bound is set to zero (the lowest possible score is 0.6 + 0.6 + 0.6 = 1.8) by subtracting 1.8 from the total. Then to make the total out of 5, scores are in this case divided by 1.44.
5
Note that the arithmetic changes to the sum of A and B and C and D and E first require that the lower bound is set to zero (the lowest possible score is 1.5 × 5 = 7.5) by subtracting 7.5 from the total. Then to make the total out of 5, scores are in this case divided by 1.5.
Figure 1. Map of the study area in and off western Vanua Levu Island, Fiji (Bua Province) showing the locations of the 13 communities studied together with infrastructure, reefs and mangroves, and key services (P is primary school, S is secondary (high) school). Inset map shows the location of the main map within the Fiji Islands.
Socsci 08 00225 g001
Figure 2. Plots of Indices 1–3 against distances along the core–periphery gradient validate the use of the variables used in their calculation as measures of community peripherality.
Socsci 08 00225 g002
Figure 3. Maps of Indices 1–3 in Bua.
Socsci 08 00225 g003
Table 1. Distances along core–periphery gradients for Bua communities as a measure of expected peripherality.
NumberCommunityStraight-Line Distance to Labasa Market (km)Components of Travel to Labasa Market (km)Actual (Unweighted) Distance to Labasa Market (km)Weighted Distance to Labasa Market (km)
Sealed RoadUnsealed RoadBoat
1Dalomo9097.560103.5109.5
2Denimanu118.597.5635.8139.3216.9
3Driti84.6106140120134
4Galoa75.580.5011.592115
5Koroinasolo95.597.5190116.5135.5
6Lekutu7880.50080.580.5
7Logana10297.5623126.5178.5
8Naivaka92.580.52115.5117169
9Naviqiri8680.5210101.5122.5
10Navunievu95.597.515.50113128.5
11Tacilevu96.597.5150112.5127.5
12Tausa9197.560103.5109.5
13Yaqaga84.580.5025105.5155.5
Table 2. Calculation of peripherality indices.
CommunityIndex 1Index 2Index 3
1A1BIndex 12A2B2CIndex 23A3B3C3D3EIndex 3
Dalomo1.801.802.500.751.800.751.042.202.502.252.432.252.76
Denimanu0.750.600.161.800.900.751.153.002.001.872.062.552.66
Driti1.800.751.410.903.000.751.981.802.003.002.252.702.83
Galoa1.800.901.563.001.800.752.601.501.501.872.432.701.67
Koroinasolo0.600.750.163.000.750.751.881.501.501.502.432.551.32
Lekutu3.003.005.001.800.903.002.713.001.752.253.002.403.26
Logana0.750.750.310.600.600.600.001.801.501.871.692.701.37
Naivaka0.900.750.471.803.000.752.601.501.501.871.871.800.70
Naviqiri1.800.901.561.801.800.751.771.501.501.872.252.251.25
Navunievu1.800.901.560.750.750.600.211.802.001.872.252.101.68
Tacilevu1.800.901.561.803.000.752.603.002.001.872.252.552.78
Tausa1.801.802.500.751.800.600.942.202.002.621.872.402.40
Yaqaga0.900.750.471.801.800.751.771.501.501.502.062.250.87

