Attitudes and Motivation to Use Public or Individual Transport: A Case Study of Two Middle-Sized Cities


1
Department of Geoinformatics, Palacký University in Olomouc, 17. listopadu 12, 779 00 Olomouc, Czech Republic
2
Institute of Geoinformatics, VSB-Technical University of Ostrava, 17. listopadu 15, 708 33 Ostrava-Poruba, Czech Republic
*
Author to whom correspondence should be addressed.
Soc. Sci. 2018, 7(6), 83; https://doi.org/10.3390/socsci7060083
Submission received: 30 April 2018
/
Revised: 18 May 2018
/
Accepted: 22 May 2018
/
Published: 24 May 2018
Abstract
:This paper presents the results of a quantitative study in the Czech Republic to understand travellers’ attitudes towards and motivation to use different means of transport. Two Czech cities, Olomouc and Ostrava, are compared from the point of view of factors influencing spatial and temporal patterns and citizen’s selection of transport mode and transport behaviour (range and daily movements of the population, perception of the quality of public transport etc.). The data for the analysis were obtained from the survey with more than 500 respondents in each city. Spatial and temporal behaviour represented by the pattern of the movement in Olomouc and Ostrava city was identified by statistical and visual analytics methods. Based on a case study of two cities of a different size, we conclude that the size and shape of the city centre (spatial structure) influence not only the distances travelled but also the average speed of public transportation (slower for a smaller city). Distances and choice of transport mode also vary with the density of urban areas but can also be influenced by the spatial structure of the city. The walking distance to a public transport stop does not influence the most frequently used mode of transport. Temporal patterns in both cities are very similar and are not dependent on city size or city spatial structure. The spatial patterns of the car and public transport flows are similar in both cities. Different patterns can be observed for walking and shopping routes.
1. Introduction
Transport plays a crucial role in urban development by giving people access to employment, education, markets, recreation, health care, and other services, as well as reifying social contacts. In recent decades, the roles of transport and mobility of the population have increased, which are strongly linked to economic growth and technological progress (Bergstad et al. 2011). In the past half-century, cars have become the dominant mode of transport, and the implications of this change are congestion and pollution. In many countries, the growing popularity of individual transport is reflected in a decrease in the volume of passengers carried by public transport and has also reduced the roles of walking, cycling and other alternative modes of transport. Moreover, mass production of cars has caused changes in employment distribution, shopping patterns, social interactions, manufacturing priorities and city planning. Door-to-door transport has the highest potential to meet residents’ transport needs (Pucher 1999). However, the car is more than a means of transport (Steg 2005). Ownership of a car has also become an indicator of the standard of living and style of the population (Hiscock et al. 2002).
At present, we do not expect that the public transport system will be able to provide a level of service that will attract large numbers of people who are currently using cars (Hensher 1998). However, it is necessary to introduce or support policies that seek to increase public transport usage and change negative perceptions of and attitudes towards public transport. Public transport should be more competitive and take passengers’ needs and demands into account. These changes are possible only through a clear understanding of the influences affecting people’s choice of means of transport and attitudes towards transport. Therefore, it is necessary to obtain and evaluate information about passengers’ perceptions and attitudes that lead to the selection of a particular mode of transport.
In the Czech Republic, the number of vehicles increased 6.5 times from 1970 to 2010. While in 1970 there were 70 cars per 1000 inhabitants, in 1990 there were already 233 cars per 1000 inhabitants, in 2010 427 cars per 1000 inhabitants, and in 2018 532 cars per 1000 inhabitants. Based on official reports (Car Importers Association 2018; Ministry of Transportation 2018), this ratio is still slowly growing, and large cities in the Czech Republic face environmental and traffic problems. Therefore, one main transport policy strategies of most cities is to reduce the number of cars travelling within the city (Horak et al. 2014).
Transport behaviour and the reasons for choosing one mode of transport over another are determined by many factors. Moreover, the choice of means of transport can vary depending on the time, journey length and/or destination. To reduce car use, it is necessary to understand the underlying patterns of travel behaviour. Currently, the car is more attractive than public transport for the commonly cited reasons of greater speed, comfort, convenience, reliability, sense of freedom, and social status (Hagman 2003). However, attitudes and perceptions are based considerably on abstract and intangible aspects that are not easily measured. Thus, measurement of service quality remains a challenging and important research area, which can help us understand and identify the most important attributes of service quality that are perceived by current and potential users, and it is important to do so to understand why people not only use public transport but also why they do not want to use this means of transport and seek individual transport.
This paper presents analysis and findings from a quantitative study based on relatively large numbers of detailed interviews conducted in two large cities in the Czech Republic, Olomouc and Ostrava. Several research questions were defined: Are there any differences in transport behavior in the cities of different size and spatial structure? What are the differences in spatiotemporal patterns? What are the main influences affecting choice of means of transport? How do people perceive public transport? What are their needs when travelling? These questions are difficult, and answers vary with time and also with city, region, and country. Household travel behaviour is fundamentally interconnected with residential location and decision-making regarding many real and psychological commuting aspects described in this paper.
According to Sierpiński (2011), it is possible to define several groups of influencing factors: factors of the physical environment and transport service in the area and socio-demographic, economic, psychological and environmental factors.
Physical-geographical characteristics of the natural environment make up the basic framework of simplicity or complexity of movement in space, which has an impact on the choice of transport. At present, a complicated urban structure in a city is often related to inadequate parking and potential congestion, which could equally also be key factors of the physical environment as the positions and distance between the starting point and end destination (Hagman 2006). Increasingly less important is the distance between residence and public transport stop (Brands et al. 2014). It was already confirmed that people do not choose the nearest public transport stop because of many factors (El-Geneidy et al. 2014). The most commonly cited threshold for the walking distance standard is 400 m, after which point researchers expect the probability of using public transport to decrease rapidly (Buehler 2011; Kimpel et al. 2007). However, people in Europe and other parts of the world have since become comfortable with slightly longer distances (Walker 2012). Today, the limit of willingness is between 500 and 800 m (varying by the city size). The choice of mode of transport is also influenced by the density and diversity of settlements (Cervero and Kockelman 1997). Homogenous areas with greater population density and urbanisation have services closer to residences (Antrop 2004). It was also confirmed that urban compactness reduces the length of shopping trips, saves time and increases leisure trips (Gim 2018). People often walk or ride a bicycle in the highly urbanised areas of the city centre (Haybatollahi et al. 2015). With increasing distance from the centre, population density and urbanisation decrease and the need for car transport increases (Brownson et al. 2009). People can also be affected by the climate; however, they are more often affected by weather in the short term (Müller et al. 2008).
The second group of factors that influence people’s behaviour is the service level of the transport system. Areas with higher population density tend to have better accessibility than others (Scheiner 2010). However, accessibility is not the main attractor of residents. A considerable part of the population has left compact urbanised areas and moved to suburbs; however, these people still work in the centre (Choocharukul et al. 2008). The quality of public transport service is often characterised by the accessibility of the public transport stop, frequency of the service, modernity of the vehicle fleet, adherence to timetables, connection speeds, and other factors. People are often affected by operating conditions, especially a lack of adherence to timetables (Wakabayashi et al. 2003), because they are focused on reliability (being on time), and another major problem is uncertainty of when the transport will arrive (König and Axhausen 2002). Moreover, it is known that travel behaviour is influenced by travel time and that the priority of time increases at the expense of distance. The extra time needed for travelling by public transport is the reason why many people use a car to commute to work every day (Line et al. 2010).
Socio-demographic factors also play an important role in the choice of means of transport. The basic sociodemographic characteristic of age determines one’s stage of life, willingness to travel, health conditions that may significantly affect travel possibilities, and other factors (Zajickova et al. 2014; Alsnih and Hensher 2003). Several studies observe that at each stage of life, people have different needs and possibilities (Zwerts et al. 2010). Moreover, the choice of transport mode is strongly influenced by family status and household composition (Srinivasan and Ferreira 2002). However, according to many studies (Best and Lanzendorf 2005), use of public transport is not dependent on gender.
In terms of economic aspects, the fare level is another attribute that can have a major negative impact on passenger satisfaction (Button 2010; Hensher et al. 2003). Therefore, employment status and its nature, work schedule, work location, personal finances and the varying availability of places of residence affect the choice of means of transport (Dieleman et al. 2002).
Travel behaviour is also considerably influenced by psychological factors that are related to people's attitudes towards the various means of transport. Now, people are focused on the speed of movement and often perceive public transport as slow and unreliable (Nolan 2010). Comfort is also highly valued by passengers (Friman and Gärling 2001; Hensher et al. 2003). Hence, to attract more passengers to the public transport system, it is particularly important to know more about this group of factors that influence choice of transport and the measures needed to reduce car dependence.
It is also known that people focus more on advantages than on disadvantages. In practice, this means that people perceive the speed and convenience benefits of using cars more than its negative impact on the environment (Line et al. 2010).
2. Methodology
Because travel behaviour is a result of complex factors, quantitative or qualitative research is needed for a deep understanding of individuals’ behaviour, perceptions and attitudes (Clifton and Handy 2001). Some aspects of travel behaviour have a rational nature; however, most are based on emotions, feelings and individual perceptions. Qualitative or quantitative methods are the best way to determine what is truly important for passengers and understand the main transportation challenges (Clifton and Handy 2001).
This quantitative study was based on more than 1000 interviews (507 in Olomouc and 534 in Ostrava) focused on obtaining detailed information about travellers’ attitudes towards and motivations with regard to means of transport. The interviews were conducted in cities that are regional capitals with a population of 100,000 in Olomouc (the sixth-largest city) and 300,000 in Ostrava (the third-largest city). While Olomouc is a typical old historic town whose development was long affected by the existence of city walls (Burian et al. 2014), Ostrava is a relatively young industrial city founded through the gradual annexation of the surrounding villages, which were subsequently heavily urbanised, and now the Ostrava–Karvina agglomeration contains 700,000 people (Ivan et al. 2012).
2.1. Participant Selection Procedures
The participants were carefully selected to ensure that sufficient samples of people lived in different geographical areas of the cities with regard to the representation of gender and age groups.
On the basis of the address list, the cities were divided into smaller city districts (11 districts in Olomouc and 13 in Ostrava). The districts were delimited according to urban function (city centre, mixed area, industrial area, individual housing and mass housing) and demographic characteristics (age and gender structure). Data provided by Czech Statistical Office were used for this delimitation (census data and address points with detailed building parameters—e.g., type of building, number of floors). The day recognition method, following age and gender composition, was used to obtain the correct data structure. The collected data were checked according to the required age and gender structure of the respondents. The final number of respondents for each city district corresponds to its population (approximately 0.5% in Olomouc and 0.2% in Ostrava). The total numbers of questionnaires were 507 in Olomouc and 534 in Ostrava.
Most of the respondents were full-time workers (46%), and nearly 19.5% were retired, 17% students, 6.5% entrepreneurs, 6% on parental leave and 5% unemployed. Additionally, all education levels were represented in the sample, from elementary (8%) through secondary without graduation (one quarter) or with graduation (40.5%) to college (26.5%).
The overall structures of transport mode selection (Figure 1) in both cities revealed that a total of 45% of the respondents in Olomouc (46% in Ostrava) regularly commute to work or school by public transport (combination of public transport and walking was included), 21% (27%) use a car or motorcycle, 22% (11%) walk, 5% (2%) use a bicycle, and the rest (7% in Olomouc, 14% in Ostrava) use other means of transport (train, motorbike, combination).
2.2. Interviewing Procedures
The semi-structured interviews were prepared in advance identically for both cities (Olomouc and Ostrava). The aim of the interviews was to obtain information about the process of mode choice for the most regular routes and the influences affecting that choice. Therefore, the interview contained 19 basic questions organised in three sections: (1) information about the respondent—age, gender, employment, education, residence, and dwelling; (2) transport attitudes—perceptions of, attitudes towards, and evaluation of public transport; and (3) daily schedule—the respondent’s regular routes. In the daily schedule section, the respondents were asked to describe their normal routes during the day in terms of start and end points, duration, means of transport used, purpose, and frequency. Most of the respondents also described their motivation to use a car or public transport because the interview was primarily based on comparison of cars and public transport as they are the two major choices of transport. The interviews lasted 20 min on average and were fully recorded in writing and digitally transcribed. Respondents were recruited on the streets covering all city district. They were also informed about the purpose of the research.
2.3. Data Processing and Analysis
The data contained a relatively large number of typos or errors (e.g., typos in the text strings, transcript mistakes, indirect geocoding of addresses), which were eliminated. These corrections did not influence the sample size. By using Google Geocoding API, all the spatial information in the database (residence of respondents, origins and destinations of routes) was geocoded with different levels of accuracy (street address, nearby points of interest, district). A total of 9959 points were geocoded. According to the daily travel diary, a total of 2680 routes in Olomouc (1839 routes on weekdays and 841 on weekends) and 1510 routes in Ostrava (1126 on weekdays and 384 on weekends) were collected.
A geographic information system (GIS) was used to calculate distances and speeds between origins and destinations and closest public transport stops to residences and to analyse spatial information contained in the respondents’ answers. In the GIS environment, densely urbanised, sparsely urbanised and city suburbs were also indicated (based on the population density and urban structure type). According to the starting point, all routes were classified into these categories.
Subsequent data processing consisted of statistical evaluation. Aggregated data were mostly prepared by pivot tables. The pivot table is a data summarisation tool that is used to reorganise and summarise selected columns and rows of data. It is especially useful with large amounts of data and helps view the data from different perspectives. In total, more than 150 pivot tables for each city were created to obtain a basis for processing how people behave and identify aspects influencing their attitudes and choice of mode of transport.
The chi-square test (X2 test) for the rows and columns of each pivot table was used to determine whether there was a significant difference between the expected and observed frequencies in one or more categories. Chi-square test compares two variables in a pivot table to reveal their relationship. The null hypothesis states that the random variables are independent, which means that the probability of occurrence of a certain variable does not affect the occurrence of the second variable.
With the chi-square test, the sample of respondents was analysed in detail searching for independence of values between the two cities, in all descriptive information (e.g., gender, age, economic activity, education, and combinations). In most cases (over 95%), the independence was proved. Therefore, it can be assumed that the set of interviewees in both cities is appropriately and uniformly selected.
Due to the wide range of issues being processed in the questionnaire and their presentation in large numbers of pivot tables, the chi-square test cannot serve as a tool for the formation of generalised claims. On the other hand, it is helpful in answering very specific questions, for example, whether the different age groups in the two cities are similarly represented among people satisfied with the speed of public transport. The chi-square test is used in Section 3.6.
To explore general similarities in transport behaviour between Olomouc and Ostrava, visualisation of travelling distances with boxplot has been used. Median values together with inter-quartile range help to estimate if the distances differ or not. Two subdivisions have been selected: divisions based on the mode of transport and degree of urbanisation. Estimation can be easily made while reading boxplots, but it is recommended to support graphical representation also with statistical tests.
Since we discussed differences between transport distances, some tests comparing mean values of several groups were necessary. We wanted to analyse two main groups—the cities of Olomouc and Ostrava and their subdivision represented by mode of transport and degree of urbanisation. In this case, there are two grouping factors, which led to the use of analysis of variance (ANOVA). The assumption of normal distribution in the data was violated. Unfortunately, the non-parametric alternative of ANOVA—the Kruskal–Wallis test—does not allow comparison of multiple groups as ANOVA does. For this reason, the simple two-sample Wilcoxon test has been performed for combinations of factors.
To identify the most important clusters of origins and destinations, the standard method of kernel density estimation (KDE) was used. This method can be used for point data (point density) or line data (line density). This method of visualisation smooths out the information represented by a collection of points or lines in a way that is more visually pleasing and understandable; discrete geometry is transformed into intensity-based continuous surfaces. However, because of the faster output from this method, it is mostly not recommended to interpret it literally but rather to use qualitative or relative interpretation.
If more quantitative analysis for transport flows is needed, many cartographical methods, such as dynamic visualisation (Stampach et al. 2015) or visual analytics (Andrienko and Andrienko 2011), can be used. In this study, V-Analytics software (Geoanalytics.net, London, Great Britain) was used to identify the dominant route targets and directions. This software allows aggregating particular routes by an advanced visualisation method (Popelka 2015). The final flow maps represent the results of discrete spatial and spatio-temporal aggregation of trajectories (Andrienko and Andrienko 2011). The starting and ending points of the routes were aggregated to the hexagonal network, and the number of routes that passed between the hexagons was calculated. The procedure is based on finding the middle line; the results are displayed by arrows that show the dominant direction and intensity of movement. The entire procedure is described in detail by, e.g., (Andrienko and Andrienko 2011) or (Andrienko and Andrienko 2006).
Data analysis of behaviour, attitudes and perceptions was structured around factors reflecting both rational and emotional needs positively and negatively which influenced the choice of transport.
3. Transport Behaviour and Perceptions of and Attitudes towards Means of Transport
Transport behaviour in Olomouc and Ostrava was analysed based on the respondents’ answers in the interviews. The results showed that the choice of means of transport is influenced by many factors, such as perceived service performance, time of day, locations of the origin and destination, distance to travel, lifestyle, and individual characteristics.
3.1. Physical-Geographical Environment
Transport behaviour is limited considerably by the structure of the urban environment itself. From the interviews, it was found that the city size and structure of a settlement with a prohibition on cars in the city centre have a great impact on the choice of transport mode. Perceptions of distance and weather conditions may also cause changes in transport mode.
In general, Olomouc is characterised by a significantly higher proportion of pedestrian transport and a lower share of public and car transport than Ostrava. In Olomouc, there is also a higher proportion of multi-modal transportation combining public transportation with walking (15% in Olomouc, and only 3% in Ostrava). Olomouc city centre (mainly a pedestrian zone) in particular, surrounded by parks, offers a more comfortable environment for walking than industrial Ostrava. Thus, people in the historical city of Olomouc are more accustomed to clearing their minds by walking home through the city centre and its parks. However, only 22% of the respondents in Olomouc (11% in Ostrava) walk to work or school. Most of the routes described in the third part of the interviews are travelled by walking in Olomouc (38%); however, in Ostrava, only 20% are travelled on foot (Figure 2). Use of bicycles is relatively negligible and is balanced in both cities (3%).
Mode of transport is closely associated with the character, development, and size (distances to go) of the city and the complexity of its transport. The threshold for walking in observed cities is approximately 600 m (Figure 3), and the willingness to ride a bicycle is up to distances of approximately two kilometres. After that, people are naturally forced to change their transport mode to a motor vehicle and do not use a bicycle for longer distances. People in Ostrava (two times the size of Olomouc) are more motivated to use cars than public transport because increasing distance on public transport (especially from outskirts/suburbs) requires more time for commuting. The commuting time is related to the number of stops on the route and thus to delays and waste of time. In Ostrava, the ratio between users of cars and passengers on public transport (including public transport/walking) is 0.71; in Olomouc, it is 0.55 (Figure 2). In Olomouc, the average distance for public transport is 2457 m, and longer distances are travelled by car (4219 m). In Ostrava, people travel by public transportation 5033 m on average (2 times more than in Olomouc), and longer journeys (an average of 6993 m) are also made by car. Distances and choice of transport mode also vary with the density of urban areas (Figure 3). Distances travelled by car in sparsely urbanised areas are comparable in both cities (5277 m in Ostrava and 5733 m in Olomouc) but, a significant difference can be observed for distances travelled in densely urbanized areas (2966 m in Olomouc and 8500 m in Ostrava). This is caused by the different spatial structure of Ostrava city. Compared to Olomouc, Ostrava is not so compact, there is a larger city centre, and densely urbanized areas are farther away from it.
These differences in route distances can also be observed in Figure 4 and Table 1. Two groups of comparison have been created—differences between cities and mode of transport, and differences between cities and degree of urbanisation of place, where people start their route. Regarding differences in transport mode, tests have shown that except for walking (p-value 0.45), there are significant differences between Olomouc and Ostrava. The second tested group (differences in degree of urbanisation) had more similar combinations: people travelling from the suburb in Olomouc cover a similar distance as people travelling from densely urbanised, sparsely urbanised areas and also suburbs in Ostrava. In summary, commuting by public transport over longer distances varies with the size of the city because people perceive what is far differently.
Distance is therefore linked to the density of urban areas because population density decreases with increasing distance from the city centre. In the centre, it is difficult to use cars and find parking; additionally, public transport is often limited by pedestrian zones. This is why in the centre and in densely urbanised areas, many people walk (32.5%) and only 20.7% of journeys are made by car, while in the suburbs and outside the city, only 18.9% of journeys are made on foot and 61.4% by car (Figure 5).
As noted, larger city size is related to longer routes; as a result, it is not surprising that Ostrava is characterised by longer routes, which is also reflected in the individual routes according to different purposes (Figure 6). However, larger city size is also associated with the positions of different types of destinations. For example, university buildings are far apart, which is reflected in long journeys to study in Ostrava (7218 m compared to 2401 m in Olomouc).
Surprisingly, walking distance to the public transport stop has no influence on the most frequently used mode of transport, and people are willing to walk increasing distances to the stop. In two Czech cities, the median walking distance to the stop for people who use public transport is only 40 m shorter than that for people who use a car. According to the two-tailed t-test, there is no significant difference between these two groups. The average distance to the most-used stop in Ostrava is approximately 130 m longer than that in Olomouc (568 m). Also valuable is the finding that most people have a public transport stop within a 5-min walk from their home (83% in Olomouc, 63% in Ostrava). These differences can also be observed in Figure 7 which shows the frequency of walking distances in Olomouc and Ostrava.
According to the weighted average, potential congestion and inadequate parking are not as important as other factors (with weights of only 2.7 of 5 for congestion and 2.9 for parking). Now, people are not motivated to use public transport because of congestion or a lack of parking because travelling by car is still faster and more comfortable. In contrast, according to the respondents’ answers, these factors have medium importance for people travelling by car, and the importance increases with the size of the city (more important in Ostrava). In future, especially in connection with the increasing number of cars, these could be key reasons why people will use public transport instead of cars.
Differences in elevation and climate conditions are not significant for people, and the Czech Republic is no exception. According to the analysis of the respondents’ answers, weather affects approximately 24% of commuters, while 58% change their usual mode of transport to a car in poor weather and the rest use public transport. Most of the affected groups are those who use a bicycle or motorbike or walk.
3.2. Factors of Transport Service in the Area
Transport service is a crucial factor that influences people’s behaviour. If people do not have the option to use public transport to their destination in a reasonable time and in decent conditions, they will seek individual transport.
The attractiveness of public transport is based on many aspects, the first related to the choice of the public transport stop. In this study, the distances between each respondent’s residence and the five closest public transport stops were calculated. These distances were compared with the responses to the answer focused on the most-used stop for transport to work. According to the survey, in Olomouc and Ostrava, only 51% of all the respondents prefer the closest public transport stop. Another 20% of residents use the second-closest stop, 11% the third-closest, and subsequent stops (up to the seventh-closest) are used by approximately 2–4%. Passengers frequently select stops based on: (1) frequency of connections/stop service; (2) direct connection without changes; (3) connection speed to the city, with trams generally faster; (4) potential delays; (5) stop facilities (automatic ticket vendor, shelter); (6) overcrowded connections at peak hours; (7) feeling of safety; and (8) another reason.
Exclusions of timetables influence only a small portion of people because users of public transport often do not have the option to use a car. For example, in Olomouc, exclusions of timetables influence only 22% of people travelling by public transport but nearly 44% in Ostrava, which is a significant difference. According to expert opinion, this difference is caused by shorter delays during exclusions of timetables in Olomouc than in Ostrava.
Closures are the reason to switch from a car to public transport for 11% of people in Olomouc and 20% in Ostrava. This factor does not appear very important and also depends on the size of the city.
Travel time is the most important factor in the choice of means of transport. The average weight of this factor is the highest of all in both cities, 3.7 of 5. The number of changes is also important; people in the survey rated this factor as 3.2/5 on average. Also key is the time of departure or arrival. This factor was the second most important with the weight of 3.4/5. People do not want to waste time and risk uncertainty as to when transport will arrive, and doubt about being on time is the main reason why people choose car transport. They know that they will leave home, drive a car, find a place to park and walk a bit to the destination. They feel more certain that they will be able to keep to their schedules. According to the survey respondents, public transport is approximately 20 min slower than car travel for commuting on the most frequent journey for 54% of people in Ostrava and nearly 68% in Olomouc. Surprisingly, public transport is faster than cars for 4% of people in Olomouc. Based on the survey data (Figure 8), the average travel time is 16.9 min in Olomouc and 23.8 min in Ostrava. The average duration of the route to work is 20.4 min (24.6 min).
However, people make more and shorter journeys in the centre than in other parts of the city and spend more time walking, cycling, and on public transport than travelling by car across the entire city. In both cities, people spend 40% of their time in cars, 35% walking, 24% on public transport, and 1% riding a bicycle. Travelling by public transport takes more time in both cities (19 min in Olomouc, 27 min in Ostrava) than travelling by car (18 min in Olomouc, 23 min in Ostrava). However, the pedestrian routes are the shortest (12 min in Olomouc, 14 min in Ostrava). Additionally, the average speed for different transport means was calculated. There are no significant differences for walking (3.2 km/h in Olomouc; 3.3 km/h in Ostrava) and for cars (19.8 km/h in Olomouc; 19.6 km/h in Ostrava), but remarkable differences can be observed for public transportation (only 10.2 km/h in Olomouc; but 15.0 km/h in Ostrava). This difference can be explained by smaller distances between stops in Olomouc and by the shape of the historical city centre in Olomouc that slows down the public transportation.
3.3. Sociodemographic Factors
The interviews confirm that perceptions and attitudes are strongly influenced by lifestyle, age and health. Surprisingly, it was found that walking is almost independent of age and in all age groups remains at 16%. There is a similar situation with cycling; however, the percentage of cycling people is decreasing for the oldest age groups. In contrast, young people (age 18–24) use mainly public transport and then after age 25 replace approximately ¼ of public transport routes with car routes. People at productive ages have greater freedom of choice of means of transport and are the most concerned with saving time. The use of cars decreases again after age 55 (Figure 9). Older people (primarily age 70 or older) have a higher accident rate per kilometre driven than any other age group except young male drivers (Li et al. 2003). For this reason, they often become dependent on public transport or on accompanying family members (they become passengers).
It was found that family status and household composition greatly influence the choice of means of transport. People living in a household without children use a car for commuting over 16% less than people living with children (Figure 10). In interviews, as many as 30% of people in Ostrava and 10% in Olomouc confirmed that they are influenced by the presence of children/seniors, and more than 90% select car transport when accompanied by a member of either group. There are also differences in commuting by gender. More women (almost a 6% difference) walk, and more men (7% difference) use a car, motorbike, or bicycle.
3.4. Environmental Factors
In the survey, environmental factors influenced only 8% of respondents. People are more focused on comfort and speed as the crucial factors. For this reason, people buy cars despite the fact that they have no place to park them in the evening. Most households in the cities have at least one car (54% in Olomouc, 46%), followed by households with two cars (15% in Olomouc, 23% in Ostrava). However, almost one quarter of households (29% in Olomouc, 23% in Ostrava) still have no car. Clearly, the burden on the environment is not crucial to the choice of means of transport.
3.5. Economic Factors
In the survey, the importance of price was evaluated at 3.0 of 5.0. However, the perception of price varies according to the size of the city. In Olomouc, 79% of the respondents consider public transport cheap (the price of a ticket valid for 40 min on weekdays and 60 min on weekends is 14 Czech crowns), compared to only 48% of respondents in Ostrava (the price of a ticket valid for 30 min on weekdays and 45 min on weekends is 20 Czech crowns). According to data from the Czech Statistical Office, the average salary is higher (by approximately 5%) in the Ostrava region. This means that public transport is expensive in Ostrava in comparison with Olomouc, where people are more satisfied. In Ostrava, it is more convenient to commute by car even for medium distances. We conclude that even a small difference in ticket price can cause a significant difference in price perception.
Generally according to Figure 11, employed people choose cars more than the unemployed (nearly three times more in the survey). In contrast, entrepreneurs use cars almost exclusively due to the independence that it offers (71%).
3.6. Psychological Factors
Psychological factors are based on people’s awareness, ideas, and experiences. However, these factors are also closely related to the size of the city. As the size of the city increases, it is more difficult to maintain the attractiveness of public transport, primarily in terms of creating optimal and fast routes at affordable prices. In Olomouc (Figure 10), public transport is more attractive (68%), reliable (86%), clean (72%), safe (82%), comfortable (69%), fast (72%), and inexpensive (80%) than in Ostrava, where it is rather unattractive (56%), less reliable (83%), less clean (only 51%), less safe (70%), uncomfortable (51%), less fast (59%), and rather expensive (54%). The only statistically significant difference between the cities, however, is for the cost (expensive, inexpensive). Public transport in both cities is attractive and comfortable for students, retirees, and employees with less education, i.e., for respondents without the possibility of using a car. Respondents see comfort and conviction to travel by public transport as irrelevant in determining means of transport (weight 2.7 and 2.0 of 5.0).
As an example of the chi-square test, the perception of transport time as a decisive factor when using public transport is described: the chi-square test revealed the difference in the representation of the group for which transport time is the least important issue. Dependence is present by both sexes, and by employed people aged between 35–44. For other groups of transport time importance, the cities do not differ significantly. It can be concluded that in this case, only a small group of people differ from one city to another.
4. Spatiotemporal Patterns of Behavior
Analysis of spatiotemporal patterns of movement data is a popular topic addressed by several authors (e.g., Demšar and Virrantaus 2010). Several programs, such as bicycle sharing (Zhou 2015), public transport (Foell et al. 2014), and floating cars (Liu and Ban 2013), are common in the literature. Patterns are commonly analysed for human mobility (Hasan et al. 2013) because this approach allows not only analysing the current situation but also using the results for estimations, modelling, and simulations. The analysis of spatiotemporal patterns was used in this study to understand the behaviour of Olomouc and Ostrava residents. According to this analysis, it is possible to optimise public transport both in time according to the sequence of travel destinations and spatially by tracing the lines where the need for transport exists.
4.1. Temporal Patterns of Behaviour
The factors described in the previous section influence the behaviour of Olomouc and Ostrava residents. The behaviour can be described by statistical data or transformed into spatiotemporal patterns. The temporal pattern was elaborated according to concrete routes from the survey (2680 routes in Olomouc and 1510 routes in Ostrava). The data were analysed separately for weekdays and weekends; only three main groups of people (pensioners, students, and employees) were taken into account. Routes were sorted according to chronological order for each group to create the sequences of movement.
In general, the majority (75%) of the respondents display simple patterns of behaviour (home–destination–home), and only a few take more routes per day. Another explanation is that these extra routes are not significant enough to be included in the interview responses.
The typical time pattern of pensioners’ behaviour consists of a simple sequence of routes (home–shopping–home). This pattern accounts for approximately 61% of all the pensioners’ routes on weekdays and 57% on weekends. Other typical weekday destinations are doctors, entertainment/culture, social visits or transport of a family member. In Ostrava, a significant number of sequences are created by routes to work (part-time jobs for pensioners). On weekends, the percentages of the sequences “home–visit–home” and “home–culture–home” are higher than on weekdays.
Students’ behaviour on weekdays consists of another simple sequence (home–study–home). This sequence accounts for approximately 61% of all the students’ weekday routes in Olomouc and 82% in Ostrava. Other typical sequences are more diverse. In addition to routes to school, shopping and sport routes are included. The percentage of these sequences is higher in Olomouc than in Ostrava. On weekends, five main sequences can be identified. All consist of only one route to the destination and one route back home. The most common destinations are entertainment, shopping, sport, social visits and work. These sequences account for approximately 18% of weekend routes on average.
Employees’ behaviour is represented by two main time patterns. The first (home–work–home) accounts for approximately 70% of weekday routes in both cities. The second pattern is represented by the sequence “home–work–shopping–home” and constitutes approximately 19% of weekday routes in Olomouc and 10% in Ostrava. The third most frequent sequence is similar to the previous sequence—only one route home is included after work. On the weekends there is still a high percentage of the sequence “home–work–home“, accounting for 26% in Olomouc and 21% in Ostrava. The majority of the sequences are distributed between shopping routes (36%), social visit routes 11%, entertainment/culture routes (11%) and sport routes 9%. In conclusion, temporal patterns in Olomouc and Ostrava (at this level of detail) are very similar and are not dependent on city size or city spatial structure.
4.2. Spatial Patterns of Behaviour
Statistical analysis normally does not consider spatial aspects and cannot show the spatial patterns of people's behaviour in a form that is very clear and understandable. The visual analytics method in the software V-Analytics was used to identify the main flow direction and destinations of movement in the city. In the analysis, only the routes travelled by car, public transport or walking were selected. Spatial patterns can be identified from the flow maps presented in Figure 12, Figure 13, Figure 14, Figure 15, Figure 16, Figure 17, Figure 18 and Figure 19. Flow maps are the result of a spatial aggregation of the trajectories of each route. The direction of the arrow represents the direction of the dominant movement. The size (thickness) of the arrows represents the intensity of movement.
The majority of the routes in Olomouc have concentric directions (Figure 12), and most travel to and from the city centre. The routes travelled by car (Figure 13) and by public transport (Figure 14) are distributed across the entire city; the significant flows from suburbs are also visible in the north-east or the north-west. The main directions of public transport correspond to the existing public transport network. Due to good walking accessibility and the proximity of settlements, frequent destinations achieved by walking (Figure 15) are shopping centres. Most of the walking routes are concentrated in the city centre and in the western and southern parts of the city, where the most populous settlements in Olomouc are located. In the centre of Olomouc, a higher proportion of public transport and less car traffic can also be seen. In contrast, in the more peripheral areas of the city, more targets are reached by car; however, the frequency of these targets is relatively low.
In Ostrava (Figure 16), there are relatively few targets that are travelled to by all means of transport. In most cases, only one or two means of transport are dominant. The most significant flow exists between the centre and western parts of the city. Other significant flows of public transport (Figure 18) are heading to the city centre. These flows are accompanied by less numerous and more scattered routes travelled by car (Figure 17) and on foot (Figure 19). The most common targets in the city centre are shopping malls and parking areas related to car transport. The flow of car traffic is characterised by longer distances; the most significant flow comes from municipalities in suburbs in the south-west. The entire southern part of the city is visited by a combination of all the types of transport. However, there is a significant difference between the western part of the southern cities (dominated by public transport) and the eastern part with regard to the walking routes. An important target of the routes travelled by public transport is the industrial southern part of the city (where the large company Arcellor Mittal is located). The western part of the city is dominated by targets reached by public transport (the area of Technical University Ostrava) and car (the University Hospital).
The spatial patterns of car and public transport flows are similar in both cities. The flows cover the majority of the compact cities, and other significant flows to and from the suburbs are visible. Because of the larger size of Ostrava city and its strong influence on its close surroundings, a more significant impact on suburbs is visible there than in Olomouc. Similar patterns in both cities were analysed using the example of routes to work and schools. Employees are distributed uniformly, which also reflects the spatial pattern of most work routes. Except for the largest companies or institutions, flows cover the entire area of the cities. Routes to schools are concentrated in the most frequent destinations (university buildings). Different patterns can be observed for walking and shopping routes. In Olomouc, there is a larger number of more intensive walking routes than in Ostrava. Walking flows are distributed among almost all the parts of Olomouc city; in Ostrava, only a few walking flows can be observed. Shopping routes also have a different spatial pattern. The majority of the shopping routes in Ostrava are heading to the main shopping centres. In Olomouc, there are some flows to the main shopping centres; however, people are more accustomed (a larger number of intensive flows) to using local shops (in the most populous city districts).
5. Discussion
To compete with the car, public transport must offer the quality of service desired by regular and potential users. It is important to understand the most important service attributes and what would make people switch to public transport (STIMULUS 1999). Interviews were conducted with the aim of identifying the key aspects influencing individual respondents’ attitudes and perceptions. However, as found, some facts depend on the city size, population structure, population density and distribution of resources and destinations. Therefore, the study was also based on statistical analysis and visual analytics methods, which helped recognise spatial and temporal patterns of population behaviour. Similar patterns for cars and public transport were identified. Based on the analysis of the interviews, several crucial conclusions in all the groups of factors were reached.
According to Gardner and Abraham (2007), reliability and time are the most influential factors in the choice of means of transport. Similarly, in this study, the travel time and related number of changes (on public transport) are the most important factors in the choice of means of transport (weighted 3.7 of 5 and 3.2 of 5). The times of departure and arrival are also crucial factors (3.4/5). Employed people primarily do not want to waste time because of busy weekdays, and they want to control the time and speed of the route when travelling. In other words, the reliability of public transport is the most influential aspect. It is, however, important to note that the significance of travel time depends on the type of journey. For journeys related to work/school activities, time is much more important. It was found that, particularly in cities with parks and centres with a pedestrian zone, people are more willing to walk home and to shops, meetings, and other destinations.
Lack of adherence to timetables may affect travelling in larger cities. However, closures are a reason to change from cars to public transport for only a few people.
However, it was found that the city size and spatial structure influence travel time and thus the proportions of pedestrian and car transport (Zhao et al. 2011). For example, the proportion of pedestrian movements is two times higher in Olomouc than in Ostrava, which is twice as large in size. Conversely, the proportion of car travel is significantly lower in Olomouc. Olomouc is a more walkable city than Ostrava, which is reflected by its smaller size and the historical spatial structure with the clearly defined city centre. Additionally, the average distance of routes in Ostrava is approximately 59% longer than routes in Olomouc (5244 m; 2147 m, valid for all means of transport). Typical temporal patterns of behaviour are not dependent on city size and structure. Almost all the described sequences of daytime population behaviour are the same or similar in both cities. No significant difference was found.
Density and diversity of settlement influence the choice of transport mode significantly. While in the centre and densely urbanised areas, many people tend to walk (in Czech cities up to 32.5%) and only a small portion of journeys are made by car (20.7%), in the suburbs and outside of the cities generally it is exactly the opposite (18.9% of journeys are made on foot and 61.4% by car). These findings correspond with the findings of Soltani (2005).
As Ryley (2006) concluded, family status and household composition greatly influence the choice of means of transport. In this study, for people with small children, it is more comfortable to use a car than public transport. Households without children use a car for commuting approximately 16% less than people living with children.
The need to commute to work and income also influence the choice of means of transport. Employed people choose a car nearly 3× more often than unemployed people, and entrepreneurs use a car in most cases (71%). Moreover, a small difference in public transport ticket price can cause a significant difference in price perception. However, several authors deny the importance of this factor (Beirão and Cabral 2007).
People do not choose means of transport on the basis of convenience; however, city size affects satisfaction with public transport. Based on a study, people’s choice of transport mode in Olomouc is not influenced by negative perceptions of public transport. Surprisingly, travelling comfort and other psychological factors are not reasons to use a car instead of public transport.
Use of public transport is not dependent on gender (Newbold et al. 2005). Walking is independent of age; however, the use of cars and public transport are dependent on age. For ages 25–34, there is a significant increase in the use of cars. The use of cars decreases after age 55 because of the degree of individuality and dependence on others. Males and females use public transport equally.
Congestion and lack of parking spaces are not necessarily reasons to use public transport (weights of only 2.7 of 5.0 for congestion and 2.9 for parking spaces), similar to Hensher and King (Hensher and King 2001).
The walking distance to the stop has no influence on the most frequent mode of transport. It was found that the median walking distance to the stop for people who use public transport is only 40 m shorter than for people who use a car, which is not significantly different. People are also more willing to walk greater distances to the stop (approximately 500 m) than is the standard in the literature (Murray and Wu 2003). Daniels and Mulley (2013), for example, had the same findings in Sydney (the average was 573 m). The reason is travel comfort, and thus only 50% of public transport users prefer the closest stop. People mostly choose the stop according to the frequency of connections/stop service, direct connections without changes and connection speed to the city.
Environmental factors are not important for respondents and commuting people in general, as noted for example by Nilsson and Küller (2000). People are more focused on their own needs and comfort in daily travel; many households own more than one car without worrying about the consequences.
6. Conclusions
This quantitative study has highlighted some key factors influencing people’s attitudes and perceptions when choosing a mode of transport. This study was based on more than 1000 in-depth interviews with the general public in two middle-sized cities in the Czech Republic. The qualitative and quantitative procedures enabled to us to obtain detailed information about customer perceptions of and attitudes towards transport.
Based on a case study of two cities of different sizes we conclude that a smaller city leads to a higher proportion of pedestrian transport. Size and shape of the city centre (spatial structure) influence not only the distances travelled but also the average speed of public transportation (slower for a smaller city). Use of bikes is more dependent on bicycle infrastructure and is not influenced by the city size. The dominant transportation mode in the city centre is walking, and the use of cars increases with decreasing density of the population. Distances and choice of transport mode also vary with the density of urban areas but can also be influenced by the spatial structure of the city.
Surprisingly, the walking distance to the public transport stop does not influence the most frequently used mode of transport. The threshold for walking in observed cities is approximately 600 m which coincides with other studies abroad. More than 50% of travellers do not prefer the closest public transportation stops and choose stops with a better connection. Travel time is the most significant factor in the choice of means of transport.
Temporal patterns in both cities (at this level of detail) are very similar and are not dependent on city size or city spatial structure. The spatial patterns of the car and public transport flows are similar in both cities. Because of the larger size of Ostrava city and its strong influence on its close surroundings, a more significant impact on suburbs is visible there than in Olomouc. Different patterns can be observed for walking and shopping routes. Walking flows are distributed among almost all the parts of Olomouc city; in Ostrava, only a few walking flows can be observed. The key findings indicate that public transport service should be designed with respect to the levels of service required by customers. People are focused on time, and they want fast, reliable service with high quality. In sparsely urbanised areas (still part of the compact urbanised area), there is the greatest potential to attract more passengers. In these parts of cities, over 40% of people use a car because it is faster, and public transport is not able to compete with individual transport. The connection should be as fast as possible without transfers with a stop within approximately 500 m. Now, people need more information than ever before because they have more possibilities. Passengers or potential passengers do not always have enough information regarding bus routes or changed timetables. They also need more information when travelling about delays and substitute transport (Zajickova 2015). Additionally, prices should be reasonable in relation to people’s salaries because even a small increase in price can cause a significant loss of attractiveness. The largest group of people that it is necessary to move to public transport is those aged 25–54. These people are the strictest in terms of expectations and demands of transport. They want a comfortable relaxed journey, preferably with a seat, in a not too crowded space, and a smooth ride without unpleasant odours. If public transport is not able to offer this possibility, then they use a car because they do not perceive public transport as a viable alternative.
Finally, it is necessary to understand people’s attitudes towards and perceptions of the mode of transport and to also take into consideration that different people have different needs and motivations. Thus, city and transport planning must reflect the real demands and real behaviour of the population. As this paper confirmed, if data are collected according to stratified and representative selection and according to spatial distribution, then the results can be considered to be very relevant. It is possible to identify a wide range of information regarding the time pattern of the population’s behaviour. According to the analysis described in this paper, it is possible to improve the quality of the planning process and make city development smarter and more suitable.
Author Contributions
Conceptualization, J.B. and I.I.; Methodology, J.B. and L.Z.; Investigation, J.B., L.Z. and K.M.; Data Curation, L.Z. and K.M.; Writing-Original Draft Preparation, J.B., L.Z. and I.I.; Visualization, J.B.; Supervision, J.B.
Funding
The research was supported by the Czech Science Foundation, project Spatial simulation modelling of accessibility, No. 14-26831S; and by Internal Grant Agency of Palacký University Olomouc (project IGA_PrF_2018_028).
Conflicts of Interest
The authors declare no conflict of interest.
References
- Alsnih, Rahaf, and David A. Hensher. 2003. The Mobility and Accessibility Expectations of Seniors in an Aging Population. Transportation Research Part A: Policy and Practice 37: 903–16. [Google Scholar] [CrossRef]
- Andrienko, Natalia, and Gennady Andrienko. 2006. Exploratory Analysis of Spatial and Temporal Data. Berlin/Heidelberg: Springer-Verlag. [Google Scholar] [CrossRef]
- Andrienko, Natalia, and Gennady Andrienko. 2011. Spatial Generalization and Aggregation of Massive Movement Data. IEEE Transactions on Visualization and Computer Graphics 17: 205–19. [Google Scholar] [CrossRef] [PubMed]
- Antrop, Marc. 2004. Landscape Change and the Urbanization Process in Europe. Landscape and Urban Planning 67: 9–26. [Google Scholar] [CrossRef]
- Beirão, Gabriela, and J. A. Sarsfield Cabral. 2007. Understanding Attitudes towards Public Transport and Private Car: A Qualitative Study. Transport Policy 14: 478–89. [Google Scholar] [CrossRef]
- Bergstad, Cecilia Jakobsson, Amelie Gamble, Tommy Gärling, Olle Hagman, Merritt Polk, Dick Ettema, Margareta Friman, and Lars E. Olsson. 2011. Subjective Well-Being Related to Satisfaction with Daily Travel. Transportation 38: 1–15. [Google Scholar] [CrossRef]
- Best, Henning, and Martin Lanzendorf. 2005. Division of Labour and Gender Differences in Metropolitan Car Use. An Empirical Study in Cologne, Germany. Journal of Transport Geography 13: 109–21. [Google Scholar] [CrossRef]
- Brands, Ties, Erik De Romph, Tim Veitch, and Jamie Cook. 2014. Modelling Public Transport Route Choice, with Multiple Access and Egress Modes. Transportation Research Procedia 1: 12–23. [Google Scholar] [CrossRef]
- Brownson, Ross C., Christine M. Hoehner, Kristen Day, Ann Forsyth, and James F. Sallis. 2009. Measuring the Built Environment for Physical Activity. American Journal of Preventive Medicine 36: S99–S123. [Google Scholar] [CrossRef] [PubMed]
- Buehler, Ralph. 2011. Determinants of Transport Mode Choice: A Comparison of Germany and the USA. Journal of Transport Geography 19: 644–57. [Google Scholar] [CrossRef]
- Burian, Jaroslav, Lenka Zajickova, Pavel Tucek, Vít Vozenilek, Barbora Langrova, and Mukesh Singh Boori. 2014. Traffic Intensity Changes and Their Influence on Spatial Distribution of Suburbanization. Paper presented at 14th International Multidisciplinary Scientific GeoConference SGEM 2014, Sofia, Bulgaria, June 19–25; Volume 1, pp. 895–902. [Google Scholar] [CrossRef]
- Button, K. 2010. Transport Economics, 3rd rev. ed. Cheltenham: Edward Elgar Publishing Ltd. [Google Scholar]
- Car Importers Association. 2018. Car Statistics. Available online: http://portal.sda-cia.cz/stat.php?v#str=vpp (accessed on 17 May 2018).
- Cervero, Robert, and Kara Kockelman. 1997. Travel Demand and the 3Ds: Density, Diversity, and Design. Transportation Research Part D: Transport and Environment 2: 199–219. [Google Scholar] [CrossRef]
- Choocharukul, Kasem, Hong Tan Van, and Satoshi Fujii. 2008. Psychological Effects of Travel Behavior on Preference of Residential Location Choice. Transportation Research Part A: Policy and Practice 42: 116–24. [Google Scholar] [CrossRef]
- Clifton, Kelly J., and Susan L. Handy. 2001. Qualitative Methods in Travel Behaviour Research. In Transport Survey Quality and Innovation. Bingley: Emerald Group Publishing Limited, pp. 1–20. [Google Scholar]
- Daniels, Rhonda, and Corinne Mulley. 2013. Explaining Walking Distance to Public Transport: The Dominance of Public Transport Supply. Journal of Transport and Land Use 6: 5–20. [Google Scholar] [CrossRef]
- Demšar, Urška, and Kirsi Virrantaus. 2010. Space–Time Density of Trajectories: Exploring Spatio–Temporal Patterns in Movement Data. International Journal of Geographical Information Science 24: 1527–42. [Google Scholar] [CrossRef]
- Dieleman, Frans M., Martin Dijst, and Guillaume Burghouwt. 2002. Urban Form and Travel Behaviour: Micro-Level Household Attributes and Residential Context. Urban Studies 39: 507–27. [Google Scholar] [CrossRef]
- El-Geneidy, Ahmed, Michael Grimsrud, Rania Wasfi, Paul Tétreault, and Julien Surprenant-Legault. 2014. New Evidence on Walking Distances to Transit Stops: Identifying Redundancies and Gaps Using Variable Service Areas. Transportation 41: 193–210. [Google Scholar] [CrossRef]
- Foell, Stefan, Santi Phithakkitnukoon, Gerd Kortuem, Marco Veloso, and Carlos Bento. 2014. Catch Me If You Can: Predicting Mobility Patterns of Public Transport Users. Paper presented at 17th International IEEE Conference on Intelligent Transportation Systems (ITSC), Qingdao, China, October 8–11; pp. 1995–2002. [Google Scholar] [CrossRef]
- Friman, Margareta, and Tommy Gärling. 2001. Frequency of Negative Critical Incidents and Satisfaction with Public Transport Services. II. Journal of Retailing and Consumer Services 8: 105–14. [Google Scholar] [CrossRef]
- Gardner, Benjamin, and Charles Abraham. 2007. What Drives Car Use? A Grounded Theory Analysis of Commuters’ Reasons for Driving. Transportation Research Part F: Traffic Psychology and Behaviour 10: 187–200. [Google Scholar] [CrossRef]
- Gim, Tae Hyoung Tommy. 2018. Land Use, Travel Utility and Travel Behaviour: An Analysis from the Perspective of the Positive Utility of Travel. Papers in Regional Science 97: S169–92. [Google Scholar] [CrossRef]
- Hagman, Olle. 2003. Mobilizing Meanings of Mobility: Car Users’ Constructions of the Goods and Bads of Car Use. Transportation Research Part D: Transport and Environment 8: 1–9. [Google Scholar] [CrossRef]
- Hagman, Olle. 2006. Morning Queues and Parking Problems. On the Broken Promises of the Automobile. Mobilities 1: 63–74. [Google Scholar] [CrossRef]
- Hasan, Samiul, Christian Schneider, Satish Ukkusuri, and Marta González. 2013. Spatiotemporal Patterns of Urban Human Mobility. Journal of Statistical Physics 151: 304–18. [Google Scholar] [CrossRef]
- Haybatollahi, Mohammad, Michal Czepkiewicz, Tiina Laatikainen, and Marketta Kyttä. 2015. Neighbourhood Preferences, Active Travel Behaviour, and Built Environment: An Exploratory Study. Transportation Research Part F: Traffic Psychology and Behaviour 29: 57–69. [Google Scholar] [CrossRef]
- Hensher, David A. 1998. The Imbalance between Car and Public Transport Use in Urban Australia: Why Does It Exist? Transport Policy 5: 193–204. [Google Scholar] [CrossRef]
- Hensher, David A., and Jenny King. 2001. Parking Demand and Responsiveness to Supply, Pricing and Location in the Sydney Central Business District. Transportation Research Part A: Policy and Practice 35: 177–96. [Google Scholar] [CrossRef]
- Hensher, David A., Peter Stopher, and Philip Bullock. 2003. Service Quality—Developing a Service Quality Index in the Provision of Commercial Bus Contracts. Transportation Research Part A: Policy and Practice 37: 499–517. [Google Scholar] [CrossRef]
- Hiscock, Rosemary, Sally Macintyre, Ade Kearns, and Anne Ellaway. 2002. Means of Transport and Ontological Security: Do Cars Provide Psycho-Social Benefits to Their Users? Transportation Research Part D: Transport and Environment 7: 119–35. [Google Scholar] [CrossRef]
- Horak, Jiri, Igor Ivan, David Fojtik, and Jaroslav Burian. 2014. Large Scale Monitoring of Public Transport Accessibility in the Czech Republic. Paper presented at 2014 15th International Carpathian Control Conference (ICCC), Velke Karlovice, Czech, May 28–30; pp. 157–63. [Google Scholar]
- Ivan, Igor, Tomas Boruta, and Jiří Horák. 2012. Evaluation of Railway Surrounding Areas: The Case of Ostrava City. WIT Transactions on the Built Environment 128: 141–52. [Google Scholar] [CrossRef]
- Kimpel, T.J., K.J. Dueker, and A.M. El-Geneidy. 2007. Using GIS to Measure the Effect of Overlapping Service Areas on Passenger Boardings at Bus Stops. URISA Journal 19: 5–11. [Google Scholar]
- König, A., and K. W. Axhausen. 2002. The Reliability of the Transportation System and Its Influence on the Choice Behaviour. In Paper presented at Proceedings of the 2nd Swiss Transportation Research Conference, Monte Verità, Ascona, Switzerland, March 20–22; Available online: http://www.researchgate.net/publication/228715441_The_reliability_of_the_Transportation_System_and_its_influence_on_the_Choice_Behaviour/file/504635199ca51f0043.pdf (accessed on 12 April 2018).
- Li, Guohua, Elisa R. Braver, and Li Hui Chen. 2003. Fragility versus Excessive Crash Involvement as Determinants of High Death Rates per Vehicle-Mile of Travel among Older Drivers. Accident Analysis and Prevention 35: 227–35. [Google Scholar] [CrossRef]
- Line, Tilly, Kiron Chatterjee, and Glenn Lyons. 2010. The Travel Behaviour Intentions of Young People in the Context of Climate Change. Journal of Transport Geography 18: 238–46. [Google Scholar] [CrossRef]
- Liu, Xintao, and Yifang Ban. 2013. Uncovering Spatio-Temporal Cluster Patterns Using Massive Floating Car Data. Isprs International Journal of Geo-Information 2: 371–84. [Google Scholar] [CrossRef]
- Ministry of Transportation. 2018. Central Car Register. Available online: https://www.mdcr.cz/Statistiky/Silnicni-doprava/Centralni-registr-vozidel (accessed on 17 May 2018).
- Müller, Sven, Stefan Tscharaktschiew, and Knut Haase. 2008. Travel-to-School Mode Choice Modelling and Patterns of School Choice in Urban Areas. Journal of Transport Geography 16: 342–57. [Google Scholar] [CrossRef]
- Murray, Alan T., and Xiaolan Wu. 2003. Accessibility Tradeoffs in Public Transit Planning. Journal of Geographical Systems 5: 93–107. [Google Scholar] [CrossRef]
- Newbold, K. Bruce, Darren M. Scott, Jamie E.L. Spinney, Pavlos Kanaroglou, and Antonio Páez. 2005. Travel Behavior within Canada’s Older Population: A Cohort Analysis. Journal of Transport Geography 13: 340–51. [Google Scholar] [CrossRef]
- Nilsson, Maria, and Rikard Küller. 2000. Travel Behaviour and Environmental Concern. Transportation Research Part D: Transport and Environment 5: 211–34. [Google Scholar] [CrossRef]
- Nolan, Anne. 2010. A Dynamic Analysis of Household Car Ownership. Transportation Research Part A: Policy and Practice 44: 446–55. [Google Scholar] [CrossRef]
- Popelka, Stanislav. 2015. Decision Scheme for the Selection of the Most Appropriate Method for Analyses and Visualization of Eye-Tracking Data in Cartographic Research. Paper presented at 15th International Multidisciplinary Scientific GeoConference SGEM 2015, Albena, Bulgaria, June 18–24; Book 2. Volume 2, pp. 803–10. [Google Scholar] [CrossRef]
- Pucher, John. 1999. The Transformation of Urban Transport in the Czech Republic, 1988–1998. Transport Policy 6: 225–36. [Google Scholar] [CrossRef]
- Ryley, Tim. 2006. Use of Non-Motorised Modes and Life Stage in Edinburgh. Journal of Transport Geography 14: 367–75. [Google Scholar] [CrossRef]
- Scheiner, Joachim. 2010. Interrelations between Travel Mode Choice and Trip Distance: Trends in Germany 1976–2002. Journal of Transport Geography 18: 75–84. [Google Scholar] [CrossRef]
- Sierpiński, Grzegorz. 2011. Travel Behaviour and Alternative Modes of Transportation. Communications in Computer and Information Science 239: 86–93. [Google Scholar] [CrossRef]
- Soltani, Ali. 2005. Exploring the Impacts of Built Environments on Vehicle Ownership. Paper presented at 6th Conference of the Eastern-Asia-Society-for-Transportation-Studies, Bangkok, Thailand, September 21–24; pp. 2151–63. [Google Scholar]
- Srinivasan, Sumeeta, and Joseph Ferreira. 2002. Travel Behavior at the Household Level: Understanding Linkages with Residential Choice. Transportation Research Part D: Transport and Environment 7: 225–42. [Google Scholar] [CrossRef]
- Stampach, Radim, Petr Kubicek, and Lukas Herman. 2015. Dynamic Visualization of Sensor Measurements: Context Based Approach. Quaestiones Geographicae 34: 117–28. [Google Scholar] [CrossRef]
- Steg, Linda. 2005. Car Use: Lust and Must. Instrumental, Symbolic and Affective Motives for Car Use. Transportation Research Part A: Policy and Practice 39: 147–62. [Google Scholar] [CrossRef]
- STIMULUS. 1999. Segmentation for Transport in Markets Using Latent User Psychological Structures. Transport Research Fourth Framework Programme, Office for Official Publications of the European Communities. Available online: http://www.transport-research.info/sites/default/files/project/documents/stimulus.pdf (accessed on 17 March 2018).
- Wakabayashi, Hiroshi, Katsuhiko Asaoka, Yasunori Iida, and Hiroyuki Kameda. 2003. Mode Choice Model with Travel Time Reliability and Commuters’ Travel Behavior before/after a Major Public Transportation Service Closure. In Network Reliability of Transport: Proceedings of the 1st International Symposium on Transportation Network Reliability (INSTR). Bingley: Emerald Group Publishing Limited. [Google Scholar]
- Walker, Jarrett. 2012. Human Transit: How Clearer Thinking about Public Transit Can Enrich Our Communities and Our Lives. Washington: Island Press. [Google Scholar] [CrossRef]
- Zajickova, Lenka. 2015. Geoinformatics for Intelligent Transportation. Geoinformatics for Intelligent Transportation. Lecture Notes in Geoinformation and Cartography. Edited by Igor Ivan, Itzhak Benenson, Bin Jiang, Jiří Horák, James Haworth and Tomáš Inspektor. Cham: Springer International Publishing. [Google Scholar] [CrossRef]
- Zajickova, Lenka, Vit Vozenilek, Jaroslav Burian, and Pavel Tucek. 2014. Demand Specifications for Geodata within a Public Transport System. Paper presented at SGEM2014 Conference Proceedings, Albena, Bulgaria, June 19–25; Volume 1, pp. 555–62. [Google Scholar] [CrossRef]
- Zhao, Pengjun, Bin Lu, and Gert de Roo. 2011. The Impact of Urban Growth on Commuting Patterns in a Restructuring City: Evidence from Beijing. Papers in Regional Science 90: 735–54. [Google Scholar] [CrossRef]
- Zhou, Xiaolu. 2015. Understanding Spatiotemporal Patterns of Biking Behavior by Analyzing Massive Bike Sharing Data in Chicago. PLoS ONE 10: e0137922. [Google Scholar] [CrossRef] [PubMed]
- Zwerts, Enid, Georges Allaert, Davy Janssens, Geert Wets, and Frank Witlox. 2010. How Children View Their Travel Behaviour: A Case Study from Flanders (Belgium). Journal of Transport Geography 18: 702–10. [Google Scholar] [CrossRef] [Green Version]
Figure 1.
Structure of regularly used mode of transport to work and school in Olomouc and Ostrava.

Figure 2.
Structure of routes by means of transport in Olomouc and Ostrava.
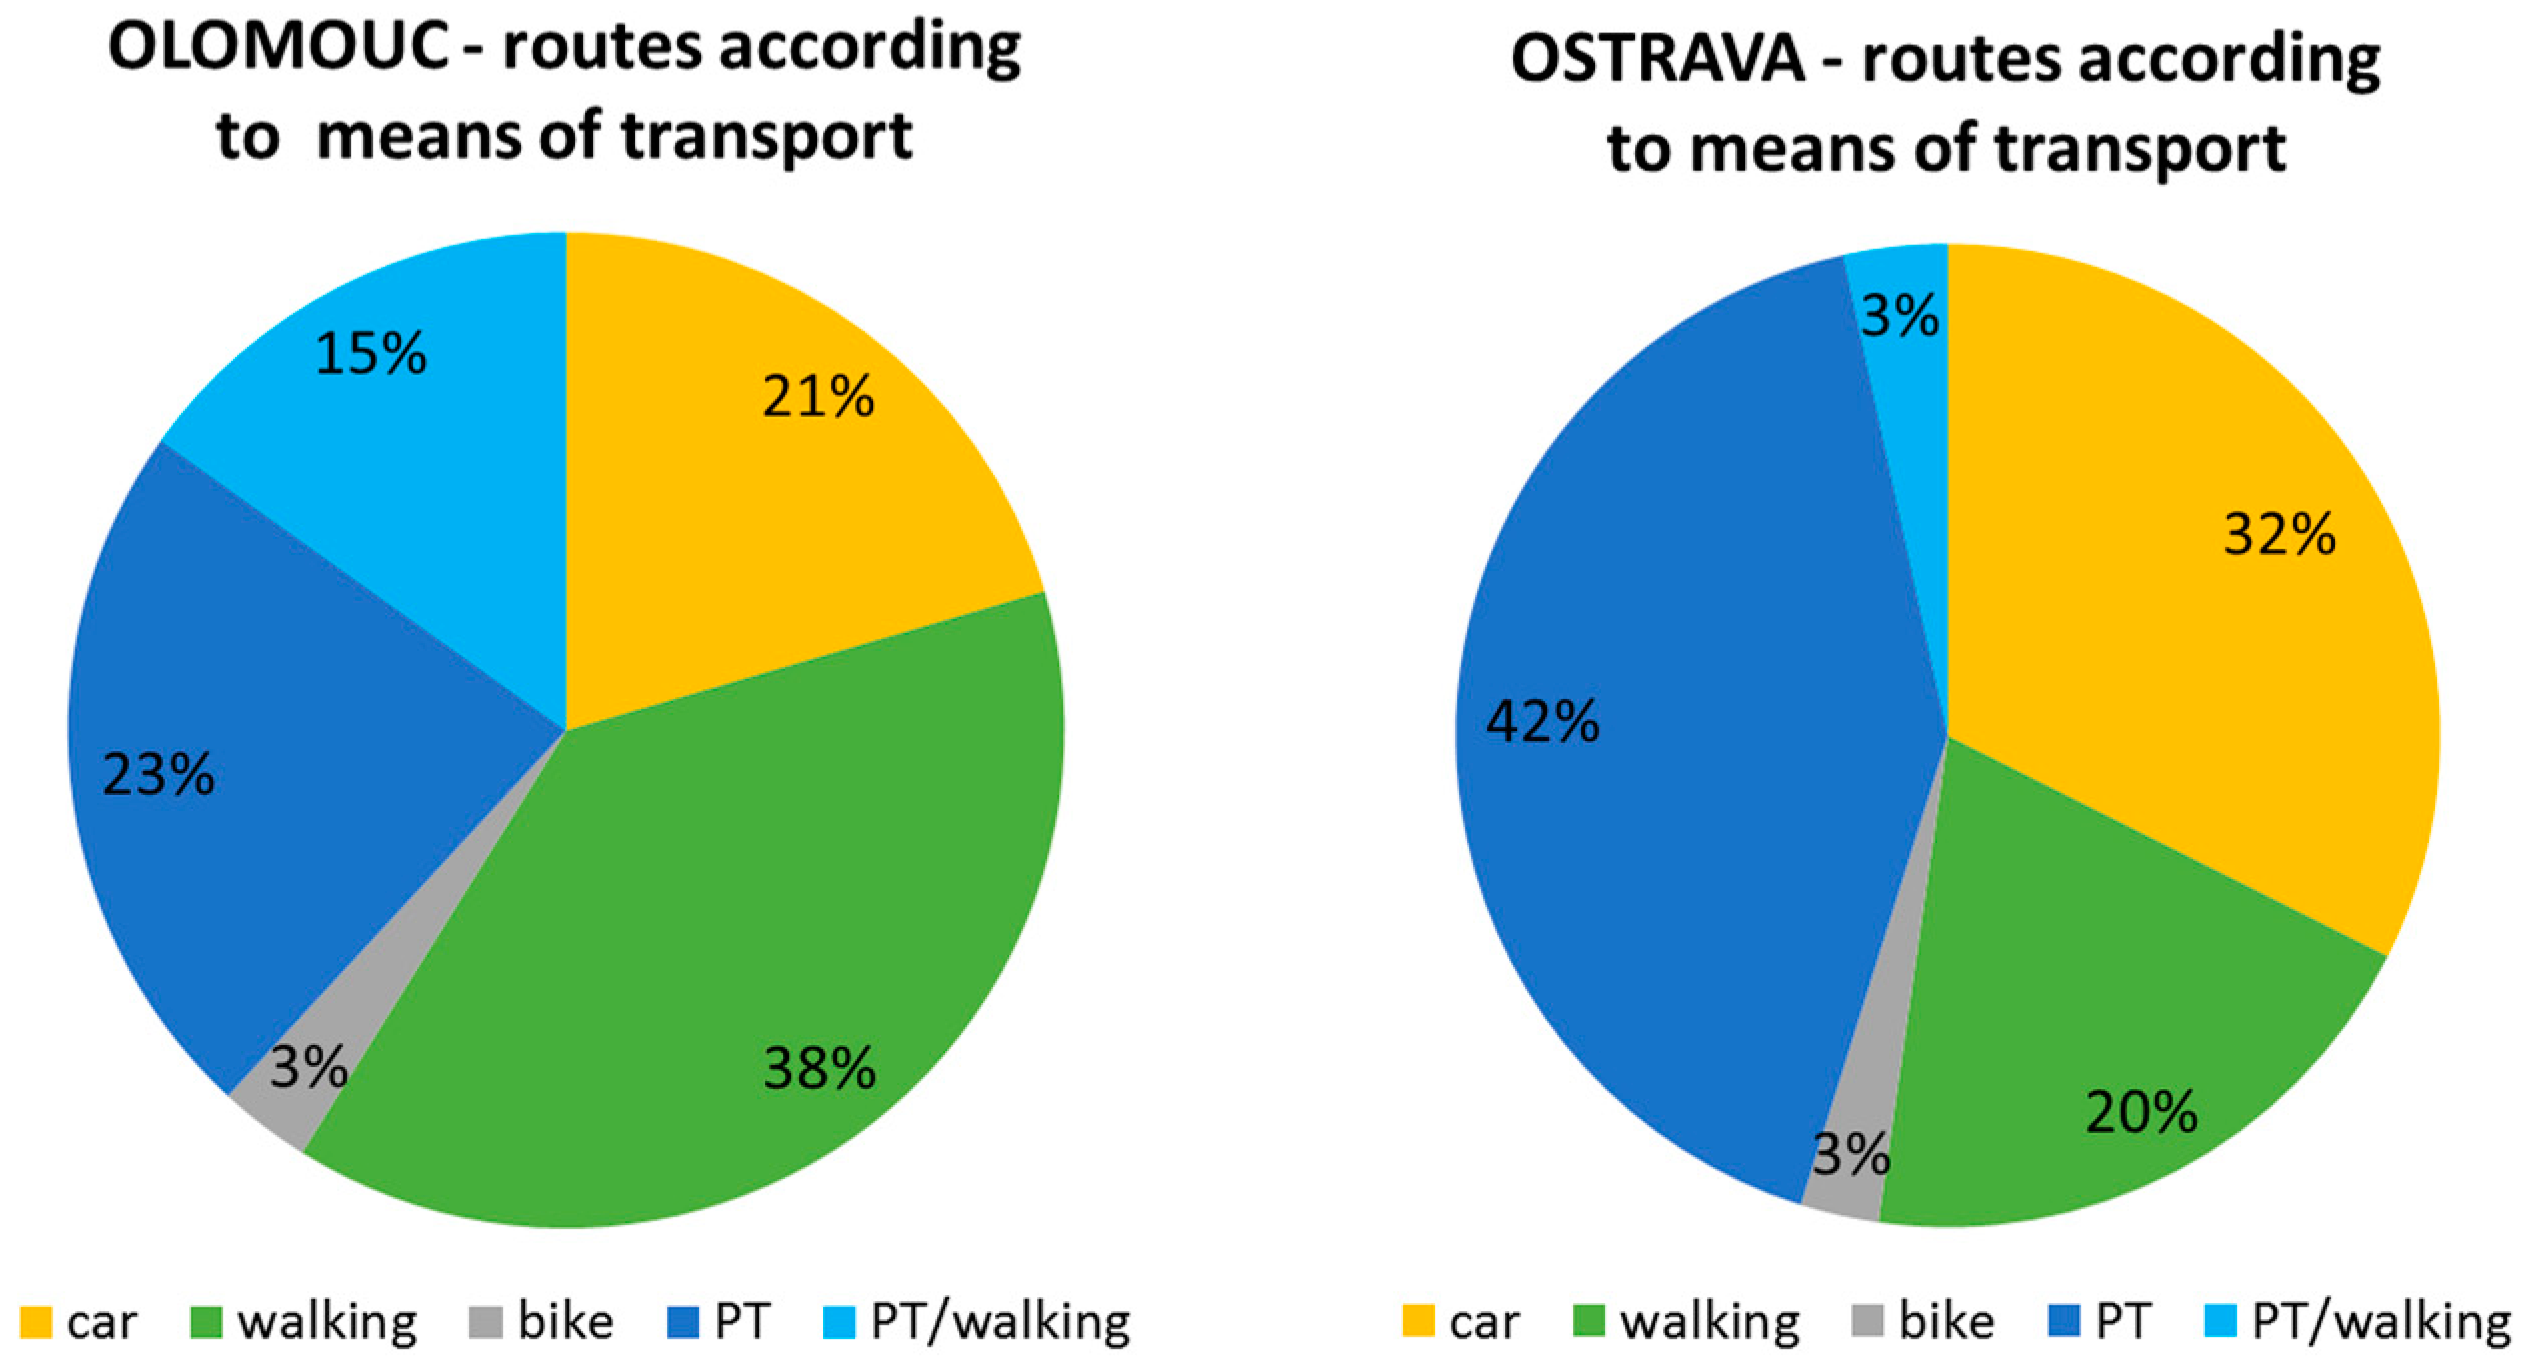
Figure 3.
Average route distance according to the degree of urbanisation and mode of transport in Olomouc and Ostrava.
Figure 3.
Average route distance according to the degree of urbanisation and mode of transport in Olomouc and Ostrava.

Figure 4.
Route distance differences between cities, transportation modes in different city districts.
Figure 4.
Route distance differences between cities, transportation modes in different city districts.
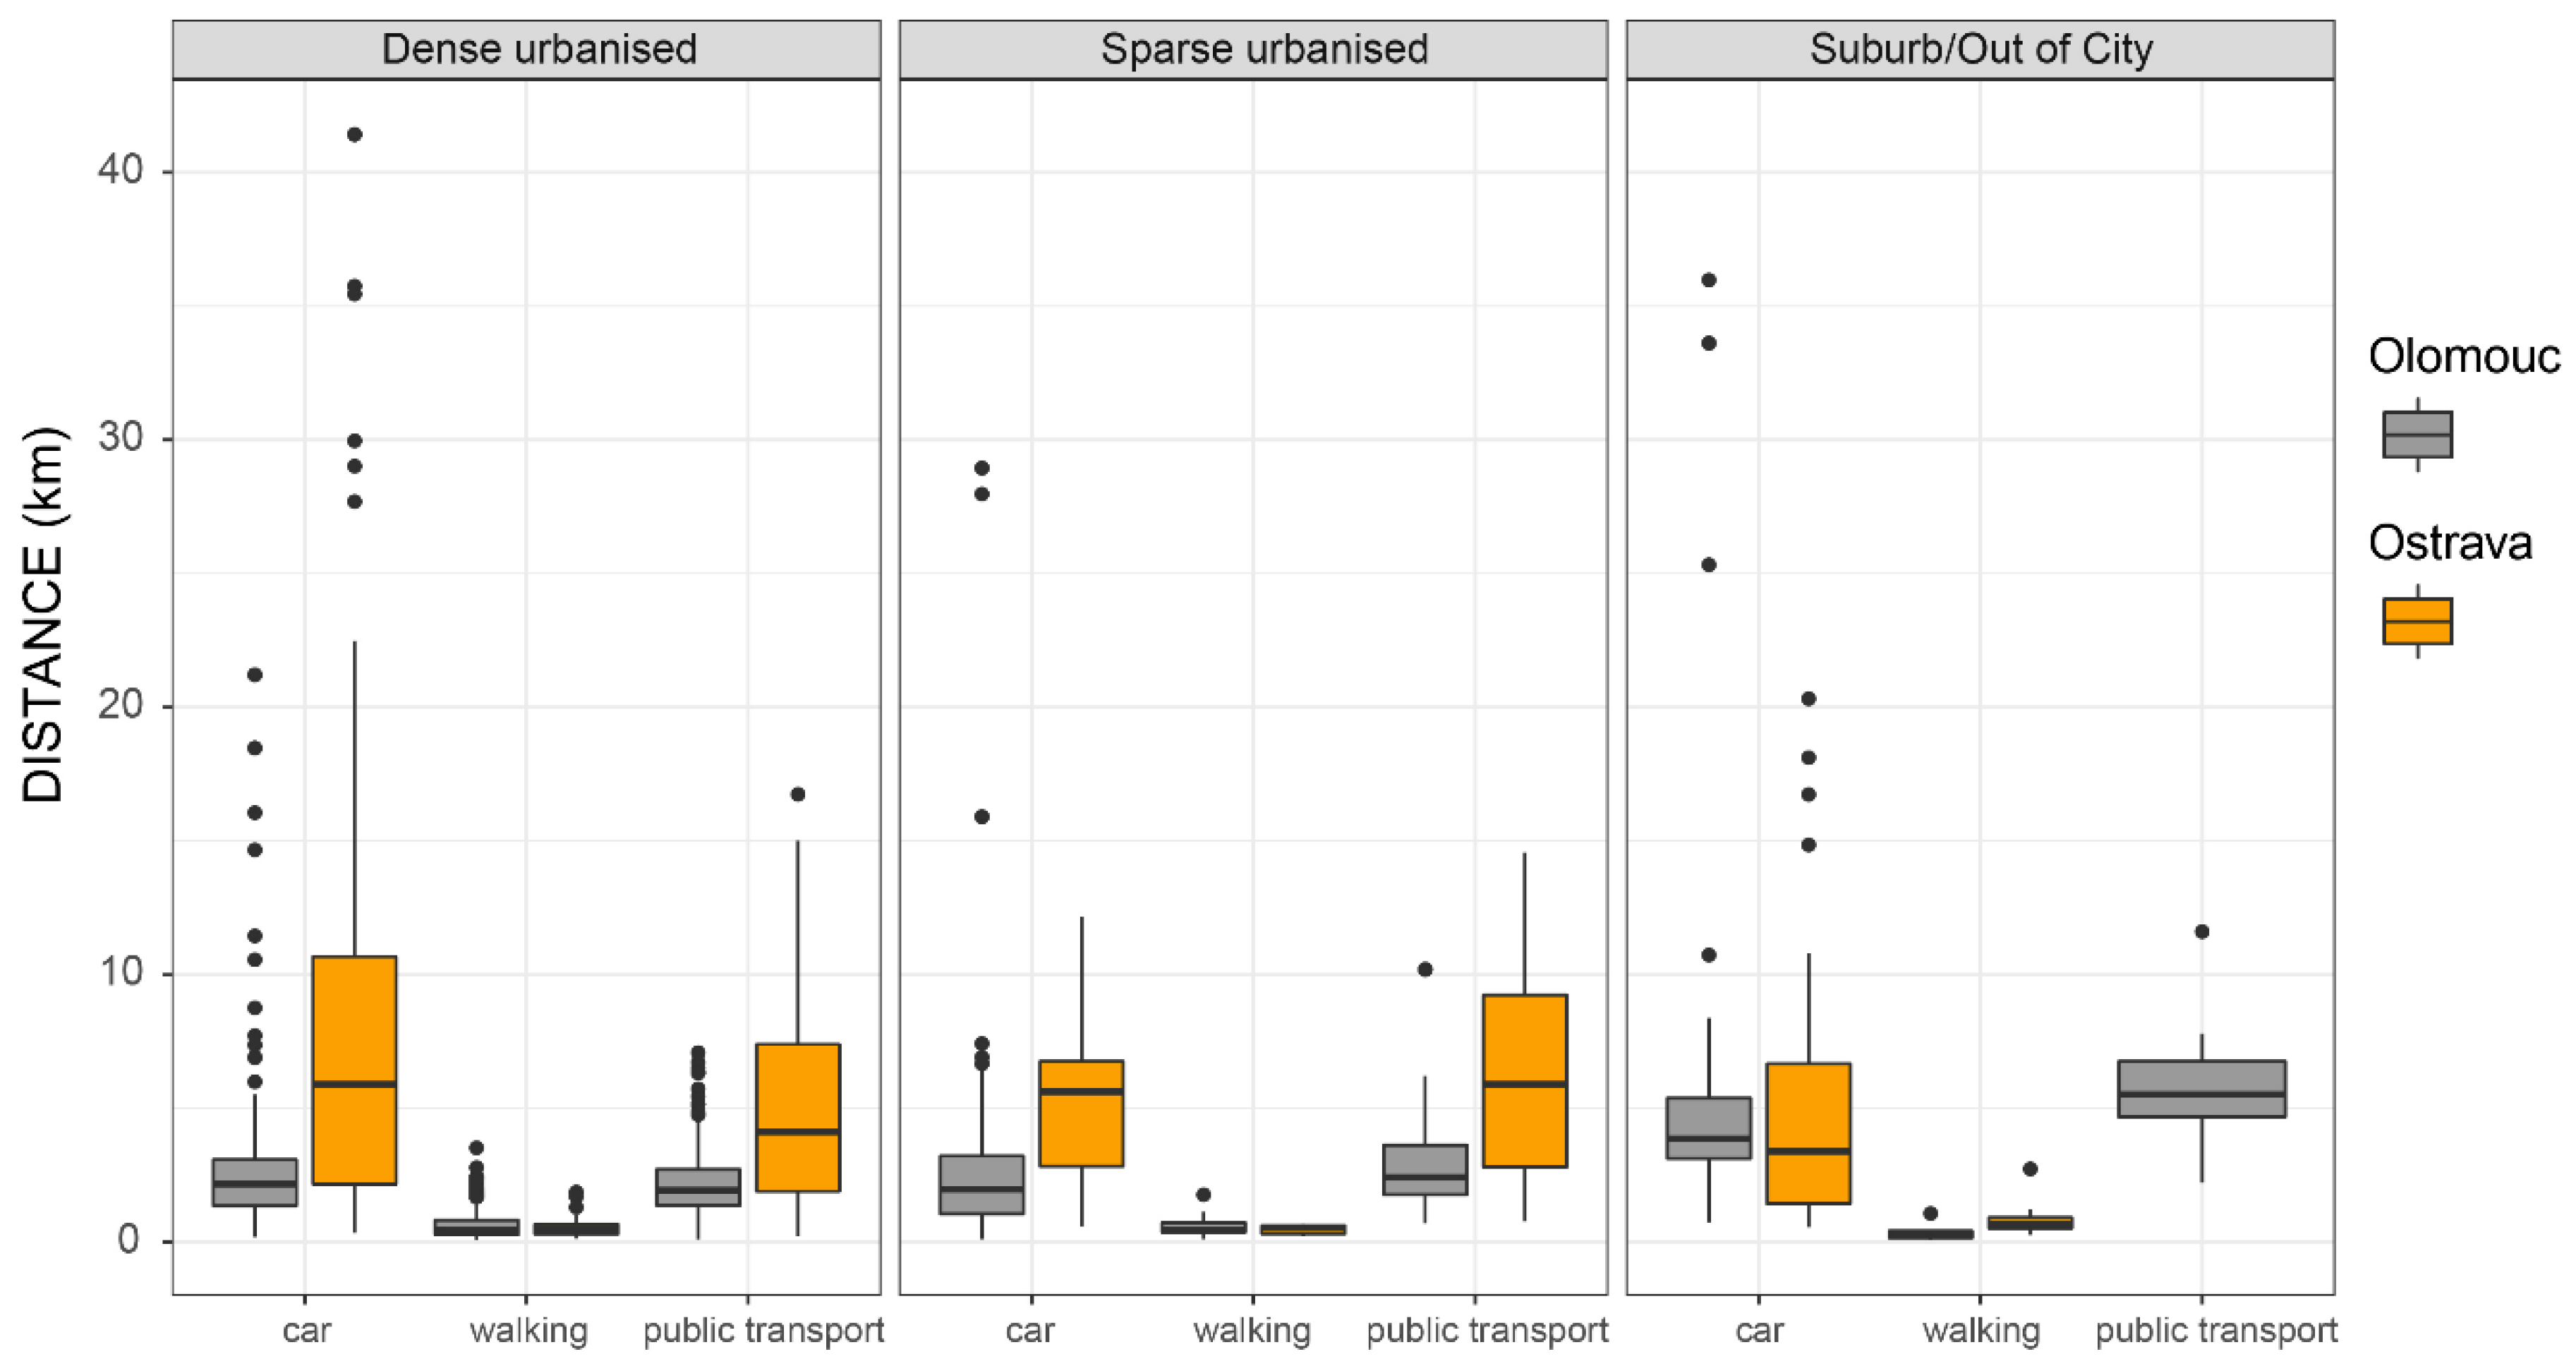
Figure 5.
Proportion of routes according to means of transport in different types of urbanised areas in Olomouc and Ostrava.
Figure 5.
Proportion of routes according to means of transport in different types of urbanised areas in Olomouc and Ostrava.
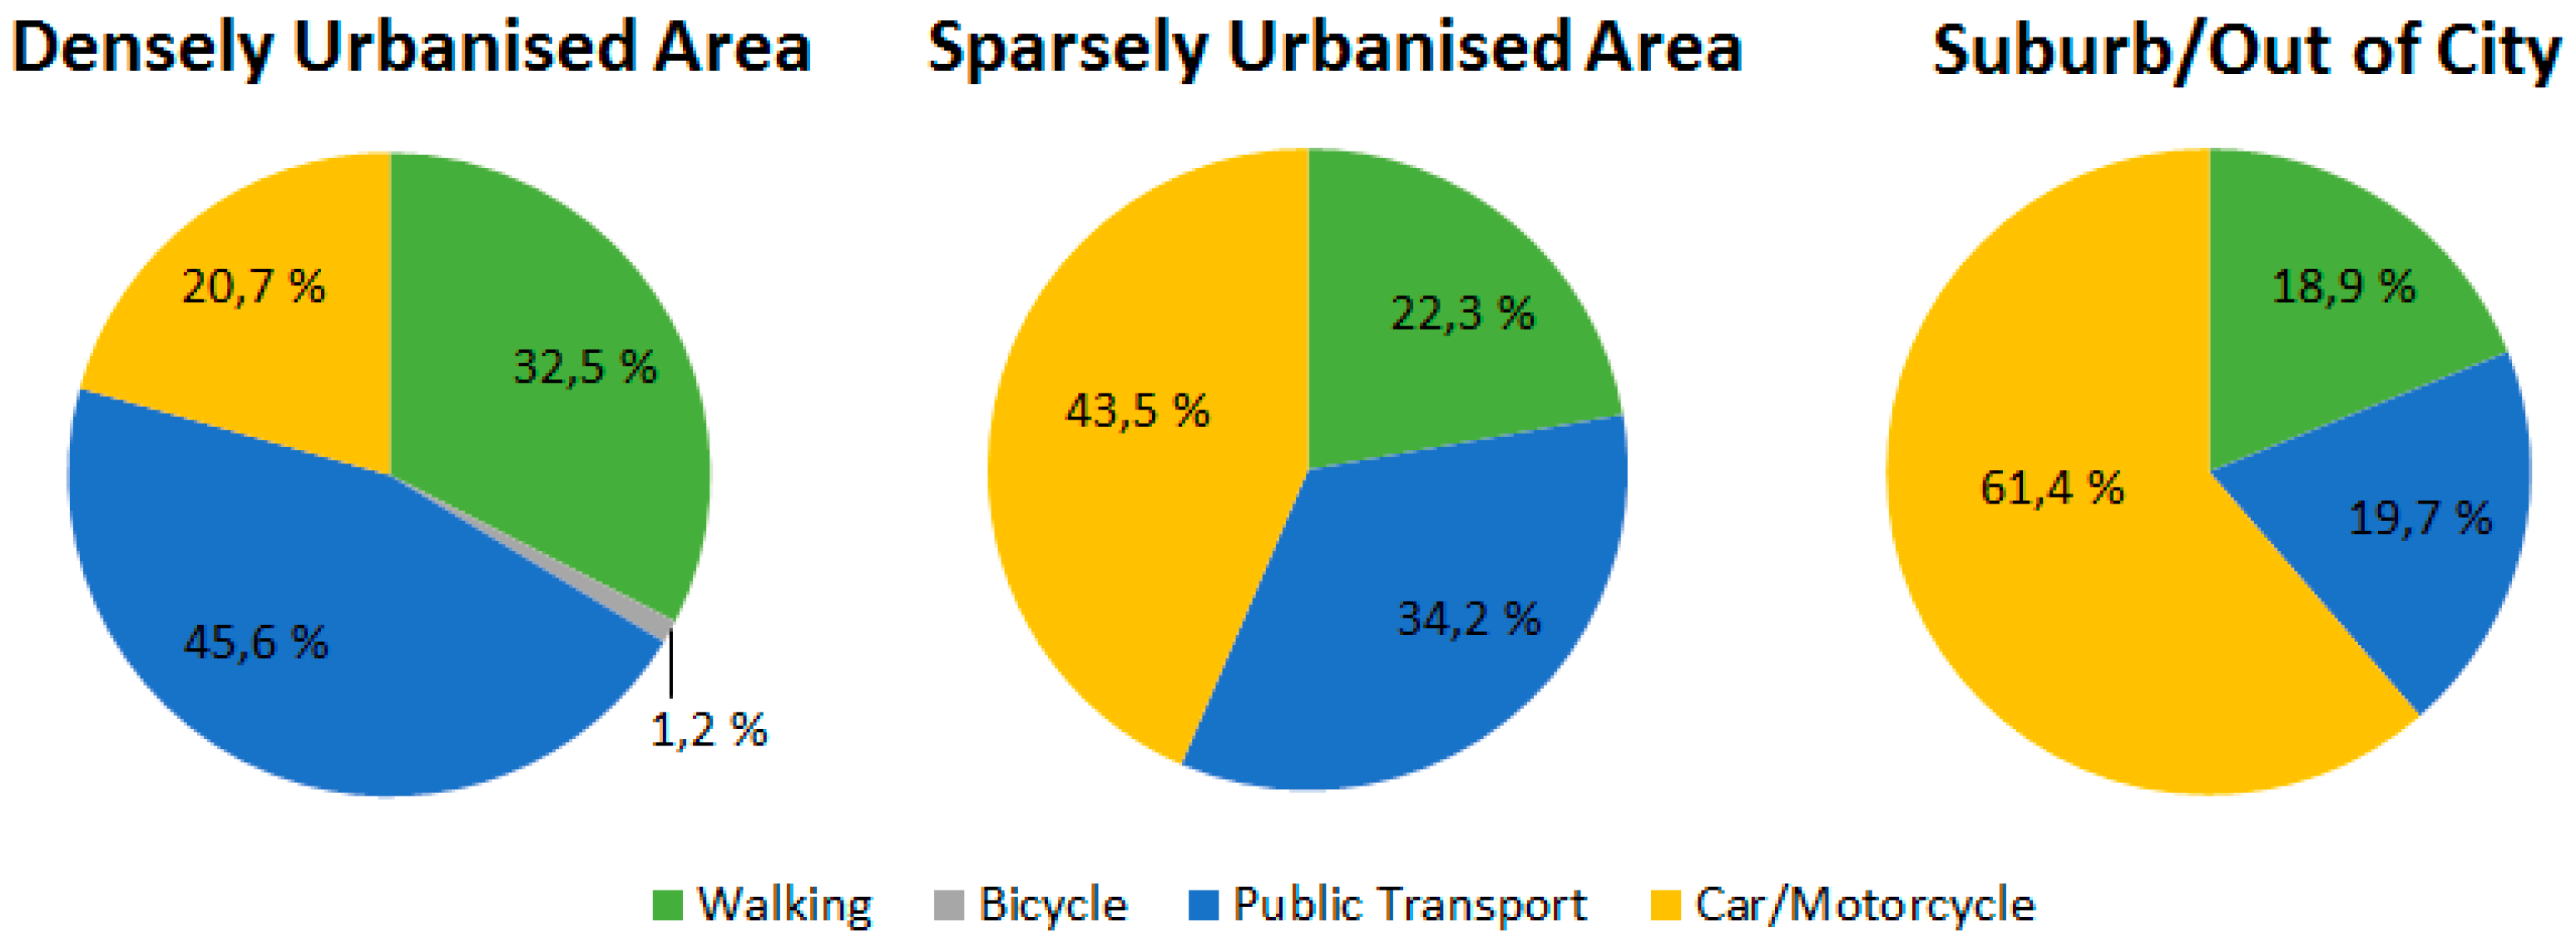
Figure 6.
Average length (in metres) of routes according to purpose in Olomouc and Ostrava.

Figure 7.
Walking distance to a preferred stop in Olomouc (left) and Ostrava (right).
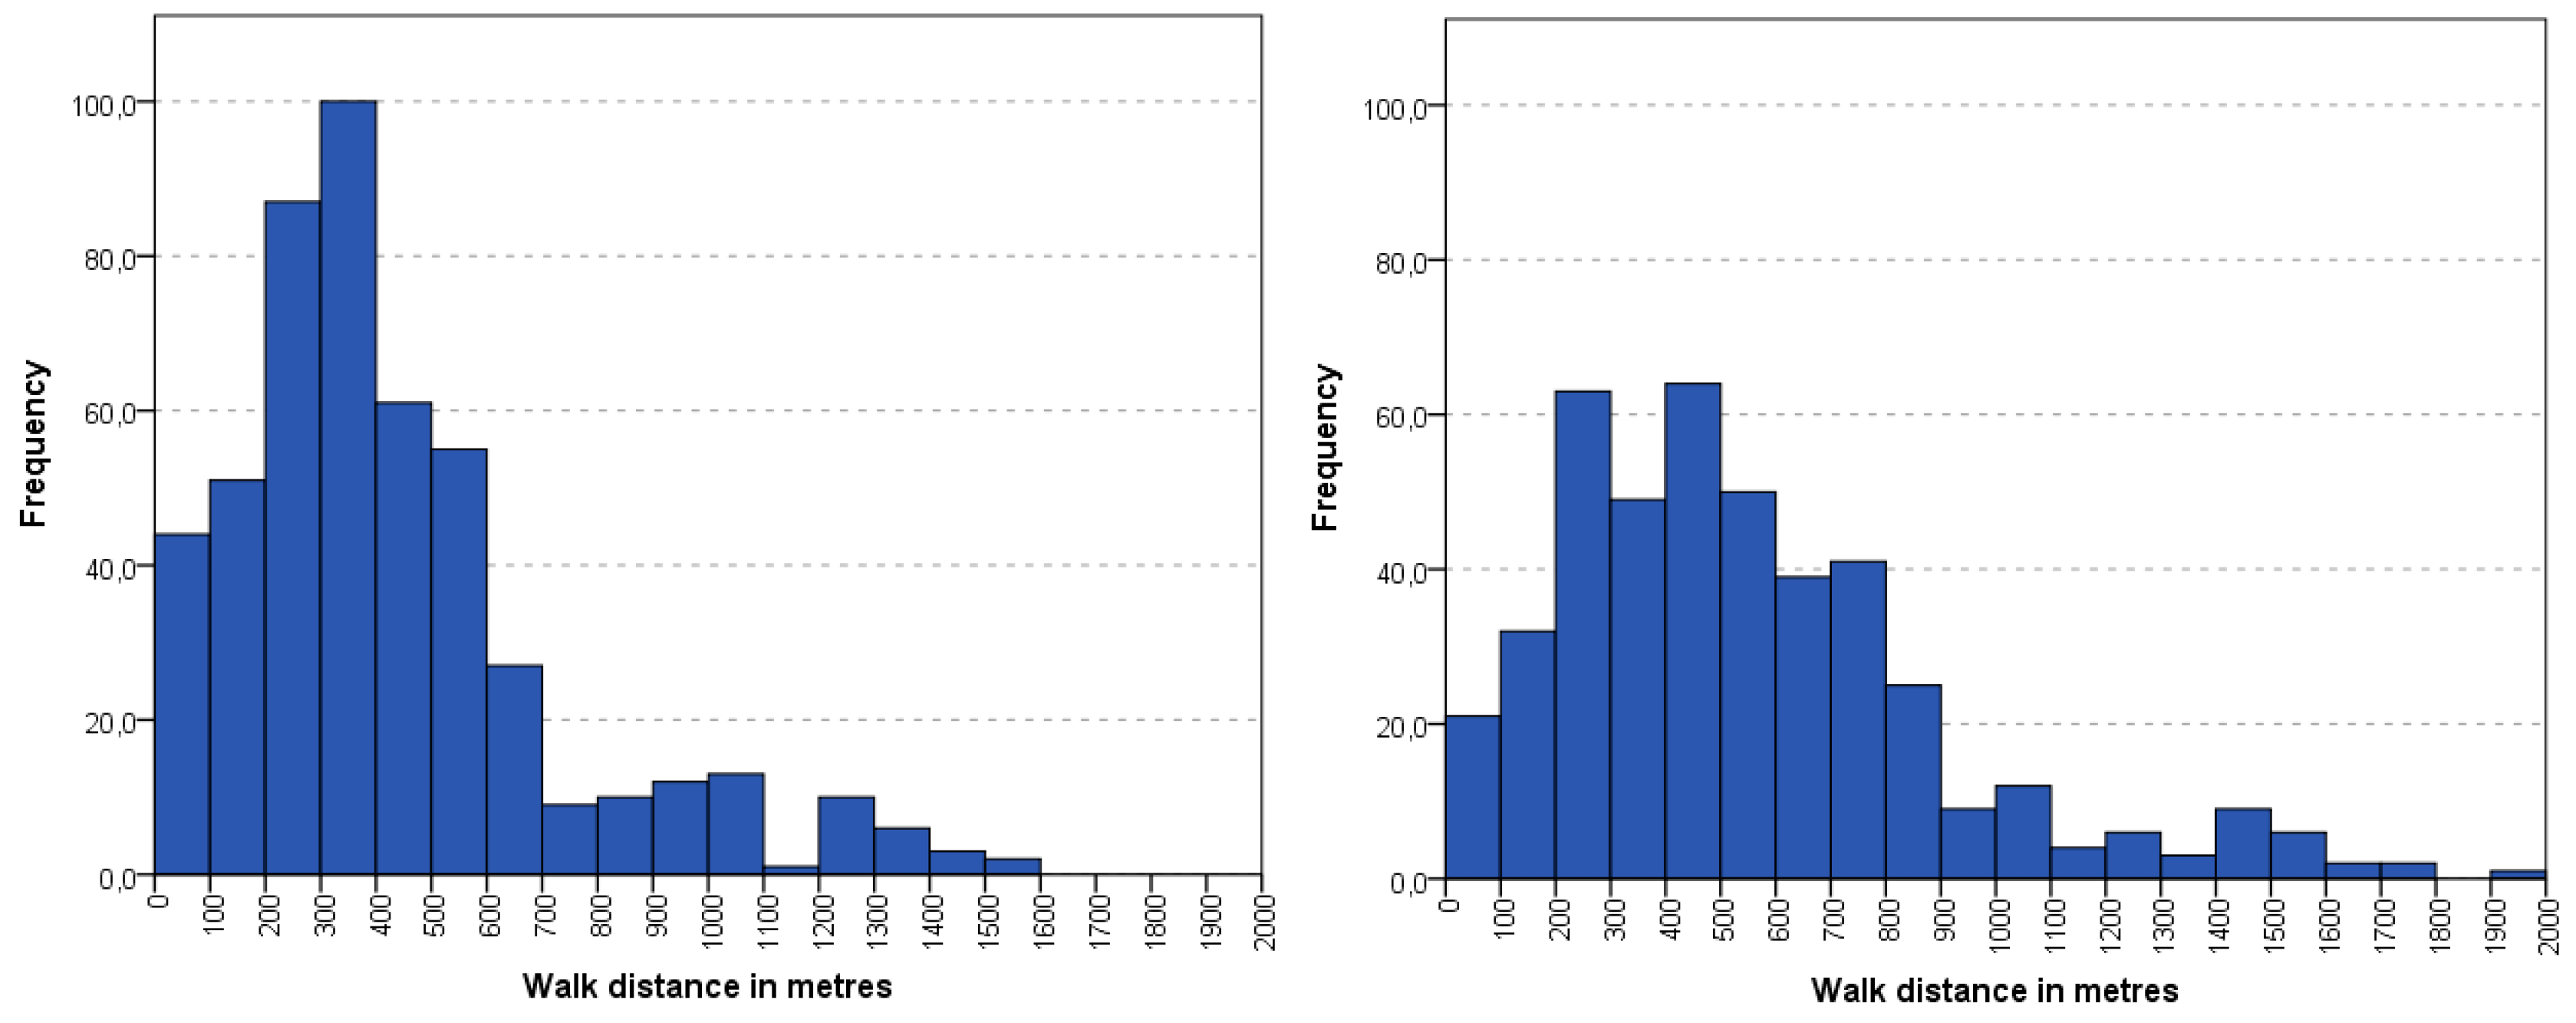
Figure 8.
Average duration of routes (in minutes) according to the purpose in Olomouc and Ostrava.

Figure 9.
Portion of commuting by different means of transport according to age.

Figure 10.
Portion of commuting by different means of transport according to employment status (left) and number of children (right).
Figure 10.
Portion of commuting by different means of transport according to employment status (left) and number of children (right).
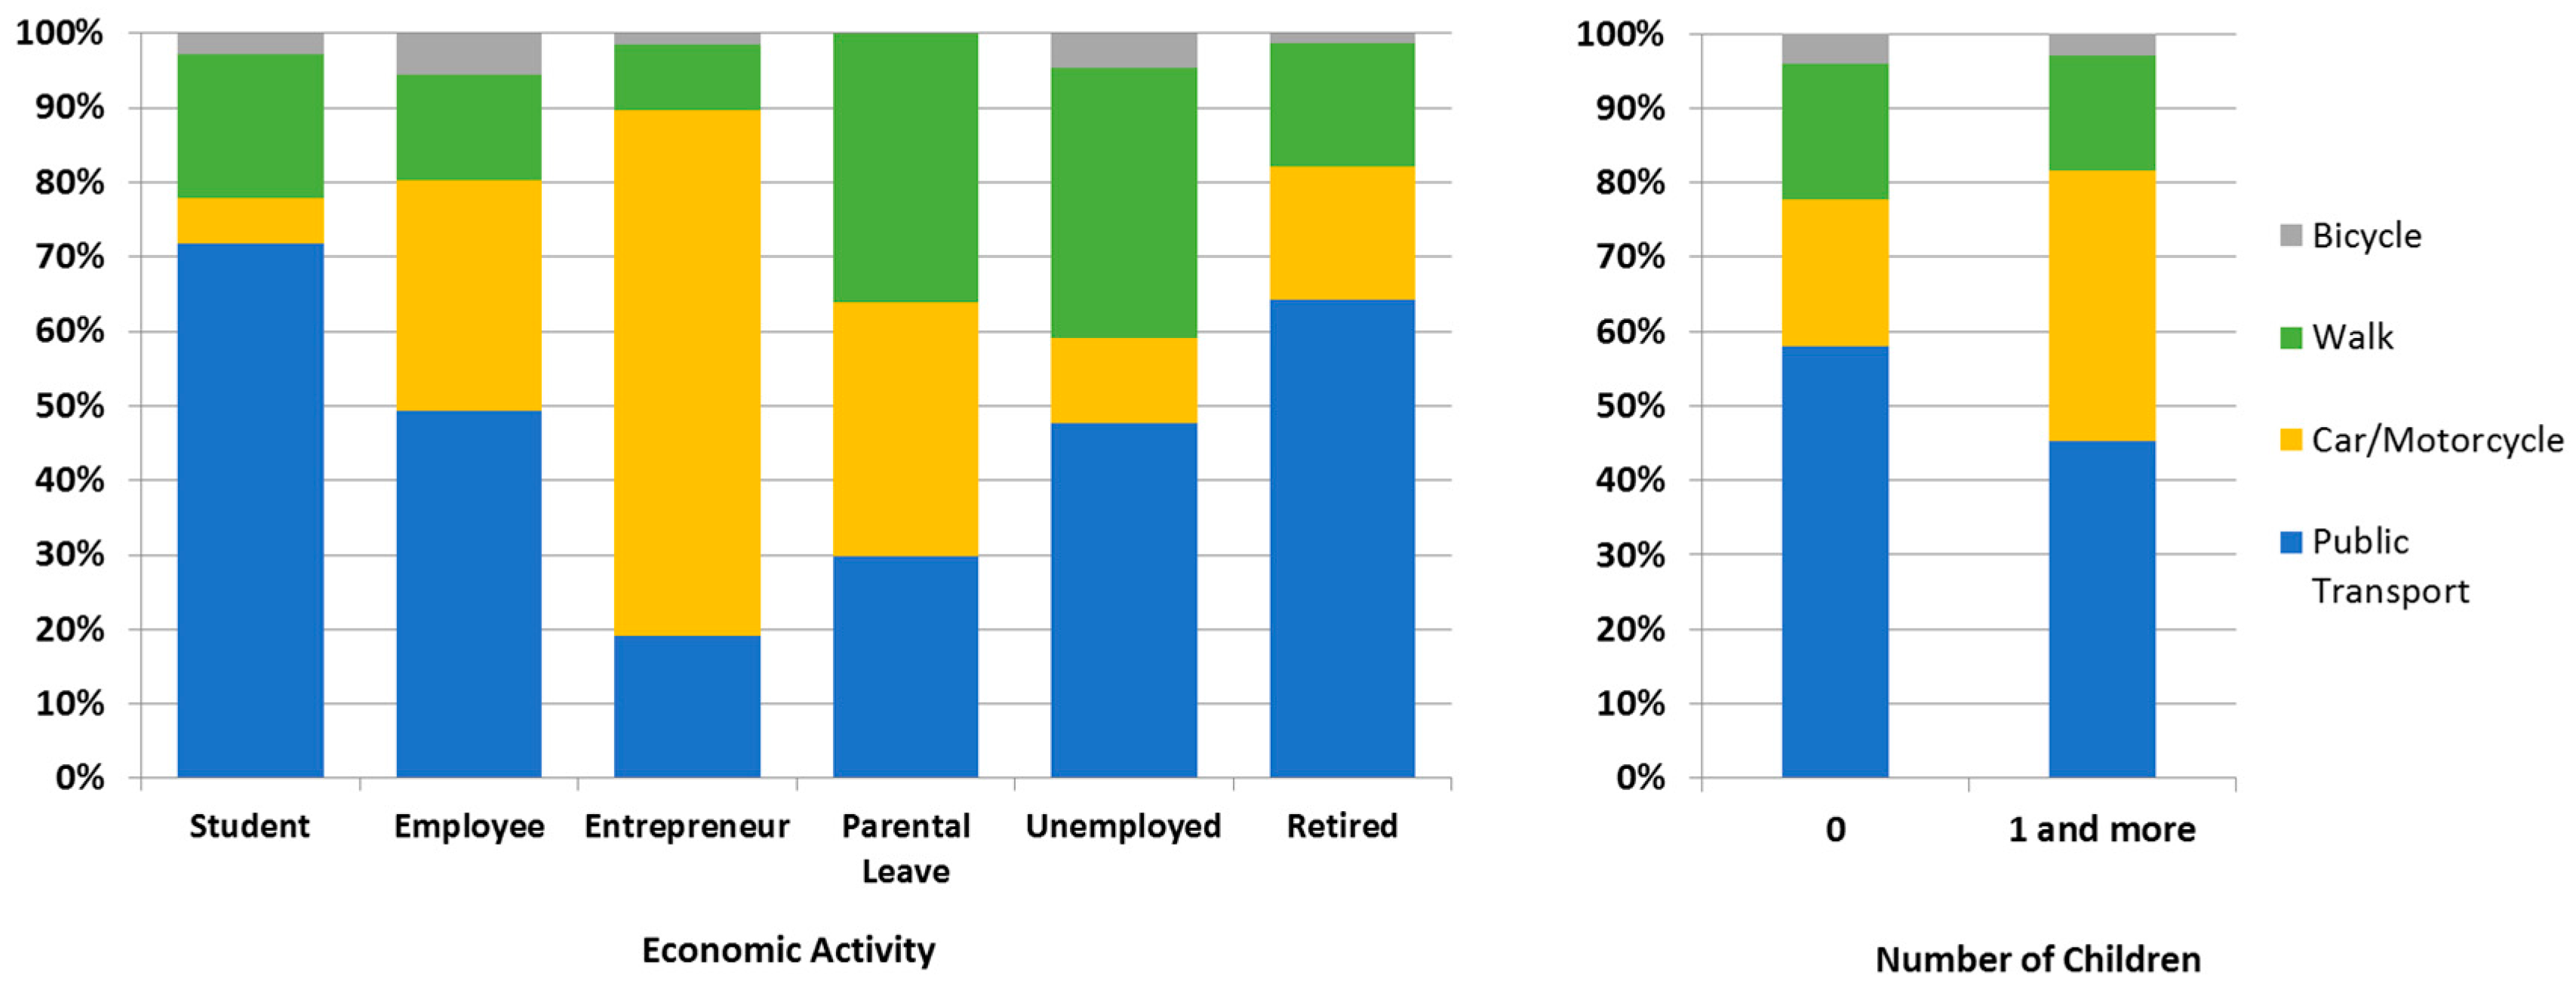
Figure 11.
Evaluation of different perceptions of selected characteristics of public transport in Olomouc and Ostrava (grey band shows the percentage).
Figure 11.
Evaluation of different perceptions of selected characteristics of public transport in Olomouc and Ostrava (grey band shows the percentage).

Figure 12.
Dominant directions of movement in Olomouc according to all means of transport.
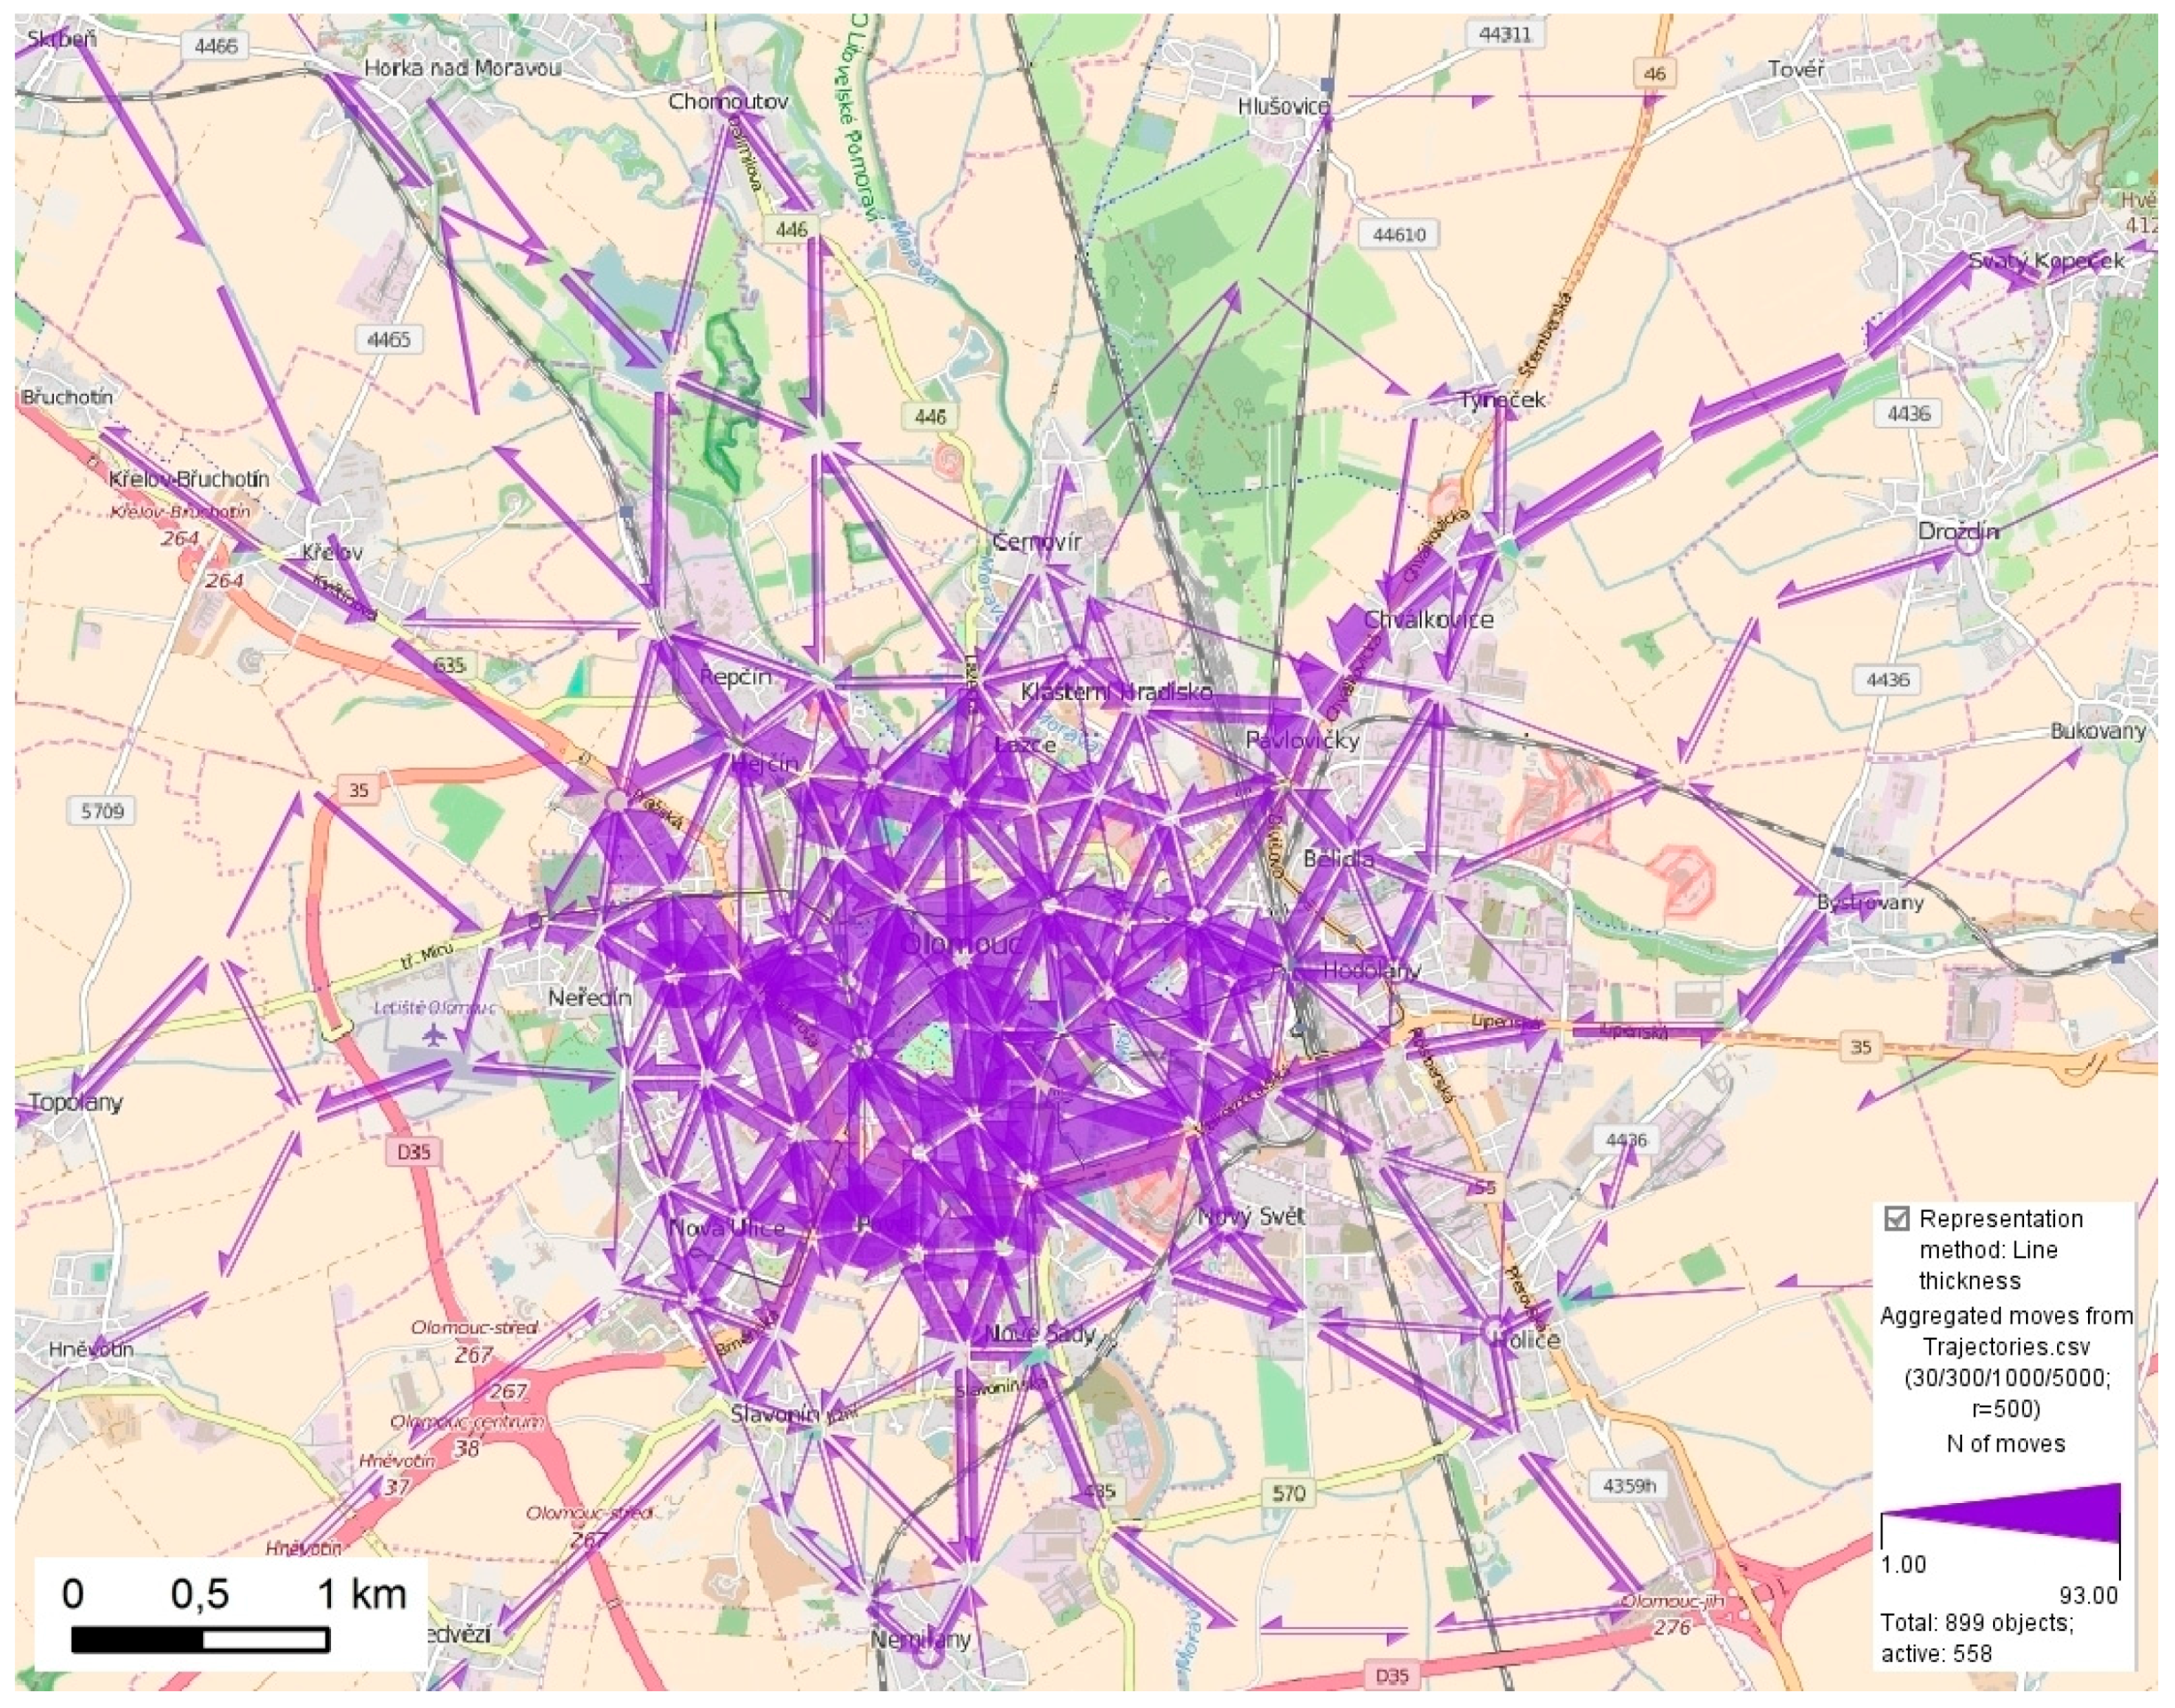
Figure 13.
Dominant directions of movement in Olomouc according to car transport.
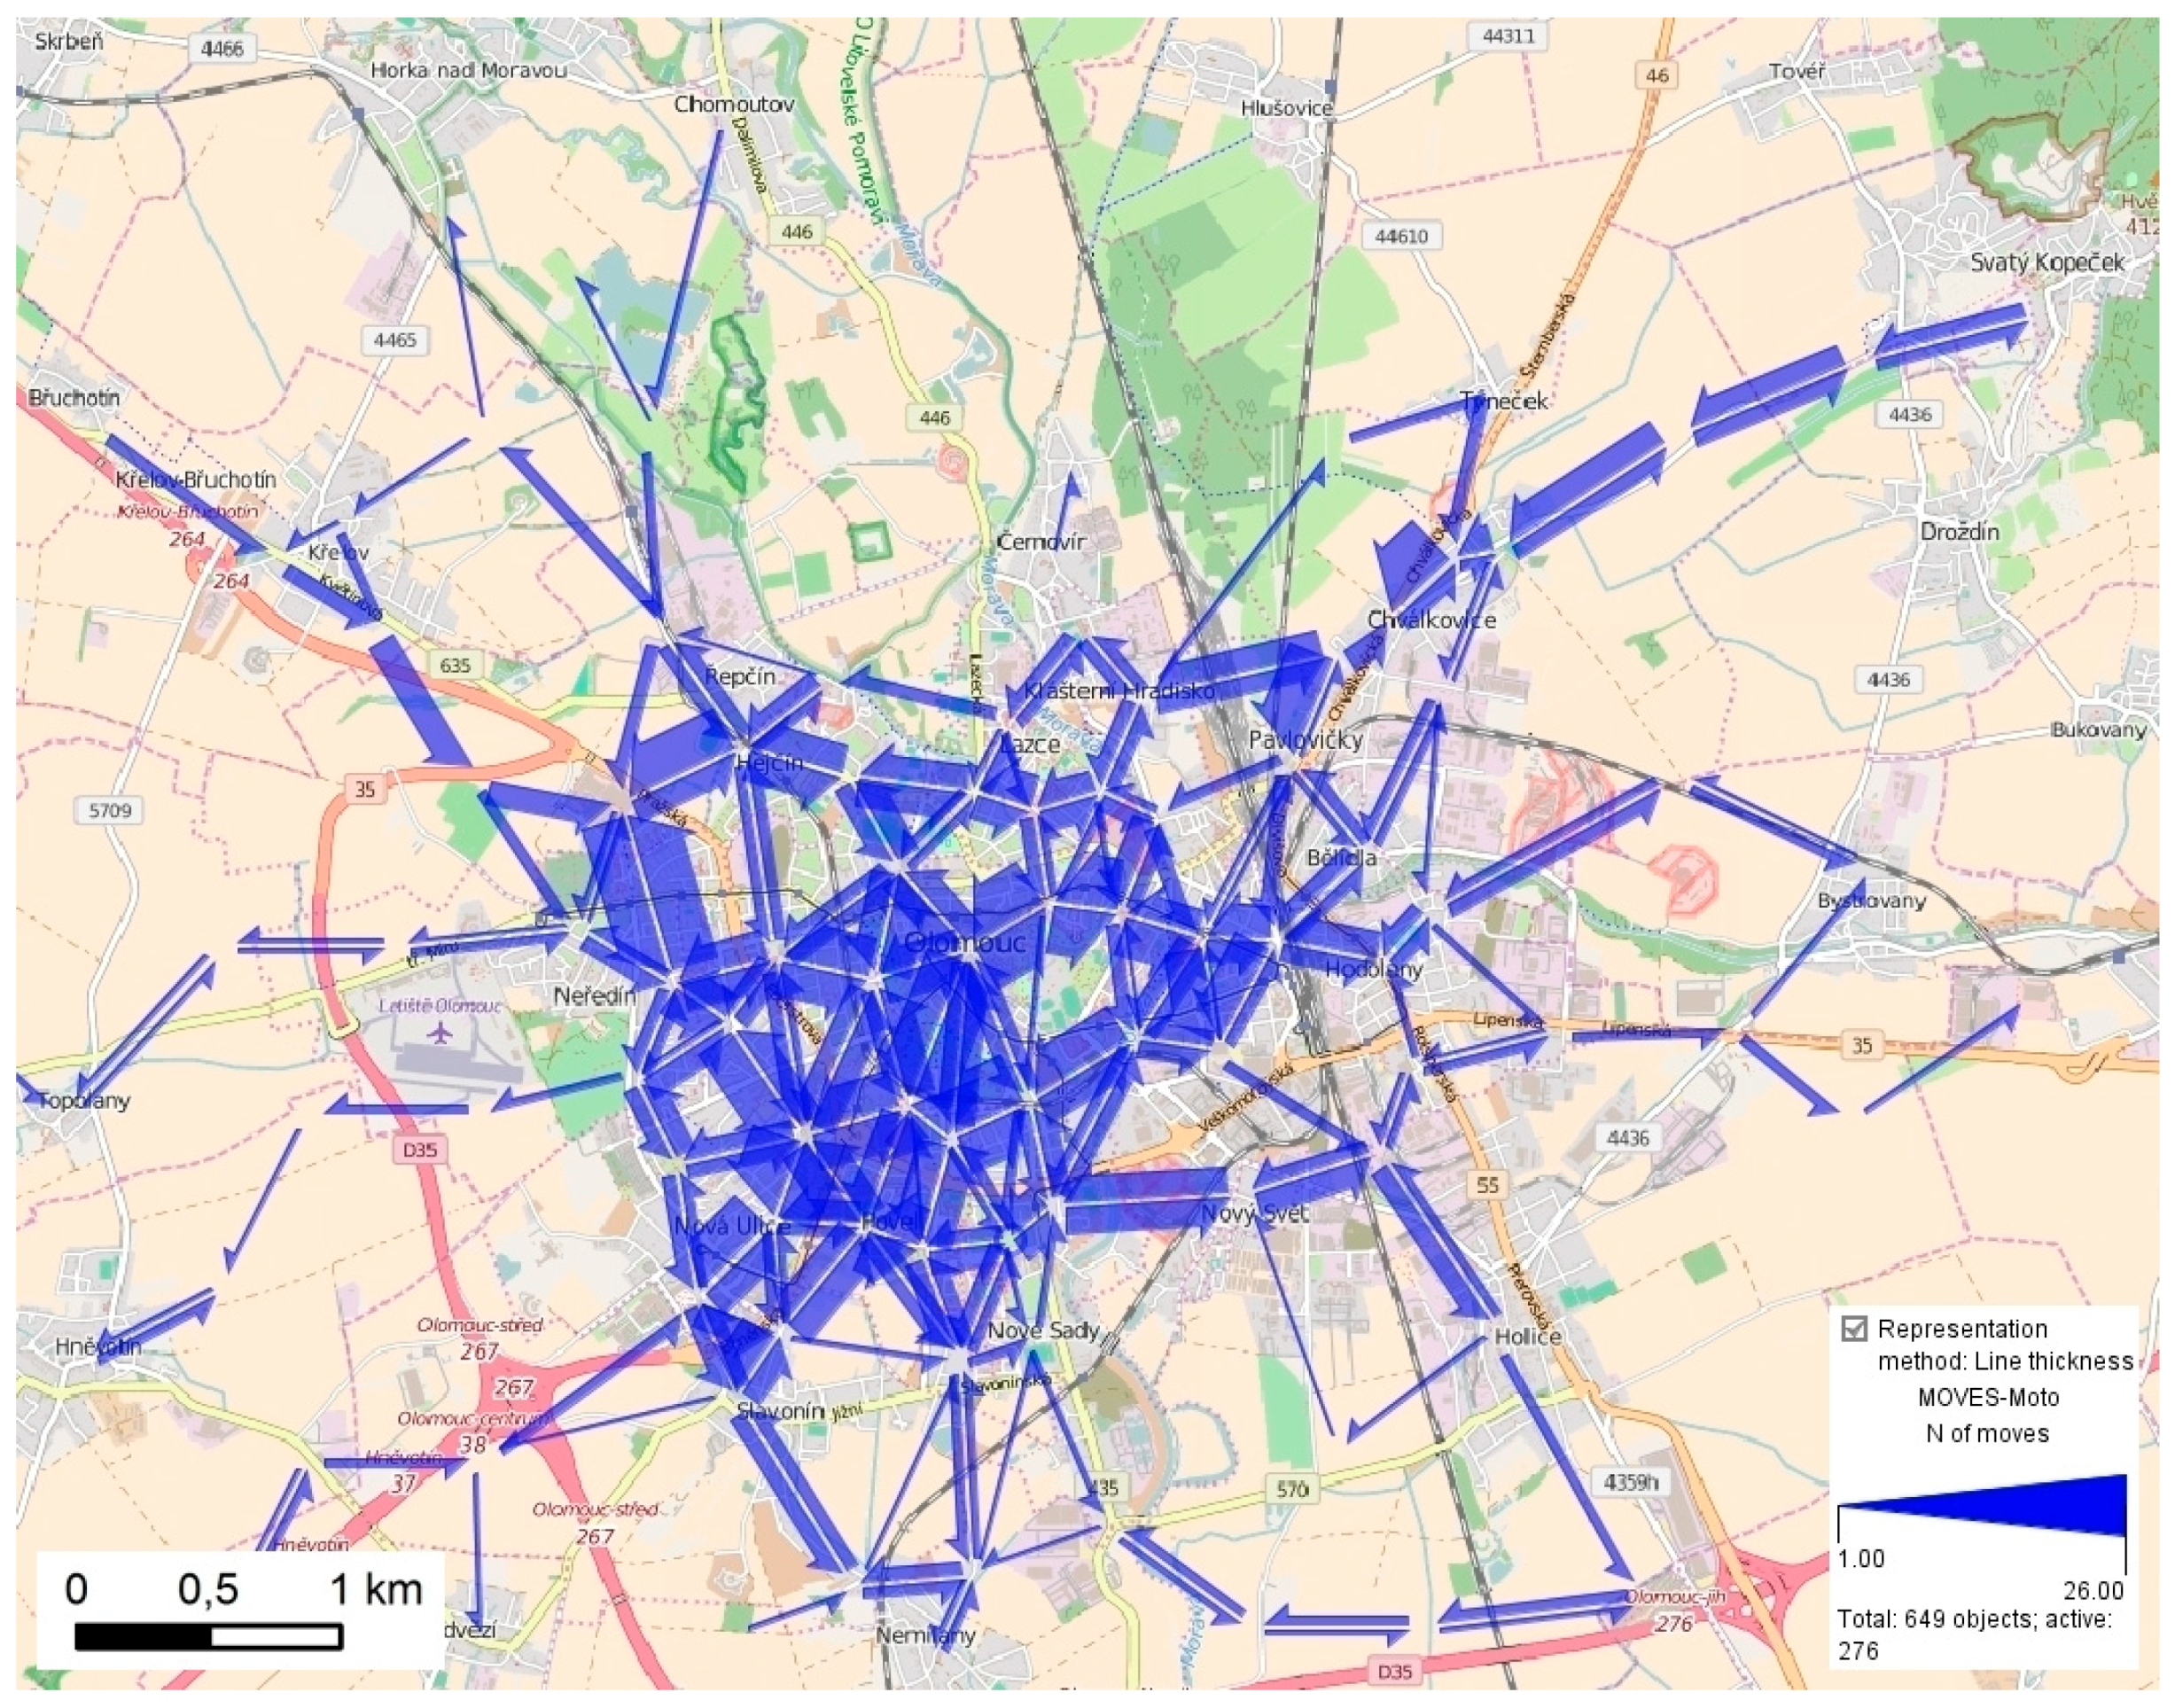
Figure 14.
Dominant directions of movement in Olomouc according to public transport.
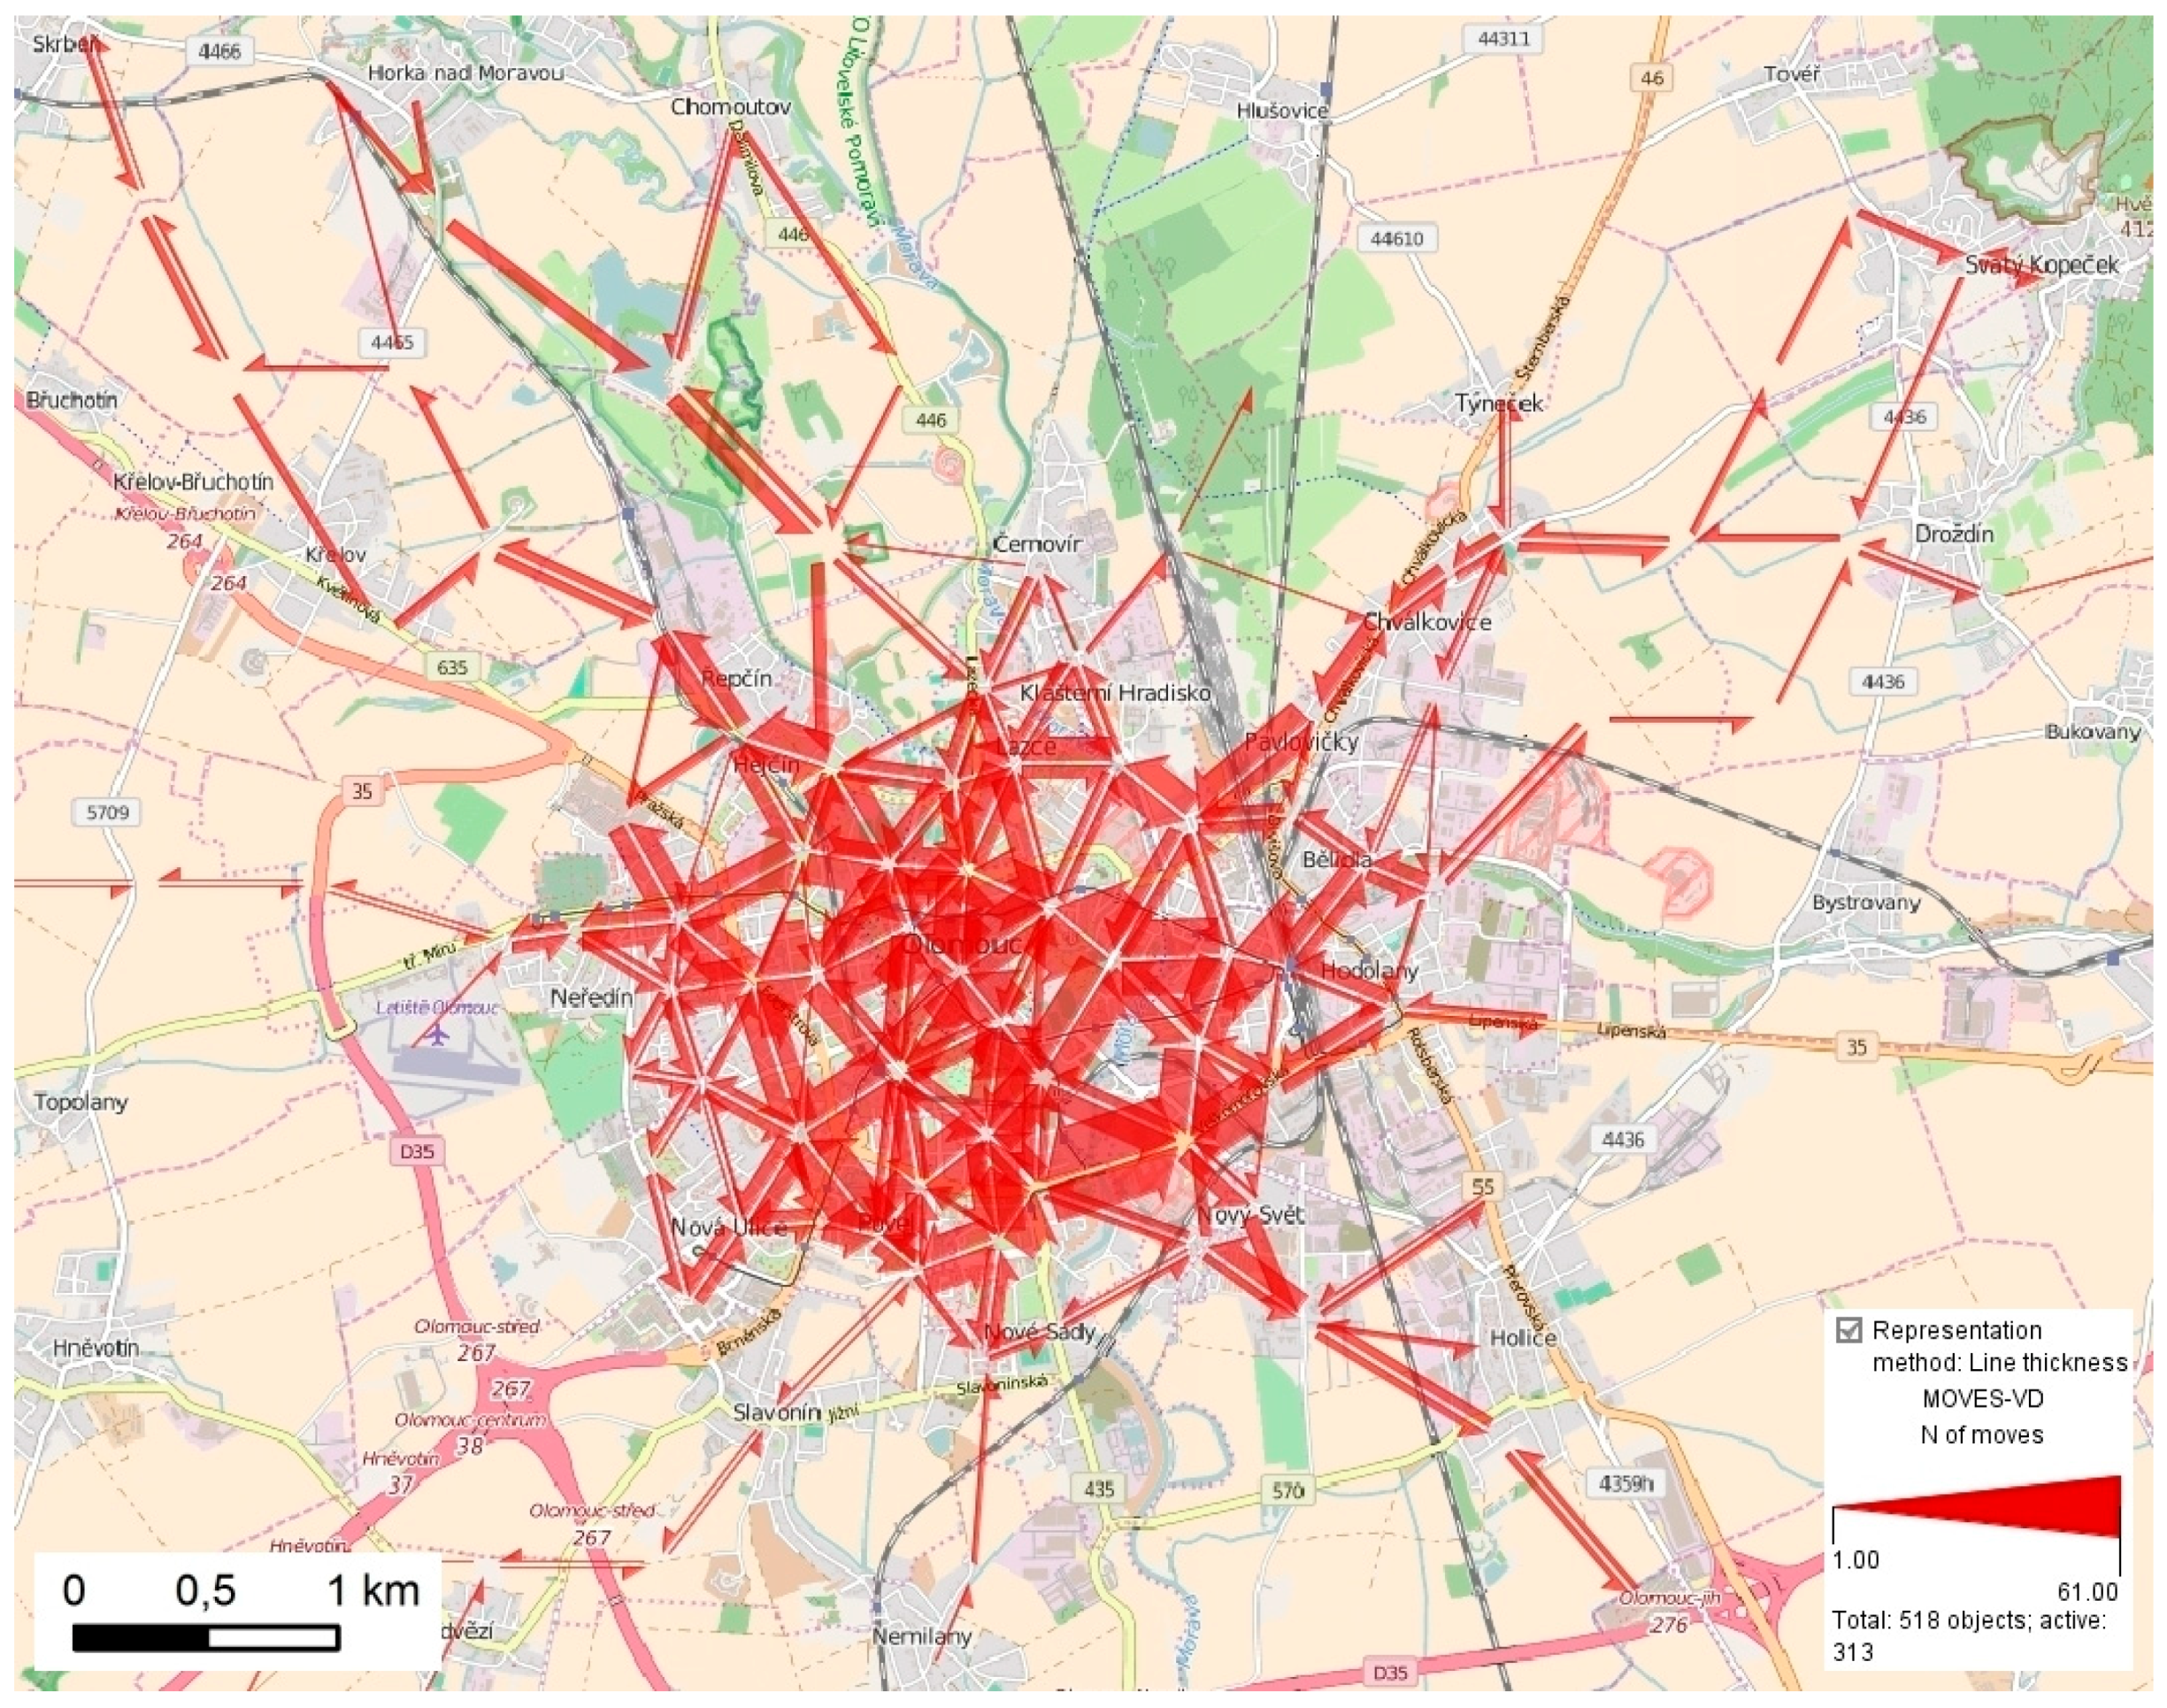
Figure 15.
Dominant directions of movement in Olomouc according to walking.
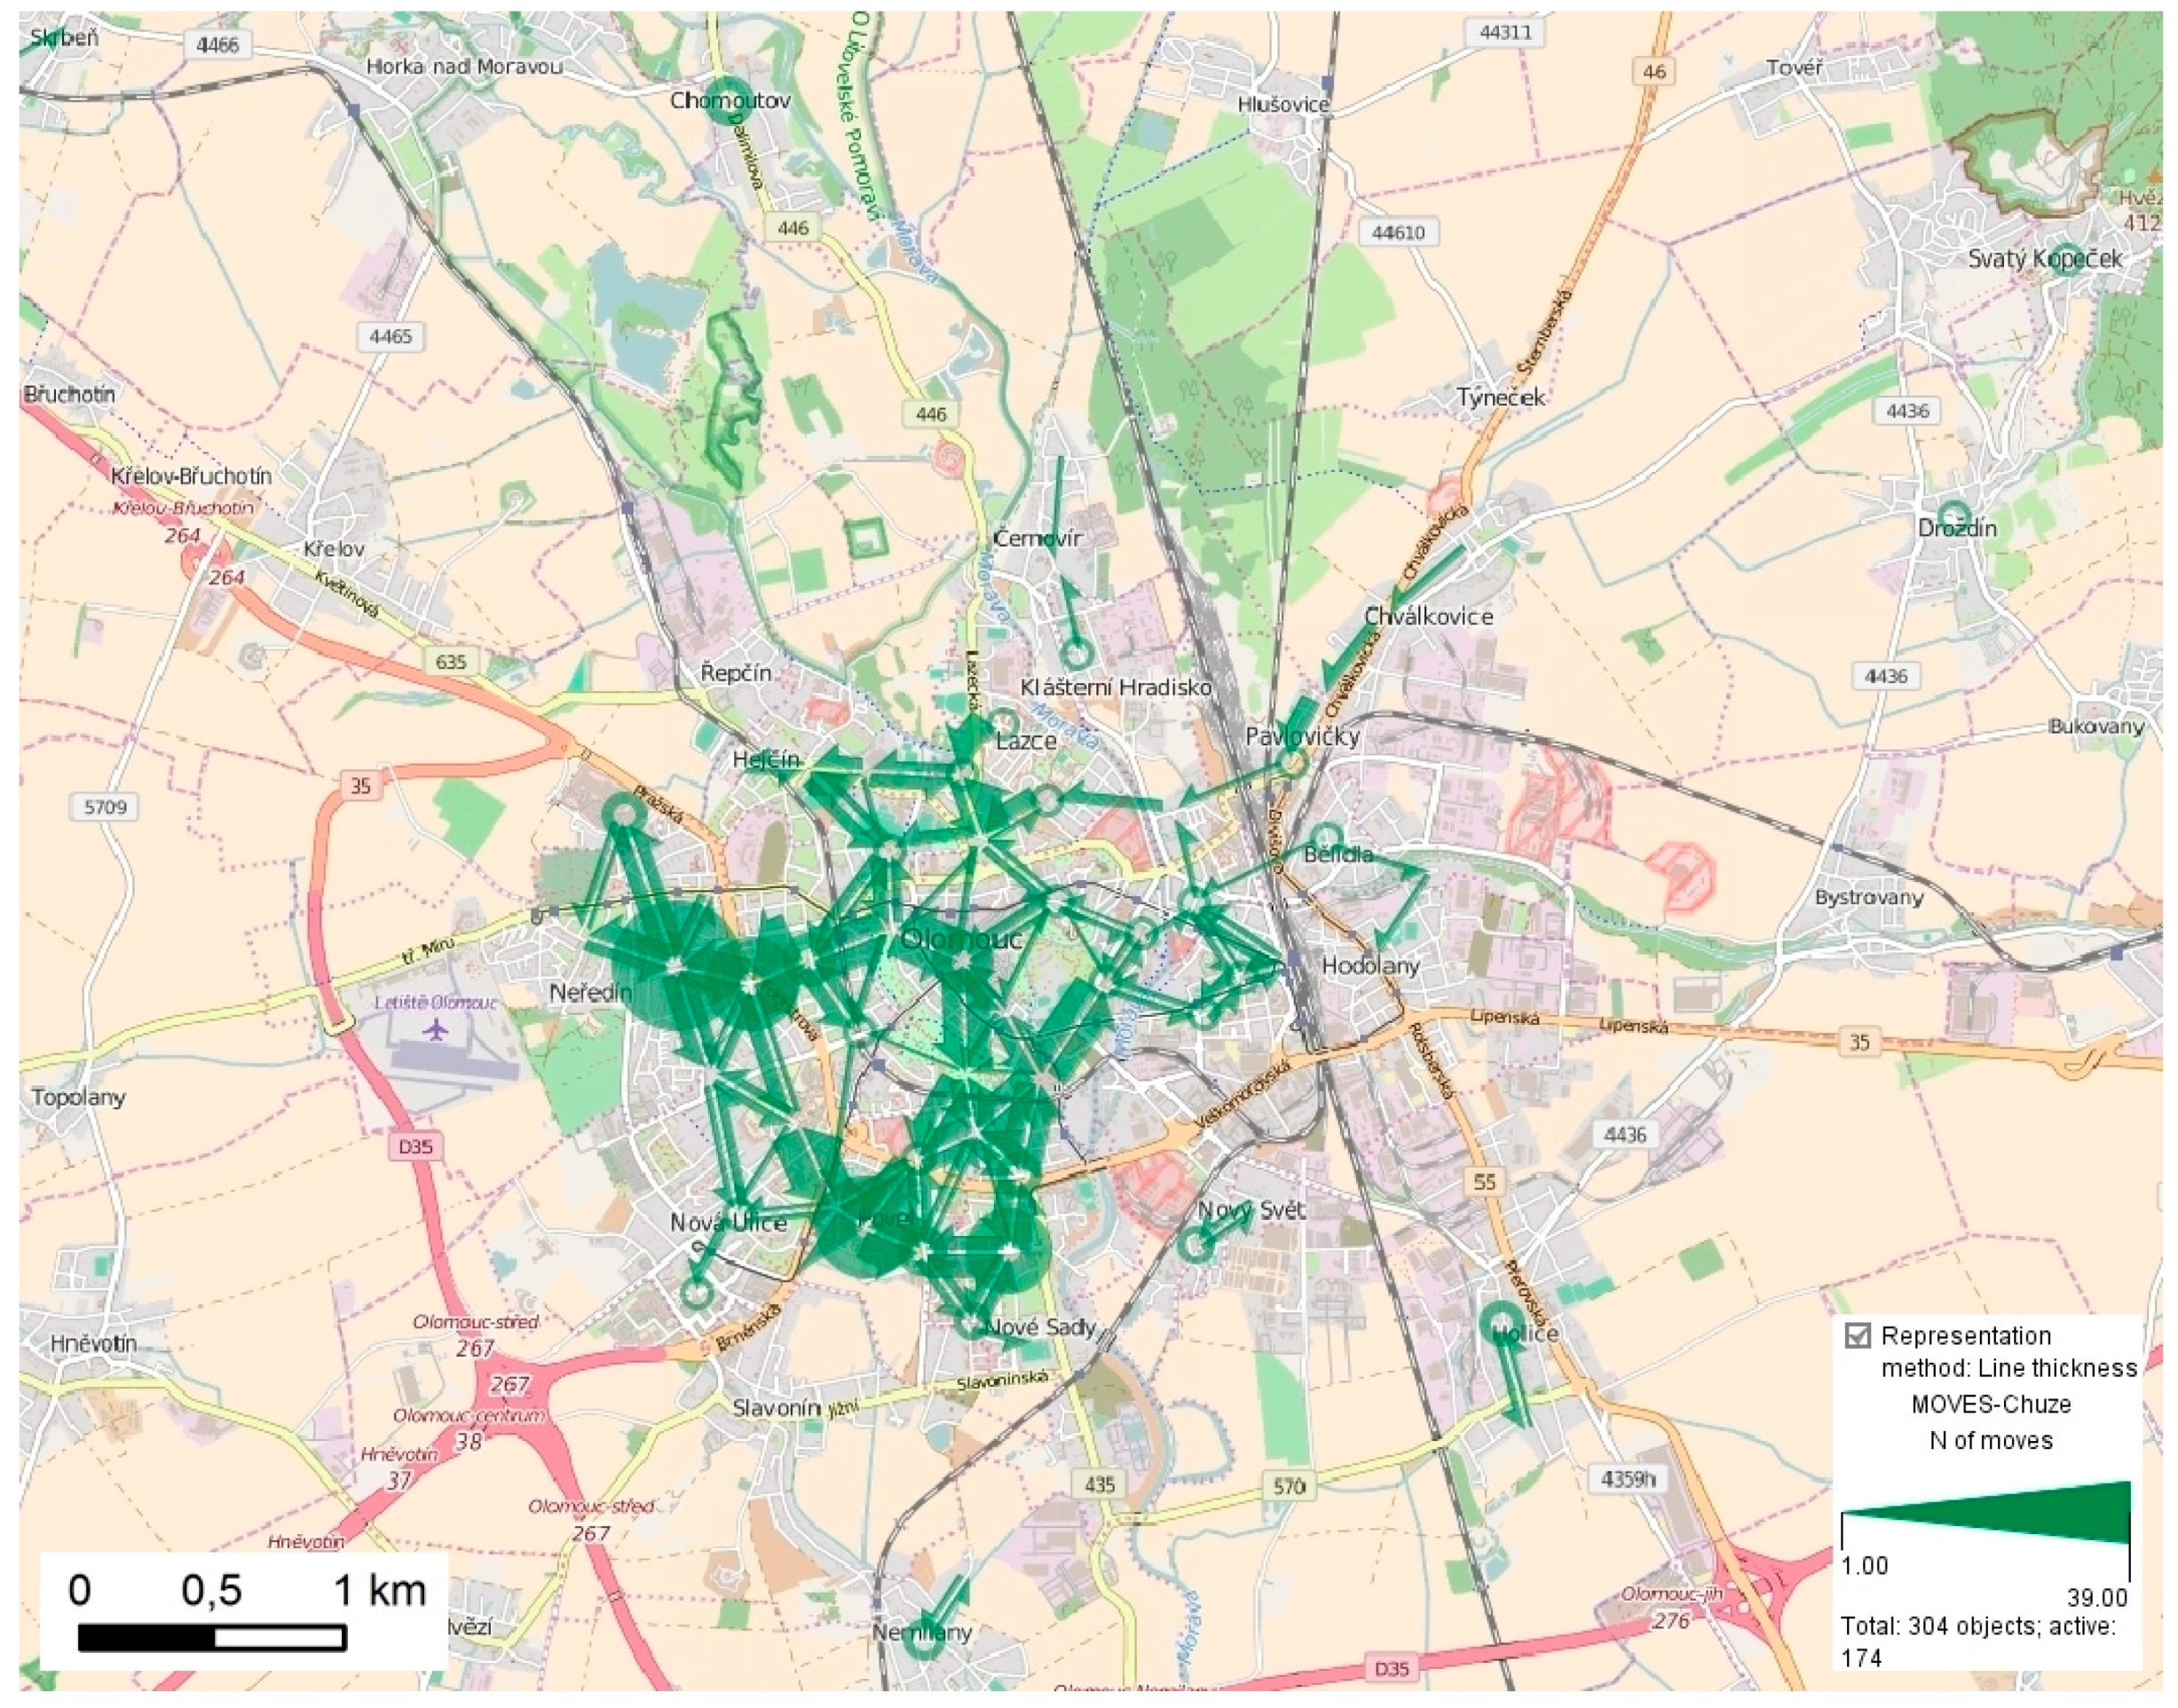
Figure 16.
Dominant directions of movement in Ostrava according to the means of transport.

Figure 17.
Dominant directions of movement in Ostrava according to car transport.

Figure 18.
Dominant directions of movement in Ostrava according to public transport.
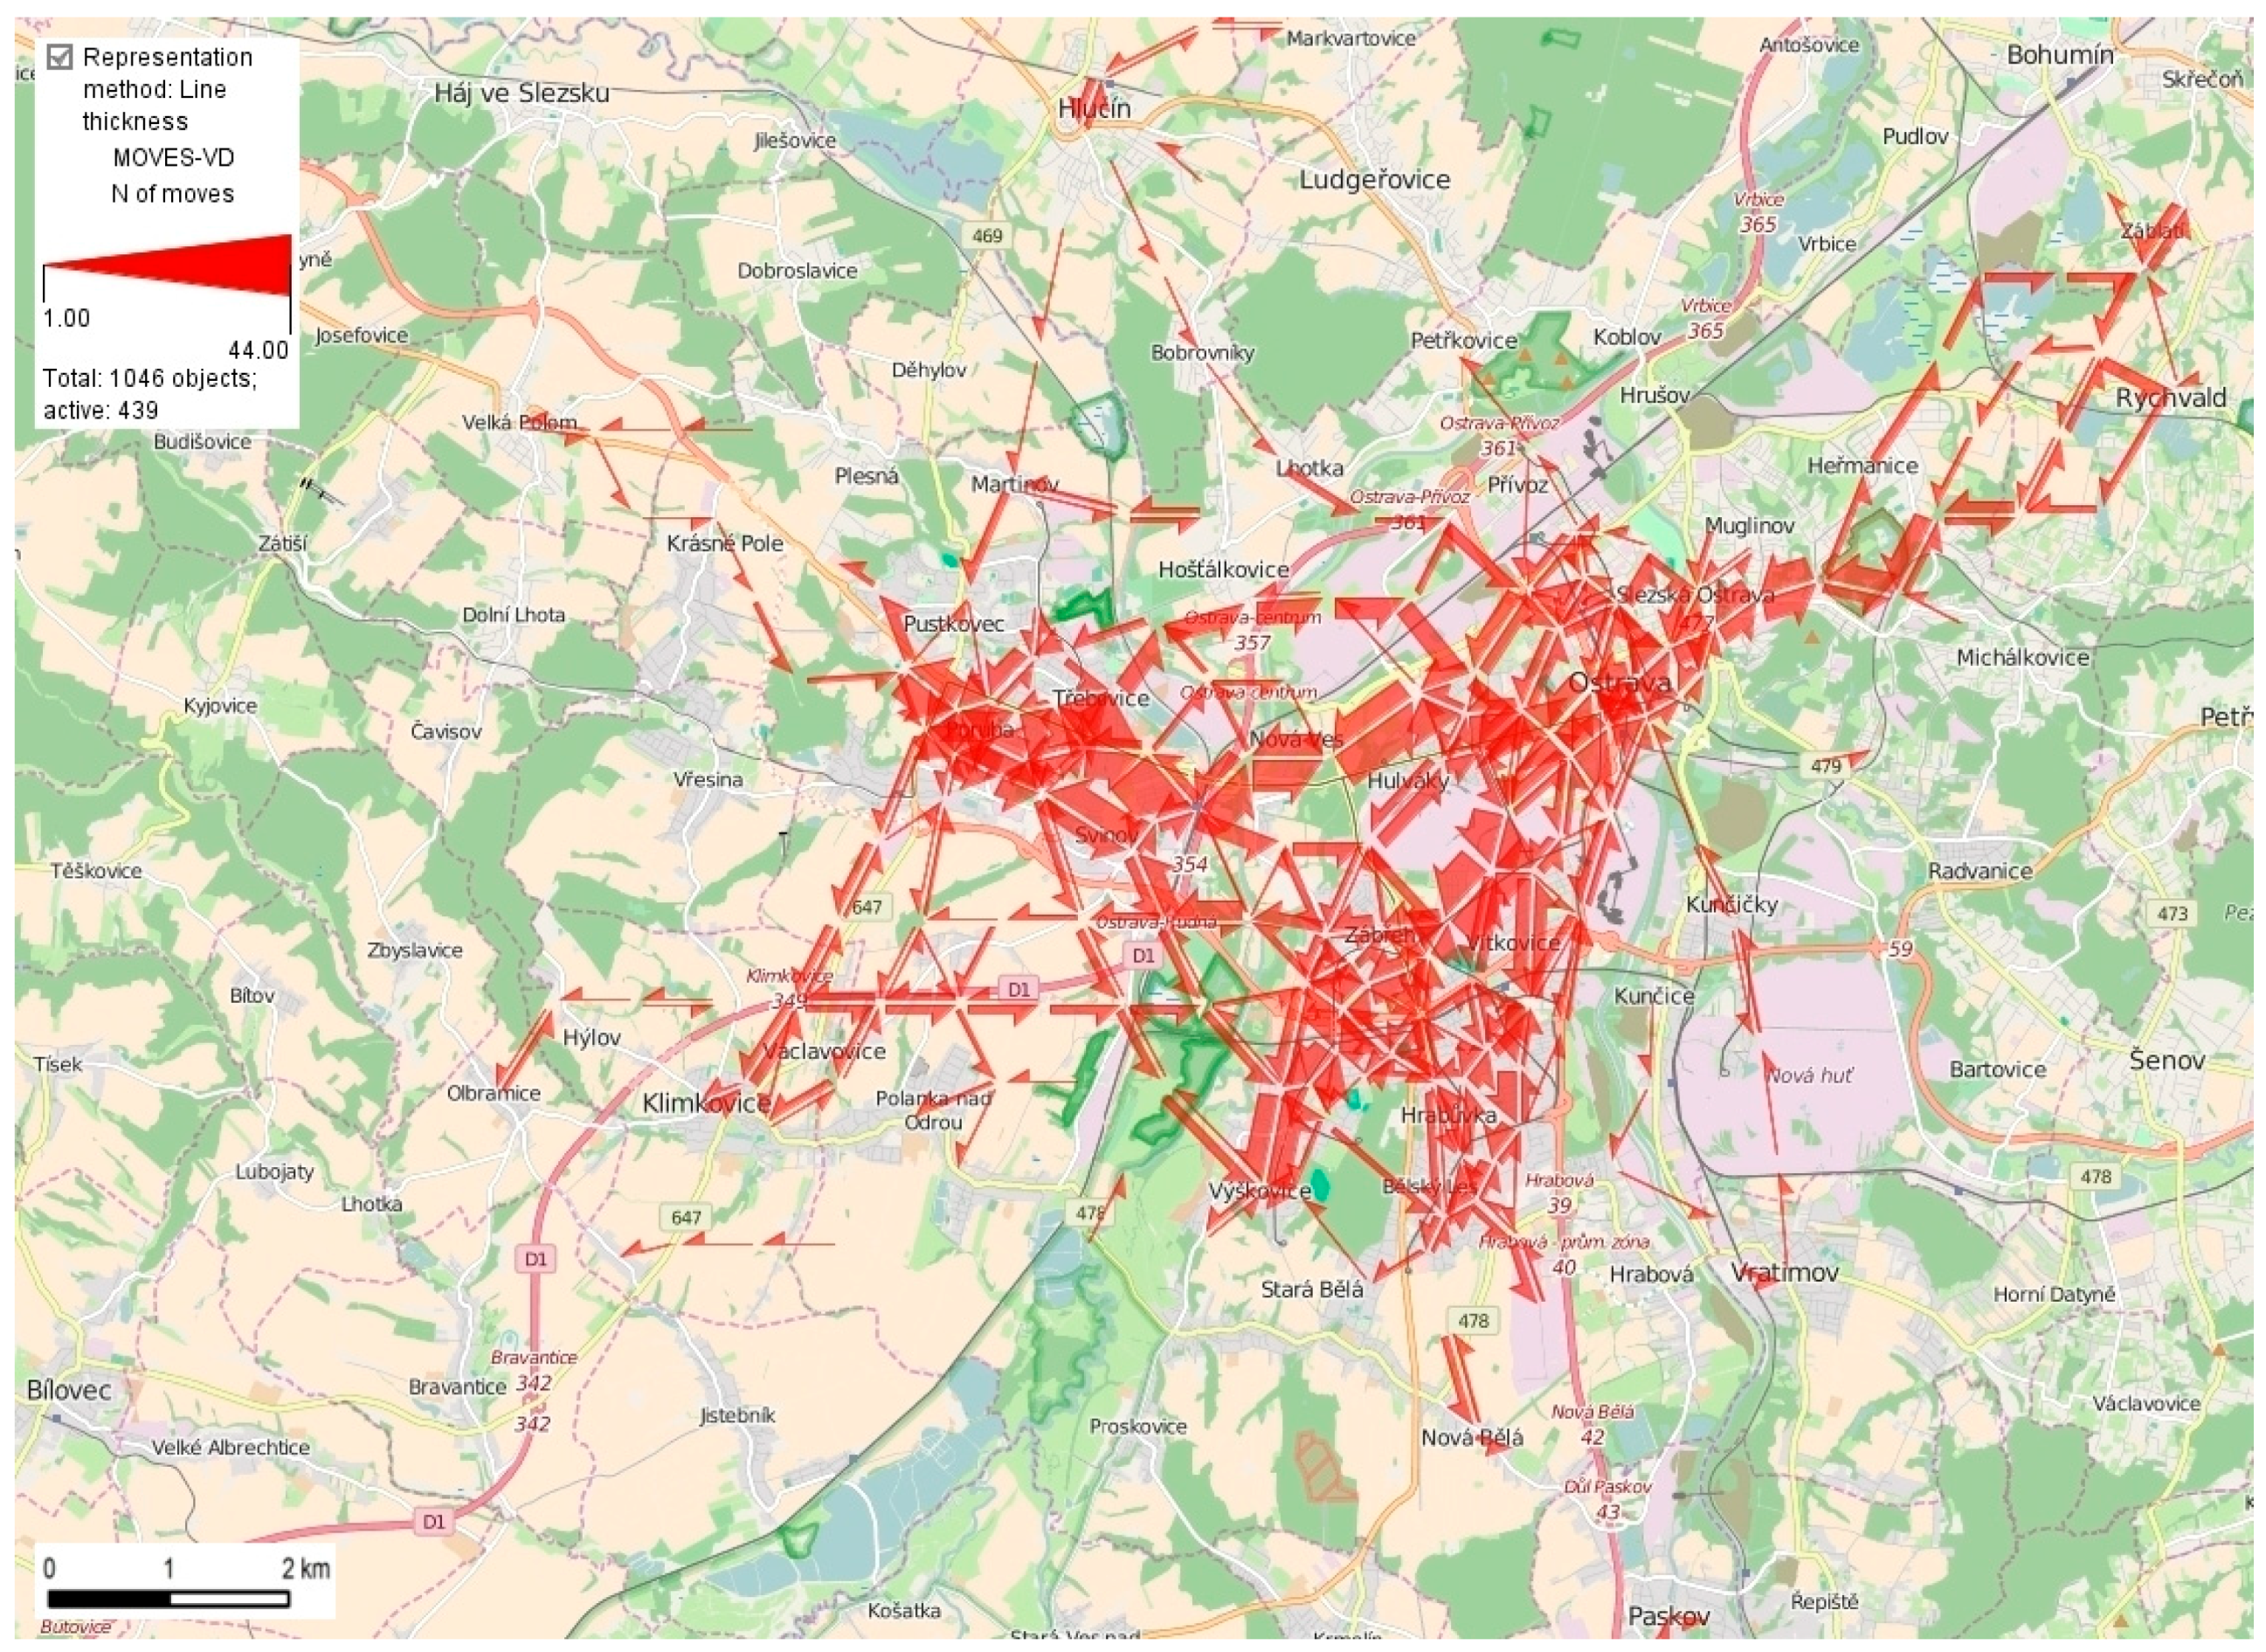
Figure 19.
Dominant directions of movement in Ostrava according to walking.


Table 1.
p-values of Wilcoxon tests for differences between transportation modes in cities.
| Ostrava | ||||
|---|---|---|---|---|
| Walking | Public Transport | Car | ||
| OLOMOUC | walking | 0.45 | <0.0001 | <0.0001 |
| public transport | <0.0001 | <0.0001 | <0.0001 | |
| car | <0.0001 | <0.0001 | <0.0001 | |
© 2018 by the authors. Licensee MDPI, Basel, Switzerland. This article is an open access article distributed under the terms and conditions of the Creative Commons Attribution (CC BY) license (http://creativecommons.org/licenses/by/4.0/).
Share and Cite
MDPI and ACS Style
Burian, J.; Zajíčková, L.; Ivan, I.; Macků, K. Attitudes and Motivation to Use Public or Individual Transport: A Case Study of Two Middle-Sized Cities. Soc. Sci. 2018, 7, 83. https://doi.org/10.3390/socsci7060083
AMA Style
Burian J, Zajíčková L, Ivan I, Macků K. Attitudes and Motivation to Use Public or Individual Transport: A Case Study of Two Middle-Sized Cities. Social Sciences. 2018; 7(6):83. https://doi.org/10.3390/socsci7060083
Chicago/Turabian StyleBurian, Jaroslav, Lenka Zajíčková, Igor Ivan, and Karel Macků. 2018. "Attitudes and Motivation to Use Public or Individual Transport: A Case Study of Two Middle-Sized Cities" Social Sciences 7, no. 6: 83. https://doi.org/10.3390/socsci7060083
Note that from the first issue of 2016, this journal uses article numbers instead of page numbers. See further details here.