Impact of Farmers’ Training Centres on Household Income: Evidence from Propensity Score Matching in Eastern Ethiopia


1
Department of Rural Development and Agricultural Extension, Haramaya University, P.O. Box 138, Dire Dawa, Ethiopia
2
Department of Economics and Management, University of Pavia, Corso Str. Nuova, 65, 27100 Pavia, Italy
*
Author to whom correspondence should be addressed.
Soc. Sci. 2018, 7(1), 4; https://doi.org/10.3390/socsci7010004
Submission received: 17 October 2017
/
Revised: 19 December 2017
/
Accepted: 21 December 2017
/
Published: 25 December 2017
Abstract
:In developing countries, agricultural advisory services (AASs) are regarded as a key component of economic development strategies in terms of improving productivity and livelihoods. Nevertheless, there is a dearth of empirical evidence on the impact of AASs in general and the Farmers’ Training Centres (FTCs) in particular. In this article, we employ the propensity score matching procedure to estimate the impact of an FTC-based training on household farm income in eastern Ethiopia. The result indicates a significant average gain of annual farm income by participants of the training, ranging from Birr 9557 to Birr 10,388 per household.
1. Introduction
About two-third of the world’s poor people live in rural areas, and most of them depend on agriculture for their livelihoods (Mogues et al. 2009). Although agriculture has been the engine for sustainable development in these areas, it is often constrained by issues of access to relevant technologies and improved practices, institutional weaknesses, and deep-rooted problems with the organisation and management of agricultural education, research, and advisory systems. Consequently, agrarian communities and agricultural systems in many countries operate under severe limitations and face major stumbling blocks to the use of knowledge, management skills, and innovation for inclusive development (Asenso-Okyere et al. 2008). To deal with these challenges and to foster agricultural growth especially in disadvantaged rural areas, agricultural advisory services (AASs) have been emphasised in today’s international development discourse (Birner et al. 2009).
AASs refer to the entire set of organisations involved in facilitating and supporting the access of farmers to technical knowledge and skills, improved technologies, credit, markets, and other rural services (Swanson 2008). The renewed interest in AASs is linked to a ‘rediscovery’ of the role of agriculture for pro-poor development and the recognition that these services are a critical means for achieving local economic development (Birkhaeuser et al. 1991). Nevertheless, the benefits that farmers obtain from AASs—and the resulting impact of the services—depend, largely, on their level of participation, which in turn is influenced by their direct and indirect access to the services.
In the case of Ethiopia, the organised and formal provision of these services dates back to the early 1950s. Since then, AASs have passed through a number of transformational stages—from top-down transfer to technologies to participatory demonstration, training and extension system (see (Belay 2003; Gebremedhin et al. 2006) for details). Nonetheless, smallholder productivity remains low because of issues related to production inputs, market, and credit (Davis et al. 2010), and poor provision of AASs. In the face of these challenges and in order to provide effective, co-ordinated, and decentralised AASs at the district level, the provision of AASs has recently been based on the use of Farmers’ Training Centres (FTCs). Farmers’ training centers (FTCs) are training and information institutions that serve as focal points for agricultural development activities at the lowest level of administration (i.e., kebele/peasant association) in rural areas. These FTCs are expected to serve as hubs for farmers to receive advisory services and information, training, and demonstrations on improved and sustainable agricultural practices (Gebremedhin et al. 2006; Mogues et al. 2009; Davis et al. 2010).
Two types of training are offered to farmers at FTCs. These are short-term and modular training. The short-term training is delivered to 15–20 farmers for a period of 3–20 days on the demonstration plots of the FTCs or on the fields of model farmers. The organisation of modular training takes special consideration of the size of participants in order to reduce/avoid adverse effects of large class size. Consequently, a classroom for such training consists of 20–30 trainees. A range of subjects are covered by the modular training—which is 80% practical and 20% theoretical in its content—including agronomy, animal husbandry and health, and natural resource management and conservation. The duration of modular training provided in each subject is 3–6 months. Depending on the type of the subject, two training periods can be arranged each year. Each trainee is expected to attend 2 days/week (6 h per day, of which 2 h for theory and 4 h for practical part). This means, a total of 300 h of participation in the training is required to graduate with a “Green Certificate.” However, there is flexibility in terms of training hours based on the particular context where the training is organised. The training methodologies employed by the FTCs include: class room lecture, demonstration trial, field practice, exposure visit, and rural radio program.
According to the Farmers’ Training Centers Operational Manual/Guideline/ (2009), the selection of farmers into modular training is done by the Kebele extension unit. The operational manual states that “the selection of farmers for the training should focus on identification of committed ones who have the desire and initiative to modernise the existing traditional agricultural practices of the area” (p. 17). Accordingly, for the selection of such farmers—irrespective of religious, economic or other background—four important criteria are used. These are: educational background, devotion and initiatives, age, and gender. Furthermore, development agents and local leaders are key players in the recruitment and selection of such households into the training.
Regarding effectiveness of AASs, prominent scholars in the field agree that AASs provide important benefits in a range of farming systems around the globe (e.g., Birkhaeuser et al. 1991; Swanson 2008; Dercon et al. 2009; Benin et al. 2012). Nonetheless, though there is a vast literature on matters related to AASs, there is an acute shortage of rigorous impact evaluations to carefully inform policy makers and development practitioners on the causal effects of AASs especially in developing countries (Waddington et al. 2010).
In Ethiopian context, there is little systematic and careful empirical investigation regarding the impact of AASs (Dercon et al. 2009). The only rigorous impact evaluation of AASs on final outcomes (i.e., poverty and consumption growth) in the country is that of Dercon et al. (2009). In the study, the researchers show that “receiving at least one visit by agricultural adviser reduces headcount poverty by 9.8 percentage points and increases consumption growth by 7.1 percentage points” (p. 1008). However, the study examined only one of the components of AASs (namely advice/visit) and did not take into account either training or demonstration.
Most importantly, despite its crucial implication for policy making in agriculture and rural development, to the best of our knowledge, there is not any careful empirical study conducted on the effectiveness of the recent introduced FTC-based approach to AAS provision. As a matter of fact, an FTC-based AAS provision is a somewhat recent approach (i.e., since the year 2000), and there is a very shallow literature on it (Davis et al. 2010). Therefore, recognising the gaps in empirical investigations, scarcity of evidence of impact of FTC-based AASs, suggestions of Gebremedhin et al. (2006) and Dercon et al. (2009) on the importance of further inquiries, in this article we investigate the causal effect of FTC-based training on farm income of smallholder farmers in Haramaya district, Ethiopia.
Our investigation contributes to the literature and discussion on AASs by providing evidence of impact of a new approach to AAS provision. First, we extend the efforts of Dercon et al. (2009) by analysing a different component of AASs, i.e., agricultural training. Second, in order to reduce/avoid contamination between treatment and control groups (Benin et al. 2012), we selected households from distinct yet comparable treatment and comparison Kebeles/peasant associations (PAs) of the district. Third, to ensure the quality of data gathered, we followed various procedures outlined by, for example, Nyariki (2009).
Fourth, the construction of the outcome variable is also an important issue. In reference to the policy aim of setting up FTCs and in accordance with the literature dealing with agriculture and allied activities in developing countries (for example, Cunguara and Darnhofer 2011; Davis et al. 2012; Benin et al. 2012), we adopt farm income as our outcome variable. Our definition of farm income encompasses not only incomes from dominant crops (sold, consumed and/or stored) and livestock (products sold and oxen rented out), but also revenues from the otherwise neglected components in many previous studies, i.e., incomes from less-dominant crops and by-products of crop production.
Finally, we followed the prevailing trends regarding choice of variables for estimating propensity score (Caliendo and Kopeinig 2008), choice of matching algorithms (Khandker et al. 2010), and matching quality analysis (Rosenbaum and Rubin 1985; Caliendo and Kopeinig 2008). Following these procedures, we estimate the average effect of training on farm income to be positive and highly significant, ranging from 9557 Birr/year (Nearest Neighbour) to 10,388 Birr/year (Kernel–Gaussian). Moreover, we disaggregated farm income into its constituents and estimated the effect of training on crop income and livestock income separately. Lastly, all the matching quality-checking mechanisms indicate that the results are reasonably robust to changes in estimation methods.
2. Materials and Methods
The data for this article comes from a household survey conducted in Haramaya district from May to October 2013. From the 18 districts in East Hararghe Zone of Oromia Region, Haramaya district was purposively selected based on representativeness to the major farming systems and agro-ecological zones, proximity to the collaborating institutions (i.e., Haramaya University and East Hararghe Zone Bureau of Agriculture and Rural Development), availability of established and functional FTCs, and personal experience in the area. From the 33 PAs in the district, 31 have established FTCs. The establishment of the FTCs is not done randomly since randomness is not in the best interest of the implementers of the program.
From the 31 PAs, 14 have operational FTCs that provide some sort of AASs. At the time of the survey, only ten of these FTCs were providing modular training. From these fully functional FTCs, we selected three—Ifa Oromia, Adele Waltaha, and Biftu Geda—based on representativeness to the rest of the PAs with functional FTCs and comparability to the PAs without FTCs. In the comparison areas, i.e., PAs that do not have any established or functional FTCs, we selected two PAs—Ifa Bate and Fendisha Lencha. These PAs are relatively comparable to the sampled treatment areas in terms of biophysical (topography, weather, etc.) and socio-economic characteristics.
2.1. Sample Selection and Data Collection
According to the Haramaya district Bureau of Agriculture and Rural Development (BoARD), there are 2449 households in the five PAs selected for this study. In treatment PAs, a list of households who participated in modular training and completed it in 2009 was obtained from the district BoARD. From the document, there were 90 such household heads in these areas. These were sampled to form our treatment group. Similarly, in the comparison PAs, the list of households was obtained from the district BoARD. We found 495 households (188 in Ifa Bate and 307 in Fendisha Lencha). Then, we randomly selected 160 households in these areas.
In relation to data collection, before embarking on the actual data collection, we carried out the selection and training of seven research assistants following the recommendations of Nyariki (2009). Likewise, to ensure the collection of good quality data, we employed two supervisors from Haramaya University to closely supervise the enumerators and provide feedback.
2.2. Variable Description
We discuss two issues here. The first one is the construction of outcome variable and the second is the choice of variables for estimating propensity score. The selection of the outcome variable primarily considers the policy aim of setting up FTCs in the study area and the literature dealing with the relationship between agricultural income, agricultural technologies, practices, and institutions in developed and developing countries (e.g., Cunguara and Darnhofer 2011; Benin et al. 2012; Davis et al. 2012; Todo and Takahashi 2013).
According to the FTC establishment document, FTCs are established to increase household income. This is intended to be achieved by providing technical information and advice, training, and demonstration related to crop, livestock, and natural resources, with crop and livestock being the most important components where FTCs are actively engaged in currently. In the light of these considerations, our study takes the agricultural (or farm) income as an outcome variable. Following Cunguara and Darnhofer (2011), we adopted the total farm household factor income from agricultural activities. However, in accordance to Davis et al. (2012), we restricted this concept to the dominant agricultural sectors of the investigated area, crop and livestock activities. Aggregating these two sources of income, we operationalise farm income as the total value of income from crop and livestock production net of the cost of intermediate inputs associated with them.
2.2.1. Income from Crop Production
Crop income by household is calculated as the value of crop sold, used for own consumption and stored, including the value of crop residues net of the intermediate inputs associated with crop production (Table 1) in the last 12 months preceding the survey. The declared quantity of production sold by commodity is converted in terms of Birr (the official currency of Ethiopia. During the survey period, US$1 = 18.7193 Birr and €1 = 24.8302 Birr) according to the price declared by each respondent for each commodity. Summing up the revenues from each crop type sold, we attained the total gross income realised by each household from crops sold.
We also obtained the quantity (kg) of each household’s own consumption and crop stored for future consumption or sale. Moreover, we included revenues from crop residues sold, consumed at household level, and paid as rent. We computed the values based on the declared amounts obtained from each respondent. Moreover, we collected details on household expenses related to intermediate inputs for crop production—fertiliser, pesticides, seeds and seedlings, transport, and other items (Table 1). These expenses are deducted from total revenues to determine crop income.
2.2.2. Income from Livestock Production
Income from livestock production by household is computed as the value of livestock products sold and rent from oxen obtained net of the cost of intermediate inputs associated with livestock production at household level (Table 1). The respondents directly provided information in value terms. As in the case of crops, livestock products have been investigated asking each respondent to provide details on each product sold in the last 12 months preceding the survey. The respondents also provided details on intermediate costs incurred in livestock production, among which are expenses for feed, water, and veterinary services. These have been aggregated and deducted from gross livestock income to compute livestock income. Having computed crop and livestock incomes separately, we derived agricultural (farm) income by combining these two (Table 2).
Table 3 provides information on the constituents of crop income.
2.2.3. Choice of Variables for Estimating Propensity Score
Regarding the choice of variables to estimate propensity score, the most widely followed tradition is to include all variables that simultaneously affect both participation in treatment (i.e., modular training) and outcome (Caliendo and Kopeinig 2008). This implies that a variable that affects outcome but not participation should be excluded. Likewise, any variable which does not affect either participation or outcome should be excluded from the model. In general, it is advised to have a sound economic theory and detailed understanding of the program-specific considerations while choosing the variables (ibid.).
In our investigation, therefore, we consulted both theoretical and empirical sources. Most importantly, we reviewed previous works in various fields employing propensity score matching, paying special attention to the studies that deal with impact evaluation in agricultural or related disciplines.(e.g., Dercon et al. 2009; Amare et al. 2012; Shiferaw et al. 2013). On the basis of these considerations, eligibility and selection criteria, outcome variable, and policy direction of setting up FTCs in the country, we included variables in our model to estimate the propensity score.
2.3. Empirical Strategy for Data Analysis
The analysis in this article relies on the use of propensity score matching (PSM) primarily due to the nature of the program and data available, and the recognition that PSM is an influential approach to estimating impact in a straightforward manner (Dillon 2011). Although the ‘gold standard’ in evaluating impact is implementing randomised control trials (RCTs), this technique is not viable in our setting due to program placement/targeting (Dercon et al. 2009) and self-selection. The alternative approaches to dealing with attribution of impact to interventions (Imbens and Wooldridge 2008) and determining the counterfactual outcome of participants (Caliendo and Kopeinig 2008; Winters et al. 2011) are quasi-experimental techniques, one among them is the PSM. From the different approaches to implementing the PSM (Khandker et al. 2010) it is suggested to try as many matching methods as possible and check overall convergence of results. Therefore, in this article, we employed the Nearest Neighbour, Kernel, and Radius matching estimators.
After performing matching, it is recommended to check whether balancing of the relevant covariates in the two groups is achieved. Matching quality analysis deals with the comparison of situations before and after matching to check if there remains any difference between the two groups after conditioning on the propensity score (Caliendo and Kopeinig 2008). Some of the techniques to check balancing are mean comparisons, standardised bias, and overall measures of covariate imbalance (Rosenbaum and Rubin 1985). In addition to these, Sianesi (2004) suggests the comparison of Pseudo-R2 before and after matching. Moreover, the likelihood ratio test on the joint significance of all covariates in the model should not be rejected before matching, but should be rejected afterwards (Caliendo and Kopeinig 2008). In this article, we tested balancing using all of the techniques mentioned here.
3. Results
3.1. Determinants of Participation in an FTC-Based Modular Training
We begin by presenting the descriptive statistics on the covariates measured at the baseline year (i.e., 2009). As shown in Table 4, there exists a statistically significant difference between treatment and comparison respondents regarding level of education, household size, asset ownership, experience in AASs, organisational membership, and number of educated members of the household. The results of the logistic regression (last column of Table 4) also indicate that level of education, household size, asset ownership, experience in farming, and organisational membership are significant predictors of participation in modular training.
In terms of education, it appears that uneducated farmers have better chance of participating in the training program compared to the educated ones. This targeting can be of particular importance to rural dwellers, as many of them do not have any formal education backgrounds. Household size is negatively related to participation probably because the more the number of members of a household, the better and diversified the opportunity to earn income outside of farming. Ownership of productive assets positively affects participation, which may be because the implementation of knowledge and skills obtained from such training requires some assets. Finally, organisational membership also positively influences participation in training. Since rural development requires the availability of complementary inputs, membership in and access to such organisations can play a great role in the adoption of productivity enhancing technologies and practices.
3.2. Estimation of the Average Effect of Training on Farm Income
Estimation of the average effect of training on outcome variables of trained participants (ATT) was performed on Stata using psmatch2 (Leuven and Sianesi 2003). The results are presented in Table 5. Accordingly, the average effect of training on farm income of trained farmers is positive and significant, ranging from 9557 birr/year (Nearest Neighbour) to 10,388 birr/year (Kernel–Gaussian), on average. Similarly, the causal effect of training on crop income is positive and significant, ranging from 9901 birr/year (Nearest Neighbour) to 10,686 birr/year (Kernel–Gaussian), on average. Although not significant, the impact of training on livestock income appears to be negative by all the matching techniques implemented. Though the dominant contributor of farm income in the study area is crop production, the livestock sector also has about 8% and 5% share of total farm income in treatment and comparison groups, respectively.
Looking at farm income in columns (1) to (3) of Table 5, there is convergence of the results obtained using the two Kernels and Radius matching. In general, all the matching algorithms show positive and significant gain of farm income by the participants of the training, on average. Moreover, the ATT estimation based on the disaggregation of farm income into its components crop and livestock incomes also reveals quite similar patterns for crop income. In terms of livestock income, however, the results suggest poor performance of trained farmers. This may partly be due to our definition of livestock income—income from sell of livestock products and oxen rented out.
4. Discussion
FTC-based modular training programs can play positive roles in affecting rural people’s livelihoods in Ethiopia. Although it has been shown recently that the general AASs in the country have positive contributions towards reducing headcount poverty and increasing consumption growth (Dercon et al. 2009), such analysis considers neither on-farm training nor FTC-based provision of AASs. In this article, we show the positive effects of FTC-based training on farm and crop income. In doing so, we further the discussion on FTC-based AASs by incorporating an impact evaluation component to the efforts of Tefera et al. (2011) and Davis et al. (2010). Our results are broadly consistent with previous research on the roles of the National Agricultural Advisory Services (NAADS) of Uganda. The research on the impact of the Ugandan NAADS program (Benin et al. 2011; Benin et al. 2012) documents positive effects on agricultural income. In particular, Benin et al. (2011) show an increase of 37–95% (direct participants) and 27–55% (indirect participants) per capita gross agricultural revenues between 2004 and 2007. In general, in this article we show that FTC-based training has a positive and significant impact on household’s farm income, which is reasonably robust to changes in matching methods.
In relation to matching quality and common support condition, similar to Sianesi (2004) and Arpino and Aassve (2013), we implemented mean comparisons (before and after matching), standardised bias, and overall measures of covariate imbalance to check matching quality. The mean comparisons between the two groups before matching indicate the existence of significant differences for many of the covariates. However, the post-matching t-test results indicate that none of these variables shows significant differences, suggesting that the different matching procedures enabled balancing of the covariates (Table 6). Looking at the absolute standardised percentage bias in the unmatched sample (Table 7), the variables education, household size, assets, experience in AASs, organisational membership, and number of educated members of the household show huge values. However, the post-matching results show that there is a significant reduction in the standardised percentage bias for all of these covariates. In general, most of the covariates have a standardised percentage bias of <5%.
The bottom half of Table 7 contains the overall measures of covariate imbalance. Accordingly, the original mean bias of 27.9 in the unmatched sample is reduced to <3.5%. Similarly, the significant reduction of the Pseudo-R2 original value in the unmatched sample also guarantees that the matching procedures were effective in reducing the existing bias.
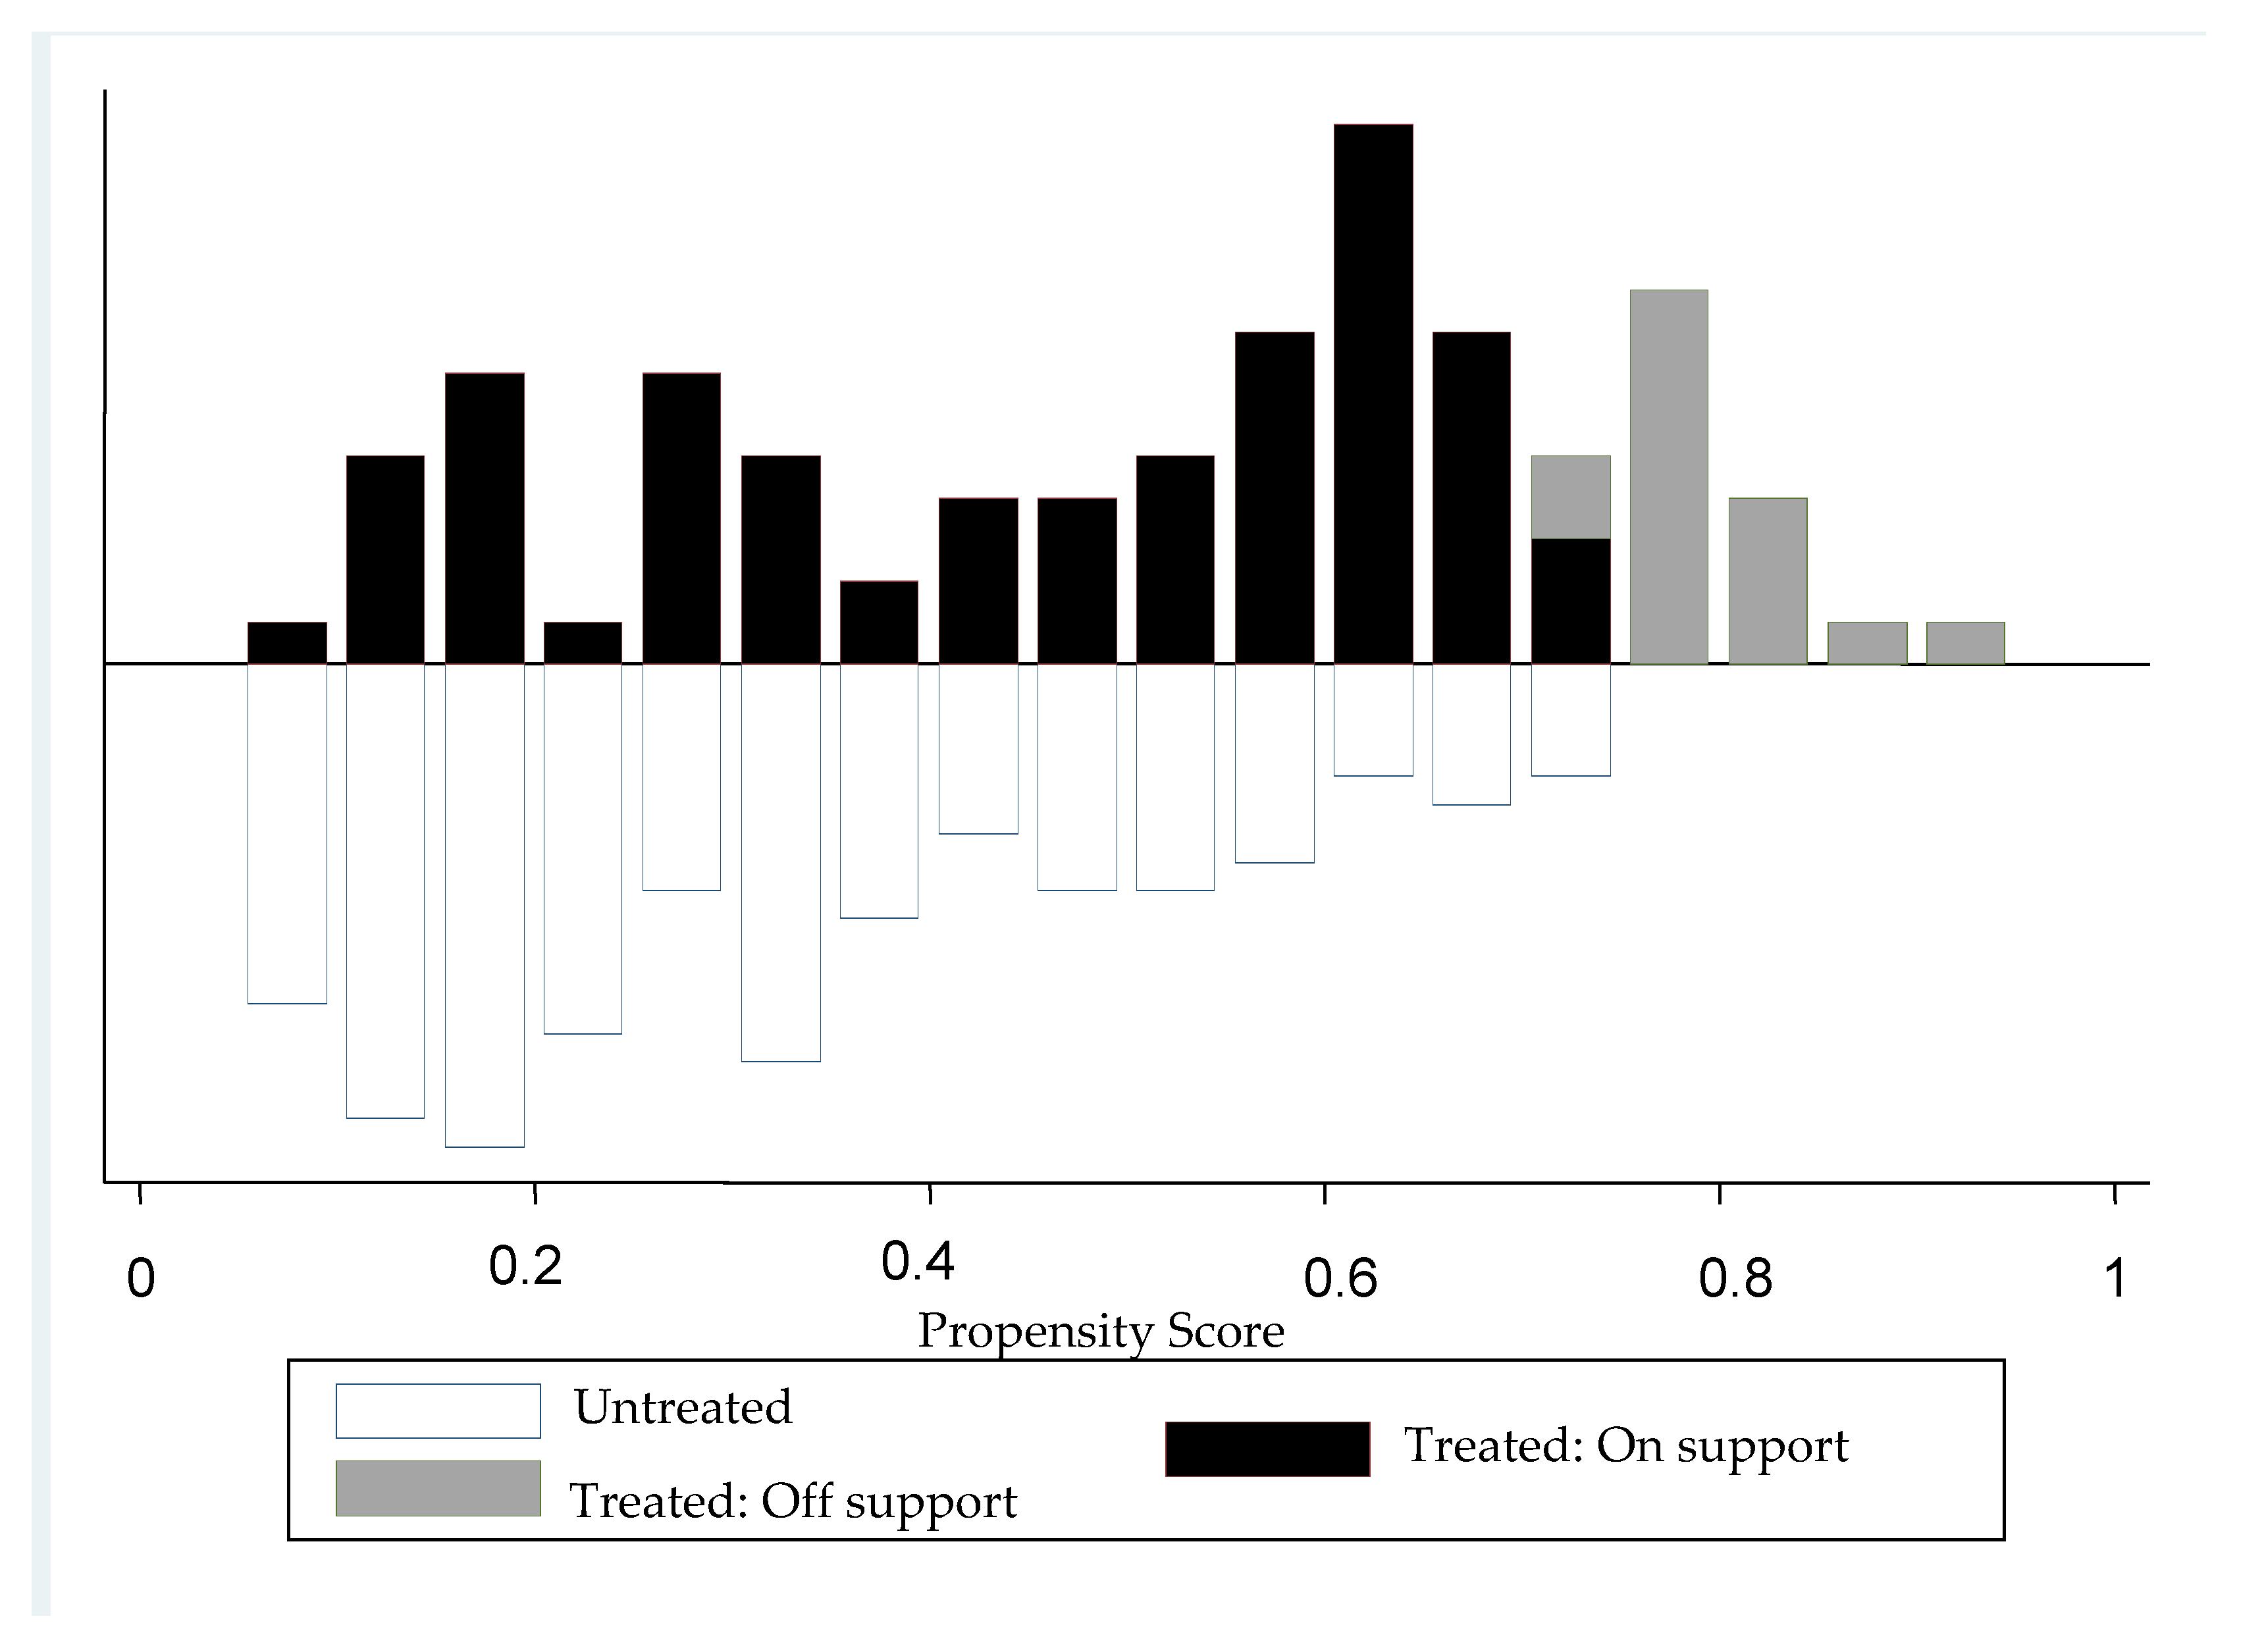
Finally, the psgraph (Figure 1) indicates the existence of a good overlap between the propensity scores of treatment and comparison respondents. Out of the 250 respondents in the pooled sample, 73 and 137 treatment and comparison respondents are on common support, respectively.
5. Conclusions
In this article, we show the causal effect of participating in an FTC-based training on rural households’ income. Through collecting data specifically for the purpose of impact evaluation and implementing rigorous evaluation methods, we address previous criticisms on data quality and methodological rigor (Birkhaeuser et al. 1991; Waddington et al. 2010). By providing evidence on the impact of a new approach to AASs, we contribute towards the renewed discussion on the role of AASs in fostering sustainable agricultural and rural development (Birner et al. 2009). In particular, by investigating the impact of agricultural training, we show the need for a due emphasis on this component of AASs in equipping farm households with the necessary practical knowledge and skills. One of our findings relates to the decision to participate in the FTC-based training. The participation equation reveals some fundamental covariates influencing the participation of rural households in agricultural training. Accordingly, we find that education, household size, asset ownership, experience in farming, and membership in organisations significantly affect the decision to take part in such training.
Regarding the impact estimates, we find a good overall convergence of results obtained using various matching methods, suggesting the efficiency of the implemented matching procedures. More specifically, all the matching techniques indicated a positive and significant average gain of farm income by the participants of the training. Furthermore, the analysis based on the breakdown of farm income into its components also shows that participation in training resulted in a positive and significant gain of crop income, on average. However, it appears that the results for livestock income are negative, though not significant. In order to have confidence on the results of the matching, we conducted a variety of matching quality analyses, including t-test, standardised percentage bias, and likelihood-ratio test. All these measures indicate that our matching procedures are effective in balancing the covariates and that they are efficient.
Based on the results of our investigation, the following recommendations are suggested. To start, there should be a reinforced awareness creation campaign regarding the importance of an FTC-based training, so that rural households may be committed in their participation in all aspects of the FTCs. In particular, young farmers need to be encouraged to partake in the training. Since the default household heads are males, there should be a specific targeting of young and women farmers irrespective of their status in the household. In this regard, a general shift of targeting from household heads to members of the household is suggested. Furthermore, a minimum experience in farming and general AASs should be sufficient to qualify young farmers for such training. It is also important to pay special attention to households who do not have enough family labour to work on the farm. Likewise, since asset ownership positively determines participation in training, a particular focus needs to be devoted to asset-constrained households. Similar to the case with assets, membership in organisations also plays crucial roles. Hence, not only should those with limited access to organisations/associations be specially considered, but also should be oriented on how to become a member in such organisations (for example, credit and saving, microfinance, farmers’ associations, etc.).
In terms of the impact of training on farm income, although we find positive and significant impacts, there is a need to strengthen and support vegetable and root crop production. Moreover, since the study area is favourable for the production of small ruminants and cattle, there should be an increased effort towards the promotion of improved livestock management. In addition to these, other stakeholders of the agricultural innovation process should work towards broadening market incentives for farmers in the production of staple food and cash crops.
Finally, here are some issues for future investigation. The first aspect requires the inclusion of more FTCs from the different agro-ecological zones of the country in order to evaluate nationwide impact of the FTC-based AASs. Such a mega-project can collect baseline data on important covariates, including outcome variables, and can be amenable to the use of various evaluation techniques. One potential technique can be combining PSM with difference-in-difference, which is superior to using each technique single-handedly. Another issue relates to a move away from individual level evaluations to aggregate levels (such as village/peasant association, district, etc.) or a combination of both of them. Whereas the former can enable a researcher to better capture spillover effects of an intervention as well as any unobserved heterogeneity in treatment and comparison groups, the latter can help in checking the complementarity of individual and group-based approaches to impact evaluation.
Author Contributions
Muluken Gezahegn Wordofa and Maria Sassi conceived, designed and performed the experiments as well as analyzed the data and wrote the paper.
Conflicts of Interest
The authors declare no conflict of interest.
References
- Amare, Mulubrhan, Solomon Asfaw, and Bekele Shiferaw. 2012. Welfare impacts of maize–pigeonpea intensification in Tanzania. Agricultural Economics 43: 27–43. [Google Scholar] [CrossRef]
- Arpino, Bruno, and Arnstein Aassve. 2013. Estimating the causal effect of fertility on economic wellbeing: Data requirements, identifying assumptions and estimation methods. Empirical Economics 44: 355–85. [Google Scholar] [CrossRef]
- Asenso-Okyere, Kwadwo, Kristin Elizabeth Davis, and Dejene Aredo. 2008. Advancing Agriculture in Developing Countries through Knowledge and Innovation: Synopsis of an International Conference. Washington: International Food Policy Research Institute. [Google Scholar]
- Belay, Kassa. 2003. Agricultural extension in Ethiopia: the case of participatory demonstration and training extension system. Journal of Social Development in Africa 18. [Google Scholar] [CrossRef]
- Benin, Samuel, Ephraim Nkonya, Geresom Okecho, Josee Randriamamonjy, Edward Kato, Geofrey Lubade, and Miriam Kyotalimye. 2011. Returns to spending on agricultural extension: the case of the National Agricultural Advisory Services (NAADS) program of Uganda. Agricultural Economics 42: 249–67. [Google Scholar] [CrossRef]
- Benin, Samuel, Ephraim Nkonya, Geresom Okecho, Josee Randriamamonjy, Edward Kato, Geofrey Lubade, and Miriam Kyotalimye. 2012. Impact of the National Agricultural Advisory Services (Naads) program of Uganda: Considering Different Levels of Likely Contamination with the Treatment. American Journal of Agricultural Economics 94: 386–92. [Google Scholar] [CrossRef]
- Birkhaeuser, Dean, Robert E. Evenson, and Gershon Feder. 1991. The economic impact of agricultural extension: A review. Economic Development and Cultural Change 39: 607–50. [Google Scholar] [CrossRef]
- Birner, Regina, Kristin E. Davis, John L. Pender, Ephraim Nkonya, Ponniah Anandajayasekeram, Javier Ekboir, and Marc Cohen. 2009. From Best Practice to Best Fit: A Framework for Designing and Analyzing Pluralistic Agricultural Advisory Services Worldwide. The Journal of Agricultural Education and Extension 15: 341–55. [Google Scholar] [CrossRef]
- Caliendo, Marco, and Sabine Kopeinig. 2008. Some practical guidance for the implementation of propensity score matching. Journal of Economic Surveys 22: 31–72. [Google Scholar] [CrossRef]
- Cunguara, Benedito, and Ika Darnhofer. 2011. Assessing the impact of improved agricultural technologies on household income in rural Mozambique. Food Policy 36: 378–90. [Google Scholar] [CrossRef]
- Davis, Kristin, Burton Swanson, David Amudavi, Daniel Aayalew Mekonnen, Aaron Flohrs, Jens Riese, Chloe Lamb, and Elias Zerfu. 2010. In-Depth Assessment of the Public Agricultural Extension System of Ethiopia and Recommendations for Improvement (No. 1041). Washington: International Food Policy Research Institute (IFPRI). [Google Scholar]
- Davis, Kristin, Ephraim Nkonya, Edward Kato, Daniel Ayalew Mekonnen, Martins Odendo, Richard Miiro, and Jackson Nkuba. 2012. Impact of Farmer Field Schools on Agricultural Productivity and Poverty in East Africa. World Development 40: 402–13. [Google Scholar] [CrossRef]
- Dercon, Stefan Dercon, Daniel O. Gilligan, John Hoddinott, and Tassew Woldehanna. 2009. The Impact of Agricultural Extension and Roads on Poverty and Consumption Growth in Fifteen Ethiopian Villages. American Journal of Agricultural Economics 91: 1007–21. [Google Scholar] [CrossRef]
- Dillon, Andrew. 2011. Do Differences in the Scale of Irrigation Projects Generate Different Impacts on Poverty and Production? Journal of Agricultural Economics 62: 474–92. [Google Scholar] [CrossRef]
- Farmers’ Training Centers Operational Manual/Guideline/. 2009. Agricultural Extension Department, Ministry of Agriculture and Rural Development, Federal Democratic Republic of Ethiopia. Available online: http://www.oerafrica.org/ftpfolder/website%20materials/Agriculture/haramaya/Perspective_Agricultural_Extension/AICM%20Module%20Final%20Jan%2031,%202012/FTC_guideline[1].doc (accessed on 15 October 2013).
- Gebremedhin, Berhanu, Dirk Hoekstra, and Azage Tegegne. 2006. Commercialization of Ethiopian Agriculture: Extension Service from Input Supplier to Knowledge Broker and Facilitator. Available online: http://cgspace.cgiar.org/handle/10568/564 (accessed on 23 November 2011).
- Imbens, Guido Wilhelmus, and Jeffrey Marc Wooldridge. 2008. Recent Developments in the Econometrics of Program Evaluation. National Bureau of Economic Research. Available online: http://www.nber.org/papers/w14251 (accessed on 26 February 2013).
- Khandker, Shahidur Rahman, Gayatri Brij Koolwal, and Hussain Samad. 2010. Handbook on Impact Evaluation: Quantitative Methods and Practices. Washington: World Bank Publications. [Google Scholar]
- Leuven, Edwin, and Barbara Sianesi. 2003. Psmatch2: Stata module to perform full Mahalanobis and propensity score matching, common support graphing, and covariate imbalance testing. In Statistical Software Components S 432001. Chestnut Hill: Boston College. [Google Scholar]
- Mogues, Tewodaj, Marc Cohen, Regina Birner, Mamusha Lemma, Josee Randriamamonjy, Fanaye Tadesse, and Zelekawork Paulos. 2009. Agricultural Extension in Ethiopia through a Gender and Governance Lens. International Food Policy Research Institute ESSP2 Discussion Paper 007. Available online: http://www.ifpri.org/publication/agricultural-extension-ethiopia-through-gender-and-governance-lens (accessed on 5 December 2012).
- Nyariki, Dickson. 2009. Household Data Collection for Socio-Economic Research in Agriculture: Approaches and Challenges in Developing Countries. Journal of Social Sciences 19: 91–99. [Google Scholar] [CrossRef]
- Rosenbaum, Paul, and Donald Rubin. 1985. Constructing a control group using multivariate matched sampling methods that incorporate the propensity score. The American Statistician 39: 33–38. [Google Scholar]
- Shiferaw, Bekele, Menale Kassie, Moti Jaleta, and Chilot Yirga. 2013. Adoption of improved wheat varieties and impacts on household food security in Ethiopia. Food Policy 44: 272–84. [Google Scholar] [CrossRef]
- Sianesi, Barbara. 2004. An evaluation of the Swedish system of active labor market programs in the 1990s. Review of Economics and Statistics 86: 133–55. [Google Scholar] [CrossRef]
- Swanson, Burton. 2008. Global Review of Good Agricultural Extension and Advisory Service Practices. Rome: Food and Agriculture Organization of the United Narions. [Google Scholar]
- Tefera, Tesfaye Lemma, Sehai Ermias, and Hoekstra Dirk. 2011. Status and Capacity of Farmer Training Centers (FTCs) in the Improving Productivity and Market Success (IPMS) Pilot Learning Woredas (PLWs). Addis Ababa: International Livestock Research Institute (ILRI). [Google Scholar]
- Todo, Yasuyuki, and Ryo Takahashi. 2013. Impact of Farmer Field Schools on Agricultural Income And Skills: Evidence From An Aid-Funded Project In Rural Ethiopia. Journal of International Development 25: 362–81. [Google Scholar] [CrossRef]
- Waddington, Hugh, Birte Snilstveit, Howard White, and Jock Anderson. 2010. The Impact of Agricultural Extension Services. 3ie Synthetic Reviews-SR009 Protocol January. Available online: http://www.3ieimpact.org/media/filer/2012/05/07/009%20Protocol.pdf (accessed on 12 March 2011).
- Winters, Paul, Alessandro Maffioli, and Lina Salazar. 2011. Introduction to the Special Feature: Evaluating the Impact of Agricultural Projects in Developing Countries. Journal of Agricultural Economics 62: 393–402. [Google Scholar] [CrossRef]
Figure 1.
Histogram of estimated propensity score between participants (treated) and nonparticipants (untreated) of Farmers’ Training Center-based modular training. Source: Own elaboration with survey data.
Figure 1.
Histogram of estimated propensity score between participants (treated) and nonparticipants (untreated) of Farmers’ Training Center-based modular training. Source: Own elaboration with survey data.

Table 1.
Average value (birr) of crop and livestock income in treatment and comparison groups.
| Treatment | Comparison | t-Test | |
|---|---|---|---|
| 30,216 (11,545) | 59,341 (78,748) | 3.48 *** |
| 1645 (1834) | 1205 (1732) | 1.89 * |
| 31,861 (12,437) | 60,546 (78,811) | 3.43 *** |
| 2440 (978) | 4858 (6276) | 3.63 *** |
| 29,421 (12,458) | 55,688 (77,442) | 3.19 *** |
| 2876 (1639) | 4422 (6444) | 2.23 ** |
| 798 (791) | 1689 (2207) | 3.69 *** |
| 2078 (1849) | 2733 (6692) | 0.91 |
| Number of observations | 90 | 160 |
Notes: Standard deviation in parenthesis. Asterisks ***, **, and * indicate statistical significance at the 1%, 5%, and 10% levels, respectively. Source: Own calculation based on survey data.
Table 2.
Distribution of average values (birr) of outcome variables in the study sample.
| Outcome Variable | Treatment | Comparison | t-Test |
|---|---|---|---|
| 1. farm income | 20,135.42 (1219.91) | 11,653.44 (1077.61) | −4.98 *** |
| 2. crop income | 18,057.44 (1248.76) | 8919.99 (831.15) | −6.30 *** |
| 3. livestock income | 2077.98 (194.86) | 2733.46 (529.04) | 0.91 |
| Number of observations | 90 | 160 |
Notes: Standard errors in parenthesis. Asterisks *** indicate statistical significance at the 1% level. Source: Own calculation based on survey data.
Table 3.
Contribution of various crops to gross crop income (percentage share).
| Gross Crop Income | |||
|---|---|---|---|
| Treatment | Comparison | Total | |
| Cereals | 41.23 | 23.41 | 29.83 |
| Vegetables | 0.88 | 0.11 | 0.39 |
| Root crops | 11.78 | 7.22 | 8.86 |
| Chat | 39.97 | 63.64 | 55.12 |
| Crop residues | 4.76 | 4.33 | 4.48 |
| Others | 1.38 | 1.29 | 1.32 |
| Total | 100.00 | 100.00 | 100.00 |
Source: Own calculation based on survey data.
Table 4.
Baseline data on covariates by treatment group and logistic regression results.
| Baseline Statistics | Reg. Coef. a | |||
|---|---|---|---|---|
| Treatment | Comparison | t-Test | ||
| Age of the household head (1 if greater than 18 years) | 0.99 | 0.99 | −0.41 | −0.53 (1.47) |
| Gender (1 if male) | 0.98 | 0.96 | 0.66 | 1.24 (0.92) |
| Education (1 if attended school) | 0.30 | 0.68 | −6.10 *** | −1.93 (0.35) *** |
| Household size (number of people) | 3.30 | 3.99 | −2.47 ** | −0.16 (0.08) ** |
| Assets (number of assets) | 3.01 | 2.61 | 3.22 *** | 0.42 (0.18) ** |
| Farming experience (number of years) | 18.29 | 18.62 | −0.36 | −0.08 (0.04) ** |
| Experience in AASs (number of years) | 15.24 | 13.63 | 1.69 * | 0.05 (0.03) |
| Land holding (1 if greater than or equal to 1 ha) | 0.32 | 0.36 | −0.54 | −0.15 (0.36) |
| Organisation (1 if a member of at least one organisation) | 0.99 | 0.86 | 3.38 *** | 2.47 (1.06) ** |
| Educated members of the household (1 if greater than or equal to 1) | 0.89 | 0.95 | −1.80 * | 0.53 (0.60) |
| Number of observations | 90 | 160 | 250 | |
| Pseudo R2 | 0.21 | |||
| LR chi2(10) | 67.95 *** | |||
Notes: Asterisks ***, **, and * indicate statistical significance at the 1%, 5%, and 10% levels, respectively. a Logistic regression coefficients. Standard errors in parenthesis. Statistical significance based on Z statistics. Source: Own calculation and estimation based on survey data.
Table 5.
Estimation of average effect of training on outcome variables using nearest neighbours, kernel and radius matching.
Table 5.
Estimation of average effect of training on outcome variables using nearest neighbours, kernel and radius matching.
| Outcome Variable (Birr) | (1) | (2) | (3) | |
|---|---|---|---|---|
| (2a) | (2b) | |||
| 1. Farm income per household | 9557.47 (2561.70) *** | 10,387.53 (2129.27) *** | 9846.20 (2685.35) *** | 10,233.93 (2509.94) *** |
| 2. Crop income per household | 9900.59 (2487.14) *** | 10,685.63 (2165.25) *** | 10,105.76 (2713.51) *** | 10,453.21 (2571.27) *** |
| 3. Livestock income per household | −343.12 (837.34) | −298.10 (565.04) | −259.56 (666.38) | −219.28 (647.25) |
Notes: 73 treated and 137 untreated individuals on common support. (1) Nearest Neighbours matching; (2) Kernel matching; (2a) Normal (Gaussian) Kernel; (2b) Epanechnikov Kernel; (3) Radius matching. Bootstrap standard errors with 50 replications in parenthesis. Asterisks *** indicate statistical significance at the 1% levels. Source: Own estimation using survey data.
Table 6.
Matching quality analysis: t-test results before/after matching.
| Unmatched (Mean and t-Test) | Matched (t-Test between Treated and Control Groups) | ||||||
|---|---|---|---|---|---|---|---|
| Treated | Control | t-Test | (1) | (2a) | (2b) | (3) | |
| Age of the household head (1 if greater than 18 years) | 0.99 | 0.99 | −0.41 | 0.13 | −0.41 | −0.36 | −0.39 |
| Gender (1 if male) | 0.98 | 0.96 | 0.66 | −0.21 | −0.03 | 0.04 | −0.00 |
| Education (1 if attended some formal school) | 0.30 | 0.68 | −6.10 *** | −0.07 | −0.39 | −0.22 | −0.27 |
| Household size (number of people in the house) | 3.30 | 3.99 | −2.47 ** | 0.20 | 0.36 | 0.23 | 0.37 |
| Assets (number) | 3.01 | 2.61 | 3.22 *** | 0.23 | 0.17 | −0.10 | 0.05 |
| Farming experience (in years) | 18.29 | 18.62 | −0.36 | −0.25 | –0.20 | –0.24 | –0.10 |
| Experience in AASs (in years) | 15.24 | 13.63 | 1.69 * | –0.31 | –0.13 | –0.35 | –0.16 |
| Land holding (1 if greater than or equal to 1 ha) | 0.32 | 0.36 | –0.54 | –0.07 | 0.04 | –0.09 | –0.03 |
| Organisation (1 if a member of at least one organisation) | 0.99 | 0.86 | 3.38 *** | –0.00 | 0.34 | –0.12 | –0.06 |
| Educated members (1 if greater than or equal to 1) | 0.89 | 0.95 | −1.80 * | −0.35 | −0.20 | −0.30 | −0.32 |
Notes: (1) Nearest Neighbours matching; (2) Kernel matching; (2a) Normal (Gaussian) Kernel; (2b) Epanechnikov Kernel; (3) Radius matching. Asterisks ***, **, and * indicate statistical significance at the 1%, 5%, and 10% levels, respectively. Source: Own estimation based on survey data.
Table 7.
Matching quality analysis: standardised percentage bias (before/after matching) and overall measures of covariate imbalance.
Table 7.
Matching quality analysis: standardised percentage bias (before/after matching) and overall measures of covariate imbalance.
| Unmatched | Matched | ||||
|---|---|---|---|---|---|
| (1) to (3) | (1) | (2a) | (2b) | (3) | |
| Age of the household age (1 if greater than 18 years) | −5.2 | 2.9 | −6.2 | −6.6 | −7.0 |
| Gender (1 if male) | 8.9 | −3.2 | −0.5 | 0.7 | −0.1 |
| Education (1 if attended some formal school) | −80.6 | −1.2 | −6.7 | −3.8 | −4.7 |
| Household size (number of people in the house) | −34.1 | 3.1 | 5.8 | 3.6 | 5.9 |
| Assets (number of productive assets) | 43.9 | 3.6 | 2.6 | −1.5 | 0.8 |
| Farming experience (number of years) | −5.1 | −4.1 | −3.4 | −4.0 | −1.7 |
| Experience in AASs (number of years) | 22.4 | −5.0 | −2.1 | −5.8 | −2.6 |
| Land holding (1 if greater than or equal to 1 ha) | −7.2 | −1.2 | 0.8 | −1.5 | −0.6 |
| Organisation (1 if a member of an organisation) | 49.5 | 0.0 | 2.9 | −0.9 | −0.4 |
| Educated members (1 if greater than or equal to 1) | −22.5 | −6.0 | −3.4 | −5.3 | −5.6 |
| Mean | 27.9 (24.5) | 3.0 (1.9) | 3.4 (2.2) | 3.4 (2.1) | 3.0 (2.6) |
| Median | 22.4 | 3.2 | 3.2 | 3.7 | 2.2 |
| Variance | 602.1 | 3.4 | 4.7 | 4.5 | 7.0 |
| Pseudo R2 | 0.21 | 0.003 | 0.003 | 0.003 | 0.003 |
| LR chi2 | 68.4 *** | 0.53 | 0.70 | 0.63 | 0.60 |
Notes: (1) Nearest Neighbours matching; (2) Kernel matching; (2a) Normal (Gaussian) Kernel; (2b) Epanechnikov Kernel; (3) Radius matching. Standard deviation in parenthesis. Asterisks *** indicate statistical significance at the 1% level. Source: Own estimation.
© 2017 by the authors. Licensee MDPI, Basel, Switzerland. This article is an open access article distributed under the terms and conditions of the Creative Commons Attribution (CC BY) license (http://creativecommons.org/licenses/by/4.0/).
Share and Cite
MDPI and ACS Style
Wordofa, M.G.; Sassi, M. Impact of Farmers’ Training Centres on Household Income: Evidence from Propensity Score Matching in Eastern Ethiopia. Soc. Sci. 2018, 7, 4. https://doi.org/10.3390/socsci7010004
AMA Style
Wordofa MG, Sassi M. Impact of Farmers’ Training Centres on Household Income: Evidence from Propensity Score Matching in Eastern Ethiopia. Social Sciences. 2018; 7(1):4. https://doi.org/10.3390/socsci7010004
Chicago/Turabian StyleWordofa, Muluken Gezahegn, and Maria Sassi. 2018. "Impact of Farmers’ Training Centres on Household Income: Evidence from Propensity Score Matching in Eastern Ethiopia" Social Sciences 7, no. 1: 4. https://doi.org/10.3390/socsci7010004
Note that from the first issue of 2016, this journal uses article numbers instead of page numbers. See further details here.