Review

The Effectiveness of Healthy Community Approaches on Positive Health Outcomes in Canada and the United States

by
Hazel Williams-Roberts
1,
Bonnie Jeffery
2,
Shanthi Johnson
3 and
Nazeem Muhajarine
4,*
1
Community Health and Epidemiology, University of Saskatchewan, Saskatoon, Saskatchewan S7N 5E5, Canada
2
Faculty of Social Work, Saskatchewan Population Health and Evaluation Research Unit, University of Regina, Prince Albert Campus, Saskatchewan S6V 7S3, Canada
3
Faculty of Kinesiology and Health Studies, Saskatchewan Population Health and Evaluation Research Unit, University of Regina, Regina, Saskatchewan S4S 0A2, Canada
4
Community Health and Epidemiology, Saskatchewan Population Health and Evaluation Research Unit, University of Saskatchewan, Saskatoon, Saskatchewan S7N 5E5, Canada
*
Author to whom correspondence should be addressed.
Soc. Sci. 2016, 5(1), 3; https://doi.org/10.3390/socsci5010003
Submission received: 9 October 2015 / Revised: 7 December 2015 / Accepted: 22 December 2015 / Published: 29 December 2015

Abstract

:
Healthy community approaches encompass a diverse group of population based strategies and interventions that create supportive environments, foster community behavior change and improve health. This systematic review examined the effectiveness of ten most common healthy community approaches (Healthy Cities/Communities, Smart Growth, Child Friendly Cities, Safe Routes to Schools, Safe Communities, Active Living Communities, Livable Communities, Social Cities, Age-Friendly Cities, and Dementia Friendly Cities) on positive health outcomes. Empirical studies were identified through a search of the academic and grey literature for the period 2000–2014. Of the 231 articles retrieved, 26 met the inclusion criteria with four receiving moderate quality ratings and 22 poor ratings using the Effective Public Health Practice Project Quality Assessment Tool. The majority of studies evaluated Safe Routes to School Programs and reported positive associations with students’ active commute patterns. Fewer studies assessed benefits of Smart Growth, Safe Communities, Active Living Communities and Age-Friendly Cities. The remaining approaches were relatively unexplored in terms of their health benefits however focused on conceptual frameworks and collaborative processes. More robust studies with longer follow-up duration are needed. Priority should be given to evaluation of healthy community projects to show their effectiveness within the population health context.

Graphical Abstract

1. Introduction

Health is shaped by the daily conditions in which we are born, live, work, play and age [1]. These social determinants of health engender differential exposures and vulnerability to health damaging conditions and influence an individual’s opportunities to live a healthy life. This is the fundamental basis for socioecological models that frame health as the confluence of multiple factors that operate in a nested genetic, biological, behavioral, social and environmental context [2]. Consequently, interventions that seek to improve health outcomes must target multiple levels and engage multisectoral partners to create the supportive conditions that foster healthy choices across settings and throughout the lifecycle.
Healthy community interventions offer a local societal response to address common threats to population health. The term “healthy communities”, originally coined in Canada in the 1980s, refer to communities that employed health promotion and community development strategies to address multiple determinants of health [3].
The built and social environment sometimes limit the resources available to individuals and communities and make it difficult to adopt and maintain healthy behaviors [4]. Community efforts to promote health often target one or both of these domains. The general discourse on this subject is broad and without any specific model that cuts across all approaches. A community’s vision for health is unique and can be pursued through multiple strategies according to their needs, assets and resources. In this article, the term healthy community approach was operationalized as deliberate efforts to improve health at the local/community level. The scope of the review was focused on health promoting strategies and interventions that target the social and physical environment, reflecting the importance of non-medical determinants in health.
The Healthy Communities Unit of the Public Health Agency of Canada commissioned this review and set out to inform their work priorities by understanding which approaches were effective in promoting the health of communities. As a result of their considerable experience with some approaches such as Age Friendly Cities, there was particular interest in approaches that target the social environment, while all the same recognizing the emerging emphasis in the literature on changing the built environment. Ten most common approaches including Healthy Cities/Healthy Communities, Smart Growth Planning, Child Friendly Cities, Safe Routes to Schools, Safe Communities, Active Living Communities, Livable Communities, Social Cities, Age-Friendly Cities, and Dementia Friendly Cities were selected for further examination. These were selected to be representative of healthy community approaches and reflect a balanced focus on the social and built environment in concert with the current understanding of determinants of health. The majority of these initiatives have global momentum that supports national efforts, are grounded in the mandate of a coordinating entity and employ multiple strategies (e.g., policies, services and structures) in various settings to achieve the objectives. There is considerable overlap in the goals and objectives with some initiatives nested within the priority areas of broader approaches. Table 1 describes the key elements of each approach. In this review each initiative has been presented independently although at the local level, these initiatives may be implemented synergistically, or as part of integrated efforts to improve health and wellbeing of communities.
There has been growing interest in the implementation of healthy community approaches with concomitant investment of public and private resources. One example is provided by the federal funding commitment of $612 million US dollars to support Safe Routes to School (SRTS) Programs in the United States [15,16]. The Robert Wood Johnson Foundation has also provided several grants in the sum of US$200,000 to support Active Living by Design (ALbD) projects [17]. With limited resources to support project implementation, it is important to determine which approaches have demonstrated benefits for whom and under what circumstances. Despite active research in some areas, evidence of effectiveness is still relatively scarce. Few reviews have explored selected approaches including SRTS and Safe Communities; however, note the absence of evidence of program impact on health outcomes [18,19]. The Cochrane systematic review of the effectiveness of WHO Safe Communities model excluded the few identified studies from the US because no injury outcomes were assessed [19]. To the best of our knowledge, this group of approaches have not previously been examined collectively nor with a specific geographical focus.
The purpose of this review was to evaluate the evidence for the effectiveness of the ten most common healthy community approaches on positive health outcomes in Canada and the United States. This bridges a gap in the literature about what is effective and informs future priorities for research to strengthen the evidence base. The heterogeneity of interventions, study designs and outcomes as well as the small number of studies identified precluded meta-analysis. A qualitative approach with narrative synthesis of the available evidence is presented.
Table 1. Description of healthy community approaches.
Healthy Community ApproachesTarget PopulationDescription
Healthy CitiesWhole populationsWorld Health Organization (WHO) initiative established in 1986 that seeks to protect health and support sustainable development. The basic features are community participation and empowerment, intersectoral collaboration, equity and action to address the social determinants of health [5].
Child Friendly CitiesChildrenLaunched in 1996, this global movement supported by United Nations Children’s Fund (UNICEF) promotes children’s rights to the highest quality of life. The nine elements include children’s participation in issues that involve them, child friendly legal framework, children’s rights strategy, child rights unit, child impact assessment, budget to support children’s activities, children’s national report, advocacy for children’s rights and children’s ombudsman or commissioner [6].
Smart Growth PlanningWhole populationsAn approach, first launched in 1995, to land use planning and development that supports health, economic growth and prioritizes conservation. The ten fundamental principles include: mixed land use, promoting compact building design, providing a range of housing options, fostering attractive communities with a strong sense of place, preservation of open spaces, development of existing communities, variety of transportation choices, encouraging fair and cost effective development and supporting community collaboration in development [7].
Safe Routes to SchoolChildren in school settingsThe US national program that uses multiple modalities including education, engineering improvements, enforcement and encouragement to increase student active travel [8]. Although activities occurred as early as 1997 in the US, the National Program Safe Routes to School Program was established by federal legislation in 2005.
Safe CommunitiesWhole populationsA global initiative supported by WHO that engages communities to promote safety and injury prevention. Multiple global networks have been established and provide accreditation to committed communities who satisfy the designated criteria [9]. The concept was introduced as a policy initiative in Sweden in 1989.
Active Living CommunitiesWhole populations in selected communitiesA movement that is dedicated to increasing opportunities for population physical activity. Some projects may include other components such as Safe Routes to School or Smart Growth [10]. Active Living by Design (ALbD) was at the forefront of the movement and was launched in 2002.
Livable CommunitiesWhole populationsLivable communities embody multiple factors that contribute to good quality of life such as recreational and educational opportunities, attractive built and natural environment, social stability and economic prosperity [11]. Programs have been implemented by various partners for more than 25 years.
Social CitiesWhole PopulationsA social city fosters social connectedness of its residents and improves the social architecture to strengthen these relationships [12]. The concept has been growing in popularity since 2009.
Age-Friendly CitiesElderly populationGlobal Initiative that promotes active aging of older residents and increases opportunities for their social participation and security. The movement builds on the 2002 Policy Framework for Active Aging and considers key domains of the social and physical environment that need to be optimized to enhance the quality of life of older persons. These include the outdoor spaces and buildings, transportation, housing, social participation, respect and social inclusion, civic participation and employment, communication and information, community support and health [13].
Dementia Friendly CitiesPersons living with dementia and their care giversThis initiative is supported by the Alzheimer’s Society and seeks to improve inclusion and quality of life of people living with dementia [14]. It has been gaining momentum especially in the United Kingdom since 2012.

2. Methods

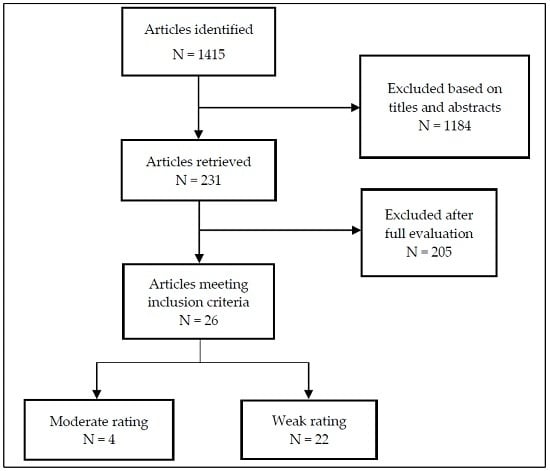
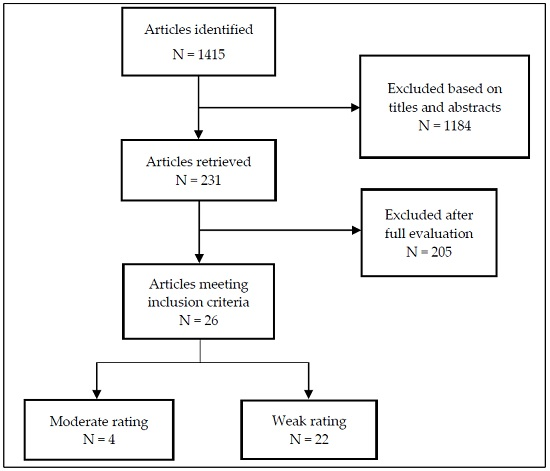
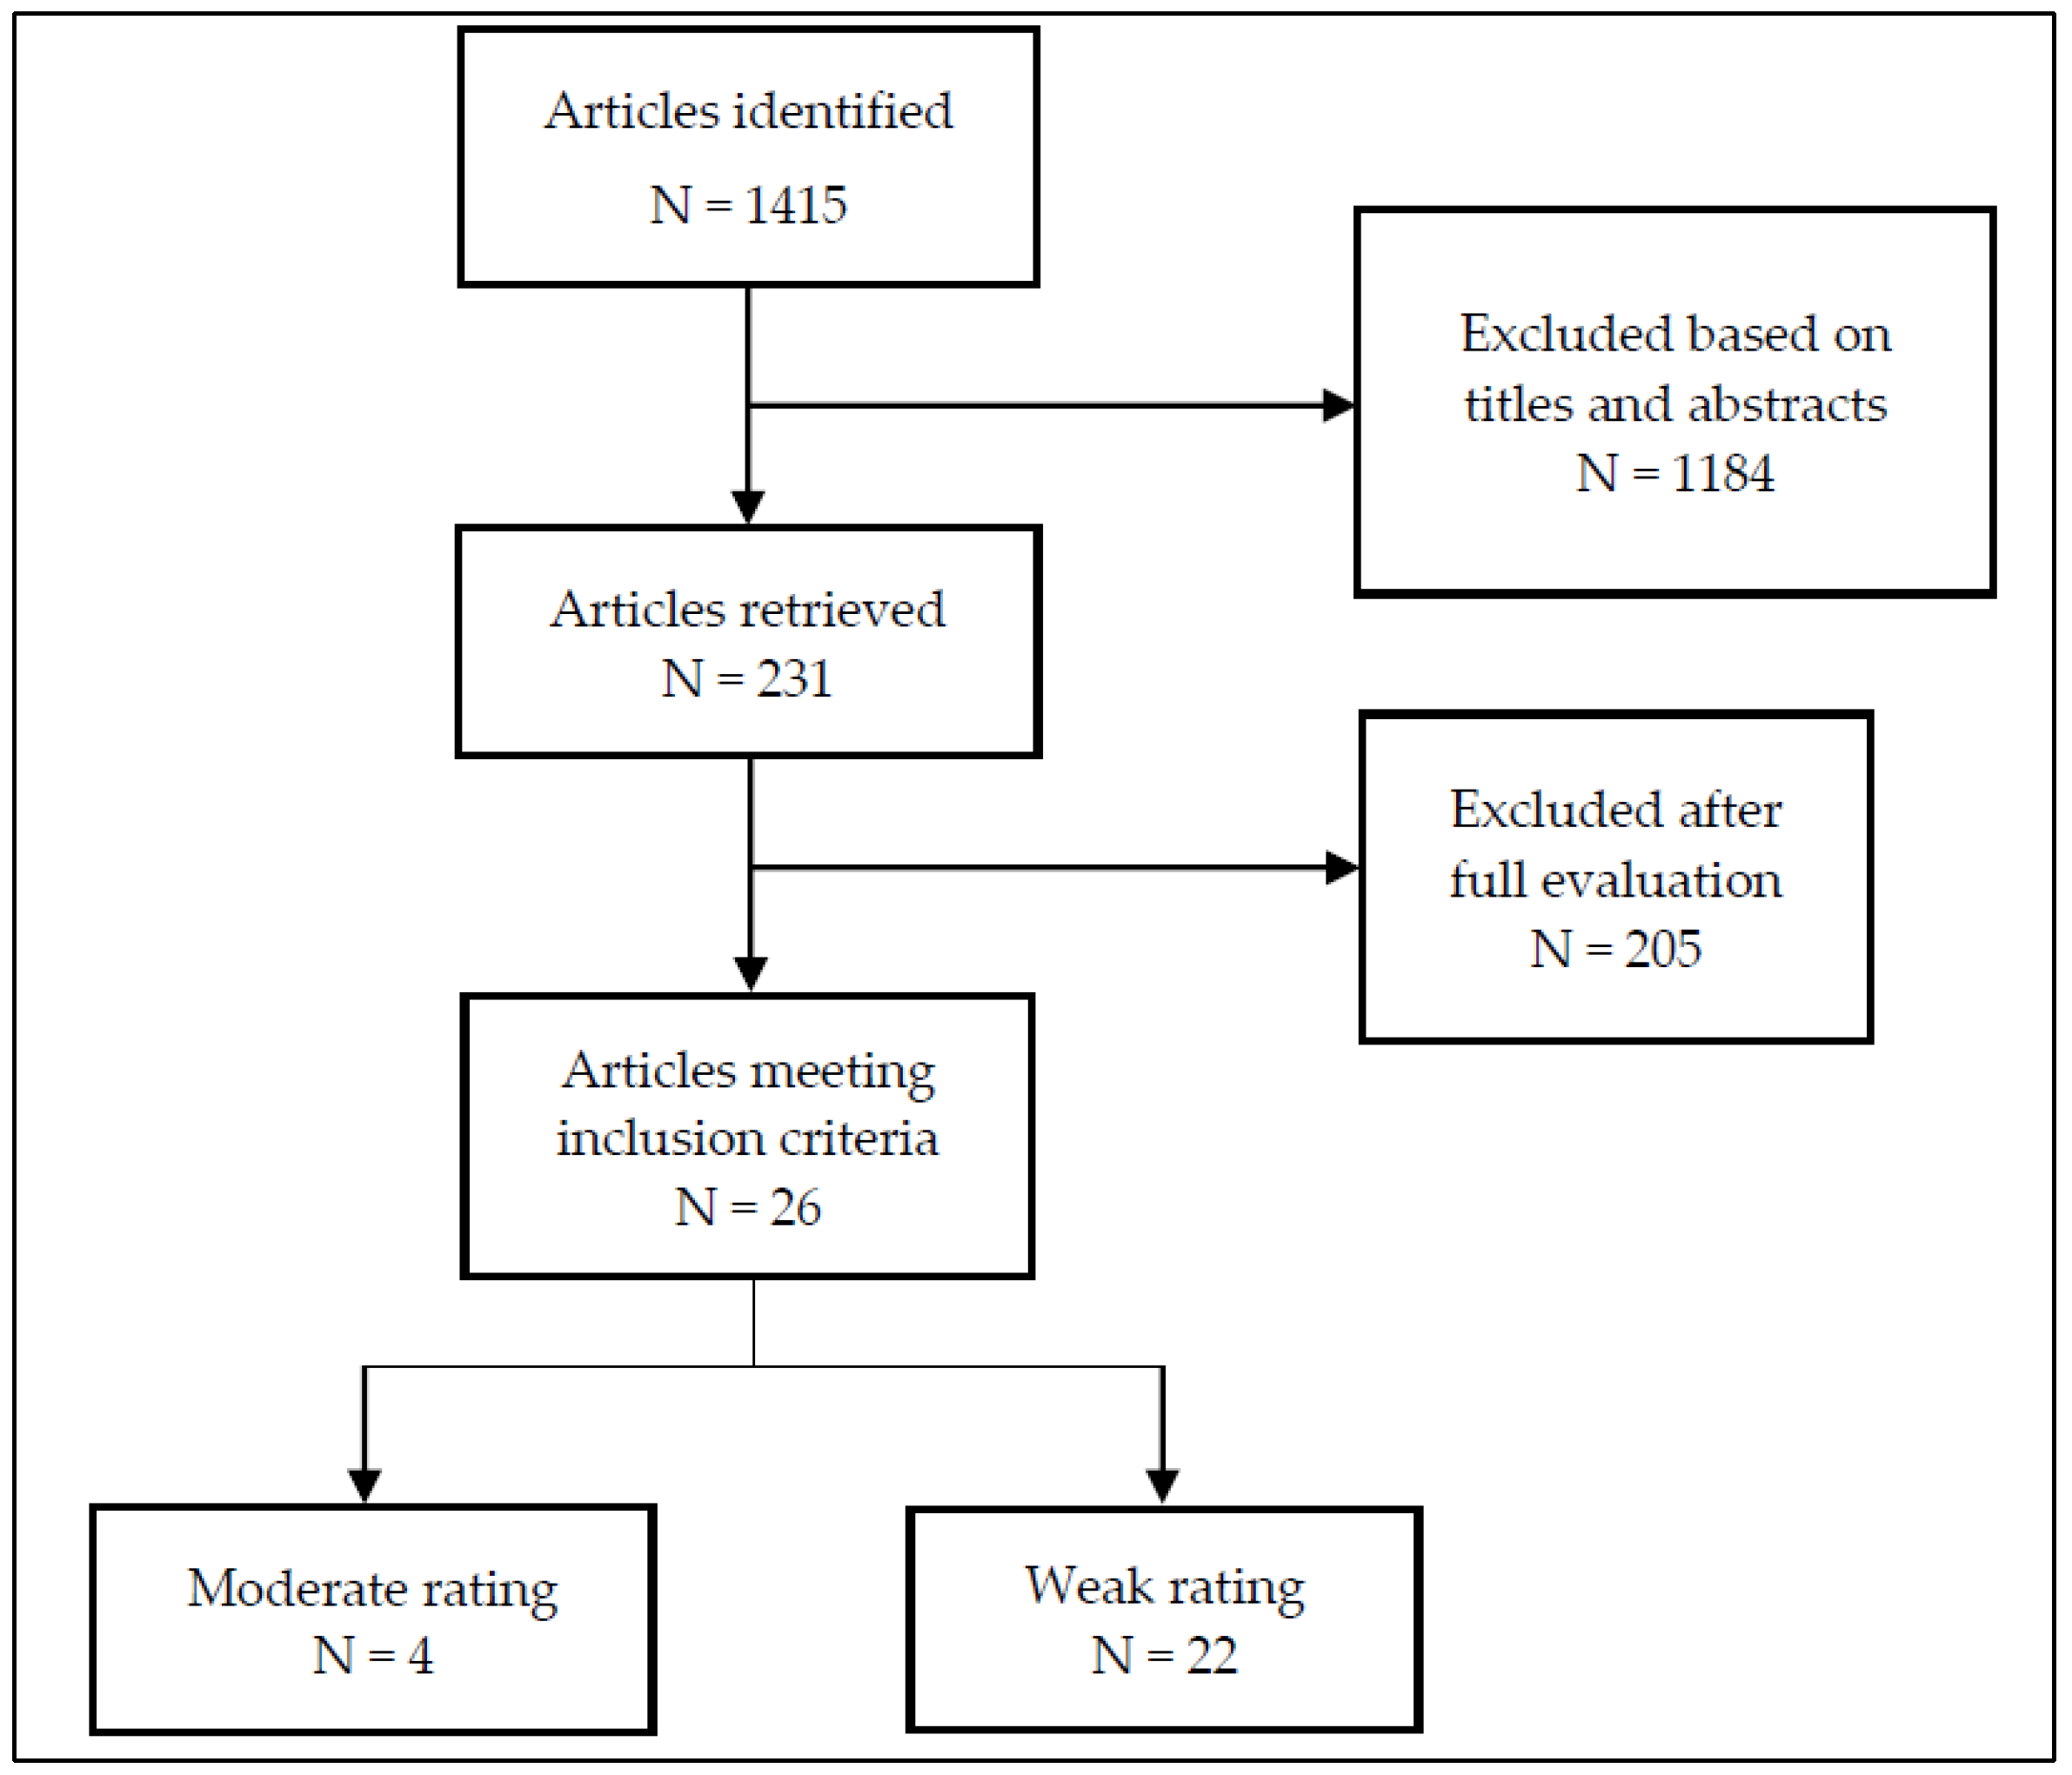
2.1. Data Sources and Search Strategy

The studies included in this review were identified through a systematic search of the academic and grey literature. Peer reviewed publications were searched in selected electronic databases including PubMed, Medline, Cumulative Index to Nursing and Allied Health Literature (CINAHL), Scopus and the Cochrane Library. The reference lists of all included papers were examined for additional articles not discovered through the primary search.
Google Scholar was used to search the web based literature to identify additional articles of relevance such as dissertations, reports, conference presentations and abstracts. A search of the grey literature focused on initiative specific websites (e.g., Child Friendly Cities, Safe Communities Canada, Active and Safe Routes to School) and websites of agencies coordinating the respective approaches (e.g., UNICEF, World Health Organization). Other relevant resources consulted included the Best Practices Portal, Centers for Disease Control (CDC) Community Interventions Evidence Database, the National Transportation Library (NTL), the McMaster University’s General Database of Public Health Interventions and the Effective Public Health Practice Policy Portal.
Three domains of search terms were identified: effectiveness, ‘healthy community approaches’ and country/geographical region. Specific terms used for the search were derived from the subject headings in MeSH list, free text and review studies related to the selected approaches. Search strategies were tailored for each approach and adapted for different databases. An example of the search strategy used for Safe Routes to School approach is shown in Appendix. Searches were limited to papers published in the English language during the period January 2000 to December 2014. A diverse range of studies with both experimental and observational study designs were included. This allowed for consideration of evidence from interventions that could not be randomized for practical or ethical reasons. Systematic reviews were excluded as empirical research was thought to offer the best available quality of evidence.

2.2. Selection and Review Process

Studies were screened initially using titles and abstracts. All articles that were potentially relevant were subjected to a detailed assessment. Studies selected were required to meet the following inclusion criteria: (1) explicitly reference an intervention based on one of the ten healthy community approaches; (2) measure at least one health outcome (morbidity, mortality or intermediary outcomes); and (3) conducted in North America (limited to Canada and United States). The following exclusion criteria were applied to the search results: (1) the article was an opinion, editorial, audit or review; (2) it included only a description of an approach but no assessment of its impact on health outcomes; and (3) employed only qualitative methods. Any disagreements about inclusion of studies were resolved through consensus of the authors. Relevant data was extracted from the articles including descriptive information; indicators of quality and measures of effectiveness. The quality of the evidence was assessed using the Effective Public Health Practice Project (EPHPP) Quality Assessment Tool for quantitative studies. The tool and accompanying dictionary are available at http://www.ephpp.ca [20]. The EPHPP examines six methodological dimensions: selection bias, study design, confounders, blinding, data collection methods, withdrawals and dropouts. A rating of strong, moderate or weak was assigned for each of the study components and then a global rating was calculated.

3. Results and Discussion

The search identified 1415 potential articles among the various sources. From these papers, 231 were assessed for eligibility based on full text review. Twenty six articles were selected and subsequently underwent quality assessment. There were no studies that received a methodologically strong rating, four were of moderate quality and 22 were assessed as weak. The main reasons for weak ratings included selection bias, failure to control for confounding and high attrition. A flow diagram of the search results is illustrated in Figure 1.
Figure 1. Summary of search and selection process for identification of relevant studies.
Socsci 05 00003 g001

3.1. Safe Routes to School

The majority of studies identified were related to evaluation of Safe Routes to School Programs (SRTS) in the United States (Table 2). In terms of study quality assessed using the EPHPP tool, most studies were assessed as weak based on methodological limitations. Two studies that examined the impact of Walking School Bus (WSB) interventions received moderate ratings. The earlier of the two studies assessed the short and long term effects on student travel in a low income minority population [21]. Another pilot study by Mendoza and colleagues employed a cluster randomized controlled trial to investigate the impact of a five week WSB intervention on rates of active commuting and physical activity levels [22]. Most studies employed multifaceted interventions that included education, traffic enforcement and engineering improvements however a few studies utilized only one strategy (commonly walking school bus) to influence active modes of school transportation [21,22,23,24,25,26,27,28,29,30,31,32,33,34]. Consistent with the goal of increasing rates of children’s active transportation to and from school, most studies focused on reporting intermediary outcomes such as travel behavior and attitudes. Only two studies also incorporated objective measures of physical activity to corroborate the results [21,34].
While the overwhelming emphasis of study outcomes focused on rates of active travel, five articles attempted to estimate the safety benefits that accrue from SRTS programs [35,36,37,38,39]. Di Maggio and Li found that annual rates of pedestrian injuries in children aged 5–19 years decreased in census tracts with SRTS improvements when compared to those census tracts without projects [35]. Two other studies reported a change in the number of collisions involving school aged children over baseline for intervention and control/comparison sites [36,37]. However, neither study could conclusively confirm the safety effects of Safe Routes to School Programs because of limitations inherent in the study design and lack of data on other correlates of collisions that may offer alternative explanations for the results. Another recent study by Ragland et al. also found a significant reduction in collisions involving pedestrians of all ages within 250 feet of countermeasure buffer zones [38]. Although a decrease in collisions also occurred among pedestrians aged 5 to 18 years, it was not statistically significant.
Table 2. Summary of Quality Assessment of Studies using Effective Public Health Practice Project Tool (EPHPP).
Author/DateSelection biasStudy designConfoundersBlindingData collection methodsWithdrawals/drop outsGlobal rating
Safe Routes to School
Mendoza et al., 2009 [21]ModerateModerateWeakN/AStrongModerateModerate
Mendoza et al., 2011 [22]WeakModerateWeakModerateStrongWeakWeak
Boarnet et al., 2005 [23]WeakWeakWeakModerateWeakModerateWeak
Cooper et al., 2010 [24]WeakModerateWeakModerateStrongWeakWeak
Buliung et al., 2011 [25]WeakWeakWeakModerateWeakWeakWeak
Mammen et al., 2014 [26]WeakModerateModerateN/AStrongWeakWeak
Henderson et al.2013 [27]WeakModerateWeakModerateWeakWeakWeak
McDonald et al., 2013 [28]WeakModerateModerateModerateStrongWeakWeak
McDonald et al., 2014 [29]WeakWeakStrongModerateStrongModerateWeak
McDonald et al., 2013 [28]WeakModerateModerateModerateStrongWeakWeak
Moudon et al., 2012 [30]WeakWeakModerateN/AWeakStrongWeak
Staunton et al., 2003 [31]WeakWeakWeakN/AModerateWeakWeak
Buckley et al., 2013 [32]WeakModerateWeakModerateWeakWeakWeak
Johnson et al., 2006 [33]WeakModerateWeakWeakModerateWeakWeak
Sayers et al., 2012 [34]WeakWeakStrongWeakModerateWeakWeak
Di Maggio et al., 2013 [35]ModerateModerateWeakModerateModerateModerateModerate
Blomberg et al.,2008 [36]ModerateWeakWeakModerateWeakModerateWeak
Orenstein et al., 2007 [37]ModerateWeakWeakN/AWeakModerateWeak
Ragland et al., 2014 [38]WeakWeakWeakModerateStrongWeakWeak
Mendoza et al., 2012 [39]WeakStrongModerateModerateStrongWeakWeak
Active living communities
Chomitz et al., 2012 [40]ModerateModerateStrongWeakStrongModerateModerate
TenBrink et al., 2009 [41]WeakWeakWeakWeakWeakWeakWeak
Sayers et al., 2012 [42]WeakWeakWeakWeakModerateModerateWeak
Safe communities
Istre et al., 2011 [43]WeakModerateWeakWeakWeakModerateWeak
Smart growth planning
Dunton et al., 2011 [44]WeakModerateWeakModerateModerateStrongWeak
Age-friendly cities
Lehning et al., 2012 [45]StrongWeakStrongWeakStrongModerateWeak
Menec and Nowicki, 2014 [46]WeakWeakStrongWeakModerateModerateWeak
Mendoza and colleagues also assessed the impact of a brief WSB intervention on pedestrian safety behaviors [39]. They found that children at intervention schools were more likely to cross at the corner or crosswalk at intersections (OR = 5.01, 95% CI 2.79–8.99) although fewer children stopped at the curb compared to children in control schools (OR = 0.21, 95% CI 0.15–0.31). Although a randomized control trial, the brief duration of the intervention limits conclusions about sustainability of behavior change. Additionally, observations were made of all children at intersections whether or not they were study participants. This would tend to underestimate any effects. Future studies that gather longitudinal data on WSB study participants would be more useful to confirm these results.
In Canada, School Travel Planning (STP) is the vehicle to promote Active Safe Routes to Schools Programs (ASRTS) by engaging stakeholders to develop and implement action plans that are sustainable at the local level. There were two studies that explored the effect of STP interventions on student active school travel [25,26]. Buliung and colleagues conducted the first pilot study of twelve schools across four Canadian provinces [25]. Over a two year period, the proportion of children (grades K—8) who used active modes of transportation for their daily school commute was monitored. There was a slight increase in the percentage of children who use active modes of travel from 43.8% at baseline to 45.9% at follow up. Parental attitudes were also more supportive of active modes of transportation in pilot schools.
A larger study consisting of 106 public elementary schools was implemented in 2010 across nine Canadian provinces [26]. Data was only available for 53 schools. There was no significant increase in active school travel after a year. In multivariable models, only season of data collection predicted a decrease in active travel in the morning. More research is needed to confirm the efficacy of STP interventions. Variation in mode change was noted between schools which suggests that other contextual factors may be important for success. Furthermore, a year may not have been adequate to demonstrate benefits of the intervention given the varied needs and heterogeneity of interventions.
There is a growing body of literature about the impact of Safe Routes to School (SRTS) programs fueled by the need to evaluate SRTS projects that received US federal funding through the Safe Accountable Flexible Efficient Transportation Equity Act: A Legacy for Users (SAFETEA-LU), often for infrastructural projects. The available evidence to support an effect of Safe Routes to School Programs on rates of active commute shows a consistent positive association although the strength of impact is generally weak. There is less evidence to support safety benefits of programs although studies suggest a reduction in morbidity from injuries. Only a few studies employ robust designs that address common threats to internal validity such as selection bias, include objective measures of health outcomes and adjust for potential confounding factors in multivariable analyses. Longer duration of follow up is also needed to demonstrate the sustainability of efforts. Future studies must address these limitations in order to strengthen the evidence base related to effectiveness of these interventions.
Among other healthy community approaches included in this review, there was a paucity of evidence to support a positive impact on health outcomes. There were relatively few studies identified with three studies related to Active Living Communities [40,41,42]; one each for Safe communities [43] and Smart growth [44] and two related to Age Friendly Cities [45,46]. While various study designs were employed, none were randomized controlled trials. The assessment of methodological quality also revealed low ratings as a result of selection bias, less rigorous study designs and analytic methods. The characteristics of various studies are reported in narrative format in Table 3 where information is provided about study design, interventions and outcomes.
Table 3. Summary of evidence for effectiveness of interventions.
StudyOutcomes
Safe Routes to School
Mendoza et al., 2009 [21]
  • Study design: Quasi-experimental design (pre-post intervention with control group)
  • Sample: 653 (baseline) 643 (follow up)
  • Study population: Ethnically diverse children (ages 5–11 years) attending three elementary public schools in Seattle.
  • Approach: This study evaluates the impact of a Walking School Bus intervention in 3 urban Seattle public schools on patterns of active travel.
 
The proportion of children who walked to intervention (20% ± 2%) and control schools (15% ± 2%) was similar at baseline. At 12 month follow up, a higher proportion of children walked to intervention schools (25% ± 2%) compared to control schools (7% ± 1%, p = 0.001).
Mendoza et al., 2011 [22]
  • Study design: Cluster randomized controlled trial.
  • Sample: 149 children
  • Study population: 4th graders in 8 schools in Houston, Texas.
  • Approach: This pilot study examined the impact of a walking school bus intervention on children’s physical activity levels and rates of active school travel
 
Weekly percent active commuting increased in the intervention group, while a decrease was observed in the control group (p < 0.0001).
Acculturation and parent outcome expectations were associated with a change in percent active commuting.
In multivariable models predicting minutes of moderate to vigorous physical activity, children in the intervention group increased their minutes while a decline was observed in the participants in the control group (p = 0.029).
Boarnet et al., 2005 [23]
  • Study design: Cross sectional design
  • Sample size: 1244 parental surveys
  • Study population: Children in 3rd to 5th grades of 10 elementary schools.
  • Approach: The study evaluated the effect of California SRTS engineering and infrastructure improvement projects on children’s active school commuting patterns in 10 elementary schools.
 
Among children who passed the project on the way to school, a greater proportion (15.4%) walked or bicycled more after the construction projects when compared to children who did not (4.3%) encounter the projects on the way to school (p < 0.01).
Cooper et al., 2010 [24]
  • Study design: Quasi-experimental design (pre-post intervention )
  • Sample size: 846 (baseline), 470 (follow up)
  • Study population: Children in 10 elementary schools in low income communities across United States.
  • Approach: The study evaluated the impact of SRTS programs delivered by coordinators on students’ active travel commute patterns.
 
Parental surveys reported modest increases in children walking to (29%) and from (26%) school over baseline. However student tallies showed marked variation with smaller increases (1 to 5%) in schools with paid coordinators and only one of the other six schools showed a clear increase (7% to 14%) in walking. In general, schools with paid coordinators had 50% more students walking in the morning and 45% in the afternoon than schools with volunteers.
Buliung et al., 2011 [25]
  • Study design: Quasi-experimental design (pre-post intervention without control group)
  • Sample: 1489 parental surveys
  • Study population: parents of children in 12 elementary schools spread across 4 Canadian provinces.
  • Approach: The pilot study assessed the efficacy of school travel planning as an approach to facilitate active travel among students.
 
Small increases occurred in rates of active transportation from 43.5% (baseline) to 45.9% (follow up).
Higher rates (43.5%) of active travel occurred at afternoons compared to mornings (37.3%).
Among household respondents, 13.3% indicated that the intervention “resulted in less driving”.
Mammen et al., 2014 [26]
  • Study design: Quasi-experimental design (pre-post intervention without control group)
  • Sample: 53 schools across Canada
  • Study population: Children (grades K—8) in participating elementary schools
  • Approach: The study examined the effectiveness of STP in Canada on students’ rates of active travel and identified predictors of mode change.
 
There was no increase over baseline in rates of active travel either in morning or afternoon after one year. Marked variation occurred in AST at the school level. The season of data collection predicted a decrease in AST in the morning (p < 0.05).
Henderson et al., 2013 [27]
  • Study design: Quasi-experimental design (pre-post intervention without control group)
  • Sample: 658 students
  • Study population: children and their parents from one elementary school in Atlanta.
  • Approach: The study assessed the impact of a multifaceted SRTS program in an elementary school in Atlanta over 2008-2010.
 
There was an increase in the rates of walking to school in the morning (p < 0.0001) during the intervention period however no significant change was observed for the afternoon commute. Parental perception about school support for active modes of transport and the health benefits (0.01 < p < 0.001) and enjoyment associated with active modes of transportation (p < 0.0001) also improved.
McDonald et al., 2013 [28]
  • Study design: Quasi-experimental design (pre-post intervention with control groups).
  • Sample: 1000–2300 students each year.
  • Study population: Children (K-8) attending 9 intervention and 5 comparison schools in the 4J school district of Oregon.
  • Approach: The study evaluated the impact of a SRTS program on walking and biking to school in Eugene, Oregon.
 
Regression models were used to estimate the marginal effects associated with walking or biking to school among the study population.
Schools with more types of interventions had larger proportions of students who walked or biked to school. Programs that delivered education and encouragement components in addition to two other SRTS interventions were associated with a 20 percentage point increase in walking and a small but non-significant increase in biking.
Infrastructure improvement interventions had borderline significance which might have been related to late completion of these components in the program cycle. Provision of covered bike parking was associated with large increases in walking (19 percentage points) and biking (11 percentage points). The Boltage intervention produced small increases in walking (5 percentage points) and biking (4 percentage points).
McDonald et al., 2014 [29]
  • Study design: Cross sectional design
  • Sample: School travel and program data analyzed from 801 schools in four US States
  • Study population: School travel mode data for the period 2007–2012 from schools in 4 US states
  • Approach: The study assessed the impact of SRTS programs on students’ active travel by comparing schools with and without SRTS programs
 
Fractional logit models were used to estimate the marginal effects of the presence and number of years of SRTS interventions on walking and bicycling.
Rates of active travel increased with each year of participation in SRTS programs. After five years, there was an absolute increase of 13 percentage points in the proportion of children who walked or biked.
In multivariable models after adjustment for school and environmental characteristics, walking and bicycling rose by 1.1 percentage points for each year of participation in SRTS programs.
The presence of an engineering component was associated with 3.3 percentage point increase in walking and bicycling. This was unrelated to the length of time that the improvement was in place.
Smaller increases (0.9 percentage points) were associated with education and encouragement interventions.
Moudon et al., 2012 [30]
  • Study design: Cross sectional design
  • Sample: Active travel data was available for 48 of the 569 SRTS projects.
  • Study population: The study utilized secondary data obtained pre and post implementation of SRTS projects to estimate the impact on student travel patterns.
  • Approach: This study assessed the impact of SRTS programs on children’s active school travel in five US states.
 
There was a statistically significant increase in rates of active transport for all modes of transport in all states except for biking in Florida.
Rates of walking increased more than cycling. Changes in rates of active transport were not correlated with any project, school or neighborhood characteristics.
Staunton et al., 2003 [31]
  • Study design: Quasi-experimental design (pre-post intervention without control group)
  • Sample: 13 schools (6 in year 1 and 7 in year 2)
  • Study population: children in 15 elementary schools in Marin County, California
  • Approach: The study examined the impact of SRTS program on active travel of children to and from school.
 
There were marked increases in walking (64%), biking (114%) and carpooling (39% decrease in children arriving by car) over the two year period.
Buckley et al. 2013 [32]
  • Study design: Quasi-experimental design (with pre, during and post event assessments with control group)
  • Sample: 475 students for fall event and 238 students for spring event.
  • Study population: Children and parents partiicpanting in designated ‘Walk t oSchool Day events at two elementary schools in Moscow, Idaho
  • Approach: The study examined the impact of two Walk to School Day events on active school travel patterns in children at two elementary schools
The number of children who walked to school increased by 25% (19%–26%). During the same period, there was a decrease in the proportion of children walking to school at comparison sites. Direct observations of children at school crossings showed small improvements in street crossing safety over baseline however key desirable behaviors were present in less than 50% of all observed crossings.
Johnson et al., 2006 [33]
  • Study design: Quasi-experimental design (pre-post intervention with control group)
  • Sample: 695 (baseline) 782 (follow up)
  • Study population: Children attending three elementary public schools in Seattle.
  • Approach: This study evaluates the impact of a Walking School Bus intervention in an inner city Seattle public schools on patterns of active travel.
 
The number of children who walked to school increased by 25% (19%–26%). During the same period, there was a decrease in the proportion of children walking to school at comparison sites. Direct observations of children at school crossings showed small improvements in street crossing safety over baseline however key desirable behaviors were present in less than 50% of all observed crossings.
Sayers et al., 2012 [34]
  • Study design: Cross sectional design.
  • Sample: 77 (38 intervention, 39 comparison)
  • Study population: Children at three elementary schools.
  • Approach: The study examined the effect of a walking school bus intervention on physical activity in three elementary schools in Missouri.
 
There was no difference between the groups in physical activity levels (p = 0.17). The percentage of time spent in moderate to vigorous physical activity (MVPA) during the study was 38 (20.9 ± 6.9) for WSB participants and 39 (23.4 ± 8) in comparison group. In multivariable models, age was negatively associated with percentage of time spent in moderate to vigorous physical activity (r = −0.79, p < 0.001).
Di Maggio and Li 2013 [35]
  • Study design: Time series analysis.
  • Sample: Authors compared age specific rates of pedestrian injuries in census tracts with and without SRTS interventions.
  • Study population: Study used crash data from the Department of Transportation from 2001–2010 and data related to the location of planned SRTS projects.
  • Approach: The study examined the impact of Safe Routes to School (SRTS) interventions on morbidity resulting from pedestrian injury in school aged children in New York City.
 
Annual pedestrian injuries declined over time however the most pronounced reduction (33% 95% CI 30–36) was observed among school aged children (5–19 years) compared to 14% (95% CI 12–16) among other age groups.
Pedestrian injury rates among school aged children in census tracts with SRTS interventions decreased between the pre-intervention and post intervention periods as well as during school travel hours (8 to 4.4 injuries per 10,000 persons). These observations were not apparent in census tracts without SRTS interventions.
Blomberg et al. 2008 [36]
  • Study design: Time series analysis based on secondary data
  • Sample: SRTS data for 130 legacy programs,state crash data from 1996 to current year
  • Study population:
  • Approach: To examine the safety effects of implementing legacy SRTS programs in three states with the largest number of SRTS programs
 
There was a general decline in pedestrian and bicycling collison sover time.
Marked reductions occurred for children 4 to 12 yeats served by SRTS focus sites when compared to state wide collisons, although the differences were not statistically significant.
Orenstein et al., 2007 [37]
  • Study design: Time series analysis using secondary data.
  • Sample: 125 SRTS programs and collision data from 1998–2005.
  • Study population: The analysis was based on national data for injuries and fatalities that resulted from collisions and SRTS project data.
  • Approach: This study was commissioned to assess the safety impact of SRTS programs in California.
 
The authors compared the change in injuries involving school aged children (5 to 18 years) pre and post SRTS construction projects for intervention and control sites in California.
There was a general decline in the number of injuries between 1998 and 2005 with a similar percentage reduction in the annual number of injuries for both SRTS (13%) and non SRTS sites (15%). However when the changes in mobility patterns were accounted for, it was estimated that safety benefits ranged from no net change to a decrease of 49% in collisions among students at SRTS sites.
Ragland et al., 2014 [38]
  • Study design: Cross sectional design
  • Sample: 47 schools, mobility analysis from 1999 parental surveys received from 8 schools.
  • Study population: Schools in California that had implemented SRTS infrastructural improvements.
  • Approach: The study assessed the long term impact of SRTS funded infrastructural improvements on safety and walking and bicycling to school.
 
In pedestrians ages 8 to 18 years there was a 50% reduction in collisions in the treatment area (within 250 feet of the countermeasure buffer zones). Although effect not statistically significant.
Among pedestrians of all ages, there was a statistically significant 75% reduction of collisions in the treated areas compared to control areas.
In the mobility analysis, living within 250 feet of the SRTS project improvement was associated with an increased probability of walking to school.
Mendoza et al., 2012 [39]
  • Study design: Cluster randomized controlled trial (4 intervention, 4 control schools)
  • Sample: 1252 (pre) 2548 (post) pedestrian observations at intersections.
  • Study population: 4th grade elementary school children in 8 schools in Houston school district.
  • Approach: The study assessed the impact of WSB intervention on child pedestrian safety behaviors at street intersections.
 
Compared to children at control schools, children at intervention schools has five times higher odds of crossing at crosswalk or corner (95% CI 2.79–8.99, p < 0.01) however also had five fold lower odds of stopping at the curb 95% CI 0.15–0.31, p < 0.01).
Parent perception of neighborhood safety and number of traffic lanes were not associated with pedestrian safety outcomes in mixed models (p > 0.05).
Active Living Communities
Chomitz et al., 2012 [40]
  • Study design: Quasi-experimental design (pre-post intervention with control group)
  • Sample: intervention city—1081 (pre) and 644 (post); comparison city—608 (post)
  • Study population: Non-institutionalized adults over 18 years, children in targeted middle and high schools.
  • Approach: The study assessed the effectiveness of an Active Living by Design project in Somerville Massachusetts on physical activity levels
 
Adults in the intervention city were more likely than those in the comparison city to report meeting recommended physical activity guidelines (OR = 1.10, 95% CI 1.04–1.17). No differences were found in meeting the recommended physical activity guidelines among of children in both cities in adjusted analyses [middle school OR 1.06 (95% CI 0.78–1.45); high school OR 1.24 95% CI 0.98–1.58).
TenBrink et al., 2009 [41]
  • Study design: Quasi-experimental design (pre-post without control group)
  • Sample: An annual transportation survey conducted in 15 locations over a one week period provided data on pedestrian and cycling patters. Walking audits and employee surveys were used in the work place initiative.
  • Study population: Children in targeted schools, general population.
  • Approach: The study assessed the effects on travel behavior of an Active Living by Design project in Michigan.
 
The number of students who walked to school (5%–15% increase) and participation in sentinel events such as Walk to School Day and Smart Commute Day increased during the project. Participation in Smart Commute Day increased from 165 (2004) to 520 persons (2008). Walk to school day participants increased from 600 in 2003 to 1200 in 2008.
Sayers et al., 2012 [42]
  • Study design: Time series analysis
  • Sample: Quarterly assessments on five consecutive days at designated intersections each year of project.
  • Study population: Data based on seasonal direct observations of pedestrians and cyclists at four key intersections in Columbia.
  • Approach: The study examined the effects of a multifaceted intervention on rates of active travel in the community over a three year period.
 
Pedestrian and cyclists counts increased from 2007 to 2009 particularly in the latter part (July and October) of 2009. Repeated measures ANOVA showed a statistically significant effect of year (p = 0.01), season (p < 0.001) and interaction of year and season (p = 0.05).
Survey data indicated increased awareness of ALbD programming through media and advertisements in 2008 compared to 2003 (63% of respondents, N = 813).
Safe Communities
Istre et al., 2011 [43]
  • Study design: Quasi-experimental design (pre-post intervention with control group)
  • Sample: 9483 observations (5743 observations among children in the target communities).
  • Study Population: Data based on pre and post assessments of restraint use in motor vehicles at 34 sites in target and comparison communities.
  • Approach: The study sought to measure the effect of a WHO Safe community model approach on the use of child restraints among children 0–8 years in motor vehicles in Texas
 
In multivariable analyses, child restraint use (OR = 1.6 95% CI 1.2–2.2), drivers who were wearing a seatbelt (OR = 2.2 95% CI 1.5–3.2) and children riding in the back seat (OR = 1.3 95% CI 1.0–1.6) increased significantly over baseline for target communities compared to communities that did not receive the intervention.
Smart Growth Planning
Dunton et al., 2012 [44]
  • Study design: Quasi-experimental study (pre-post intervention with control group).
  • Sample: 94 (48 intervention, 46 control) children
  • Study population: Children (9–13 years) who recently moved to smart growth community or who lived in neighboring community
  • Approach: This study explored the effect of smart growth communities on children’s physical activity levels and whether the physical activity context differed over time compared to children in non-smart growth communities.
 
Children in smart growth communities engaged in a greater proportion of physical activity bouts a few blocks from home (p < 0.001) and travelled more by walking (p < 0.011) than children in control communities.
Over time, social context of physical activity did not change for either group however children in smart growth communities were more likely to report decreased physical activity indoors and an increase in outdoor locations with no traffic (p = 0.036).
There was a greater increase in six month daily moderate to vigorous physical activity among children in intervention communities however it was not statistically significant (p = 0.10).
Age-Friendly Cities
Lehning et al., 2012 [45]
  • Study design: Cross sectional design
  • Sample: 1386 persons
  • Study population: Non-institutionalized persons aged 60 years or older who resided in Detroit.
  • Approach: This study assessed the relationship between age-friendly environments and self-rated health among a sample of older adults in Detroit, Michigan.
 
In adjusted multivariable analyses, significant predictors of better self-rated health included access to health care (p < 0.01), social support (p < 0.01) and community engagement (p < 0.01) while neighborhood problems were associated with poorer self-rated health (p < 0.01).
Addition of age-friendly environment characteristics weakened the association between self-rated health and three health measures (two functional limitations and chronic conditions) although still significant p < 0.001). Education and income variables were no longer significant when age-friendly characteristics were included in the model.
Menec and Nowicki, 2014 [46]
  • Study design: Cross sectional design
  • Sample: 593 individuals who completed an age-friendly survey.
  • Study population: Data were analyzed from a subset of 29 communities that completed a needs assessment as part of the Manitoba Age Friendly Initiative.
  • Approach: This study assessed the relationship between age-friendly characteristics of communities and residents’ life satisfaction and self-perceived health in rural Manitoba
 
Higher Age-Friendly ratings were associated with greater life satisfaction (p < 0.0001) and self-perceived health (<0.01).
In multivariable analyses among seniors, the Age-Friendly Index as well as five of the seven domains was associated with life satisfaction. Community support and health services were not associated with any health outcomes.
Self-perceived health was associated with fewer age-friendly domains including physical environment, housing, social environment and transportation options. These results differed for younger respondents as age friendliness was not associated with self-perceived health and life satisfaction was only associated with health services/community support and opportunities for participation (p < 0.05).

3.2. Active Living Communities

Active Living Communities increase the opportunities for physical activity through the creation of supportive policies and infrastructure that foster active modes of commuting [47]. References to “active living” are common in the literature however a formal, universal definition is difficult to find. The most organized efforts to create a shared vision and operationalize the active community living concept have come from the Robert Wood Johnson Foundation in the United States. In 2003, the Robert Wood Johnson Foundation approved 25 grants to US communities to implement Active Living by Design (ALbD) Projects. These five year grants supported projects to promote physical activity by employing a Community Action Model with five components namely preparation, promotion, programs, policy influences and physical projects. Using this approach, communities assess their needs and devise unique solutions to transform local environments to foster opportunities for increased physical activity [17].
The ALbD Project evaluations in Massachusetts [40], Michigan [41] and Missouri [42] reported an increase in the number of persons using active modes of transportation over the study period; however, methodological limitations in these studies limit causal attribution of any effects solely to the project’s influence. Project reports emphasize the changing community dynamics, rich partnerships and community empowerment that occur with project implementation as key achievements over health outcomes. More research is needed that focuses on measuring the effect of interventions on health outcomes in order to justify future investments in Active Living Initiatives.

3.3. Age-Friendly Cities

The review identified several narrative accounts of process evaluations of Age-Friendly Initiatives [48,49,50,51]. Despite this finding, there is a gap in knowledge about the holistic impact of Age-Friendly Initiatives on outcomes in the lives of older persons. The disparate results of the two studies suggest that further empirical evidence is needed that employs standardized definitions of age-friendly environments across diverse settings and health outcomes [45,46].
Cognizant of the need to update the monitoring and evaluation framework for the Age-Friendly Initiative to capture process as well as outcomes, the World Health Organization began work in 2012 to develop core indicators that would meet these expectations [52]. The proposed core indicators will retain the emphasis on tracking the progress towards the achievement of age-friendly environments however will include a few distal long term outcomes that reflect improved health and quality of life of older persons. This will pave the way for future project impact evaluations that report health outcomes.

3.4. Safe Communities

Safe Communities is an approach to injury prevention and safety promotion that embraces interventions at the community level [53]. The initiative advocates for multisectoral cooperation to devise local solutions to community safety concerns. Communities that satisfy established benchmark criteria receive the safe community designation. Evaluation frameworks emphasize the achievement of milestones in the planning process such as establishment of coordination structures, community assessment, plan development and mobilization of funding [54]. While discrete health outcomes may be measured (e.g., road traffic accidents, child mortality from unintentional injuries) in specific projects, the commitment is often to the process and creation of supportive environments that foster change in determinants
There are few studies of outcome evaluations of interventions in Western developed settings. The review identified only one study in Texas that examined the effect of a community based intervention on the use of child restraints in motorized transport [43]. The authors found that the intervention positively influenced safety behaviors such as the use of child restraints, drivers using seat belts and children riding in the back seat. Johnson has argued that while the study outcomes are likely the direct result of the intervention’s efforts, any links to the ‘safe community’ designation are at best tenuous. He recommends that future studies should explore the interaction between safe community designation and injury prevention programs and define success not only by outcomes but also process dynamics such as reach, sustainability of efforts and pathways of change [55].

3.5. Smart Growth Planning

Smart Growth (or Smart Growth Planning) is a philosophy that strategically directs urban development activities in order to promote environmental sustainability, economic revitalization and sense of community. While there is a burgeoning body of research that links urban form, physical activity and obesity the evidence linking Smart Growth and improved health outcomes is still emerging [56,57]. Only one article was identified that sought to explicitly connect Smart Growth Planning with physical activity [44]. The authors did not find a statistically significant increase in moderate to vigorous physical activity among children in smart growth communities compared to control communities. These results may be explained by a number of study limitations including small sample size, measurement of physical activity on the weekend only and subjective reporting of physical context.
There are too few studies that explore the effect of Smart Growth Planning on health outcomes. Future studies are needed that employ more robust designs with larger sample sizes, fuller complement of health outcome measures, and adequate periods of follow up to assess whether there is a critical time period for impacting health outcomes. There is also the need for a public health component of Smart Growth Planning that would facilitate mapping of principles to established community health goals as part of project evaluations.

3.6. Other Healthy Community Approaches

There is a dearth of studies that met the inclusion criteria related to Healthy Cities, Child Friendly Cities, Livable Cities, Social Cities and Dementia Friendly Cities. A closer examination of the literature provided a number of plausible explanations for the gaps in knowledge about whether these approaches result in measureable improvements in the health of populations.
Some approaches are relatively new and or emerging hence more work is needed to bring conceptual clarity in order to define criteria for designation and facilitate evaluation of projects. This is the case for Dementia Friendly Cities where work has begun to define the features of the home and built environment that facilitate ease of navigation by persons with dementia who often have sensory and cognitive deficits [58,59,60]. The literature related to Social Cities is also very scant and further work to promote coherence and definition of the concept needs to be undertaken so that it becomes a discrete and measurable entity. Once consensus is achieved on established criteria and experience with implementation grows, evidence can more easily be generated on any associated benefits and outcomes on quality of life and wellbeing.
The concept of livability has received growing attention over time. While there is general consensus that it refers to desirable characteristics of the social, physical and economic infrastructures of cities and towns, a common definition has been elusive [61]. Consequently, “livable” communities reflect a confluence of healthy community approaches that find unique expression in individual cities. Although all members of the society are intended beneficiaries of efforts to create livable communities, the concept has often been viewed from the perspective of older persons who comprise a growing segment of the population and for whom independent living and aging in place are contingent on a supportive environment.
A search of the literature revealed several tools and checklists for assessing characteristics of communities. There were several narrative reports that described conceptual frameworks or achievements of initiatives such as the Partnership for Sustainable Communities Initiative (US) [62], and Livable Centers Initiative [63]; however, efforts to locate studies and evaluation reports that included quantifiable health outcomes were unsuccessful. This is surprising given that improvement in the quality of life is often an explicit objective of programs that address livability [64]. Studies are needed that explore the health benefits for communities willing to employ those strategies.
The complex nature of the approach also poses challenges for the assessment of impact on health outcomes. Both approaches that support the development of Healthy Cities and Child Friendly Cities are broad in scope and seek to impact health through distal upstream efforts. Additionally, both approaches emphasize the process of implementation and focus on the creation of supportive environments through the development of enabling multisectoral structures and community assets [65,66]. The emphasis on development of an inclusive collaborative process may also result in a relative neglect of measurement of health outcomes as milestones of success. These challenges may be addressed with the use of alternative evaluation approaches such as social return on investment [67], realist evaluation [68] and outcome mapping [69]. While they are distinctly different methodologies, they allow for broader conceptualization of the value of a program from the perspective of stakeholders and may better accommodate complexity while providing even more comprehensive answers about how programs work and in what settings. A common set of outcomes including self-rated health and percentage time spent in moderate to vigorous physical activity may be useful program impact indicators.
The gap in the literature with respect to evidence of the effectiveness of Healthy Cities has been recognized. There is still considerable international debate about evaluation needs and methods [70,71]. The current research emphasis remains on questions related to the process of implementation (what works and what does not, and why, in the implementation process of a complex intervention such as this) with the expectation, of course, that changes in the social determinants cascade will impact health and well-being of communities. Without a clear mandate and consensus on how the value of healthy communities should be judged, this is likely to hamper work in this area.
There are several limitations of the study that should be considered in the context of its results. The scope of the review is limited to studies pertaining to selected healthy community approaches. As a result of the focused examination, extrapolation of the results to other approaches is limited. Initiatives were not equally represented in US and Canadian jurisdictions with the latter contributing fewer studies. Despite efforts to search the grey literature, many of the programs were implemented by institutions or community organizations at the local level and may not have been published in the public domain. There were few studies that were identified and employed a rigorous design that would allow for strong causal inference. This meant that available studies were not well suited to explore research questions related to the program impact. While this does not imply that the studies do not contain valuable information, it highlights the need for more research that examines what works and under what circumstances.

4. Conclusions

The body of research to support the effectiveness of selected healthy community approaches on health outcomes is limited, mainly in terms of both the depth of the evidence base and the rigor of the studies. Despite the fact that it seems reasonable, based on underlying explanatory frameworks, to suggest that healthy community approaches should be effective, there is relatively little confirmation provided by the literature. In many instances, communities and institutions lack the enabling resources (expertise, time and finances) to conduct an evaluation or do not prioritize evaluation alongside program implementation. Without adequate provisions to collect baseline data, this compromises future efforts to determine program effectiveness. Consequently, the majority of studies employed a quasi-experimental or observational design with the attendant limitations that result from lack of random allocation or absence of a concurrent or well-delineated comparison group. There is also a notable absence of theory that guides studies related to most healthy community approaches that were examined. Other frequent flaws encountered included failure to control for potential confounding factors; reliance on subjective assessment of the outcomes to the exclusion of more objective measures that can be verified and duration of follow up that was inadequate to determine if any observed changes were sustained. In the case of Safe Routes to School programs and ALbD projects where the necessary support and priority is accorded to evaluation, more studies have been conducted.
A related issue that affects the availability of evidence of effectiveness is the differential emphasis on evaluation of the process of implementation over outcomes. Healthy community approaches depend on the establishment of multisectoral partnerships to achieve their goals. In many instances, benchmark criteria require demonstration of these collaborative processes for legitimacy. There is a need to promote more comprehensive approaches to evaluation that address structure, process and outcome components and better satisfy the information needs of all stakeholders.
Although there are inherent difficulties with attribution of observed outcomes to interventions with observational designs, there is weak evidence to support an association between selected healthy community approaches and achievement of positive health outcomes. The majority of included studies pertained to Safe Routes to School Programs and reported consistent positive association between students’ active commute and program implementation. Safety benefits and changes in physical activity levels need to be confirmed with further studies. There is a paucity of studies about Active Living Communities, Age-Friendly Cities, Safe Communities and Smart Growth Planning. The evidence base needs to be strengthened by additional studies that are conceptualized to assess the effect of multifaceted interventions that may exert an influence synergistically or on specific health outcomes.
Several approaches including Healthy Cities/Communities, Child Friendly Cities, Dementia Friendly Cities and Social Cities have been relatively less studied in terms of health outcomes. The process of implementation has traditionally been emphasized in Healthy Cities and Child Friendly Cities given their focus on influencing policy to address broad social determinants. Research on these approaches is likely to be driven by practical considerations, relevance and utility in the specific city/community context. The latter two approaches (Dementia Friendly and Social Cities) require consensus and definition of uniform criteria to support design of interventions that can be evaluated.

Acknowledgments

The work was supported by the Public Health Agency of Canada (contract # 4500309324).

Author Contributions

The study was conceived and designed by BJ, NM and SJ. HW conducted the search, abstracted the data elements, and wrote the manuscript. All authors contributed to the interpretation of the findings and preparation of the manuscript.

Conflicts of Interest

The authors declare no conflict of interest.

Abbreviations

ASRTS
Active and Safe Routes to School;
ALbD
Active Living by Design;
CDC
Centers for Disease Control;
EPPHP
Effective Public Health Practice Project;
NTL
National Transportation Library;
SAFETEA-LU
Safe Accountable Flexible Efficient Transportation Equity Act: A Legacy for Users;
STP
School Travel Planning;
SRTS
Safe Routes to School;
UNICEF
United Nations Children Fund;
WHO
World Health Organization;
WSB
Walking School Bus.

Appendix: Search Strategy for Safe Routes to School

Medline OVID SP (2000 – 2014)
  • Walking/
  • Bicycling/
  • Transportation/
  • 1 or 2 or 3
  • Safety/
  • Schools/
  • Child/
  • 4 and 5 and 6 and 7
SCOPUS (Limits to English, 2000 – 2014)
  • Safe Routes to School

References and Notes

  1. Commission on Social Determinants of Health (CSDH). Closing the Gap in a Generation: Health Equity through Action on the Social Determinants of Health. Final Report of the Commission on Social Determinants of Health. Geneva: World Health Organization, 2008, Available online: http://www.who.int/social_determinants/thecommission/finalreport/en/ (accessed on 10 October 2014).
  2. Timothy Evans, Margaret Whitehead, Finn Diderichsen, Abbas Bhuiya, and Meg Wirth. Challenging Inequities in Health Care: From Ethics to Action. New York: Oxford University Press, 2001, pp. 309–22. [Google Scholar]
  3. Trevor Hancock. “Act Locally: Community-Based Population Health Promotion.” Available online: http://www.parl.gc.ca/Content/SEN/Committee/402/popu/rep/appendixBjun09-e.pdf (accessed on 7 August 2015).
  4. National Research Council and Institute of Medicine. U.S. Health in International Perspective: Shorter Lives, Poorer Health. Panel on Understanding Cross-National Health Differences among High-Income Countries. Edited by Steven H. Woolf and Aron Laudan. Washington: The National Academies Press, 2013. [Google Scholar]
  5. Tyler Norris, and Mary Pittman. “The healthy communities movement and the coalition for healthier cities and communities.” Public Health Reports 115 (2000): 118. [Google Scholar] [CrossRef] [PubMed]
  6. UNICEF Innocenti Research Centre. “Building Child Friendly Cities: A framework for action.” Available online: http://childfriendlycities.org/wp_content/uploads/2013/04/pdf/BuildingCFC_AFrameworkforaction_en.pdf (accessed on 9 September 2015).
  7. Smart Growth Online. “What is smart growth? ” Available online: http://www.smartgrowth.org/what-is-smart-growth/ (accessed on 9 September 2015).
  8. “National Center for Safe Routes to School.” Available online: http://saferoutesinfo.org/about-us/history-srts (accessed on 9 September 2015).
  9. “WHO Collaborating Centre on Community Safety Promotion.” Available online: http://isccc.global/how-to-become-an-international-safe-community (accessed on 25 December 2015).
  10. “Active Living Research.” Available online: http://activelivingresearch.org/active-living-topics (accessed on 9 September 2015).
  11. Elizabeth E. Fischer. “Building livable communities for the 21st century.” Public Roads 63 (2000): 30–34. [Google Scholar]
  12. Cardus. “About the Social Cities Research Program.” Available online: http://www.cardus.ca/research/socialcities/ (accessed on 9 September 2015).
  13. World Health Organization. “Global Age Friendly Cities: A Guide.” Available online: http://apps.who.int/iris/bitstream/10665/43755/1/9/8921 (accessed on 9 September 2015).
  14. Alzheimer’s Society. “Dementia Friendly Communities.” Available online: http://www.alzheimers.org.uk/site/scripts/documents_info.php?documentID=1843 (accessed on 10 September 2015).
  15. Noreen C. McDonald, Pamela H. Barth, and Ruth L. Steiner. “Assessing the Distribution of Safe Routes to School Program Funds, 2005–2012.” American Journal of Preventive Medicine 45 (2013): 401–6. [Google Scholar] [CrossRef] [PubMed]
  16. Angie L. Cradock, Billy Fields, Jessica L. Barrett, and Steven Melly. “Program practices and demographic factors associated with federal funding for the Safe Routes to School program in the United States.” Health & Place 18 (2012): 16–23. [Google Scholar] [CrossRef] [PubMed]
  17. Philip Bors, Mark Dessauer, Rich Bell, Risa Wilkerson, Joanne Lee, and Sarah L. Strunk. “The Active Living by Design national program: Community initiatives and lessons learned.” American Journal of Preventive Medicine 37 (2009): S313–21. [Google Scholar] [CrossRef] [PubMed]
  18. Lynn Weigand. “A review of literature: The effectiveness of Safe Routes to School and other programs to promote active transportation to school.” Available online: https://www.pdx.edu/ibpi/sites/www.pdx.edu.ibpi/files/Safe%20Routes%20White%20Paper.pdf (accessed on 25 August 2015).
  19. Anneliese Spinks, Cathy Turner, Jim Nixon, and Roderick J. McClure. “The WHO Safe Communities model for the prevention of injury in whole populations.” Cochrane Database of Systematic Reviews 3 (2009): CD004445. [Google Scholar] [PubMed]
  20. Effective Public Health Practice Project. “Quality Assessment Tool for Quantitative Studies.” Available online: http:///www.ephpp.ca/Tools.html (accessed on 7 August 2015).
  21. Jason A. Mendoza, David D. Levinger, and Brian D. Johnston. “Pilot evaluation of a walking school bus program in a low-income, urban community.” BMC Public Health 9 (2009): 122. [Google Scholar] [CrossRef] [PubMed]
  22. Jason A. Mendoza, Kathy Watson, Tom Baranowski, Theresa A. Nicklas, Doris K. Uscanga, and Marcus J. Hanfling. “The walking school bus and children’s physical activity: A pilot cluster randomized controlled trial.” Pediatrics 128 (2011): e537–44. [Google Scholar] [CrossRef] [PubMed]
  23. Marlon G. Boarnet, Craig L. Anderson, Kristen Day, Tracy McMillan, and Mariela Alfonzo. “Evaluation of the California Safe Routes to School legislation: Urban form changes and children’s active transportation to school.” American Journal of Preventive Medicine 28 (2005): 134–40. [Google Scholar] [CrossRef] [PubMed]
  24. Jill F. Cooper, and Tracy E. McMillan. “Safe Routes to School Local School Project: A health evaluation at 10 low income schools.” Available online: http://saferoutespartnership.org/sites/default/files/pdf/Health_Evaluation_Feb_2010.pdf (accessed on 8 August 2015).
  25. Ron Buliung, Guy Faulkner, Theresa Beesley, and Jacky Kennedy. “School travel planning: Mobilizing school and community resources to encourage active school transportation.” Journal of School Health 81 (2011): 704–12. [Google Scholar] [CrossRef] [PubMed]
  26. George Mammen, Michelle R. Stone, Guy Faulkner, Subha Ramanathan, Ron Buliung, Catherine O’Brien, and Jacky Kennedy. “Active school travel: An evaluation of the Canadian school travel planning intervention.” Preventive Medicine 60 (2014): 55–59. [Google Scholar] [CrossRef] [PubMed]
  27. Susan Henderson, Robin Tanner, Norma Klanderman, Abby Mattera, Lindsey Martin Webb, and John Steward. “Safe Routes to School: A public health practice success story—Atlanta, 2008–2010.” Journal of Physical Activity and Health 10 (2013): 141–42. [Google Scholar] [PubMed]
  28. Noreen C. McDonald, Yizhao Yang, Steve M. Abbott, and Allison N. Bullock. “Impact of the Safe Routes to School program on walking and biking: Eugene, Oregon study.” Transport Policy 29 (2013): 243–48. [Google Scholar] [CrossRef]
  29. Noreen C. McDonald, Ruth L. Steiner, Chanam Lee, Tori Rhoulac Smith, Xuemei Zhu, and Yizhao Yang. “Impact of the safe routes to school program on walking and bicycling.” Journal of the American Planning Association 80 (2014): 153–67. [Google Scholar] [CrossRef]
  30. Anne Vernez Moudon, and Orion Stewart. “Moving forward: Safe Routes to School progress in five states. ” Available online: http://www.wsdot.wa.gov/research/reports/fullreports/743.3.pdf (accessed on 8 August 2015).
  31. Catherine E. Staunton, Deb Hubsmith, and Wendi Kallins. “Promoting safe walking and biking to school: The Marin County success story.” American Journal of Public Health 93 (2003): 1431–34. [Google Scholar] [CrossRef] [PubMed]
  32. Aaron Buckley, Michael B. Lowry, Helen Brown, and Benjamin Barton. “Evaluating safe routes to school events that designate days for walking and bicycling.” Transport Policy 30 (2013): 294–300. [Google Scholar] [CrossRef]
  33. Brian D. Johnston, Jason Mendoza, Sarah Rafton, Denise Gonzalez-Walker, and David Levinger. “Promoting physical activity and reducing child pedestrian risk: Early evaluation of a walking school bus program in central Seattle.” Journal of Trauma and Acute Care Surgery 60 (2006): 1388–89. [Google Scholar] [CrossRef]
  34. Stephen P. Sayers, Joseph W. LeMaster, Ian M. Thomas, Gregory F. Petroski, and Bin Ge. “A Walking School Bus program: Impact on physical activity in elementary school children in Columbia, Missouri.” American Journal of Preventive Medicine 43 (2012): S384–89. [Google Scholar] [CrossRef] [PubMed]
  35. Charles DiMaggio, and Guohua Li. “Effectiveness of a safe routes to school program in preventing school-aged pedestrian injury.” Pediatrics 131 (2013): 290–96. [Google Scholar] [CrossRef] [PubMed]
  36. Richard D. Blomberg, Arlene M. Cleven, F. Dennis Thomas III, and Raymond C. Peck. Evaluation of the Safety Benefits of Legacy Safe Routes to School Programs; Washington: National Highway Traffic Safety Administration, 2008. Available online: http://www.nhtsa.gov/DOT/NHTSA/Communication%20.../tt368.pdf (accessed on 8 August 2015).
  37. Marla R. Orenstein, Nicolas Gutierrez, Thomas M. Rice, Jill F. Cooper, and David R. Ragland. Safe Routes to School Safety and Mobility Analysis; Berkley: UC Berkley Traffic Safety Center, 2007. Available online: http://www.dot.ca.gov/hq/LocalPrograms/saferoutes/documents/SR2S+Final_Report_to_the_Legislature.pdf (accessed on 9 August 2015).
  38. David R. Ragland, Swati Pande, John Bigham, and Jill F. Cooper. “Ten years later: Examining the long term impact of the California Safe Routes to School Program.” In Paper presented at the Transportation Research Board 93rd Annual Meeting, Washington, DC, USA, 12–16 January 2014; Available online: http://doc.trb.org/prp/14-4226.pdf (accessed on 25 December 2015).
  39. Jason A. Mendoza, Kathy Watson, Tzu-An Chen, Tom Baranowski, Theresa A. Nicklas, Doris K. Uscanga, and Marcus J. Hanfling. “Impact of a pilot walking school bus intervention on children’s pedestrian safety behaviors: A pilot study.” Health & Place 18 (2012): 24–30. [Google Scholar] [CrossRef] [PubMed]
  40. Virginia R. Chomitz, Julia C. McDonald, Denise B. Aske, Lisa N. Arsenault, Nicole A. Rioles, Lisa B. Brukilacchio, Karen A. Hacker, and Howard J. Cabral. “Evaluation results from an active living intervention in Somerville, Massachusetts.” American Journal of Preventive Medicine 43 (2012): S367–78. [Google Scholar] [CrossRef] [PubMed]
  41. David S. TenBrink, Randall McMunn, and Sarah Panken. “Project U-Turn: Increasing active transportation in Jackson, Michigan.” American Journal of Preventive Medicine 37 (2009): S329–35. [Google Scholar] [CrossRef] [PubMed]
  42. Stephen P. Sayers, Joseph W. LeMaster, Ian M. Thomas, Gregory F. Petroski, and Bin Ge. “Bike, Walk, and Wheel: A way of life in Columbia, Missouri, revisited.” American Journal of Preventive Medicine 43 (2012): S379–83. [Google Scholar] [CrossRef] [PubMed]
  43. Gregory R. Istre, Martha Stowe, Mary A. McCoy, Billy J. Moore, Dan Culica, Katie N. Womack, and Ron J. Anderson. “A controlled evaluation of the WHO Safe Communities model approach to injury prevention: Increasing child restraint use in motor vehicles.” Injury Prevention 17 (2011): 3–8. [Google Scholar] [CrossRef] [PubMed]
  44. Genevieve F. Dunton, Stephen S. Intille, Jennifer Wolch, and Mary Ann Pentz. “Investigating the impact of a smart growth community on the contexts of children’s physical activity using Ecological Momentary Assessment.” Health & Place 18 (2012): 76–84. [Google Scholar] [CrossRef] [PubMed]
  45. Amanda J. Lehning, Richard J. Smith, and Ruth E. Dunkle. “Age-Friendly Environments and Self-Rated Health: An Exploration of Detroit Elders.” Research on Aging 36 (2012): 72–94. [Google Scholar] [CrossRef] [PubMed]
  46. Verena H. Menec, and Scott Nowicki. “Examining the relationship between communities’ ’age-friendliness’ and life satisfaction and self-perceived health in rural Manitoba, Canada.” Rural and Remote Health 14 (2014): 1–14. Available online: http://www.rrh.org.au/articles/subviewnew.asp?ArticleID=2594 (accessed on 25 December 2015). [Google Scholar]
  47. Kim L. Bercovitz, and Harvey A Skinner. “Active Living—Just a passing fad? ” Canadain Journal of Public Health 87 (1996): 275–79. [Google Scholar]
  48. Elaine Gallagher, and Angie Mallhi. “Age-Friendly British Columbia. Lessons learned from October 1, 2007–September 30, 2010. ” Available online: http://www2.gov.bc.ca/assets/gov/people/seniors/about-seniorsbc/afbc/afbc_evaluation_report.pdf (accessed on 25 December 2015).
  49. Neil Steffler, and Lisa Kaldeway. “City of Kawartha Lakes Age-Friendly Project Assessment: Report to the Community, 2011.” Available online: http://www.hkpr.on.ca/Portals/0/PDF%20Files%20-%20CDIP/AFReport-web.pdf (accessed on 10 October 2014).
  50. Verena H. Menec, Sheila Novek, Dawn Veselyuk, and Jennifer McArthur. “Lessons learned from a Canadian province-wide age-friendly initiative: The Age-Friendly Manitoba Initiative.” Journal of Aging & Social Policy 26 (2014): 33–51. [Google Scholar] [CrossRef] [PubMed]
  51. Mary Wiley. “Niagara Age-Friendly Community Initiative Year 1 2010–2011. Evaluation Report.” Available online: https://notl.civicweb.net/document/3543/Niagara%20Age-Friendly%20Summary%20Report.pdf?handle=0A6A4D09624A46BF808D78BEB6BFA16F (accessed on 25 December 2015).
  52. WHO Centre for Health Development. “2nd WHO Consultation on Developing Indicators for Age-Friendly Cities.” 8 September 2013. Available online: http://www.seniorscouncil.net/uploads/files/AFC_Mtg-2_Report_SEP2013_Quebec.pdf (accessed on 14 August 2015).
  53. “Parachute.” Available online: http://www.parachutecanada.org/safecommunities (accessed on 6 September 2015).
  54. Nilsen Per. “What makes community based injury injury prevention work? In search of evidence of effectiveness.” Injury Prevention 10 (2004): 268–274. [Google Scholar] [CrossRef] [PubMed]
  55. Brian D. Johnston. “Injury prevention in safe communities.” Injury Prevention 17 (2011): 1–2. [Google Scholar] [CrossRef] [PubMed]
  56. Casey P. Durand, Mohammad Andalib, Genevieve F. Dunton, Jennifer Wolch, and Mary Ann Pentz. “A systematic review of built environment factors related to physical activity and obesity risk: Implications for smart growth urban planning.” Obesity Reviews 12 (2011): e173–82. [Google Scholar] [CrossRef] [PubMed]
  57. Nazeem Muhajarine. “Canadian Evidence on Built Environment and Health.” Canadian Journal of Public Health 103 (2012): S3–72. [Google Scholar] [PubMed]
  58. Lynne Mitchell, Elizabeth Burton, and Shibu Raman. “Dementia-friendly cities: Intelligible neighbourhoods for life.” Journal of Urban Design 9 (2004): 89–101. [Google Scholar] [CrossRef]
  59. Lynne Mitchell. “Breaking New Ground. The Quest for Dementia-Friendly Communities.” 2012. Available online: www.housinglin.org.uk (accessed on 14 September 2015).
  60. Jason Su. “Built for Dementia: Urban Design analysis for Dementia-Friendly Communities.” Master Thesis, San Jose State University, San Jose, CA, USA, 1 April 2013. Available online: http://scholarworks.sjsu.edu/cgi/viewcontent.cgi?article=1317&context=etd_projects (accessed on 25 December 2015). [Google Scholar]
  61. Matthias Ruth, and Rachel S. Franklin. “Livability for all? Conceptual limits and practical limitations.” Applied Geography 49 (2014): 18–23. [Google Scholar] [CrossRef] [PubMed]
  62. “Partnership for Sustainable Communities. ” Available online: https://www.sustainablecommunities.gov/mission/livability-principles (accessed on 6 September 2015).
  63. Atlanta Regional Commission. “Livable Centers Initiative (LCI) Implementation Report.” 2013. Available online: http://www.atlantaregional.com/land-use/livable-centers-initiative (accessed on 10 August 2015).
  64. “Partners for Livable Communities.” Available online: http://livable.org (accessed on 6 September 2015).
  65. Silvie Schulze, and Francesca Moneti. “The Child Friendly Cities Initiative.” Municipal Engineer 160 (2007): 77–81. [Google Scholar] [CrossRef]
  66. World Health Organization. “Healthy Settings.” 2014. Available online: http://www.who.int/healthy_settings/types/cities/en (accessed on 6 September 2015).
  67. Malin Arvidson, Fergus Lyon, Stephen McKay, and Domenico Moro. “The ambitions and challenges of SROI. Third Sector Research Centre.” 2010. Available online: https://eprints.mdx.ac.uk/7104/1/The_ambitions_and_challenges_of_SROI.pdf (accessed on 6 September 2015).
  68. Ray Pawson, and Nick Tilley. Realistic Evaluation. London: Sage, 1997. [Google Scholar]
  69. Sarah Earl, Fred Carden, and Terry Smutylo. Outcome Mapping. Building Learning and Reflection into Development Programs. Ottawa: International Development Research Centre, 2001, Available online: http://www.outcomemapping.ca/download.php?file=/resource/files/OM_English_final.pdf (accessed on 25 December 2015).
  70. Evelyne De Leeuw, and Thomas Skovgaard. “Utility-driven evidence for healthy cities: Problems with evidence generation and application.” Social Science & Medicine 61 (2005): 1331–41. [Google Scholar] [CrossRef] [PubMed]
  71. Evelyne De Leeuw. “Evaluating WHO Healthy Cities in Europe: Issues and perspectives.” Journal of Urban Health 90 (2013): 14–22. [Google Scholar] [CrossRef] [PubMed]

