1. Introduction
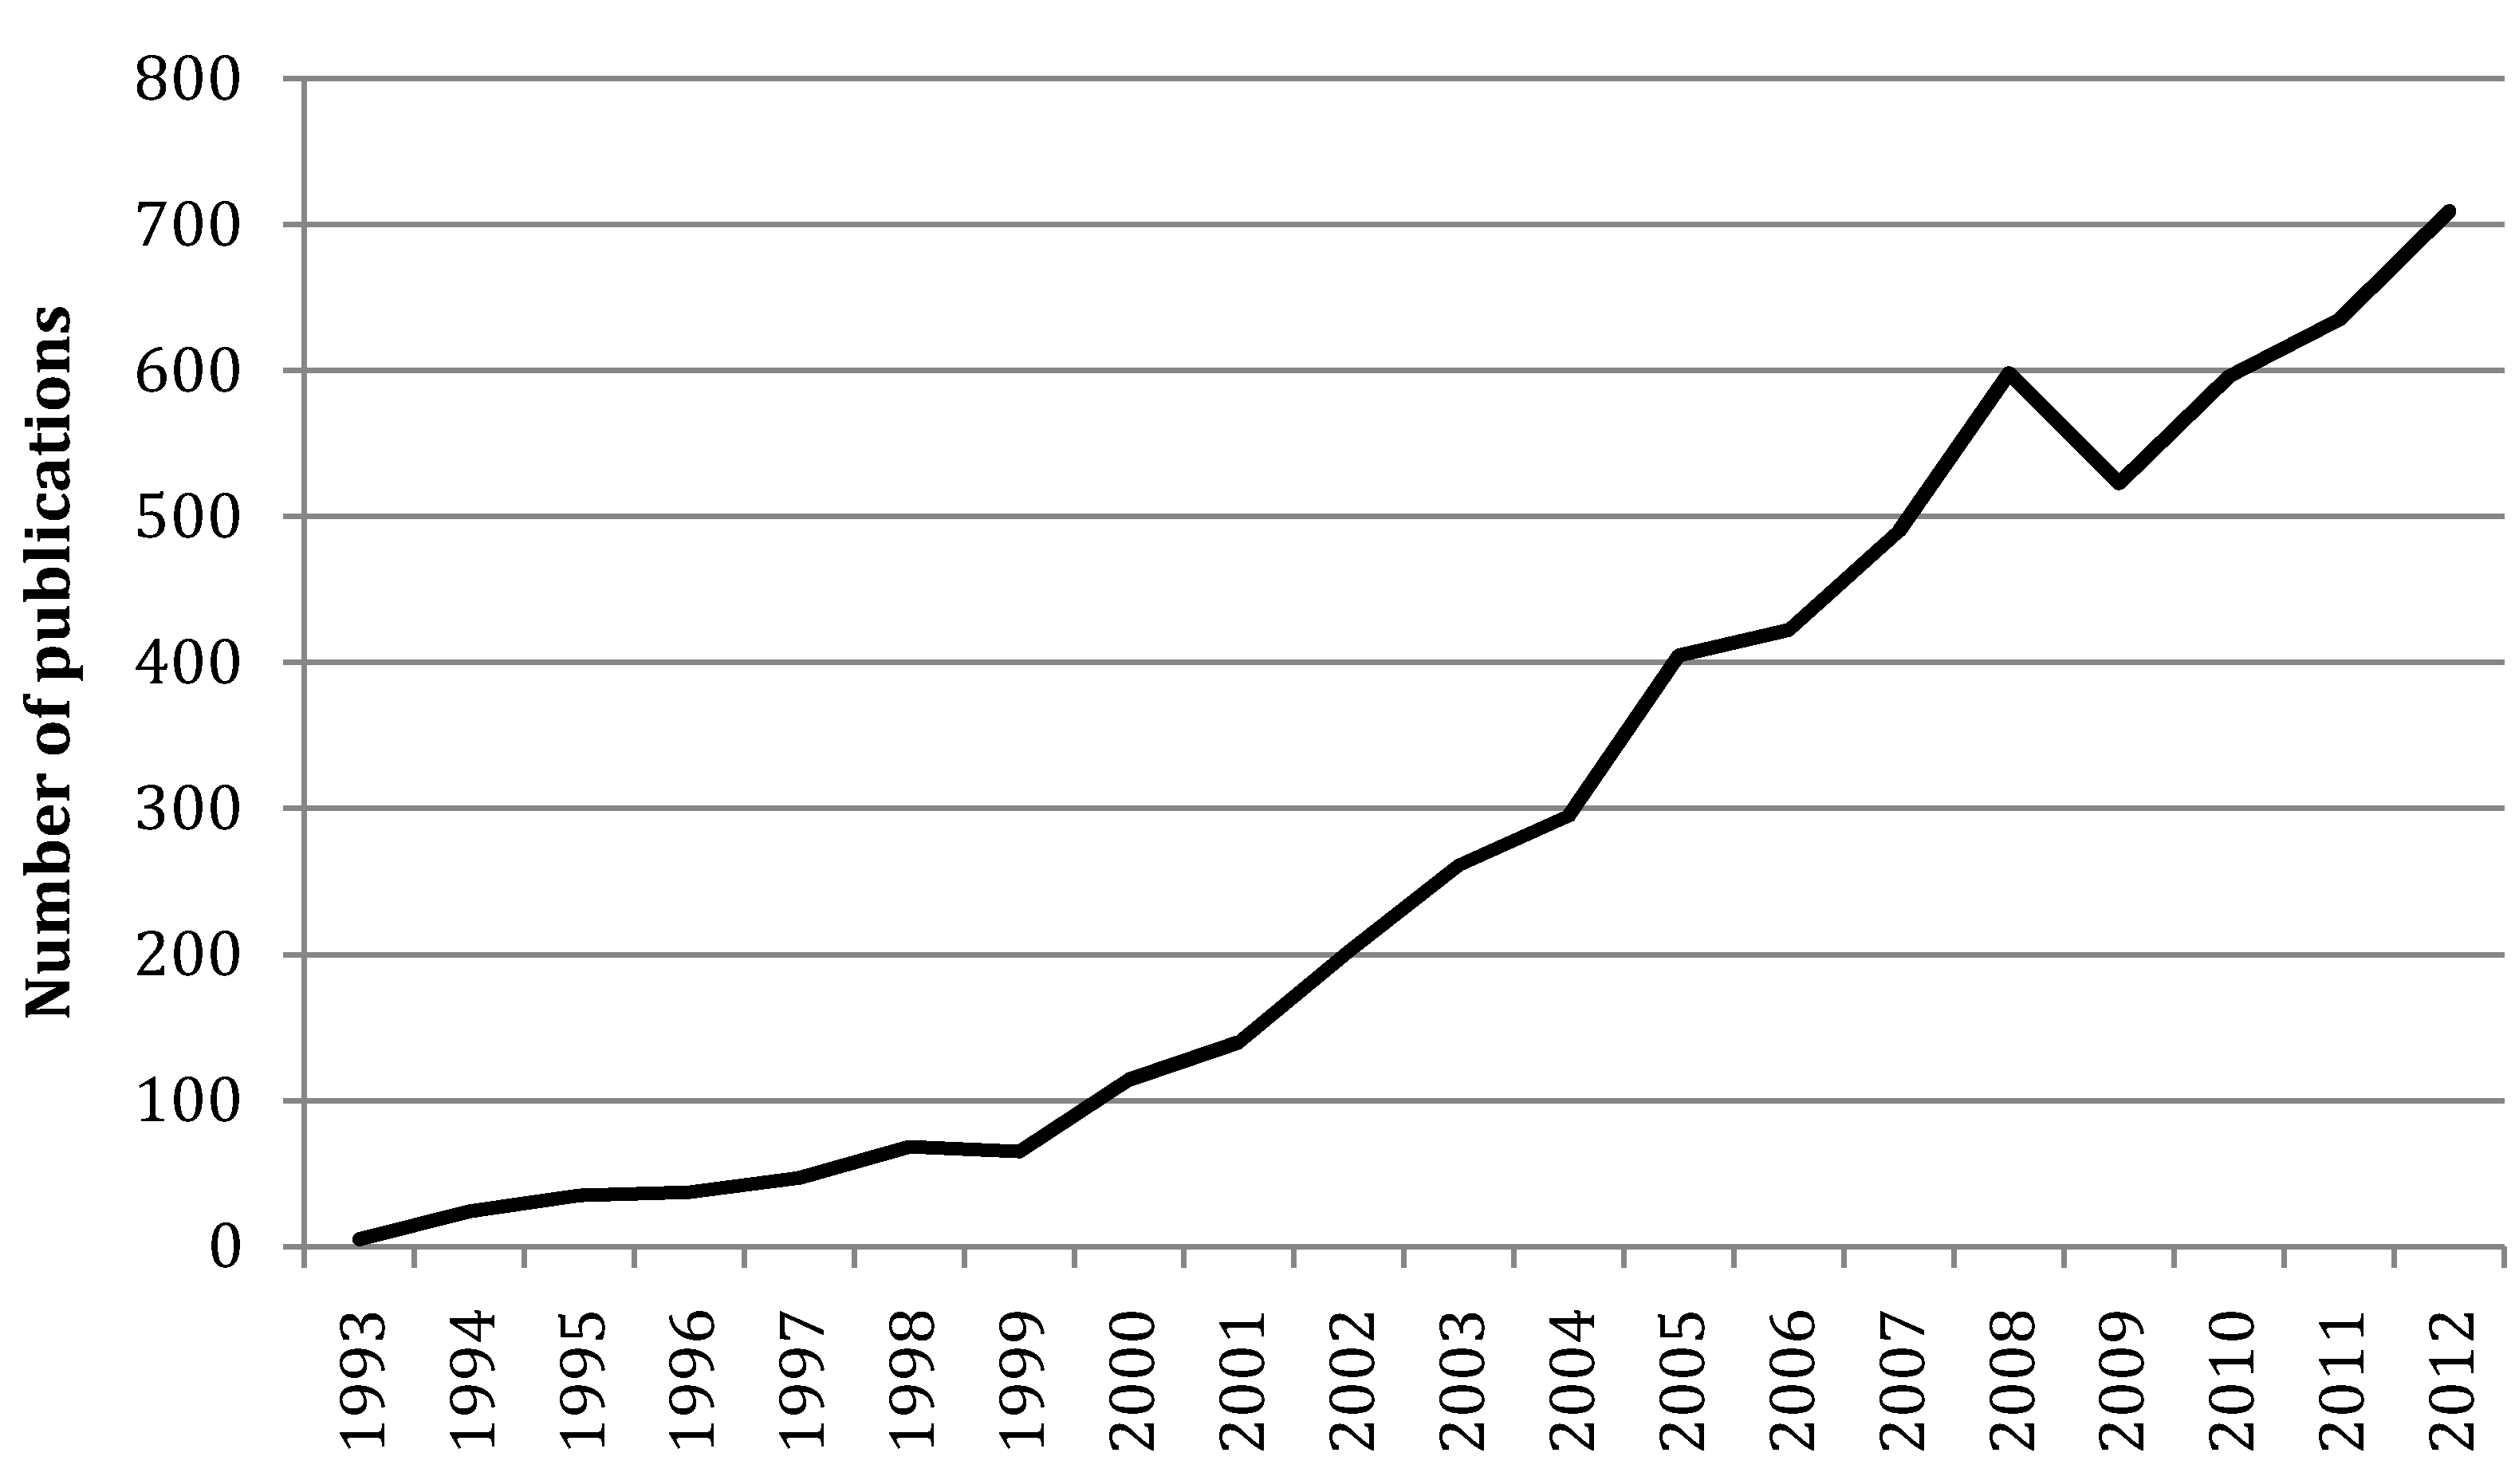
Within conservation, the number of new household surveys has grown almost every year for the last two decades (
Figure 1). Conservation organizations are using household surveys as the data collection tool for,
inter alia, project baselines and impact assessments (e.g., [
1,
2]) and to inform the detailed design of new projects.
Figure 1.
All publications in Google Scholar containing the search terms “household survey” and “biodiversity” from 1993 to 2012.
Figure 1.
All publications in Google Scholar containing the search terms “household survey” and “biodiversity” from 1993 to 2012.
Conservation’s growing use of surveys helps answer the calls for more empirical evidence of conservation impacts [
3,
4]. Yet given the time and financial costs of a survey, it may not always be the best option for a conservation initiative’s monitoring and evaluation. Where there are a large number of potential project-influenced changes or a need for a nuanced understanding of changes, qualitative tools may be a better alternative [
5,
6]. When surveys are the tool of choice, data collection is commonly done either remotely or face-to-face [
7]. Remote data collection involves mail, phone or Internet surveys. This type of data collection affords a higher degree of privacy to respondents but depends on reliable mail service or a high percentage of phone/computer ownership. Face-to-face data collection involves in-person interviews where responses are recorded with pen and paper or electronically. In a developing country context, face-to-face data collection may be more practical than remote data collection when communications infrastructure is limited.
Face-to-face data collection has historically been paper-based, but this is changing. Since the 1990s, computer-aided personal interviewing (CAPI) has become prevalent, offering the advantages of data entry during the interview and consistency in survey skip coding and branching logic [
7]. Early CAPI efforts in developing countries used laptop computers and a different software program for each stage of the survey process (e.g., [
8]). Personal data assistants (PDAs) and basic survey software were the follow-on technologies (e.g., [
9]). Smartphones with dedicated survey apps have more recently been used for CAPI surveys in developing countries (e.g., [
10]). When the Apple iPad tablet computer was introduced in April 2010, another option became available. The paper-sized screen, portability, battery life, and data storage capacity make tablets attractive for face-to-face surveys. Initial tablet efforts used first-generation hardware and custom-designed software for health surveys in developing countries (e.g., [
11]). In 2011, multi-language survey software became available as a downloadable iPad software app [
12]. Recently, the confluence of lower prices for second-generation tablets and suitable off-the-shelf survey software has enabled those without the resources for expensive hardware and custom software to also undertake tablet-based surveys in developing countries.
Like other international conservation organizations, The Nature Conservancy is increasingly focused on measuring the social impacts of its conservation work in developing countries. In an October 2013 survey, a team at The Nature Conservancy tested the viability of tablet computers and off-the-shelf survey software for household data collection in a rural area of a developing country. Having data on the costs and time for a tablet-based household survey presented the opportunity to compare these with similar paper-based surveys. This paper thus presents preliminary evidence of likely differences in costs and time between tablet-based and paper-based household surveys along with several novel findings.
2. Methods
This comparison used household survey data from a grasslands conservation project in eastern South Africa (a 2010 paper-based survey), a population, health and environment project in western Tanzania (a 2011 paper-based survey), and a freshwater conservation project in central Kenya (a 2013 tablet-based survey). The three surveys were funded by The Nature Conservancy and implemented in conjunction with partner organizations. Free, prior and informed consent was obtained from all respondents in the surveys.
The paper-based surveys were chosen for the comparison because they share with the tablet-based survey a face-to-face data collection mode, a project-area sampling frame, a cluster-sampling method, the use of trained local enumerators and local supervisors, and a similar East African geographical context.
Substantive differences among the surveys were that the tablet-based survey had more questions than the paper-based ones (104 questions versus 80 and 86 questions), the thematic focus of the questionnaires was different, and the in-kind support from local partner organizations varied. There was also a substantive difference in one paper-based survey (Tanzania) where errors during data entry required extensive data cleaning. The additional data cleaning costs were included in the comparison given that data-entry issues are not unusual in a paper-based survey conducted in a developing country.
The survey costs comprise enumerator and supervisor fees (including enumerator and supervisor training and the pre-test), data entry, data cleaning, and the survey materials (paper and printing or tablets and software). The cost items in the paper-based surveys were averaged to reduce the variations in costs within individual surveys and provide a more representative comparator. The costs do not include the survey development, translation, the survey team’s room and board, or local transport. These costs were specific to the local context and hence excluded from the comparison.
The cost data were based on expense reports submitted to The Nature Conservancy with the exception of the data cleaning costs which were estimated by the data cleaners based on the number of hours spent on the task. Because international cost comparison can be influenced by exchange rates and local purchasing power, all local currency costs were converted to U.S. dollars using the 2011 purchasing power parity conversion factor for each country [
13]. This factor is the number of currency units required to buy the same amounts of goods and services in a country’s domestic market as one U.S. dollar would buy in the United States. The purchasing power parity (PPP) rate is a frequent component of cost comparisons in different currencies (e.g., [
14,
15]).
The time data were based on the duration of each interview. One of the paper-based surveys did not include interview duration data, and an estimate was made based on team recollections. This was marked as an estimate in the results, and the estimate was excluded from the statistical comparison. The interview duration data were independent samples of interval data with a non-standard distribution and thus a non-parametric Wilcoxon rank-sum test in Stata 12.0 was used.
For the paper-based surveys, local printers and copying machines were used to produce the surveys. For the tablet-based survey, six iPad minis (Apple, Cupertino, CA, USA, 2013) with 16GB, WiFi and iOS7 were purchased along with waterproof covers and electrical plug adapters. Each iPad cost US$343.
The software application was QuickTapSurvey version 5.4 [
12]. The cost for a two-month subscription to the software was US$288. Survey data were collected offline and uploaded each evening to the software provider’s server via a local WiFi connection.
3. Results
The comparison of paper-based and tablet-based social survey data collection suggests savings in both costs and time. The cost per completed interview for the tablet-based survey was 74% less than the paper-based survey average (
Table 1), and the average time per interview question for the tablet-based survey was 46% less than the paper-based survey average (
Table 2).
Table 1.
Cost comparison of paper-based versus tablet-based survey data collection (in 2011 purchasing power parity (PPP) US$) showing tablet costs as a percentage of paper costs and the cost per completed interview.
Table 1.
Cost comparison of paper-based versus tablet-based survey data collection (in 2011 purchasing power parity (PPP) US$) showing tablet costs as a percentage of paper costs and the cost per completed interview.
| | | Paper-based | Tablet-based | Tablet costs (b) |
|---|
| Item | Paper 1 (South Africa) | Paper 2 (Tanzania) | Paper average (a) | Tablet (Kenya) (b) | as a percentage of paper costs (a) |
|---|
| Enumerator fees | 6950 | 13,698 | 10,324 | 3679 | 36% |
| Supervisor fees | 4245 | 4476 | 4361 | 3066 | 70% |
| Data entry costs | 3321 | 2686 | 3003 | 0 | 0% |
| Data cleaning costs * | 2088 | 11,200 | 6644 | 500 | 8% |
| Survey materials | 1174 | 895 | 1034 | 2461 | 238% |
| Total | $17,778 | $32,955 | $25,366 | $9706 | 38% |
| Cost per completed interview | $35 | $68 | $51 | $13 | 26% |
The primary costs savings were in data cleaning and enumerator fees. Taking each in turn, the need for data cleaning was minimal for the tablet-based survey, creating the largest portion of the cost savings. Identifiable data entry errors for the tablet-based survey were limited to the sequential numbering of daily interviews by each numerator.
In the paper-based surveys, enumerators spent an average of 218 minutes a day interviewing people compared to 202 minutes a day for the tablet-based survey, yet the tablet-based enumerators completed 63% more interviews a day on average even though the tablet-based survey had approximately 20% more questions. The reduced data collection time led to lower enumerator fees.
Table 2.
Survey characteristics detailing the n for each survey, the average duration of interview, number of questions per interview, and other relevant parameters.
Table 2.
Survey characteristics detailing the n for each survey, the average duration of interview, number of questions per interview, and other relevant parameters.
| | | Paper-based | Tablet-based | Ho: |
|---|
| Item | Paper 1 (South Africa) | Paper 2 (Tanzania) | Paper average (a) | Tablet (Kenya) (b) | Paper = Tablet ** |
|---|
| Completed interviews (n) | 513 | 487 | 500 | 730 | -- |
| Average duration of interview (minutes) | 30 * | 43 | 37 | 21 | z = −23.1
p = 0.00 |
| Number of questions per interview | 80 | 86 | 83 | 104 | -- |
| Average time per question (seconds) | 23 * | 30 | 26 | 12 | -- |
| Enumerator person-days (total) | 60 | 153 | 107 | 76 | -- |
| Average interviews per person-day | 8.6 | 3.2 | 5.9 | 9.6 | -- |
As enumerators learned to use the tablet’s touchscreen and software, the average time per interview dropped by about 45%. The average time per interview on the first full day of interviewing was 35 minutes and not much different from the 37 minute average of the paper-based surveys. By day five, the average time per interview was 19 minutes and stayed relatively constant thereafter. The largest change came on day four when the average time decreased 10 minutes compared to day three.
4. Discussion and Conclusions
While this is an opportunistic comparison of existing survey costs and time, it offers indications that there may be substantial cost and time saving with tablet-based data collection compared to paper-based data collection.
Our results suggest that the savings on survey data entry costs alone may be greater than the costs of the electronic hardware and software. This corroborates other authors’ findings. An infant feeding practices survey in China comparing paper and smartphones [
16] and a neglected tropical disease survey in Ethiopia comparing paper and tablets [
11] both found the savings on data entry were greater than the costs of the hardware and software. Avoiding the double entry of data needed with a paper survey appears to be the primary reason for the cost savings.
In this comparison, the greatly reduced data cleaning generated the largest savings. Restricting data entry to only valid responses eliminated out-of-range data entry in the tablet-based survey and minimized the need for data cleaning.
On timesaving, the touchscreen of the tablets allowed for data entry with a single touch for multiple-choice questions. The skip logic and branching of the survey were also invisible to enumerators, and thus no time was needed to move to the next question in the survey. The result was that enumerators could complete more surveys in a given time.
The average interview duration did not drop until after three full days of using the tablets. This suggests that for enumerators not familiar with the technology, tablet surveys may need to be longer than three days before the benefits of faster interviews compared to paper are apparent. This may be a finding new to the social science survey literature.
While the use of tablets for household surveys in developing countries shows promise, it may create new issues. First, the iPads used in the survey were high-status items in Kenya, making them a theft risk. Keeping the tablets secured at night and hidden while walking to interviews was a priority for the enumerators. Second, safe data storage depends on uploading the day’s interviews via the Internet, and where WiFi is not available at the end of each day, the risks go up of a lost or damaged iPad compromising the survey sample. Third, during the interviews, respondents often sat side-by-side with the enumerators so they could see how the tablet worked. This could influence the answers. Respondents tend to choose the last answer given if they are hearing the questions (the recency effect) or the first answer given if they are reading the question (the primacy effect) [
7]. If respondents read the questions from the tablet rather than listen to them for some interviews but not others, this could make the responses inequivalent. To avoid this issue, tablet screens should be positioned so respondents cannot read them during interviews. This may be an issue new to the social science survey literature.
The recency and primacy effects raise the issue of overall paper
versus electronic data collection equivalency—a topic that has been studied extensively in the health sector. A meta-review that assessed paper
versus computer versions of patient-reported outcomes in clinical trials found that among 233 direct comparisons, 93% were within ±5% of the scale range [
17], suggesting a high degree of equivalency. A large disease survey with 12,000 households interviewed using tablets and 9000 interviewed using pen and paper found no differences in disease classification errors but fewer errors overall in the tablet data than the paper data [
11]. This suggests that tablet-based data collection can be of comparable or better quality than paper-based data collection.
While a switch to tablet-based surveys may create new issues, it may also address old ones. Falsification of data in surveys is a known enumerator issue that can undermine data reliability [
7]. The tablet survey software records the end time for each survey automatically, and this feature was demonstrated to the enumerators after the pre-test to preclude shortcuts in data collection. The survey software made it easier to spot falsified data, and during the data cleaning, one interview was discarded because it was less than two minutes long followed by a two-hour break.
This tablet-paper comparison is not without noteworthy limitations. It is based on opportunistic observations from existing data collection efforts, and there were differences in the surveys, enumerators and local contexts. Hence, the comparison provides only suggestive evidence that using off-the-shelf tablet hardware and survey software may offer savings in costs and time compared to paper-based surveys. Further studies would ideally be comparison tests of identical surveys except for the data collection tool.
This preliminary comparison has several implications for conservationists conducting household surveys in developing countries. First, tablet-based data collection should be considered when designing a new survey. Second, the reduction in cost and time from using tablets for data collection could make social surveys viable for even small conservation projects with limited funding. Third, technology is making it easier to do surveys, but unexpected issues specific to the technology may yet arise during implementation or analysis.
Acknowledgements
In South Africa, the author would like to thank the people neighboring the Umgano Nature Reserve, R. Brouwer, Chief Baleni, W. Bainbridge, B. Barnes, Z. Mazibuko, P. Nixon, A. Anderson, M. Jaca, K. MaCann, R. Vogelij, J. Gutowska, P. van Beukering and the local stationary shop owner, E. Leistershire, for copying the household questionnaires.
In Tanzania, the author would like to thank the people around Mahale Mountain National Park, S. Hess, A. Mallya, K. Doody, M. Mosha, S. Aibe, P. David and the many others who helped with the survey.
In Kenya, the author would like to thank the local people in the upper Tana River watershed, F. Kihara, J. Musengezi, M. Wanjiku Karigu, K. Maina, S. Kabiru, J. Ng’ang’a Gathagu, E. Nangila, and M. Muthoni Macharia, J.J. Wachira and P. Wachira, C. Gitau, R. Mutui, and K. Mugo.
Finally, thanks go to the Ann Ray Charitable Trust and Pentair for funding this work.
Conflicts of Interest
The author declares no conflict of interest.
References
- David S. Wilkie, Gilda A. Morelli, Josefien Demmer, Malcolm Starkey, Paul Telfer, and Matthew Steil. “Parks and people: Assessing the human welfare effects of establishing protected areas for biodiversity conservation.” Conservation Biology 20 (2006): 247–49. [Google Scholar] [CrossRef] [PubMed]
- Craig Leisher, Sebastiaan Hess, Timothy M. Boucher, Pieter van Beukering, and M. Sanjayan. “Measuring the impacts of community-based grasslands management in Mongolia’s Gobi.” PloS One 7 (2012): e30991. [Google Scholar] [CrossRef] [PubMed]
- Andrew S. Pullin, and Teri M. Knight. “Effectiveness in conservation practice: Pointers from medicine and public health.” Conservation Biology 15 (2001): 50–54. [Google Scholar] [CrossRef]
- William J. Sutherland, Andrew S. Pullin, Paul M. Dolman, and Teri M. Knight. “The need for evidence-based conservation.” Trends in Ecology & Evolution 19 (2004): 305–08. [Google Scholar]
- Lizzie Wilder, and Matt Walpole. “Measuring social impacts in conservation: Experience of using the Most Significant Change method.” Oryx 42 (2008): 529–38. [Google Scholar] [CrossRef]
- Jenniver Sehring, Kaisa Korhonen-Kurki, and Maria Brockhaus. “Qualitative Comparative Analysis (QCA): An application to compare national REDD+ policy processes.” CIFOR Working Paper 121; Bogor, Indonesia: Center for International Forestry Research (CIFOR), 2013. Available online: http://www.cifor.org/online-library/browse/view-publication/publication/4278.html (accessed on 9 May 2014).
- Robert M. Groves, Floyd J. Fowler Jr., Mick P. Couper, James M. Lepkowski, Eleanor Singer, and Roger Tourangeau. Survey Methodology. Hokoken: John Wiley & Sons, 2009. [Google Scholar]
- Ralph R. Frerichs, and Khin Tar Tar. “Computer-assisted rapid surveys in developing countries.” Public Health Reports 104 (1989): 14–23. [Google Scholar] [PubMed]
- Peter Byass, Sennen Hounton, Moctar Ouédraogo, Henri Somé, Ibrahima Diallo, Edward Fottrell, Axel Emmelin, and Nicolas Meda. “Direct data capture using hand-held computers in rural Burkina Faso: Experiences, benefits and lessons learnt.” Tropical Medicine & International Health 13 (2008): 25–30. [Google Scholar]
- David M. Aanensen, Derek M. Huntley, Edward J. Feil, and Brian G. Spratt. “EpiCollect: Linking smartphones to web applications for epidemiology, ecology and community data collection.” PloS One 4 (2009): e6968. [Google Scholar] [CrossRef] [PubMed]
- Jonathan D. King, Joy Buolamwini, Elizabeth A. Cromwell, Andrew Panfel, Tesfaye Teferi, Mulat Zerihun, Berhanu Melak, Jessica Watson, Zerihun Tadesse, Danielle Vienneau, and et al. “A novel electronic data collection system for large-scale surveys of neglected tropical diseases.” PloS One 8 (2013): e74570. [Google Scholar] [CrossRef] [PubMed]
- TabbleDabble. “About.” Available online: http://www.tabbledabble.com/about/ (accessed on 9 May 2014).
- World Bank. “Purchasing power parity (PPP) conversion factor.” Available online: http://wdi.worldbank.org/table/4.16 (accessed on 9 May 2014).
- Stephen T. Garnett, Liana N. Joseph, James E.M. Watson, and Kerstin K. Zander. “Investing in threatened species conservation: Does corruption outweigh purchasing power? ” PloS One 6 (2011): e22749. [Google Scholar] [CrossRef] [PubMed]
- Ashley McCrea-Strub, Dirk Zeller, Ussif Rashid Sumaila, Jay Nelson, Andrew Balmford, and Daniel Pauly. “Understanding the cost of establishing marine protected areas.” Marine Policy 35 (2011): 1–9. [Google Scholar] [CrossRef]
- Shuyi Zhang, Qiong Wu, Michelle HMMT van Velthoven, Li Chen, Josip Car, Igor Rudan, Yanfeng Zhang, Ye Li, and Robert W. Scherpbier. “Smartphone versus pen-and-paper data collection of infant feeding practices in rural China.” Journal of Medical Internet Research 14 (2012): e119. [Google Scholar] [CrossRef] [PubMed]
- Chad J. Gwaltney, Alan L. Shields, and Saul Shiffman. “Equivalence of electronic and paper-and-pencil administration of patient-reported outcome measures: A meta-analytic review.” Value in Health 11 (2008): 322–33. [Google Scholar] [CrossRef] [PubMed]
© 2014 by the author; licensee MDPI, Basel, Switzerland. This article is an open access article distributed under the terms and conditions of the Creative Commons Attribution license (http://creativecommons.org/licenses/by/3.0/).


