2. On the Concept of Competitiveness
In its definition on competitiveness, the WEF mentions institutions, policies and factors. The concept of institutions is interpreted in a broad sense: it refers to the legal and administrative framework in which individuals, enterprises and governments interact in the course of wealth production. New institutional economics interprets the concept of institution as a set of norms which aims at directing individual actions in a certain way. An institution may be formal or informal but we generally include laws and contracts or tools that ensure the realisation of norms. In new institutional economics, the transaction costs are of great significance, and the limited access to information by actors is a fundamental condition [
2]. The overall institutional setup greatly determines the conditions to develop and maintain competition in the markets [
3].
Regarding continental European economic thought, the Freiburg school has thoroughly examined and described the concept and optimal conditions of competition. In this theoretical context, the greatest enemy is dominant position [
4], implying that industrialisation in itself endangers freedom of market actors as it results in the concentration of economic power. It is state competition policy that has to keep uneven market positions within limits. So, freedom and the competitive institutional order serve one another [
5]. In the WEF’s model, an institutional framework is constituted by a number of elements including, among others, the government’s attitude to market economy, transparency, prudency of public spending, the level of bureaucracy or corruption—the latter two obviously appear as costs for a national economy. These are classical Coase-type transaction costs [
6]. Nevertheless, such transaction costs are reduced if a workable price system based on complete competition is applied [
7]. Also, the regulator should strive for resisting the pressure on behalf of special interest groups that aim at capturing the regulator in order to realise the monopolist’s profit, or divide welfare surplus in some other way but this is definitely less effective than a market mechanism [
8]. The most successful institutional set-ups are those that guarantee such an unbiased state resistant to rent-seekers’ pressure at the constitutional level [
9].
The WEF interprets the concept of policies rather broadly as well since all replies to upcoming economic challenges are to be included. Moreover, these measures and actions are assessed in light of the actual global environment, in comparison to the most competitive countries who dictate the pace in global competition. Hereby we approach the effect of policies from the regulatory function of the state as we share the fundamental conviction of regulatory economics that, “in a market economy, economic regulation is substantially realised through market regulation” ([
10], p. 14). Therefore, effective market regulation should cover, among others, the encouraging and strengthening of competition, the elimination of barriers to entry to the extent possible, the creation of uniform, privilege-free and just conditions for competing actors, and fostering economically optimal risk-taking.
Perhaps the element of the WEF definition that is of greatest relevance for us in relation to the competitiveness of the European economic and social model is the group of factors determining productivity. Classical economics defines three factors of production: capital, labour, and land (or area where economic activities take place) [
11]. Nevertheless, the classical model gives a more or less exact description of the economic order of 19th century capitalism but, in the course of the 20th century, and especially in its second half, the basic economic order underwent major changes. Two interrelated factors appear as individual factors of production; one of them is technology that acts as a factor of production independent of capital and labour (and, many times, of area as well). The other one is knowledge, a factor that is special in many aspects [
12]. As the relevance of technology and knowledge in productivity and thus in competitiveness is greater than ever [
13], let us examine them in more detail, in light of our main research scope.
Solow was the first to reveal that, besides capital and labour, something more is influencing the production function. He called it “technical change” and used this expression to describe “any kind of shift in the production function” ([
14], p. 312). The function that he set up was the following:
Solow was awarded the Nobel Prize in Economic Sciences in 1987 “for his contribution to the theory of economic growth”. As we are in search of potential sources of growth for the European economy, his thoughts are relevant to us, perhaps more than ever before. In his Nobel Prize lecture, Solow emphasised that the greatest advancement since his famous 1957 article was the dissolution of “technical change” to its elements. Accordingly, two parts of this third factor of production can be identified: human capital, and technological change in its narrowest sense. Solow said that “work along these lines might eventually tell us something interesting and useful about the role of knowledge in the economy and society. We have always realized that there is an important endogenous element in the development of new technology; all those businesses investing millions in research are not suffering from a mass delusion.” [
15]
The other Nobel Prize laureate emphasising the importance of human capital in economic performance was Theodore Schultz. In his view, skills and knowledge should be handled as a form of capital and thus investment is needed to develop human capital [
16]. In his Nobel Prize lecture delivered in 1979, Schultz emphasised that, in economic science, land was overrated while the quality of human agents was underrated. In order to achieve development, quality of the population has to be improved. The way to such improvement is mainly through investment in education. Schultz quoted Marshall by saying that “We in the high income countries have forgotten the wisdom of Alfred Marshall, when he wrote, ‘Knowledge is the most powerful engine of production; it enables us to subdue Nature and satisfy our wants’ [
17].”
Neither economic theory, nor applied economic policy should underestimate the importance of the human factor in productivity or the general success of any economic and social model. We hereby highlight the major characteristics of knowledge that should influence our general view of economics and the economy itself:
- -
On one hand, knowledge is capital in the sense that it appears as a certain stock. Moreover, it amortises in time.
- -
On the other hand, knowledge adheres to the labour force or, rather, the human resource as it only works as a factor of production if it is utilised. And, knowledge is only utilisable if it is acquired and applied by humans.
All this implies that, in order to maintain and/or develop competitiveness, the knowledge capital base of an economy has to be developed and continuously maintained [
18]. Therefore, in the modern global economic environment, education serves as the facilitator of an exceptionally important factor of production.
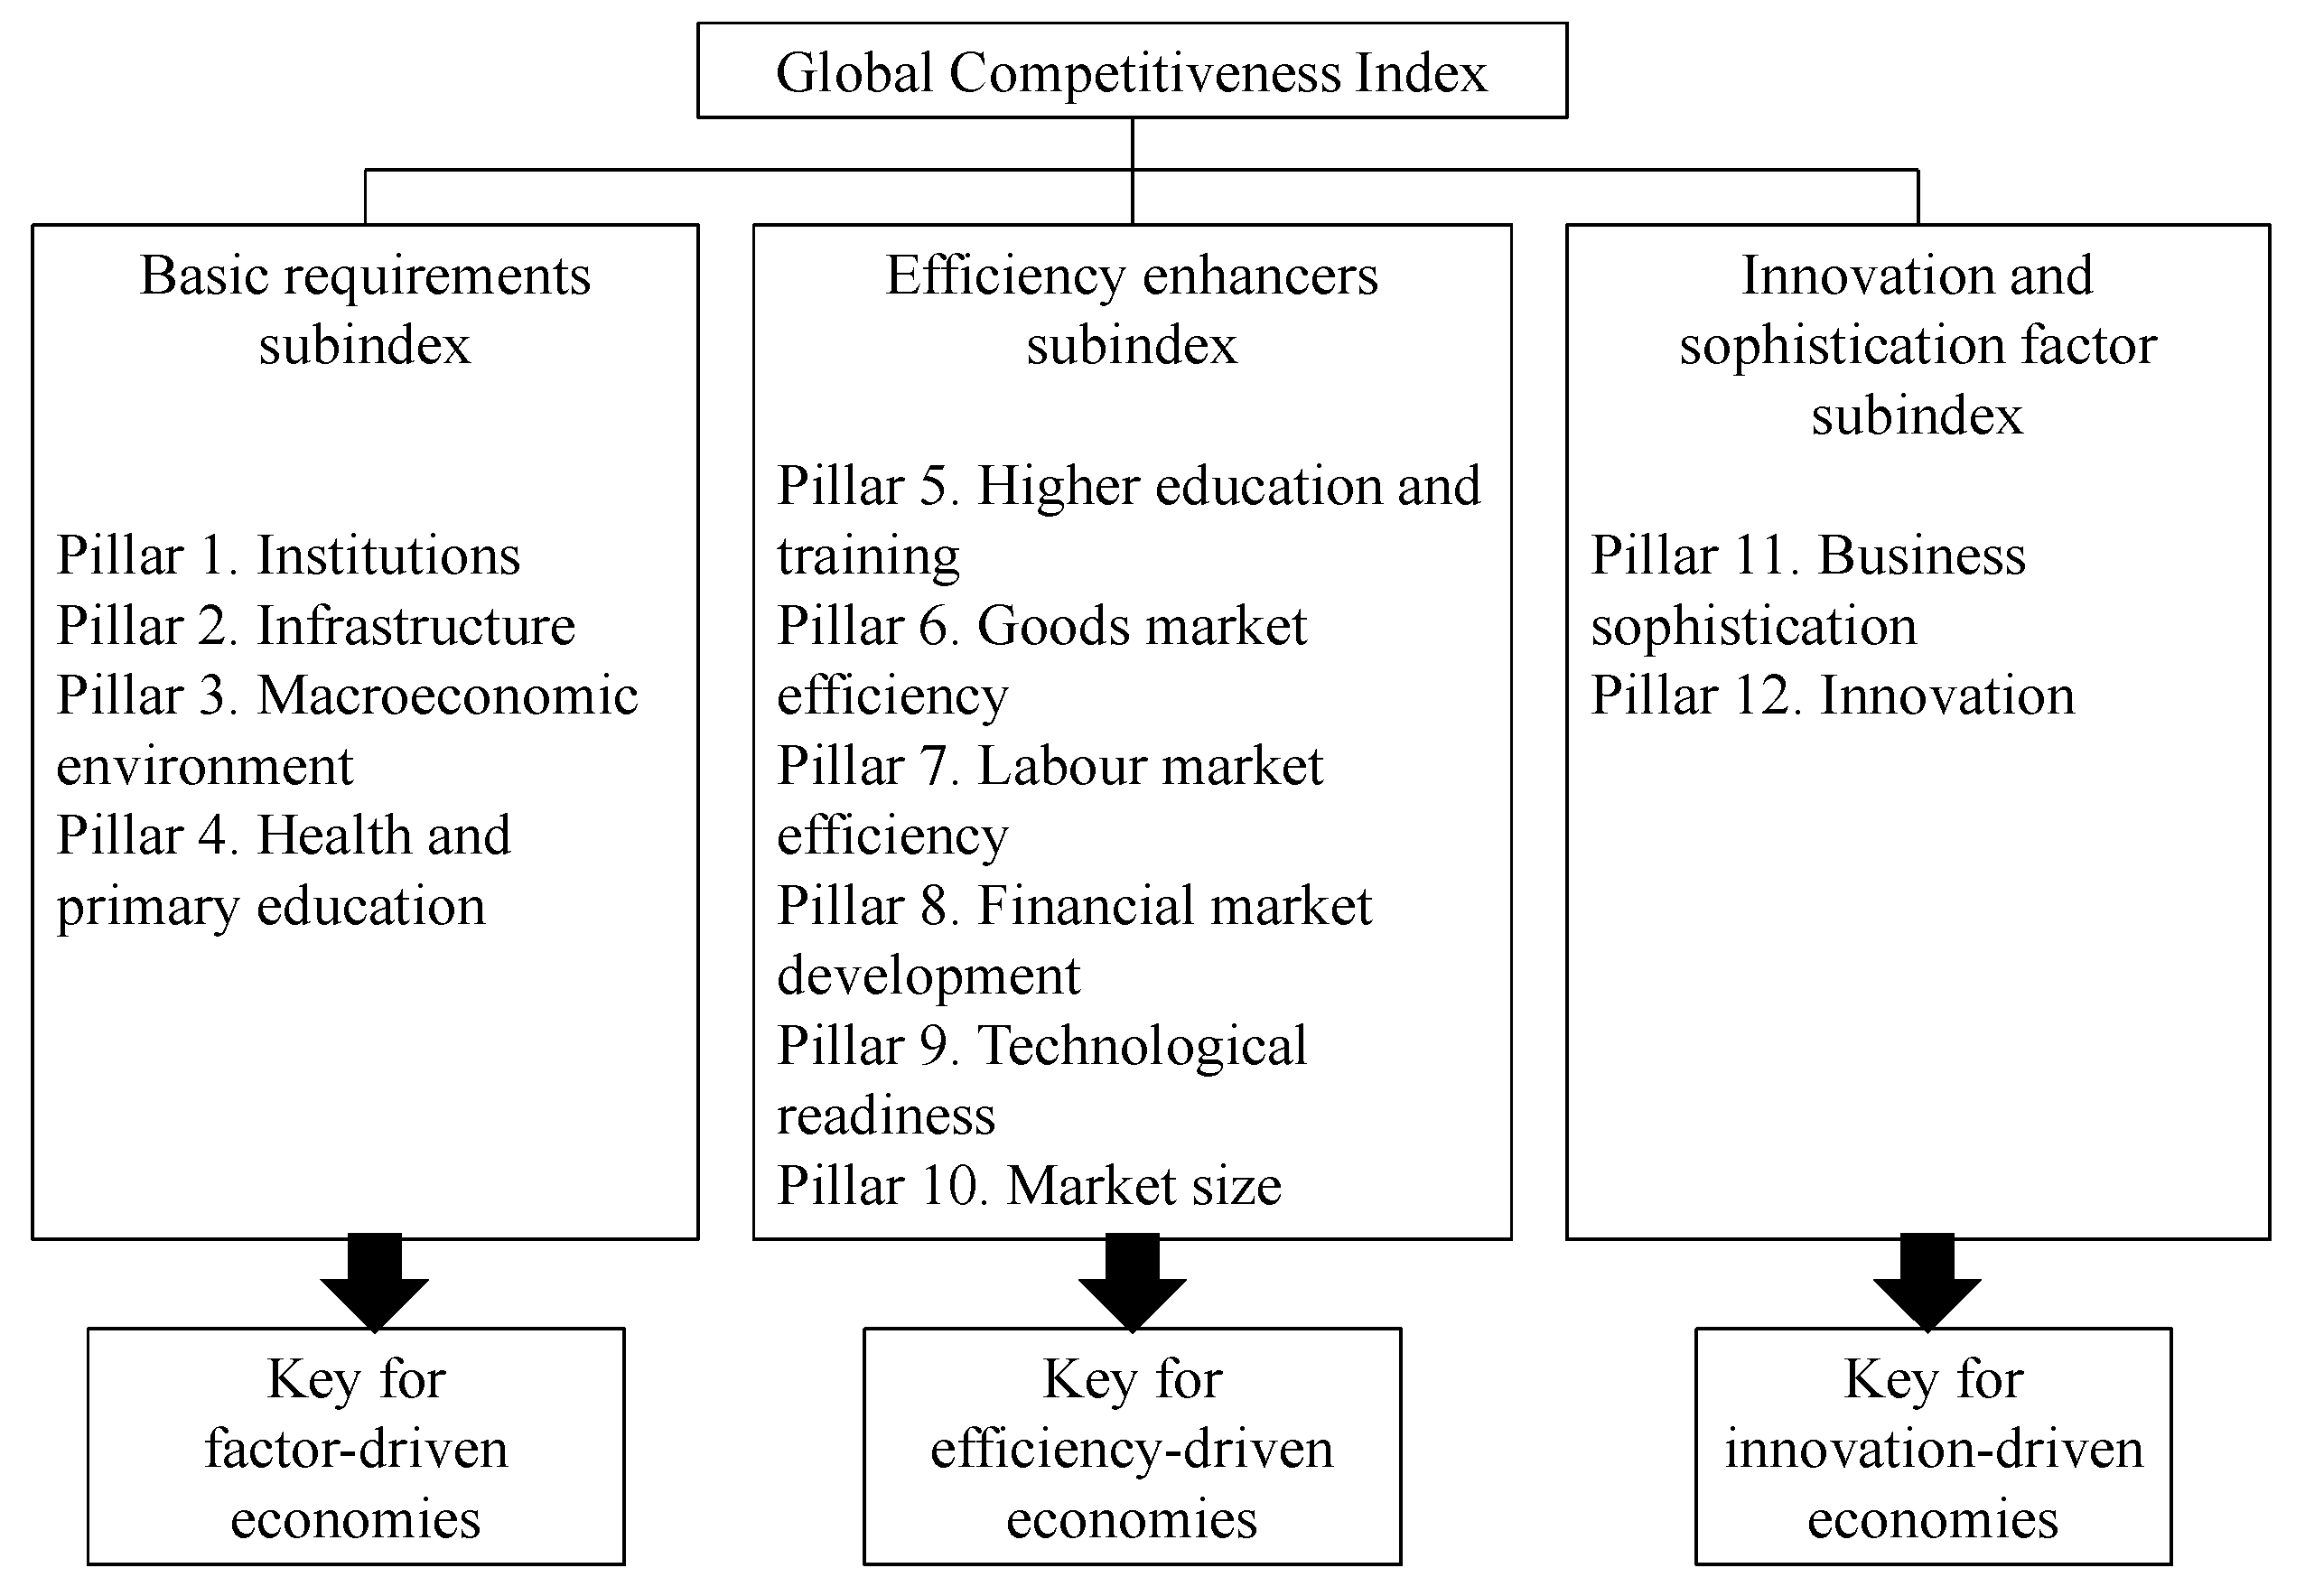
According to the methodology applied by the WEF, national competitiveness relies on a few fundamental pillars (
Figure 1). The twelve pillars demonstrate a certain order of development and, at the same time, indicate the levels of development: the first four pillars support the so-called factor-driven economies; pillars 5 to 10 contribute to the development of efficiency-driven economies while, relying on pillars 11 and 12, national economies can reach the level to become innovation-driven economies. Education appears in two pillars: already at the level of factor-driven economies, the proper functioning of a basic educational system is inevitable while higher education serves as an entry to the group of efficiency-driven economies.
If a society moves upwards on the ladder of educatedness, it creates possibilities to develop according to the following logic:
- -
As the members of a better educated society are able to produce higher added value (
i.e., they are either at the top or moving up the global value chain), both households and enterprises will be able to attain higher income.
1- -
Educatedness creates demand for various cultural products and services (e.g., books, theatre performances, arts exhibitions). In other words, a better educated society can efficiently generate demand in the market of such products and services. To phrase it in an extreme way, educated people create markets for each others’ knowledge and skills which, in the larger context, brings about the development of the tertiary sector, the one that produces the highest added value. In the medium and long term, these processes can easily induce an upward spiral in social and economic development.
- -
As higher levels of education result in higher disposable income levels, demand for other products and services will also increase. Moreover, much of these additional incomes is likely to be spent in more environmentally sustainable ways, especially through the increasing demand for higher quality in general, a consequence that better educatedness also brings with itself. This aspect may give a further impetus to the upward spiral of development.
Figure 1.
The Global Competitiveness Index framework.
Figure 1.
The Global Competitiveness Index framework.
Numerous scientific works (e.g., [
19,
20,
21]) have proved that, with higher levels of education, the general health condition and life expectancy of individuals considerably improve. Such improvements do not only have a direct positive impact on national competitiveness but also contribute to the better sustainability of social security systems, which gives a further impetus to the improvement of national competitiveness.
All in all, higher levels of educatedness in a society results in higher living standards and not only in materialistic terms: both the quality of life and the individual prospects for the members of the society are enhanced by education.
3. European Competitiveness
Firstly, we take a look at EU-level competitiveness. The European Commission’s latest thorough report on European competitiveness dedicates special attention to the EU’s participation in global value chains [
22]; in this sense, the spirit of the report is progressive: it analyses the European economy’s more and more integrated participation in the global economy, and gives sound policy implications on how to handle uncertainties in the global (external) conditions for European economic activities. On the other hand, the report handles the global embeddedness of the European economy much more as a given circumstance than a platform for possible improvement, e.g., by the support of business start-ups or the development of local or virtual economic ecosystems. Although there is a chapter on clusters and networks, its approach is not outstandingly innovative (
i.e., earlier policy approach continues to dominate the recommendations), and its findings are not connected to global value chains in any way, except for the policy recommendation that “support for networks of SMEs active in areas with positive externalities, such as innovation and exporting to new markets” ([
22], p. 182)—not specified in any larger details.
Nevertheless, in our view, the largest weakness of the Commission’s competitiveness report is that it does not count the risks lying in the internal imbalances of the EU’s single market. In fact, the thorough report builds exclusively on aggregated EU-27 data ([
22], pp. 217–28). Accordingly, the report does not provide any policy implications on how to cope with these challenges. According to our viewpoint, such imbalances, if not targeted appropriately by EU-level policies, may easily undermine European competitiveness in the longer run. Therefore, we now turn our attention to the differences in the competitiveness of EU member states. We will see that member states in this respect are highly heterogeneous.
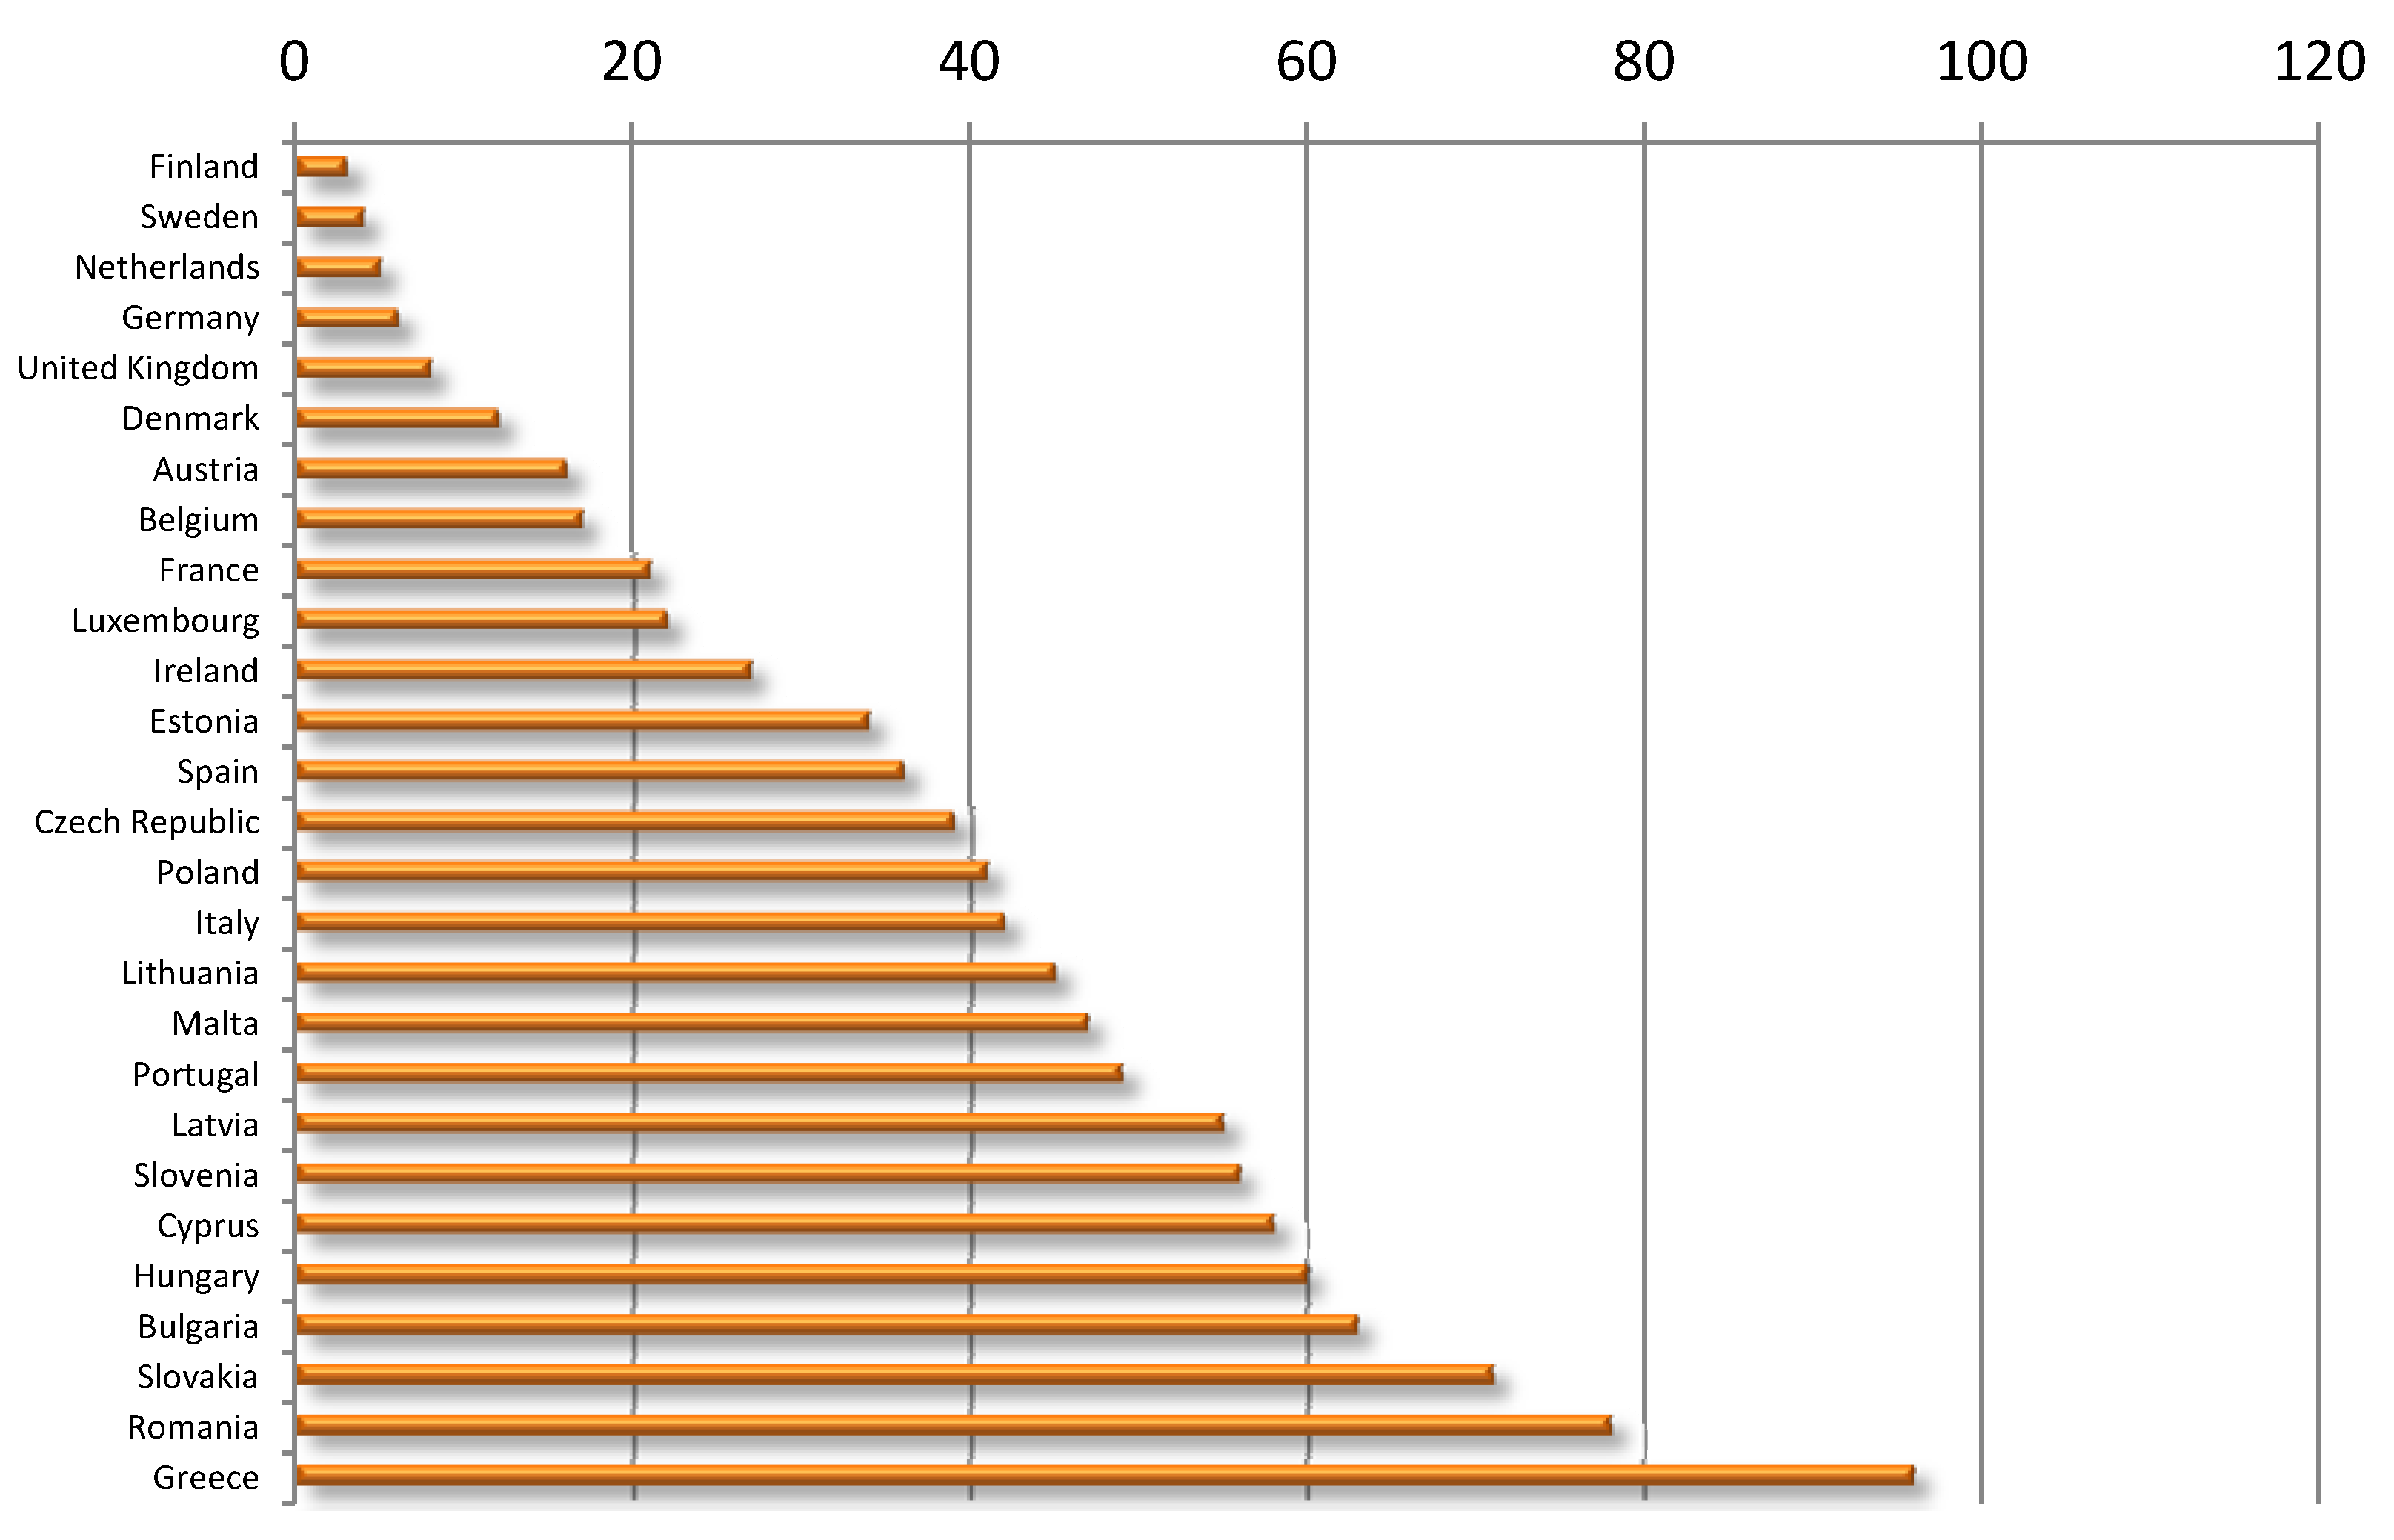
In the latest global competitiveness list of the WEF, EU member states are spread between Rank 2 (Finland) and Rank 96 (Greece). This means that the 27 countries take positions among 95 countries of the world; the large dispersion is evident (
Figure 2). Perhaps interestingly, within this wide range, the EU member states are distributed more or less evenly although Greece has by now obviously left the group (Greece ranked only 90 in the previous list). Eliminating Greece from the list (that we consider a singular case), there is a middle range of member states (from Estonia to Portugal) where the best performing new member states (Estonia, Czech Republic, Poland, Lithuania) and the worst performing old member states (Spain, Italy, Portugal) merge. This latter group is at the same time the most problematic part of the Eurozone, outside Greece, of course.
Figure 2.
Global Competitiveness Report 2012–2013 overall rank of EU member states.
Figure 2.
Global Competitiveness Report 2012–2013 overall rank of EU member states.
Own edition based on [
1].
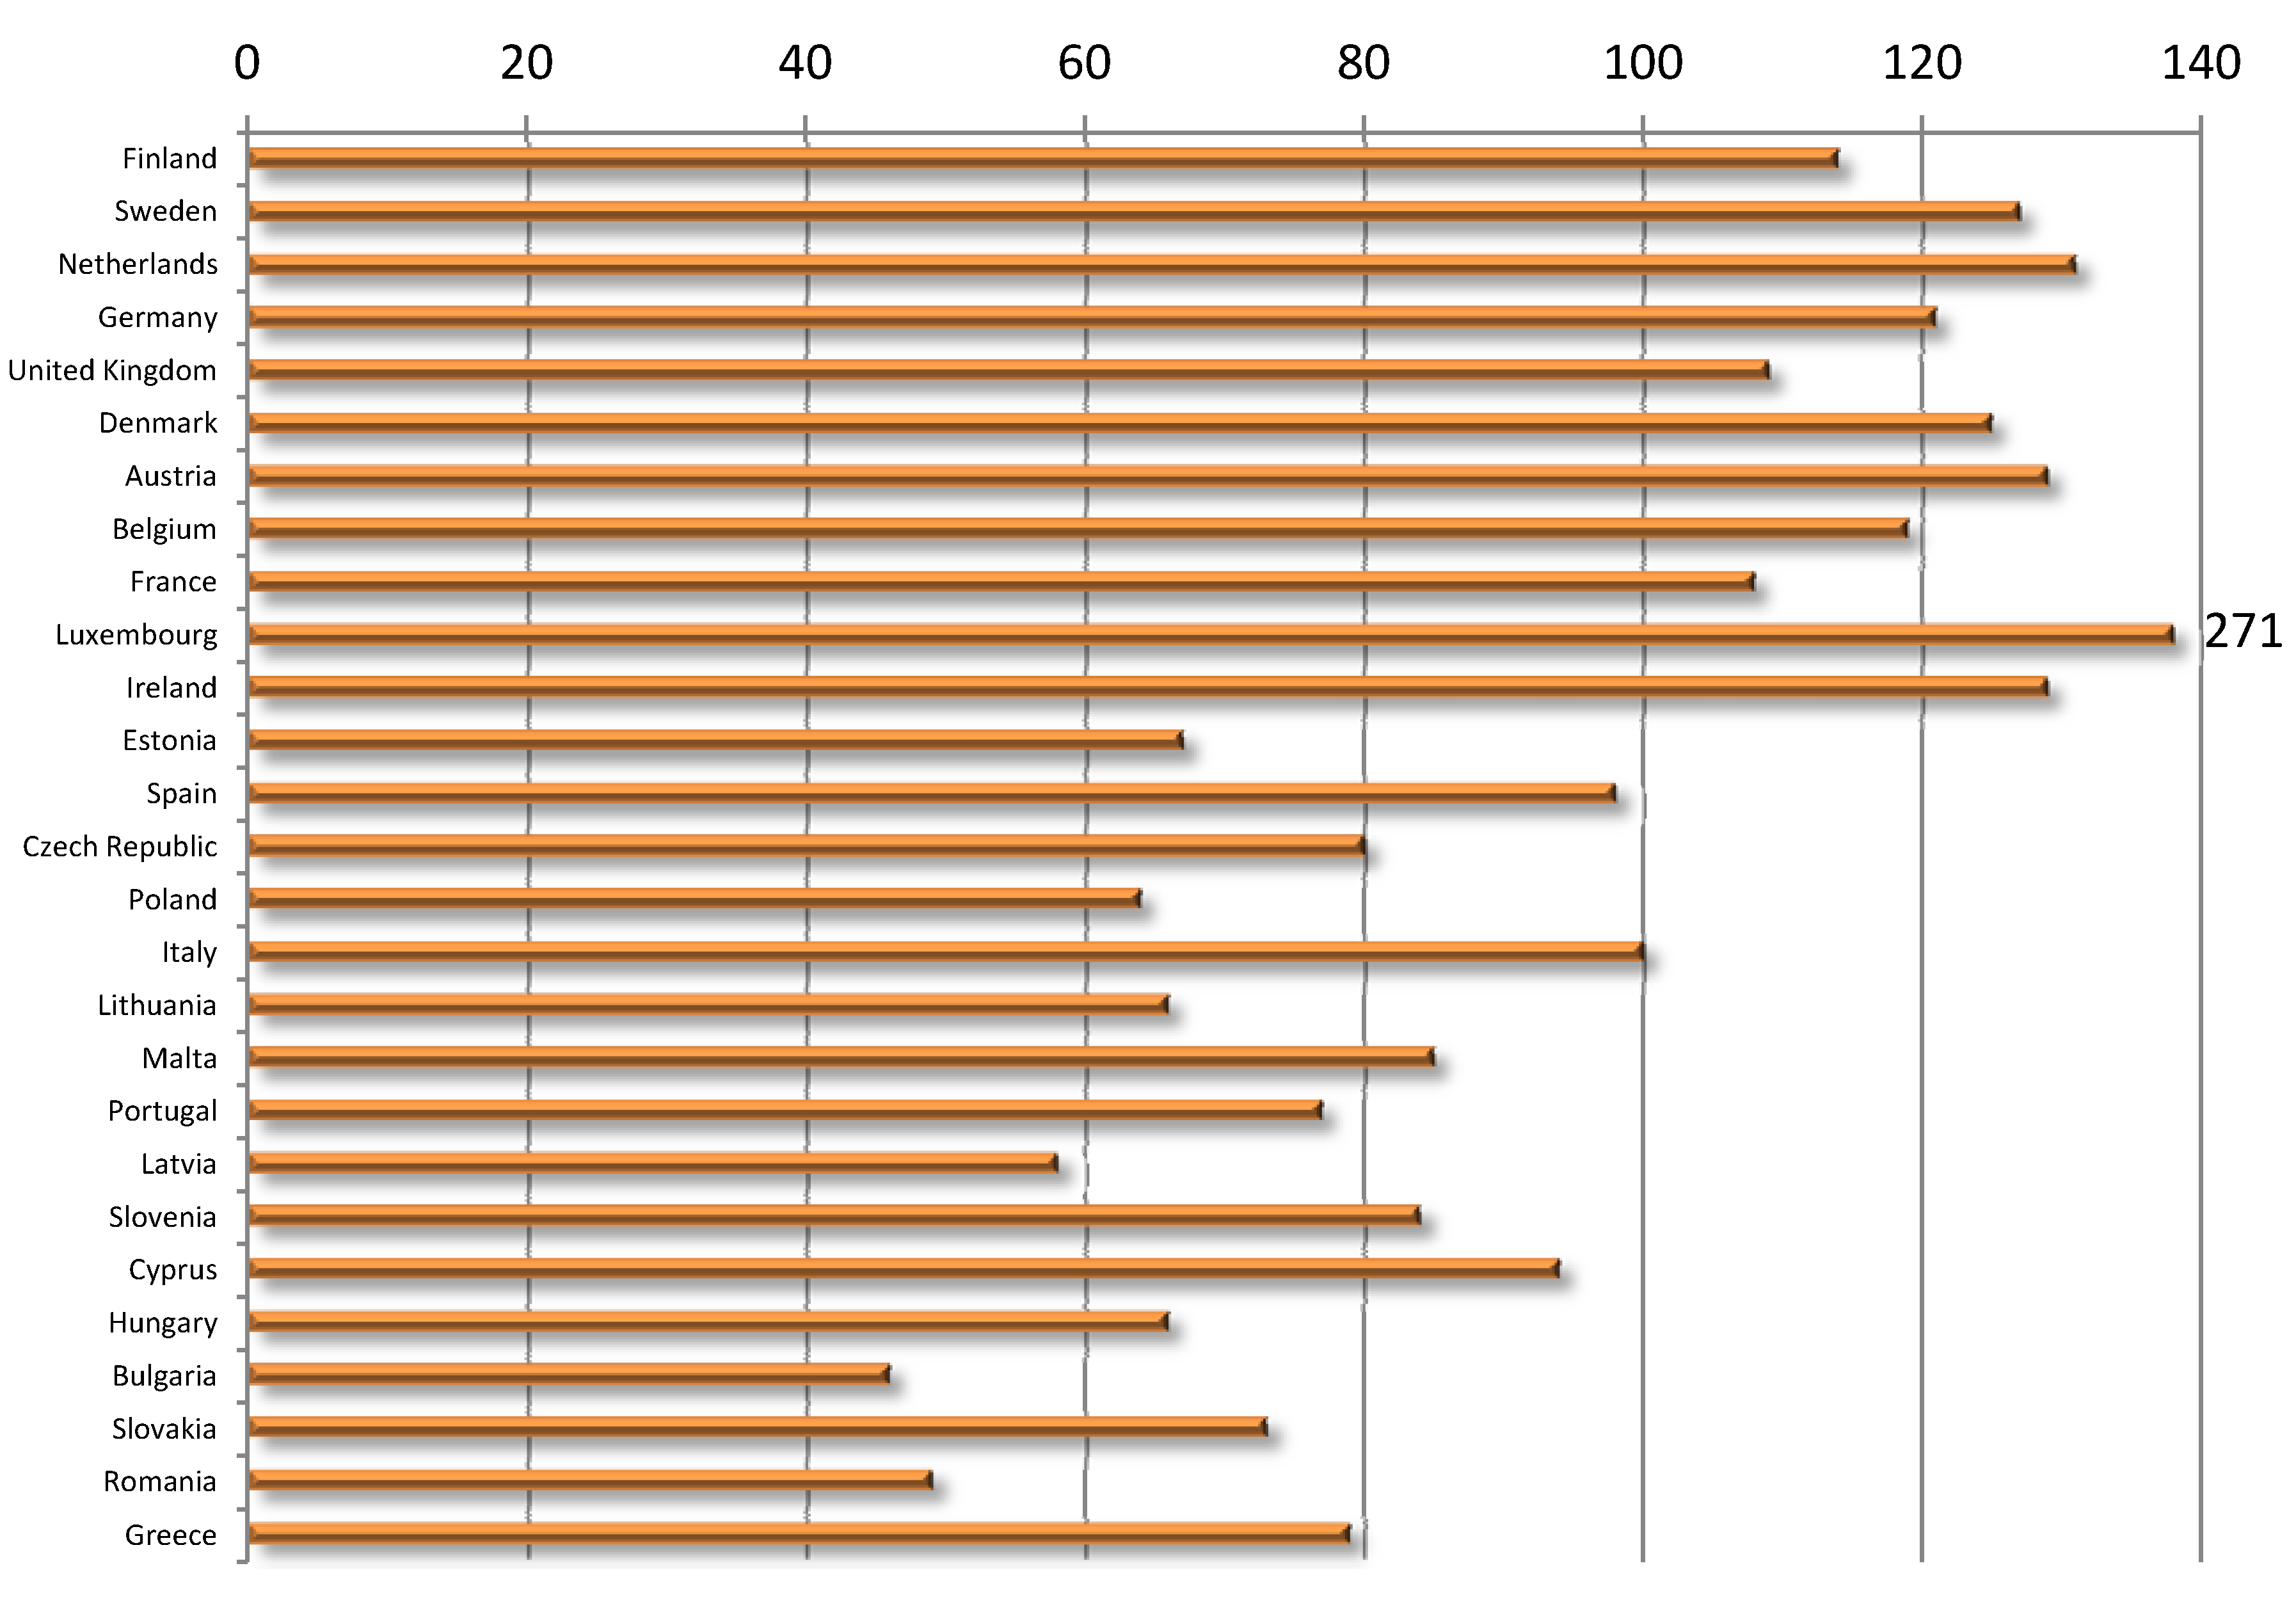
At the level of certain sub-indicators, the dispersion is even larger; e.g., Greece ranks 111 regarding institutions, and ranks 144 regarding macroeconomic environment (of the 144 countries examined by the WEF). Romania and Bulgaria, considered as the least developed member states of the EU (
Figure 3), take the positions 78 and 63 in the overall rank respectively (just to be precise, Slovakia is between the two with its position of 73), but both of them rank over 100 regarding institutions: Bulgaria is the 108
th and Romania is the 116
th in this respect [
2].
Figure 3.
GDP per capita in PPS in EU member states, 2011, EU27 = 100 *.
Figure 3.
GDP per capita in PPS in EU member states, 2011, EU27 = 100 *.
* Order of countries according to Global Competitiveness Report 2012–2013 rank. Own edition based on [
23].
On the other hand, the global competitiveness list does not cover social indicators like poverty, social exclusion, or the exposedness to these—if these were not influencing competitiveness. But they do, though not directly. The logic of how social inequalities threaten welfare is best described by Stiglitz [
24]. The greatest threat of inequitable and non-democratic economic growth models resulting in large social disparities is twofold: on one hand, the proportion of social groups in poverty rises, demolishing the long-term potential growth of the economy. Secondly, the growing dissatisfaction of the larger and larger masses of people living in poverty appears as a major risk to the stability and security of the better-off social groups, and thus, undermines the peaceful and fruitful development prospects for the whole society. Even if Stiglitz talks about the global trends and developments, his logic may easily be applied to the EU as well. Up until the unfolding of the 2008 crisis, the social aspects of European development did not show any divergence. However, some of the latest trends are rather worrisome. Of these trends of concern, youth unemployment in the Southern periphery of the Eurozone is perhaps the most striking [
25].
In relation to the social advancements, the European Commission, in the Europe 2020 strategy, was much more explicit than ever before when claiming that growth preferable for Europe does not only have to be intelligent and sustainable, but also inclusive [
26]. There are two numerical objectives regarding social inclusion ([
26], p. 12):
- -
By 2020, the share of early school leavers should be under 10% and at least 40% of 30–34 years old should have completed a tertiary or equivalent education. In this respect, between 2010 and 2012, there has been a slight decrease of 1.2 percentage points, down to 12.8% in 2012 (estimation) [
27].
- -
By 2020, poverty should be reduced by lifting at least 20 million people out of the risk of poverty or social exclusion. In relation to this indicator of the strategy, the latest data available is for 2010: in that year, 116.3 million people were considered to be at risk of poverty or social exclusion [
27].
The Europe 2020 strategy outlines the steps to be taken, thus clearly showing the way for the member states. Proposed actions cover measures to increase levels of employment (including investment in the employability of the population), developing skills (through the school system and lifelong learning schemes), and providing chances for social groups with lower incomes to step to higher levels of life standards. Nevertheless, the most important and effective channel for inclusion is education [
28].
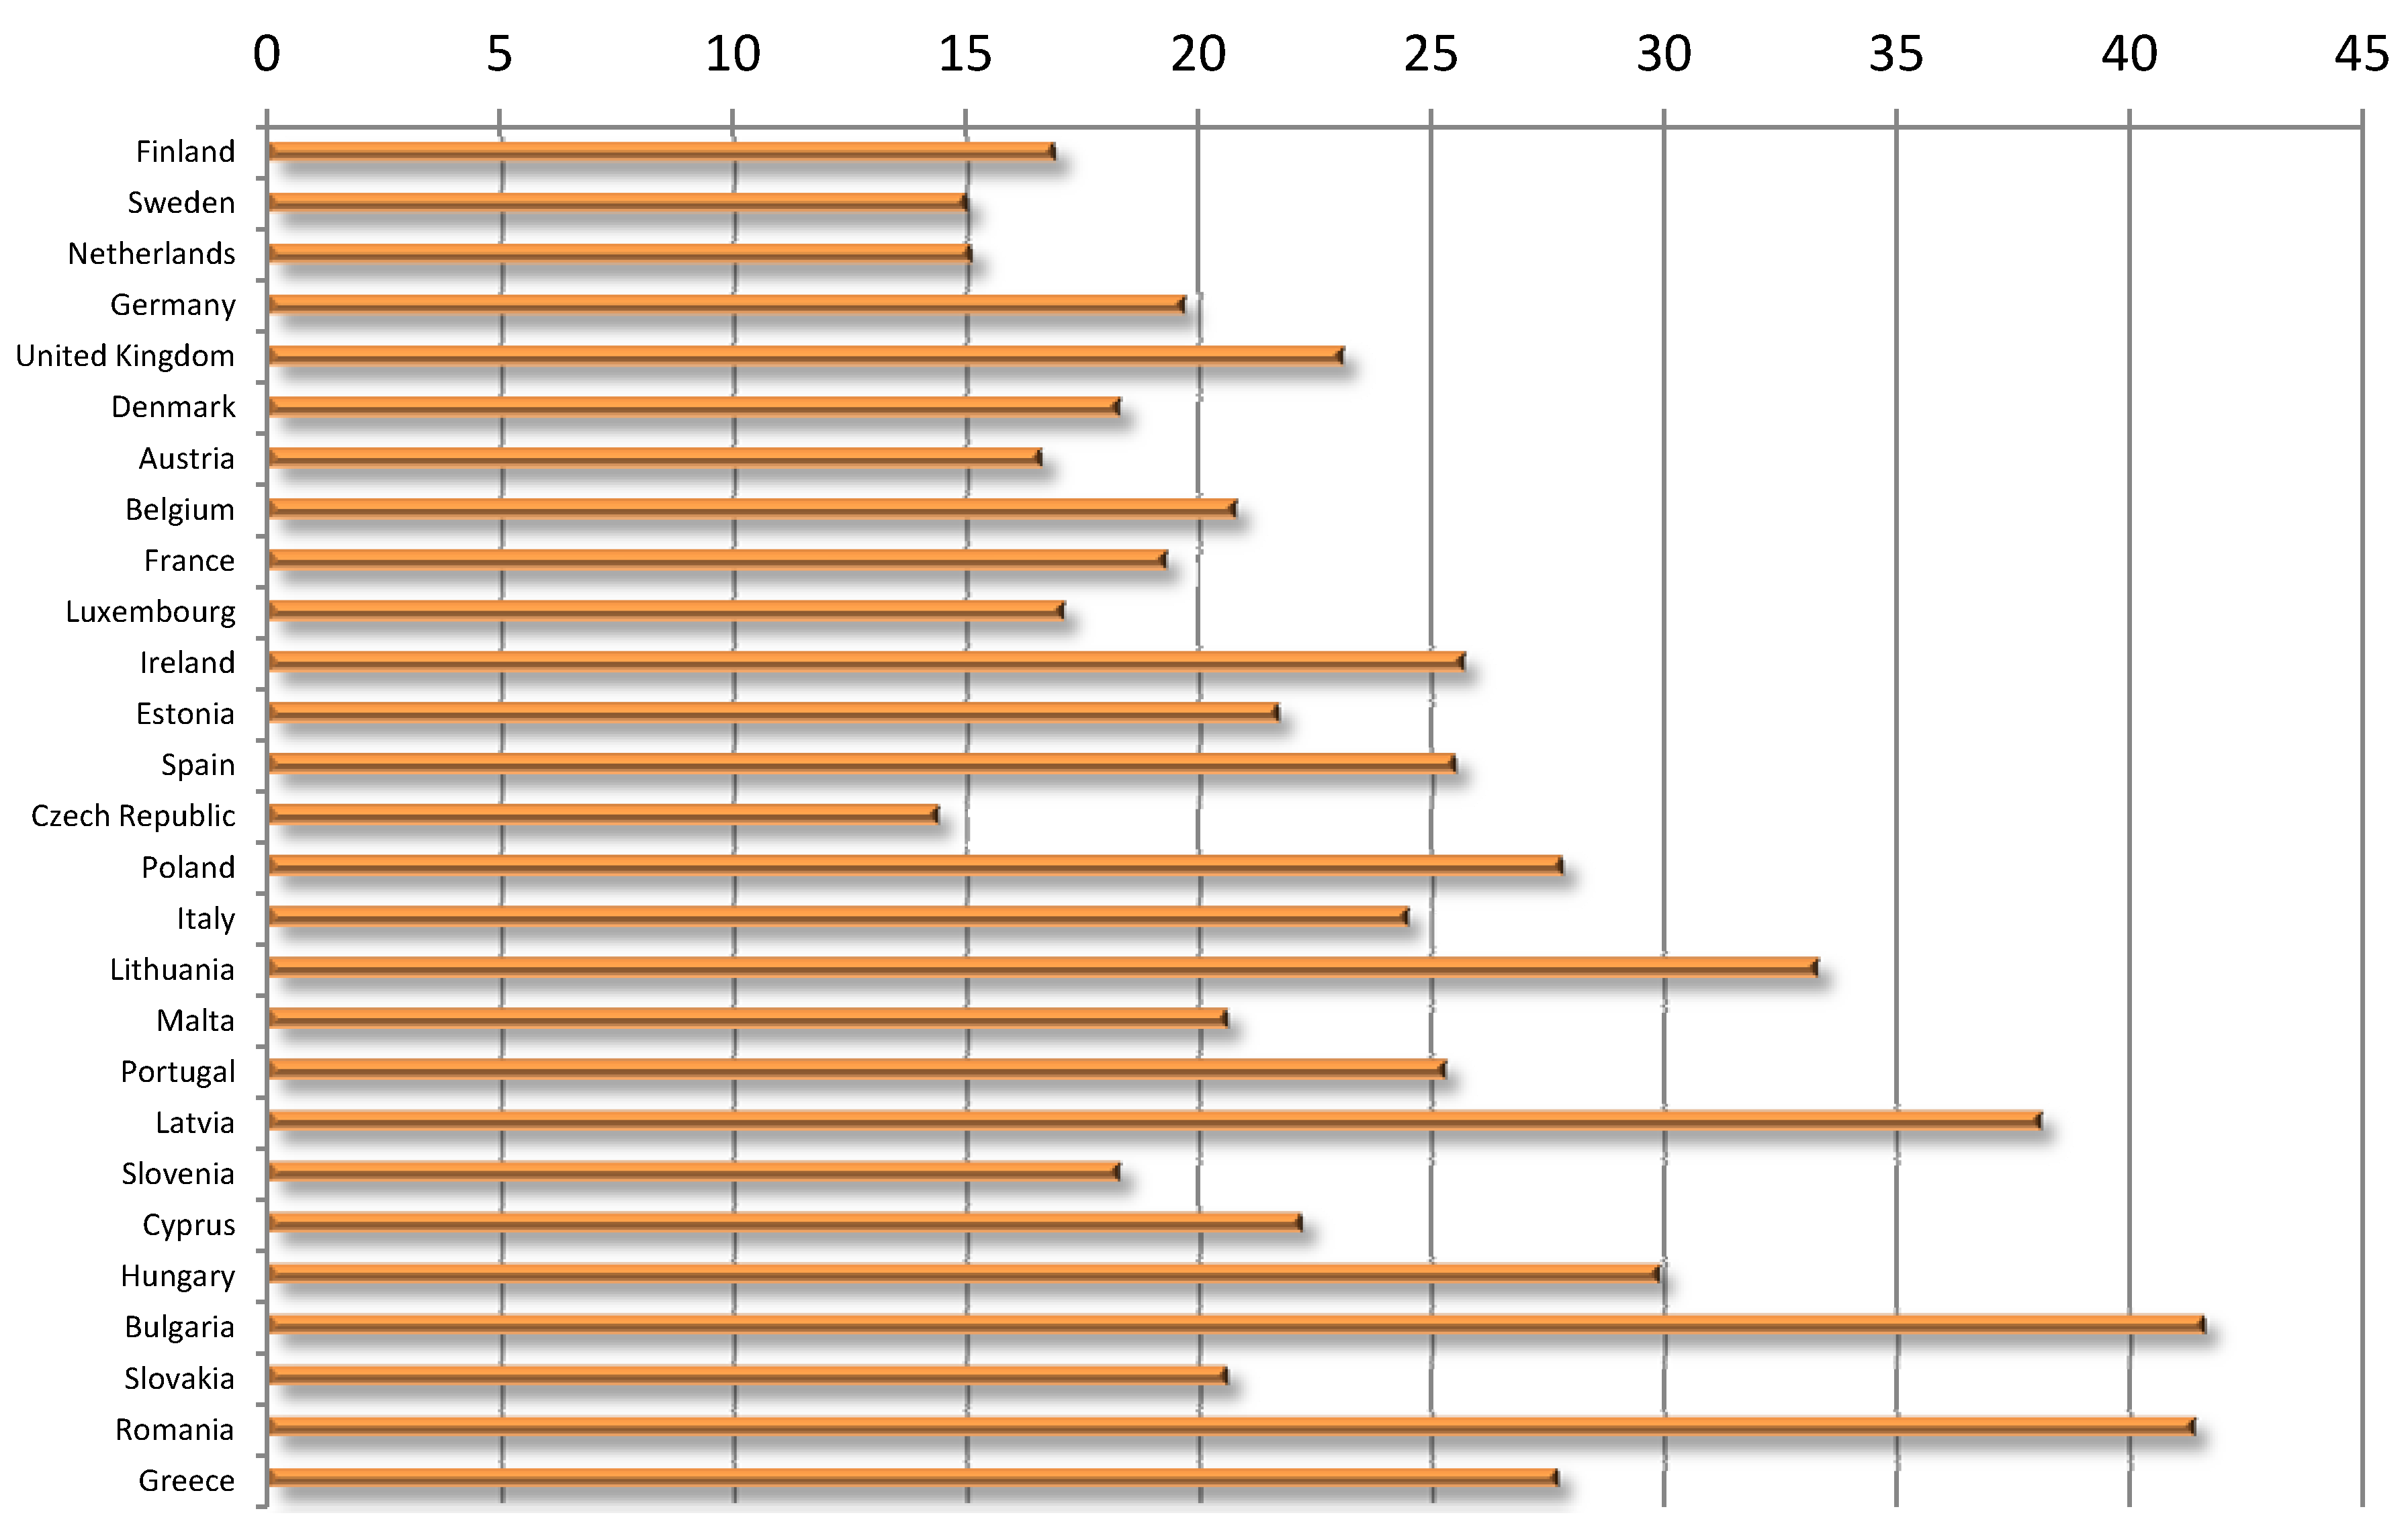
Not surprisingly, in the periphery of the EU, the percentage of people belonging to the socially threatened groups greatly exceeds the respected ratio in the core territories: according to the 2012 Eurostat data (for year 2010), 23.4% of the EU’s population is living in or at risk of poverty and social exclusion [
29]. The EU average is well preceded by Bulgaria (41.6%), Romania (41.4%), Latvia (38.1%), Lithuania (33.4%), and Hungary (29.9%). At the other end of the scale, we find the Czech Republic (14.4%), the Netherlands (15.1%), Sweden (15%), Austria (16.6%), Finland (16.9%) and Luxembourg (17.1%). That is, differences are huge (
Figure 4).
2
Figure 4.
Persons at risk of poverty or social exclusion, 2010, % of total population *.
Figure 4.
Persons at risk of poverty or social exclusion, 2010, % of total population *.
* Order of countries according to Global Competitiveness Report 2012–2013 rank. Own edition based on [
26].
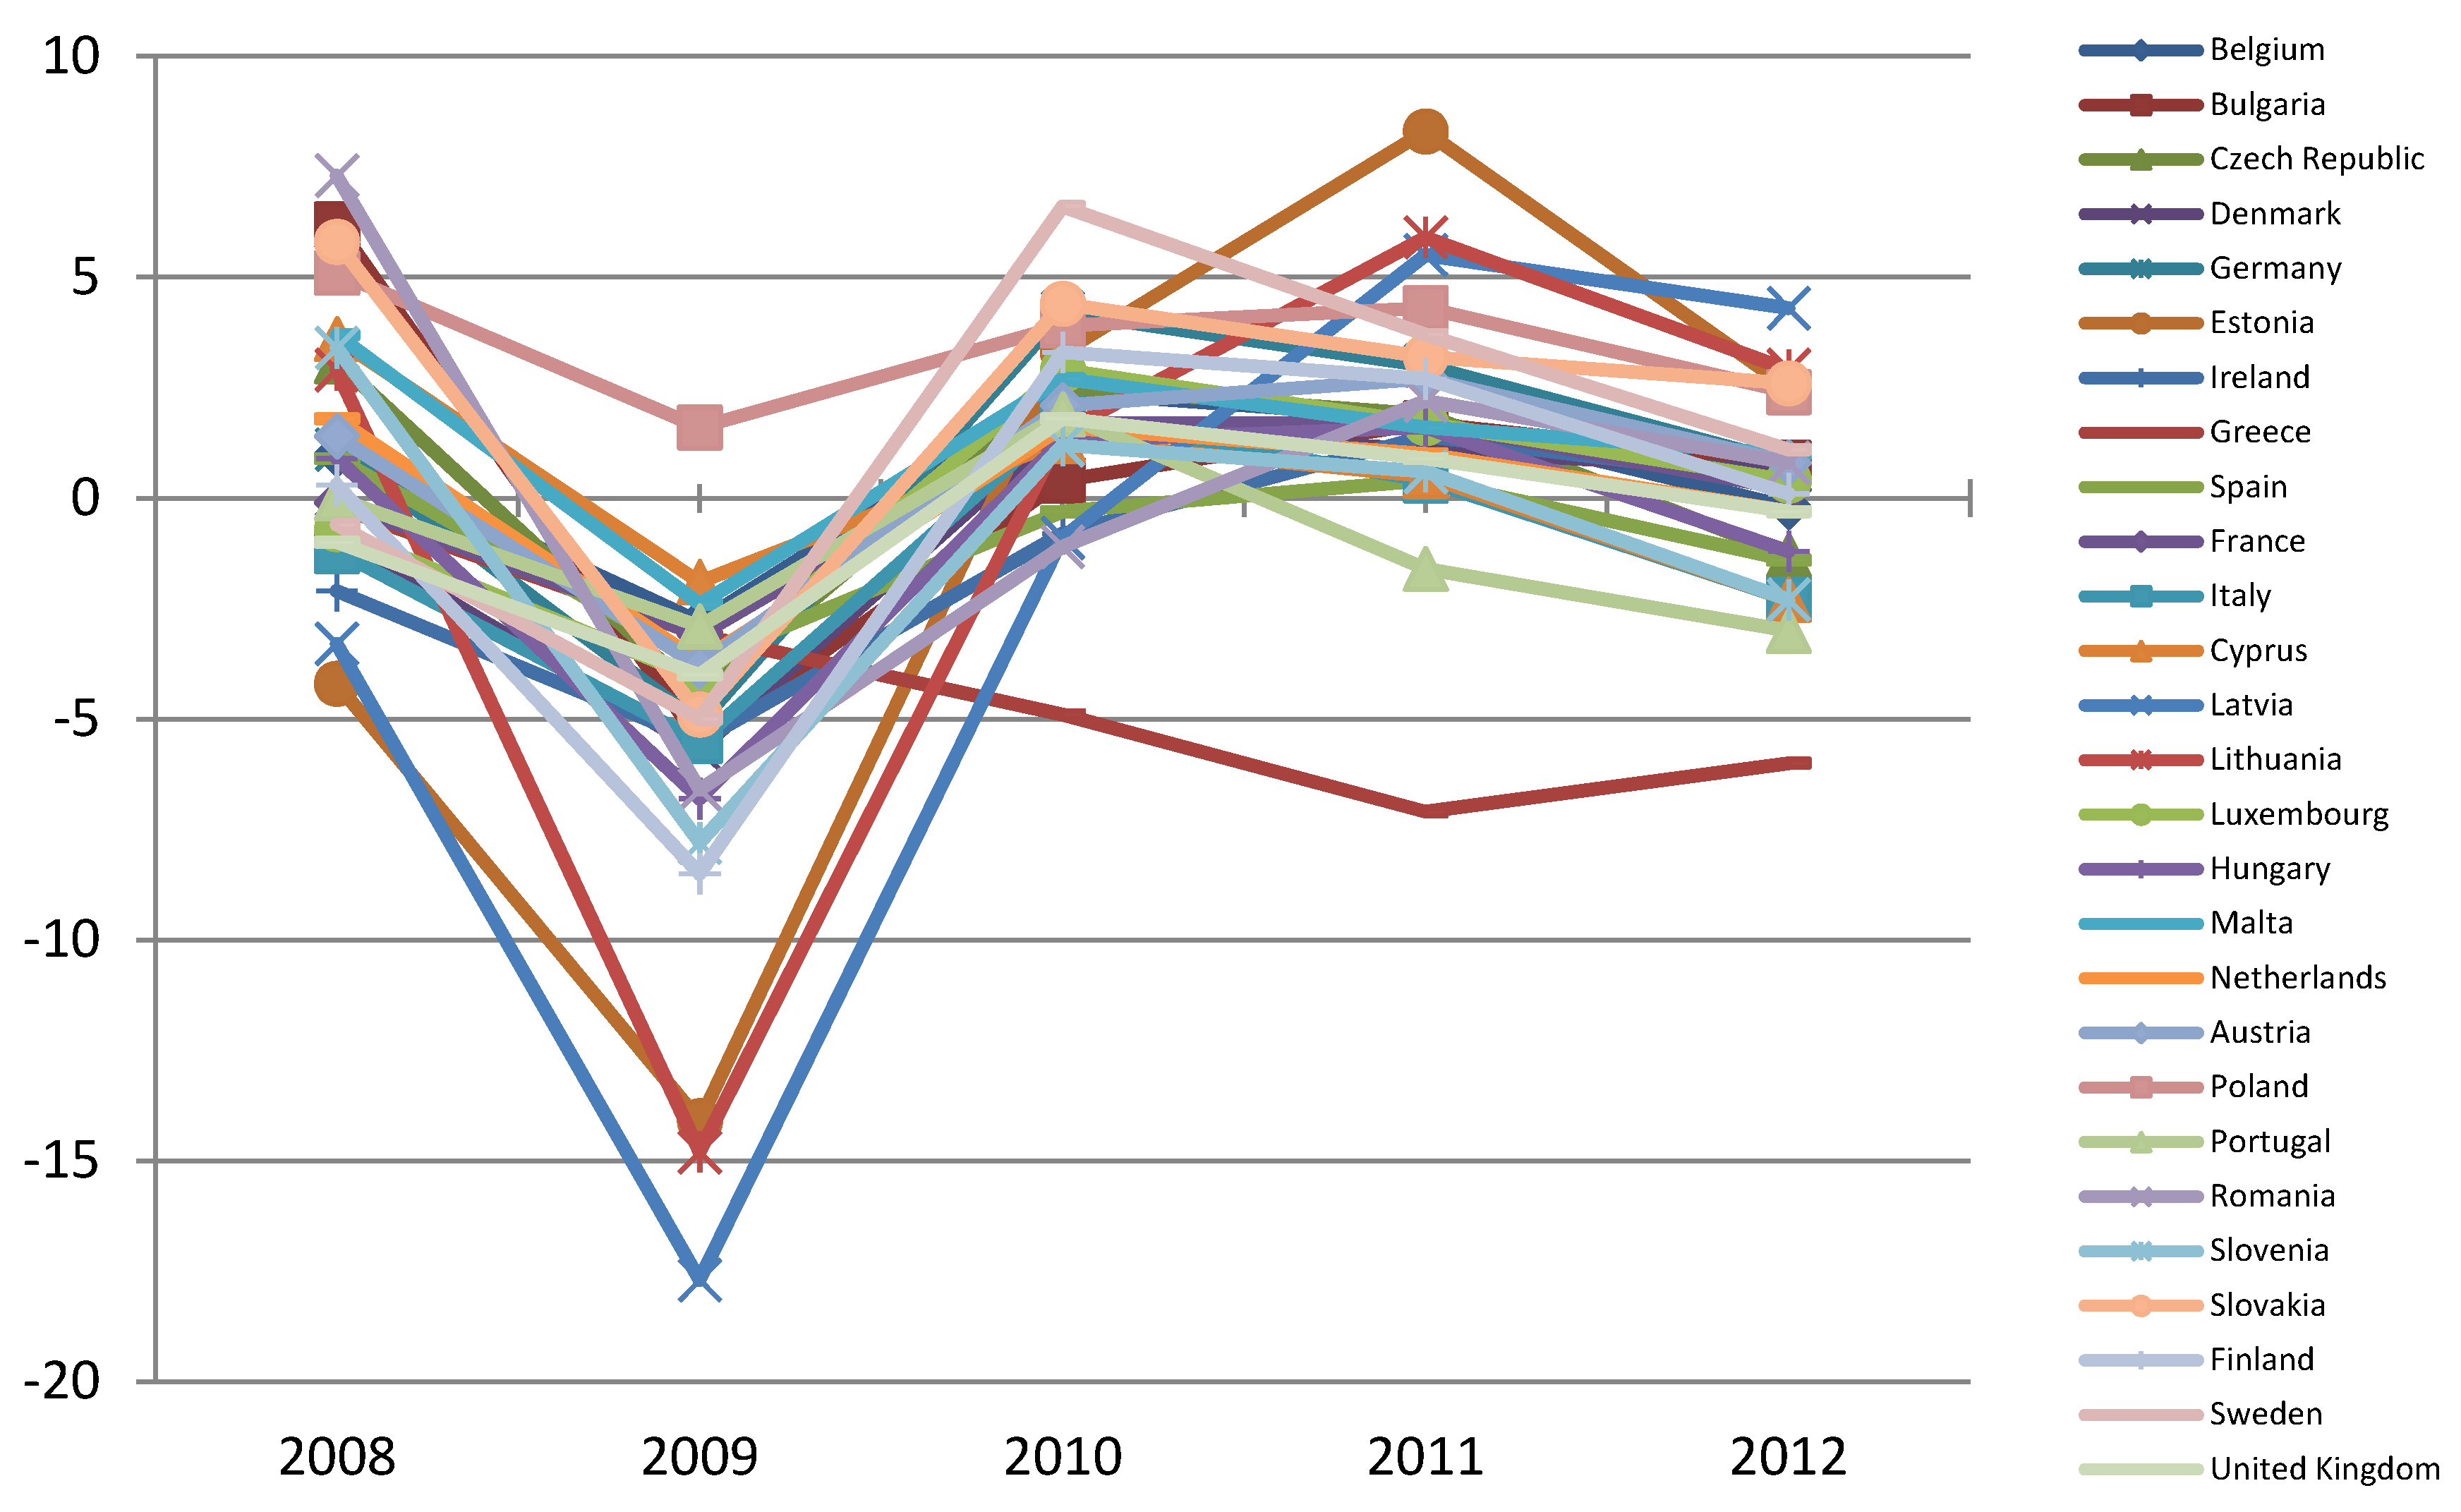
Regarding growth rates of the member states’ economies, the overall picture is rather similar to that of the social development: the periphery of the Eurozone has to face the gloomiest prospects while the North of the EU (including some new member states) is recovering from the crisis (
Table 1 and
Figure 5, just as
Table 2 and
Figure 6, are manifestations of the same data).
Figure 5.
Real GDP growth rate of EU member states, 2008–2012 *, percentage change on previous year.
Figure 5.
Real GDP growth rate of EU member states, 2008–2012 *, percentage change on previous year.
* 2012: estimates. Own edition based on [
30].
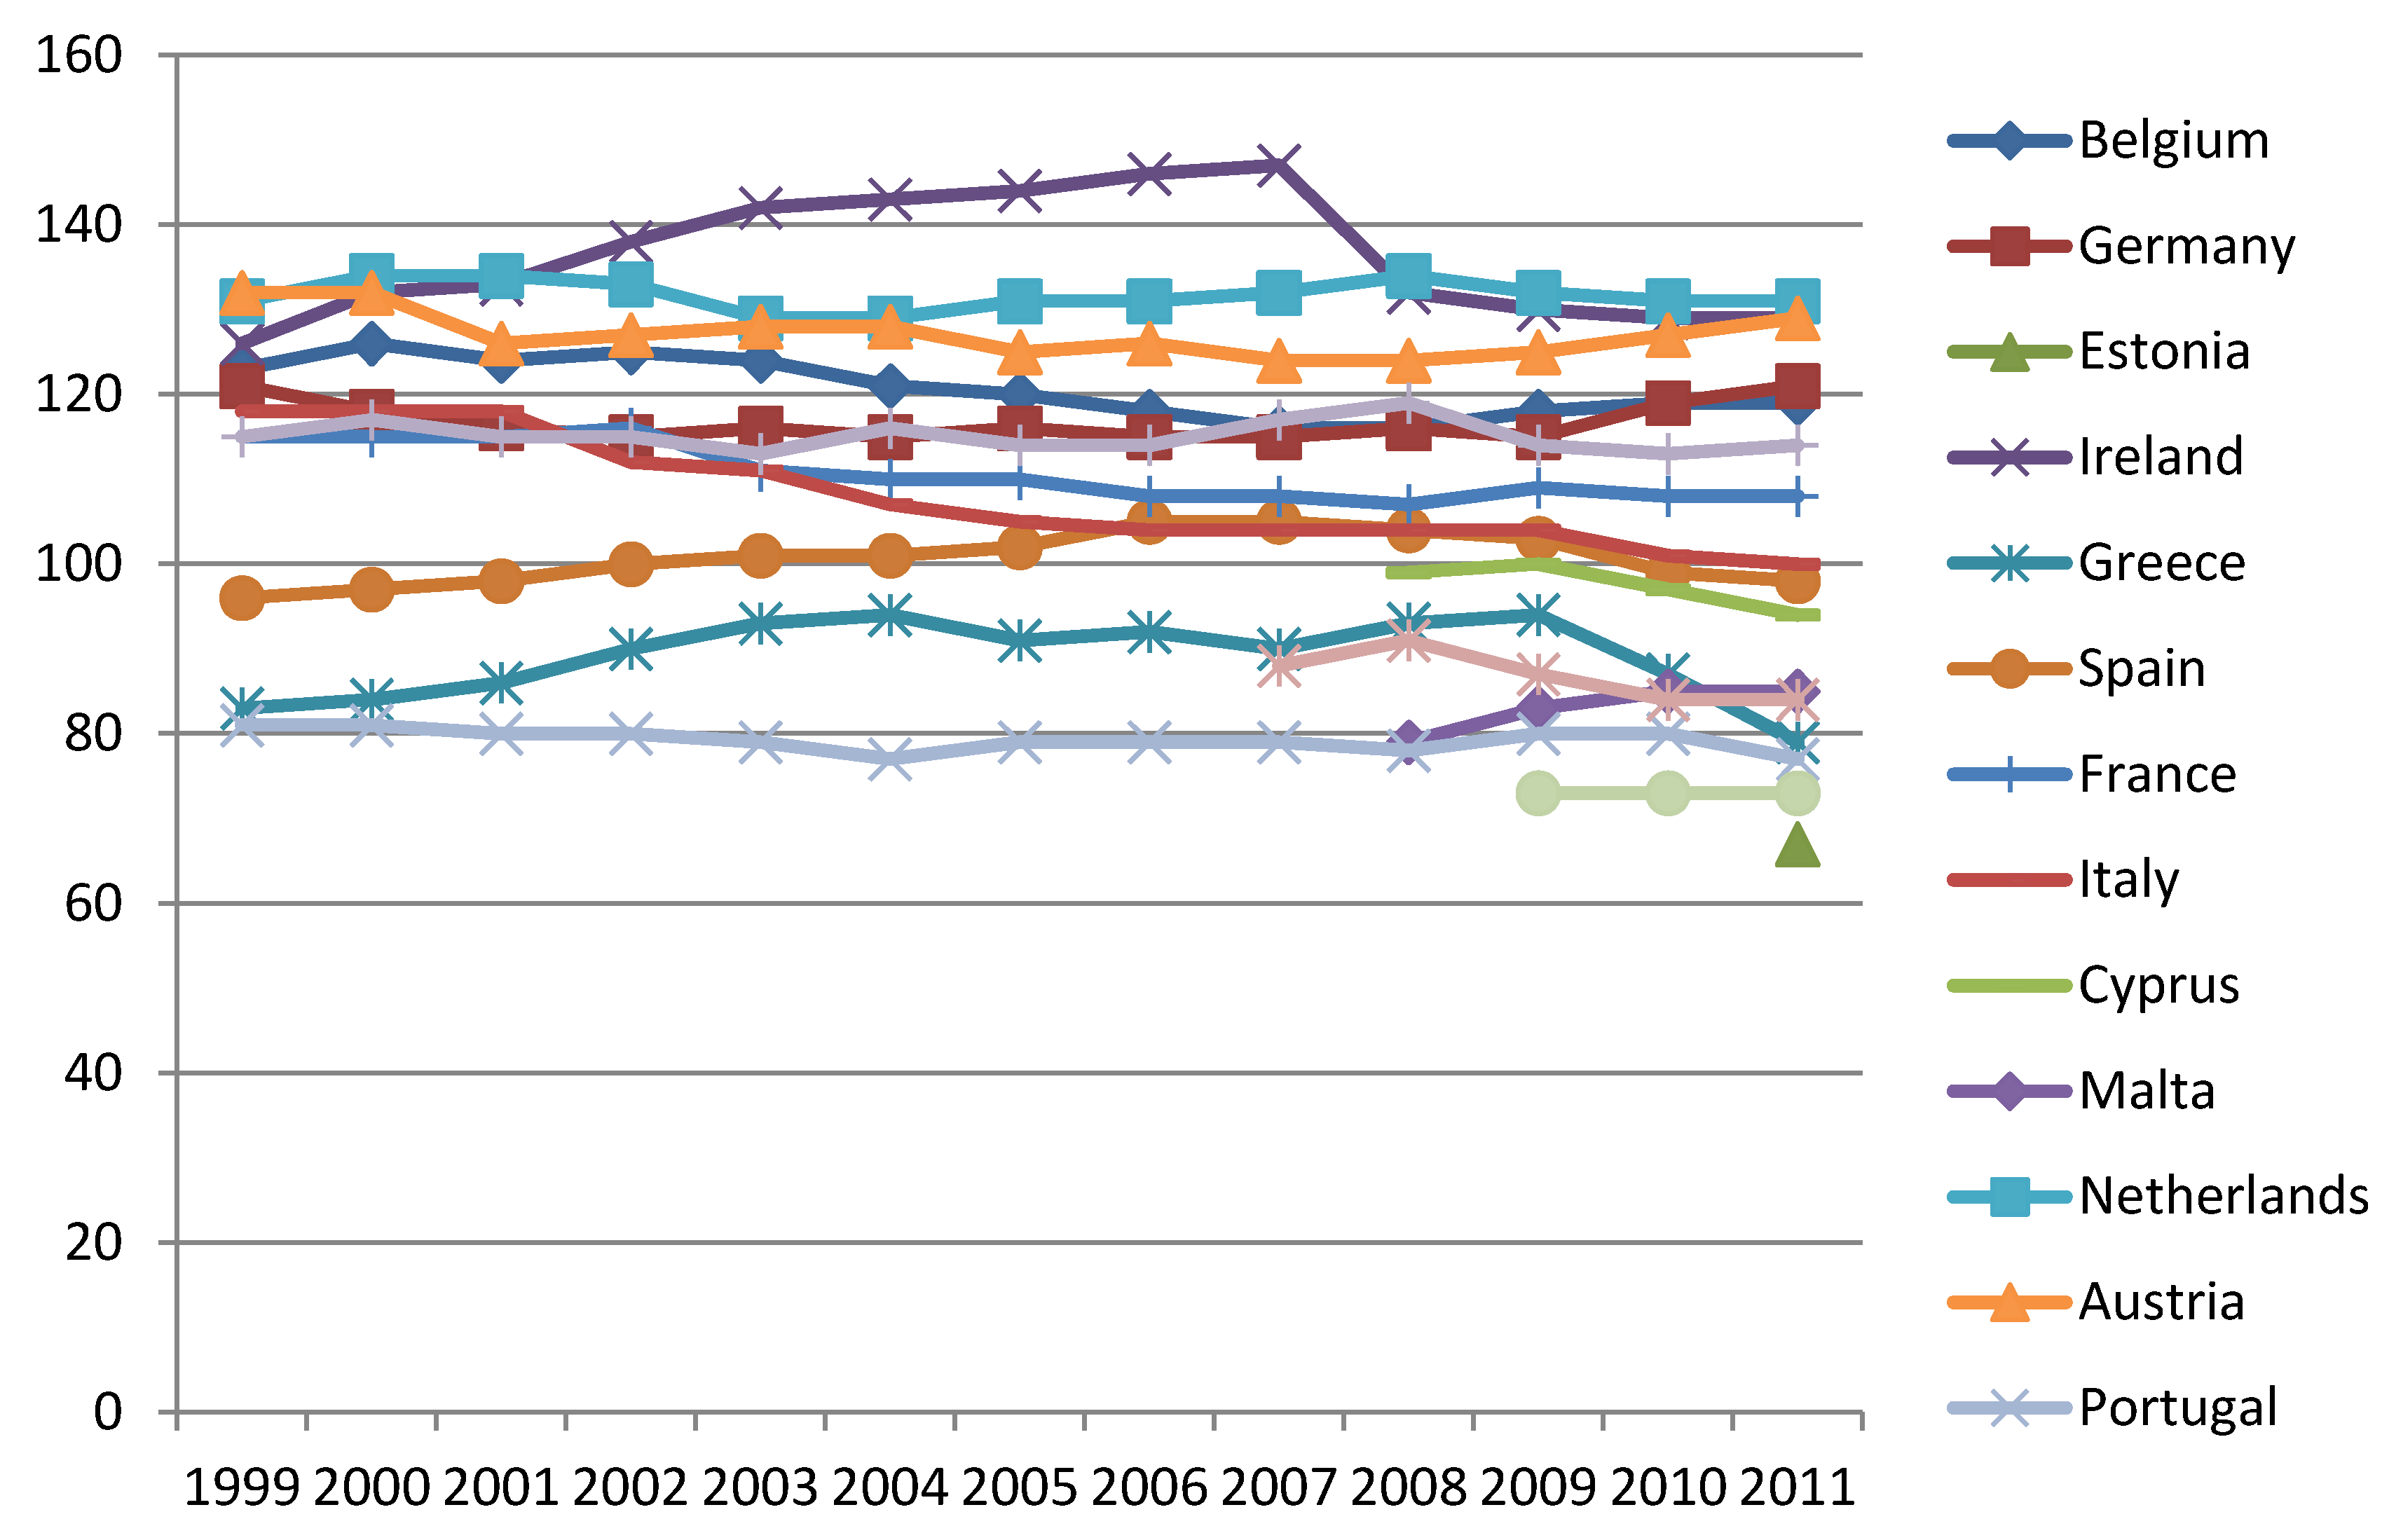
Figure 6.
GDP per capita in PPS of Eurozone countries, 1999–2011 *, EU27 = 100.
Figure 6.
GDP per capita in PPS of Eurozone countries, 1999–2011 *, EU27 = 100.
* Only for years of Eurozone membership. Own edition based on [
23].
Table 1.
Real GDP growth rate, percentage change on previous year *.
Table 1.
Real GDP growth rate, percentage change on previous year *.
| | 2008 | 2009 | 2010 | 2011 | 2012 |
|---|
| Finland | 0,3 | −8,5 | 3,3 | 2,7 | 0,1 |
| Sweden | −0,6 | −5 | 6,6 | 3,7 | 1,1 |
| Netherlands | 1,8 | −3,7 | 1,6 | 1 | −0,3 |
| Germany | 1,1 | −5,1 | 4,2 | 3 | 0,8 |
| United Kingdom | −1 | −4 | 1,8 | 0,9 | −0,3 |
| Denmark | −0,8 | −5,7 | 1,6 | 1,1 | 0,6 |
| Austria | 1,4 | −3,8 | 2,1 | 2,7 | 0,8 |
| Belgium | 1 | −2,8 | 2,4 | 1,8 | −0,2 |
| France | −0,1 | −3,1 | 1,7 | 1,7 | 0,2 |
| Luxembourg | −0,7 | −4,1 | 2,9 | 1,7 | 0,4 |
| Ireland | −2,1 | −5,5 | −0,8 | 1,4 | 0,4 |
| Estonia | −4,2 | −14,1 | 3,3 | 8,3 | 2,5 |
| Spain | 0,9 | −3,7 | −0,3 | 0,4 | −1,4 |
| Czech Republic | 3,1 | −4,5 | 2,5 | 1,9 | −1,3 |
| Poland | 5,1 | 1,6 | 3,9 | 4,3 | 2,4 |
| Italy | −1,2 | −5,5 | 1,8 | 0,4 | −2,3 |
| Lithuania | 2,9 | −14,8 | 1,5 | 5,9 | 2,9 |
| Malta | 3,7 | −2,4 | 2,7 | 1,6 | 1 |
| Portugal | 0 | −2,9 | 1,9 | −1,6 | −3 |
| Latvia | −3,3 | −17,7 | −0,9 | 5,5 | 4,3 |
| Slovenia | 3,4 | −7,8 | 1,2 | 0,6 | −2,3 |
| Cyprus | 3,6 | −1,9 | 1,3 | 0,5 | −2,3 |
| Hungary | 0,9 | −6,8 | 1,3 | 1,6 | −1,2 |
| Bulgaria | 6,2 | −5,5 | 0,4 | 1,7 | 0,8 |
| Slovakia | 5,8 | −4,9 | 4,4 | 3,2 | 2,6 |
| Romania | 7,3 | −6,6 | −1,1 | 2,2 | 0,8 |
| Greece | −0,2 | −3,1 | −4,9 | −7,1 | −6 |
Table 2.
GDP per capita in PPS of Eurozone countries, 1999–2011 *, EU27 = 100.
Table 2.
GDP per capita in PPS of Eurozone countries, 1999–2011 *, EU27 = 100.
| | 1999 | 2000 | 2001 | 2002 | 2003 | 2004 | 2005 | 2006 | 2007 | 2008 | 2009 | 2010 | 2011 |
|---|
| Belgium | 123 | 126 | 124 | 125 | 124 | 121 | 120 | 118 | 116 | 116 | 118 | 119 | 119 |
| Germany | 121 | 118 | 116 | 115 | 116 | 115 | 116 | 115 | 115 | 116 | 115 | 119 | 121 |
| Estonia | | | | | | | | | | | | | 67 |
| Ireland | 126 | 132 | 133 | 138 | 142 | 143 | 144 | 146 | 147 | 132 | 130 | 129 | 129 |
| Greece | 83 | 84 | 86 | 90 | 93 | 94 | 91 | 92 | 90 | 93 | 94 | 87 | 79 |
| Spain | 96 | 97 | 98 | 100 | 101 | 101 | 102 | 105 | 105 | 104 | 103 | 99 | 98 |
| France | 115 | 115 | 115 | 116 | 111 | 110 | 110 | 108 | 108 | 107 | 109 | 108 | 108 |
| Italy | 118 | 118 | 118 | 112 | 111 | 107 | 105 | 104 | 104 | 104 | 104 | 101 | 100 |
| Cyprus | | | | | | | | | | 99 | 100 | 97 | 94 |
| Malta | | | | | | | | | | 79 | 83 | 85 | 85 |
| Netherlands | 131 | 134 | 134 | 133 | 129 | 129 | 131 | 131 | 132 | 134 | 132 | 131 | 131 |
| Austria | 132 | 132 | 126 | 127 | 128 | 128 | 125 | 126 | 124 | 124 | 125 | 127 | 129 |
| Portugal | 81 | 81 | 80 | 80 | 79 | 77 | 79 | 79 | 79 | 78 | 80 | 80 | 77 |
| Slovenia | | | | | | | | | 88 | 91 | 87 | 84 | 84 |
| Slovakia | | | | | | | | | | | 73 | 73 | 73 |
| Finland | 115 | 117 | 115 | 115 | 113 | 116 | 114 | 114 | 117 | 119 | 114 | 113 | 114 |
4. Challenges to European Competitiveness
José Manuel Durao Barroso, President of the European Commission, in his speech of 12 September 2012 of historical significance, unambiguously connected growth and competitiveness when saying that “Growth is the lifeblood of our European social market model: it creates jobs and supports our standard of living. But we can only maintain growth if we are more competitive [
31].” Evidently, he meant EU level competitiveness. And, in our view, he was basically right; the question is how to restore growth in the whole of the EU?
As we could see above, quite a number of the member states of the EU, accounting for a considerable proportion of the EU’s aggregated GDP, are scoring high on the WEF list. Then, why would the backlog of the periphery be the problem of the developed countries? Or, to rephrase the question: what do these facts tell us about the whole of European integration? In our subjective viewpoint, the fastest growth of certain member states, accompanied by the stagnation or the backlog of others, tempts the success of the whole integration process substantially, and this split-up will, in the longer run, undermine the position of the developed, seemingly stable at the moment. But how have inequalities developed in the EU which has always been proud of the welfare its member states provide their citizens?
European integration has, from the beginning, ensured free trade among member states, in order to promote their economic development. A series of logical cause-and-consequence helps us admit that this establishment, in case not all member states are at the same level of development, favours the strong as the weak are unable to impose any obstacles to the trade of their competitive products; the latter do not have any regular tools to protect their own markets. That is, the strong have (for decades) been able to raise more advantages for themselves than the weak. It is not by accident that the 1993 EU Summit of Copenhagen, with respect to the possible Eastern enlargement, set the criterion that countries who aspire to access the European Union have to dispose of “the capacity to cope with competitive pressure and market forces within the Union” ([
32], p. 1). We seem to begin to understand the real contents of this criterion only now, including its interpretations for the Eurozone core and periphery relation. In this latter context, there are also aspects of what varieties of capitalism these countries have been showing: while the core member states have been well-performing export-led economies, the periphery has mostly been relying on demand-led growth. Thus, the introduction of the Euro in 1999 has, instead of decreasing differences, contributed to the growth in internal (trade) imbalances of the Eurozone, which could only be addressed successfully by EU-level solidarity [
33]. However, the enlargement process, just as the establishment of the Eurozone is one-way—at least that is what the so far crisis management at the EU level shows.
Of course, the common budget is dedicated to counterweigh these disproportions caused by the single market but the total balance of the EU budget, accounting for just 1 per cent of the EU’s GDP [
34], is clearly insufficient to reach such objectives, even if these financial resources are spent to an optimal extent and with optimal efficiency. Therefore, the periphery might need to look for other sources of growth. We recommend that they concentrate on improving their knowledge base with all possible tools and, preferably, improve their institutional setup. We say this as financial capital to be invested is always looking for good returns so, where there is a good knowledge capital base accompanied by a good institutional environment, financial resources will be available.
So, when the globally outstanding competitiveness of the most developed EU member states is appraised, we must not forget that they have reached such results partially at the expense of the less developed periphery, thus further deepening the already striking differences in the levels of development of member states. This is of course a rather blunt way to say it but, at one point, we must face our problems bluntly. Moreover, the situation is even worse in the case of the countries of the Eurozone periphery who no more dispose of the tool of competitive devaluation of their currencies in order to improve the competitiveness of their products in the internal market. Nonetheless, these countries are struggling with further weaknesses (e.g., historically high levels of rent-seeking at the expense of the labour force) which, if there is strong enough political commitment to fight them, may require further painful and politically definitely unpopular measures to take [
35].
The situation is further aggravated by the huge differences in the initial stage of development among Eurozone member states. Portugal’s and Greece’s GDP per capita accounted for 81 and 84 per cent of the EU average in 2000 respectively while Germany, for example, stood at 118 per cent (
Table 2). And these differences have only grown with the crisis: the respective data are 77 and 79 per cent for Portugal and Greece, and 121 per cent for Germany in 2011. Spain, with a short upgrade followed by a fallback, kept its position slightly below the EU average. The most obvious evidence of this discrepancy is that the two EU member states at the two ends of the World Economic Forum rank (Finland and Greece) both use the Euro.
Analyses (e.g., [
36,
37]) tend to concentrate on the weaknesses of European competitiveness deriving from the periphery but the responsibility of the other group of member states, who usually hold the accuser’s position in the debates, is rarely even mentioned. And what else is this asymmetry showing if not the deficiency in solidarity at the European level.
5. Concluding Thoughts
The major advancements in European integration in the coming years will show the true commitment of the core EU member states to the European idea of solidarity. The slight changes detectable in the crisis management of the ECB (see e.g., [
38]), the setting-up of the EFSF and the ESM (there is a recent study considering possible outcomes: [
39]), the outlining implementation of the plans to create a banking union [
40], and the latest steps towards the elaboration of the federative Europe [
41] all point in the direction that the most developed EU member states are perhaps beginning to comprehend that, for a developed EU member state, there is no long-term competitiveness without EU-level competitiveness. Also, there is no EU-level competitiveness without EU-level solidarity. However, there is still a long way to go. Nevertheless, solidarity will not be sufficient if the federation does not cover the whole of the EU. On the other hand, all this does not exempt the member states from making every effort to leave behind any practices of free-riding detected, once and for all. All in all, the European social model will only be sustainable if the future European economy relies on enhanced competitiveness across the whole EU, under the wise and well-coordinated guidance of European institutions, and a newly defined pan-European solidarity based on the conviction that “united we stand, divided we fall.”
As for the social developments, our recommendation would be to put education in the focus of public policies as we believe that a better educated society has more chance to succeed in the 21st century. Quite regrettably, the crisis has hit the national education budgets of many member states of the EU, especially in those countries that are suffering from large public deficits and/or debts [
42]. This is a trend that, instead of solving the problems, only aggravates them. Therefore, it has to be reverted as soon as possible, in order to avoid the negative consequences of growing social inequalities. The latest initiatives of the European Commission to tackle youth unemployment within the periphery of the EU [
43] are therefore greatly appreciated but, if these are not accompanied by sound and enlightened educational and social policies led by the interested governments, the final outcome might be an overall failure in reaching the ambitious objectives.


