
Educational Intervention through a Board Game for the Teaching of Mathematics to Dyslexic Greek Students


1
Department of Education, University of Cordoba, 14004 Córdoba, Spain
2
Mathematics Education, Department of Mathematics, University of Cordoba, 14004 Córdoba, Spain
*
Author to whom correspondence should be addressed.
Soc. Sci. 2021, 10(10), 370; https://doi.org/10.3390/socsci10100370
Submission received: 16 August 2021
/
Revised: 24 September 2021
/
Accepted: 26 September 2021
/
Published: 30 September 2021
(This article belongs to the Special Issue The End-Purpose of Teaching Social Sciences and the Curricular Inclusion of Social Problems)
Abstract
:The main purpose of this study was to investigate the effectiveness of an intervention strategy in teaching mathematics based on a board game, using the curriculum of mathematics in Greece, called Adapted Analytical Programs (A.A.P.). This research was conducted on secondary students in Greek General Schools over a period of five weeks. One hundred and twenty-four 12-to-13-year-old dyslexic students participated in the study. A pre-test and a post-test with exercises in the chapter of fractions were used to assess the improvement in students’ performance. The assessment showed that this intervention strategy improved dyslexic students’ performance. Τhe results of the research indicate that integrating a board game adapted to mathematics into the secondary school curriculum could have positive effects on dyslexic students.
1. Introduction
The Yemen Dyslexia Association (Emerson 2015) defines dyslexia as ‘A functional disorder of the left side of the brain. It causes difficulty in reading, writing or mathematics associated with other symptoms, such as weakness in short-term memory, ordering, movements and directions awareness’. People with dyslexia find it difficult to connect speech with writing because they have deficiencies in the phonological component of the language. The difficulty of accurately and easily deciphering can affect reading comprehension and vocabulary development. Spelling difficulties can affect the production of written speech as well. Within this context, dyslexia is not a sign of low intelligence, laziness or poor eyesight. On the contrary, it occurs in the whole range of mental abilities of the individual. According to the law on education of people with disabilities (Disabilities Education Act), the functional definition of dyslexia is ‘special learning disability’ (Futterman and Futterman 2017).
It is a disorder in one or more of the basic psychological processes involved in understanding or using language, speech or writing and can manifest itself in the imperfect ability of a person to hear, think, speak, read, write or carry out mathematical calculations. The most persistent problem, however, seems to be diction (Roitsch and Watson 2019). More specifically, when a student with dyslexia begins to learn how to read, they have difficulty with the level of voice or sound, which adversely affects spelling and reading. Secondary consequences may include reading comprehension problems and reduced reading experience, which may impede the development of vocabulary and background knowledge (Roitsch and Watson 2019).
Dyslexia is one of the most common neurodevelopmental disorders in children. About 5–10% of school-age children suffer from dyslexia, which is more common in boys (Huang et al. 2020a); the aetiology and pathogenesis of dyslexia have not yet been clearly defined. Rüsseler et al. (2017) have found that children with dyslexia may be associated with genetic and/or brain injuries, brain dysplasia, malnutrition and so on. External factors, such as school, family environment, childhood education, living environment and other factors, can also affect children’s reading skills. According to Huang et al. (2020b), children’s living and learning environment has significantly affected their learning skills. The result is that children with dyslexia have negative emotions about their self-image and relationships with classmates and family. In terms of social interaction, children with dyslexia lack social skills due to stress or low self-esteem and have problems with adapting themselves to social circumstances (Abd Rauf et al. 2020). Additionally, the incidence of anxiety and depression in children with dyslexia is also higher than in typical children, with more negative behaviours, higher suicide rates and increased antisocial behaviours (Abd Rauf et al. 2018).
Muhamad et al. (2016) support that ‘teachers enjoy teaching maths to students with dyslexia but find that adequate training, teaching experience, and exposure to multiple teaching strategies are required for success’. According to Macrae et al. (2003), the student may also have difficulty with numerical facts, retrieving the theorems and the formulas that are needed and even more with mathematical relationships. In multi-step problems, students often lose their way or skip sections and do not consider all the relevant aspects of the problem. This results in their inability to make the necessary combinations and achieve a final solution. In support of this, Witzel and Mize (2018), in their research, corroborate that having legislative support for students with dyslexia and dyscalculia is beneficial. Employing empirically validated assessments and strategies is even better. According to them, teachers and teacher candidates alike must learn how to evaluate and guide students with dyslexia. In addition, in real teaching situations, dyslexic students appear to have less potential when asked to address certain assignments. Additionally, mathematics is reinforced through practice. For this reason, towards the end of a lesson the teacher often assigns a handout or some exercises from the official textbook for students to complete at home. While typical students may have completed the task before the next lesson, the dyslexic student will have completed perhaps three-fourths, and, in effect, they receive less reinforcement. This leads to a decrease in the student’s confidence in their ability to complete a set task. Furthermore, as Grehan et al. (2015) state, there is no one standard approach to providing support in mathematics which will cater for the needs of all students. Macrae et al. (2003) state that dyslexia may also cause slow reading, or the student may not understand what they have read. Finally, frequent problems arise when learners are asked to associate a concept with its symbol or function.
All the aforementioned reasons attest that a significant number of students with learning disabilities have certain difficulties in mathematics. Cook et al. (2019) state that ‘the research in mathematics is underdeveloped in such a way that special educators as well as general educators must make instructional decisions based on the best evidence when planning instruction for students with learning disabilities’. These students’ have difficulties in assimilating and understanding at the same pace during the lesson. Frequent repetitions are needed and, of course, someone who explains what the teacher says in simpler ways. In another study (Shin and Bryant 2016), it is mentioned that students can become more proficient problem solvers if they are able to use models to represent the structure of the problem in a diagram or graphic organizer. Researchers (Bryant et al. 2014) have pointed out that even the most struggling students can benefit from a small group intervention that is intensive, strategic, and explicit. Furthermore, according to Robinson (2017), effective models of inclusive teacher education will be likely to adopt a collaborative approach to professional learning and development. So, common educational programs for different groups of people with special educational needs are likely to be found, to a greater or lesser extent, in every educational system. Educational programs can be used in every level of education so that they can help students with special needs. For example, in schools with a large student population, the number of students with special needs is adequate to form homogeneous classes of learners who share the same level of learning difficulties. However, in educational systems which have only recently begun to provide targeted special education services to people with physical, mental, and multiple disabilities, this situation is increasing dramatically. An example of such a system is the Greek education system. In the last decade, it has been observed that the number of students with physical, mental, or multiple disabilities participating in educational programs of the Ministry of Education, mainly at the level of secondary education, has multiplied (Papadimitriou and Tzivinikou 2019).
This research aims to investigate the effectiveness of the APS of the Greek Ministry for students with dyslexia in the course of mathematics in high school. In the same vein, it is directed towards indicating the need to design more comprehensive analytical programs for dyslexic students or to improve and supplement the existing ones. Accordingly, the grounds towards more effective teaching of mathematics to students with special needs will be set. Furthermore, it must be mentioned that a comprehensive presentation and comparison between an intervention in mathematics with the Adapted Analytical Programs for students with dyslexia is included. This happens because, in Greece, there are two analytical programs for every subject, one for students with special needs named ‘Adapted Analytical Programs’ (A.A.P.) and one for typical students named ‘Analytical Programs’. The A.A.P. for students with special needs, which refer to dyslexic students as well, contain exercises with graphs and pictures. The Ministry of Education publishes them to guide the teachers on how implement each lesson.
2. Materials and Methods
2.1. Objective/Research Questions and Hypotheses Control
This research aims to examine the performance of students with dyslexia who are taught mathematics according to the A.A.P. In essence, the researcher aims to investigate the need to design more comprehensive analytical programs for dyslexic students or to improve and supplement the existing ones, with the ultimate goal of improving the field of special education and effectively teaching mathematics to students with special needs. Consequently, the objectives that arise from the literature review and the context in which they will be explored are:
- Identifying difficulties of students with dyslexia in mathematics.
- Critical evaluation of A.A.P. (adapted analytical programs) of mathematics for students with dyslexia.
- Exploring if an intervention based on a board game using A.A.P. helps dyslexic students.
Achieving these objectives requires answering the following questions which account for the research questions:
- Are the A.A.P. helping students with dyslexia to understand mathematics?
- Are the exercises and suggested activities from the A.A.P. sufficient for such an adapted teaching?
- Does the intervention program using A.A.P. help dyslexic students?
- Is there a significantly positive relationship between the performance of dyslexic students and their attendance of the A.A.P.?
- Is there a significantly positive relationship between the performance of dyslexic students and their participation in the intervention program?
2.2. Participants
The participants of the present study were 124 students who had been diagnosed with dyslexia. Informed consent was obtained from the parents of all children. The students had been diagnosed with dyslexia by their Local Certified Government Agencies. The control group (C.G.) consisted of 61 students with dyslexia and the experimental group (E.G.) consisted of 63 students with dyslexia. In Table 1, the number of students of each group and the type of each student are presented analytically. The selected samples randomly consisted of seventh graders, aged 12–13 years old, from many different schools in Greece, mainly from the region of Attica and Lesvos Island. The students were selected by the principal and the teachers of each school and agreed to participate with consent provided by their parents. The selection criteria of the sample were determined both by the principal of each school and the responsible teachers of each class, who indicated the students diagnosed with dyslexia.
2.3. Variables—Measures
In Table 2, variables’ denomination and their corresponding categorization are shown.
In Table 3, dependent variables’ denomination and their corresponding dimension and definition are shown.
2.4. Design of the Research
A quantitative approach has been adopted because the collection of information drawn from the data to investigate the research questions, was based on numerical measurement and statistical analysis in order to determine a pattern of performance in mathematics. Based on this, the quantitative research offered a chance of generalizing the results obtained in a broader sense, although controlling the groups studied in terms of their number and size should be considered. Similarly, it has given the opportunity of reproducing and an accurate perspective on specific points of these groups, thus facilitating comparison with other studies of a similar nature (López-Hernández et al. 2005).
This is carried out as a correlational study, the purpose of which was to examine the relationship between two categories or variables in a specific context (López-Hernández et al. 2005). It is attempted to measure the degree of the relationship between dependent and independent variables. These were the performance of dyslexic students attending the A.A.P. against their performance attending an alternative intervention program based on a board game.
2.5. Procedure
All data during the pre-test, intervention, and post-test phases of the study were collected at three time points over a period of 3 months, through filling out forms in the classroom. The filling out of forms lasted for a total of 7 teaching hours (45 min) for every student and took place during the scholar time. More specifically, the whole procedure contained 1 teaching hour at pre-test, 10 × 22 min for intervention/teaching of the analytical programs and 1 teaching hour at post-test. The forms were devised in order to collect the answers of the target students. The dependent variable was the total knowledge/performance of each student. The designed test about fractions is intended to measure students’ knowledge of fractions and subsequently their performance.
Initially, the parents of students with dyslexia were informed about the basic principles and aims of this research, giving their signed consent. Concerning the 61 dyslexic students who were assigned to the Control Group were going to attend only the A.A.P., while the remaining 63 students who were in the Experimental Group were going to participate in the alternative intervention. The next step was to inform the principal of the school and the teachers and to ensure that they could participate in this project. A time and date were set for the teaching through the A.A.P. to the C.G. and another time and date for the implementation of the intervention to the E.G. It should be mentioned that all the students knew that they could leave the project any time. This option provided them with a sense of safety, stability, and control over the intervention process.
2.5.1. Pre-Test
Pre-test was carried out before the intervention and the teaching of A.A.P. and involved all students filling out forms for 1 teaching hour (45 min). They were asked to answer some questions about the fractional operations and a combination of them in a problem in two stages. There were exercises of increasing difficulty and a variety of arithmetic operations so that the student can be examined in all thematic units. All the students answered the questions prior to the teaching of the topic relying only on the knowledge they had from previous classes. The pre-test showed the performance and the level of acquisition of each student in fractions. A graded scale of 0–20 corresponded to each student. There were 8 exercises, and each student could reach 20 points if they answered all questions correctly and 0 point if they answered everything wrong. Each correct answer was giving 1 point and each incorrect answer was giving 0 points. After the collection of pre-test data, the students with dyslexia were allocated to the C.G. and to the E.G.
2.5.2. Intervention
The board game was implemented over a period of 5 weeks on a weekly basis consisting of 10 sessions. Each session lasted 22 min and took place twice every week after the end of classes, so that the students, an empty and quiet classroom and the researcher were available. Concerning the alternative way of teaching, it is an original learning game that promotes an alternative teaching–learning method through questions and solved examples printed on cards to students with dyslexia. The subject matter of the tool deals with a specific part of the curriculum of the Mathematics A’ Gymnasium, the ‘Fractions’. More specifically, it deals with the research area of fractions, and its learning objectives are divided into 5 learning areas:
- Quantity
- Equality of fractions
- Base of 10
- Algebraic and Geometric Thought
- Forms of a fractional number
Regarding the design of the game, a dashboard has been formed which is divided into 5 coloured areas, depending on the difficulty and the research area the students deal with (Figure 1). Each thematic area corresponds to 5 closed-question cards with 5 similar solved examples on the backside of each card (Figure 2). Therefore, the game consisted of 25 questions in total and 25 solved examples for each question. The difficulty of the exercises is tiered as the students move on to each topic, and there is a variety of arithmetic operations so that the students can go through all the questions and be assessed. The transition from area to area takes place only with the process of completing the respective learning area. The aim of the participant is to cover the full range of exercises which are included in the specific thematic area of fractions modules. It should be noted that the choice of exercises from the researcher has been meticulously made to avoid obstacles or difficulties for students with dyslexia, after an extensive literature review of dyslexia and its correlation with mathematics. The dashboard and the two sides of one card is presented below.
The background consists of random mathematical shapes and equations to embellish the dashboard of the game within a mathematical context.
2.5.3. Reliability of Intervention
The reliability of the intervention will be examined with the help of Cronbach’s Alpha. In the table below (Table 4), a total of 25 questions were selected, of which five cognitive areas of the intervention are created.
The table above shows that the value of Cronbach’s Alpha is 0.766, i.e., the level of reliability of all questions is sufficient but not very good. The table below (Table 5) shows all Cronbach’s Alpha values if one of the intervention questions is removed each time.
As is concluded, removing the Card—Q15 slightly improves the value of Cronbach’s Alpha, increasing it by just 1%. Nevertheless, this question is part of the intervention, and it is considered good not to remove it. In any case, the improvement that appears from the removal of the Card—Q15 is very small and does not add anything extra to the reliability of the questionnaire.
2.5.4. Post-Test
The post-test was carried out 1 month after the teaching by A.A.P. and the collection of the intervention data. All the students retook the test of knowledge about fractions in 45 min, as in the pre-test. It must be mentioned that the pre-test and the post-test are exactly the same tests in order to take reliable results.
3. Results
3.1. Performance of Dyslexic Students, Who Were Not Intervened, However, Only Attended the Adapted Analytical Program
Initially, the performance of dyslexic students in both groups, the E.G. and the C.G., is going to be examined. The t-test for the equality of two means and the Mann–Whitney test in SPSS resulted in exactly the same values, so the t-test is going to be used for the analysis of the results. Table 6 shows the mean of dyslexic students in the C.G. and Table A1 in the Appendix A provides the results of the two-sample t-test comparing means.
In the conclusion of the t-test, dyslexic students appear to be improved after attending the adapted analytical program by 2.29 points.
3.2. Performance of Dyslexic Students Who Participated in the Intervention
Regarding the performance of dyslexic students who participated in the intervention, Table 7 below shows that the mean before and after the intervention and Table A2 in the Appendix A provides the results of the two-sample t-test comparing means.
In conclusion, from the two-sample t-test comparing means, dyslexic students appear to be significantly better after the intervention by 5.68 points. Examining the results so far, it seems that the intervention has benefited more dyslexic students than the teaching of the adapted analytical program, and in fact this improvement has been interpreted as 1.31 points. In order to confirm the above claim, we will present the comparison of the results of the score in the post-test of the dyslexic students of the two groups: the first group of the dyslexic students in which no intervention was applied (control group) and the second group of the dyslexic students in which the intervention was applied (experimental group). In support of the above claim, a comparison of the post-test score results of the dyslexic students constituting both groups will be presented. As is noticed in Table 8, it seems that the performance of dyslexic students to whom the intervention was applied increased by three points more than the performance of dyslexic students whose teaching was based on the A.A.P. guidelines set by the Greek Ministry of Education. The two-sample t-test comparing means is presented in Table A3 in the Appendix A.
In conclusion, from the t-test, the dyslexic students in whom the intervention was applied appear to be more improved than the dyslexic students in whom no intervention was applied. It must be mentioned that this difference is statistically significant.
3.3. Performance Testing of Dyslexic Students in Each Question, Who Participated in the Intervention
The analysis of the research data is completed by checking the performance of the dyslexic students in whom the intervention was applied, not in their total score, but in their score per question. The results of the two-sample t-test comparing means are shown in Table A4 and Table A5 in Appendix A. First of all, regarding the first question from the Levene test for the equality of means, it is noticed that the significance of the test is 0 < 0.05. Therefore, the null hypothesis is not accepted and the mean values of the two samples are unequal. In conclusion, the intervention enhanced the performance of dyslexic students by 2.11 points when concerned with placing fractions on the line of real numbers. For the second question, in Levene’s test for the equality of mean, it is noticed that the significance of the test is 0 < 0.05. Therefore, the null hypothesis is not accepted and the mean values of the two samples are not equal. So, the intervention enhanced the performance of dyslexic students by 0.33 points as concerned with the equivalence of fractions. The third question concerns finding a fraction between two given fractions. In Levene’s test for the equality of means it is noticed that the significance of the test is 0 < 0.05. Therefore, the means of the two samples are not equal to each other. So, the intervention enhanced the performance of dyslexic students by 0.42 points, when concerned with finding a fraction between two given fractions. The fourth question concerns the comparison of fractions. In Levene’s test for the equality of means, it is noticed that the significance of the test is 0 < 0.05. Therefore, the mean values of the two samples are unequal. So, the intervention enhanced the performance of dyslexic students by 0.47 points in comparing fractions. The next question concerns the calculation of the subtraction between two fractions. In Levene’s test for the equality of means, it is noticed that the significance of the test is 0.009 < 0.05. Therefore, the means of the two samples are not equal to each other. So, the intervention enhanced the performance of dyslexic students by 0.22 points when concerned with calculating the subtraction between two fractions. The next question concerns the multiplication of two fractions. In Levene’s test for the equality of means, it is noticed that the significance of the test is 0 < 0.05. Therefore, the mean values of the two samples are unequal. So, the intervention enhanced the performance of the dyslexic students by 0.71 points whenconcerned with the multiplication of two fractions. Continuing with the post-test, there was the question of converting a fraction to a decimal number. In Levene’s test for the equality of means, it is noticed that the significance of the test is 0 < 0.05. Therefore, the mean values of the two samples are unequal. So, the intervention enhanced the performance of dyslexic students by 1.14 points in converting a fraction to a decimal number. Finally, regarding the problem of sharing a sum in four parts based on fractions, in Levene’s test for the equality of means, it is noticed that the significance of the test is 0.286 > 0.05. Therefore, the means of the two samples are equal to each other. So, the intervention does not seem to have enhanced the performance of dyslexic students when concerned with the problem of dividing a sum into four parts based on fractions.
4. Discussion
The exercises carried out during this research were adapted to the needs of dyslexic students. Performing mathematical activities is a complex process that requires the use of many different skills. More specifically, the enhancement in all five learning areas helped each student to develop their mathematical abilities, but also to exhibit further enhancement in the corresponding areas.
The research questions of the study were confirmed, since the performance of student with dyslexia who participated in the intervention project was enhanced in comparison with the control group. In contrast, although the A.A.P. also increased the mean of the performance of dyslexic students, the increase in the mean was less than that of the intervention. The findings of Bryan et al. (1991) confirm how salient it is for dyslexic students to be integrated into special education programs due to significant differences between skills and mathematical performance. The findings of Choi et al. (2016) in this investigation indicated that this approach to inclusive education may benefit all students by improving student academic performance. Within the same context, Tam and Leung (2019) argue that students who showed some benefits in improving their behavioural and cognitive aspects required continuous intervention courses to become self-regulating students, develop self-motivation in order to improve, optimize on the learning methods, and adopt strategies in order to achieve academic goals. It should also be mentioned that these results confirm older research findings showing that teaching interventions based on the use of alternative games are more effective than a conventional type of interventions (Shu and Liu 2019; Kim et al. 2017; Fokides 2017; Al-Azawi et al. 2016; Ke and Abras 2012; Kebritchi et al. 2010; Kiger et al. 2012; Kim and Mido 2010; Shin et al. 2011). Additionally, dyslexic students can benefit from the A.A.P., especially if they are adapted in alternative methods of teaching, such as a board game with cards. Yeo et al. (2015) in their research also supported that students made significant improvements across all topics of mathematics through an intervention program. Generally, in the present study it is shown that dyslexic students learn from an educational game, changing their cognitive and affective measurements. This fact is in line with the proposal of Kim et al. (2017), Kraiger et al. (1993) and Castellar et al. (2014) who support that mathematical games can increase mental calculation speed in a similar way as an equivalent number of paper exercises. It is suggested to design games in a way that students’ perceived competence, particularly in-game competence, will be increased so that they will be more engaged in game-mediated learning, thus benefiting more from games.
However, in Greece, according to Stampoltzis and Polychronopoulou (2009), research on dyslexia is limited. There is no project that uses an alternative intervention to teach mathematics to dyslexic students of high school ages. Therefore, in the present study, the researcher aims to supplement the existing literature and at the same time shed some light on the effectiveness of an alternative intervention in teaching and learning mathematics for dyslexic students by providing them with different stimuli. This fact, after all, demonstrates the innovation and the importance of the implemented intervention, which if accompanied by the A.A.P. will be of great benefit to the dyslexic students.
Furthermore, using hypothesis testing for the intervention, clear conclusions can be drawn about the design. Firstly, dyslexic students were improved greatly in all the cognitive areas to such a degree that it is considered statistically significant. Secondly, both methods of teaching enhanced the performance of dyslexic students.
Based on the above conclusions, the intervention has positive results in dyslexic students, but this does not mean that modifications are not allowed. Modifications are needed for the techniques used and related to the specific questions in which the dyslexic students did not show much improvement. This fact, however, is not discouraging because there has been not only overall improvement of students, but also improvement in each focused category of the game separately. Therefore, the intervention may be improved in the future only if some corrections are made, for example the sample increases with the number of the participants, changes in the card content of the game which are included in the intervention, and in the method of teaching through the cards. As Papadopoulos (2010) notes in his statistical research, the intervention can be improved by reducing the variability while keeping the sample size constant. However, this is not possible in our case, while the results are collected and analysed exactly as the students gave them. So, a practical solution would be to increase the sample size. In this way, the variability will be reduced. Furthermore, Sabri and Gyateng (2015) state that the chance of detecting a strong statistical difference will be increased by picking a large enough sample size. In conclusion, it is worth noting the difficulties and limitations of the research. Initially, collecting the sample was not easy because many school principals presented concerns about the time and the day that the students were going to participate and thus disagreed with the research process. In addition, some students wanted to leave the class because they felt tired or anxious about their performance, even though they knew in advance that the process was anonymous and their performance would not be graded. Another shortcoming was the fact that, many students with dyslexia needed more time to complete the pre- and post-test. Finally, increasing the sample, adding new cards, or modifying the existing ones in the board game may lead to safer conclusions. This fact is relayed to the improvement of the value of Cronbach’s Alpha in case of the removal of one card.
5. Conclusions
The first general conclusion is that the alternative intervention motivated the dyslexic students to work on their performance and show considerable signs of improvement to such a degree that it is considered statistically significant. In light of this, differentiated teaching of dyslexic students is helpful for them to understand the mathematical concept of fractions. This is precisely the reason why dyslexic students, who did not participate in the alternative intervention, also seem to be improved, presenting a slightly lower mean than that of the group of dyslexic students who attended the proposed intervention. The second conclusion is that dyslexic students can also benefit from the A.A.P., especially if they are adapted to alternative methods of teaching, such as a board game with cards. The third conclusion, regarding the duration of the intervention, is that more time and more sessions with students are needed. There were many students who left the project because of the time and the anxiety they felt. The fourth and last conclusion is that the alternative intervention can be further modified. A practical solution would be to modify some of the techniques that were used and related to the specific questions, in which the dyslexic students did not show much improvement in their performance. Further research on a larger sample and with small changes in the intervention, making it even more dynamic, can possibly bring more reliable conclusions concerning the contribution of differentiated teaching to dyslexic learners. These conclusions show that dyslexic students could have a better performance in other countries too under a similar teaching method.
Author Contributions
Conceptualization, E.M., N.J.-F. and V.M.-D.; methodology, E.M. and N.J.-F. and V.M.-D.; validation, E.M., N.J.-F. and V.M.-D.; formal analysis, E.M.; investigation, E.M. and N.J.-F.; resources, E.M.; data curation, E.M., N.J.-F. and V.M.-D.; writing—original draft preparation, E.M., N.J.-F. and V.M.-D.; writing—review and editing, E.M., N.J-F. and V.M.-D.; supervision, N.J.-F. and V.M.-D. All authors have read and agreed to the published version of the manuscript.
Funding
This research received no external funding.
Institutional Review Board Statement
Not applicable.
Informed Consent Statement
Not applicable.
Data Availability Statement
Not applicable.
Conflicts of Interest
The authors declare no conflict of interest.
Appendix A

Table A1.
Independent Samples of C.G.—A.A.P.
| Levene’s Test for Equality of Variances | t-Test for Equality of Means | |||||||||
|---|---|---|---|---|---|---|---|---|---|---|
| F | Sig. | t | df | Sig. (2-Tailed) | Mean Difference | Std. Error Difference | 95% Confidence Interval of the Difference | |||
| Lower | Upper | |||||||||
| Score | Equal variances assumed | 0.214 | 0.645 | −4.505 | 120 | 0 | −2.295 | 0.509 | −3.304 | −1.286 |
| Equal variances not assumed | −4.505 | 119.73 | 0 | −2.295 | 0.509 | −3.304 | −1.286 | |||
(C.G. refers to Control Group and A.A.P. refers to Adapted Analytical Programs).
Table A2.
Independent Samples Test for E.G.—Intervention Program.
| Levene’s Test for Equality of Variances | t-Test for Equality of Means | |||||||||
|---|---|---|---|---|---|---|---|---|---|---|
| F | Sig. | t | df | Sig. (2-Tailed) | Mean Difference | Std. Error Difference | 95% Confidence Interval of the Difference | |||
| Lower | Upper | |||||||||
| Score | Equal variances assumed | 0.653 | 0.421 | −6.847 | 124 | 0.000 | −5.683 | 0.830 | −7.325 | −4.040 |
| Equal variances not assumed | −6.847 | 119.670 | 0.000 | −5.683 | 0.830 | −7.326 | −4.039 | |||
(E.G. refers to Experimental Group).
Table A3.
Independent Samples Test comparison of C.G. and E.G.
| Levene’s Test for Equality of Variances | t-Test for Equality of Means | |||||||||
|---|---|---|---|---|---|---|---|---|---|---|
| F | Sig. | t | df | Sig. (2-Tailed) | Mean Difference | Std. Error Difference | 95% Confidence Interval of the Difference | |||
| Lower | Upper | |||||||||
| Score | Equal variances assumed | 19.571 | 0.000 | −4.816 | 122 | 0.000 | −3.075 | 0.639 | −4.339 | −1.811 |
| Equal variances not assumed | −4.848 | 107.345 | 0.000 | −3.075 | 0.634 | −4.333 | −1.818 | |||
Table A4.
Performance testing of dyslexic students in each question who participated in the intervention.
Table A4.
Performance testing of dyslexic students in each question who participated in the intervention.
| Knowledge Paper in Fractions | N | Mean | Std. Deviation | Std. Error Mean | |
|---|---|---|---|---|---|
| Note in the following number line the points corresponding to the given fractions 2/7, 7/7, 8/7, 5/7, 0, 1/7, 15/7 | Pre-test | 63 | 2.52 | 2.687 | 0.339 |
| Post-test | 63 | 4.63 | 2.465 | 0.311 | |
| We have the fractions 4/9 and 16/19. Are these fractions equivalent? Justify your answer. | Pre-test | 63 | 0.32 | 0.469 | 0.059 |
| Post-test | 63 | 0.65 | 0.481 | 0.061 | |
| Find a fraction between 3/4 and 5/6. | Pre-test | 63 | 0.11 | 0.317 | 0.040 |
| Post-test | 63 | 0.54 | 0.502 | 0.063 | |
| Compare these fractions: 5/8 and 4/6. | Pre-test | 63 | 0.24 | 0.429 | 0.054 |
| Post-test | 63 | 0.71 | 0.455 | 0.057 | |
| Circle the correct answer for this operation 6/7–4/21 | Pre-test | 63 | 0.52 | 0.503 | 0.063 |
| Post-test | 63 | 0.75 | 0.439 | 0.055 | |
| Calculate the operations 3/4*5/3 and 4/3*15/8 | Pre-test | 63 | 0.95 | 0.923 | 0.116 |
| Post-test | 63 | 1.67 | 0.672 | 0.085 | |
| Convert the following fractions to decimal numbers: 7/10, 9/25, 4/50 | Pre-test | 63 | 0.67 | 0.967 | 0.122 |
| Post-test | 63 | 1.81 | 1.045 | 0.132 | |
| Four people money sharing problem | Pre-test | 63 | 0.68 | 1.280 | 0.161 |
| Post-test | 63 | 0.94 | 1.378 | 0.174 |
Table A5.
Independent Samples Test.
| Levene’s Test for Equality of Variances | t-Test for Equality of Means | |||||||||
|---|---|---|---|---|---|---|---|---|---|---|
| F | Sig. | t | df | Sig. (2-Tailed) | Mean Difference | Std. Error Difference | 95% Confidence Interval of the Difference | |||
| Lower | Upper | |||||||||
| Note in the following number line the points corresponding to the given fractions 2/7, 7/7, 8/7, 5/7, 0, 1/7, 15/7 | Equal variances assumed | 0.127 | 0.722 | −4.595 | 124 | 0.000 | −2.111 | 0.459 | −3.020 | −1.202 |
| Equal variances not assumed | −4.595 | 123.084 | 0.000 | −2.111 | 0.459 | −3.020 | −1.202 | |||
| We have the fractions 4/9 and 16/19. Are these fractions equivalent? Justify your answer. | Equal variances assumed | 0.560 | 0.455 | −3.939 | 124 | 0.000 | −0.333 | 0.085 | −0.501 | −0.166 |
| Equal variances not assumed | −3.939 | 123,930 | 0.000 | −0.333 | 0.085 | −0.501 | −0.166 | |||
| Find a fraction between 3/4 and 5/6. | Equal variances assumed | 90.598 | 0.000 | −5.727 | 124 | 0.000 | −0.429 | 0.075 | −0.577 | −0.280 |
| Equal variances not assumed | −5.727 | 104.570 | 0.000 | −0.429 | 0.075 | −0.577 | −0.280 | |||
| Compare these fractions: 5/8 and 4/6. | Equal variances assumed | 1.461 | 0.229 | −6.039 | 124 | 0.000 | −0.476 | 0.079 | −0.632 | −0.320 |
| Equal variances not assumed | −6.039 | 123.572 | 0.000 | −0.476 | 0.079 | −0.632 | −0.320 | |||
| Circle the correct answer for this operation 6/7–4/21 | Equal variances assumed | 19.202 | 0.000 | −2.641 | 124 | 0.009 | −0.222 | 0.084 | −0.389 | −0.056 |
| Equal variances not assumed | −2641 | 121.728 | 0.009 | −0.222 | 0.084 | −0.389 | −0.056 | |||
| Calculate the operations 3/4*5/3 and 4/3*15/8 | Equal variances assumed | 22.395 | 0.000 | −4.965 | 124 | 0.000 | −0.714 | 0.144 | −0.999 | −0.430 |
| Equal variances not assumed | −4.965 | 113.293 | 0.000 | −0.714 | 0.144 | −0.999 | −0.429 | |||
| Convert the following fractions to decimal numbers: 7/10, 9/25, 4/50 | Equal variances assumed | 1.377 | 0.243 | −6.370 | 124 | 0.000 | −1.143 | 0.179 | −1.498 | −0.788 |
| Equal variances not assumed | −6.370 | 123.264 | 0.000 | −1.143 | 0.179 | −1.498 | −0.788 | |||
| Four people money sharing problem | Equal variances assumed | 0.132 | 0.717 | −1.072 | 124 | 0.286 | −0.254 | 0.237 | −0.723 | 0.215 |
| Equal variances not assumed | −1.072 | 123.336 | 0.286 | −0.254 | 0.0237 | −0.723 | 0.215 | |||
References
- Abd Rauf, Athira Amira, Maizatul Akmar Ismail, Vimala Balakrishnan, and Khalid Haruna. 2018. Dyslexic Children: The Need for Parents Awareness. Journal of Education and Human Development 7: 91–99. [Google Scholar] [CrossRef]
- Abd Rauf, Athira Amira, Maizatul Akmar Ismail, Vimala Balakrishnan, Loh Sau Cheong, Novia Indriaty Admodisastro, and Khalid Haruna. 2020. Analysis of Support for Parents in Raising Children with Dyslexia. Journal of Family Issues 42: 276–92. [Google Scholar] [CrossRef]
- Al-Azawi, Rula, Fatma Al-Faliti, and Mazin Al-Blushi. 2016. Educational Gamification vs. Game Based Learning: Comparative Study. International Journal of Innovation, Management and Technology 7: 131–36. [Google Scholar] [CrossRef]
- Bryan, T., M. Bay, N. Lopez-Reyna, and M. Donahue. 1991. Characteristics of students with learning disabilities: A summary of the extant data base and its implications for educational programs. In The Regular Edu Cation Initiative: Alternative Perspectives. Edited by John Wills Lloyd, Nirbhay N. Singh and Alan C. Repp. Sycamore: Thomson Brooks/Cole, pp. 121–31. [Google Scholar]
- Bryant, Brian R., Diane Pedrotty Bryant, Jennifer Porterfield, Minyi Shih Dennis, Terry Falcomata, Courtney Valentine, Chelsea Brewer, and Kathy Bell. 2014. The Effects of a Tier 3 Intervention on the Mathematics Performance of Second Grade Students with Severe Mathematics Difficulties. Journal of Learning Disabilities 49: 176–88. [Google Scholar] [CrossRef] [PubMed] [Green Version]
- Castellar, Elena Núñez, Jan Van Looy, Arnaud Szmalec, and Lieven de Marez. 2014. Improving Arithmetic Skills through Gameplay: Assessment of the Effectiveness of an Educational Game in Terms of Cognitive and Affective Learning Outcomes. Information Sciences 264: 19–31. [Google Scholar] [CrossRef]
- Choi, Jeong Hoon, Jessica M. Meisenheimer, Amy B. McCart, and Wayne Sailor. 2016. Improving Learning for All Students through Equity-Based Inclusive Reform Practices. Remedial and Special Education 38: 28–41. [Google Scholar] [CrossRef]
- Cook, Sara Cothren, Lauren W. Collins, Lisa L. Morin, and Paul J. Riccomini. 2019. Schema-Based Instruction for Mathematical Word Problem Solving: An Evidence-Based Review for Students with Learning Disabilities. Learning Disability Quarterly 43: 75–87. [Google Scholar] [CrossRef]
- Emerson, Jane. 2015. The enigma of dyscalculia. In The Routledge International Handbook of Dyscalculia and Mathematical Learning Difficulties. London: Routledge, pp. 217–27. [Google Scholar]
- Fokides, Emmanuel. 2017. Digital Educational Games and Mathematics. Results of a Case Study in Primary School Settings. Education and Information Technologies 23: 851–67. [Google Scholar] [CrossRef]
- Futterman, Kathy, and Kathryn R. Futterman. 2017. Identification of Students with Dyslexia in California Public Schools. Ph.D. thesis, California Public Schools, Coal Center, PA, USA. [Google Scholar]
- Grehan, Martin, Ciarán Mac an Bhaird, and Ann O’Shea. 2015. Investigating Students’ Levels of Engagement with Mathematics: Critical Events, Motivations, and Influences on Behaviour. International Journal of Mathematical Education in Science and Technology 47: 1–28. [Google Scholar] [CrossRef]
- Huang, Yanhong, Chongtao Xu, Meirong He, Wenlong Huang, and Kusheng Wu. 2020a. Saliva Cortisol, Melatonin Levels and Circadian Rhythm Alterations in Chinese Primary School Children with Dyslexia. Medicine 99: e19098. [Google Scholar] [CrossRef] [PubMed]
- Huang, Yanhong, Meirong He, Anna Li, Yuhang Lin, Xuanzhi Zhang, and Kusheng Wu. 2020b. Personality, Behavior Characteristics, and Life Quality Impact of Children with Dyslexia. International Journal of Environmental Research and Public Health 17: 1415. [Google Scholar] [CrossRef] [Green Version]
- Ke, Fengfeng, and Tatiana Abras. 2012. Games for Engaged Learning of Middle School Children with Special Learning Needs. British Journal of Educational Technology 44: 225–42. [Google Scholar] [CrossRef]
- Kebritchi, Mansureh, Atsusi Hirumi, and Haiyan Bai. 2010. The Effects of Modern Mathematics Computer Games on Mathematics Achievement and Class Motivation. Computers & Education 55: 427–43. [Google Scholar] [CrossRef]
- Kiger, Derick, Dani Herro, and Deb Prunty. 2012. Examining the Influence of a Mobile Learning Intervention on Third Grade Math Achievement. Journal of Research on Technology in Education 45: 61–82. [Google Scholar] [CrossRef]
- Kim, Sunha, and Chang Mido. 2010. Computer games for the math achievement of diverse students. Journal of Educational Technology & Society 13: 224–32. [Google Scholar]
- Kim, Sunha, Mido Chang, Kirby Deater-Deckard, Michael A. Evans, Anderson Norton, and Yavuz Samur. 2017. Educational Games and Students’ Game Engagement in Elementary School Classrooms. Journal of Computers in Education 4: 395–418. [Google Scholar] [CrossRef]
- Kraiger, Kurt, J. Kevin Ford, and Eduardo Salas. 1993. Application of Cognitive, Skill-Based, and Affective Theories of Learning Outcomes to New Methods of Training Evaluation. Journal of Applied Psychology 78: 311–28. [Google Scholar] [CrossRef]
- López-Hernández, Danilo, Michel Brossard, Jean-Claude Fardeau, and Michel Lepage. 2005. Effect of Different Termite Feeding Groups on P Sorption and P Availability in African and South American Savannas. Biology and Fertility of Soils 42: 207–14. [Google Scholar] [CrossRef]
- Macrae, Sheila, Margaret Brown, Hannah Bartholomew, and Melissa Rodd. 2003. An Examination of One Group of Failing Single Honours Students in One University. MSOR Connections 3: 17–20. [Google Scholar] [CrossRef]
- Muhamad, Hani Zohra, Zachary Walker, and Kara Rosenblatt. 2016. The Teaching of Maths to Students with Dyslexia: A Teachers’ Perspective. Asia Pacific Journal of Developmental Differences 3: 228–47. [Google Scholar] [CrossRef]
- Papadimitriou, Panagiotis, and Sotiria Tzivinikou. 2019. Departments of Integration in Secondary Education: A Critical Review on Procedure and the Educational Practices of the Evaluation and the Intervention that Are Adopted. Panhellenic Conference of Educational Sciences 9: 565–78. [Google Scholar] [CrossRef]
- Papadopoulos, Georgios. 2010. Laboratory of Mathematics & Statistics [Course Notes]. Available online: www.aua.gr.http://www.aua.gr/gpapadopoulos/shmeiwseis.php (accessed on 30 September 2010).
- Robinson, Deborah. 2017. Effective Inclusive Teacher Education for Special Educational Needs and Disabilities: Some More Thoughts on the Way Forward. Teaching and Teacher Education 61: 164–78. [Google Scholar] [CrossRef]
- Roitsch, Jane, and Silvana Watson. 2019. An Overview of Dyslexia: Definition, Characteristics, Assessment, Identification, and Intervention. Science Journal of Education 7: 81. [Google Scholar] [CrossRef] [Green Version]
- Rüsseler, Jascha, Zheng Ye, Ivonne Gerth, Gregor R. Szycik, and Thomas F. Münte. 2017. Audio-Visual Speech Perception in Adult Readers with Dyslexia: An FMRI Study. Brain Imaging and Behavior 12: 357–68. [Google Scholar] [CrossRef]
- Sabri, Farooq, and Tracey Gyateng. 2015. Understanding Statistical Significance: A Short Guide. London: New Philanthropy Capital. [Google Scholar]
- Shin, Mikyung, and Diane P. Bryant. 2016. Improving the Fraction Word Problem Solving of Students with Mathematics Learning Disabilities. Remedial and Special Education 38: 76–86. [Google Scholar] [CrossRef]
- Shin, Namsoo, LeeAnn M. Sutherland, Cathleen A. Norris, and Elliot Soloway. 2011. Effects of Game Technology on Elementary Student Learning in Mathematics. British Journal of Educational Technology 43: 540–60. [Google Scholar] [CrossRef] [Green Version]
- Shu, Liuyi, and Min Liu. 2019. Student engagement in game-based learning: A literature review from 2008 to 2018. Journal of Educational Multimedia and Hypermedia 28: 193–215. [Google Scholar]
- Stampoltzis, Aglaia, and Stavroula Polychronopoulou. 2009. Greek University Students with Dyslexia: An Interview Study. European Journal of Special Needs Education 24: 307–21. [Google Scholar] [CrossRef]
- Tam, Irelan O. L., and Cynthia Leung. 2019. Evaluation of the Effectiveness of a Literacy Intervention Programme on Enhancing Learning Outcomes for Secondary Students with Dyslexia in Hong Kong. Dyslexia 25: 296–317. [Google Scholar] [CrossRef]
- Witzel, Bradley, and Minnie Mize. 2018. Meeting the Needs of Students with Dyslexia and Dyscalculia. SRATE Journal 27: 31–39. [Google Scholar]
- Yeo, Rebecca, Tim Bunn, Aishah Abdullah, Siti Aisha Bte Shukri, and Anaberta Oehlers-Jaen. 2015. Evaluating the Progress of Dyslexic Children on a Small-Group Maths Intervention Programme. Asia Pacific Journal of Developmental Differences 2: 144–57. [Google Scholar] [CrossRef]
Figure 1.
Dashboard.
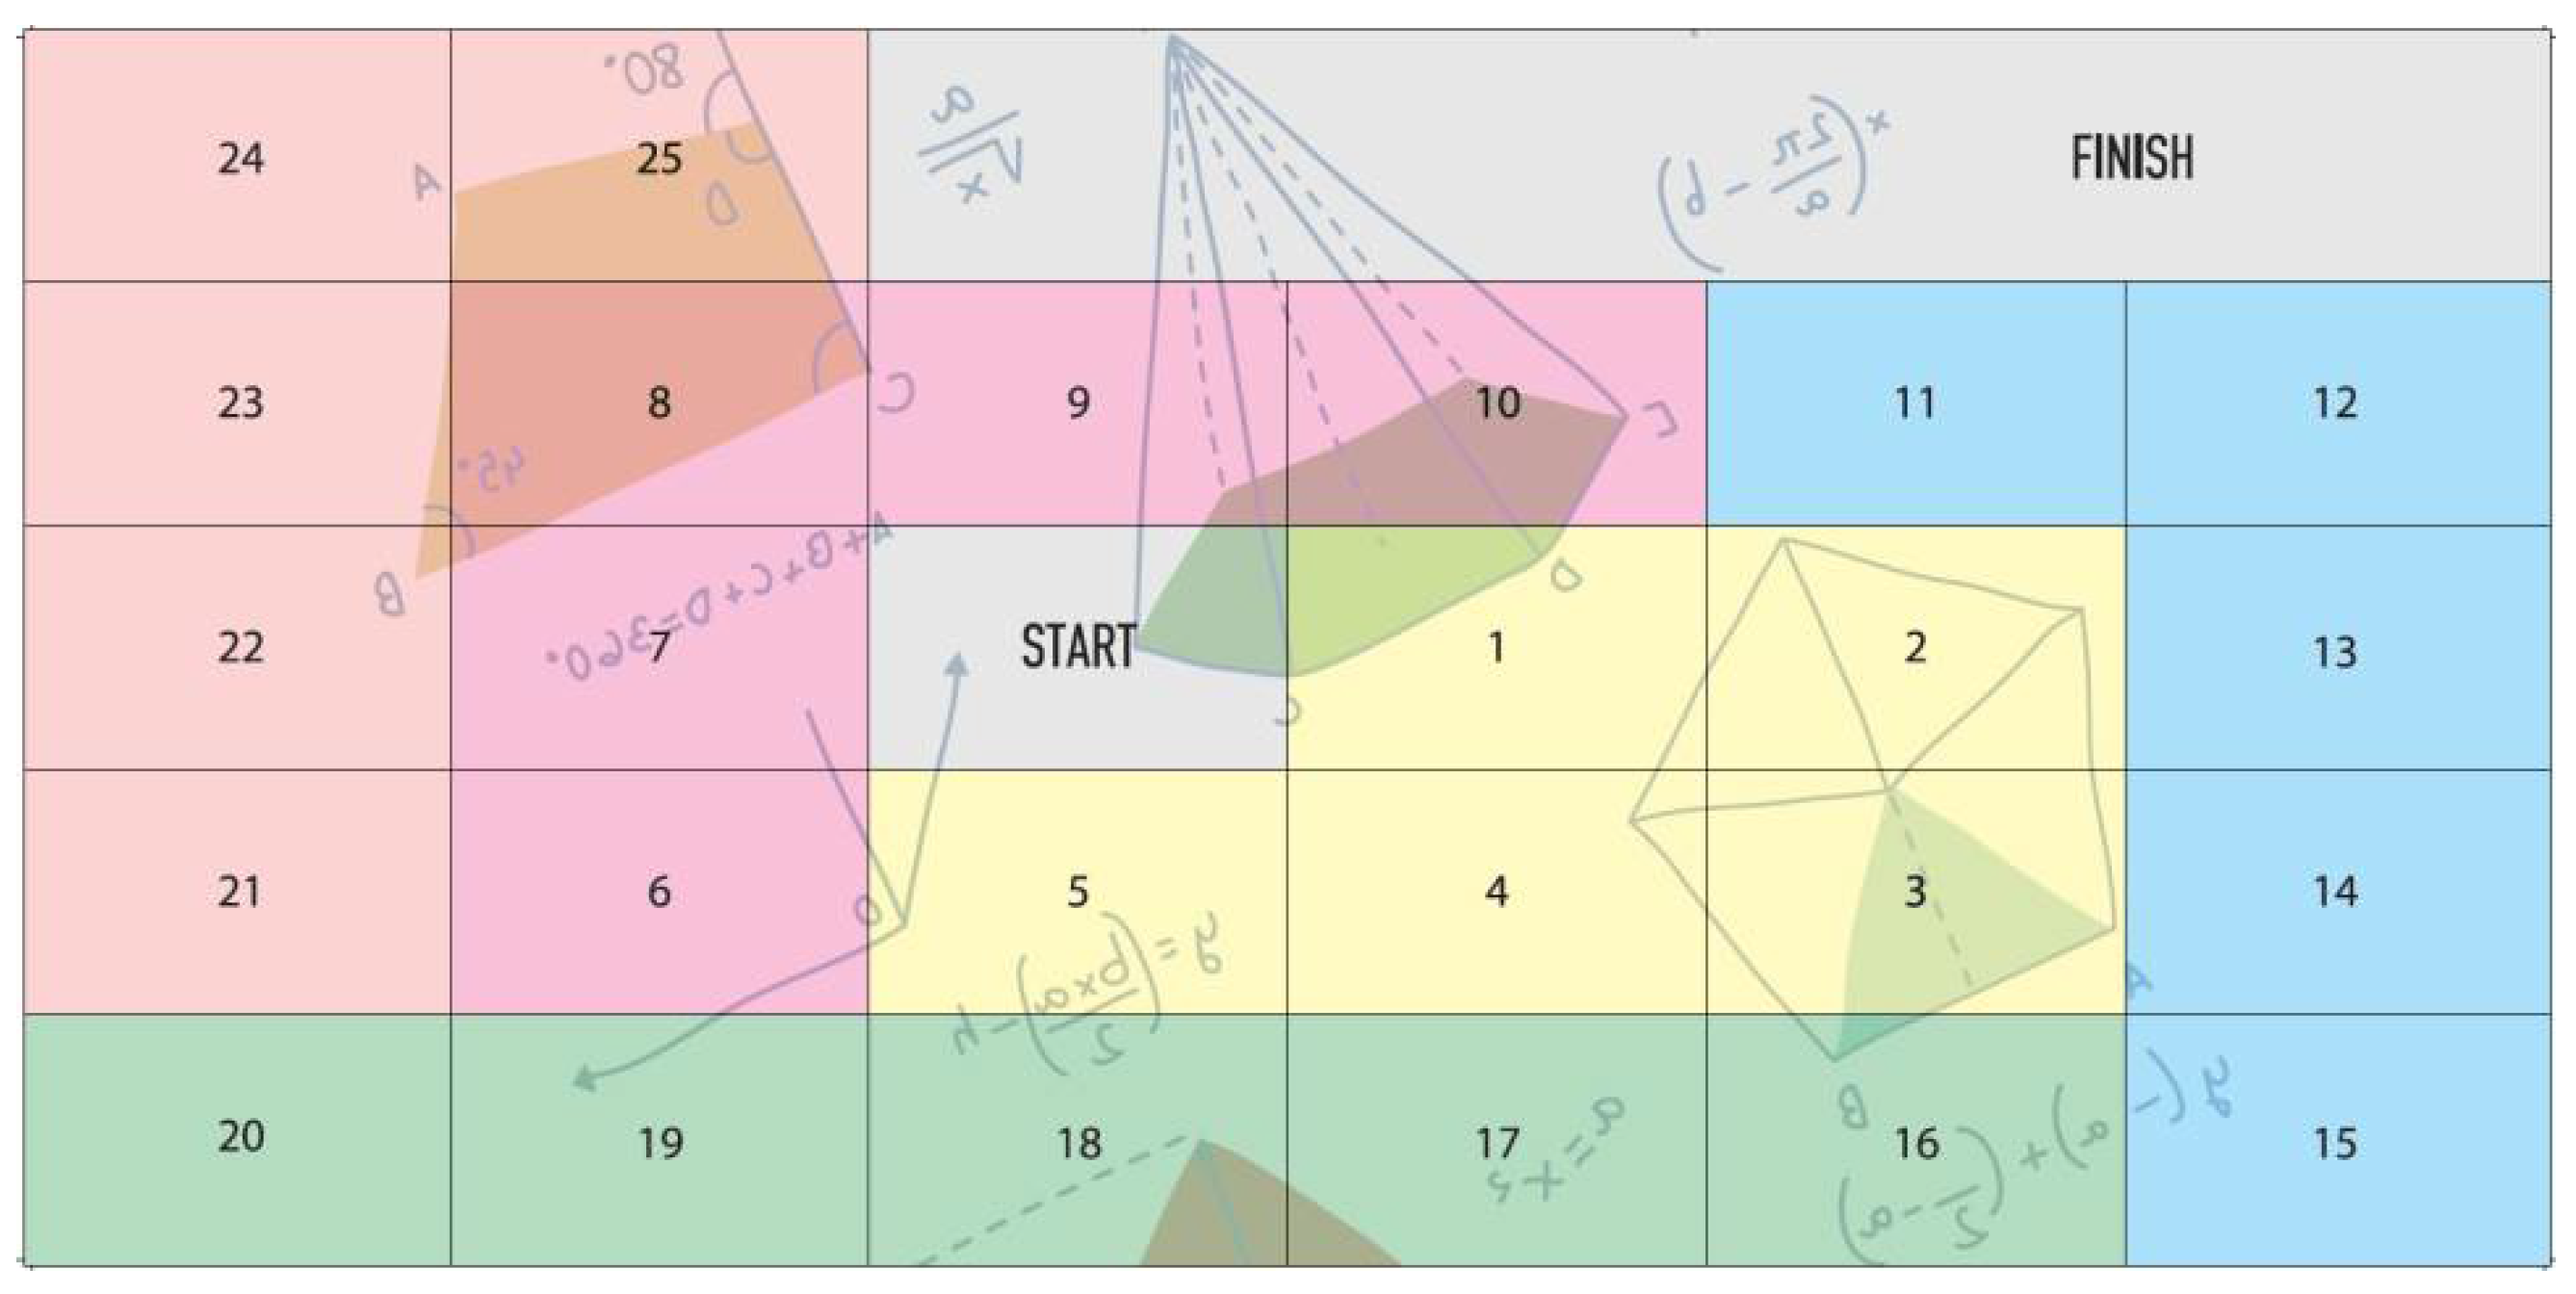
Figure 2.
Two sides of a card of the game.

Table 1.
Gender of each Group.
| C.G. | E.G. | Total | |
|---|---|---|---|
| Male | 32 | 135 | 67 |
| Female | 29 | 28 | 57 |
| Total | 61 | 63 | 124 |
(C.G. refers to Control Group and E.G. refers to Experimental Group).
Table 2.
Independent variables.
| Variables | Categories |
|---|---|
| Gender | Male |
| Female | |
| Method of teaching | A.A.P. to C.G. |
| Intervention to E.G. |
(A.A.P. refers to Adapted Analytical Programs).
Table 3.
Dependent variables.
| Variables | Definition | Dimension |
|---|---|---|
| Evaluation of performance of D.S. in pre-test | 8 questions with a scale 0–20 | Performance of D.S. in the chapter of fractions in mathematics before teaching A.A.P./intervention |
| Evaluation of performance of D.S. in intervention program | 25 questions with a scale 0–25 | Performance of D.S. in the chapter of fractions in mathematics during the intervention program |
| Evaluation of performance of D.S. in post-test | 8 questions with a scale 0–20 | Performance of D.S. in the chapter of fractions in mathematics after teaching A.A.P./intervention |
(D.S. refers to Dyslexic Students).
Table 4.
Reliability Statistics.
| Cronbach’s Alpha | Cronbach’s Alpha Based on Standardized Items | N of Items |
|---|---|---|
| 0.766 | 0.771 | 25 |
Table 5.
Item—Total Statistics.
| Scale Mean If Item Deleted | Scale Variance If Item Deleted | Corrected Item-Total Correlation | Cronbach’s Alpha If Item Deleted | |
|---|---|---|---|---|
| Card—Q1 | 14.91 | 19.326 | 0.017 | 0.775 |
| Card—Q2 | 15.14 | 19.061 | 0.176 | 0.764 |
| Card—Q3 | 14.63 | 19.033 | 0.081 | 0.772 |
| Card—Q4 | 14.58 | 18.072 | 0.327 | 0.756 |
| Card—Q5 | 14.55 | 18.176 | 0.307 | 0.757 |
| Card—Q6 | 14.72 | 18.696 | 0.154 | 0.767 |
| Card—Q7 | 14.63 | 18.7 | 0.16 | 0.767 |
| Card—Q8 | 14.38 | 18.658 | 0.274 | 0.76 |
| Card—Q9 | 14.48 | 19.15 | 0.074 | 0.77 |
| Card—Q10 | 14.51 | 17.817 | 0.424 | 0.751 |
| Card—Q11 | 14.46 | 17.757 | 0.479 | 0.748 |
| Card—Q12 | 14.47 | 17.874 | 0.432 | 0.751 |
| Card—Q13 | 14.46 | 17.511 | 0.552 | 0.744 |
| Card—Q14 | 14.52 | 17.86 | 0.408 | 0.752 |
| Card—Q15 | 14.66 | 19.356 | 0.003 | 0.776 |
| Card—Q16 | 14.77 | 17.7 | 0.395 | 0.752 |
| Card—Q17 | 14.89 | 17.793 | 0.397 | 0.752 |
| Card—Q18 | 14.39 | 18.254 | 0.402 | 0.754 |
| Card—Q19 | 14.54 | 17.366 | 0.531 | 0.744 |
| Card—Q20 | 14.81 | 17.708 | 0.397 | 0.752 |
| Card—Q21 | 14.75 | 18.161 | 0.282 | 0.759 |
| Card—Q22 | 14.63 | 18.033 | 0.324 | 0.756 |
| Card—Q23 | 14.55 | 18.003 | 0.353 | 0.755 |
| Card—Q24 | 1450 | 18.223 | 0.316 | 0.757 |
| Card—Q25 | 14.77 | 18.106 | 0.296 | 0.758 |
Table 6.
Performance of C.G.—A.A.P.
| Knowledge Paper in Fractions | N | Mean | Std. Deviation | Std. Error Mean | |
|---|---|---|---|---|---|
| Score | Pre-test | 61 | 6.33 | 2.879 | 0.369 |
| Post-test | 61 | 8.62 | 2.746 | 0.352 |
Table 7.
Performance of E.G.—Intervention Program.
| Knowledge Paper in Fractions | N | Mean | Std. Deviation | Std. Error Mean | |
|---|---|---|---|---|---|
| Score | Pre-test | 63 | 6.02 | 5.082 | 0.64 |
| Post-test | 63 | 11.7 | 4.192 | 0.528 |
Table 8.
Comparison C.G.–E.G.
| Program That the Students Follow | N | Mean | Std. Deviation | Std. Error Mean | |
|---|---|---|---|---|---|
| Score | Adapted Analytical Program | 61 | 8.62 | 2.746 | 0.352 |
| Interventionprogram | 63 | 11.7 | 4.192 | 0.528 |
Publisher’s Note: MDPI stays neutral with regard to jurisdictional claims in published maps and institutional affiliations. |
© 2021 by the authors. Licensee MDPI, Basel, Switzerland. This article is an open access article distributed under the terms and conditions of the Creative Commons Attribution (CC BY) license (https://creativecommons.org/licenses/by/4.0/).
Share and Cite
MDPI and ACS Style
Malliakas, E.; Jiménez-Fanjul, N.; Marín-Díaz, V. Educational Intervention through a Board Game for the Teaching of Mathematics to Dyslexic Greek Students. Soc. Sci. 2021, 10, 370. https://doi.org/10.3390/socsci10100370
AMA Style
Malliakas E, Jiménez-Fanjul N, Marín-Díaz V. Educational Intervention through a Board Game for the Teaching of Mathematics to Dyslexic Greek Students. Social Sciences. 2021; 10(10):370. https://doi.org/10.3390/socsci10100370
Chicago/Turabian StyleMalliakas, Efstratios, Nοelia Jiménez-Fanjul, and Verónica Marín-Díaz. 2021. "Educational Intervention through a Board Game for the Teaching of Mathematics to Dyslexic Greek Students" Social Sciences 10, no. 10: 370. https://doi.org/10.3390/socsci10100370
Note that from the first issue of 2016, this journal uses article numbers instead of page numbers. See further details here.