Online Tool Wear Monitoring by the Analysis of Cutting Forces in Transient State for Dry Machining of Ti6Al4V Alloy


 , and
, and 
Abstract
:1. Introduction
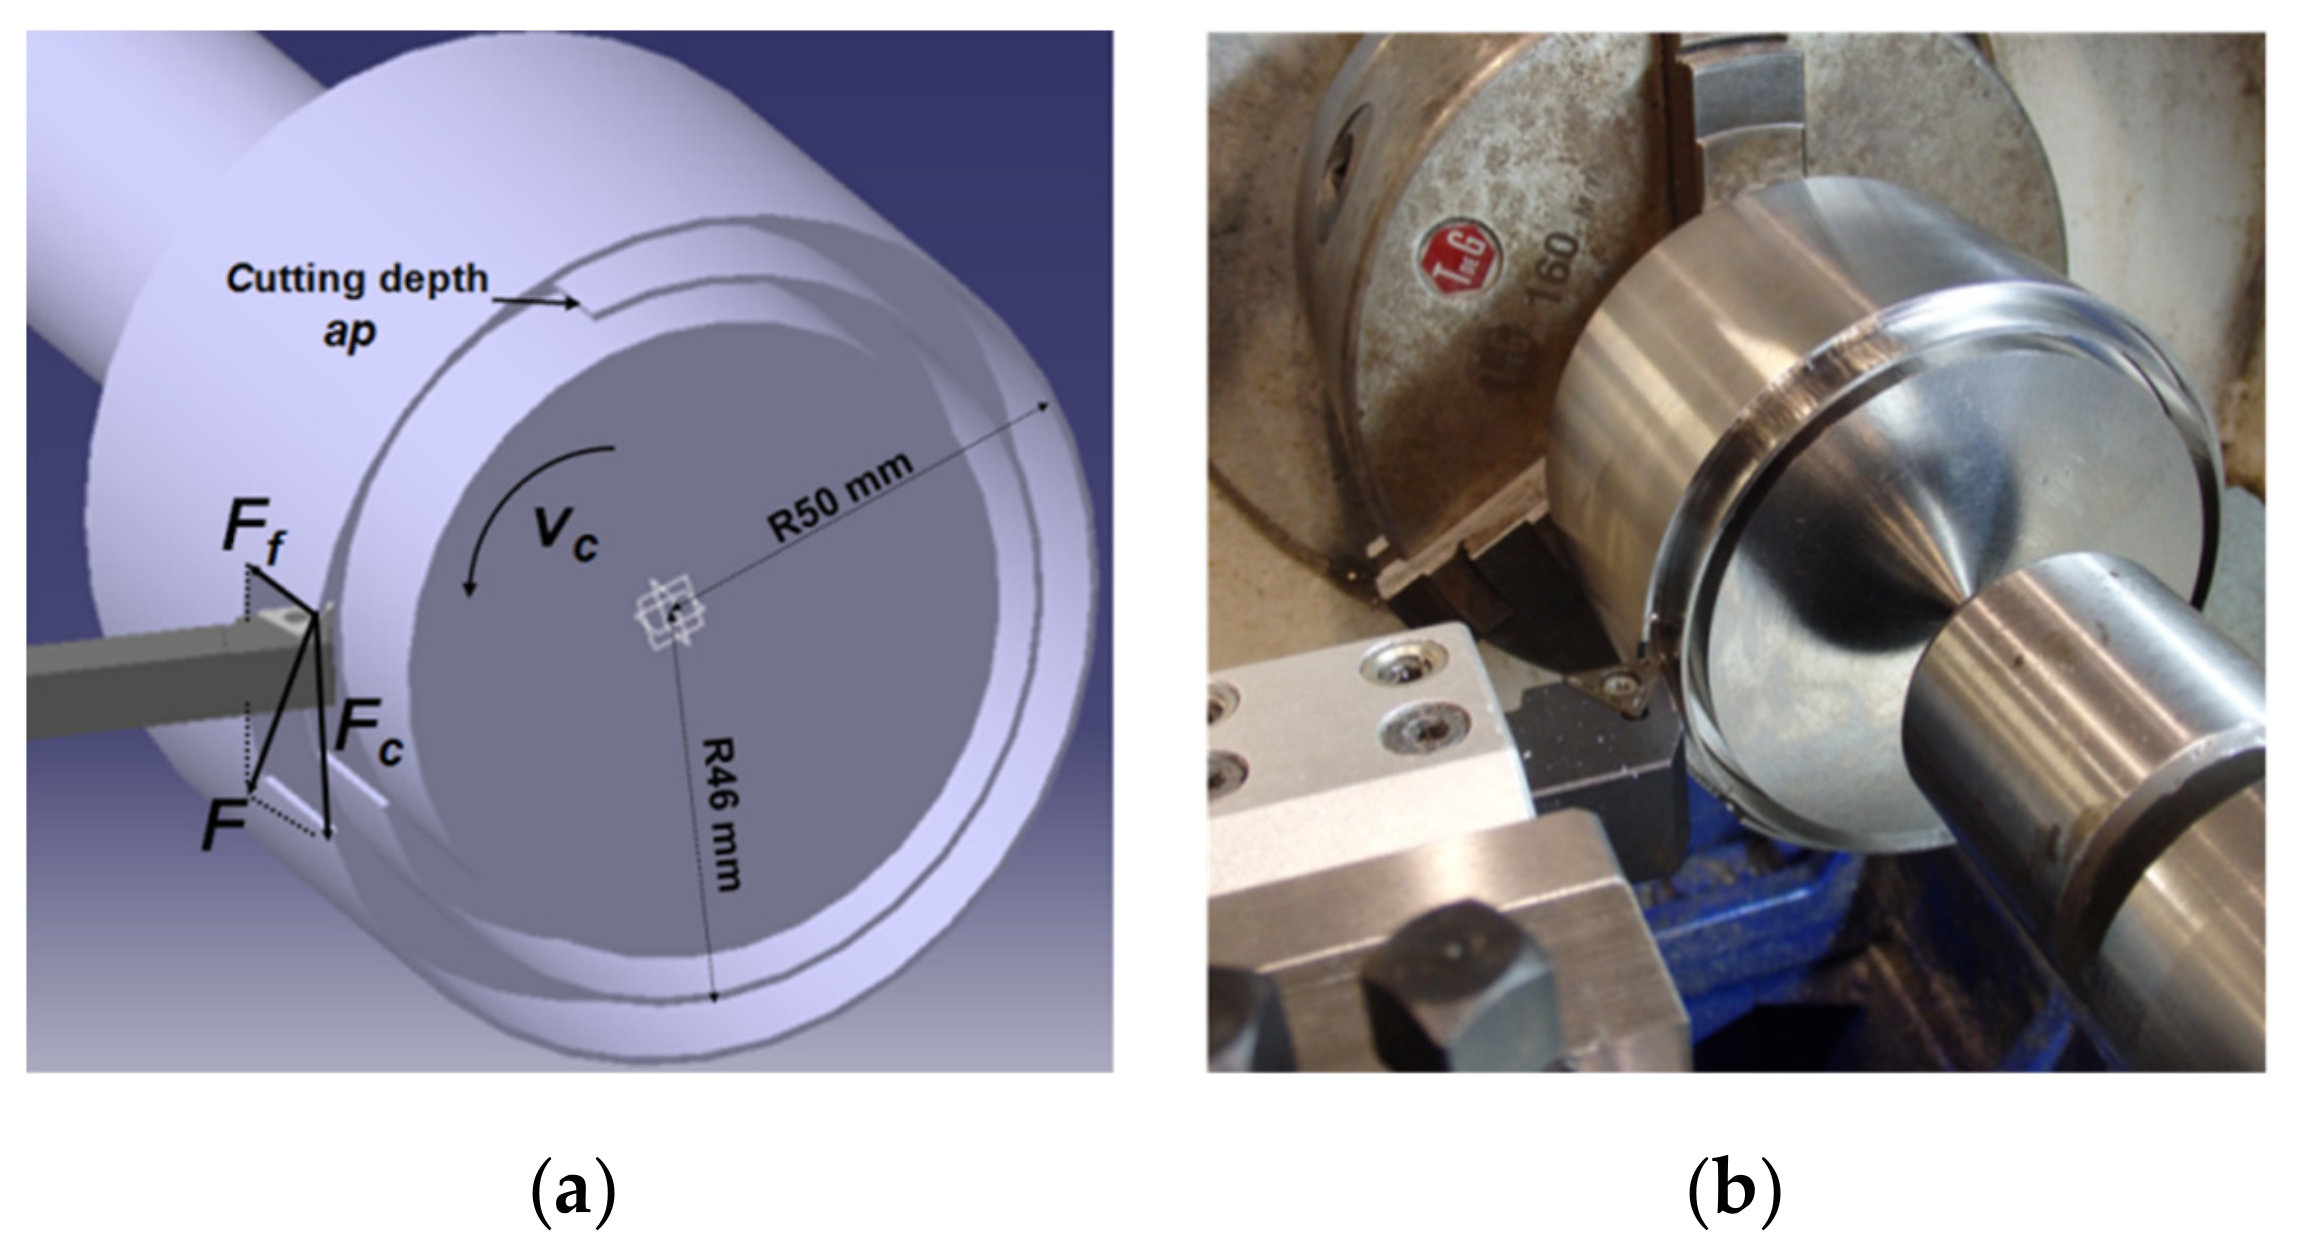
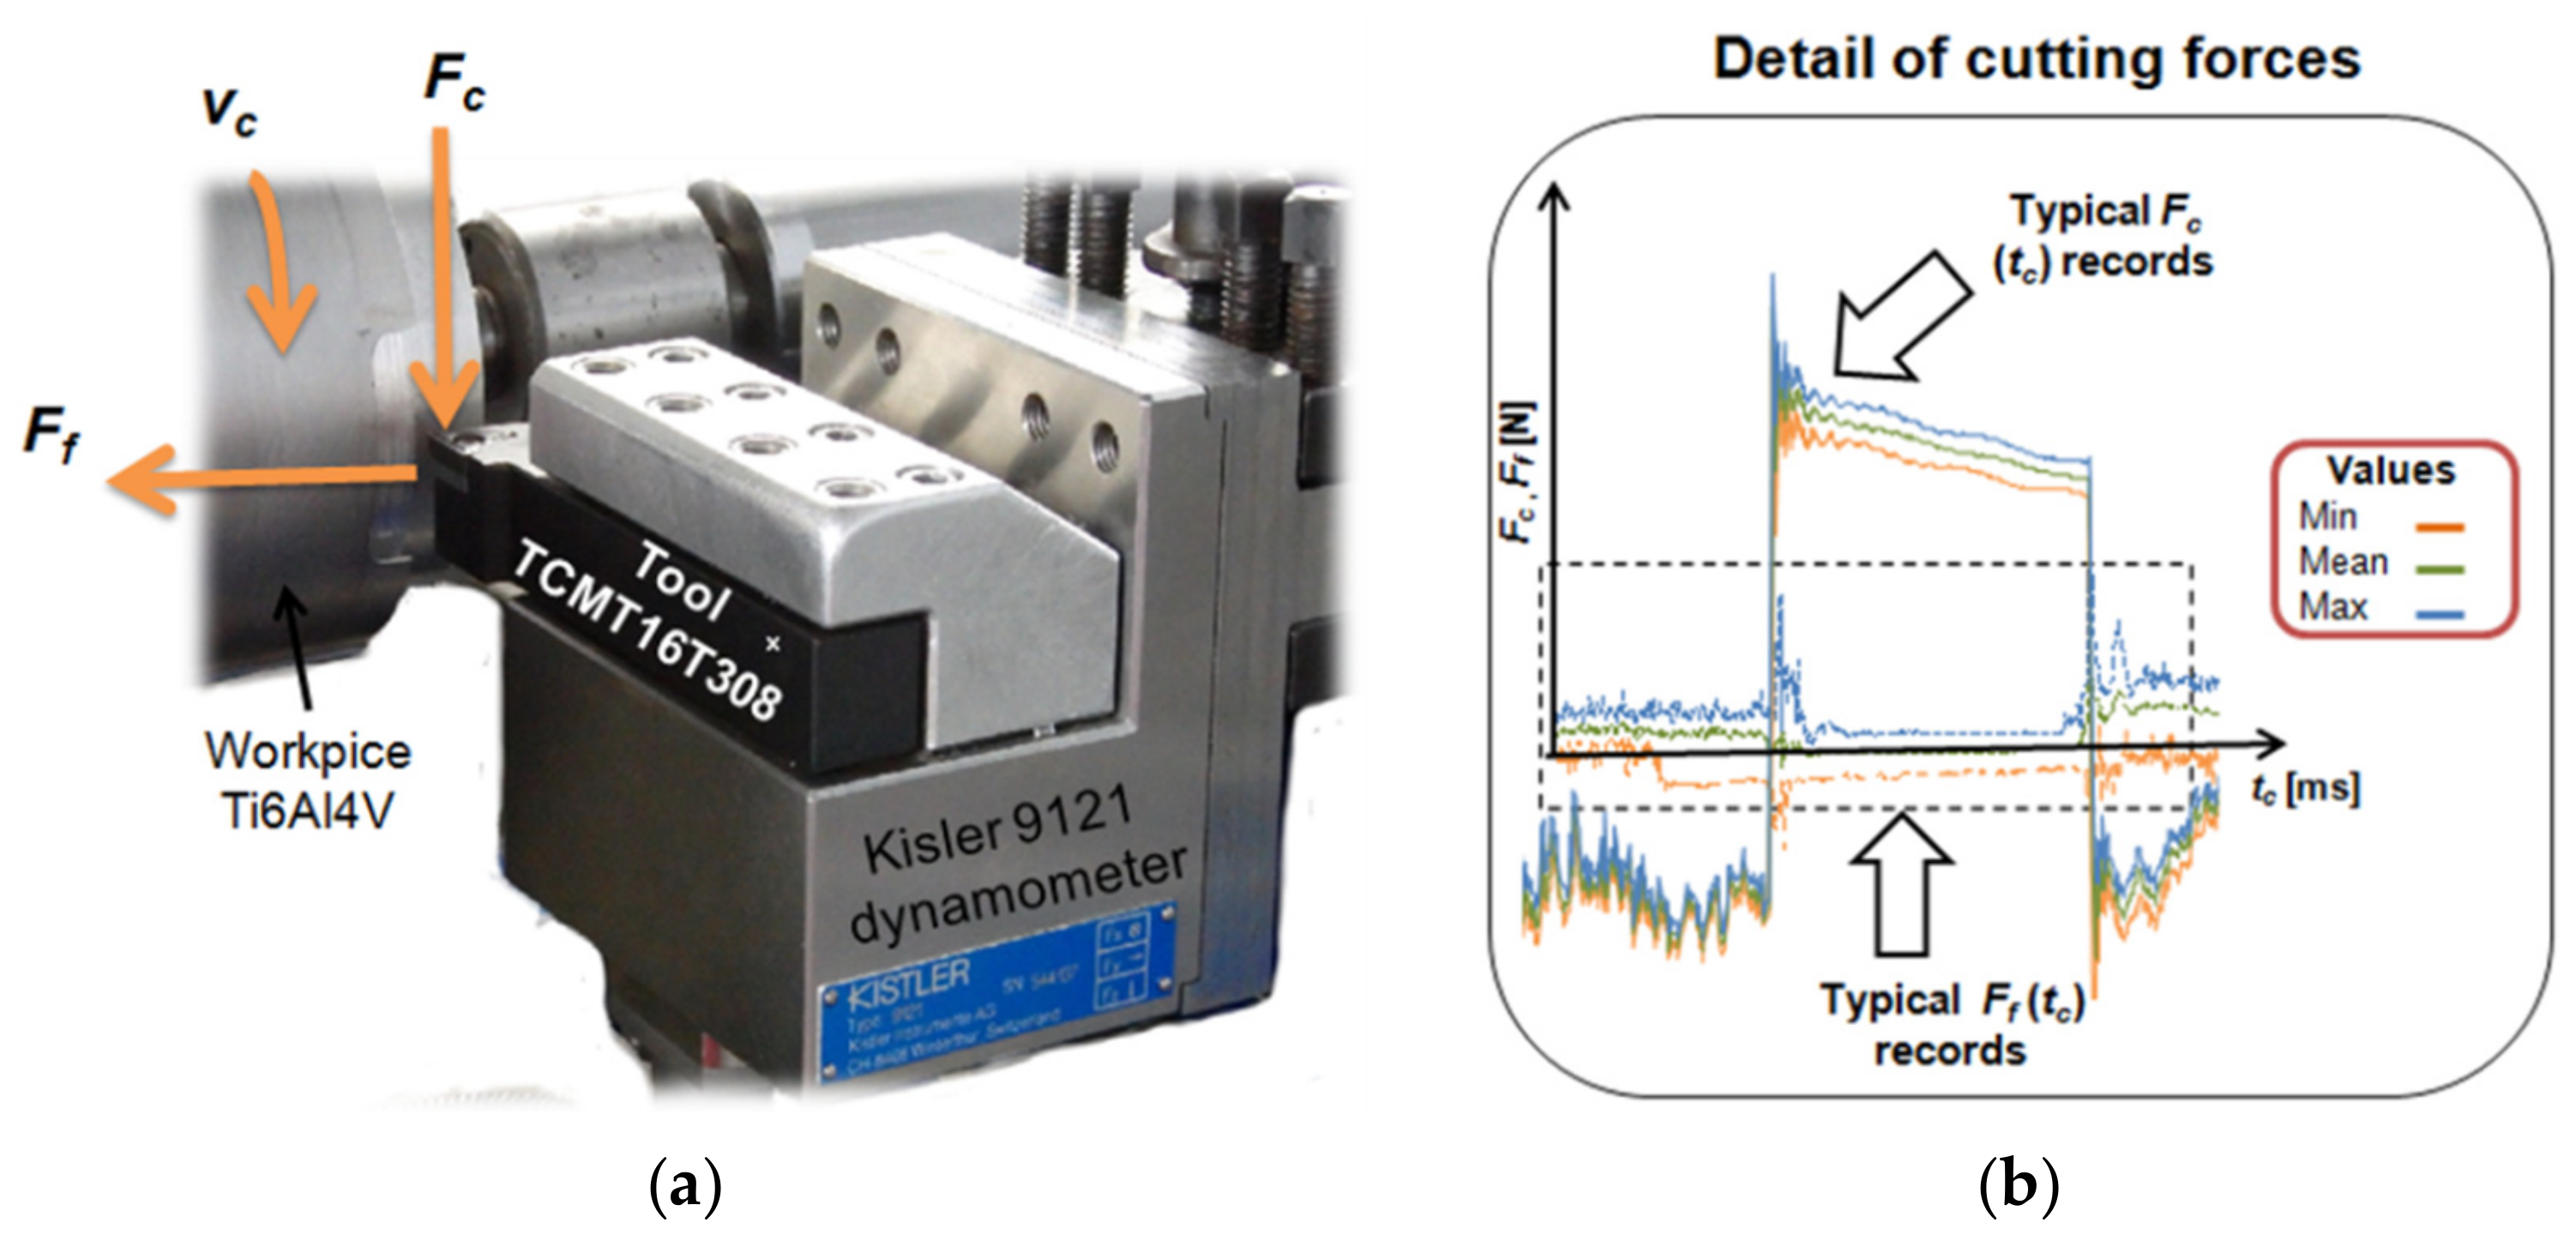
2. Materials and Experimental Procedure
3. Results and Discussion
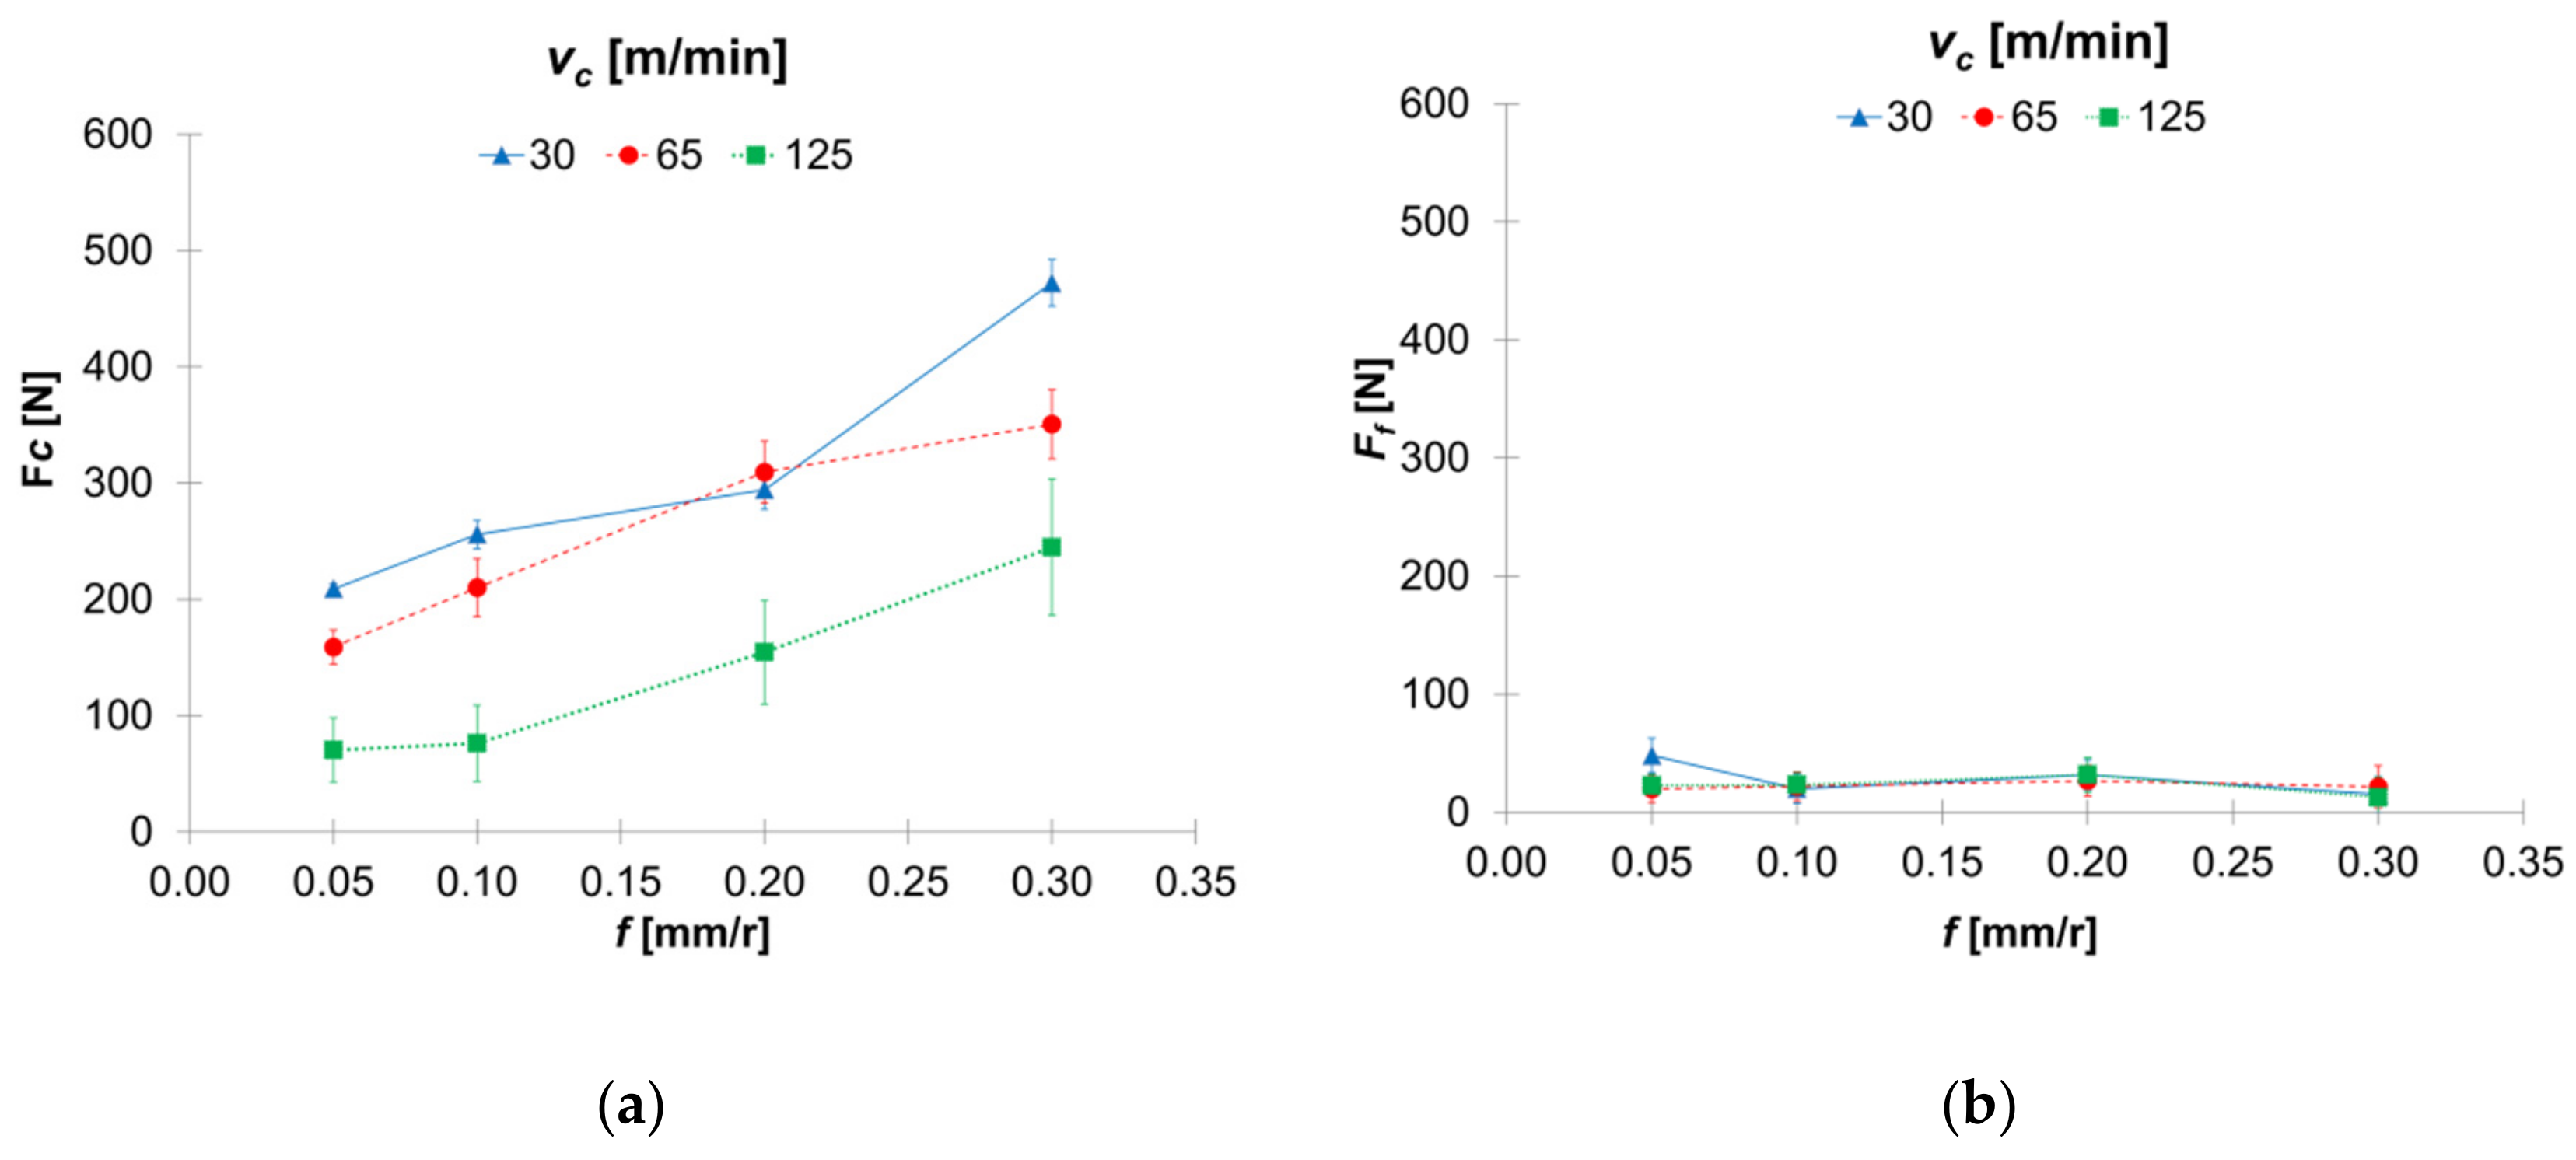
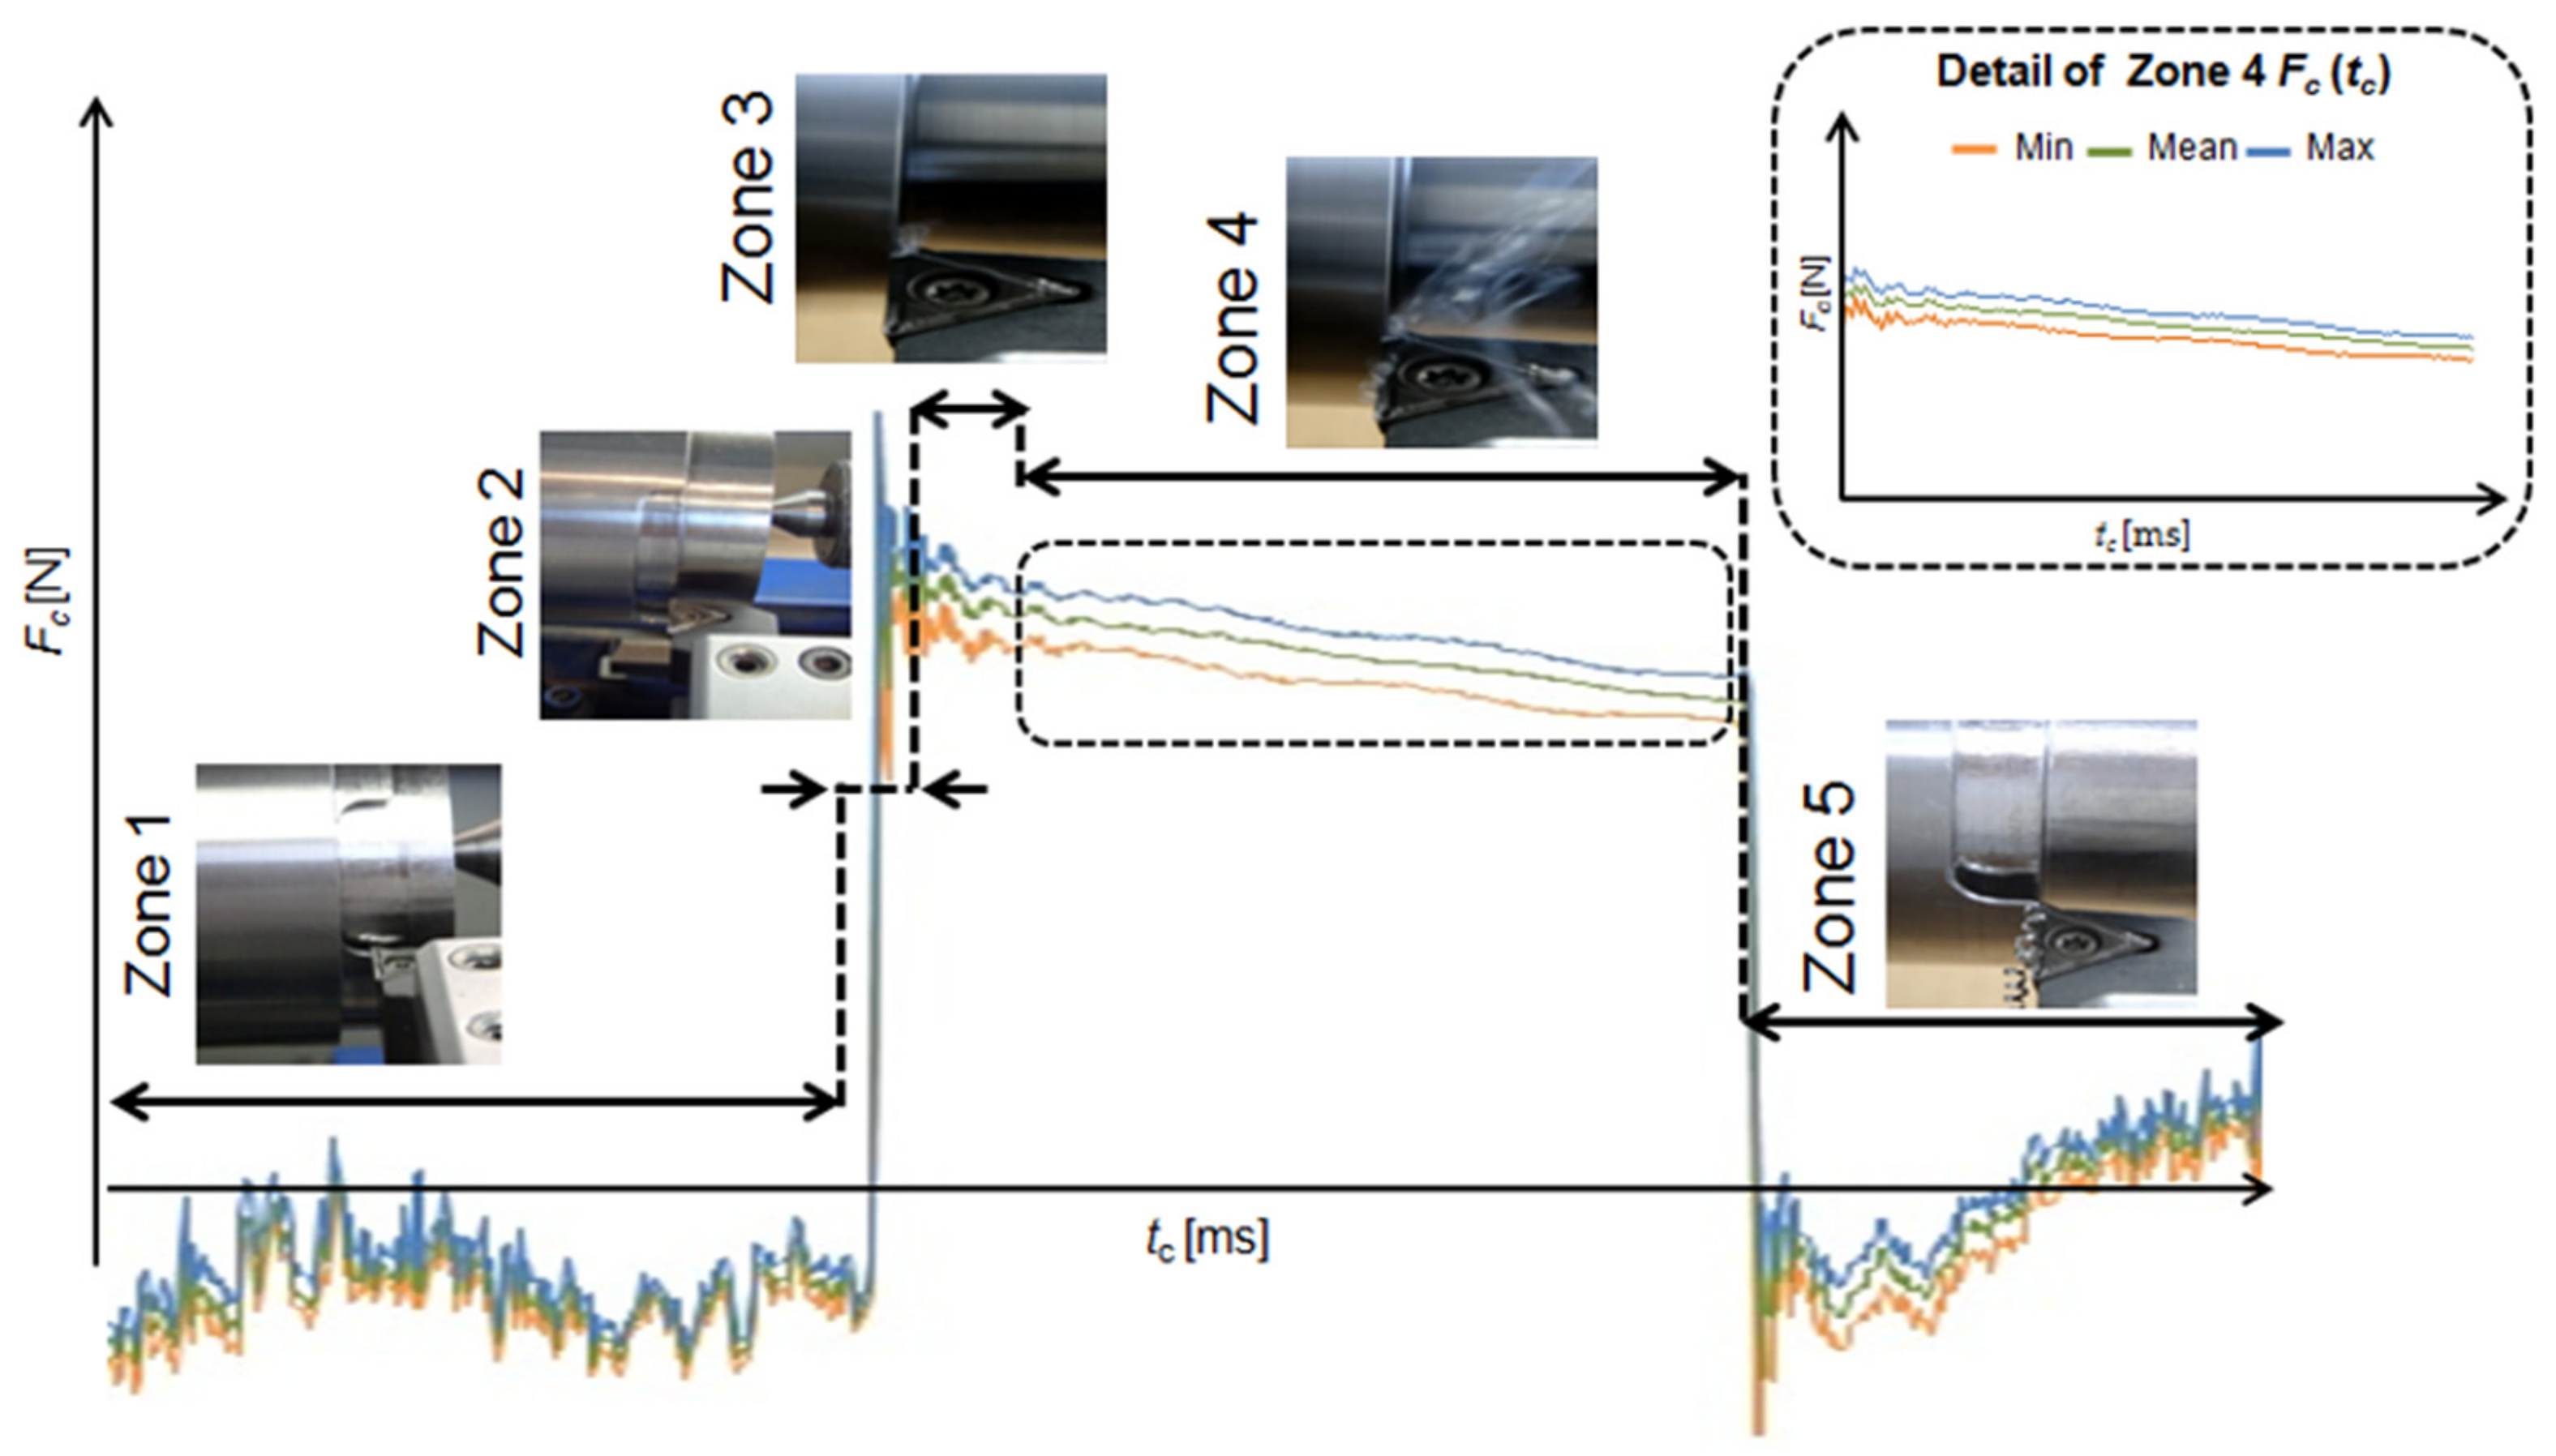
3.1. Dynamic Cutting Forces Amplitude Analysis
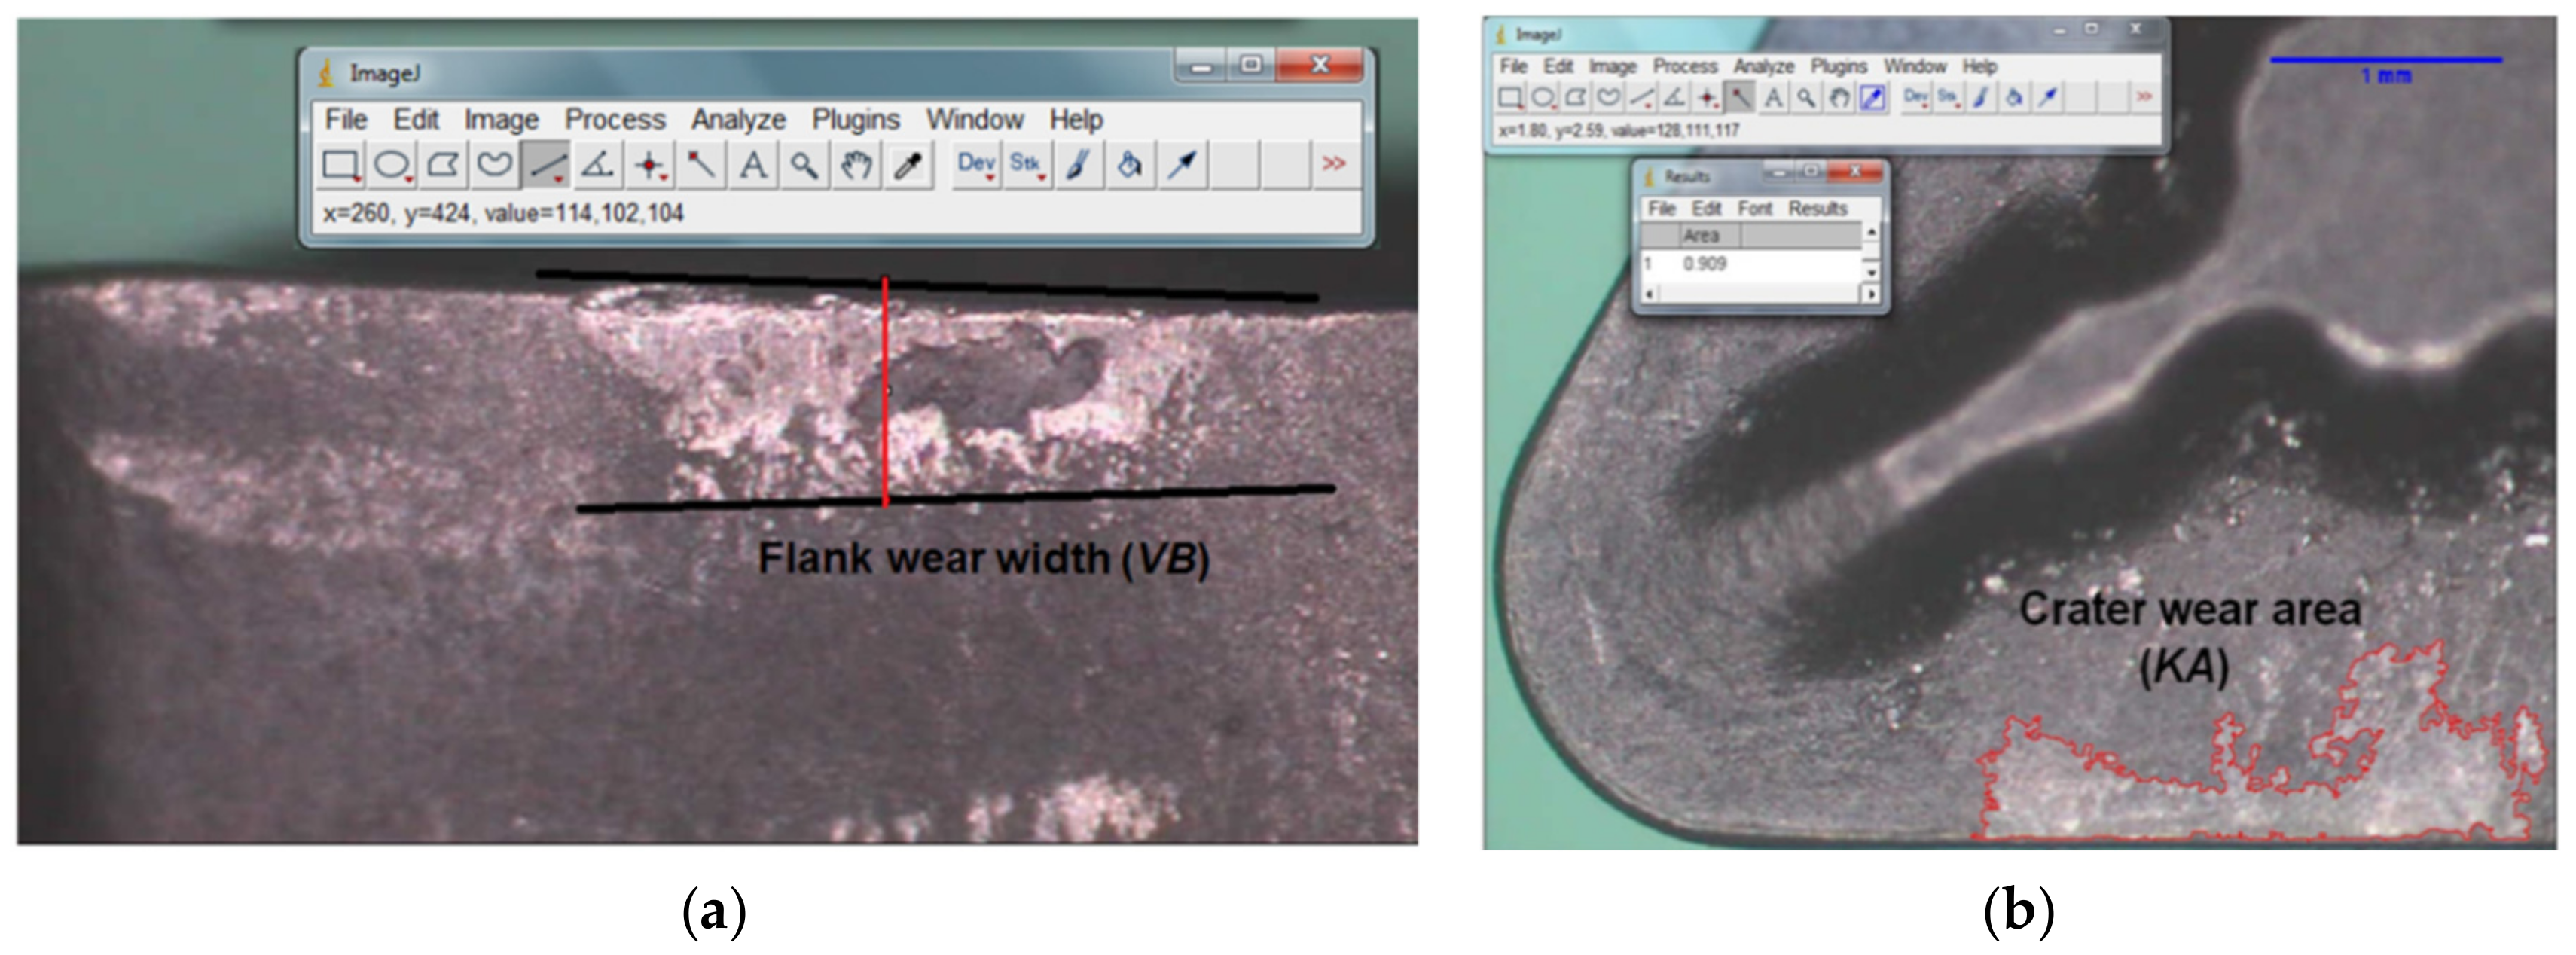
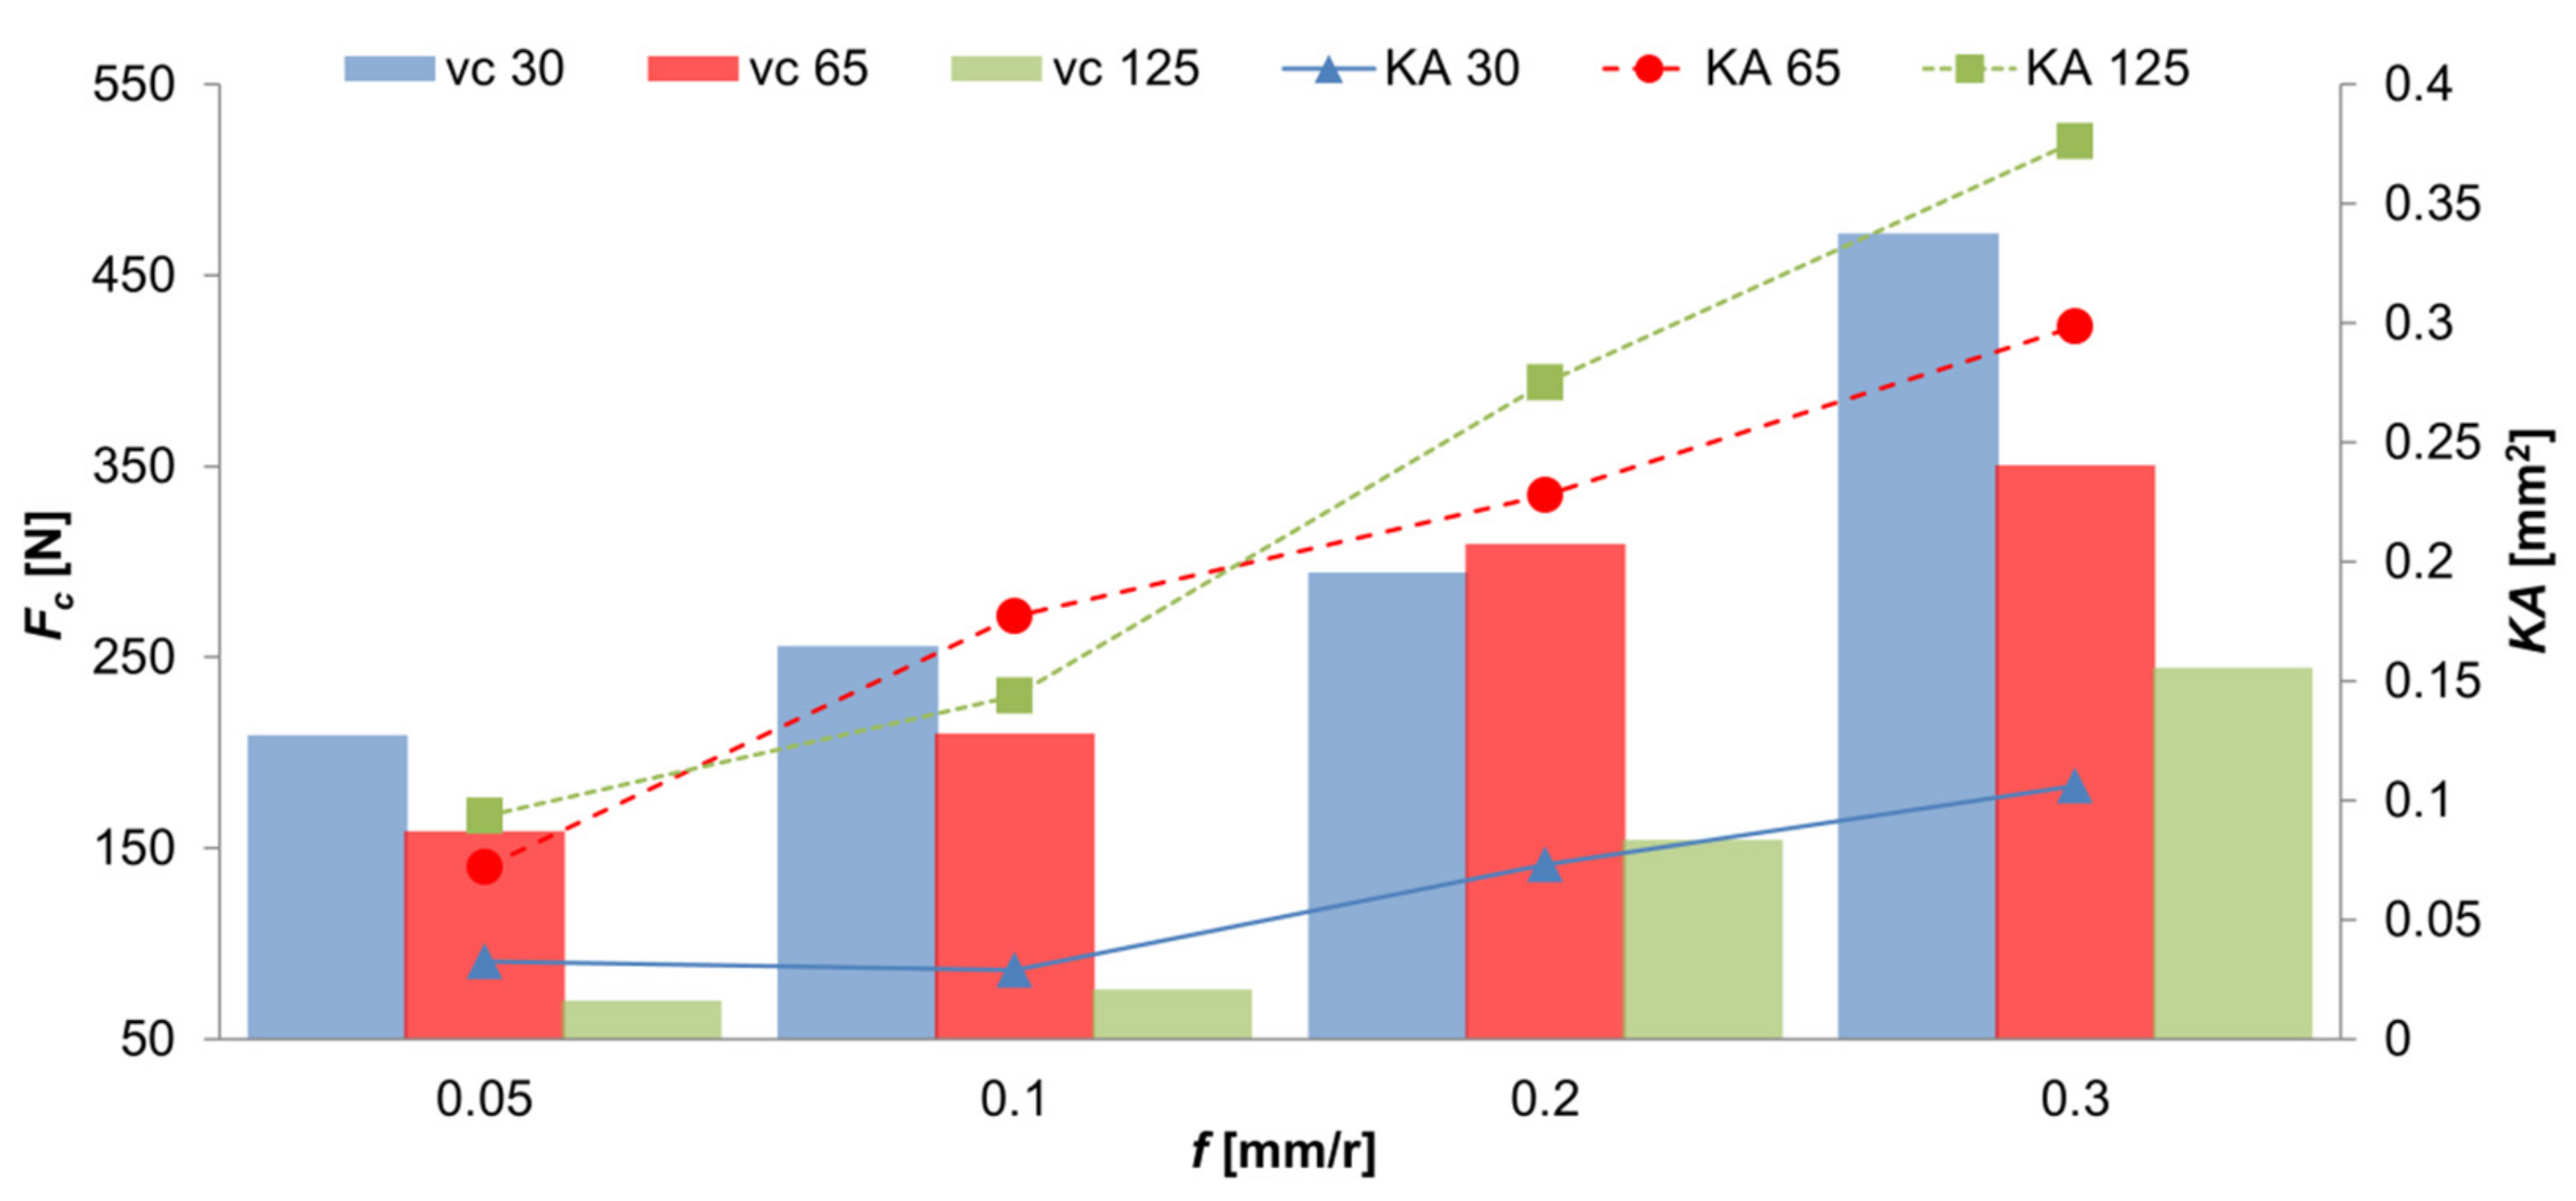
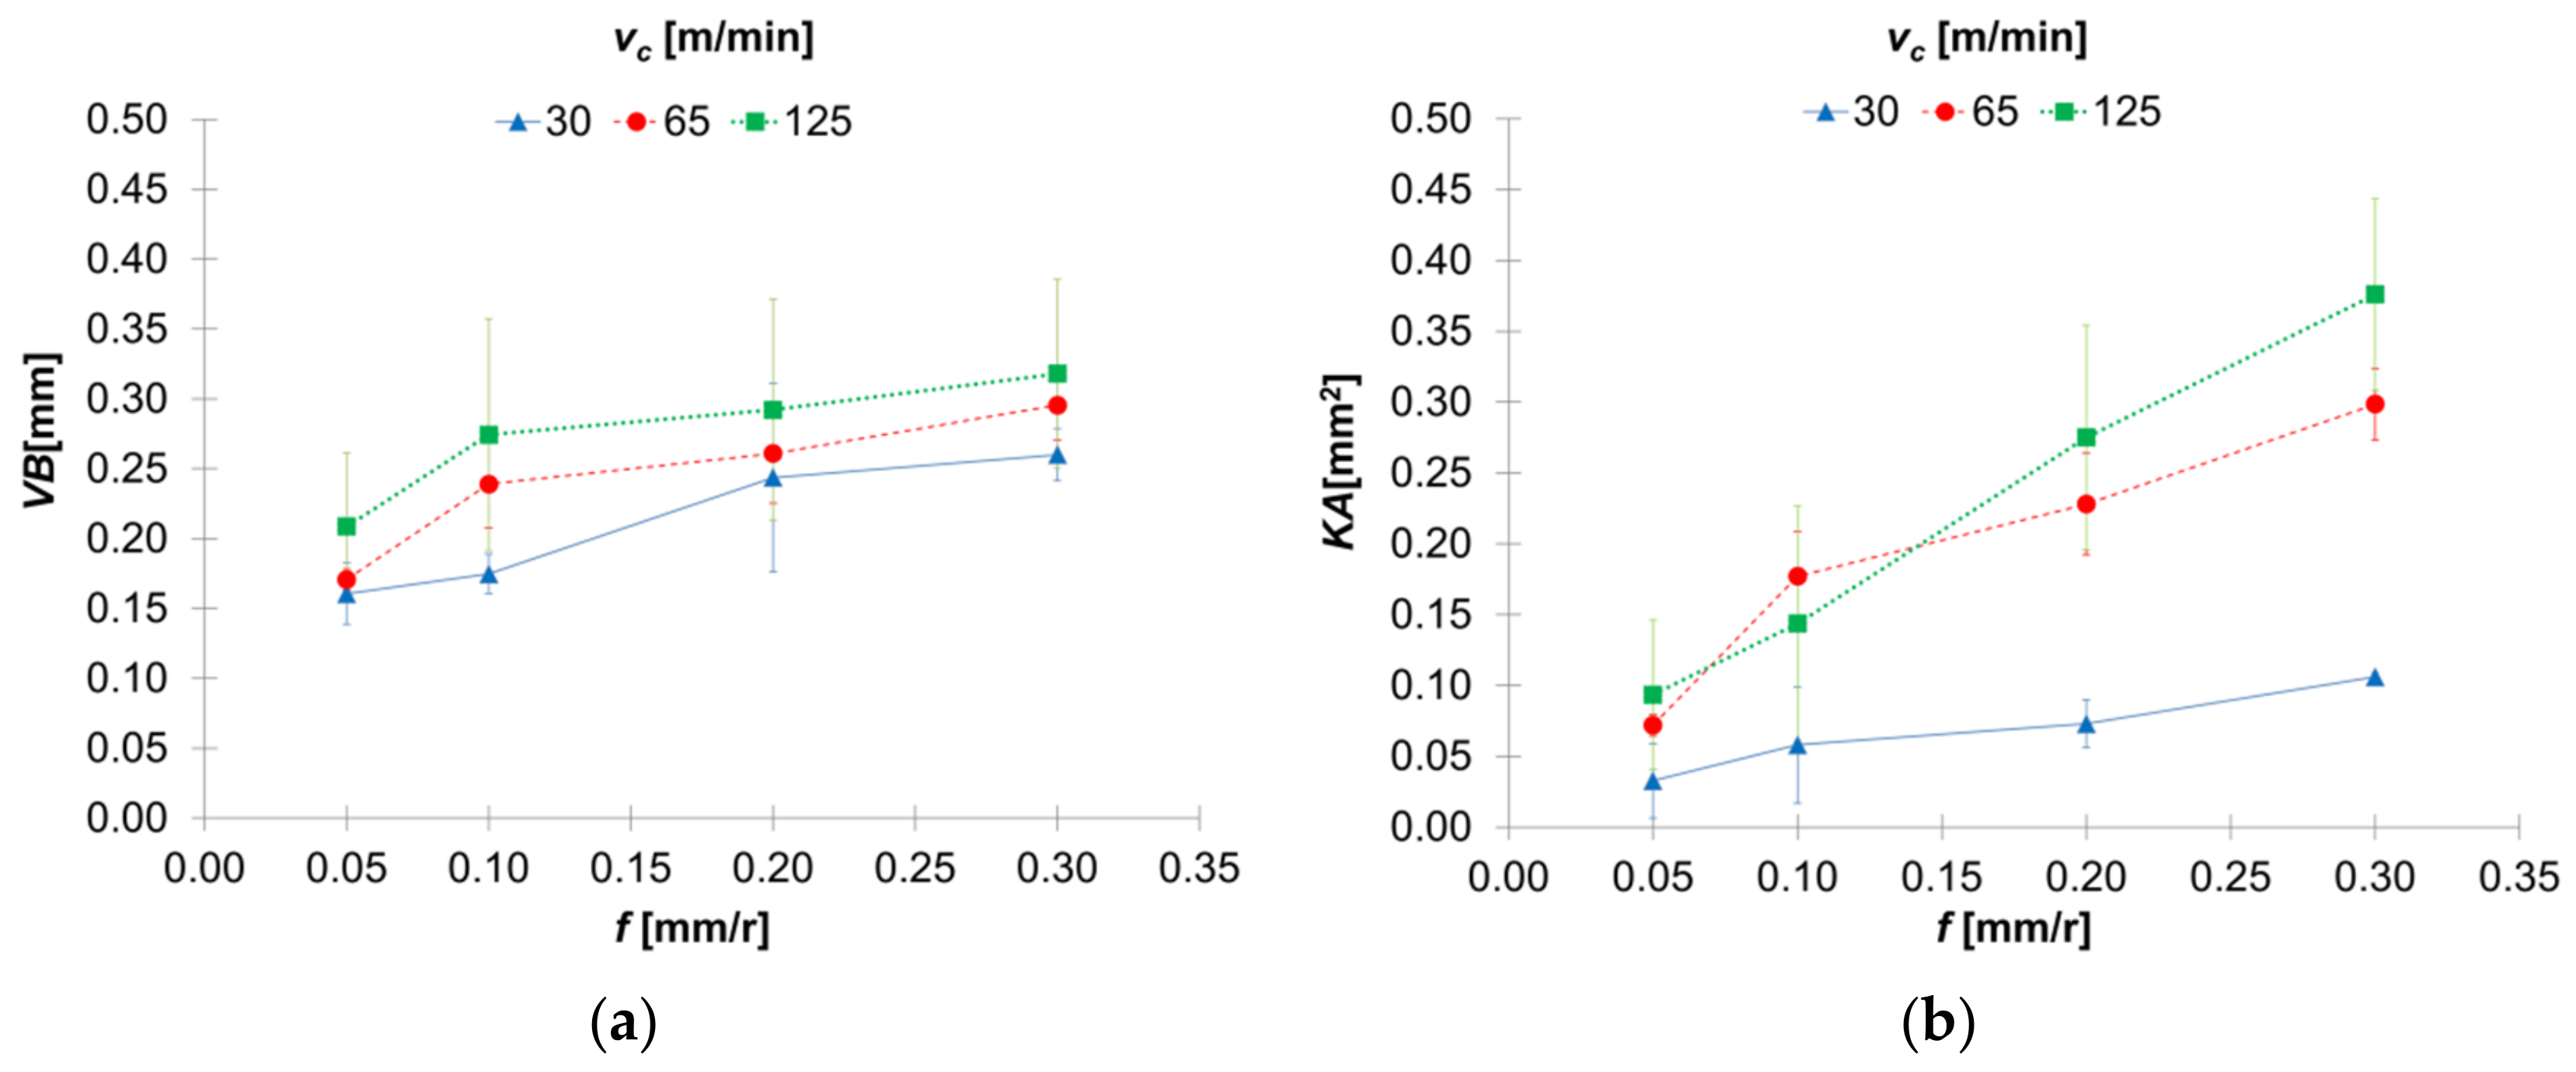
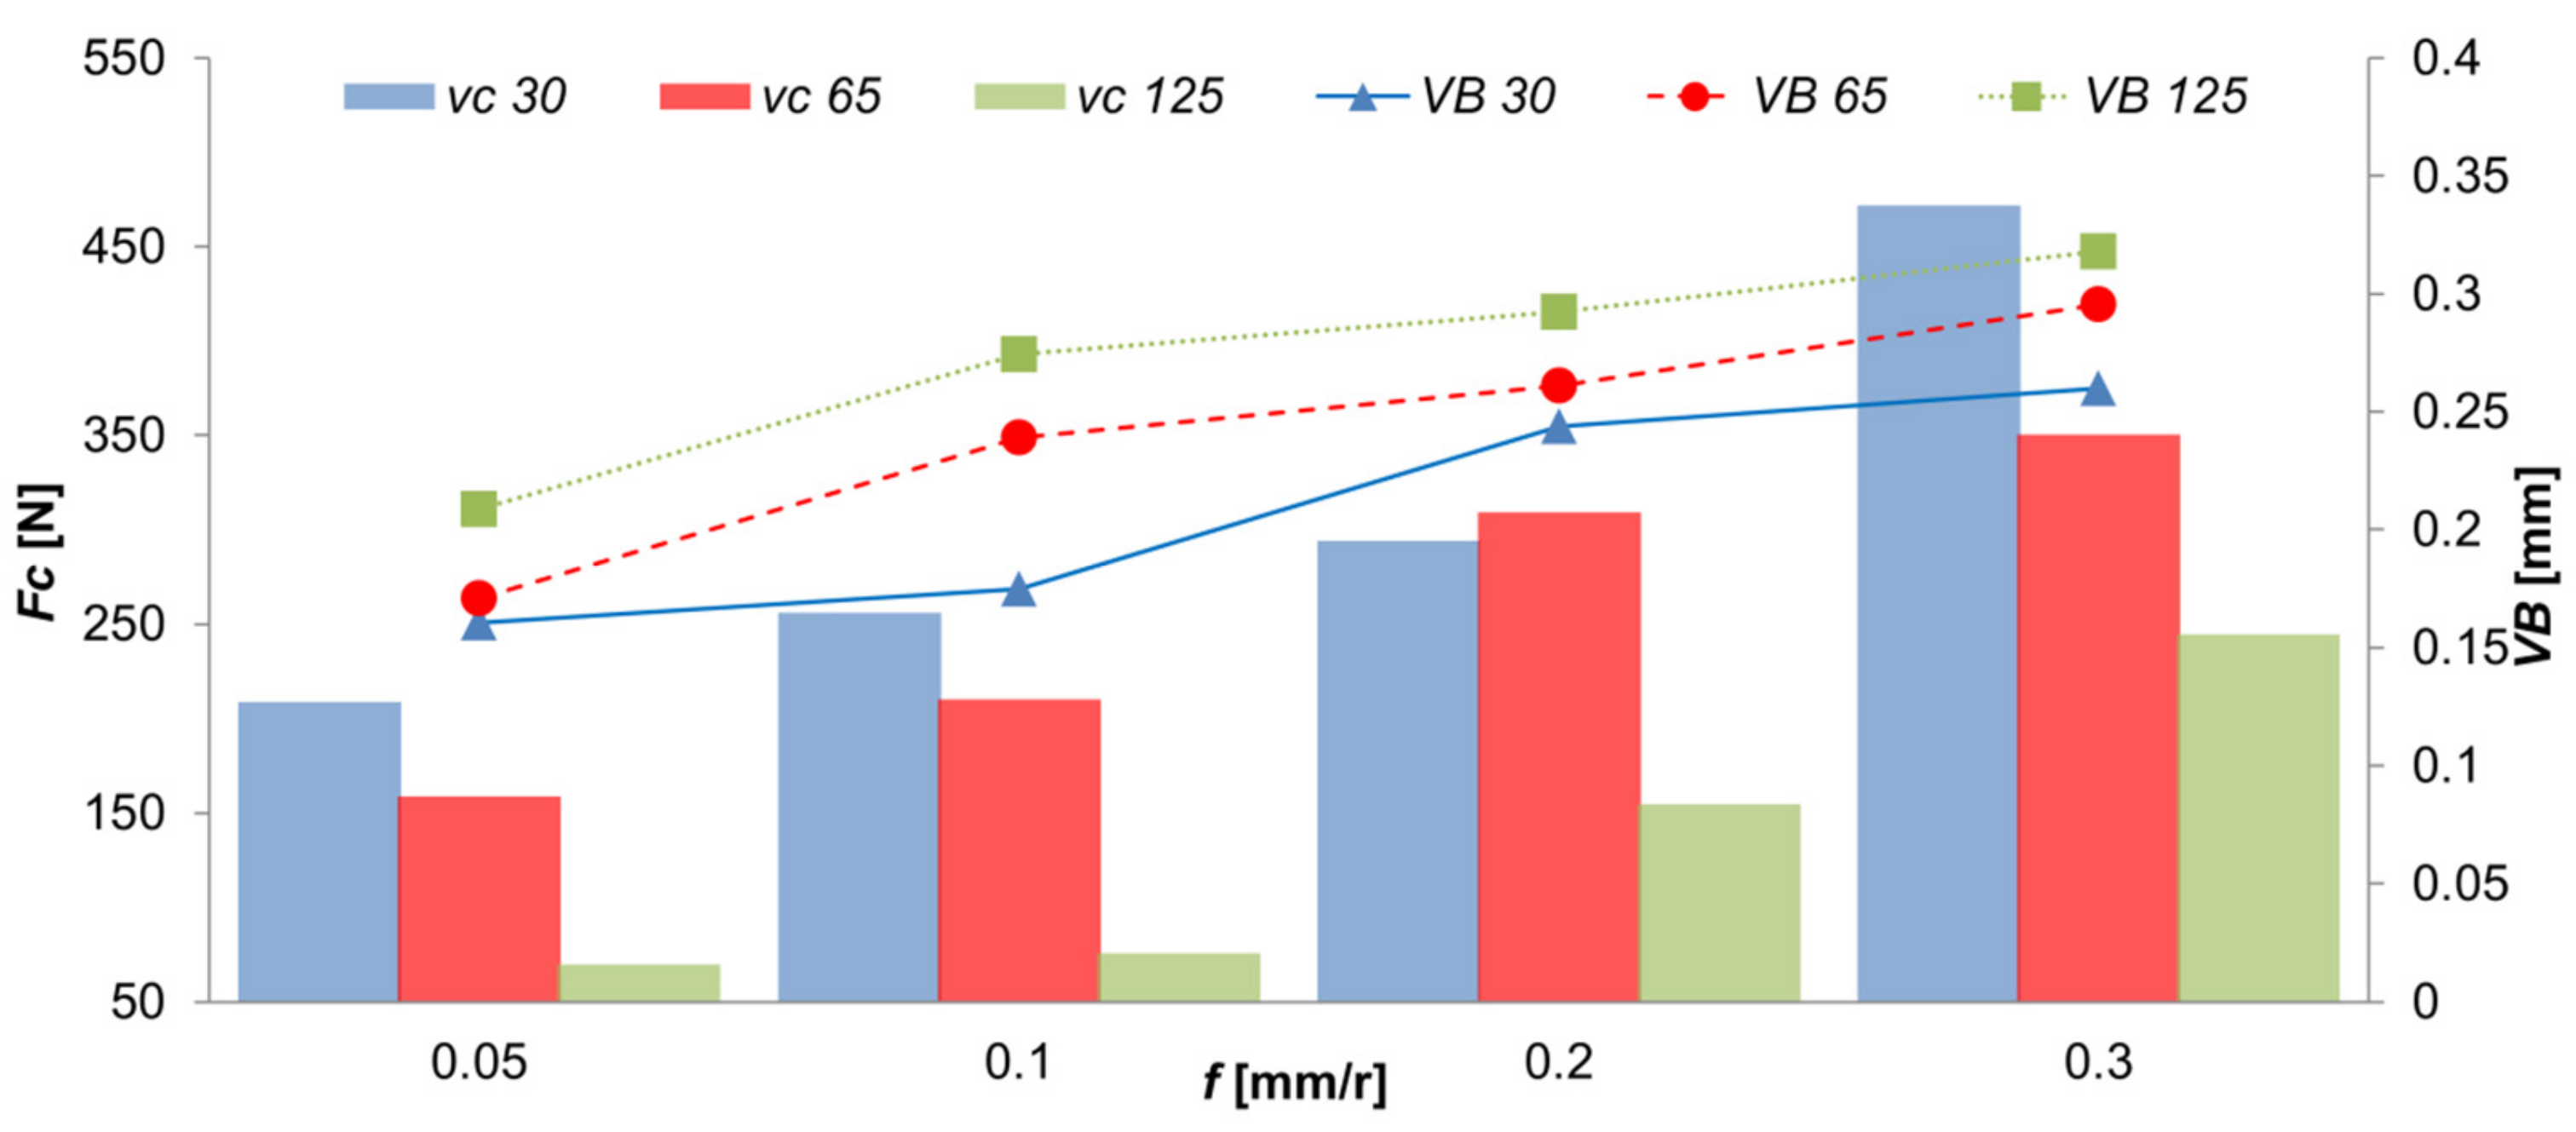
3.2. Tool Wear Online Monitoring
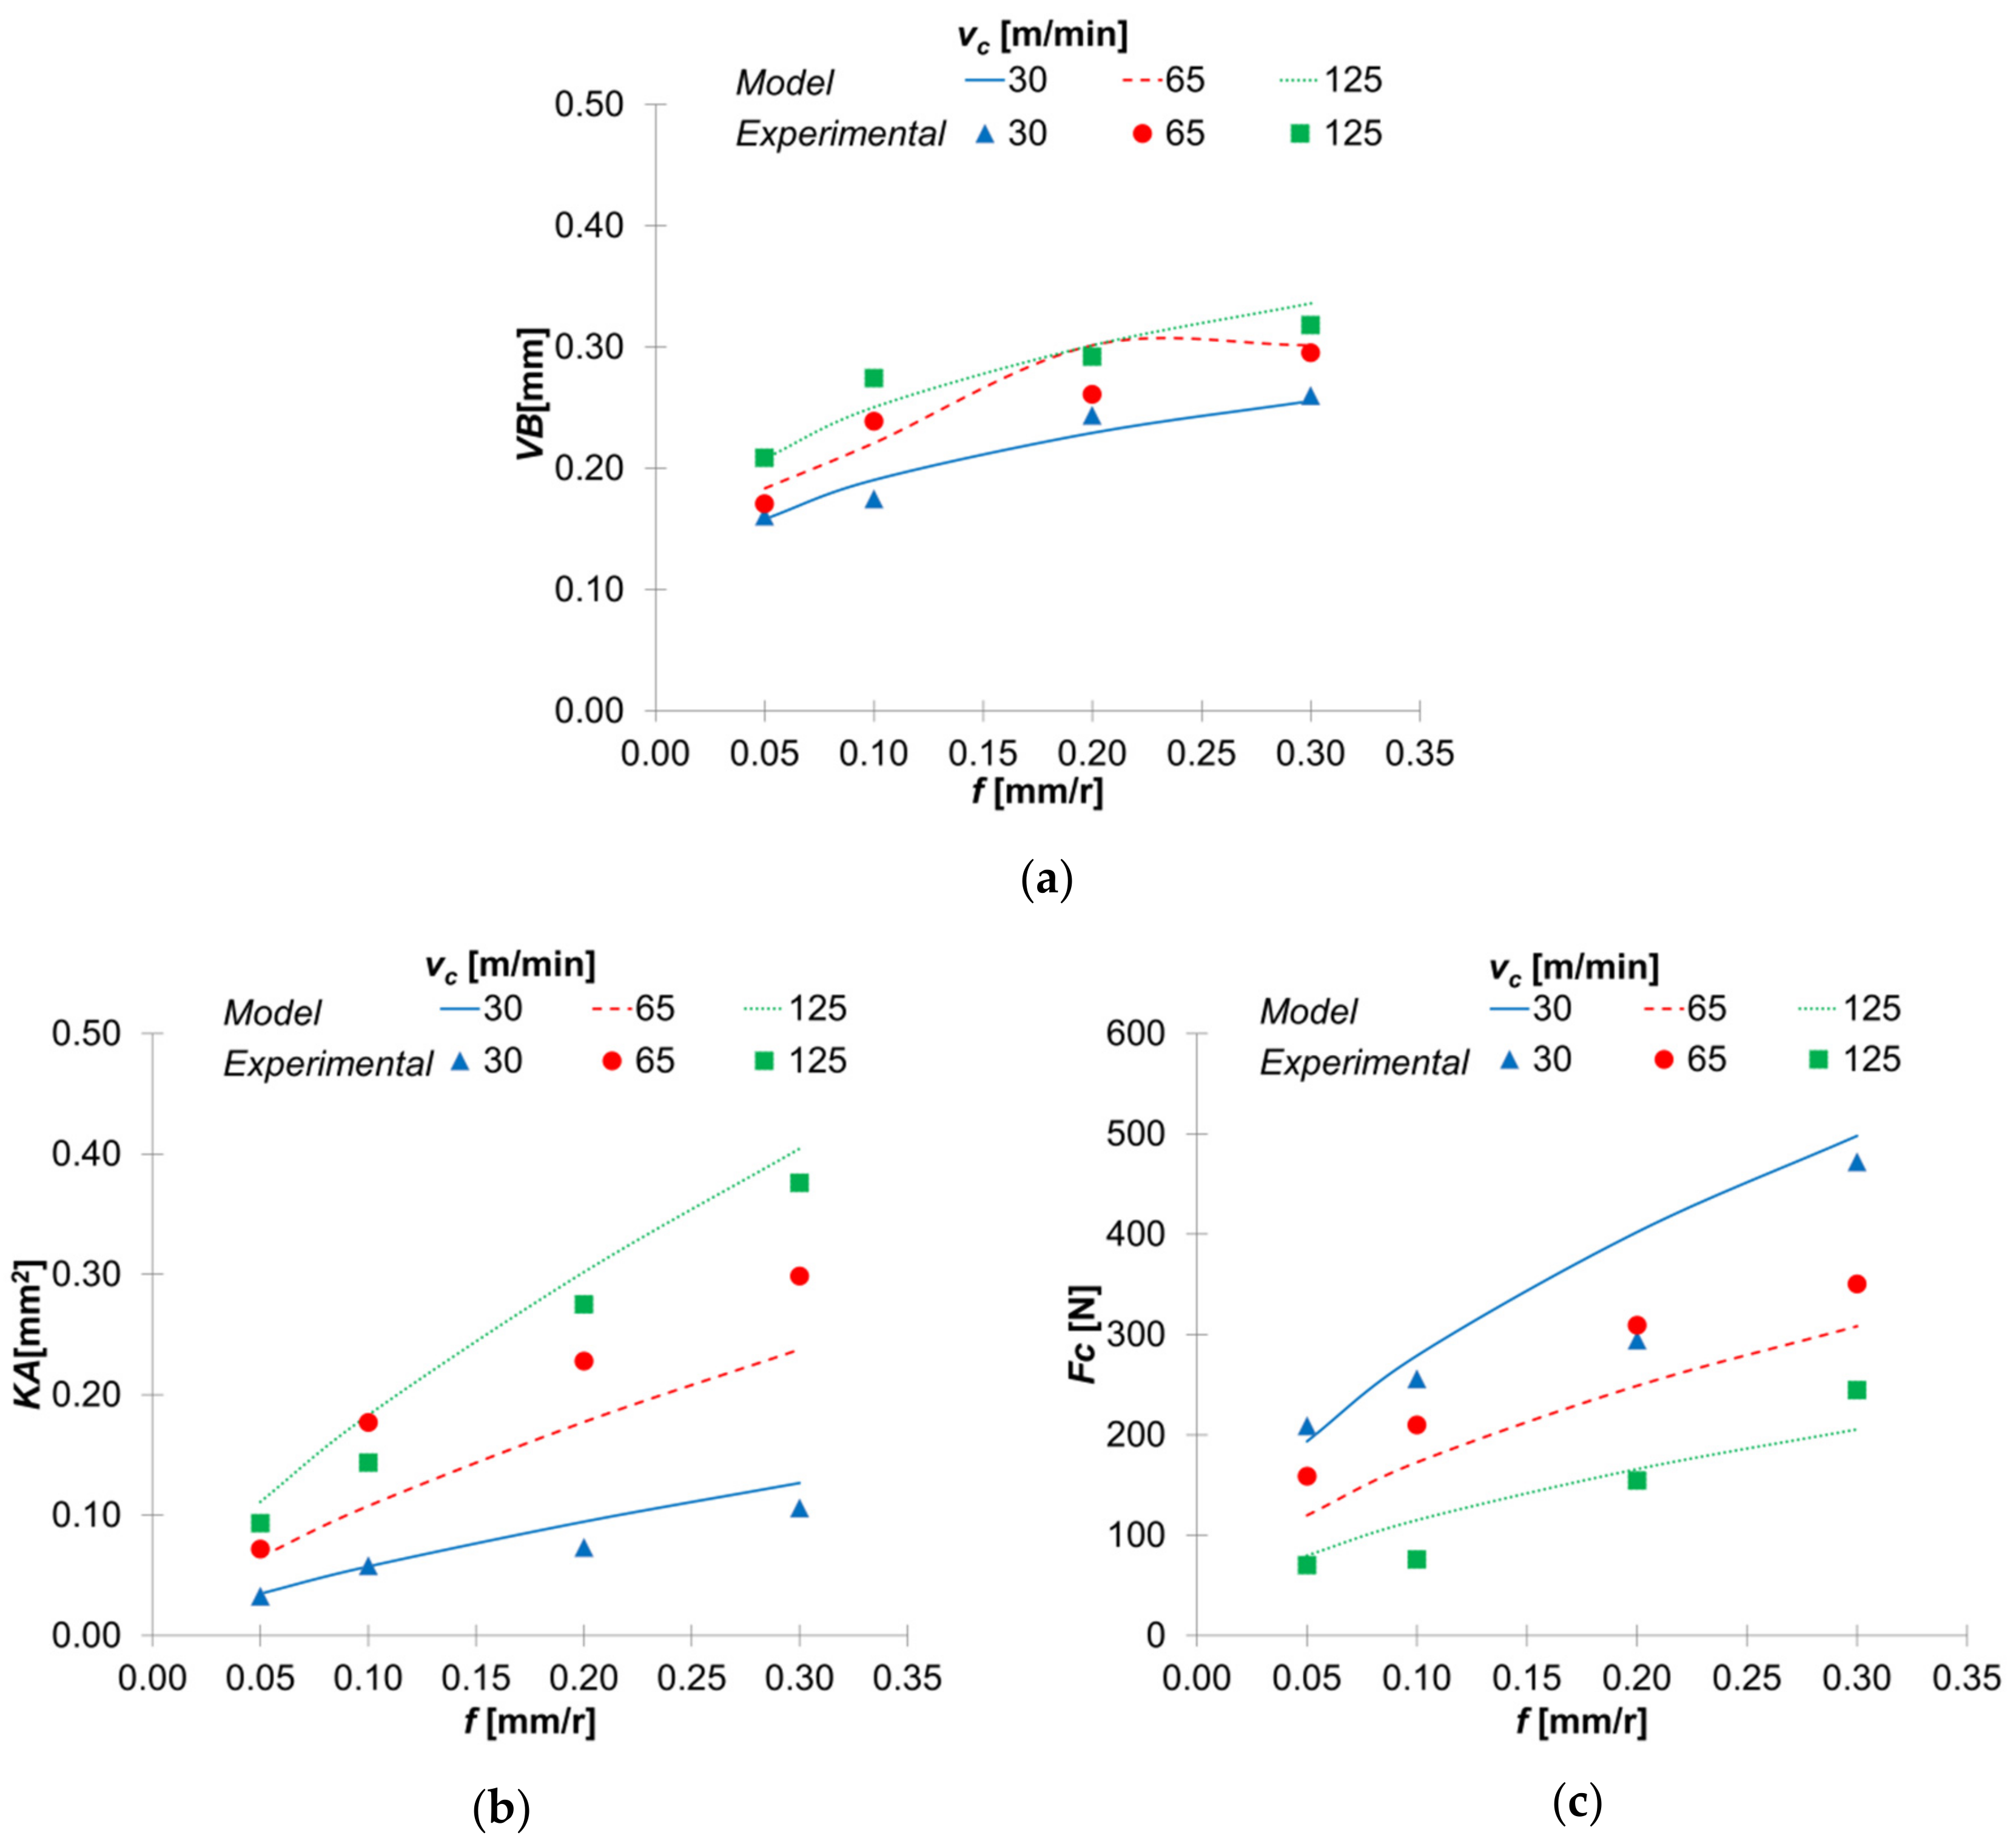
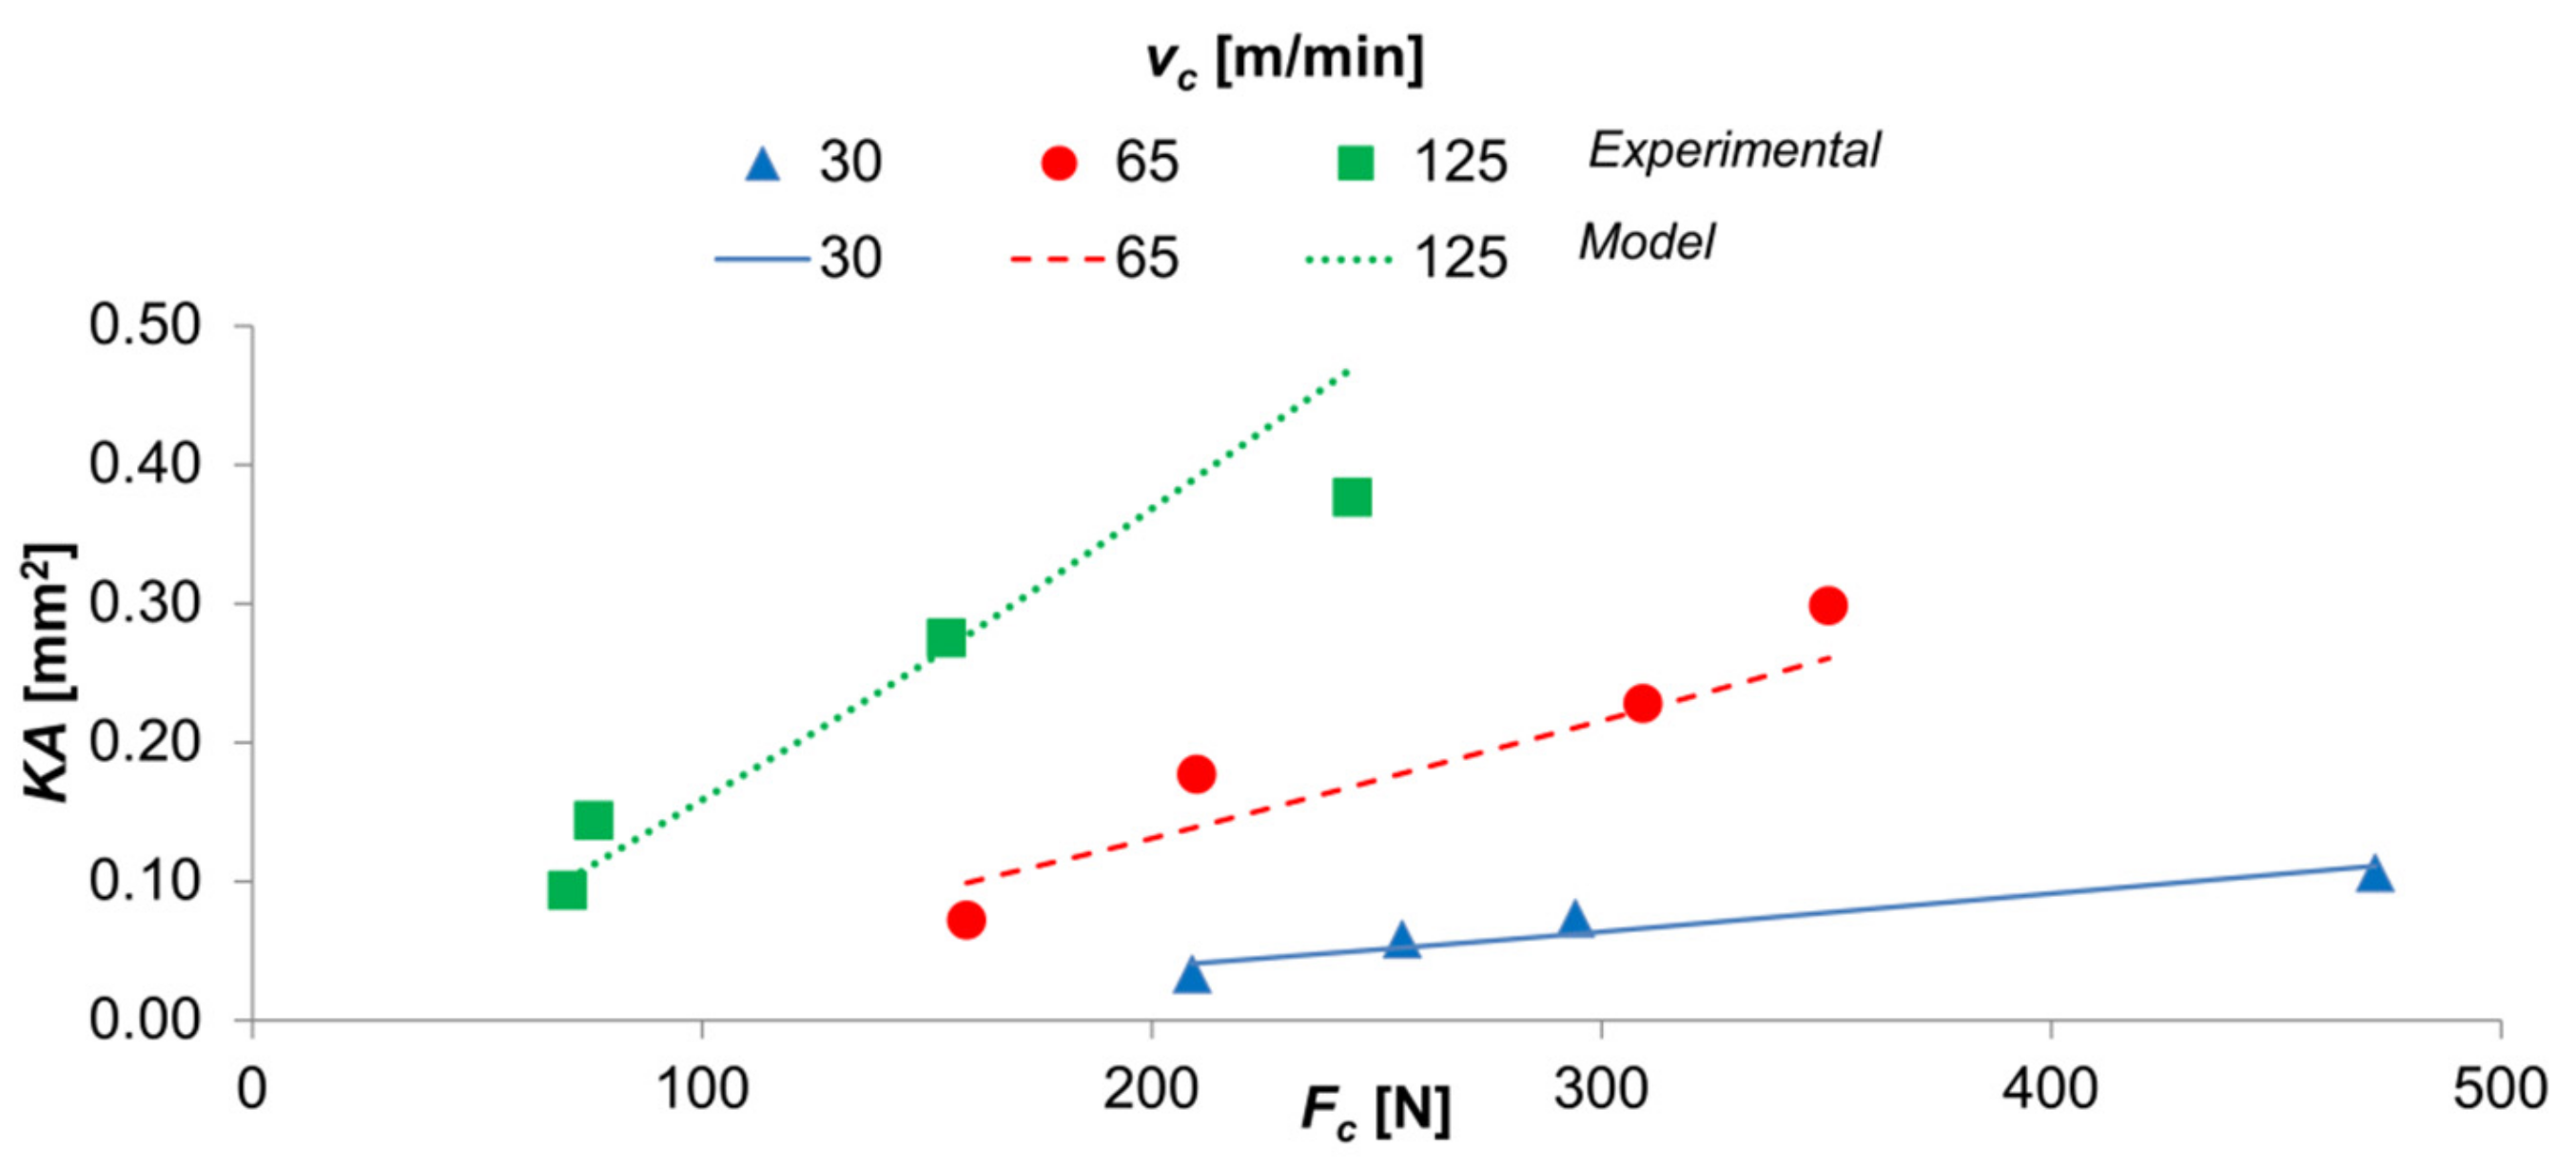
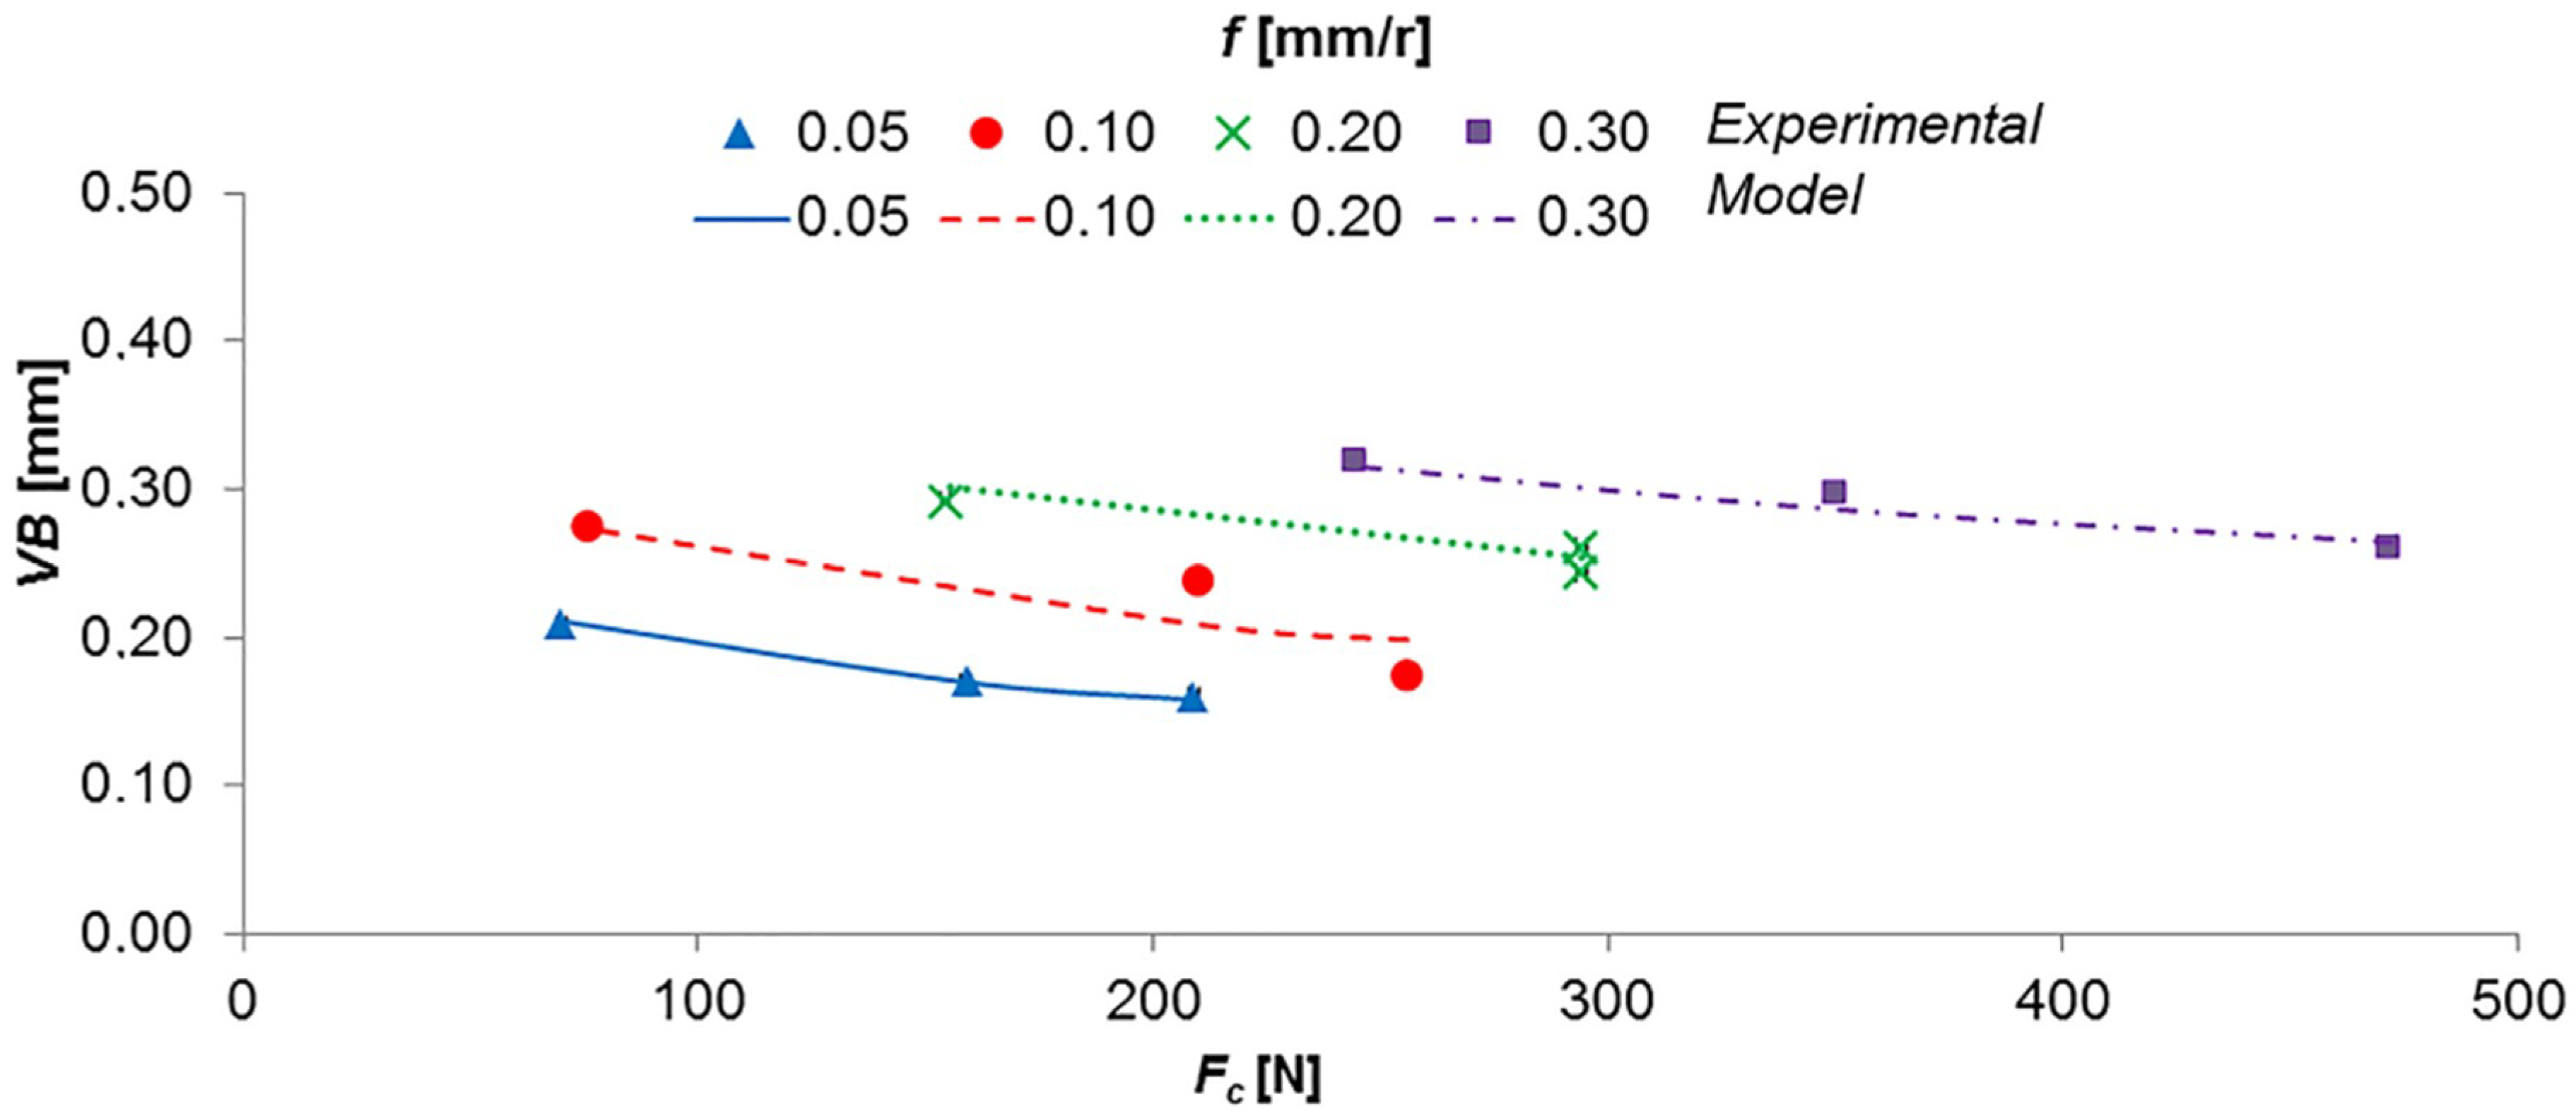
3.3. Experimental Parametric Models
4. Conclusions
Author Contributions
Funding
Acknowledgments
Conflicts of Interest
References
- López de lacalle, L.; Pérez, J.; Llorente, J.; Sánchez, J. Advanced cutting conditions for the milling of aeronautical alloys. J. Mater. Process. Technol. 2000, 100, 1–11. [Google Scholar] [CrossRef]
- Veiga, C.; Davim, J.P.; Loureiro, A.J.R. Properties and applications of titanium alloys: A brief review. Rev. Adv. Mater. Sci. 2012, 32, 133–148. [Google Scholar]
- Zhu, L.; Li, N.; Childs, P.R.N. Light-weighting in aerospace component and system design. Propuls. Power Res. 2018, 7, 103–119. [Google Scholar] [CrossRef]
- Hosseini, A.; Kishawy, H. Machining of Titanium Alloys; Materials Forming, Machining and Tribology; Davim, J.P., Ed.; Springer: Berlin/Heidelberg, Germany, 2014; ISBN 978-3-662-43901-2. [Google Scholar]
- Ezugwu, E.O.; Wang, Z.M. Titanium alloys and their machinability—A review. J. Mater. Process. Technol. 1997, 68, 262–274. [Google Scholar] [CrossRef]
- Kikuchi, M.; Okuno, O. Machinability Evaluation of Titanium Alloys. Dent. Mater. J. 2011, 23, 37–45. [Google Scholar] [CrossRef]
- Gupta, K.; Laubscher, R.F. Sustainable machining of titanium alloys: A critical review. Proc. Inst. Mech. Eng. Part B J. Eng. Manuf. 2017, 231, 2543–2560. [Google Scholar] [CrossRef]
- Maruda, R.W.; Krolczyk, G.M.; Wojciechowski, S.; Zak, K.; Habrat, W.; Nieslony, P. Effects of extreme pressure and anti-wear additives on surface topography and tool wear during MQCL turning of AISI 1045 steel. J. Mech. Sci. Technol. 2018, 32, 1585–1591. [Google Scholar] [CrossRef]
- Maruda, R.W.; Krolczyk, G.M.; Michalski, M.; Nieslony, P.; Wojciechowski, S. Structural and Microhardness Changes after Turning of the AISI 1045 Steel for Minimum Quantity Cooling Lubrication. J. Mater. Eng. Perform. 2017, 26, 431–438. [Google Scholar] [CrossRef]
- Ginting, A.; Nouari, M. Surface integrity of dry machined titanium alloys. Int. J. Mach. Tools Manuf. 2009, 49, 325–332. [Google Scholar] [CrossRef]
- Pramanik, A. Problems and solutions in machining of titanium alloys. Int. J. Adv. Manuf. Technol. 2014, 70, 919–928. [Google Scholar] [CrossRef]
- Trujillo, F.J.; Sevilla, L.; Marcos, M. Experimental Parametric Model for Indirect Adhesion Wear Measurement in the Dry Turning of UNS A97075 (Al-Zn) Alloy. Materials 2017, 10, 152. [Google Scholar] [CrossRef] [PubMed]
- Sánchez, Y.; Trujillo, F.J.; Bermudo, C.; Sevilla, L. Experimental Parametric Relationships for Chip Geometry in Dry Machining of the Ti6Al4V Alloy. Materials 2018, 11, 1260. [Google Scholar] [CrossRef] [PubMed]
- Niknam, S.A.; Khettabi, R.; Songmene, V. Chapter 1 Machinability and Machining of Titanium Alloys:A Review BT—Machining of Titanium Alloys. In Machining of Titanium Alloys; Springer: Berlin/Heidelberg, Germany, 2014; pp. 1–30. ISBN 978-3-662-43901-2. [Google Scholar]
- De Aguiar, M.M.; Diniz, A.E.; Pederiva, R. Correlating surface roughness, tool wear and tool vibration in the milling process of hardened steel using long slender tools. Int. J. Mach. Tools Manuf. 2013, 68, 1–10. [Google Scholar] [CrossRef]
- Calamaz, M.; Coupard, D.; Girot, F. A new material model for 2D numerical simulation of serrated chip formation when machining titanium alloy Ti-6Al-4V. Int. J. Mach. Tools Manuf. 2008, 48, 275–288. [Google Scholar] [CrossRef]
- Arrazola, P.-J.; Garay, A.; Iriarte, L.-M.; Armendia, M.; Marya, S.; Le Maître, F. Machinability of titanium alloys (Ti6Al4V and Ti555.3). J. Mater. Process. Technol. 2009, 209, 2223–2230. [Google Scholar] [CrossRef] [Green Version]
- Nouari, M.; Makich, H. Analysis of Physical Cutting Mechanisms and Their Effects on the Tool Wear and Chip Formation Process When Machining Aeronautical Titanium Alloys: Ti-6Al-4V and Ti-55531. In Machining of Titanium Alloys; Springer: Berlin/Heidelberg, Germany, 2014; pp. 79–111. ISBN 978-3-662-43901-2. [Google Scholar]
- Bejjani, R.; Odelros, S.; Kaplan, B.; Norgren, S.; Kritikos, M. Study of tool wear and chemical interaction during machining of Ti6Al4V. Int. J. Refract. Met. Hard Mater. 2017, 72, 253–256. [Google Scholar]
- Su, Y.; Li, L.; Wang, G.; Zhong, X. Cutting mechanism and performance of high-speed machining of a titanium alloy using a super-hard textured tool. J. Manuf. Process. 2018, 34, 706–712. [Google Scholar] [CrossRef]
- Liang, X.; Liu, Z.; Wang, B. State-of-the-art of surface integrity induced by tool wear effects in machining process of titanium and nickel alloys: A review. Meas. J. Int. Meas. Confed. 2019, 132, 150–181. [Google Scholar] [CrossRef]
- Hatt, O.; Crawforth, P.; Jackson, M. On the mechanism of tool crater wear during titanium alloy machining. Wear 2017, 374–375, 15–20. [Google Scholar] [CrossRef]
- Hatt, O.; Lomas, Z.; Thomas, M.; Jackson, M. The effect of titanium alloy chemistry on machining induced tool crater wear characteristics. Wear 2018, 408–409, 200–207. [Google Scholar] [CrossRef]
- Chen, L.; El-Wardany, T.I.; Harris, W.C. Modelling the effects of flank wear land and chip formation on residual stresses. CIRP Ann. Manuf. Technol. 2004, 53, 95–98. [Google Scholar] [CrossRef]
- Liang, L.; Liu, X.; Li, X.Q.; Li, Y.Y. Wear mechanisms of WC-10Ni3Al carbide tool in dry turning of Ti6Al4V. Int. J. Refract. Met. Hard Mater. 2015, 48, 272–285. [Google Scholar] [CrossRef]
- Dimla, D.E. Sensor signals for tool-wear monitoring in metal cutting operations—A review of methods. Int. J. Mach. Tools Manuf. 2000, 40, 1073–1098. [Google Scholar] [CrossRef]
- Ambhore, N.; Kamble, D.; Chinchanikar, S.; Wayal, V. Tool condition monitoring system: A review. Mater. Today Proc. 2015, 2, 3419–3428. [Google Scholar] [CrossRef]
- Dimla, D.E.; Lister, P.M. On-line metal cutting tool condition monitoring. Int. J. Mach. Tools Manuf. 2002, 40, 739–768. [Google Scholar] [CrossRef]
- Siddhpura, A.; Paurobally, R. A review of flank wear prediction methods for tool condition monitoring in a turning process. Int. J. Adv. Manuf. Technol. 2013, 40, 739–768. [Google Scholar] [CrossRef]
- Daymi, A.; Boujelbene, M.; Salem, S.B.; Hadj Sassi, B.; Torbaty, S.; Sassi, B.H. Effect of the cutting speed on the chip morphology and the cutting forces. Int. Sci. J. 2009, 1, 77–83. [Google Scholar]
- Rosa, P.A.R.; Kolednik, O.; Martins, P.A.F.; Atkins, A.G. The transient beginning to machining and the transition to steady-state cutting. Int. J. Mach. Tools Manuf. 2007, 47, 1904–1915. [Google Scholar] [CrossRef]
- Abdel Hamid, A.; Ali, Y. Experimental determination of dynamic forces during transient orthogonal cutting. J. Mater. Process. Technol. 1995, 55, 162–170. [Google Scholar] [CrossRef]
- Calamaz, M.; Coupard, D.; Girot, F. Numerical simulation of titanium alloy dry machining with a strain softening constitutive law. Mach. Sci. Technol. 2010, 14, 244–257. [Google Scholar] [CrossRef]
- Yameogo, D.; Haddag, B.; Makich, H.; Nouari, M. Prediction of the Cutting Forces and Chip Morphology When Machining the Ti6Al4V Alloy Using a Microstructural Coupled Model. Procedia CIRP 2017, 58, 335–340. [Google Scholar] [CrossRef]
- Outeiro, J.C.; Umbrello, D.; M’Saoubi, R.; Jawahir, I. Evaluation of present numerical models for predicting metal cutting performance and residual stresses. Mach. Sci. Technol. 2015, 19, 183–216. [Google Scholar] [CrossRef]
- Melkote, S.N.; Grzesik, W.; Outeiro, J.; Rech, J.; Schulze, V.; Attia, H.; Arrazola, P.J.; M’Saoubi, R.; Saldana, C. Advances in material and friction data for modelling of metal machining. CIRP Ann. Manuf. Technol. 2017, 66, 731–754. [Google Scholar] [CrossRef] [Green Version]
- Arrazola, P.J.; Özel, T.; Umbrello, D.; Davies, M.; Jawahir, I.S. Recent advances in modelling of metal machining processes. CIRP Ann. Manuf. Technol. 2013, 62, 695–718. [Google Scholar] [CrossRef]
- Trujillo, F.J.; Sevilla, L.; Marcos, M. Cutting speed-feed coupled experimental model for geometric deviations in the dry turning of UNS A97075 Al-Zn alloys. Adv. Mech. Eng. 2014, 2014, 1–11. [Google Scholar] [CrossRef]
- Trujillo, F.J.; Sevilla, L.; Martín, F.; Bermudo, C. Analysis of the Chip Geometry in Dry Machining of Aeronautical Aluminum Alloys. Appl. Sci. 2017, 7, 132. [Google Scholar]
- Yang, X.; Liu, C.R. Machining Science and Technology: An International Machining Titanium and Its Alloys; Taylor and Francis: London, UK, 2012; ISBN 1094034990894. [Google Scholar]
- Hayajneh, M.T.; Astakhov, V.P.; Osman, M.O.M. An analytical evaluation of the cutting forces in orthogonal cutting using a dynamic model of the shear zone with parallel boundaries. J. Mater. Process. Technol. 1998, 82, 61–77. [Google Scholar] [CrossRef]
- ISO. Tool-Life Testing with Single-Point Turning Tools; ISO: Geneva, Switzerland, 1993; Volume 3685, pp. 1–50. [Google Scholar]
- Zoya, Z.; Krishnamurthy, R. The performance of CBN tools in the machining of titanium alloys. J. Mater. Process. Technol. 2000, 100, 80–86. [Google Scholar] [CrossRef]


| Alloy | C | Fe | N | O | Al | V | Ti |
|---|---|---|---|---|---|---|---|
| Ti6Al4V | 0.80 | 0.164 | 0.05 | 0.05 | 5.47 | 4.09 | Rest |
| f (mm/r) | vc (m/min) | ap (mm) |
|---|---|---|
| 0.05 | 30 65 125 | 1 |
| 0.10 | ||
| 0.20 | ||
| 0.30 |
| vc (m/min) | f (mm/r) | ||||
|---|---|---|---|---|---|
| 0.30 | 0.20 | 0.10 | 0.05 | ||
| 30 | Rake face |  |  |  |  |
| Flank face |  | 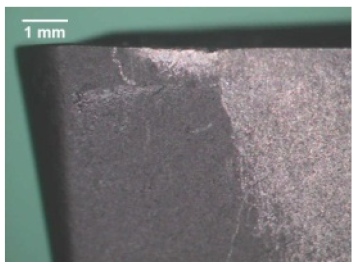 | 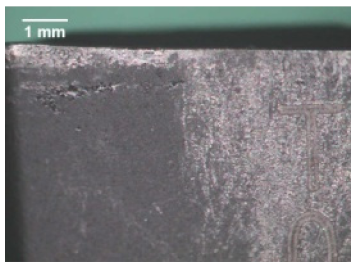 |  | |
| Tool edges | 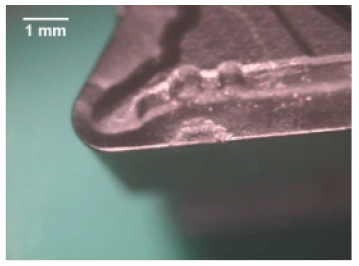 | 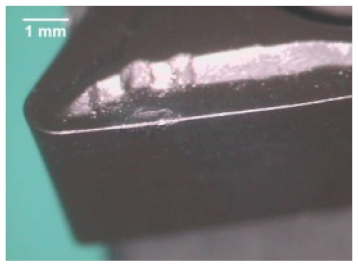 |  |  | |
| 65 | Rake face |  | 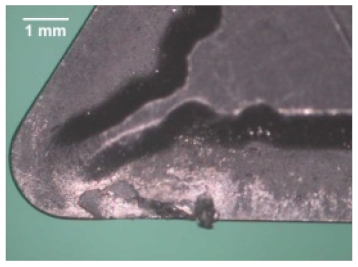 | 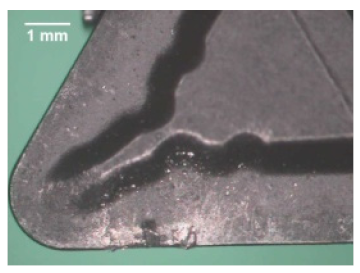 | 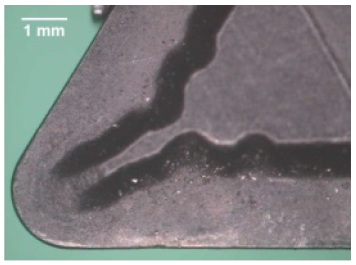 |
| Flank face | 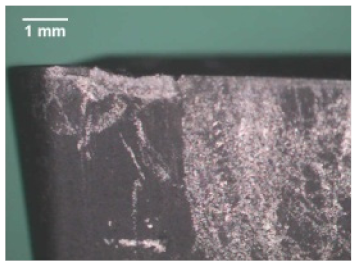 |  | 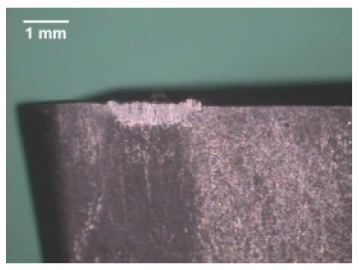 | 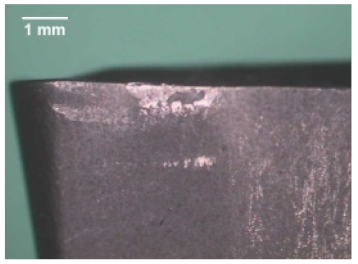 | |
| Tool edges |  | 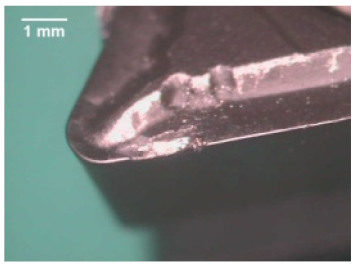 | 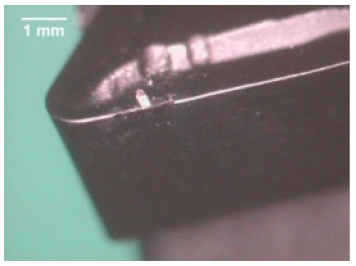 |  | |
| 125 | Rake face |  |  |  |  |
| Flank face | 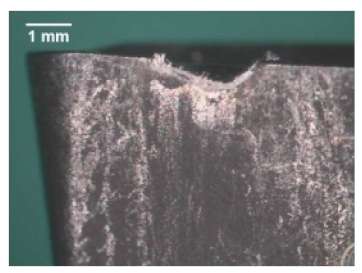 |  |  |  | |
| Tool edges | 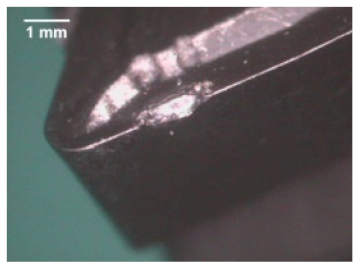 |  | 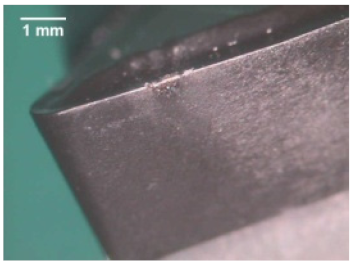 | 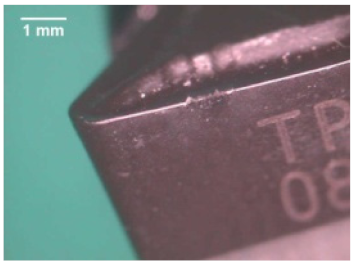 | |
| OV | K | x | y | R2 |
|---|---|---|---|---|
| Fc | 7746.67 | −0.62 | 0.52 | 0.82 |
| VB | 0.18 | 0.19 | 0.26 | 0.92 |
| KB | 0.019 | 0.81 | 0.72 | 0.88 |
| GP | K | x | y | R2 |
|---|---|---|---|---|
| VB | 2.19 | 0.41 | −0.26 | 0.91 |
| KA | 2.8 × 10⁻⁷ | 1.57 | 1.22 | 0.93 |
© 2019 by the authors. Licensee MDPI, Basel, Switzerland. This article is an open access article distributed under the terms and conditions of the Creative Commons Attribution (CC BY) license (http://creativecommons.org/licenses/by/4.0/).
Share and Cite
Sánchez Hernández, Y.; Trujillo Vilches, F.J.; Bermudo Gamboa, C.; Sevilla Hurtado, L. Online Tool Wear Monitoring by the Analysis of Cutting Forces in Transient State for Dry Machining of Ti6Al4V Alloy. Metals 2019, 9, 1014. https://doi.org/10.3390/met9091014
Sánchez Hernández Y, Trujillo Vilches FJ, Bermudo Gamboa C, Sevilla Hurtado L. Online Tool Wear Monitoring by the Analysis of Cutting Forces in Transient State for Dry Machining of Ti6Al4V Alloy. Metals. 2019; 9(9):1014. https://doi.org/10.3390/met9091014
Chicago/Turabian StyleSánchez Hernández, Yezika, F. Javier Trujillo Vilches, Carolina Bermudo Gamboa, and Lorenzo Sevilla Hurtado. 2019. "Online Tool Wear Monitoring by the Analysis of Cutting Forces in Transient State for Dry Machining of Ti6Al4V Alloy" Metals 9, no. 9: 1014. https://doi.org/10.3390/met9091014