Microstructural and Mechanical Properties of β-Type Ti–Nb–Sn Biomedical Alloys with Low Elastic Modulus


1
School of Materials Science and Engineering, Shaanxi University of Technology, Hanzhong 723001, China
2
School of Materials Science and Engineering, Shanghai University, Shanghai 200444, China
*
Author to whom correspondence should be addressed.
Metals 2019, 9(6), 712; https://doi.org/10.3390/met9060712
Submission received: 22 May 2019
/
Revised: 14 June 2019
/
Accepted: 21 June 2019
/
Published: 25 June 2019
Abstract
:The microstructural and mechanical properties of β-type Ti85-xNb10+xSn5 (x = 0, 3, 6, 10 at.%) alloys with low elastic modulus were investigated. The experimental results show that the Ti85Nb10Sn5 and Ti75Nb20Sn5 alloys are composed of simple α and β phases, respectively; the Ti82Nb13Sn5 and Ti79Nb16Sn5 alloys are composed of β and α″ phases. The content of martensite phase decreases with the increase of Nb content. The Ti82Nb13Sn5 and Ti79Nb16Sn5 alloys show an inverse martensitic phase transition during heating. The Ti85Nb10Sn5 and Ti82Nb13Sn5 alloys with the small residual strain exhibit the good superelastic properties in 10-time cyclic loading. The reduced elastic modulus (Er) of the Ti75Nb20Sn5 alloy (61 GPa) measured by using the nanoindentation technique is 2–6 times of that of human bone (10–30 GPa), and is smaller than that of commercial Ti-6Al-4V biomedical alloy (120 GPa). The Ti75Nb20Sn5 alloy can be considered as a novel biomedical alloy. The wear resistance (H/Er) and anti-wear capability (H3/Er2) values of the four alloys are higher than those of the CP–Ti alloy (0.0238), which indicates that the present alloys have good wear resistance and anti-wear capability.
1. Introduction
At present, stainless steel, cobalt-chromium (Co–Cr) alloy, and titanium alloys are widely used in biomedical alloys [1]. The elastic modulus of medical stainless steel, Cr–Co alloys, and titanium alloys as implants are 220 GPa, 230 GPa and 110 GPa, respectively, higher than those of human bone (10–30 GPa) [2]. When the higher elastic modulus of the biomedical alloys do not match the elastic modulus of the human bone around the implant, and can easily cause stress shielding, thus affecting the health of the patient [3,4,5]. In addition, biomedical alloys require high specific strength for hard tissue implants [2]. Therefore, in the development of biomedical alloys, many researchers are committed to developing Ti alloys with low elastic modulus and high specific strength. In fact, Ti biomedical alloys have not only low elastic modulus and high specific strength, but also low density, good corrosion resistance and good biocompatibility [6,7,8,9,10]. The biomedical α-type pure titanium (CP–Ti), and (α+β)-type Ti-6Al-4V alloys have the unique therapeutic effects in the field of hard tissue implantation and soft tissue interventional therapy [3,11]. Compared with CP–Ti alloy, Ti-6Al-4V alloy has high strength, corrosion resistance and high hardness [2,12,13]. However, the release of the toxic elements Al and V can lead to long-term health problems, such as neurological diseases and Alzheimer’s disease [14,15]. As the elastic modulus of Ti-6Al-4V alloy easily causes stress shielding, affecting the health of patients [2]. In recent years, as alternatives to Ti-6Al-4V alloys, non-toxic titanium alloys with lower elastic modulus and without containing the elements Al and V like Ti–Nb [16,17,18,19,20], Ti–Fe [21,22], Ti–Mo [23,24], Ti–Ta [25], Ti–Zr [26,27]-based alloys were reported. Among them, the Ti–Nb-based alloys have low elastic modulus, shape memory behavior, and hyperelasticity, so they are favored by biomedical materials researchers [16,17,18,19,20,28,29,30,31]. The shape memory effect of Ti–Nb alloys is attributed to the reversible martensite transformation between α″ martensite and the parent phase. The martensite transformation temperature and shape memory behavior of Ti–Nb alloys mainly depend on the composition [28,29,30,31]. In binary Ti–Nb alloy, the martensite transformation temperature decreases with the increase of Nb content [29]. The elements added to broaden the composition range of binary Ti–Nb alloy are mainly Sn, Ta, Pd, Zr, Mo and Cu, which can adjust the transformation temperature of martensite, and can improve the mechanical properties and shape memory ability of alloys [2,9,10,30,32]. These added elements are harmless to the human body, and in fact, some of these elements are necessary trace elements for the human body [2,5,10]. In addition, the reported added elements can stabilize the β phase, reduce the elastic modulus of Ti–Nb alloy, improve the strength of the alloy, and maintain good ductility [9,10,15,17,18,20,31,32].
When the mass percentage of Nb in binary Ti–Nb alloy is 14–26 mass%, the phases of Ti–Nb alloys are composed of martensite and β phases; when the mass percentage of Nb is 26–34 mass%, and the phases of Ti–Nb alloys are composed of martensite, β phase and ω phase [6]. However, when the mass percentage of Nb content is 34–40 mass %, there is only β phase in Ti–Nb alloy [6]. When the reversible martensite transformation between martensite and parent phase can exist, the alloy exhibits shape memory behavior [6]. Therefore, to study the shape memory behavior of Ti–Nb alloy, the mass percentage of Nb element should be less than 34 mass%; to obtain a relatively stable β-type phase content, the mass percentage of Nb content is generally greater than 34 mass% [6]. In ternary Ti–Nb–Sn alloys, the addition of Sn can adjust the mass percentage of Ti and Nb, and then adjust the content of martensite, allow the study of the shape memory behavior and/or superelasticity of different components, and the mechanical properties of β-type Ti–Nb–Sn alloys [31,33,34,35]. Wang [30] reported that in ternary Ti–Nb–Sn alloys, the content of martensite decreases with the increase of Sn content, and decreases with the decrease of corresponding Ti content, indicating that stable β-type Ti–Nb–Sn alloys can be obtained by adjusting the Ti and Sn contents. In fact, in the study of bone tissue implants, the Ti-25Nb-11Sn (wt.%) or Ti78.7Nb15.8Sn5.5 (at.%) alloys have good bone tissue compatibility, equivalent to that of Ti-6Al-4V alloy [36]. Importantly, both Nb and Sn ions are harmless to human body [2,5,35,36]. For the Ti78.7Nb15.8Sn5.5 alloy [36], the precipitation of Ti3Sn intermetallic compound in the second phase can be inhibited at low Sn content to stabilize the β phase. When the Nb content decreases, the Ti content increases, and the content of Sn remains unchanged, the martensite phase and Ti3Sn phase may increase, which results in a low stability of the β phase and high elastic modulus. When the Nb content increases and the Ti content decreases, and the Sn content remains unchanged, the martensite phase and Ti3Sn phase will decrease, which results in a high stability of the β phase and a low elastic modulus. For the Ti78.7Nb15.8Sn5.5 alloy, the effect of Nb and Ti contents on the content of martensitic phase or Ti3Sn second phase, as well as the martensitic transformation temperature and mechanical properties needs further study to provide a reference for selecting biomedical alloys. In fact, the mass percentage of Nb in ternary Ti85Nb10Sn5 (at.%) is 16.61 mass%, which locates in the range of 14–26% [6]; according to the results of Hon’s experiments [6], the Ti85Nb10Sn5 alloy containing martensite phase may have hyperelastic behavior. In this paper, Ti85Nb10Sn5 (at.%) was chosen as the model alloy, and an alloy with the composition Ti85-xNb10+xSn5 (x = 0, 3, 6, 10 at.%) was designed, in which, when x = 3, the Ti79Nb16Sn5 component is similar to the Ti78.7Nb15.8Sn5.5 component. The main purpose was to study the effect of martensite or Ti3Sn contents on martensite transformation temperature, hyperelasticity, and on elastic modulus and hardness, based on the increase of Nb content and the corresponding decrease of Ti content in Ti85Nb10Sn5 alloys. The experimental results can provide a reference for the selection of Ti–Nb–Sn biomedical alloys.
2. Experimental Procedure
Various combinations of pure Ti, Nb, and Sn (purity of 99.9 % or higher) were used to prepare ingots of four Ti–Nb–Sn alloys with nominal compositions Ti85Nb10Sn5, Ti82Nb13Sn5, Ti79Nb16Sn5, and Ti75Nb20Sn5 (at.%) under a high vacuum (3 × 10⁻³ Pa) using a magnetically controlled tungsten arc-melting furnace (Shenyang Scientific Instruments Co., Ltd., Chinese Academy of Sciences, Shenyang, China) in an argon atmosphere. The raw materials Ti, Nb and Sn are bulk, and the range of sizes was from 5 × 5 × 5 mm3 to 20 × 20 × 20 mm3. These raw materials were obtained from Beijing Xing rong yuan Technology Co., Ltd. (Beijing, China). The calculated quantities of raw materials were weighed using an analytical balance with a precision of 0.1 mg. For example, for the Ti85Nb10Sn5 alloy, the quantity of Ti is 21.8325 g, that of Nb is 4.9840 g and that of Sn is 3.1836 g. Such a small mass is taken from the bulk raw materials using iron pliers. Minor mass changes were ground using a grinding wheel, in accordance with the calculated mass. After mixing the raw materials, a total of 30 g of raw materials were put into a water-cooled crucible to smelt into alloy ingots. As the melting point of Nb is high, the solution in contact with the crucible cools rapidly, and the atom diffusion of Nb in the solution is slow. When the number of smelting cycles is small, the composition of the alloy is non-uniform. To ensure the uniformity of the chemical composition of the ingots, all the ingots were smelted more than 7 times. Rod-like samples with a diameter of 3 mm, and a length of more than 10 mm were cut from the ingots with the diameter of about 25 mm and the height of about 11 mm. The samples for mechanical and structural analysis were cut from the rod-shaped samples by using a slow steel saw. The surfaces of thin sheets with diameter of 3 mm were polished using standard metallographic procedures, consisting of grinding up to 2000 grit with SiC paper and polishing with a colloidal silica suspension. For observing the microstructure, the surfaces of polished samples need to be corroded. This was accomplished with a mixed solution of HF, HNO3 and H2O, and the corresponding volume ratio is 1:4:16. The microstructures of the prepared samples were observed by optical microscope (OM). The cross-sections of samples with a diameter of 3 mm are observed using a Rigaku D\max-2550 X-ray diffractometer (XRD, Rigaku Company, Tokyo, Japan), at an operating voltage of 30 KV, using Cu-Ka radiation. The chemical compositions of alloys were measured by scanning electron microscopy (SEM, JSM-6390LV, JEOL, Peabody, MA, USA) with an energy dispersive spectrometer (EDS). To obtain more accurate chemical components, five points were scanned in different regions, and the values of chemical components obtained were the average of five measurements.
The phase transformation temperatures of the samples with a diameter of 3 mm weighing 20–50 mg was measured by differential scanning calorimetry (DSC) with heating and cooling rates of 0.33 K⋅s−1, using a Perkin Elmer DSC 7 instrument (PerkinElmer, Waltham, MA, USA). To prevent the instability of the sample during compression, the ratio of length to diameter is 1.5 times to 2 times. The cylindrical Ti–Nb–Sn samples with a diameter of 3.0 mm and height of ~5.0 mm were prepared by subjecting them to uniaxial compression testing at room temperature. The two sections of the samples are smooth and parallel, to reduce the friction between the pressure head and the end face of the sample. The uniaxial compression testing was performed at room temperature using a CMT5105 electronic testing machine (Metis Industrial Systems (China) Co., Ltd., Shanghai, China), at a strain rate of 2.5 × 10⁻⁴ s–1. The quantitative data were all measured for three times, and the average results are shown. The cycle loading and unloading experiments were also carried out on this instrument at a strain rate of 2.5 × 10⁻⁴ s–1. The Vickers hardness (HV) measurement of polished samples was performed using an HVS-10Z/LCD hardness testing machine (Shanghai Gaozhi Precision Instrument Co., Ltd., Shanghai, China) with a load of 20 kgf for 10 s. To get the HV value of the alloy more accurately, each sample was tested ten times, and the reported value was the average of 10 measurements.
Elastic modulus is an important mechanical property parameter for biomedical alloys, so accuracy is required in elastic modulus measurements. On the stress-strain curve, the elastic modulus of alloys can also be obtained by the ratio of stress to strain, but, as the elastic modulus of the instrument itself, the elastic modulus calculated by the stress-strain curve includes the elastic modulus of the instrument and the elastic modulus of the alloy, which results in the fact that the elastic modulus error for the Ti–Nb–Sn alloy is large. This large elastic modulus error looses its reference value for biomaterials. The error of elastic modulus measurements between the nano-indentation technique and ultrasonic testing is small [8,24]. Therefore, the elastic modulus of Ti–Nb–Sn alloys was measured by the nano-indentation technique, and the hardness of the samples was also measured at the same time. The nano-indentation tests were performed by a Hystron-Tl980 TriboIndentor system (Beijing Obel Scientific Instruments Co., Ltd. Beijing, China) equipped with a Berkovich indenter (Bruker, Germany). The indentation marks (indents) were made using an applied load of 8000 µN, loading rate of 1.6 mN⋅s−1, and dwell time of 5 s. The reduced elastic modulus (Er) and hardness (H) values were calculated automatically using the TriboScanTm software (Boston University, Boston, MA, USA). To reduce test errors, 10 sample nanoindentation tests were carried, and the reported data is the average of 10 tests. To ensure the correctness of the measured results, the surface of each sample was polished to a mirror-finish. Based on a Berkovich indenter, the calculated Er values were used [24]:
where S is the stiffness, and A(hc) represents the contact area.
3. Results and Discussion
3.1. Phase and Microstructure of Ti–Nb–Sn Alloys
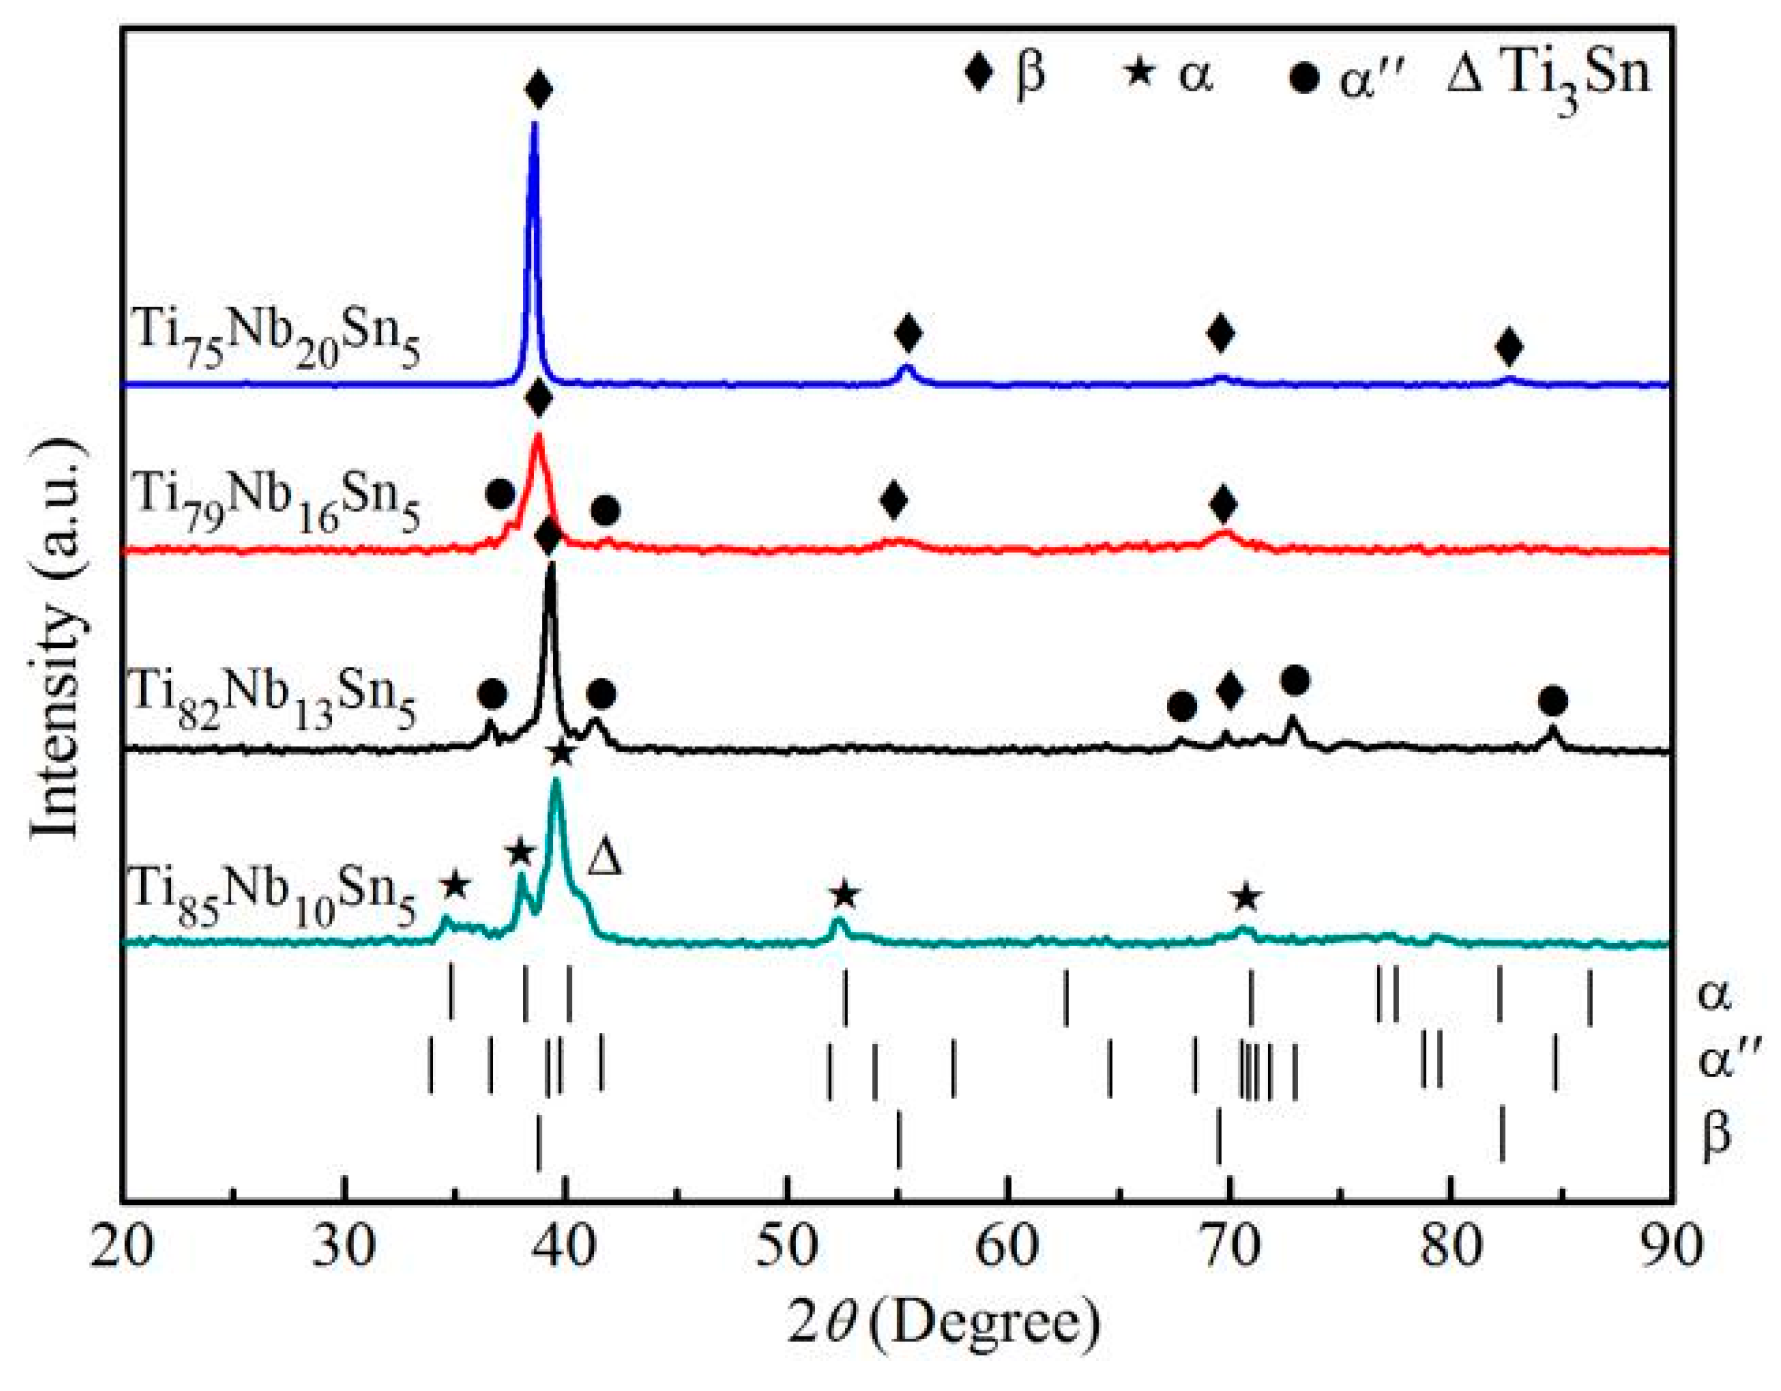
Figure 1 shows the XRD patterns of as-cast Ti85-xNb10+xSn5 (x = 0, 3, 6, and 10 at.%) alloys. The Ti85Nb10Sn5 alloy is composed of α phase and a small amount of Ti3Sn phase; the Ti82Nb13Sn5 and Ti79Nb16Sn5 alloys are composed of β and α″ phases; the Ti75Nb20Sn5 alloy is composed of simple β phase. The addition of Nb stabilizes the β phase. The relative volume fraction of the matrix and the second phase can be calculated quantitatively using the XRD patterns.
The main reported method to calculate the volume fraction of the phase is the integral-area method of the diffraction peak [17,18,37]. To ensure that the diffraction intensity of XRD energy spectrum and the integral area of diffraction peak of different samples are comparable, the cross section areas of the tested samples were the same, and the XRD energy spectrum is measured under the same test conditions. When the cross section area of Ti–Nb–Sn samples for the XRD energy spectrum is 3 mm, and other same test conditions, the diffraction intensity and integral area of diffraction peak for the different samples are comparable. The integrated areas of diffraction peaks for β and α″ phases in Figure 1 were determined by using the peak-fitting program [17,18,37]. The volume fraction (Vf) of β and α″ phases were calculated by using Equations (2) and (3) [37,38],
where, Vf(α″) and Vf(β) are the volume fractions, and Aα″ and Aβ are the total integrated area, corresponding to α″ and β phases, respectively. The calculated volume fractions of the β and α″ phases according to the integrated area of diffraction peaks for the β and α″ phases in Figure 1, are listed in Table 1. The Vf(α″) values of the α″ phase in Ti82Nb13Sn5 and Ti79Nb16Sn5 alloys are 26.5% and (7.1%), respectively, which are larger than that of Ti75Nb20Sn5 (0.0%) alloy, respectively. Accordingly, the relative content of α″ phase decreases with decrease of Nb content, and with the increase of corresponding β phase; the Ti85Nb10Sn5 and Ti75Nb20Sn5 alloys exhibit a single stable α and β phases, respectively.
Based on the ESD analysis, the true chemical compositions of the five alloys are Ti85.32Nb10.1Sn4.58, Ti82.96Nb12.73Sn4.31, Ti79.06Nb16.7Sn4.24 and Ti75.32Nb20.52Sn4.16, respectively. Compared with the nominal composition, the atomic percentages of Ti and Nb elements are larger than those of the nominal composition, while the atomic percentages of Sn elements decrease gradually with the increase of Nb content, and are less than 5 at.% of the nominal composition. As the boiling point (2260 °C) of Sn is lower than the melting point (2468 °C) of Nb, the volatilization of Sn is easier than those of Ti and Nb during the alloy smelting process. In addition, each smelting time of alloy with the high Nb content is longer than that of alloy with the low Nb content, which leads to a longer volatilization time for the Sn element, resulting in a low Sn concentration of alloys with high Nb content. Accordingly, based on the results of EDS analysis, the changes of true and nominal components of the alloys provide a reference for industrial applications.
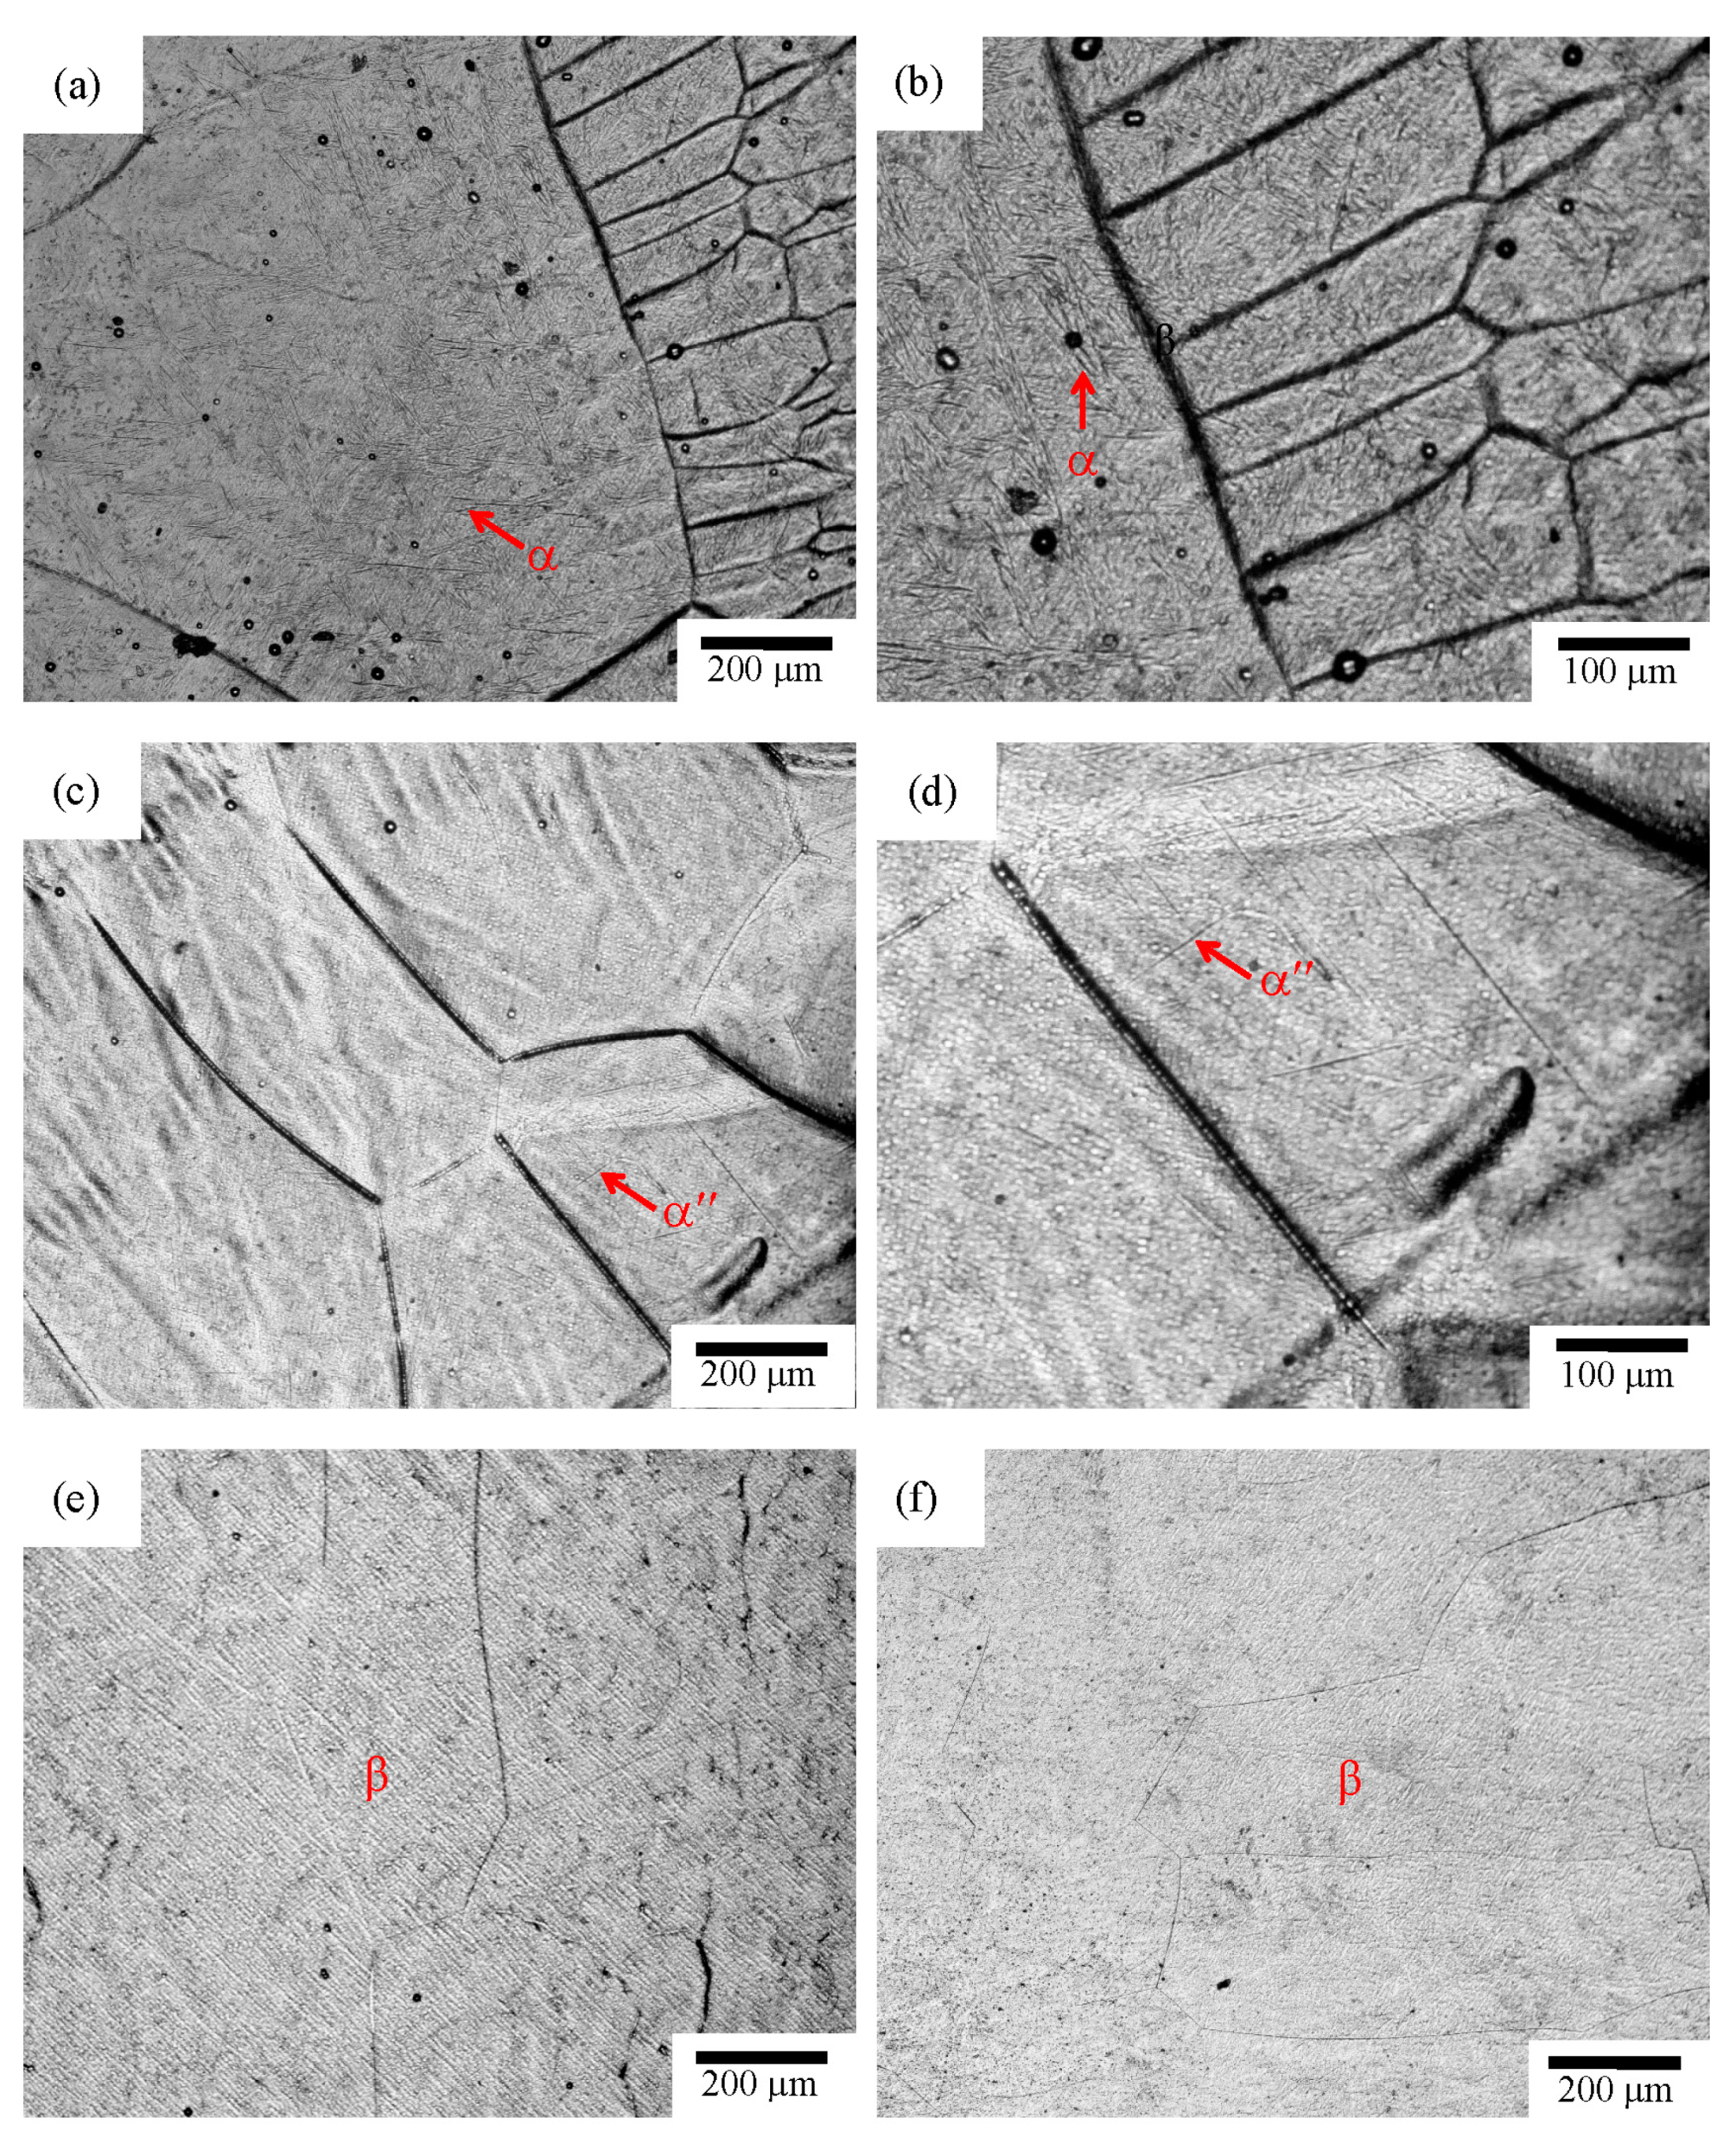
Figure 2 shows the microstructure of Ti–Nb–Sn alloys observed by optical microscope. For the Ti85Nb10Sn5 alloy, a large amount of needle-like α martensite phase can be found to precipitate in the matrix β phase. For the Ti82Nb12Sn5 alloy, less needle-like α″ martensite phase is precipitated in the matrix β phase. As the relative content of α″ phase for the Ti79Nb16Sn5 alloy is small in Figure 1, the α″ phase microstructure cannot be found in Figure 2c. The microstructure of single β phase for the Ti75Nb20Sn5 alloy is exhibited in Figure 2d. The results agree with those of XRD patterns in Figure 1.
When the transition metal Nb is added to Ti alloy, the stabilization of β phase can be attributed to the increase of conduction-electron density, which enhances the screening of the ion core [39]. This favors a formation of BCC structure, and consequently increases the stability of the β-Ti phase [39]. In Ti alloys, when the content of the stable element of the β phase is low, the alloy exhibits only α phase; when the content of the added stabilizing element is high, the alloy will have a (α + β) or (α″ + β) microstructure; when further stable element is added, the alloy will present the metastable β phase [39].
Therefore, for the Ti85Nb10Sn5 alloy, the content of stable β phase Nb is less, and the microstructure of the alloy is only α phase. For the Ti82Nb13Sn5 and Ti79Nb16Sn5 alloys, when the content of Nb is further increased, the microstructures of the alloys are composed of α″ + β phases, and β phase stability is exhibited. For the Ti75Nb20Sn5 alloy, when the content of Nb is the highest, the alloy is only composed of metastable β phase at room temperature. When the content of Sn is too high, Ti and Sn can easily form stable intermetallic compounds of Ti3Sn, which destroys the stability of the β phase. When the content of Sn is low, the content of Ti3Sn phase is less, so the β phase can be stabilized. In addition, although Sn is a neutral element, the addition of Sn can change the phase transition kinetics of w phase, thus improving the stability of β phase [39]. Therefore, in the present Ti–Nb–Sn alloys, when the percentage of Sn atom is set to 5%, the content of Nb is increased, and the content of Ti is decreased accordingly, which inhibits the precipitation of Ti3Sn phase, and promotes the stability of the β phase.
In multicomponent Ti alloy systems, the stability of the β-Ti phase can be represented by the molybdenum equivalent (Moeq) [39]. The larger the Moeq value is, the more the stability of β-Ti phase is. The Moeq value can be expressed using the following formula [40]:
where [x] is the concentration of x element in weight percent [40]. Table 1 shows the calculated Moeq values of Ti–Nb–Sn alloys. The Moeq values increase from 7.83 of Ti85Nb10Sn5 alloy to 11.56 of Ti75Nb20Sn5 alloy. In fact, the Moeq values increase with the increase of Nb contents, indicating that the stability of β-Ti phase increases with the increase of Nb contents. The results agree with those of XRD curves.
3.2. Phase Transition Temperature of Ti–Nb–Sn Alloys
In hard tissue implants, martensitic transformation cannot occur within a temperature range that the human body can withstand, because martensitic transformation can change the volume of tissue implants, and the volume change of hard tissue implants will cause secondary injuries to patients. Under special circumstances, the temperature range that human body can bear is between—50 °C and 100 °C (burn or scald). Within this temperature range, the special requirement for hard tissue implants is that there is no martensitic transformation or volume change. Therefore, to better study Ti-Nb-Sn biomedical alloys, the temperature range of phase transformation should include the temperature range that human body can bear in special environment. Accordingly, the temperature range of phase transformation should be set to −100 °C to 200 °C.
Figure 3 shows the DSC curves of the phase transition temperature during heating and cooling. When the four alloys are cooled from 200 °C to −100 °C, no martensitic transformation occurs; when heated from −100 °C to 200 °C, the Ti85Nb10Sn5 and Ti75Nb20Sn5 alloys do not exhibit reverse martensitic phase transition, while the Ti82Nb13Sn5 and Ti79Nb16Sn5 alloys show inverse martensitic phase transition, and the phase transition temperatures (TA) are 169 °C and 177 °C, respectively. Because the martensitic transition is not present during heating, thermal phase transformation hysteresis does not exist. In Ti–Nb–Sn alloy, as the Ti85Nb10Sn5 and Ti75Nb20Sn5 alloys are composed of single α and β phases, respectively, there is no martensitic transformation during heating and cooling, indicating that the martensite in Ti–Nb–Sn alloy is independent of single α and β phases. As the Ti82Nb13Sn5 alloy contains a large number of α″-Ti phases, the inverse martensite transformation occurs when the alloy is heated from −100 °C to 150 °C. However, when the Ti79Nb16Sn5 alloy contains a small amount of α″-Ti phases, the inverse martensite transformation also occurs in the range of heating temperature, which indicates that the inverse martensite transformation is related to the α″-Ti phase. Therefore, the Ti–Nb–Sn alloys have no martensitic transformation in the temperature range that human body can bear, indicating that the Ti–Nb–Sn alloys are the good biomedical alloys for implantation.
3.3. Mechanical Properties of Ti–Nb–Sn Alloys
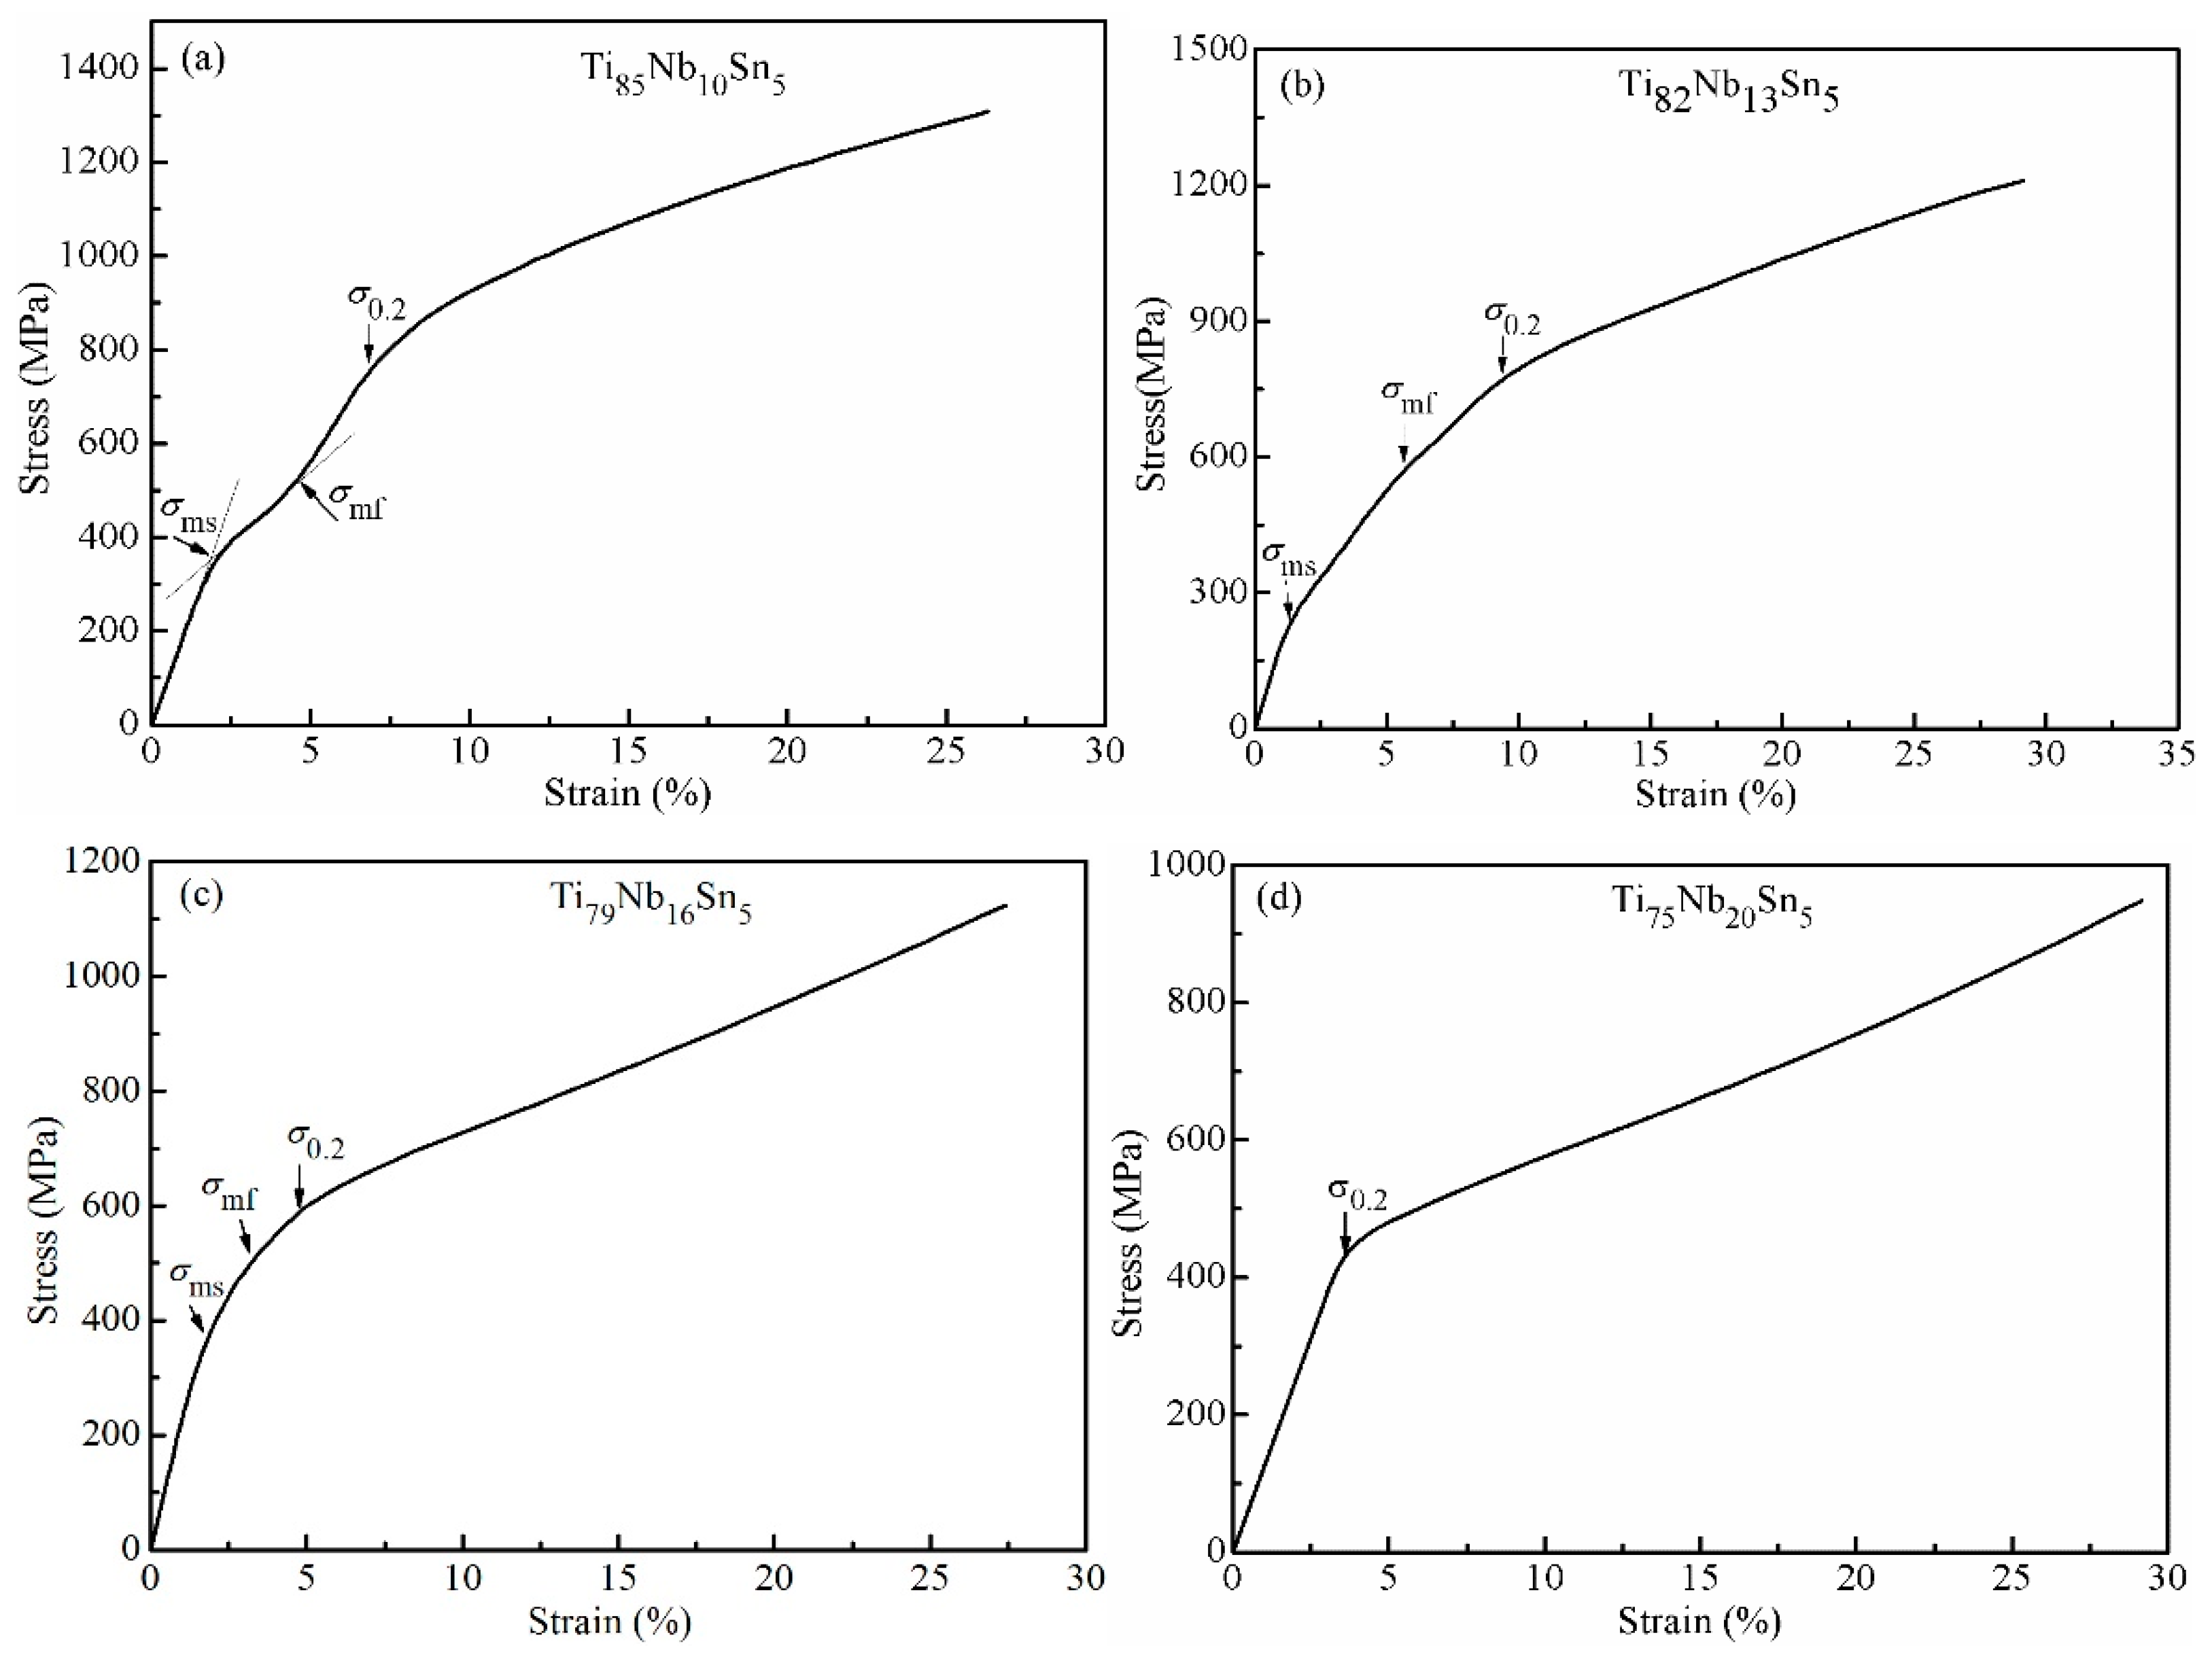
Figure 4 shows the compression stress-strain curves of Ti–Nb–Sn alloys at room temperature. The stress-induced martensite transformation is exhibited in Figure 4a,b for the Ti85Nb10Sn5 and Ti82Nb13Sn5 alloys, that is, the stress-strain curves show a characteristic two-step yield behavior, which indicates that the two alloys present hyperelastic characteristics at room temperature.
The initial stress (σms) and strain (εms) of martensite transformation, the finished stress (σmf) and strain (εmf) of martensite transformation, the offset 0.2% yield stress (σ0.2) calculated, and initial plastic strain (ε0.2) in the stress-strain curves are listed in Table 1. The σms and σmf values are 352 MPa and 509 MPa for the Ti85Nb10Sn5 alloy, and 256 MPa and 574 MPa for the Ti82Nb13Sn5 alloy, respectively. In addition, the ε0.2 values of Ti85Nb10Sn5 and Ti82Nb13Sn5 alloys are 6.84% and 9.46%, respectively, which indicates that the two alloys have a larger elastic strain, as the largest elastic strain is equal to the initial plastic strain. The large elastic strains of Ti85Nb10Sn5 and Ti82Nb13Sn5 alloys are due to the long time or displacement of martensite transformation for a large number of α or α’’ phases under the action of stress. In addition, the small ε0.2 values of Ti79Nb16Sn5 and Ti75Nb20Sn5 alloys indicate that the two alloys do not exhibit hyperelastic characteristics. The small elastic strain of Ti79Nb16Sn5 alloy is due to the short time or displacement of martensite transformation for a small number of α″ phases; the elastic strain of Ti79Nb16Sn5 alloy is only from the elastic strain of β phase. In Figure 4a,b, the Ti85Nb10Sn5 alloy exhibits an obvious martensite transformation stress platform, which is due to the stress-induced martensite transformation of a large number of α phases. When the relative content of the α″ phase is low, the stress platform of Ti82Nb13Sn5 alloy is not obvious, which is due to the stress-induced martensite transformation of partial α″ phases. However, when the relative content of α″ phase was 7%, the stress platform of Ti79Nb16Sn5 alloy is not exhibited in Figure 4c, In fact, the elastic-plastic deformation of Ti79Nb16Sn5 is larger than that of Ti75Nb20Sn5 alloy with the single β phase, as shown in Figure 4c,d. The large elastic-plastic deformation is due to the stress-induced martensite transformation of a small number of α″ phases. Accordingly, the relative contents of α and α″ phases not only affect the stress platform of martensite transformation, but also affect the elastic-plastic deformation of the alloys.
The σ0.2 values of Ti85Nb10Sn5 and Ti82Nb13Sn5 alloys are 787 MPa and 772 MPa, respectively, which are larger than those of Ti79Nb16Sn5 (611 MPa) and Ti75Nb20Sn5 (435 MPa) alloys, respectively. The σ0.2 values of Ti-Nb-Sn alloys reduce with increased Nb content. As the martensite transformation of α and α″ phases make the Ti85Nb10Sn5 and Ti82Nb13Sn5 alloys present a two-step yield characteristic, resulting in that the σ0.2 values of second yield strength are larger than those of Ti79Nb16Sn5 and Ti75Nb20Sn5 alloys. In addition, as the stress-induced martensite transformation of a small number of α″ phases for the Ti79Nb16Sn5 alloy results in the large elastic-plastic deformation, which make the alloy presents the larger σ0.2 values, comparing to the Ti75Nb20Sn5 alloy. Accordingly, the martensite transformation of α and α″ phases result in the second yield or elastic-plastic deformation, which affect the yield strength of the Ti-Nb-Sn alloys, or make the yield strength of the alloy decrease with the decrease of martensite contents.
The Vickers hardness (HV) values of Ti85Nb10Sn5 and Ti82Nb13Sn5 alloys are 230 and 226, respectively, while those of Ti79Nb16Sn5 and Ti75Nb20Sn5 alloys are 220 and 218, respectively, as shown in Table 1. In fact, in the present Ti–Nb–Sn alloys, the HV value of Ti85Nb10Sn5 alloy is the largest; however, the Ti75Nb20Sn5 alloy exhibits the minimum HV value. Therefore, the content of α″ martensite phase affects the Vickers hardness of the alloy, and when the content of α″ martensite phase decreases, the Vickers hardness of the alloys is reduced accordingly.
3.4. Elastic Energy of Ti–Nb–Sn Alloys
For the Ti85Nb10Sn5 and Ti82Nb13Sn5 hyperelastic alloys, the stress-induced martensite transformation can be exhibited in the stress-strain curve, and the cyclic dissipation energy can be calculated under cyclic loading. For the hyperelastic alloys, the calculation of cyclic dissipation energy is more practical than the calculation of elastic energy, so the Ti85Nb10Sn5 and Ti82Nb13Sn5 alloys were used to calculate the cyclic dissipation energy.
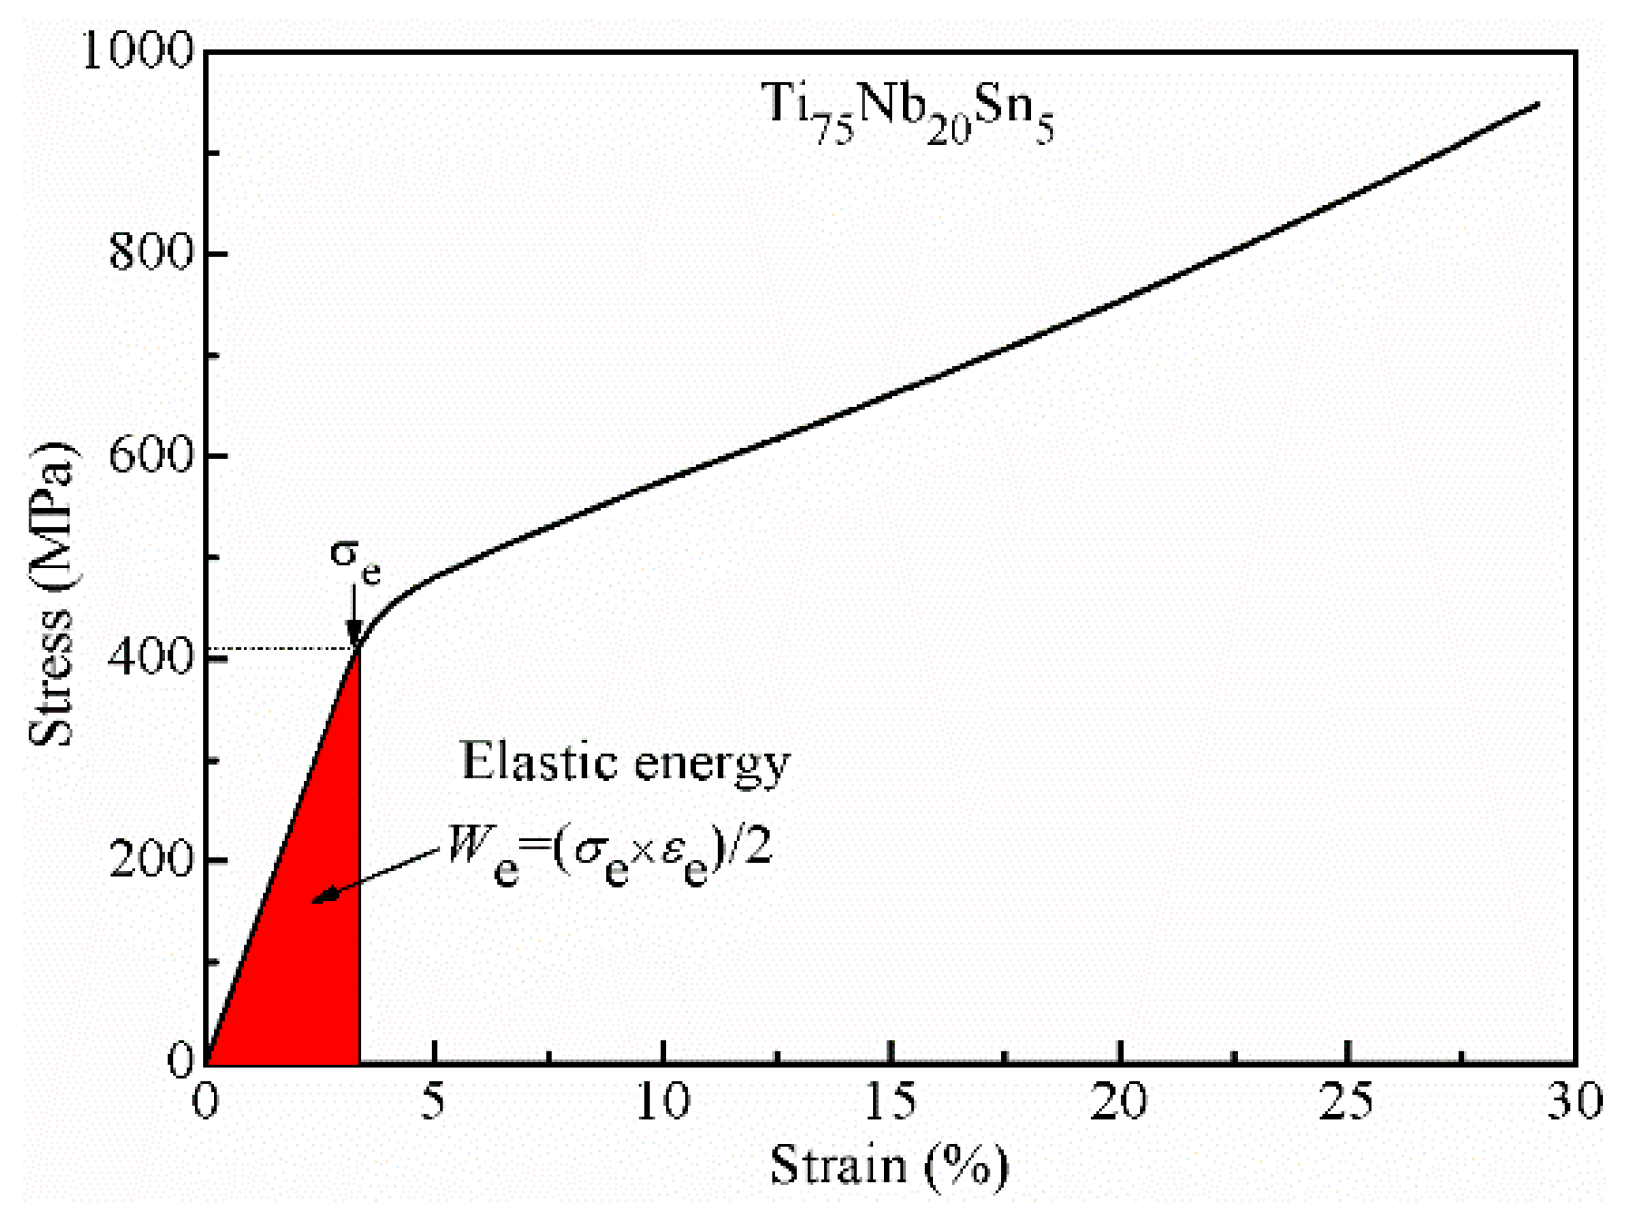
For the Ti79Nb16Sn5 and Ti75Nb20Sn5 alloys without the stress platform of martensite transition, the calculated elastic energy is more important than the cyclic dissipation energy. As the biomedical materials are usually used in the range of elastic deformation [41,42], the calculated elastic energy of biomedical and/or function materials is important to ensure the safety of applied materials. The elastic energy (We) in Figure 5 can be estimated using Equation (5):
The calculated We values of Ti–Nb–Sn alloys are list in Table 1. The elastic energy of Ti75Nb20Sn5 alloy is 6.53 × 10⁶ J⋅m−3, which is higher than that of Ti79Nb16Sn5 alloy (1.65 × 10⁶ J⋅m−3). In fact, the We value of Ti75Nb20Sn5 alloy is higher than that of the commercial biomedical material Ti-6Al-4V alloy (2.8 × 10⁶ J⋅m−3) [17,43], which indicates that the Ti75Nb20Sn5 alloy can be used as a novel biomedical material.
3.5. Cyclic Loading Stress-Strain Curves of Ti–Nb–Sn Alloys
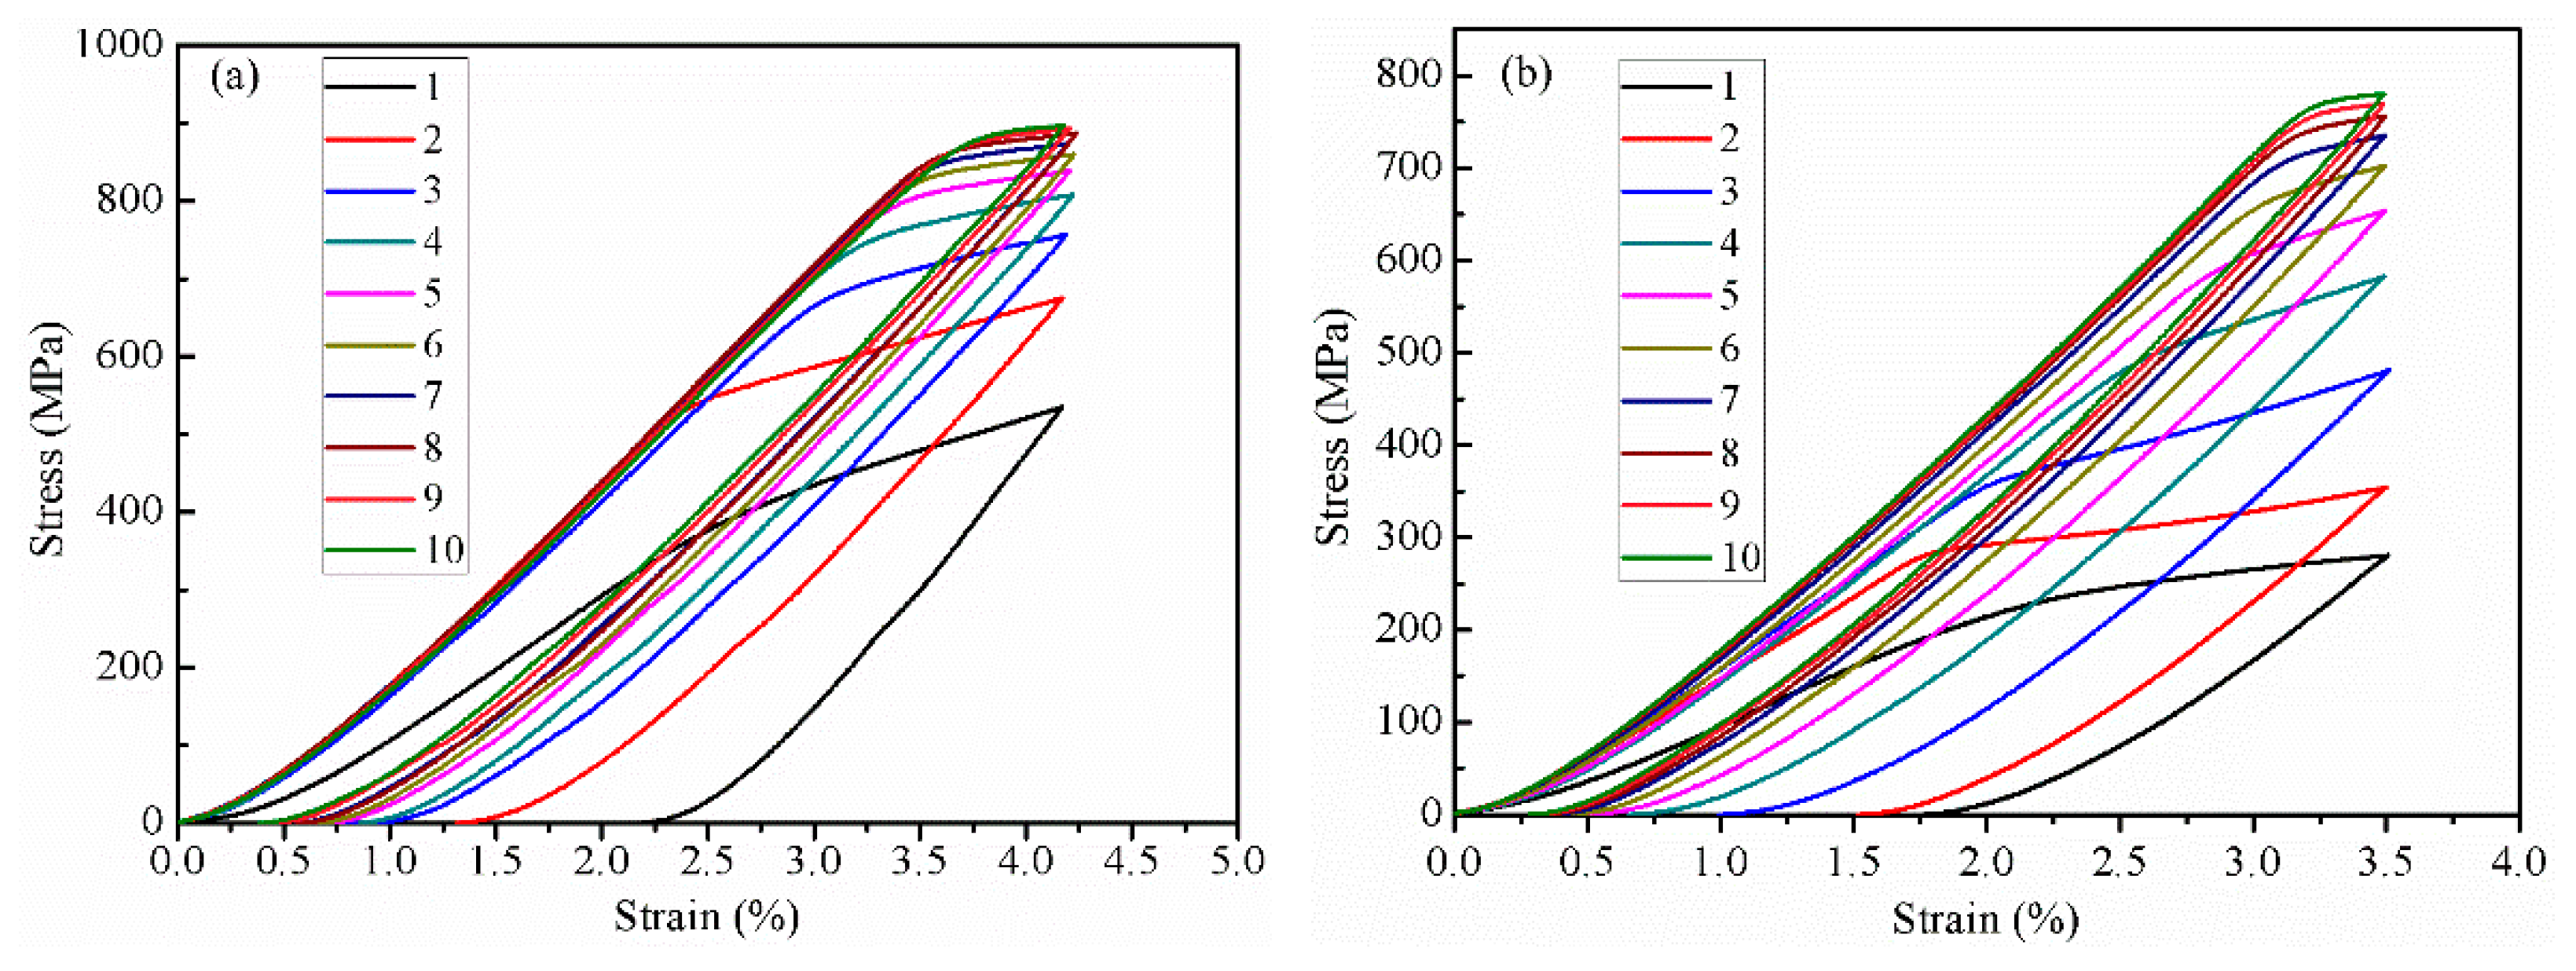
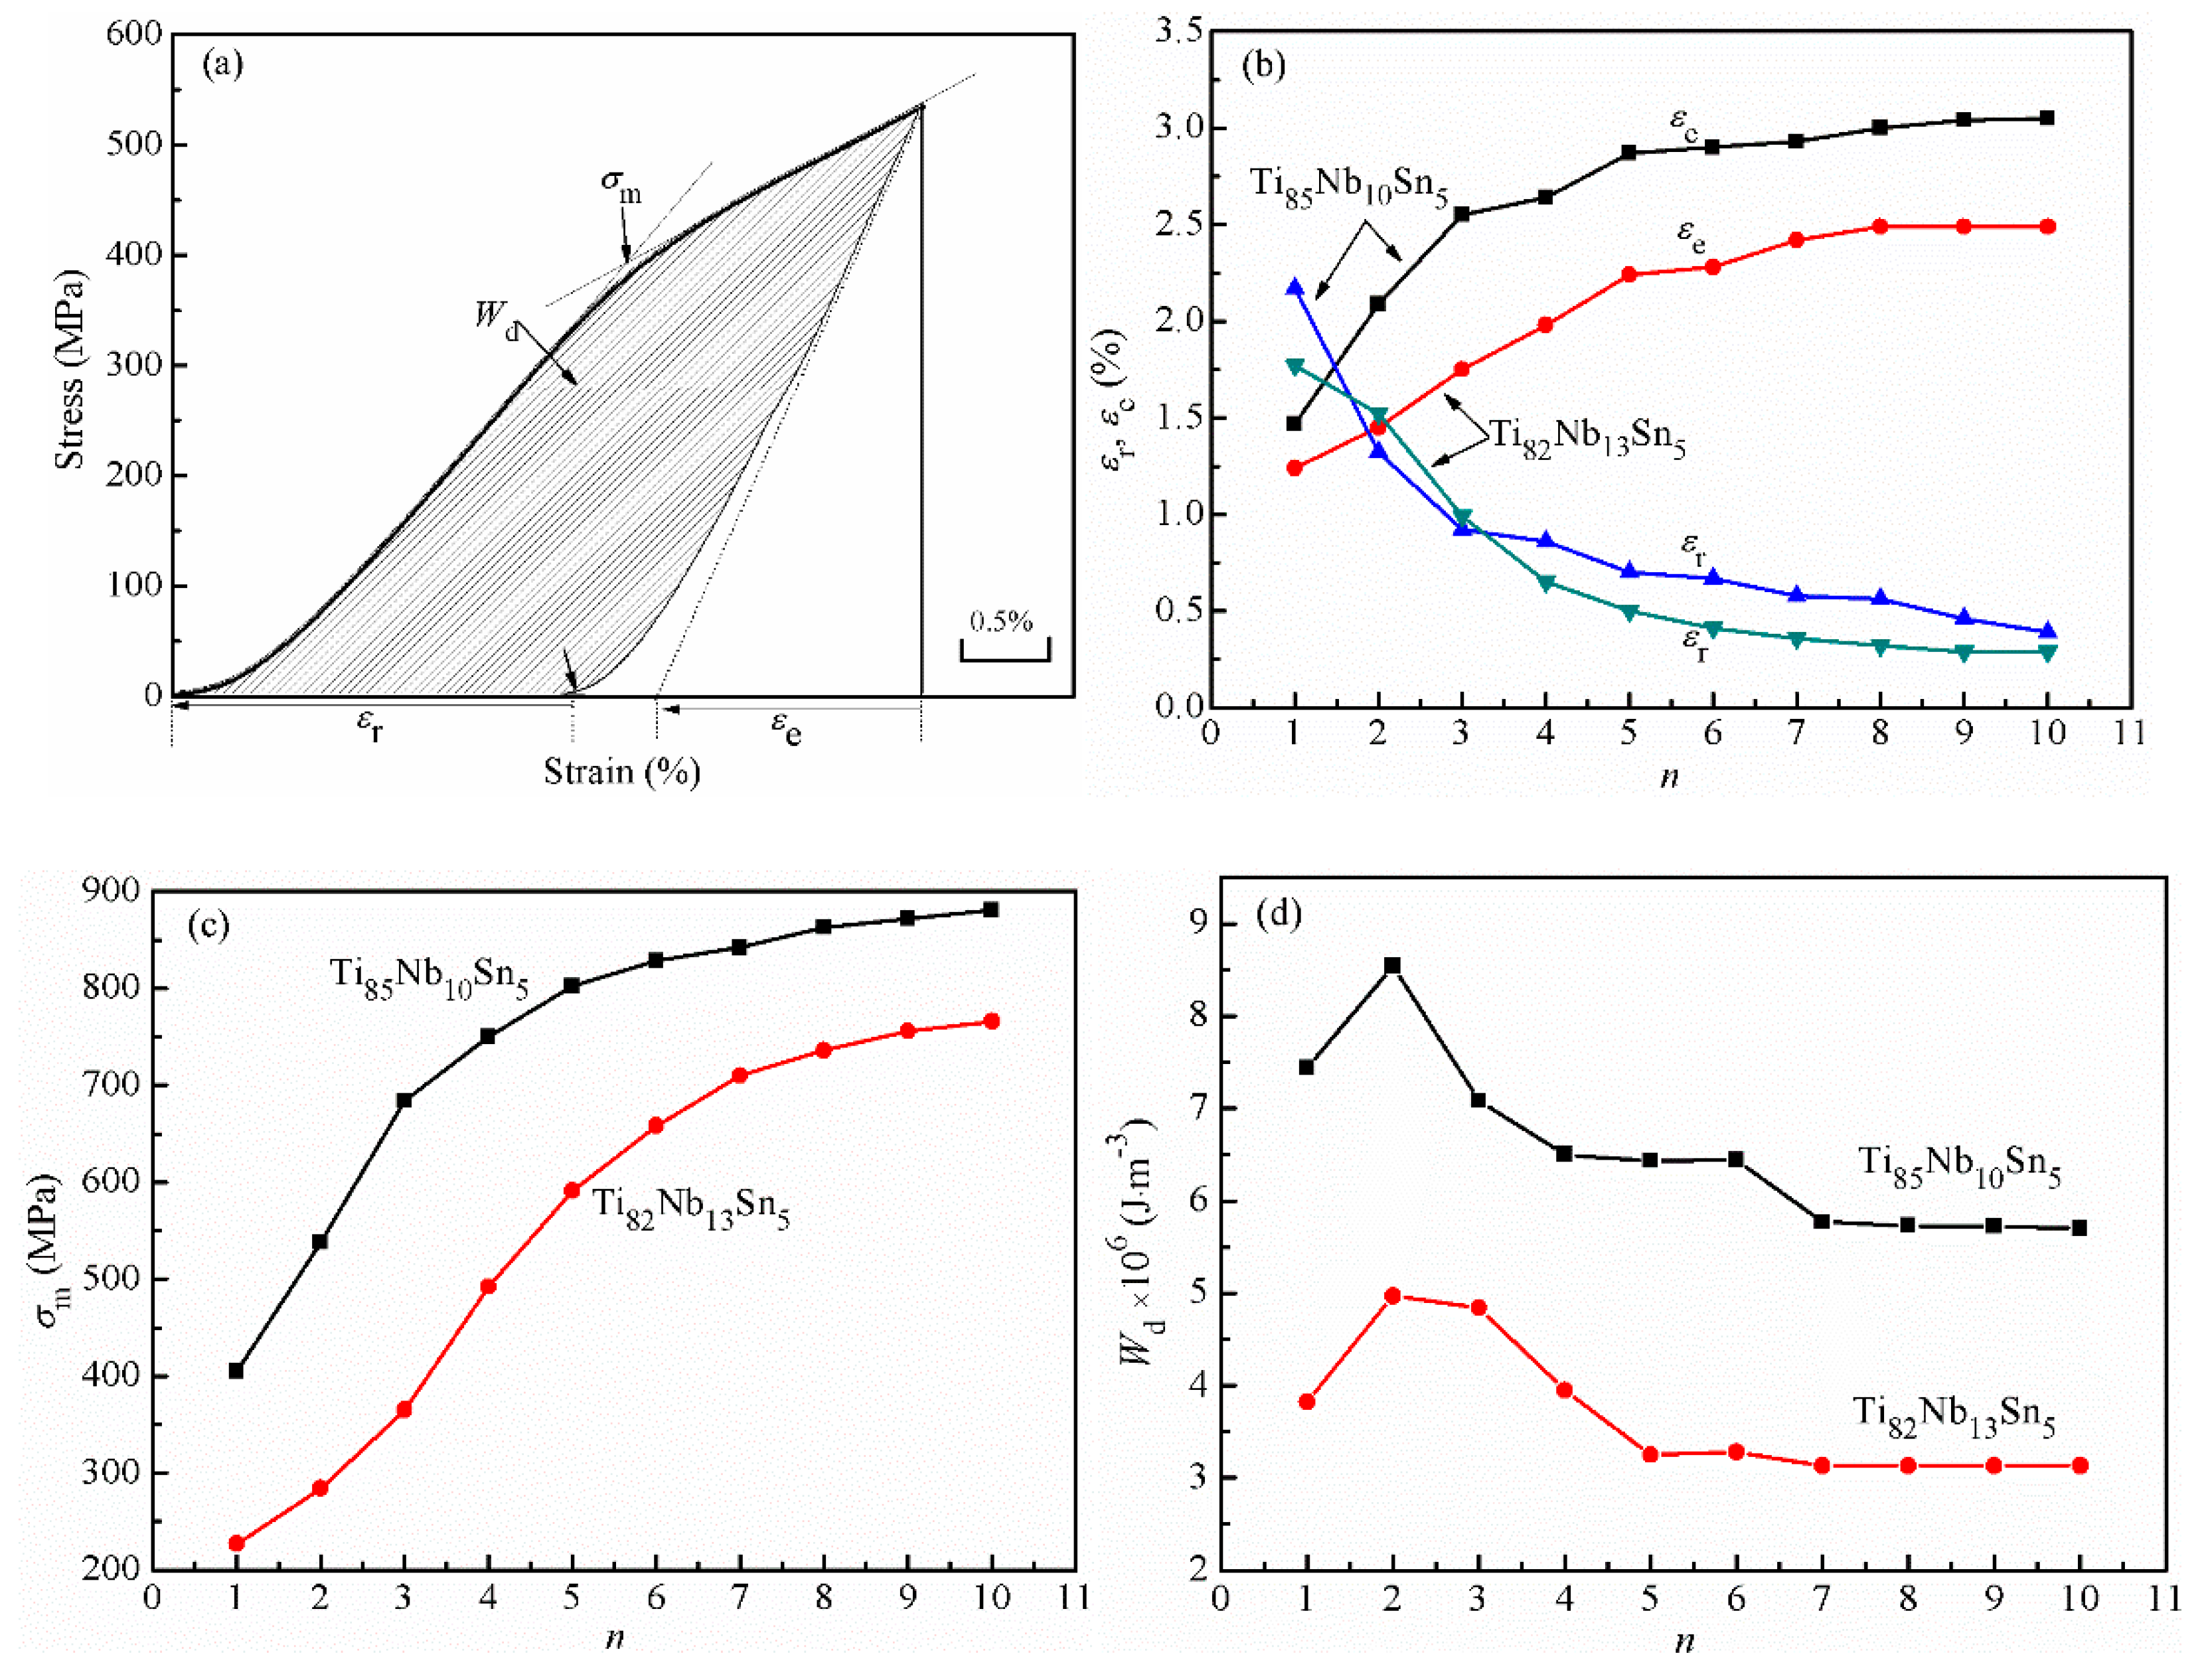
Figure 6 shows the stress-strain curves of Ti85Nb10Sn5 and Ti82Nb13Sn5 alloys under 10 loading cycles. As the content of α phase for the Ti85Nb10Sn5 alloy are larger than that of α″phase for the Ti82Nb13Sn5 alloy, the content of martensitic transformation for the former may be larger than that for the latter. Under the same cyclic loading times, the plastic deformation of Ti85Nb10Sn5 alloy may also be larger than that of Ti82Nb13Sn5 alloy. Accordingly, the set constant strain of Ti85Nb10Sn5 alloy can be larger than that of Ti82Nb13Sn5 alloy under the cyclic loading. The set constant strain of the two alloys lies in the stress platforms of martensitic transformation in Figure 4a,b. Figure 6 shows that the Ti85Nb10Sn5 alloy is cyclic loading at a constant strain of 4.2% (<4.48%, seen in Table 1), while the Ti82Nb13Sn5 alloy is subjected to cyclic loading at a constant strain of 3.5% (<5.56%, seen in Table 1). Based on the stress-strain curve of cyclic loading, Wd, εr, the elastic strain (εe), and the critical stress (σm) of stress-induced martensitic tranformation are listed in Table 2.
The εe values of the two alloys increase with the increase in the number of loading times. In fact, the εe values of two alloys increase more quickly before five loading cycles, but the εe values change slightly and tend to be stable after more than five times, as shown in Figure 7b. The εr values of Ti85Nb10Sn5 alloy decrease rapidly before three times, decrease slowly and approximately tend to be stable in the more than third time, as shown in Figure 7b.
The εr values of Ti82Nb13Sn3 alloy decrease more rapidly before four times; after more than five times, the εr values decrease slowly and tend to be stable, as shown in Figure 7b. As the residual strain is a performance index of hyperelastic material, the lower the residual strain is, the better the hyperelastic property of the alloy is. The final residual strain values that tend to be stable for the Ti85Nb10Sn5 and Ti82Nb13Sn5 alloys are 0.39% and 0.29%, respectively. The stable residual strain indicates that two alloys exhibit better superelastic properties. For superelastic materials, the critical stress (σm) of stress-induced martensite transformation is an important performance index. Usually, the larger the σm values is, the greater the constant stress is, which results in that, the smaller the residual strain is, the better the hyperelastic property of the alloy is. During cyclic loading, two alloys presents the σm values of martensite transformation, and the σm value increases with the increase of cycle times, and the final σm values tend to remain stable, as shown in Figure 7c. When the σm values of two alloys tend to be stable and invariant, the corresponding residual strain is minimum, indicating that two alloys have the good hyperelasticity. When the stress reaches the critical stress (σm) of martensitic transformation, martensite transformation occurs, which results in that stress platform with the increase of stress can be exhibited in Figure 6. For the first and second cyclic loading of two alloys, the length of the stress platform of martensitic transformation is relatively large, and the length of the later stress platform decreases with the increase of the loading times, and the length of the final stress platform tends to remain invariant, as shown in Figure 6. When the alloy is unloaded, some of the martensite undergoes an inverse transformation, so the martensitic transformation occurs again when the alloy is reloaded. When loading and unloading reach a certain number of times, the contents of inverse martensitic transformation are approximately constant, which can result in the fact that the stress-platform length and the residual strain tend to be approximately invariant. Due to the loading strain on the stress platform of martensite transformation, some of the martensite is converted to austenite under loading conditions. Under the condition of unloading, only a small amount of martensite has inverse phase transformation, so no stress-induced reverse transformation of martensite can be observed on the unloading stress-strain curve. For the two alloys, the maximum value of cyclic dissipation energy (Wd) is at the second cycle loading, starting from the second cycle, the Wd values decrease rapidly, and then tends to stabilize, that is, the Wd values of the Ti85Nb10Sn5 alloy tend to be stable after the seventh cycle; however, the Wd values of the Ti82Nb13Sn5 alloy tend to stabilize after the fifth cycle, as shown in Figure 7d. During the first few cycles of the alloys, the interface of the parent phase is more movable, and its dissipation energy includes not only the energy dissipation generated by the stress-induced α″ phase transformation, but also the energy dissipation caused by the movement of the parent phase interface [44]. Therefore, in the first few cycles, the energy consumption is large. With the increase of cycle times, the mobility of the parent phase interface becomes poor, and the energy dissipation caused by the movement of the parent phase interface gradually disappears [44], which leads to the decrease of the Wd of the two alloys with the increase of the loading times (larger than the second time). Finally, the Wd values tend to be stable.
3.6. Nanoindentation of Ti–Nb–Sn Alloys
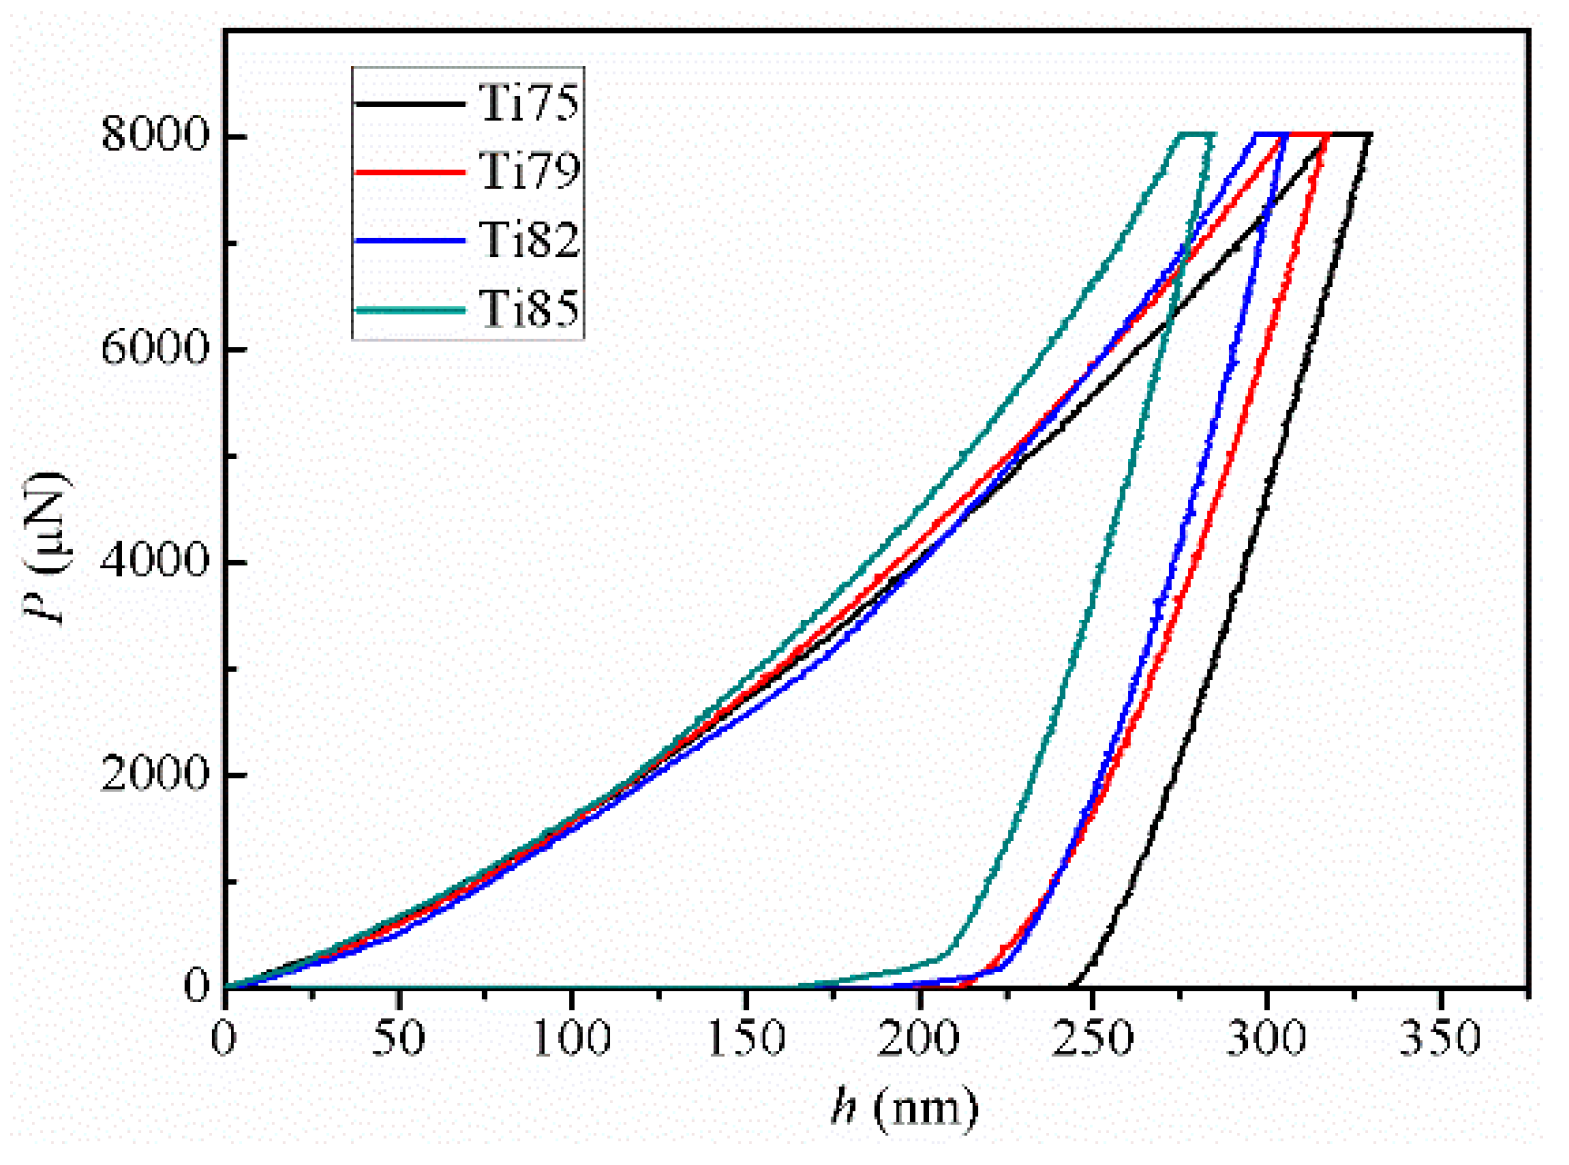
Figure 8 shows the representative load (P)-displacement (h) nanoindentation curves for the Ti–Nb–Sn alloys. The calculated hardness (H), the reduced elastic modulus (Er), H/Er, and H3/Er2 ratio are listed in Table 3. The Er values of Ti80Nb10Sn5 and Ti82Nb13Sn5 alloys are 80 GPa and 75 GPa, respectively, while the Er values of Ti79Nb16Sn5 and Ti75Nb20Sn5 alloys are 62 GPa and 61 GPa, respectively. In fact, the Ti85Nb10Sn5 alloy has the largest Er value and hardness value (3.4 GPa), and the Ti75Nb20Sn5 alloy has the minimum Er value and hardness (2.6 GPa).
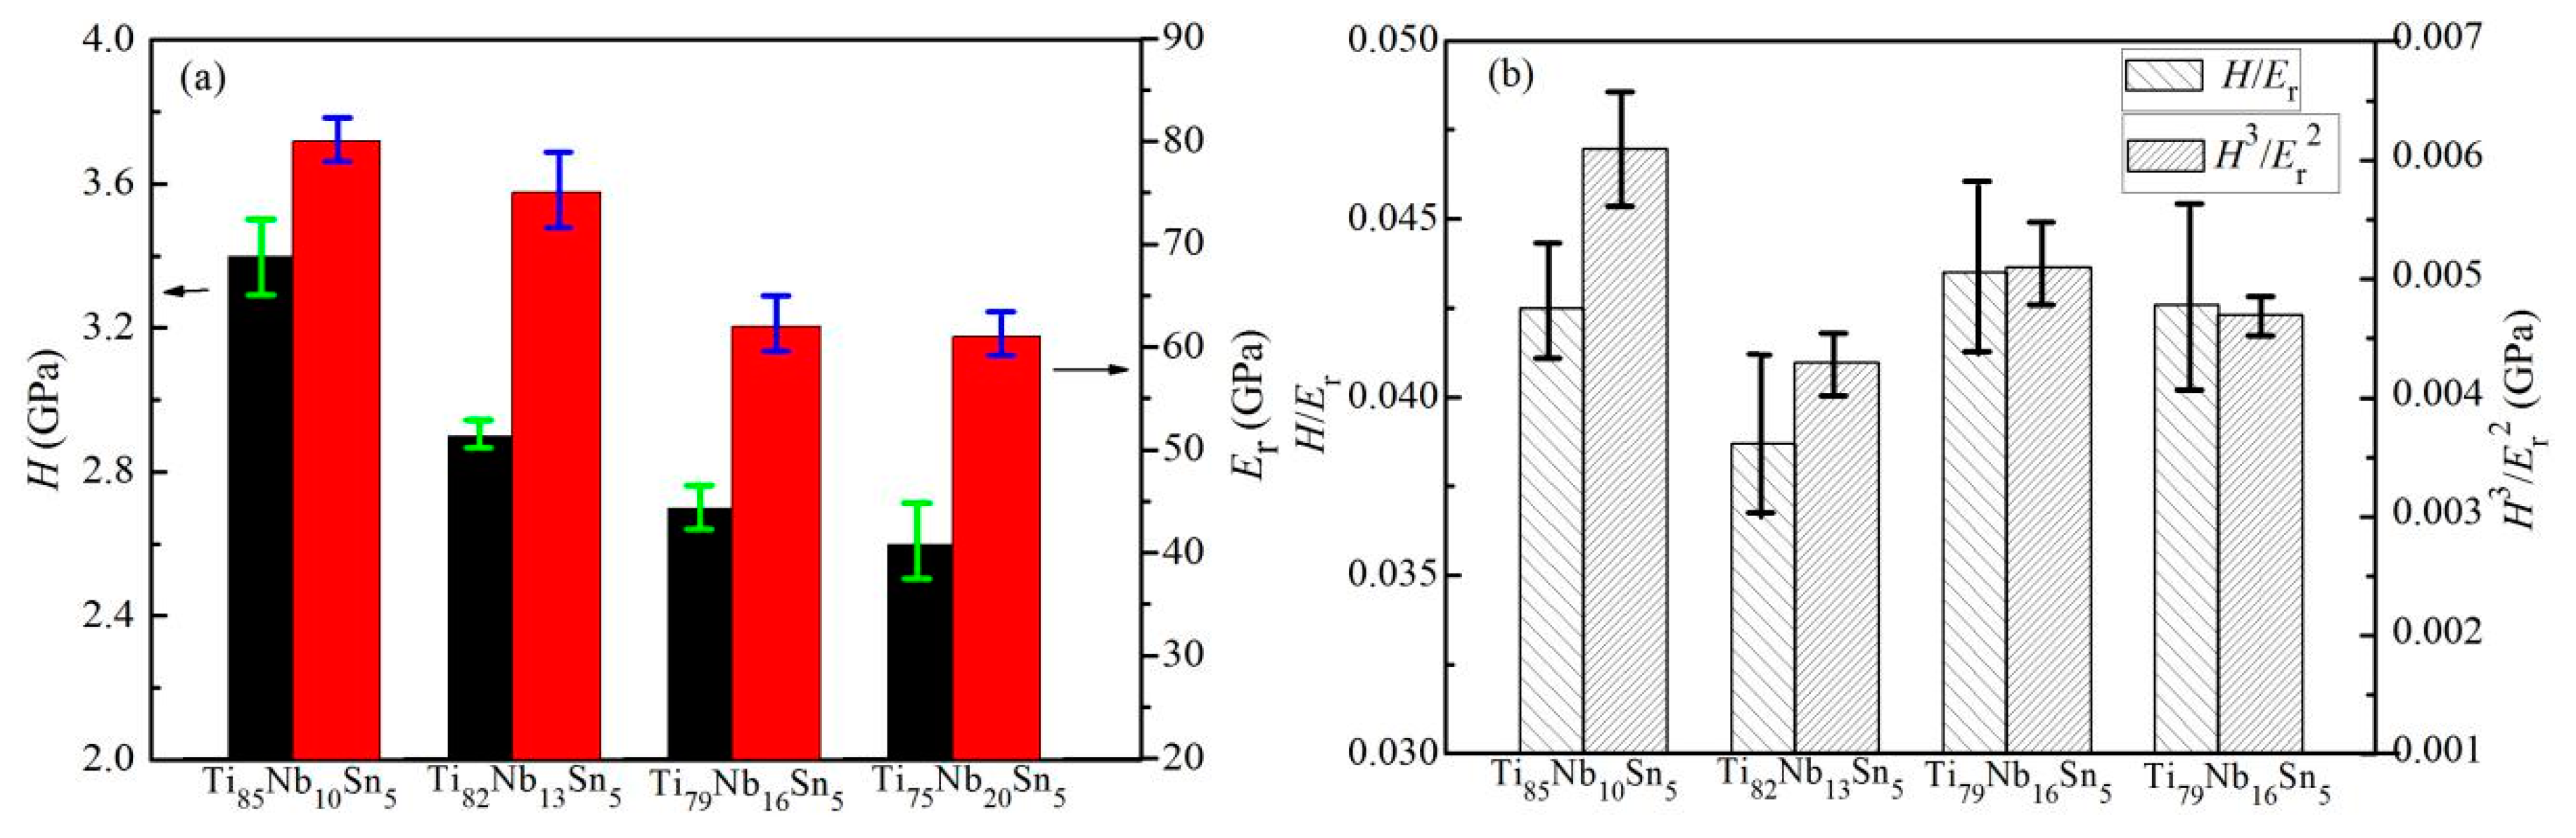
The H and Er values decrease with the increase of Nb content, and with the decrease of martensite contents, as shown in Figure 9a and Table 1. As the elastic modulus and hardness of α or α″ martensite phase are higher than those of β phase, respectively, it indicates that the elastic modulus and hardness of the Ti85Nb10Sn5 and Ti82Nb13Sn5 alloys are larger than those of the Ti79Nb16Sn5 and Ti75Nb20Sn5 alloys. In addition, the elastic modulus of the Ti75Nb20Sn5 alloy is 2–6 times of that of human bone (10–30 GPa), which is closer to that of human bone, comparing with that of Ti-6Al-4V alloy (120 GPa) [2]. Accordingly, the Ti75Nb20Sn5 alloy can be considered as a novel biomedical alloy.
The reported H/Er value represents the wear resistance of the materials [45]. The large H/Er value of the materials indicates the large wear resistance of the materials or a long service life [45]. The Ti79Nb16Sn5 alloy has the largest H/Er value (0.0435), and the Ti82Nb13Sn5 alloy has the smallest H/Er value (0.0387), as shown in Figure 9 and Table 3, indicating that the Ti79Nb16Sn5 alloy has good wear resistance, and that the Ti82Nb13Sn5 alloy has poor wear resistance. In addition, the H/Er value of Ti85Nb10Sn5 alloy is approximately equal to that of Ti75Nb20Sn5 alloy, which indicates that there is no direct relationship between the martensite content and the H/Er values of Ti–Nb–Sn alloys. In addition, the H/Er values of the four alloys are higher than those of the CP-Ti alloy (0.0238), of the Ti-8Fe alloy, and of the Ti–Fe–Ta alloys [45], which indicates that the Ti–Nb–Sn alloys have the good wear resistance or a long service life as biomedical materials.
Another parameter, the H3/Er2 value, can indicate the anti-wear ability of materials. A large H3/Er2 value indicates a strong anti-wear ability of a material, and thus the service life of the materials can be improved [46,47]. The Ti85Nb10Sn5 alloy has the largest H3/Er2 value (0.0061 GPa), and the Ti82Nb13Sn5 alloy has the smallest H3/Er2 value (0.0043 GPa) in Ti-Nb-Sn alloys, as shown in Figure 9b and Table 3, indicating that the Ti85Nb10Sn5 alloy has good anti-wear ability, while the Ti82Nb13Sn5 alloy has a weak anti-wear ability. In addition, the H3/Er2 values of the Ti79Nb16Sn5 and Ti75Nb20Sn5 alloys are 0.0051 GPa and 0.0047 GPa, respectively, but smaller than that of Ti85Nb10Sn5 alloy, and larger than that of Ti82Nb13Sn5 alloy. These results indicate that there is no direct relationship between the content of α″ martensite phase and the H3/Er2 values of alloys, which is similar to the results of H/Er values. In fact, the H3/Er2 values of Ti–Nb–Sn alloys are higher than that of CP-Ti biomaterial (0.0014 GPa) [45], indicating that the Ti–Nb–Sn alloys exhibit the good anti-wear capability or long service life as biomedical materials.
4. Conclusions
The microstructural and mechanical properties of β-type Ti85-xNb10-xSn5 (x = 0, 3, 6, 10 at.%) alloys with low Young’s modulus were investigated. The main results are summarized as follows:
- (1)
- The Ti85Nb10Sn5 and Ti75Nb20Sn5 alloys are composed of simpleαand β phase, respectively; the Ti82Nb13Sn5 and Ti79Nb16Sn5 alloys are composed of β and α″ phases. The content of martensite phase decreases with the increase of Nb content.
- (2)
- The Ti82Nb13Sn5 and Ti79Nb16Sn5 alloys show inverse martensitic phase transition during heating. No martensite phase transition is found during cooling from 150 °C to –100 °C. The Ti–Nb–Sn alloys with no martensitic transformation in the temperature range that human body can bear can be considered as the good biomedical alloy for implantation.
- (3)
- The final residual strain values that tend to be stable for the Ti85Nb10Sn5 and Ti82Nb13Sn5 alloys are 0.39% and 0.29%, respectively, indicating the good superelastic properties of the alloys in 10-times cyclic loading.
- (4)
- The reduced elastic modulus of Ti75Nb20Sn5 alloy is 61 GPa, which is 2–6 times of that of human bone (10–30 GPa), and is smaller than that of commercial Ti-6Al-4V biomedical alloy (120 GPa). The Ti75Nb20Sn5 alloy can be considered as a novel biomedical alloy. The H/Er and H3/Er2 values of the four alloys are higher than those of the CP-Ti alloy (0.0238), which indicates that the presented alloys have good wear resistance and anti-wear capability.
Author Contributions
P.L. and X.M. conceived and designed the experiments; P.L., X.M. and D.W. performed the experiments, analyzed the data, wrote original draft preparation; P.L. and H.Z. wrote review and editing.
Conflicts of Interest
The authors declare no conflict of interest.
References
- Liu, Y.J.; Li, X.P.; Zhang, L.C.; Sercombe, T.B. Processing and properties of topologically optimised biomedical Ti-24Nb-4Zr-8Sn scaffolds manufactured by selective laser melting. Mater. Sci. Eng. A 2015, 642, 268–278. [Google Scholar] [CrossRef]
- Ninomi, M. Recent metallic materials for biomedical applications. Metall. Mater. Trans. A 2002, 33A, 477–486. [Google Scholar] [CrossRef]
- Song, B.; Dong, S.J.; Zhang, B.C.; Liao, H.L.; Coddet, C. Effects of processing parameters on microstructure and mechanical property of selective laser melted Ti6Al4V. Mater. Des. 2012, 35, 120–125. [Google Scholar] [CrossRef]
- Chaves, J.M.; Florêncio, O.; Silva, P.S.; Marques, P.W.B.; Afonso, C.R.M. Influence of phase transformations on dynamical elastic modulus and anelasticity of beta Ti–Nb–Fe alloys for biomedical applications. J. Mech. Behav. Biomed. Mater. 2015, 46, 184–196. [Google Scholar] [CrossRef]
- Niinomi, M. Recent research and development in titanium alloys for biomedical applications and healthcare goods. Sci. Technol. Adv. Mater. 2003, 4, 445–454. [Google Scholar] [CrossRef] [Green Version]
- Hon, Y.H.; Wang, J.Y.; Pan, Y.N. Composition/phase structure and properties of Titanium-Niobium alloys. Mater. Trans. 2003, 44, 2384–2390. [Google Scholar] [CrossRef]
- Li, P.Y. Microstructural and mechanical properties of novel β-type Ti–Nb–Ni alloys containing a second phase. Int. J. Mater. Res. 2018, 109, 708–715. [Google Scholar] [CrossRef]
- Ozaki, T.; Matsumoto, H.; Watanabe, S.; Hanada, S. Beta Ti alloys with low Young’s modulus. Mater. Trans. 2004, 45, 2776–2779. [Google Scholar] [CrossRef]
- Matsumoto, H.; Watanable, S.; Hanada, S. Beta TiNbSn alloys with low Young’s modulus and high strength. Mater. Trans. 2005, 46, 1070–1078. [Google Scholar] [CrossRef]
- Moraes, P.E.L.; Contieri, R.J.; Lopes, E.S.N.; Robin, A.; Caram, R. Effects of Sn addition on the microstructure, mechanical properties and corrosion behavior of Ti–Nb–Sn alloys. Mater. Charact. 2014, 96, 273–281. [Google Scholar] [CrossRef]
- Attar, H.; Haghighi, S.E.; Kent, D.; Wu, X.H.; Dargusch, M.S. Comparative study of commercially pure titanium produced by laser engineered net shaping, selective laser melting and casting processes. Mater. Sci. Eng. A 2017, 705, 385–393. [Google Scholar] [CrossRef]
- Ho, W.F.; Wu, S.C.; Hsu, S.K.; Li, Y.C.; Hsu, H.C. Effects of molybdenum content on the structure and mechanical properties of as-cast Ti–10Zr-based alloys for biomedical applications. Mater. Sci. Eng. C 2012, 32, 517–522. [Google Scholar] [CrossRef]
- Ho, W.F.; Pan, C.H.; Wu, S.C.; Hsu, H.C. Mechanical properties and deformation behavior of Ti–5Cr–xFe alloys. J. Alloys Compd. 2009, 472, 546–550. [Google Scholar] [CrossRef]
- Silva, H.; Schneider, S.; Neto, C.M. Study of nontoxic aluminum and vanadium-free titanium alloys for biomedical applications. Mater. Sci. Eng. C 2004, 24, 679–682. [Google Scholar] [CrossRef]
- Hsu, H.C.; Hsu, S.K.; Wu, S.C.; Lee, C.J.; Ho, W.F. Structure and mechanical properties of as-cast Ti–5Nb–xFe alloys. Mater. Charact. 2010, 61, 851–858. [Google Scholar] [CrossRef]
- Chang, L.L.; Wang, Y.D.; Ren, Y. In-situ investigation of stress-induced martensitic transformation in Ti–Nb binary alloys with low Young’s modulus. Mater. Sci. Eng. A 2016, 651, 442–448. [Google Scholar] [CrossRef]
- Haghighi, S.E.; Liu, Y.J.; Cao, G.H.; Zhang, L.C. Phase transition, microstructural evolution and mechanical properties of Ti–Nb–Fe alloys induced by Fe addition. Mater. Des. 2016, 97, 279–286. [Google Scholar] [CrossRef]
- Haghighi, S.E.; Prashanth, K.G.; Attar, H.; Chaubey, A.K.; Cao, G.H.; Zhang, L.C. Evalution of mechanical and wear properties of Ti–xNb–7Fe alloys disinged for biomedical applications. Mater. Des. 2016, 111, 592–599. [Google Scholar] [CrossRef]
- Wen, M.; Wen, C.; Hodgson, P.; Li, Y. Fabrication of Ti–Nb–Ag alloy via powder metallurgy for biomedical applications. Mater. Des. 2014, 56, 629–634. [Google Scholar] [CrossRef]
- Xu, W.; Kim, K.B.; Das, J.; Calin, M.; Eckert, J. Phase stability and its effffect on the deformation behavior of Ti–Nb–Ta–In/Cr b alloys. Scr. Mater. 2006, 54, 1943–1948. [Google Scholar] [CrossRef]
- Haghighi, S.E.; Liu, Y.J.; Cao, G.H.; Zhang, L.C. Influence of Nb on the β→α″ martensitic phase transformation and properties of the newly designed Ti–Fe–Nb alloys. Mater. Sci. Eng. C 2017, 60, 503–510. [Google Scholar] [CrossRef]
- Li, P.Y.; Zhang, H.; Tong, T.; He, Z.R. The rapidly solidified β-type Ti–Fe–Sn alloys with high specific strength and low elastic modulus. J. Alloys Compd. 2019, 786, 986–994. [Google Scholar] [CrossRef]
- Nnamchi, P.S.; Obayi, C.S.; Todd, I.; Rainforth, M.W. Mechanical and electrochemical characterisation of new Ti–Mo–Nb–Zr alloys for biomedical applications. J. Mech. Behav. Biomed. Mater. 2016, 60, 68–77. [Google Scholar] [CrossRef]
- Ruzic, J.; Emura, X.; Ji, X.; Watanabe, I. Mo segregation and distribution in Ti–Mo alloy investigated using nanoindentation. Mater. Sci. Eng. A 2018, 718, 48–55. [Google Scholar] [CrossRef]
- Biesiekierski, A.; Lin, J.X.; Li, Y.C.; Ping, D.H.; Yamabe-Mitarai, Y.; Wen, C. Investigations into Ti–(Nb, Ta)–Fe alloys for biomedical application. Acta Biomater. 2016, 32, 336–347. [Google Scholar] [CrossRef]
- Pavón, L.L.; Kim, H.Y.; Hosoda, H.; Miyazaki, S. Effect of Nb content and heat treatment temperature on superelastic properties of Ti–24Zr–(8–12)Nb–2Sn alloys. Scripta Mater. 2015, 95, 46–49. [Google Scholar] [CrossRef]
- Qu, W.T.; Sun, X.G.; Yuan, B.F.; Xiong, C.Y.; Zhang, F.; Li, Y.; Sun, B.H. Microstructures and phase transformations of Ti–30Zr–xNb (x = 5, 7, 9, 13 at.%) shape memory alloys. Mater. Charact. 2016, 122, 1–5. [Google Scholar] [CrossRef]
- Kim, H.Y.; Ikehara, Y.; Kim, J.I.; Hosoda, H.; Miyazaki, S. Martensitic transformation, shape memory effect and superelasticity of Ti–Nb binary alloys. Acta Mater. 2006, 54, 2419–2429. [Google Scholar] [CrossRef]
- Zhang, D.C.; Lin, J.G.; Jiang, W.J.; Ma, M.; Peng, Z.G. Shape memory and superelastic behavior of Ti-7.5Nb-4Mo-1Sn alloy. Mater. Des. 2011, 32, 4614–4617. [Google Scholar] [CrossRef]
- Horiuchi, Y.; Nakayama, K.; Inamura, T.; Kim, H.Y.; Wakashima, K.; Miyazaki, S.; Hosoda, H. Effect of Cu addition on shape memory behavior of Ti-18 mol%Nb alloys. Mater. Trans. 2007, 48, 414–421. [Google Scholar] [CrossRef]
- Wang, B.L.; Zheng, Y.F.; Zhao, L.C. Effects of Sn content on the microstructure, phase constitution and shape memory effect of Ti–Nb–Sn alloys. Mater. Sci. Eng. A 2008, 486, 146–151. [Google Scholar] [CrossRef]
- Kim, J.I.; Kim, H.Y.; Hosoda, H.; Miyazaki, S. Shape memory characteristics of Ti–22Nb–(2–8)Zr (at.%) biomedical alloys. Mater. Sci. Eng. A 2005, 403, 334–339. [Google Scholar] [CrossRef]
- Yılmaz, E.; Gökçe, A.; Findik, F.; Gülsoy, H.O. Characterization of biomedical Ti-16Nb-(0-4) Sn alloys produced by powder injection molding. Vacuum 2017, 142, 164–174. [Google Scholar]
- Guo, S.; Shang, Y.; Zhang, J.S.; Meng, Q.K.; Cheng, X.N.; Zhao, X.Q. In situ synchrotron X-ray diffraction study of deformation behaviour of a metastable β-type Ti-33Nb-4Sn alloy. Mater. Sci. Eng. A 2017, 692, 81–89. [Google Scholar] [CrossRef]
- Hanada, S.; Masahashi, N.; Jung, T.K.; Yamada, N.; Yamako, G.; Itoi, E. Fabrication of a high-performance hip prosthetic stem using β Ti-33.6Nb-4Sn. J. Mech. Behav. Biomed. Mater. 2014, 30, 140–149. [Google Scholar] [CrossRef]
- Miura, K.K.; Yamada, N.; Hanada, S.J.; Jung, T.K.; Itoi, E. The bone tissue compatibolity of a new Ti-Nb-Sn alloy with low Young’s modulus. Acta. Biomater. 2011, 7, 2320–2326. [Google Scholar] [CrossRef]
- Li, P.Y. Microstructure and mechanical properties of novel β-type Ti–Co–Zr alloys with high specific strength. Mater. Res. Express 2019, 6, 076559. [Google Scholar] [CrossRef]
- Yang, H.; Wen, J.; Quan, M.; Wang, J. Evaluation of the volume fraction of nanocrystals devitrified in Al-based amorphous alloys. J. Non-Cryst. Solids 2009, 355, 235–238. [Google Scholar] [CrossRef]
- Kolli, R.P.; Joost, W.J.; Ankem, S. Phase stability and stress-induced transformation in beta Titanium alloys. JOM 2015, 67, 1273–1280. [Google Scholar] [CrossRef]
- Wang, Q.; Dong, C.; Liaw, P.K. Structural stabilities of β-Ti alloys studied using a new Mo equivalent derived from [β/(α+β)] phase-boundary slopes. Metall. Mater. Trans. A 2015, 46, 3440–3447. [Google Scholar] [CrossRef]
- Cui, B.; Yao, J.; Wu, Y.; Zhang, X.; Wang, F.L.; Sui, J.H.; Cai, W. Precipitation behavior and mechanical properties of Ti–Ni–Nb–Co alloys. Intermetallics 2018, 95, 40–47. [Google Scholar] [CrossRef]
- Hussein, A.H.; Gepreel, M.A.H.; Gouda, M.K.; Hefnawy, A.M.; Kandil, S.H. Biocompatibility of new Ti–Nb–Ta base alloys. Mater. Sci. Eng. C 2016, 61, 574–578. [Google Scholar] [CrossRef]
- Fischer, F.D.; Reisner, G.; Werner, E.; Tanaka, K.; Cailletaud, G.; Antretter, T. A new view on transformation induced plasticity (TRIP). Int. J. Plast. 2000, 16, 723–748. [Google Scholar] [CrossRef]
- He, Z.R.; Wang, Q.; Wang, F.; Wang, Y.S.; Yang, J. Effect of annealing temperatures on microstructure and tensile properties of Ti–Ni–Cr low-temperature superelasticity alloy. Rare Met. Mater. Eng. 2011, 40, 1998–2001. [Google Scholar]
- Haghighi, S.E.; Cao, G.H.; Zhang, L.C. Nanoindentation study of mechanical properities of Ti based alloys with Fe and Ta additions. J. Alloys Compds. 2017, 692, 892–897. [Google Scholar] [CrossRef]
- Xu, J.; Wang, G.D.; Lu, X.; Liu, L.; Munroe, P.; Xie, Z.H. Mechanical and corrosion-resistant properties of Ti–Nb–Si–N nanocomposite films prepared by a double glow discharge plasma technique. Ceram. Int. 2014, 40, 8621–8630. [Google Scholar] [CrossRef]
- Musil, J.; Kunc, F.; Zeman, H.; Poláková, H. Relationships between hardness, Young’s modulus and elastic recovery in hard nanocomposite coatings. Surf. Coat. Technol. 2002, 154, 304–313. [Google Scholar] [CrossRef]
Figure 1.
XRD patters of Ti85-xNb10+xSn5 (x = 0, 3, 6, and 10 at.%) alloys.
Figure 2.
Microstructure of (a) and (b) Ti85Nb10Sn5, (c) and (d) Ti82Nb13Sn5, (e) Ti79Nb16Sn5, and (f) Ti75Nb20Sn5 alloys observed by optics microscope.
Figure 2.
Microstructure of (a) and (b) Ti85Nb10Sn5, (c) and (d) Ti82Nb13Sn5, (e) Ti79Nb16Sn5, and (f) Ti75Nb20Sn5 alloys observed by optics microscope.

Figure 3.
Phase transformation temperature of (a) Ti85Nb10Sn5, (b) Ti82Nb13Sn5, (c) Ti79Nb16Sn5 and (d) Ti75Nb20Sn5 alloys in the DSC curves.
Figure 3.
Phase transformation temperature of (a) Ti85Nb10Sn5, (b) Ti82Nb13Sn5, (c) Ti79Nb16Sn5 and (d) Ti75Nb20Sn5 alloys in the DSC curves.
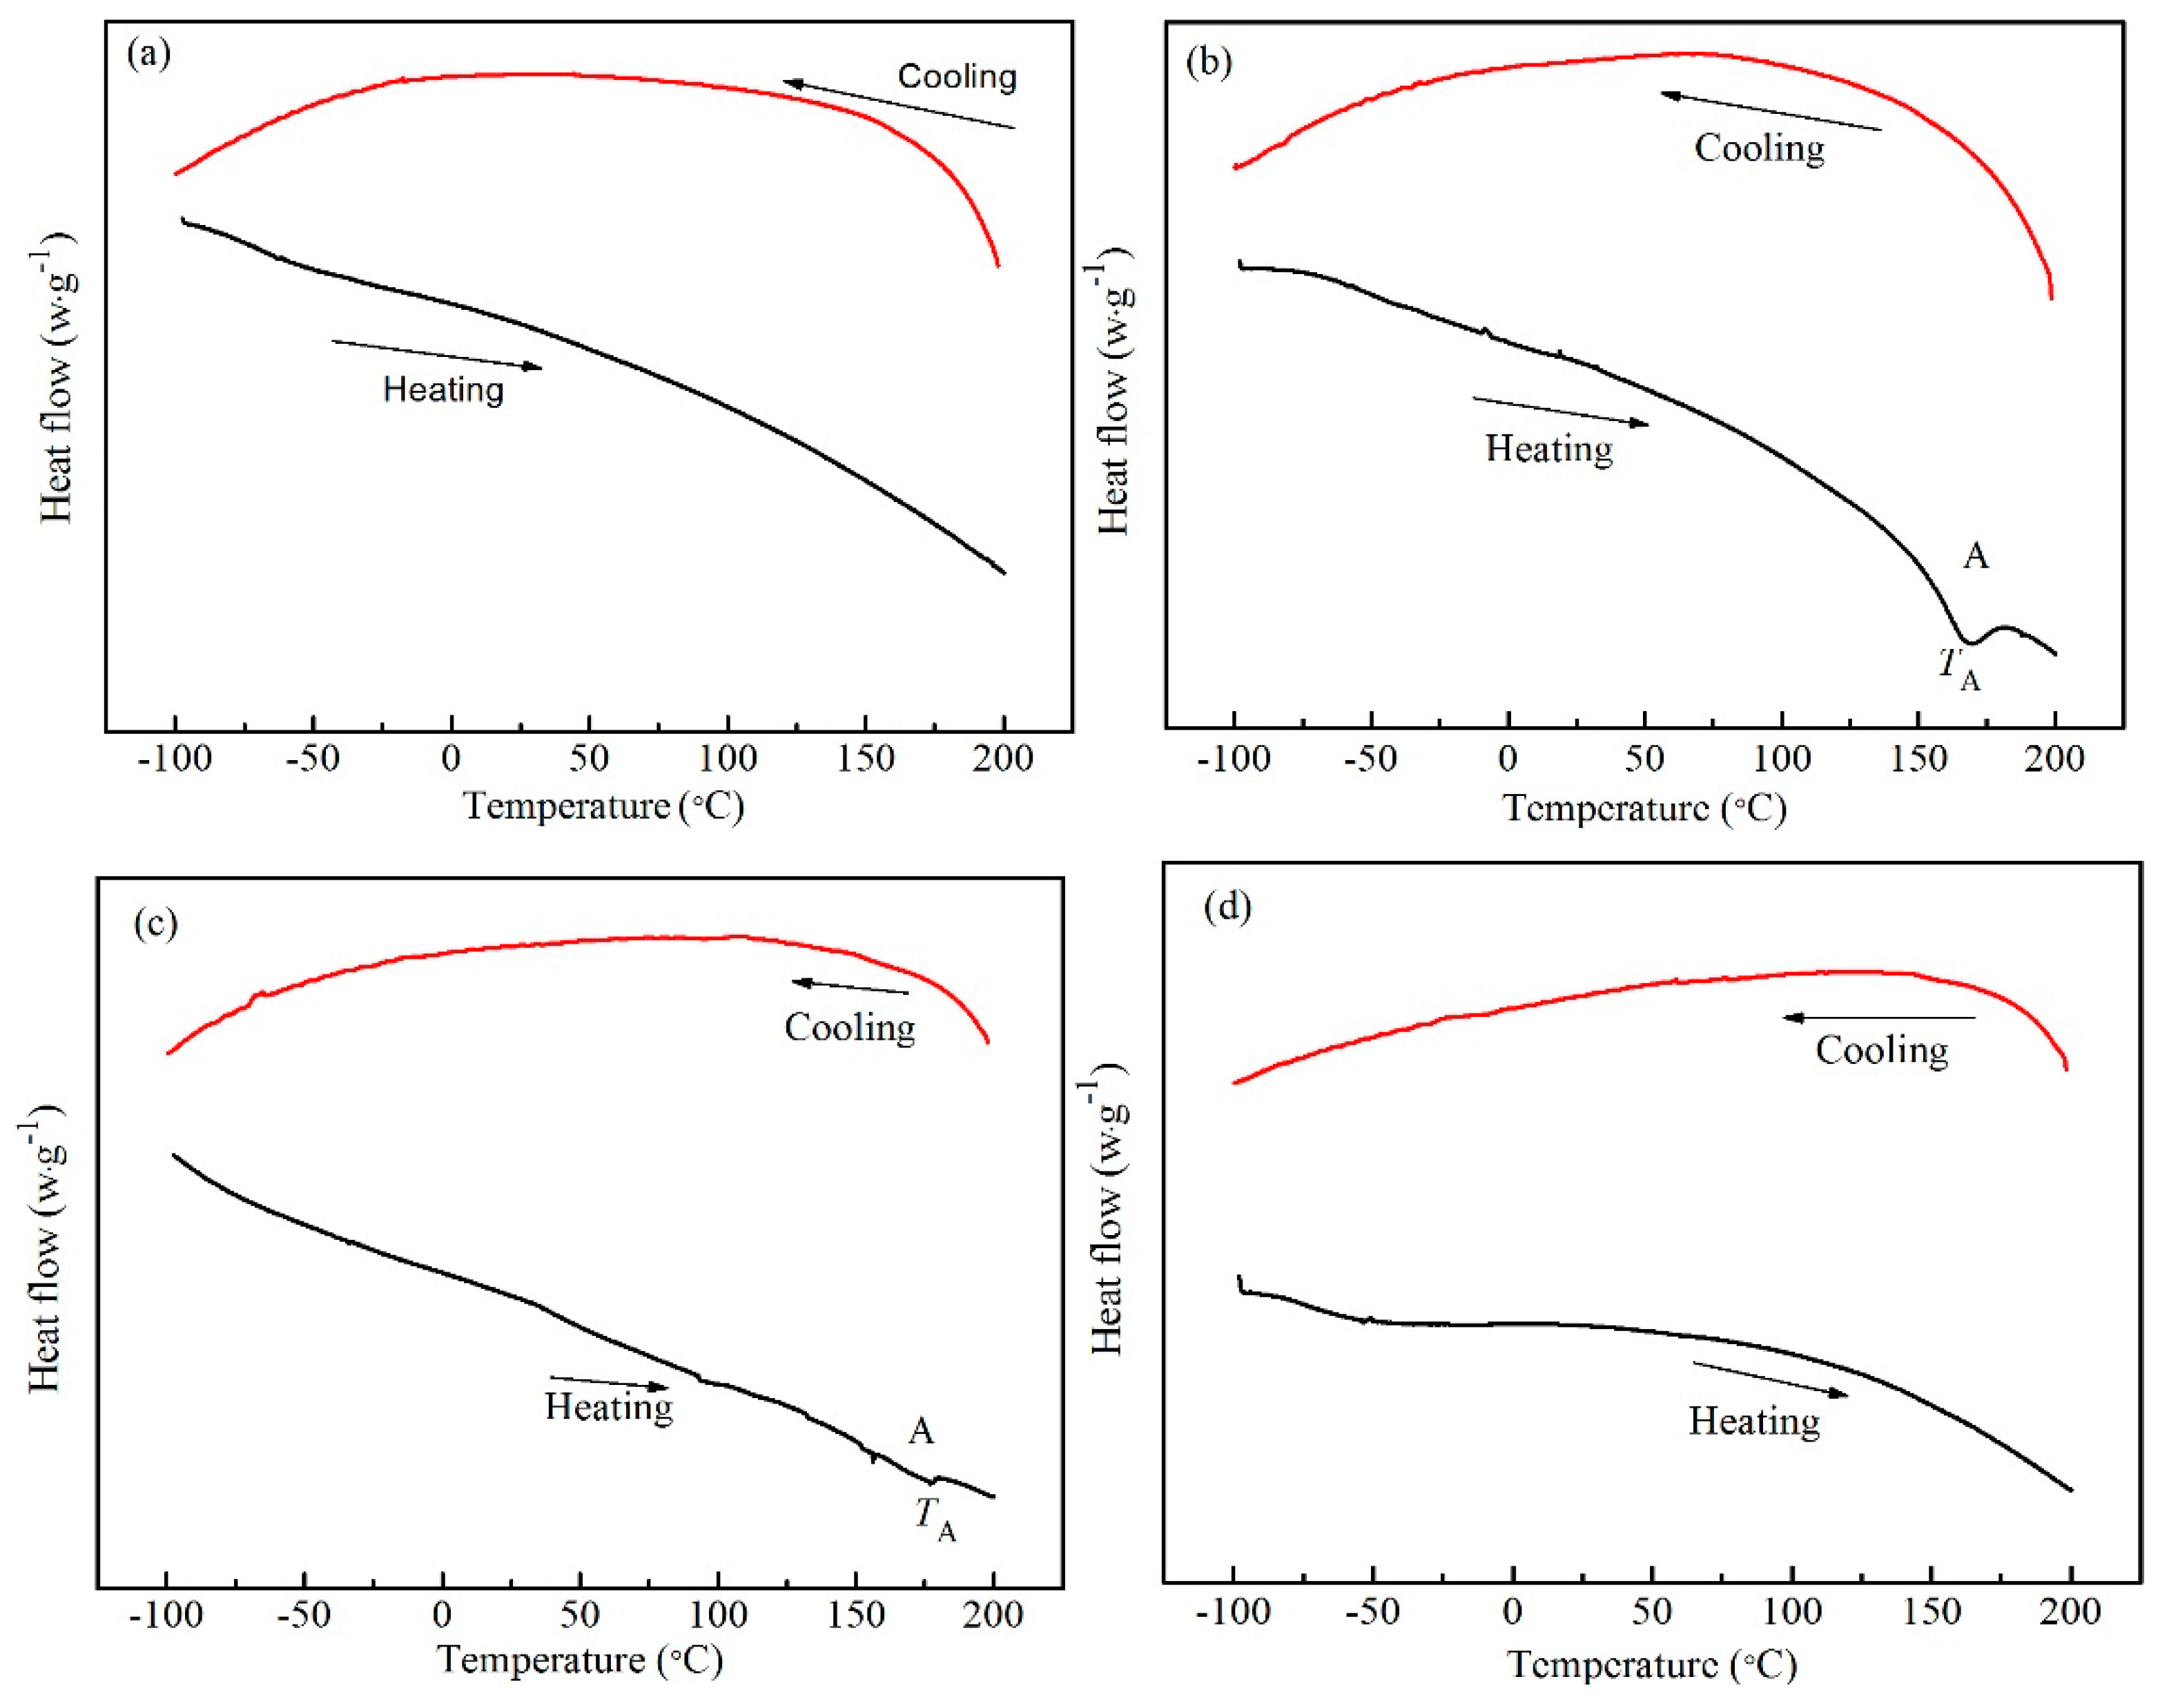
Figure 4.
Stress-strain curves of (a) Ti85Nb10Sn5, (b) Ti82Nb13Sn5, (c) Ti79Nb16Sn5 and (d) Ti75Nb20Sn5 alloys.
Figure 4.
Stress-strain curves of (a) Ti85Nb10Sn5, (b) Ti82Nb13Sn5, (c) Ti79Nb16Sn5 and (d) Ti75Nb20Sn5 alloys.
Figure 5.
Compression elastic energy of Ti75Nb20Sn5 alloy.
Figure 6.
Cyclic loading stress-strain curve of (a) Ti85Nb10Sn5 and (b) Ti82Nb13Sn5 alloys.
Figure 7.
The (a) stress-strain curves of Ti85Nb10Sn5 alloy under first cyclic loading; the relationship between, (b) residual strain (εr) and elastic strain (εe), (c) critical stress (σm), (d) cyclic dissipation energy (Wd), and loading times (n) for the Ti85Nb10Sn5 and Ti82Nb13Sn5 alloys.
Figure 7.
The (a) stress-strain curves of Ti85Nb10Sn5 alloy under first cyclic loading; the relationship between, (b) residual strain (εr) and elastic strain (εe), (c) critical stress (σm), (d) cyclic dissipation energy (Wd), and loading times (n) for the Ti85Nb10Sn5 and Ti82Nb13Sn5 alloys.
Figure 8.
Representative load (P)-displacement (h) nanoindentation curves for the Ti-Nb-Sn alloys. The Ti85Nb10Sn5, Ti82Nb13Sn5, Ti79Nb16Sn5, and Ti75Nb20Sn5 alloys are labeled by Ti85, Ti82, Ti79 and Ti75, respectively.
Figure 8.
Representative load (P)-displacement (h) nanoindentation curves for the Ti-Nb-Sn alloys. The Ti85Nb10Sn5, Ti82Nb13Sn5, Ti79Nb16Sn5, and Ti75Nb20Sn5 alloys are labeled by Ti85, Ti82, Ti79 and Ti75, respectively.
Figure 9.
(a) The hardness (H) and reduced elastic modulus (Er), and (b) the H/Er and H3/Er2 ratios of the as-cast Ti–Nb–Sn alloys.
Figure 9.
(a) The hardness (H) and reduced elastic modulus (Er), and (b) the H/Er and H3/Er2 ratios of the as-cast Ti–Nb–Sn alloys.

Table 1.
Measured mechanical properties of various alloys, including the initial stress (σms), finished stress (σmf), and finished strain (εmf) of martensitic transformation, 0.2 % offset yield stress (σ0.2), Vickers hardness (HV), elastic energy (We); volume fractions of α″ (Vα″) and β (Vβ) phases; molybdenum equivalent (Moeq); reverse martensite transformation temperature (TA) in DSC curves.
| Alloys | σms (MPa) | σmf (MPa) | εmf (%) | σ0.2 (MPa) | ε0.2 (%) | HV | We × 106 (J⋅m−3) | Vα″ (%) | Vβ (%) | Moeq | TA (°C) |
|---|---|---|---|---|---|---|---|---|---|---|---|
| Ti85Nb10Sn5 | 352 | 509 | 4.48 | 787 | 6.84 | 230 | -- | -- | -- | 7.83 | -- |
| Ti82Nb13Sn5 | 256 | 574 | 5.56 | 772 | 9.46 | 226 | -- | 26.5 | 73.5 | 9.02 | 169 |
| Ti79Nb16Sn5 | 370 | 508 | 3.21 | 611 | 5.30 | 220 | 1.65 | 7.1 | 92.9 | 10.14 | 177 |
| Ti75Nb20Sn5 | -- | -- | -- | 435 | 3.71 | 218 | 6.53 | 0.0 | 100 | 11.56 | -- |
Table 2.
The cyclic dissipation energy (Wd), residual strain (εr), elastic strain (εe), and critical stress (σm) of martensitic tranformation.
Table 2.
The cyclic dissipation energy (Wd), residual strain (εr), elastic strain (εe), and critical stress (σm) of martensitic tranformation.
| Alloys | Parameters | 1 | 2 | 3 | 4 | 5 | 6 | 7 | 8 | 9 | 10 |
|---|---|---|---|---|---|---|---|---|---|---|---|
| Ti85Nb10Sn5 | Wd × 106 (J⋅m−3) | 7.44 | 8.54 | 7.08 | 6.5 | 6.43 | 6.44 | 5.77 | 5.73 | 5.72 | 5.70 |
| εr (%) | 2.17 | 1.32 | 0.92 | 0.86 | 0.70 | 0.67 | 0.58 | 0.56 | 0.46 | 0.39 | |
| εe (%) | 1.47 | 2.09 | 2.55 | 2.64 | 2.87 | 2.90 | 2.93 | 3.00 | 3.04 | 3.05 | |
| σm (MPa) | 405 | 538 | 684 | 750 | 802 | 829 | 842 | 863 | 872 | 881 | |
| Ti82Nb13Sn5 | Wd × 106 (J⋅m−3) | 3.82 | 4.97 | 4.84 | 3.95 | 3.25 | 3.28 | 3.13 | 3.13 | 3.13 | 3.13 |
| εr (%) | 1.77 | 1.52 | 0.99 | 0.65 | 0.5 | 0.41 | 0.36 | 0.32 | 0.29 | 0.29 | |
| εe (%) | 1.24 | 1.45 | 1.75 | 1.98 | 2.24 | 2.28 | 2.42 | 2.49 | 2.49 | 2.49 | |
| σm (MPa) | 227 | 284 | 365 | 492 | 591 | 658 | 710 | 736 | 756 | 766 |
Table 3.
Measured mechanical properties of Ti–Nb–Sn alloys from the nanoindentation, including hardness (H), reduced elastic modulus (Er), H/Er, and H3/Er2.
Table 3.
Measured mechanical properties of Ti–Nb–Sn alloys from the nanoindentation, including hardness (H), reduced elastic modulus (Er), H/Er, and H3/Er2.
| Alloys | Er (GPa) | H (GPa) | H/Er | H3/Er2 (GPa) |
|---|---|---|---|---|
| Ti85Nb10Sn5 | 80 | 3.4 | 0.0425 | 0.0061 |
| Ti82Nb13Sn5 | 75 | 2.9 | 0.0387 | 0.0043 |
| Ti79Nb16Sn5 | 62 | 2.7 | 0.0435 | 0.0051 |
| Ti75Nb20Sn5 | 61 | 2.6 | 0.0426 | 0.0047 |
© 2019 by the authors. Licensee MDPI, Basel, Switzerland. This article is an open access article distributed under the terms and conditions of the Creative Commons Attribution (CC BY) license (http://creativecommons.org/licenses/by/4.0/).
Share and Cite
MDPI and ACS Style
Li, P.; Ma, X.; Wang, D.; Zhang, H. Microstructural and Mechanical Properties of β-Type Ti–Nb–Sn Biomedical Alloys with Low Elastic Modulus. Metals 2019, 9, 712. https://doi.org/10.3390/met9060712
AMA Style
Li P, Ma X, Wang D, Zhang H. Microstructural and Mechanical Properties of β-Type Ti–Nb–Sn Biomedical Alloys with Low Elastic Modulus. Metals. 2019; 9(6):712. https://doi.org/10.3390/met9060712
Chicago/Turabian StyleLi, Peiyou, Xindi Ma, Duo Wang, and Hui Zhang. 2019. "Microstructural and Mechanical Properties of β-Type Ti–Nb–Sn Biomedical Alloys with Low Elastic Modulus" Metals 9, no. 6: 712. https://doi.org/10.3390/met9060712
Note that from the first issue of 2016, this journal uses article numbers instead of page numbers. See further details here.