Multiscale Comparison Study of Void Closure Law and Mechanism in the Bimetal Roll-Bonding Process


School of Mechanical Engineering, University of Science and Technology Beijing, No. 30, Xueyuan Road, Haidian District, Beijing 100083, China
*
Author to whom correspondence should be addressed.
Metals 2019, 9(3), 343; https://doi.org/10.3390/met9030343
Submission received: 2 January 2019
/
Revised: 12 March 2019
/
Accepted: 14 March 2019
/
Published: 18 March 2019
(This article belongs to the Special Issue Multiscale Modeling of Materials and Processes)
Abstract
:The void closure mechanism during the roll-bonding process was investigated using a multiscale approach, which includes contact deformation at the macro-scale and atomic bonding at the micro-scale. The closure process of the voids was observed using roll-bonding tests of 304 stainless steel/Q235 carbon steel. A finite element model was built to simulate the macroscopic deformation process of 304/Q235 material, and a molecular dynamics model established to simulate the deformation process of the microscopic rough peaks. The closure law and mechanism of interface voids at the macro- and micro-scales were studied. The results show that the closure rate of interface voids decreases with the decrease in the average contact stress during the contact deformation process. In the atomic bonding process, the void closure rate is slow in the elastic deformation process. The ordered atoms near the interface become disordered as plastic deformation occurs, which increases the void closure rate and hinders dislocation propagation through the interface, resulting in significant strengthening effects via plastic deformation. Ultimately, a perfect lattice is reconstructed with void healing. In addition, the interface morphology after roll-bonding at the macro scale was determined by the morphology of the 304 steel with larger yield strength ratio, while the interface morphology at the micro-scale was mainly determined by the morphology of the Q235 steel with a higher yield strength.
1. Introduction
Austenitic stainless steel, exhibiting good corrosion resistance at high temperatures, is widely used in the petrochemical industry, aviation, shipping, as well as other industries. Because the price of stainless steel is more expensive, it is more economical to use composite materials of stainless steel and low carbon steel in engineering applications [1]. Roll-bonding is an efficient solid-phase joining method for the industrial production of bimetallic products [2]. Compared with traditional welding methods, there are no brittle compounds that damage the mechanical properties [3]. Almost all materials with different physical and chemical properties can be combined by this method [4].
Theoretically, two ideal flats can form a close contact interface through the interatomic force without any pressure [5]. However, a perfectly smooth surface cannot be machined by any method on which asperities can be observed [6]. When the two materials are stacked, only the asperities on the surface contact each other, thus forming a row of irregular voids, which gradually shrink until completely closed during the roll-bonding process.
Modern roughness measurements show that the surface profile of many engineering surfaces has a multiscale fractal nature; that is, when the surface is properly amplified, the enlarged morphology is similar to the original morphology [7]. Therefore, there are nano-scale rough peaks existing on the micron-scale rough peaks based on this assumption. The whole roll-bonding process can be regarded as the closure process of interface voids on various scales. Many investigators have studied the closure process of voids in diffusion bonding processes using experiments and have established mathematical models [8,9,10]. However, studies on the closure law and mechanisms of void closures in roll-bonding processes are still limited.
The development of molecular dynamic (MD) simulations, which treat the atoms as typical particles and solve the trajectory through the Newton equations of motion [11,12], makes it possible to explore the microscopic nature of deformation based on simulation. Previous studies have already been carried out to simulate the bonding process of bimetallic compounds with surface roughness. Chen and Ke [13] studied the diffusion bonding process of Cu/Al with rough surfaces at different temperatures, and divided the bonding process into three stages. In the first stage, the rough peak on the rough surfaces deforms under stress before heating. In the second stage, the contact area increases significantly as the temperature increases. In the third stage, interdiffusion occurs between the two metals. Jiao [14] investigated the laws of void closure during Ni/Al linear friction welding with a rough surface. It was found that the mechanism of void closure on the rough surface of Al and Ni is different. The voids on the Al side are closed due to the elemental diffusion in the friction process, while the voids on the Ni side are closed in the forging process due to the deformation of the interface. These studies mainly focus on the void closure and diffusion process of bimetallic surfaces with rough surfaces, but lack research on the interfacial void closure behavior of bimetallic surfaces during roll-bonding.
Deformation behavior has an important influence on the closure process of interface voids. A large number of previous studies were conducted to investigate interface effects on the mechanical properties, and have provided ideas for studying the microscopic mechanism of void closure. An interface is usually divided into three types: coherent, semicoherent, and incoherent [15]. For incoherent interfaces, dislocations cannot pass through the interface during the deformation process because of the different lattice structures. Then dislocations accumulate at the interface, and a local shear effect occurs, which affects the properties of the material [16,17]. For coherent or semicoherent interfaces, the mismatch of the lattice parameter produces coherency stress and enhances the barrier strength [18,19,20]. For coherent twin interfaces, it was found that the interface can absorb dislocations and reduce dislocation density, thus strengthening plastic deformation [21,22].
In this study, 304 stainless steel and Q235 carbon steel were chosen as study materials. The closure process of real composite interface voids was observed through experiments. Then, the void closure behavior on different scales was studied by the finite element method and molecular dynamics method.
2. Closure Process of Interface Voids
2.1. Experimental Methods
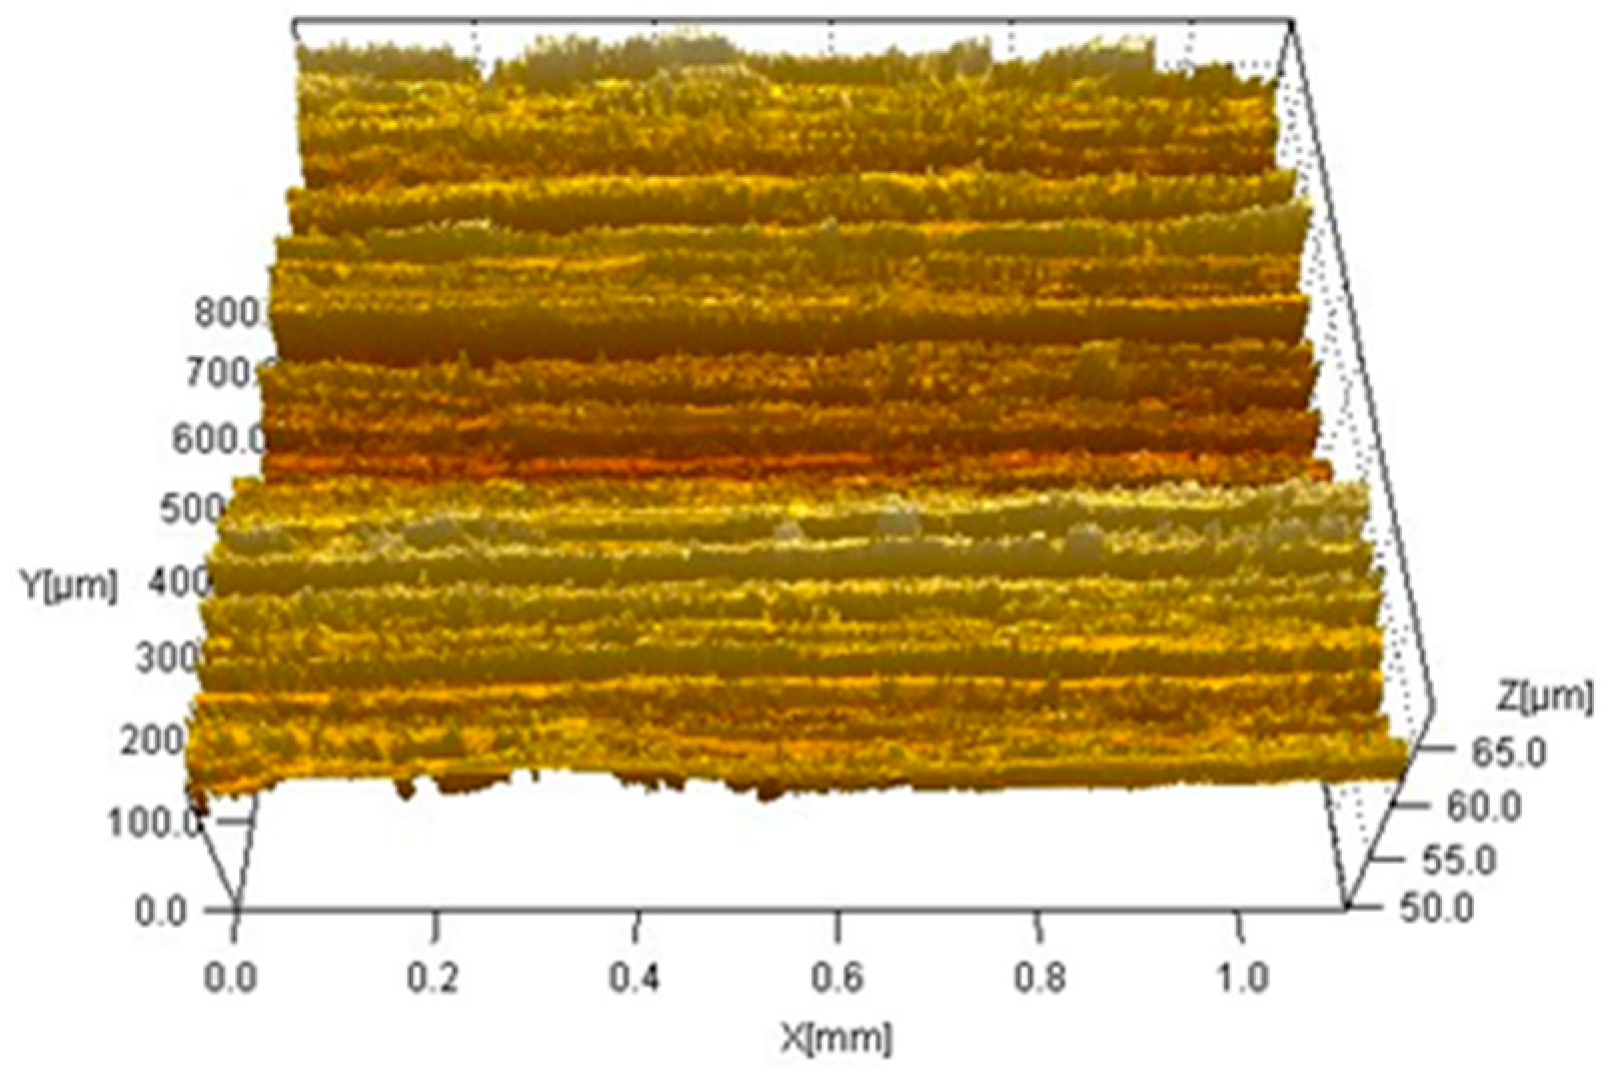
Commercial AISI 304 stainless steel and Q235A carbon steel were selected as the raw materials. The chemical compositions are given in Table 1. Both materials were cut into plate specimens with dimensions of 20 mm × 8 mm × 5 mm. Prior to the experiments, it was essential to remove any contaminant layer using a surface treatment method such as grinding, polishing, or burnishing [23]. The surfaces of the specimens were prepared by grinding on SiC wheels followed by polishing to 2.5 μm. The 3D surface morphology of the stainless steel specimens scanned by a white light interferometer microscope are shown in Figure 1.
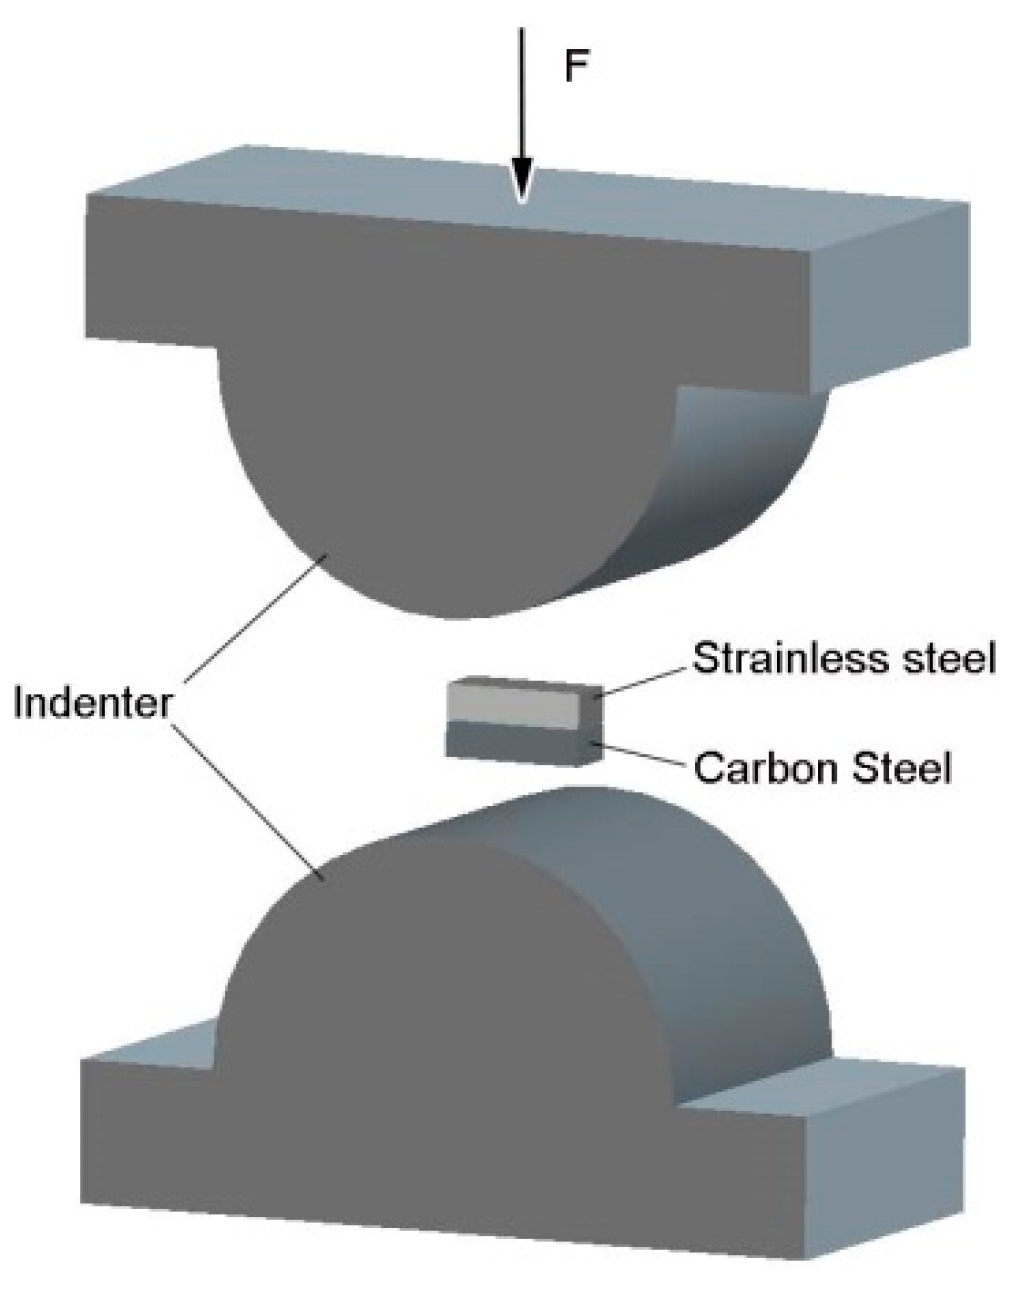
Cylindrical indenters were used to simulate rolls and static pressure experiments carried out to simulate rolling experiments. As shown in Figure 2, to keep the unit rolling force in the experimental process consistent with that in the actual production, two indenters with a diameter of 70 mm were designed. Moreover, as the indenters are prone to deformation under high pressure conditions, the selection of indenter materials and the processing technology are very important [24]. In this study, Cr40MoV die steel is selected as the material of indenter, and the surface was hardened after wire-electrode cutting.
The two materials were first heated to 700 °C and then bonded together with pressures of 16 Torr, 22 Torr, 28 Torr, 34 Torr, and 40 Torr. A UST 200 immersion ultrasonic “C” scanning detection system (General Electric Company, Boston, MA, USA) was used to detect the unbonded area of the bonding joint, and was composed of a scanning device, ultrasonic signal emission, reception unit, signal analysis, and preprocessing capability. The frequency of the probe used was 15 MHz, the focus in the water was 30 mm, the diameter at the focus was approximately 0.37 mm, the wave speed was 5800 m/s, and the scanning step length was 0.1 mm. The criteria for judging the unbonded region were as follows. First, an ultrasound “C” scan was performed at a perfect bonding area, which was observed with a microscope to confirm that there was no obvious hole. Then, the height of the first bottom echo was adjusted to 80% of the full scale as reference sensitivity. The location was identified as an unbonded region when the height of the first bottom echo was less than 5% of the full scale, and the defect echo was clearly evident (the height of echo was higher than 5%). Subsequently, the specimens were cut along the width direction, and the joint cross-sections were ground and polished. Microstructural observations were carried out by scanning electron microscopy (SEM).
2.2. Closure Process
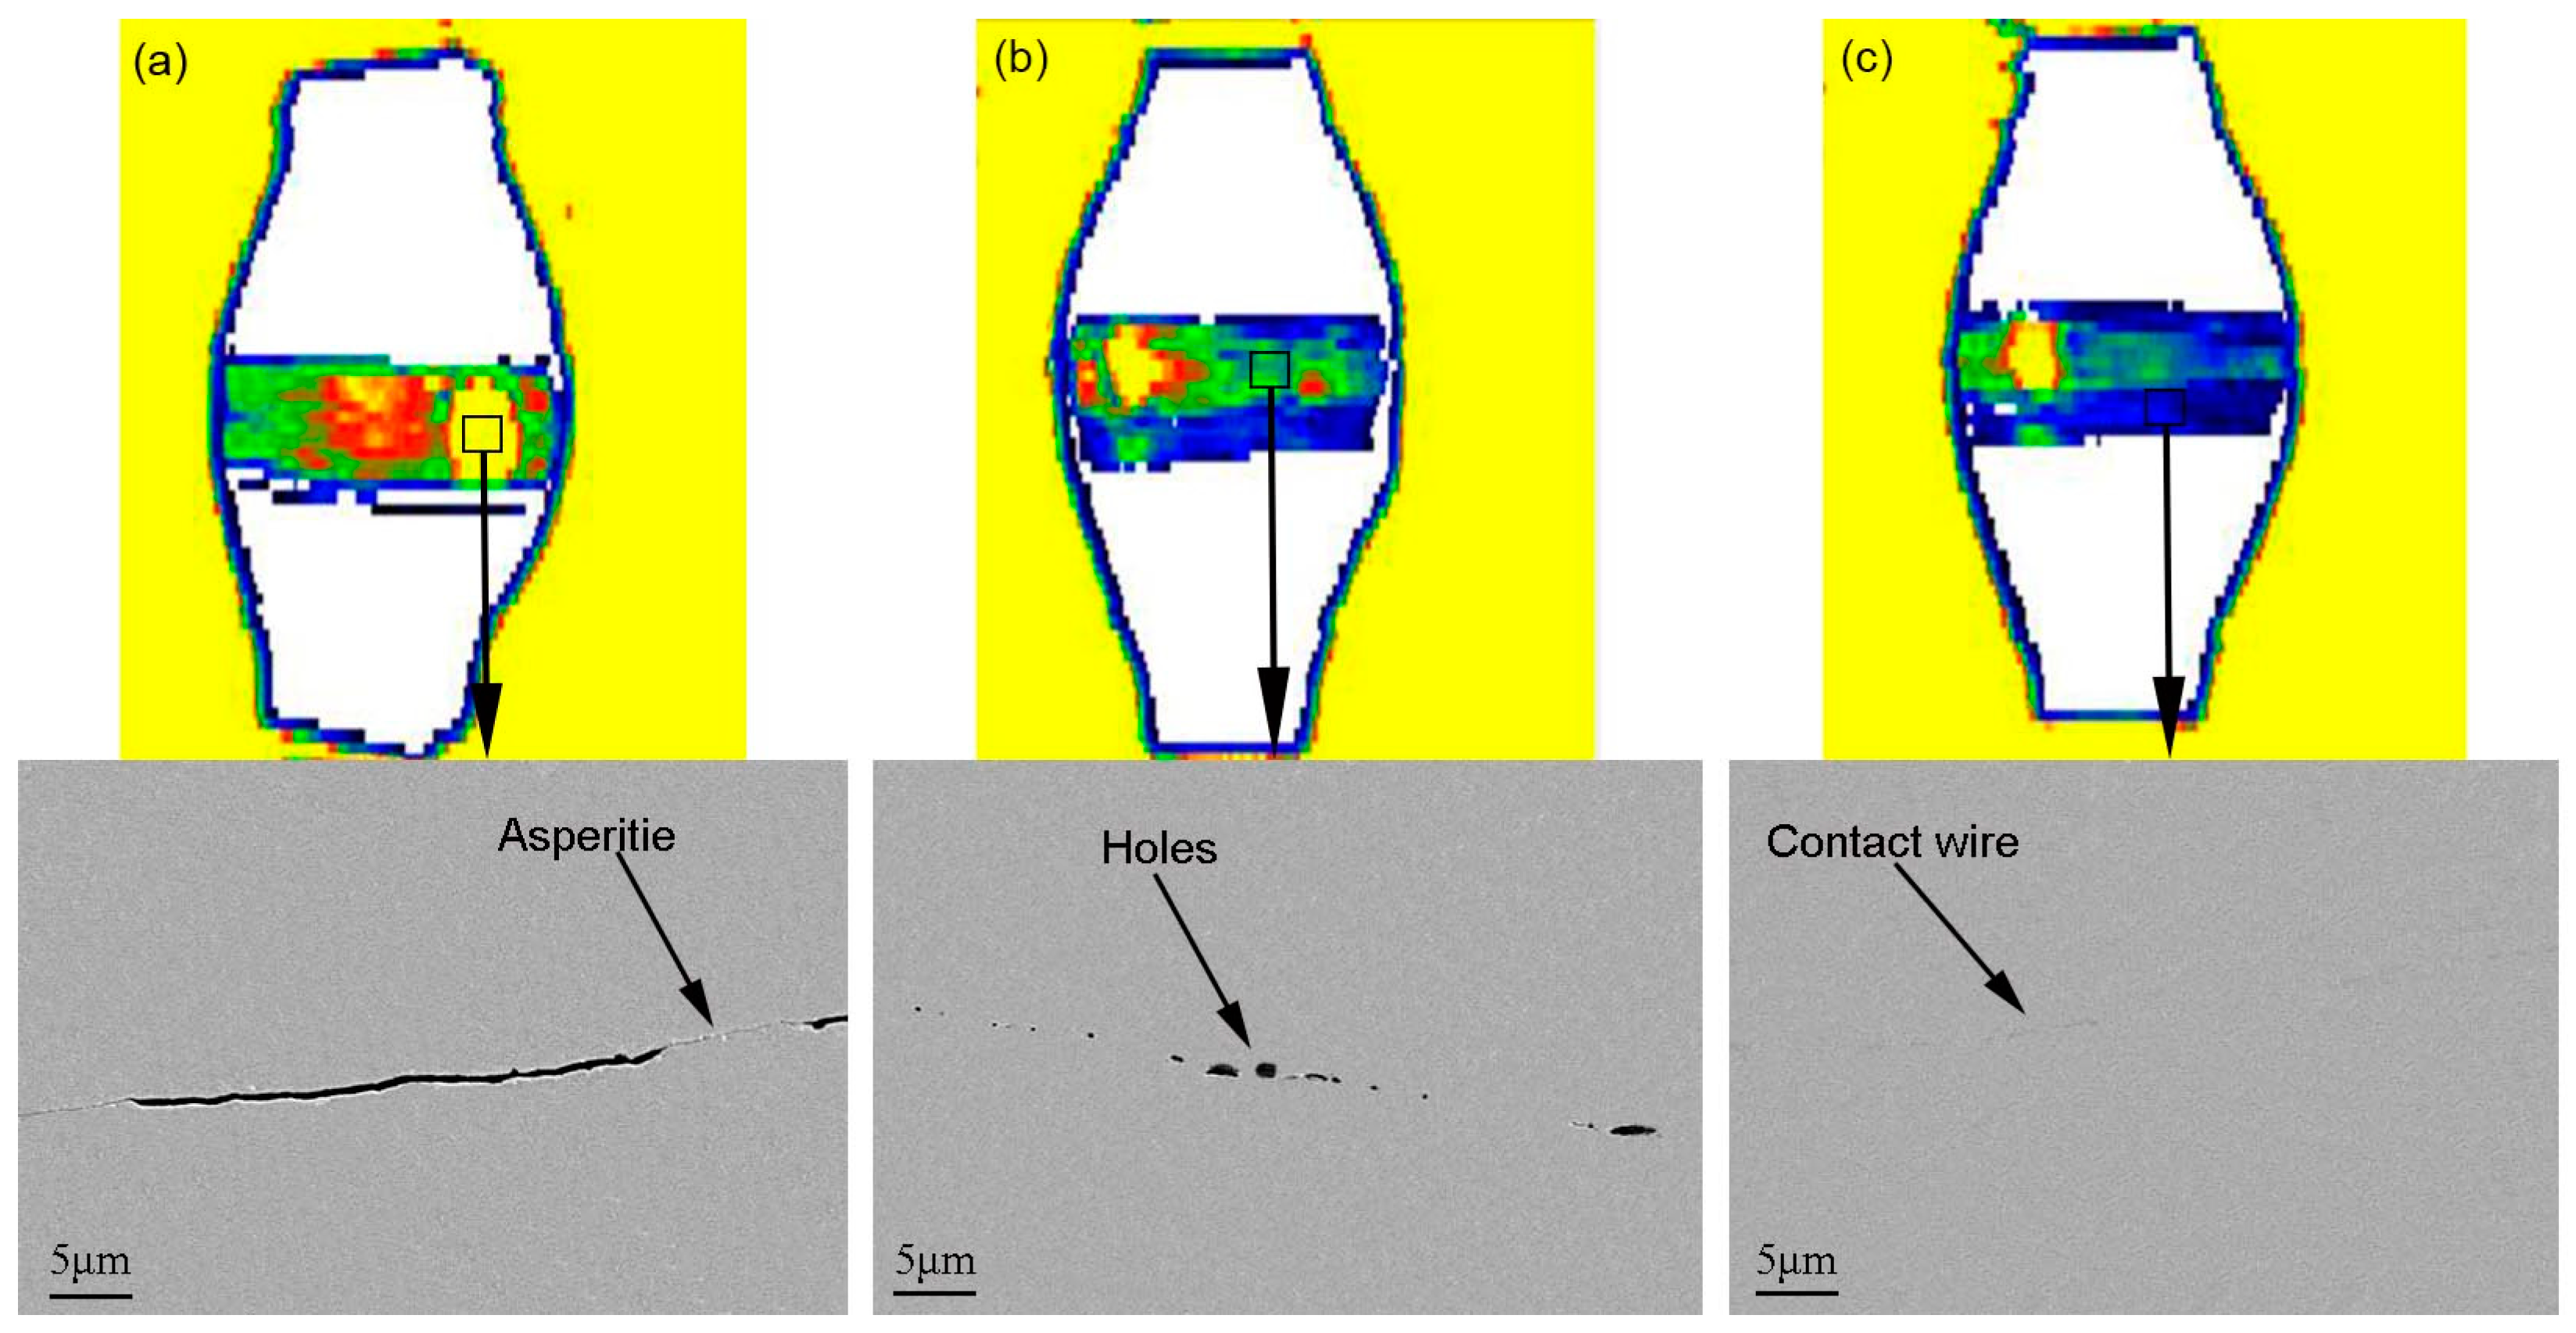
The images of the bonding state and interface morphology at special positions, acquired after the roll-bonding process, are shown in Figure 3. According to the echo amplitude (AMP) visualized by the ultrasonic “C” scanning, different states can be distinguished using different colors. The blue regions represent the bonding states, the yellow regions represent the unbonded states, and the green regions represent the semi-bonded states. Interfacial voids are ultimately formed by contact between rough peaks. During the deformation process, the rough peaks are gradually flattened, and the real contact area between interfaces is gradually increased. It can be seen from Figure 3a that there are still wide strip cracks in the interfacial morphology corresponding to the yellow region. As the pressure increases, the plastic deformation of the metal in the interface region causes the voids to shrink into circular or elliptical shapes, and finally, the voids disappear completely.
The bonding rate is an important index for evaluating the interfacial bonding quality of composites [1]. The bonding rate values at various pressures are shown in Figure 4. The interface bonding rate increases with increasing external pressure. In addition, the value of the bonding rate represents the total contract area between interfaces. It can be seen that the closure rate of voids shows a trend of being fast initially and then slowing down.
Next, to study the deformation process of rough peaks and the mechanism of void closure, the macro-scale finite element model and the micro-scale molecular dynamics model, respectively, were established.
3. Multiscale Numerical Models
3.1. Finite Element Simulation at the Macro-scale
2D models of the indenters and specimens were developed, as shown in Figure 5. The specimens are assumed to have ideal elasticity–plasticity and the mechanical properties of the material at 700 °C are shown in Table 2. Meshing of the specimen with dimensions of 2 × 0.05 (L × H) mm was generated using a four-node planar type element with 2000 grids in the length direction. A sinusoidal morphology was constructed on the surface of the specimen as a surface roughness peak, with a period of 80 μm and an amplitude of 4 μm. To improve computational efficiency while ensuring computational accuracy, the surface mesh of the specimen is refined while the internal mesh is relatively sparse. The indenter is considered rigid with a diameter of 35 mm and a unit size of 0.002 mm. The friction coefficient between indenters and specimen was set as 0.2.
During the solution process, the upper indenter is fixed, and then the uniform load is applied on the lower indenter node in the Y-direction. As shown in Table 3, to study the deformation process of the rough peak, three models with different surface roughnesses were constructed (group 1, 2, 3). Subsequently, groups 4, 5, 6, 7, 8 with different strains were constructed to analyze the closure law of voids from the point of view of interface deformation.
3.2. Molecular Dynamics Simulation at the Micro-scale
Type 304 stainless steel is an austenitic steel with a typical face-centered cubic structure (FCC). Its main components are Fe, Cr, and Ni, and it may also contain trace elements such as Mn, Nb, Mo, Ti, and N. The Cr and Ni atoms exist in FCC-Fe in the way of substitutional atoms. Ignoring the trace alloying elements, Fe17Cr5Ni2 is close to an AISI-304 austenitic stainless steel. The initial model of 304 stainless steel was established by randomly replacing Fe atoms with Cr atoms and Ni atoms in a certain proportion. The proportion of each part was Fe:Cr:Ni = 17:5:2. As the temperature rises from normal temperature to approximately 700 °C, the Q235 carbon steel with a body-centered cubic structure (BCC) will be austenitized and transformed into the FCC structure. The mass fraction of Fe element in Q235 carbon steel is over 98%. In this paper, FCC-Fe17Cr5Ni2 and FCC-Fe were used to simulate 304 stainless steel and Q235 carbon steel, respectively.
The potential function describing the interaction potential between atoms is an important problem in a molecular dynamics simulation because it determines the accuracy of the simulation. The embedded atomic potential is widely used to describe the interaction between atoms of metal materials and alloy materials. The principle is used to represent the total energy of the atomic system into the pair potential and the embedded atomic energy between the atoms. In this simulation, the FeCrNi/Fe EAM (Embedded-Atom Method) potential developed by Plimpton [25] is applied.
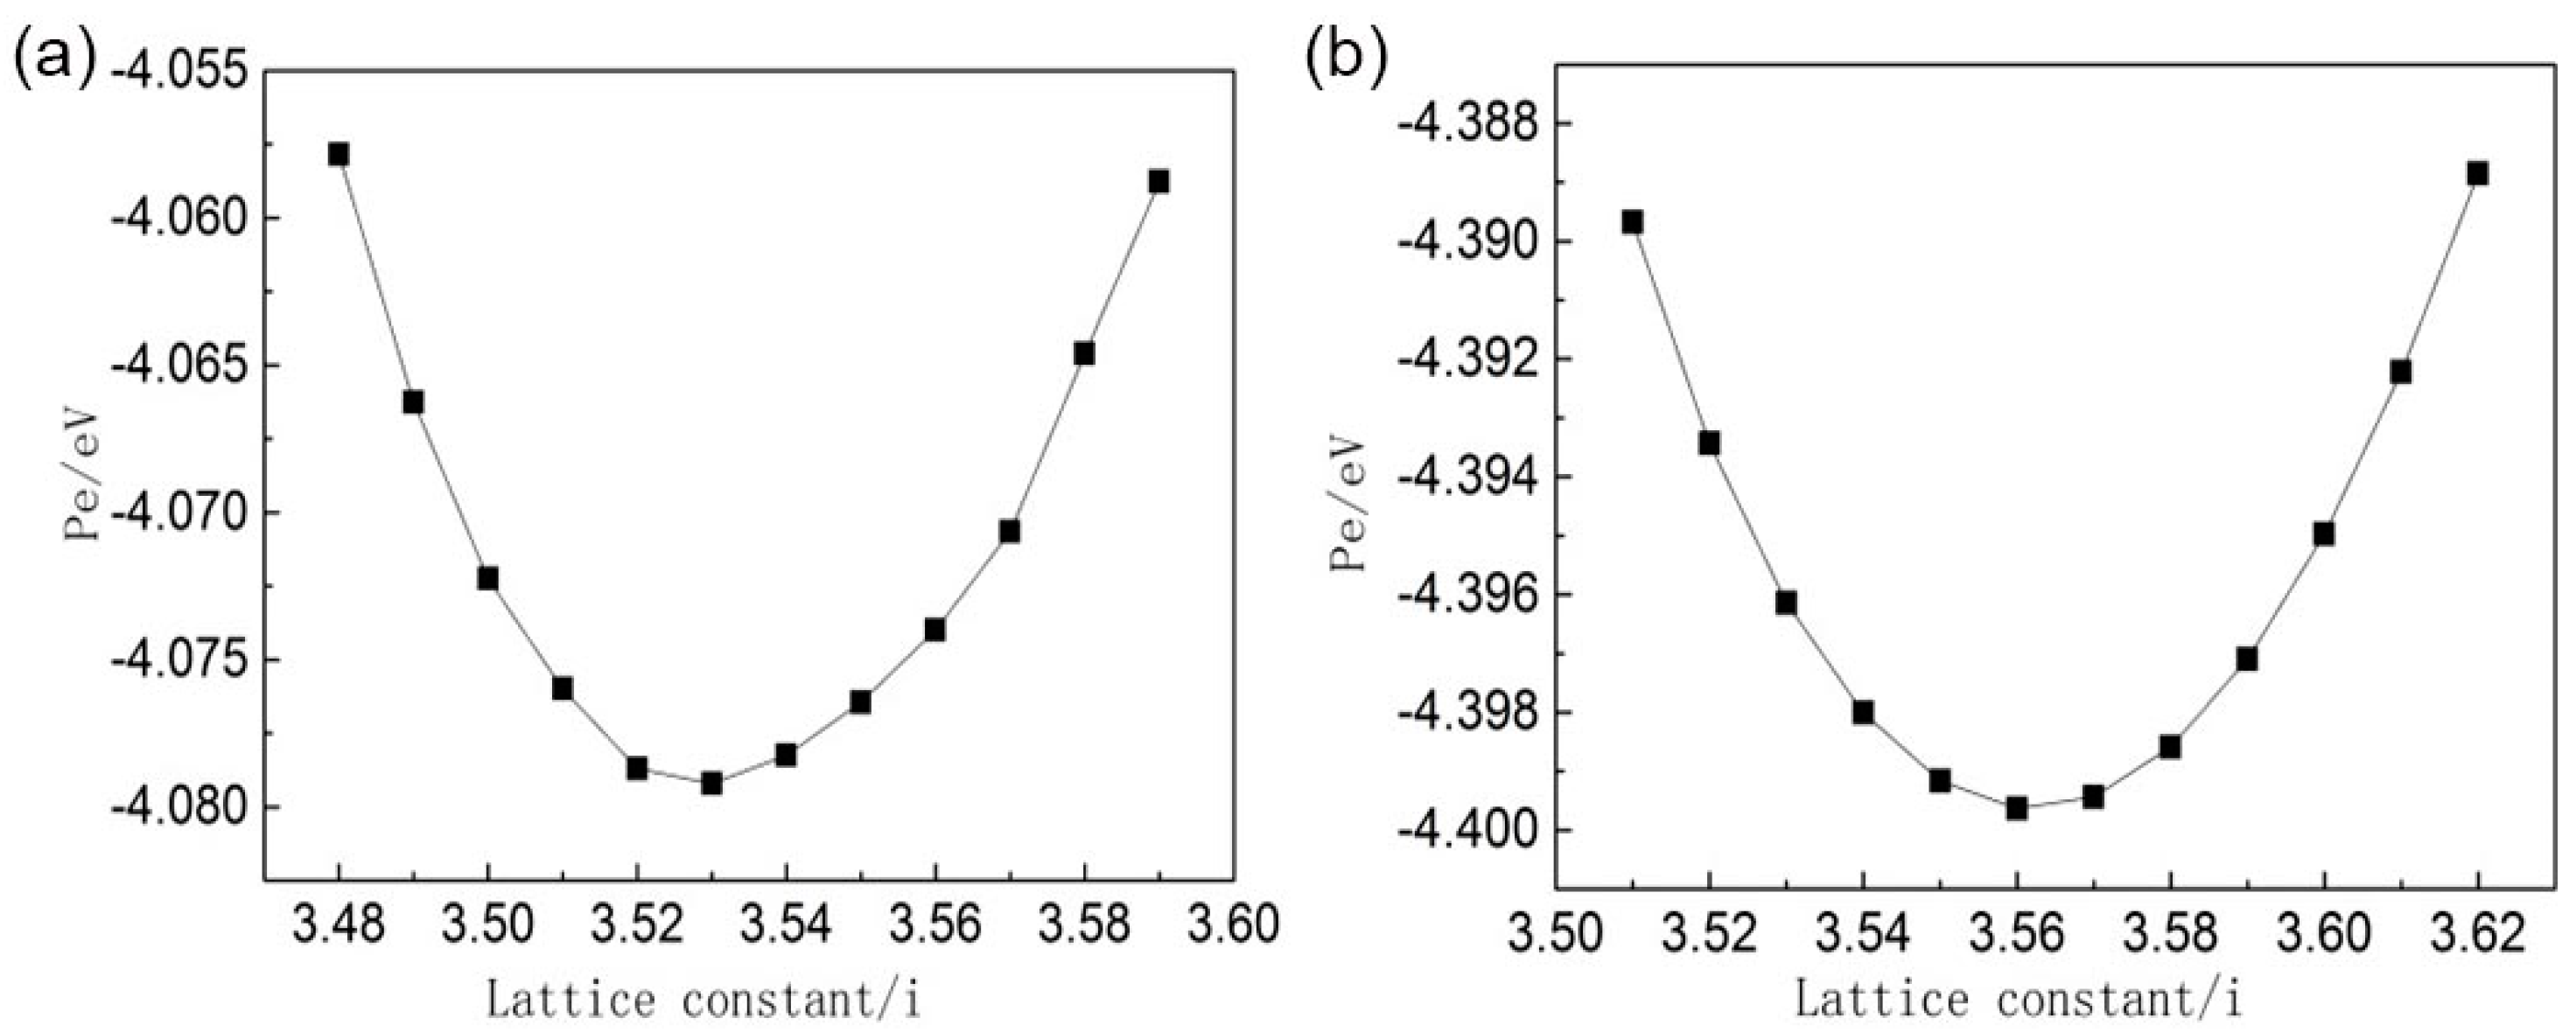
To verify the validity of the potential function, the distribution of potential energy for Fe17Cr5Ni2 and Fe with a variety of lattice constants at 25 °C are displayed in Figure 6. A minimum potential energy exists, which is the stable phase of the material due to low lattice energy [26,27]. The corresponding lattice constants are 3.53 nm and 3.56 nm, respectively. The MD results are in good agreement with the experimental results [28]. Therefore, it can be selected as a reasonable research object.
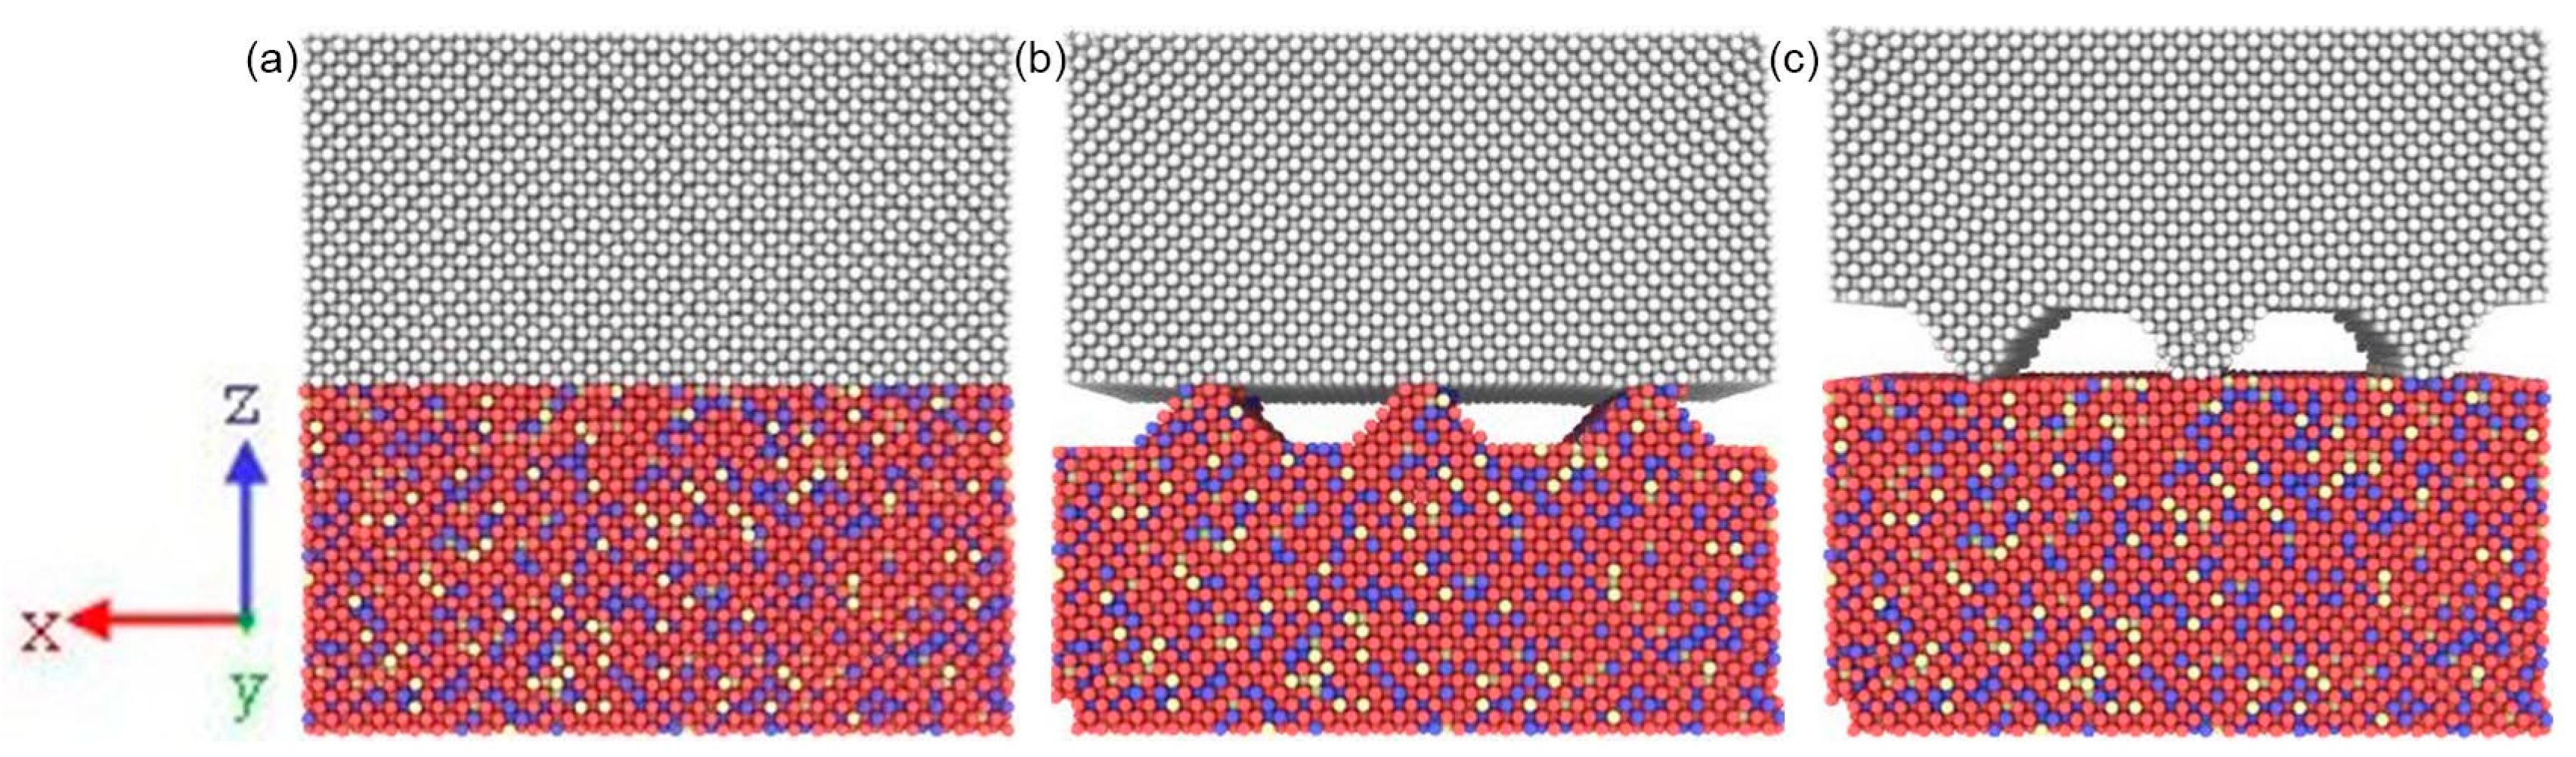
Based on the fractal theory, there are countless rough peaks with different scales on the macro-scale rough peaks. In this section, three models with different asperities were constructed to simulate rough peaks on the microscopic scale. Figure 7 shows the initial atomic configurations in the xz plane of the models. The system consists of a monocrystal Fe slab (top) and a monocrystal FeCrNi slab (bottom). The contact surfaces of Fe and FeCrNi were both (100) planes. For model 1, both surfaces are smooth, and the total number of atoms is 54000. For model 2, the Fe surface is smooth, and the FeCrNi surface is rough with three asperities. For model 3, the FeCrNi surface is smooth, and the Fe surface is rough with three asperities. The size of all three models is 9.26 nm × 5.35 nm × 9.26 nm and all asperities sizes are 1.8 nm × 5.35 nm × 0.9 nm, while the total number of atoms in model 2 and model 3 is 51750.
The simulation was run in an NPT ensemble, and periodic boundary conditions implemented in three directions. The system was heated to approximately 700 °C and the initial velocities of atoms determined by the Maxwell distribution. Newton’s equations of motion for the atoms were numerically integrated using the Leap-Frog algorithm with a fixed time step of 0.001 ps. Before loading, the model was first relaxed for 30,000 steps to obtain an equilibrium state at approximately 700 °C. A tensile strain was loaded along the z direction at a rate of 0.001 ps−1 until the strain reached 0.2. Three layers of atoms at the end of FeCrNi side were fixed. During the compression process, the NPT ensemble was employed with a Nose/Hoover barostat to maintain the pressure at zero in the x and y directions. Periodic boundary conditions were applied in the x, y, and z directions. In this study, the MD simulation was implemented using the Large-scale Atomic/Molecular Massively Parallel Simulator (LAMMPS) [29], which is a scalable molecular dynamics code including long-range Coulomb interactions. And the Open Visualization Tool (OVITO) was adopted for visualizing the evolution of the atomic structure [30].
4. Closure Law and Mechanism of Interface Voids
4.1. Contact Deformation Law and Mechanism at the Macro-scale
Numerical results of groups 1, 2, and 3 are shown in Figure 8a–c, respectively. It can be seen from the partially enlarged drawing that when the surface of the stainless steel is rough, the surface matrix of the stainless steel is embedded in the softer carbon steel matrix, and the interface morphology still retains the initial morphology of the stainless steel to some extent. When the surface of the carbon steel is rough, the rough peak of the carbon steel surface is gradually flattened and disappears. At the macro-scale, the yield strength of 304 stainless steel is smaller than that of Q235 carbon steel, but the presence of internal alloy atoms makes it easier for dislocations to be pinned. Therefore, the yield strength ratio of 304 stainless steel is much larger than that of Q235 carbon steel. The interface morphology after pressure bonding is determined by the morphology of the stainless steel.
Due to the different deformability of carbon steel and stainless steel, the elongation of the materials in the roll-bonding process is different. The dotted frame in Figure 8a shows the rough peak of stainless steel embedded in the carbon steel matrix, playing a role in limiting the horizontal extension of the carbon steel. The average stress at the interface of group 1 is the largest, while the elongation difference is the smallest compared with the other two groups. For group 3, it is easier for the carbon steel to extend to both sides during deformation, and the elongation difference between the two sides of the interface is the clearest.
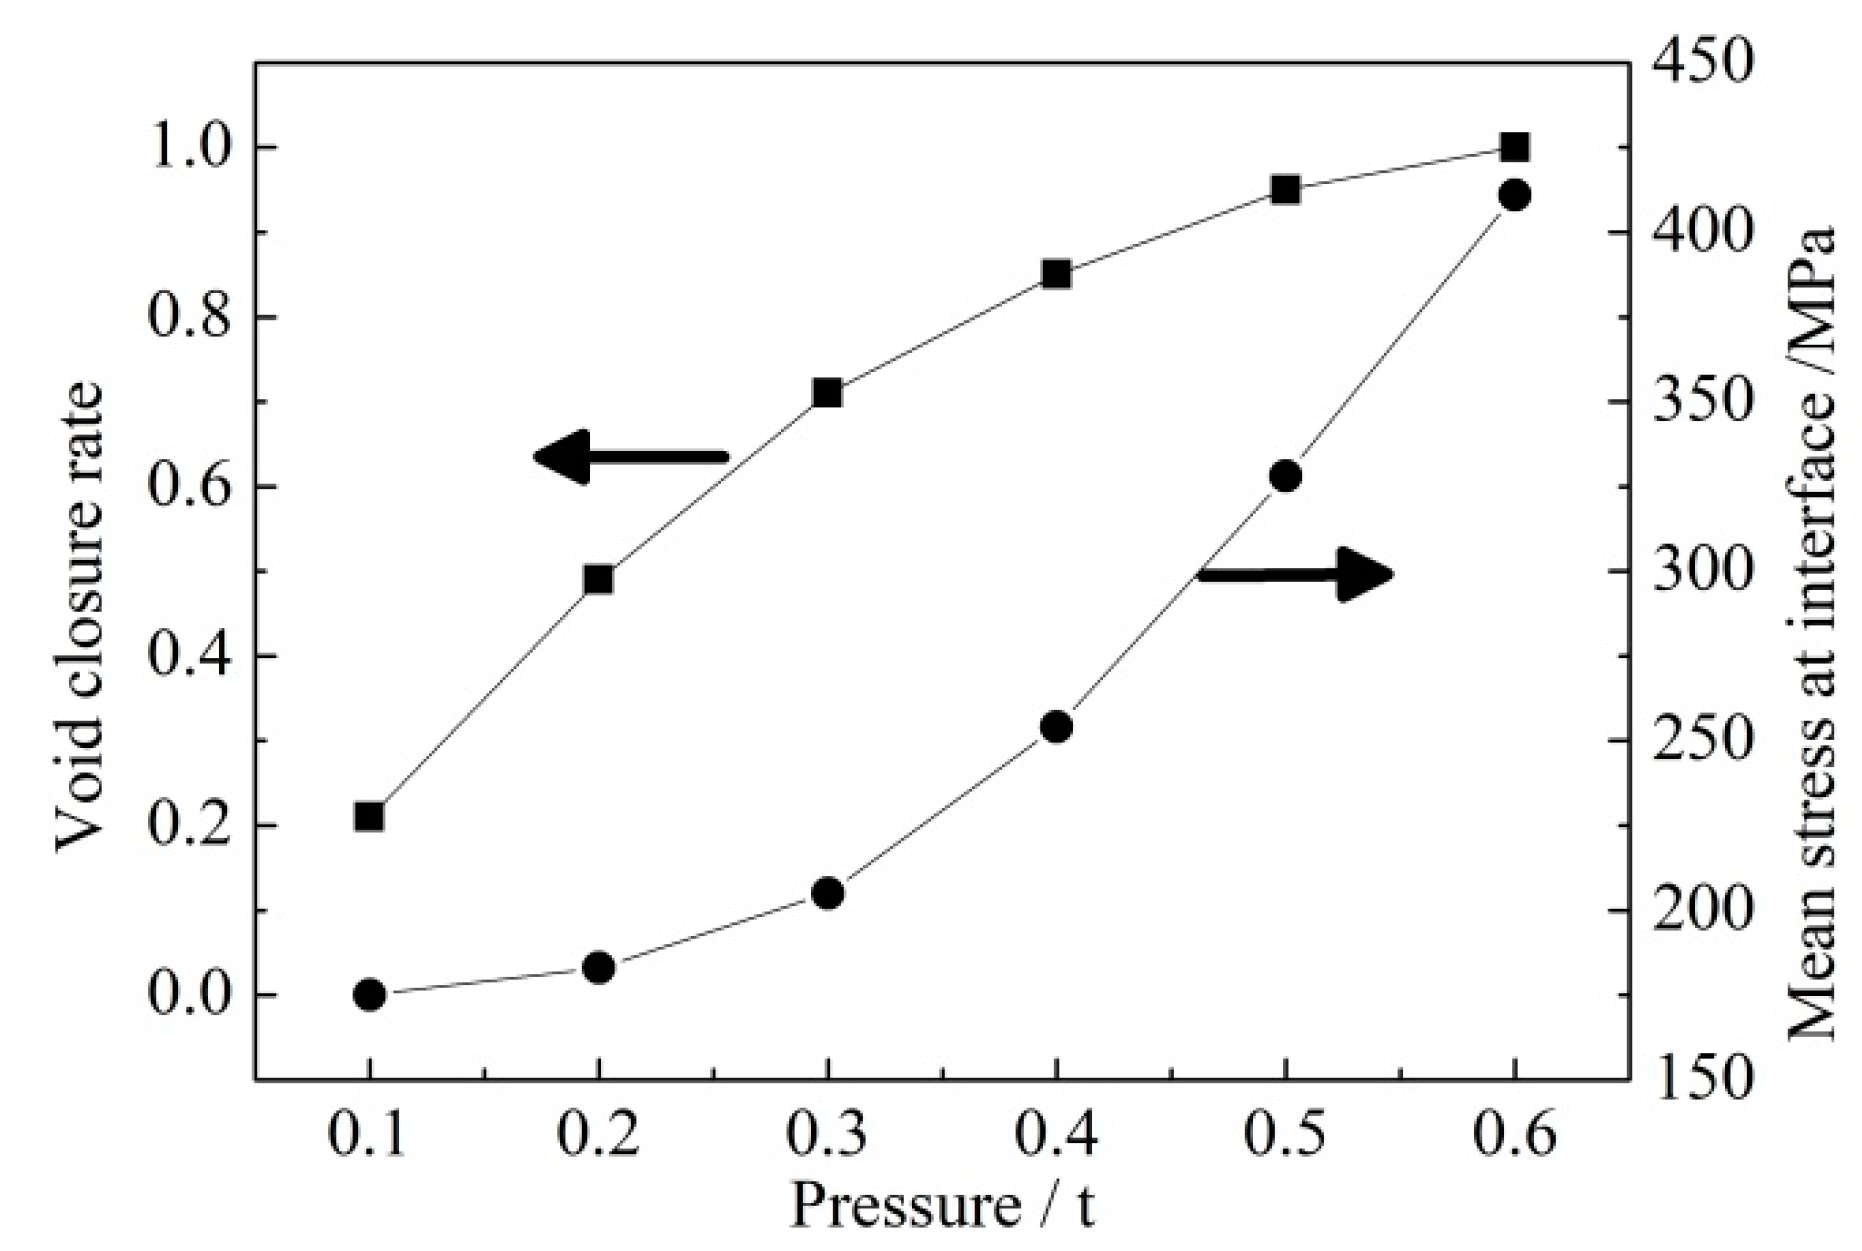
An Image-Pro Plus (IPP) analysis system (V6.0, Media Cybernetics, Rockville, MD, USA, 2003) was used to calculate the void area of groups 1, 4, 5, 6, 7, and 8. The void closure rate is defined as the ratio of void area to the total area of the interface. The closure rate of interface voids and the mean stress at the interface are shown in Figure 9. It can be seen that with increasing strain, the closure rate of voids decreases while the growth rate of the interface stress accelerates gradually, which means that the deformation of the rough peaks becomes more difficult with the closure of voids. Under a certain pressure, the real contact area is small, and the contact pressure per unit area of the interface is high at the initial stage of deformation, so the void closure speed is faster. With continued reduction in the closure rate, the real contact area increases, and deformation becomes difficult. Therefore, the interface stress is the main factor affecting the closure rate of voids at the macro-scale.
4.2. Atomic Bonding Process at the Micro-scale
4.2.1. Closure Law of Interfacial Voids
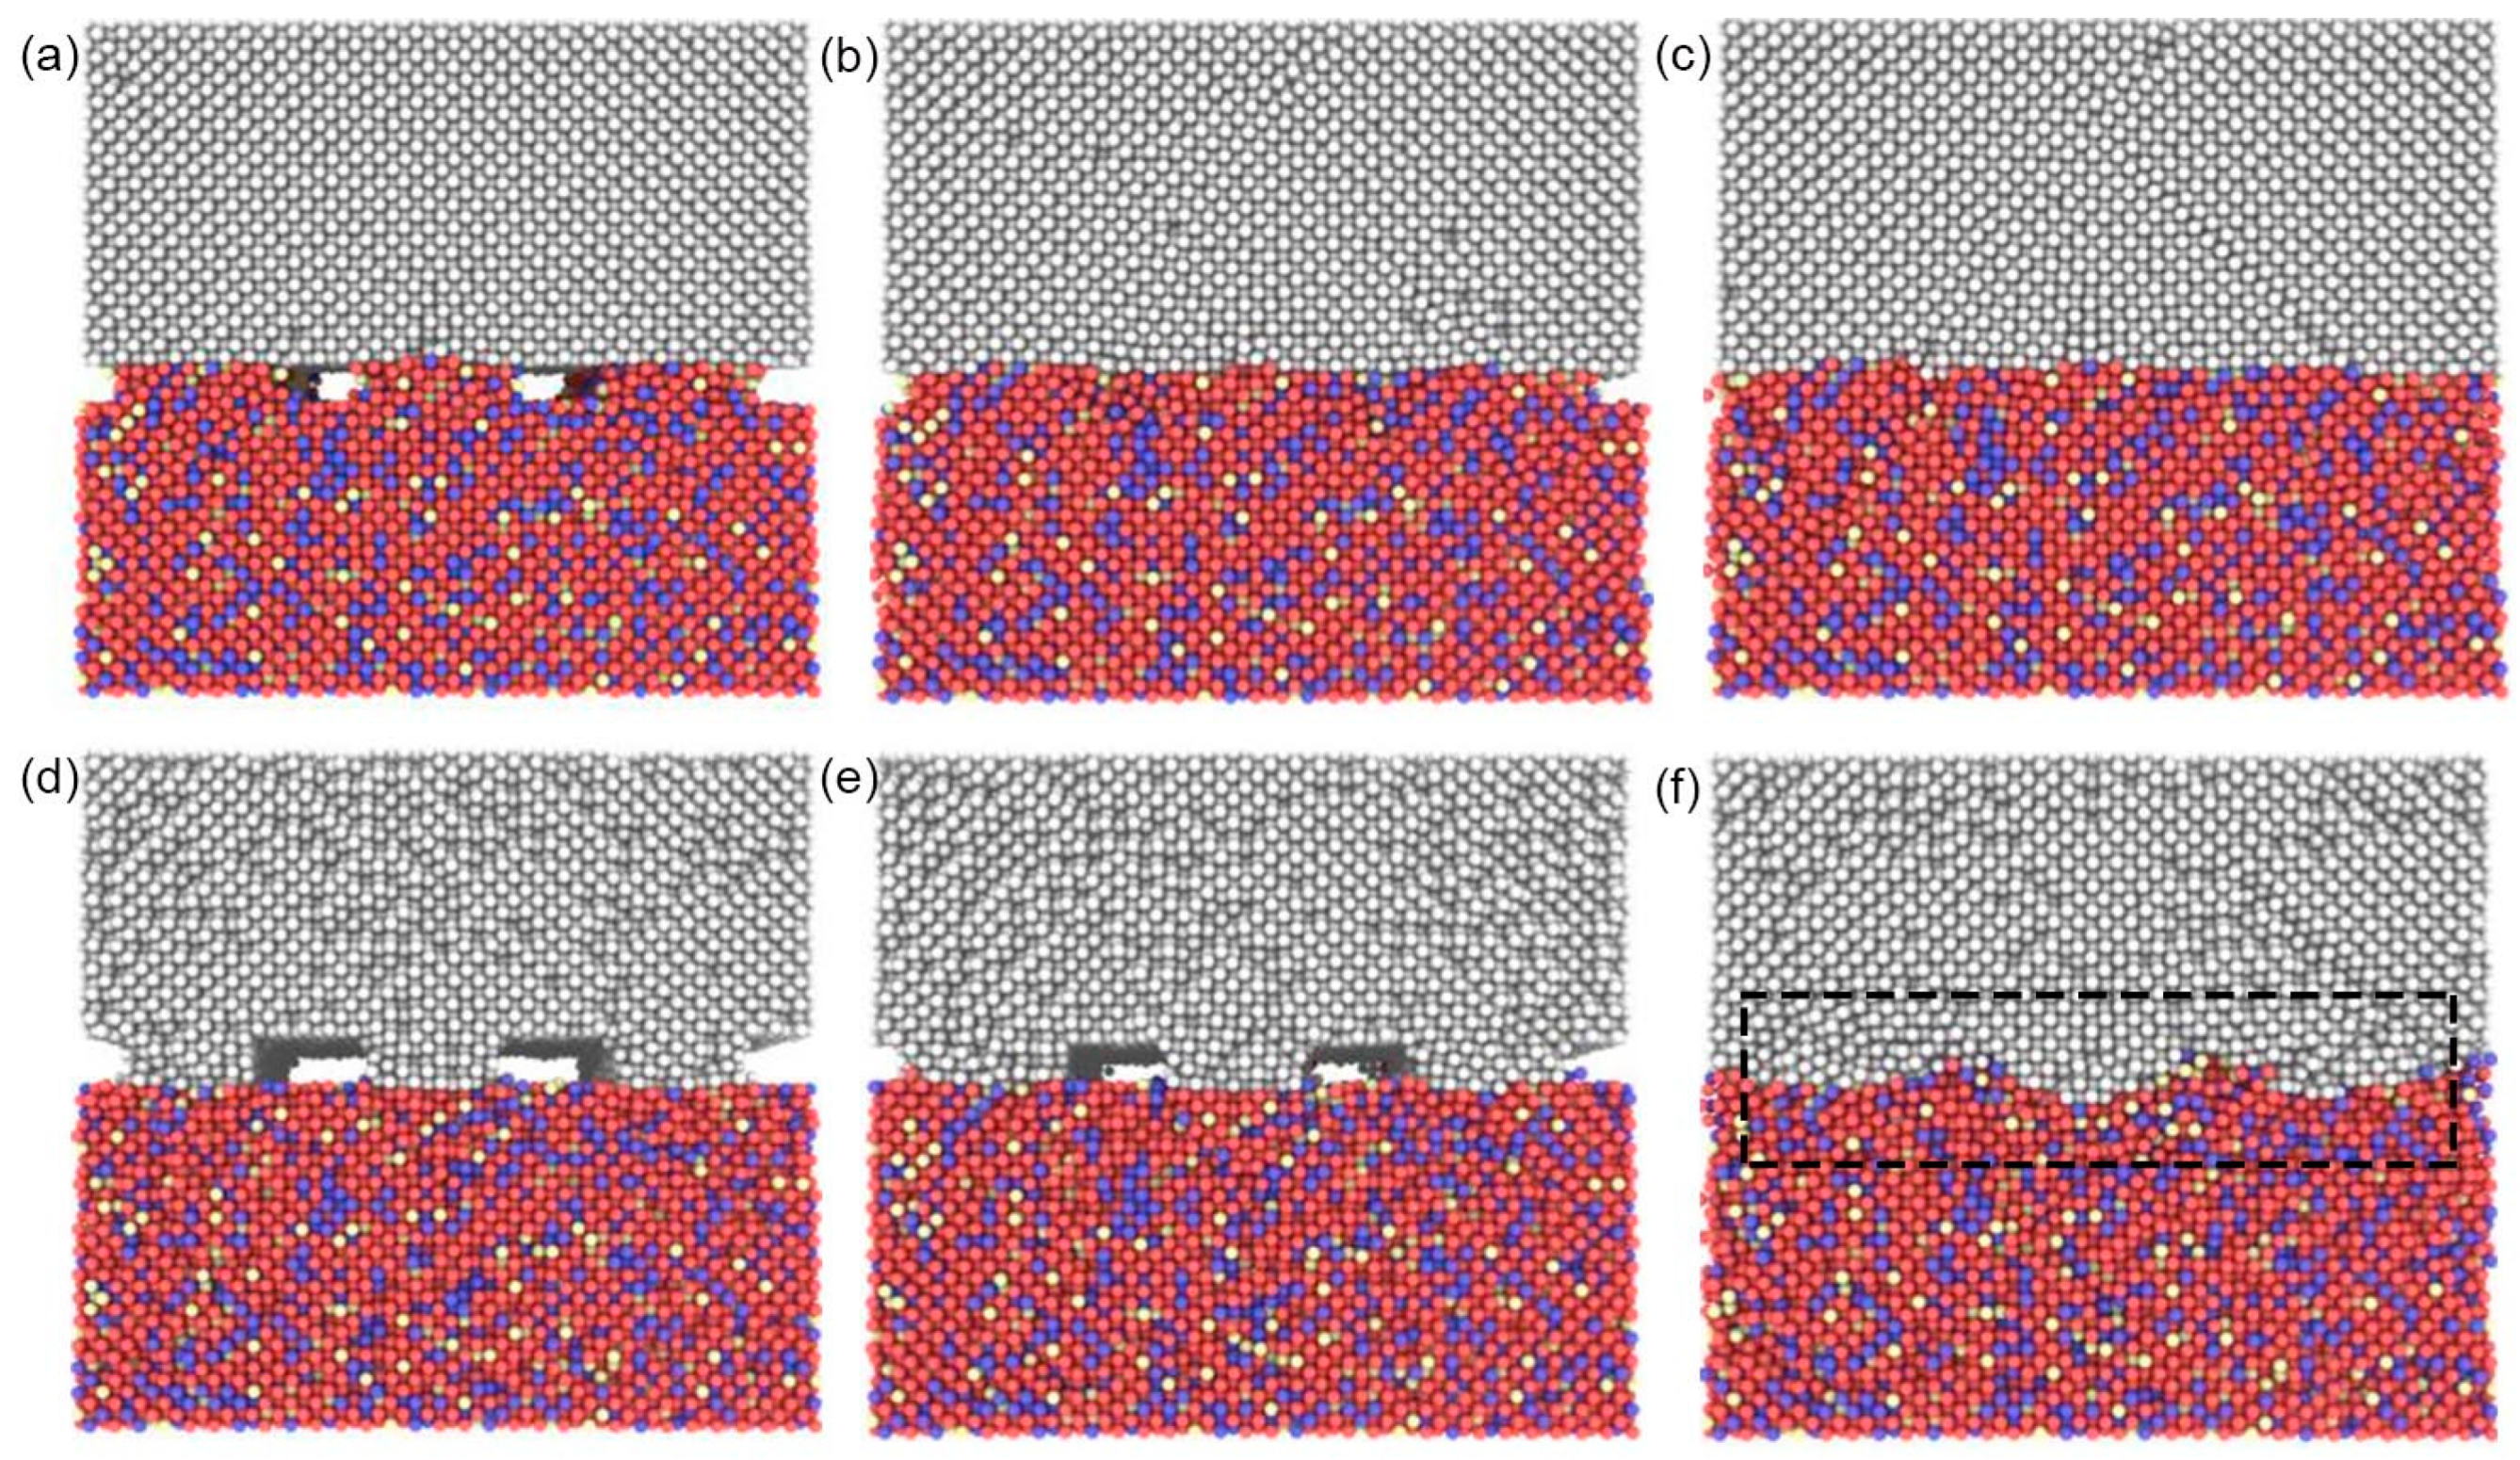
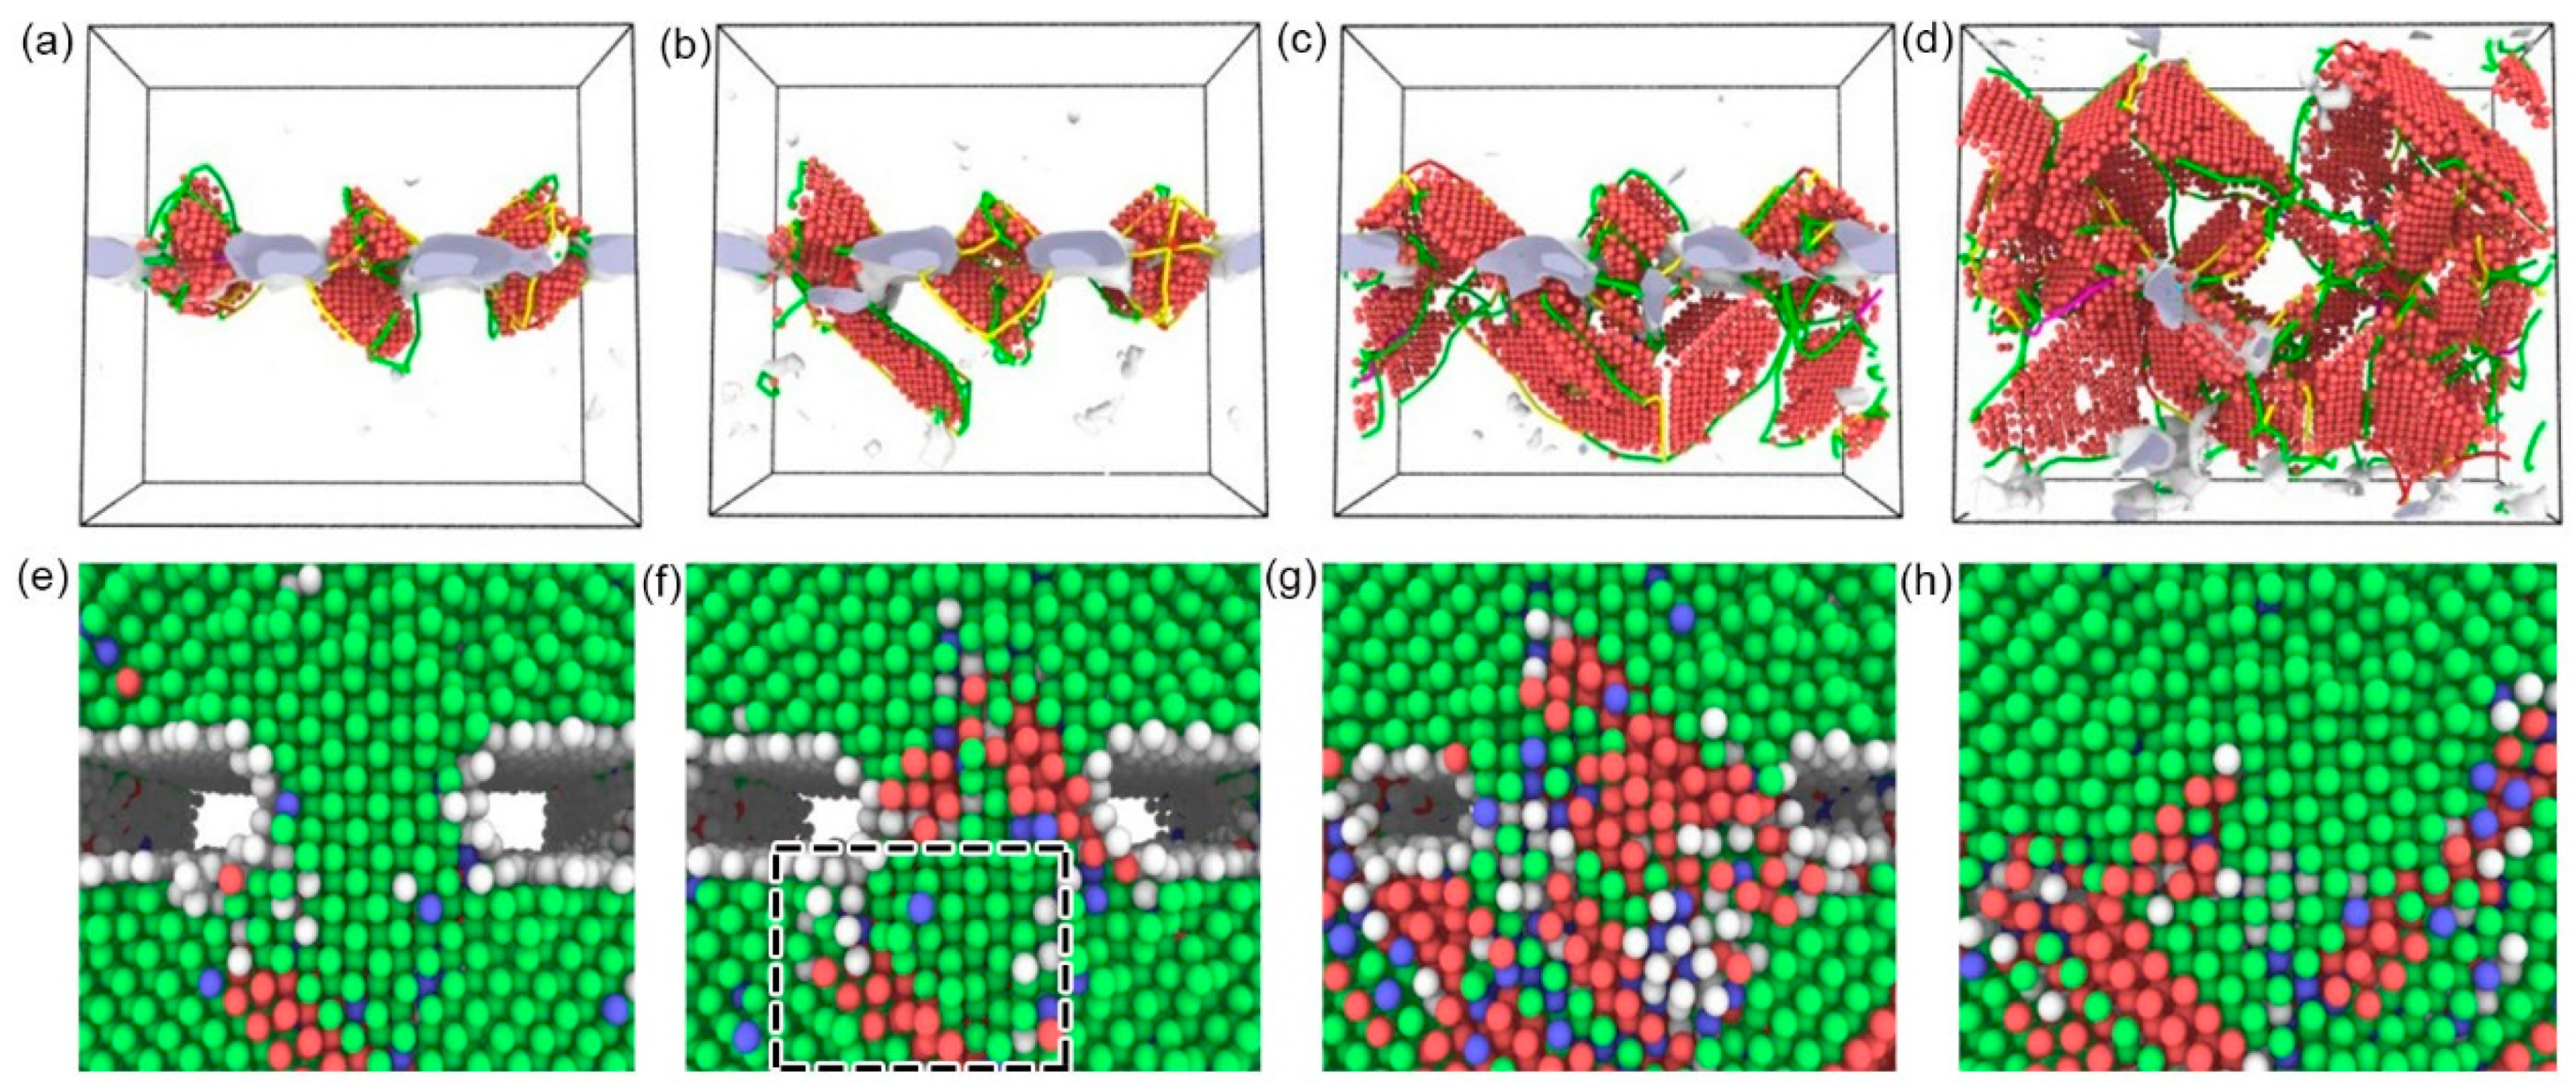
Figure 10 shows the deformation process of the rough peaks for model 2 and model 3 under different strains. When the surface of the Fe slab is flat and the surface of the FeCrNi slab is rough (Figure 10a–c), the surface of the FeCrNi slab with a smaller yield strength is gradually flattened. The atoms of the peaks spread along the surface of the Fe until the contact between the interfaces of the Fe and FeCrNi slab is close. When the surface of the FeCrNi slab is flat and the surface of the Fe slab is rough (Figure 10d–f), the asperities of the Fe slab with a higher yield strength are gradually embedded into the FeCrNi slab with deformation, while the FeCrNi atoms are pressed to fill the voids. As shown in the black dashed box in Figure 10f, the asperities of the original rectangle are compressed into parabolic shapes.
The deformation law of rough peaks is different at micro- and macro-scales in the roll-bonding process. At the macro-scale, yield strength and yield-strength ratio codetermine the deformation process of the materials, while at the micro-scale, the yield strength of the materials is the main factor. The interface morphology at the micro-scale was mainly determined by Q235 carbon steel in this case.
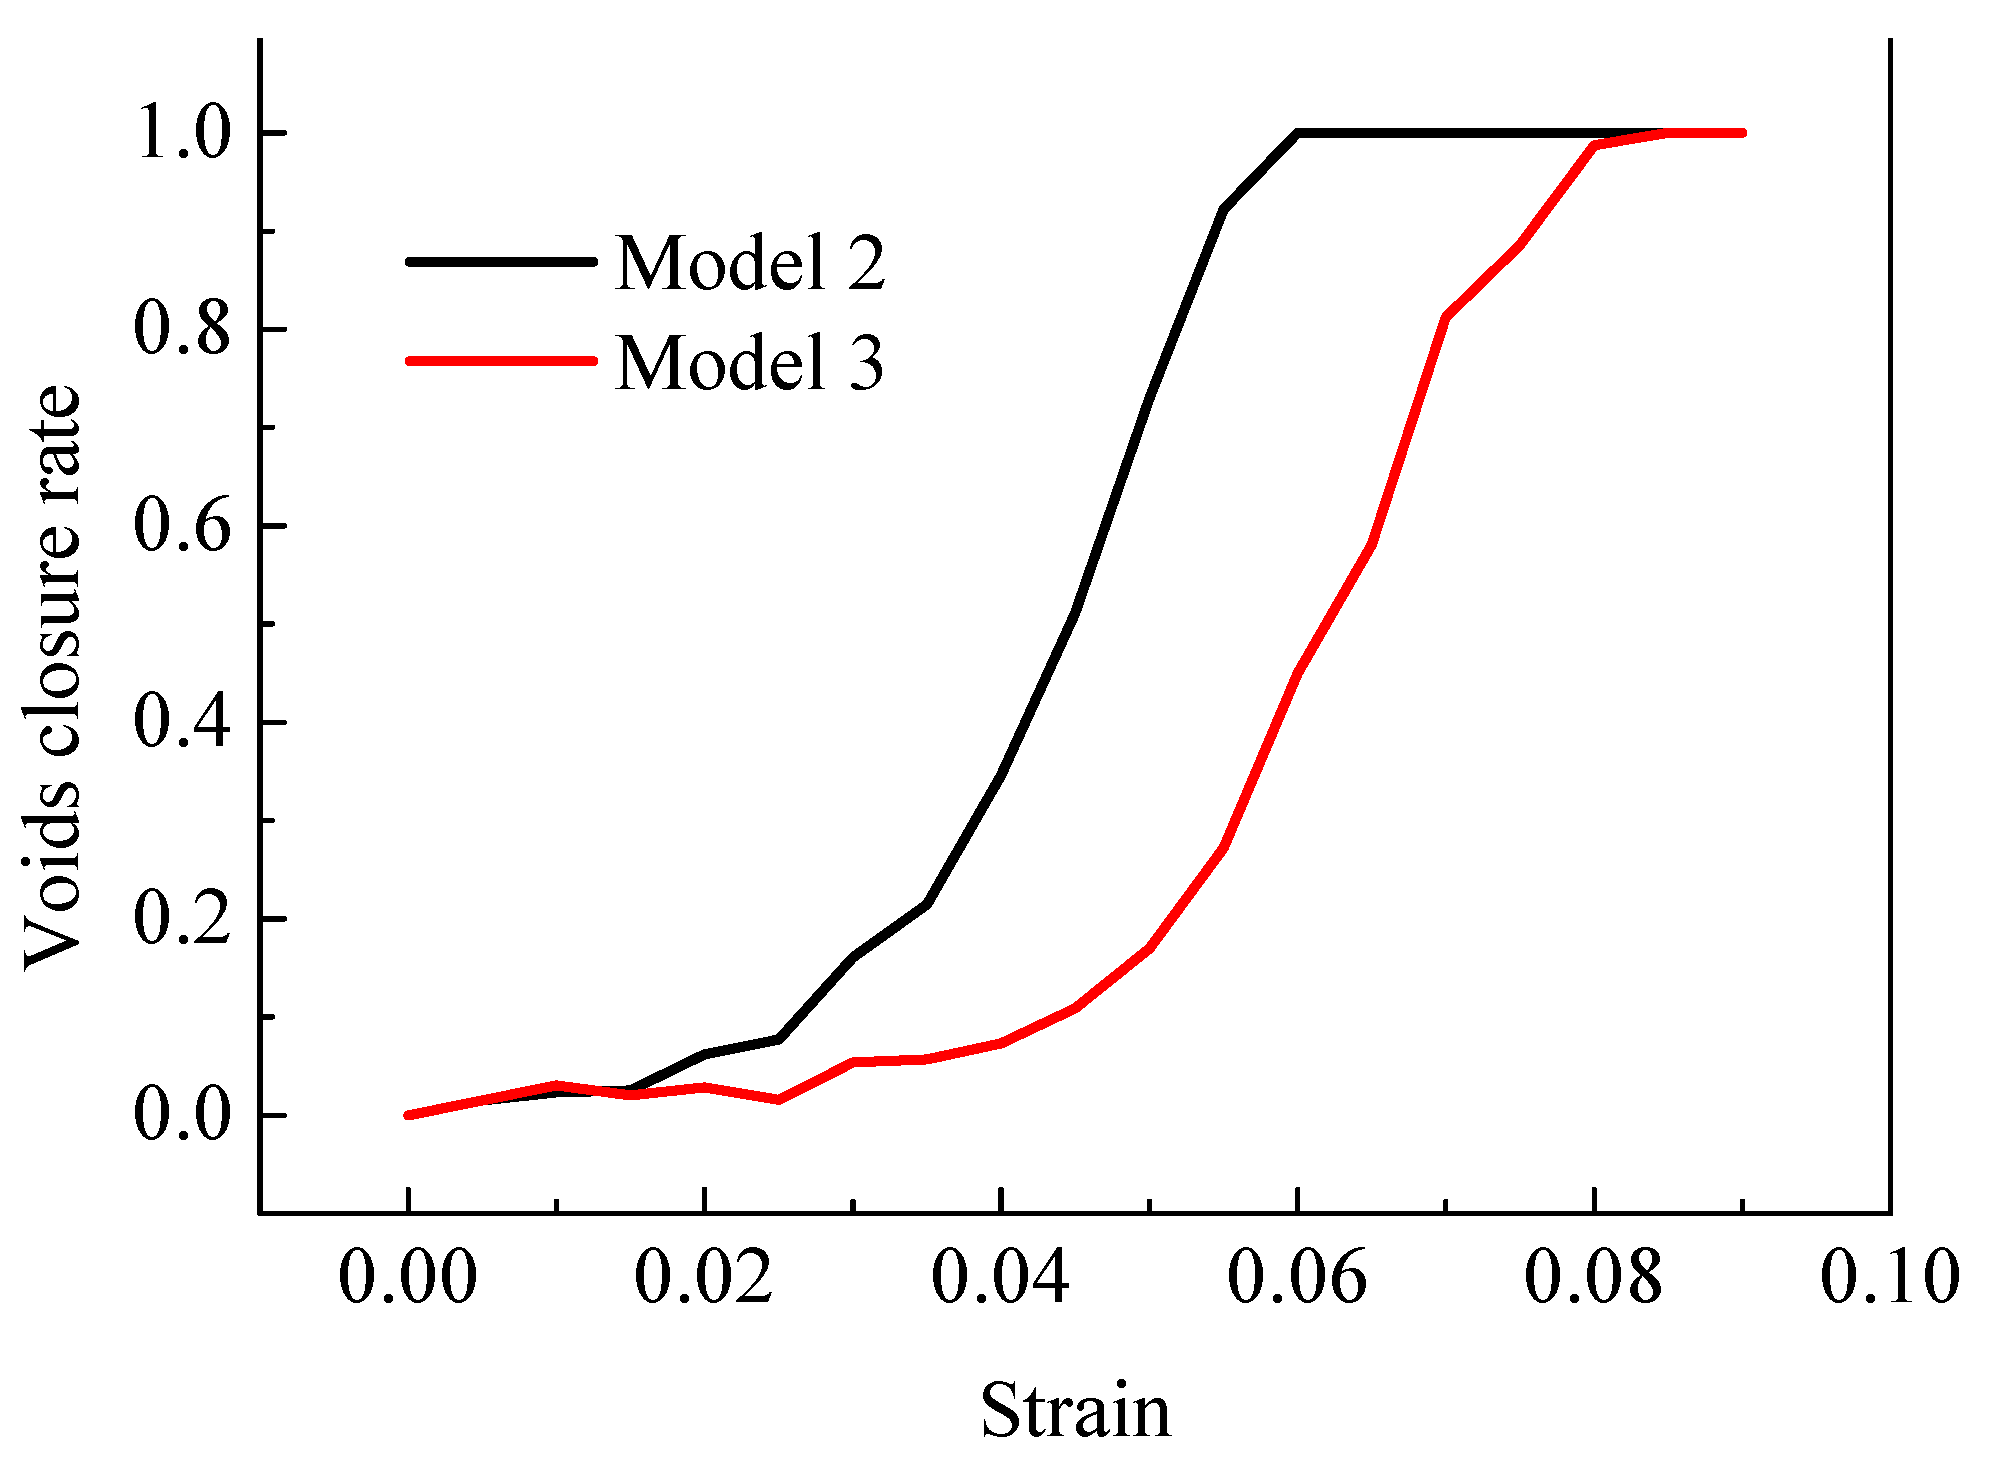
As shown in Figure 10b,e, when the strain reaches 7%, the FeCrNi surface is flattened, and the entire contact line has only a small gap at the edge. However, there are still large voids on the Fe rough peak contact line. To study the effect of the surface roughness on the closure rate during the deformation process, the void closure rate was defined as the ratio of the void volume to the initial volume. The void closure rate curves for models 2 and 3 during deformation are shown in Figure 11, in which the slope of the curve represents the speed of void closure. The void closure rates of models 2 and 3 are very slow and then increase with the nucleation of dislocations. Voids are completely closed when the deformation reaches 6% and 8.5%, respectively.
4.2.2. Closure Mechanism of Interface Voids
(a) Plastic Deformation Stage
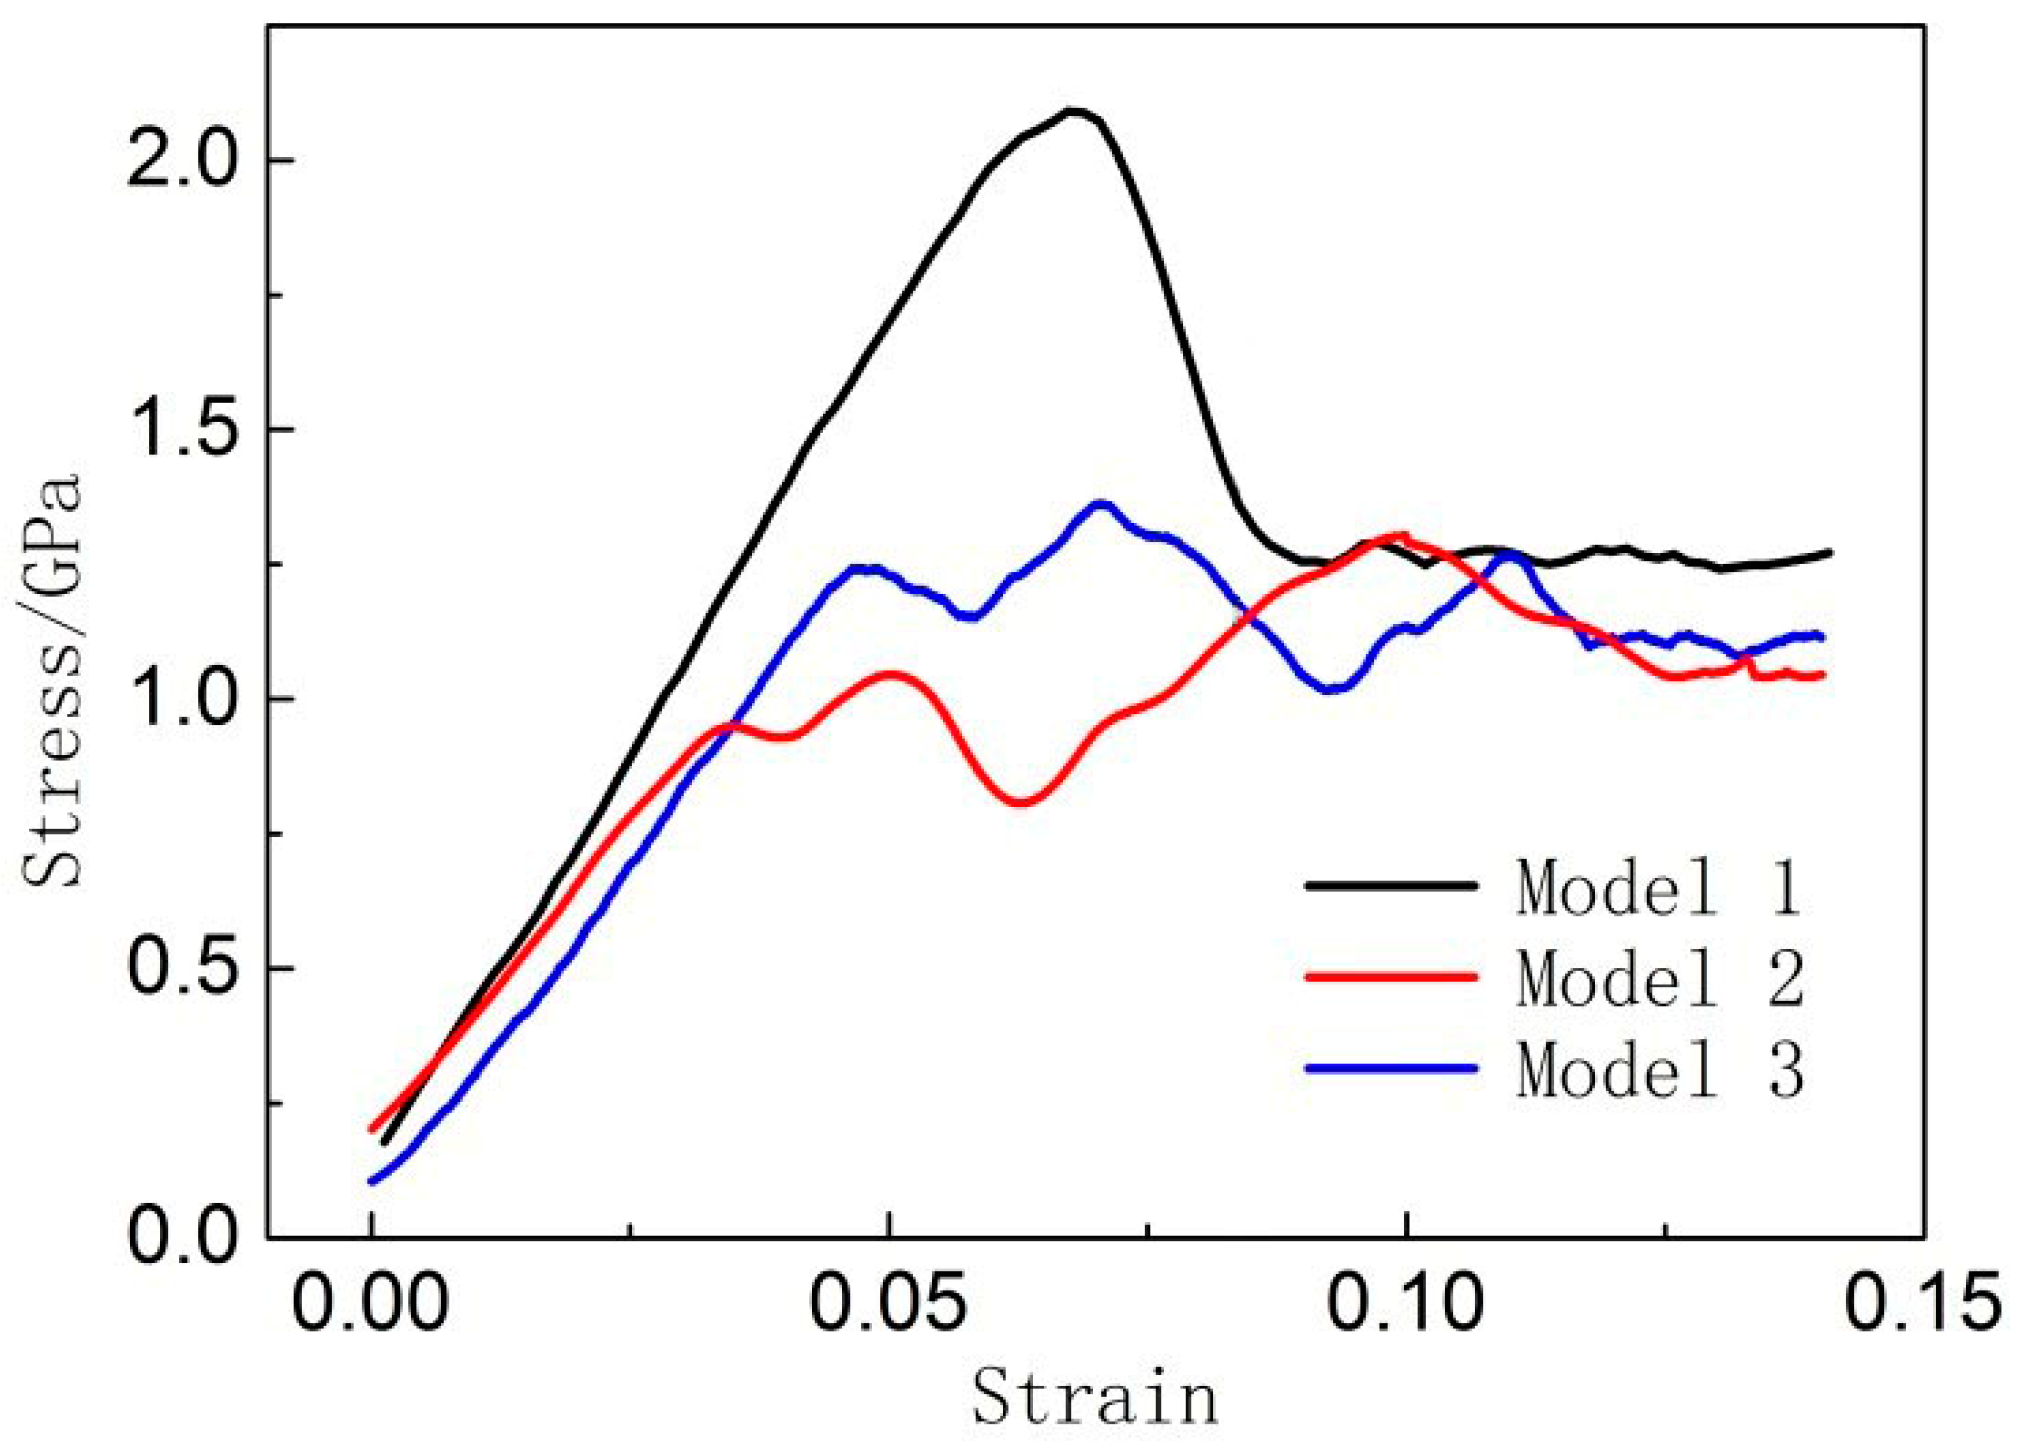
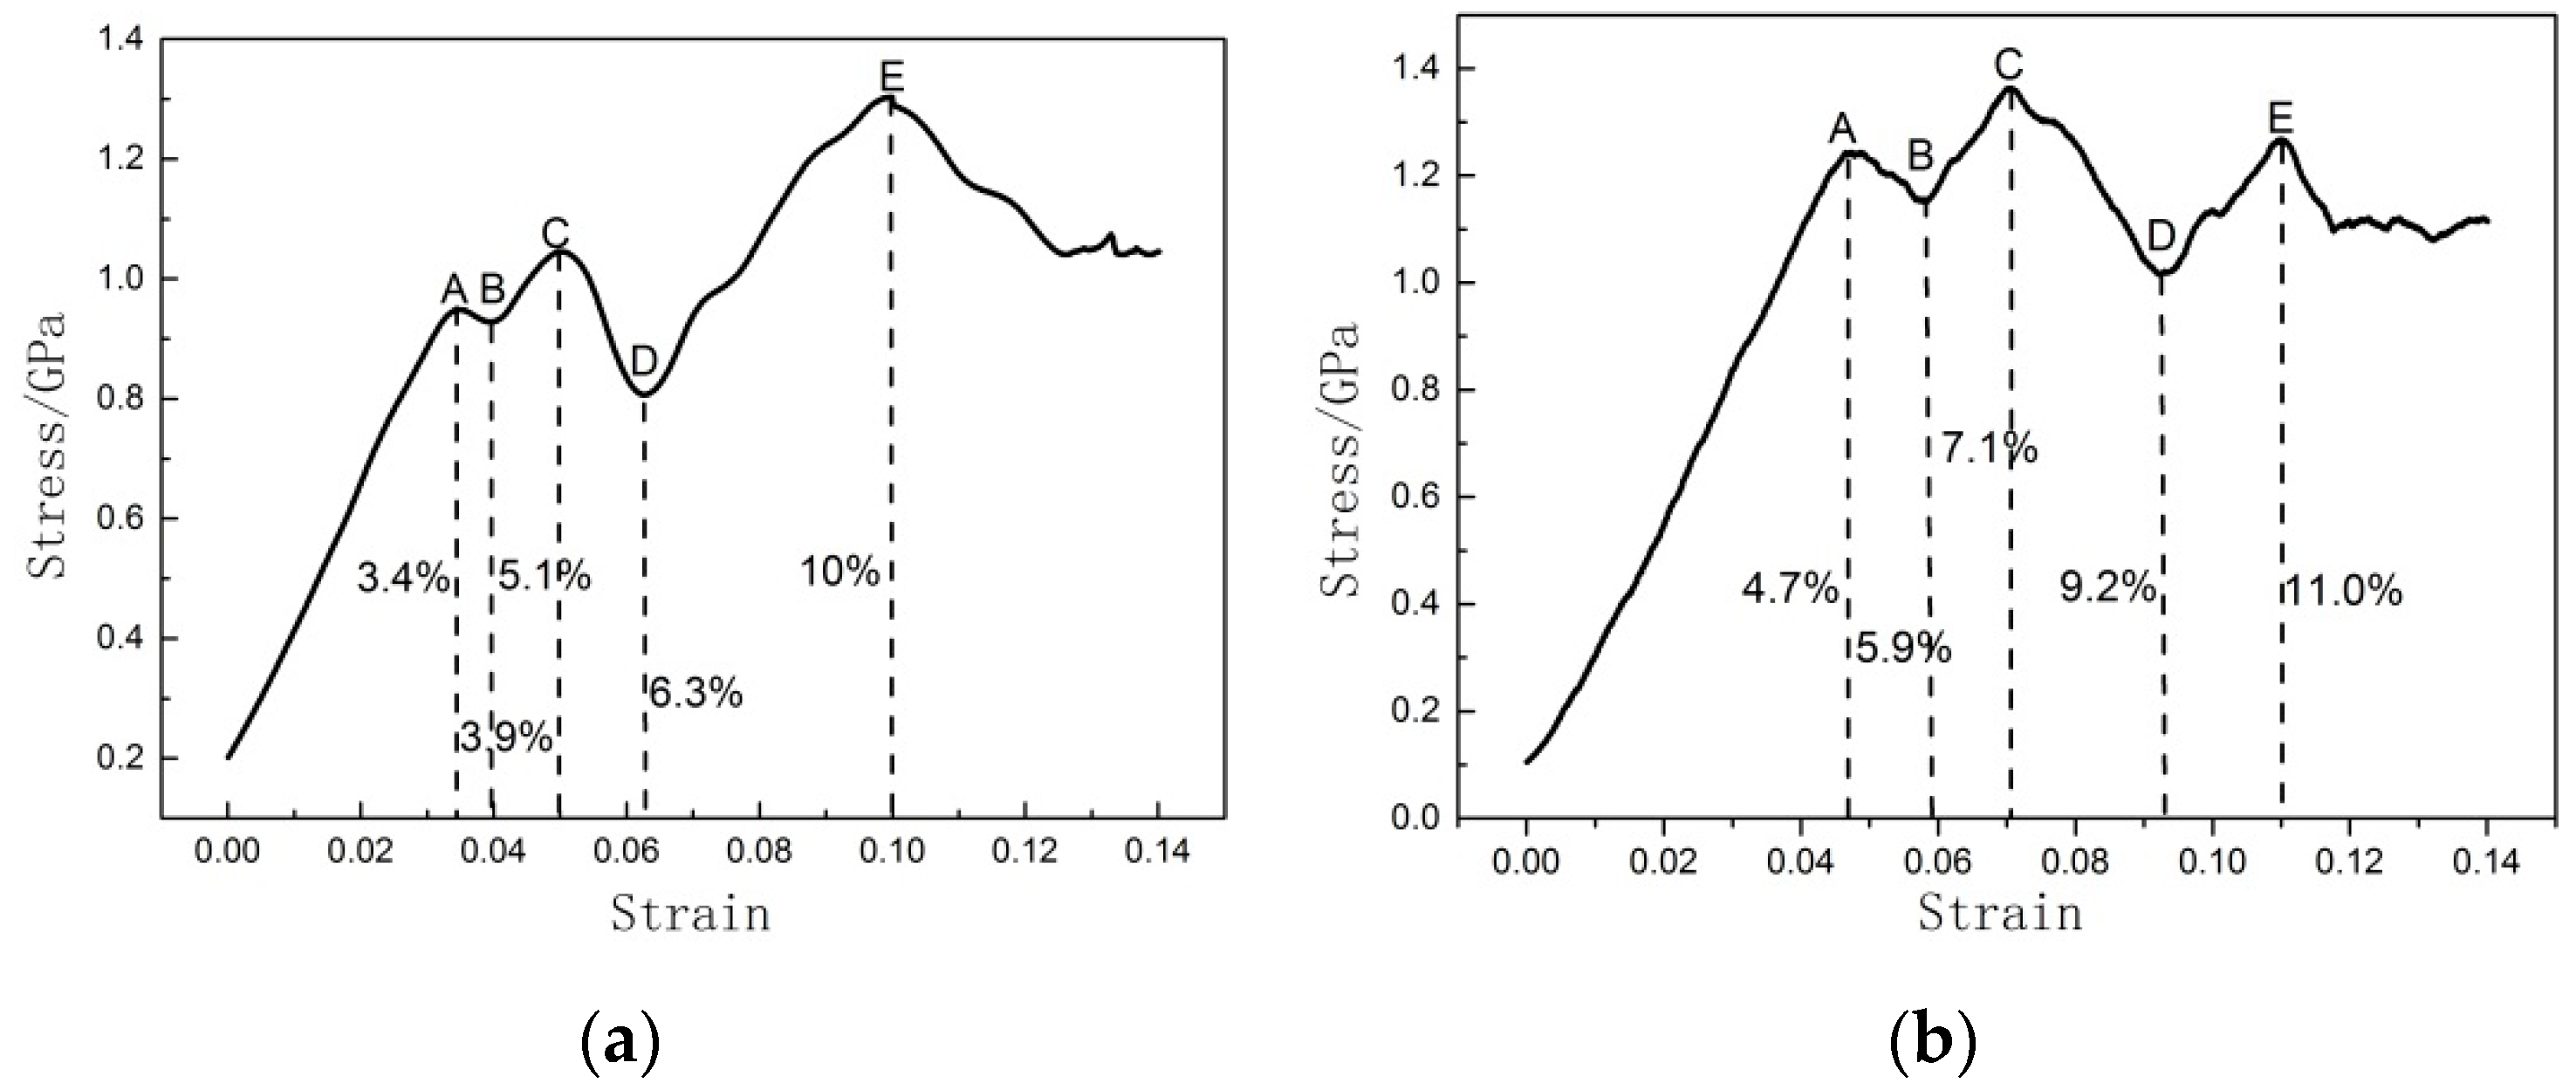
Figure 12 shows the stress–strain curves of FeCrNi/Fe with different asperities at 700 °C. The stress is the sum of all the atom stresses in the Z direction, in which the atomic stress equals the potential density in the resultant force field generated by the neighboring atoms, and the strain is the ratio of total deformation to the initial dimension of the material in the Z direction. It can be seen that the stress increases linearly with the strain until the first peak, which is the separation point of the elastic and plastic stages. The strains of these models at this time are approximately 0.067, 0.047, and 0.031. Then, there is a stress drop and plastic deformation commences. The modulus of elasticity in the three models is basically the same, but the yield limit is different. The minimum yield limit of model 2 is 0.87 GPa, and the yield limit of model 3 and model 1 is 1.23 GPa and 2.08 GPa, respectively.
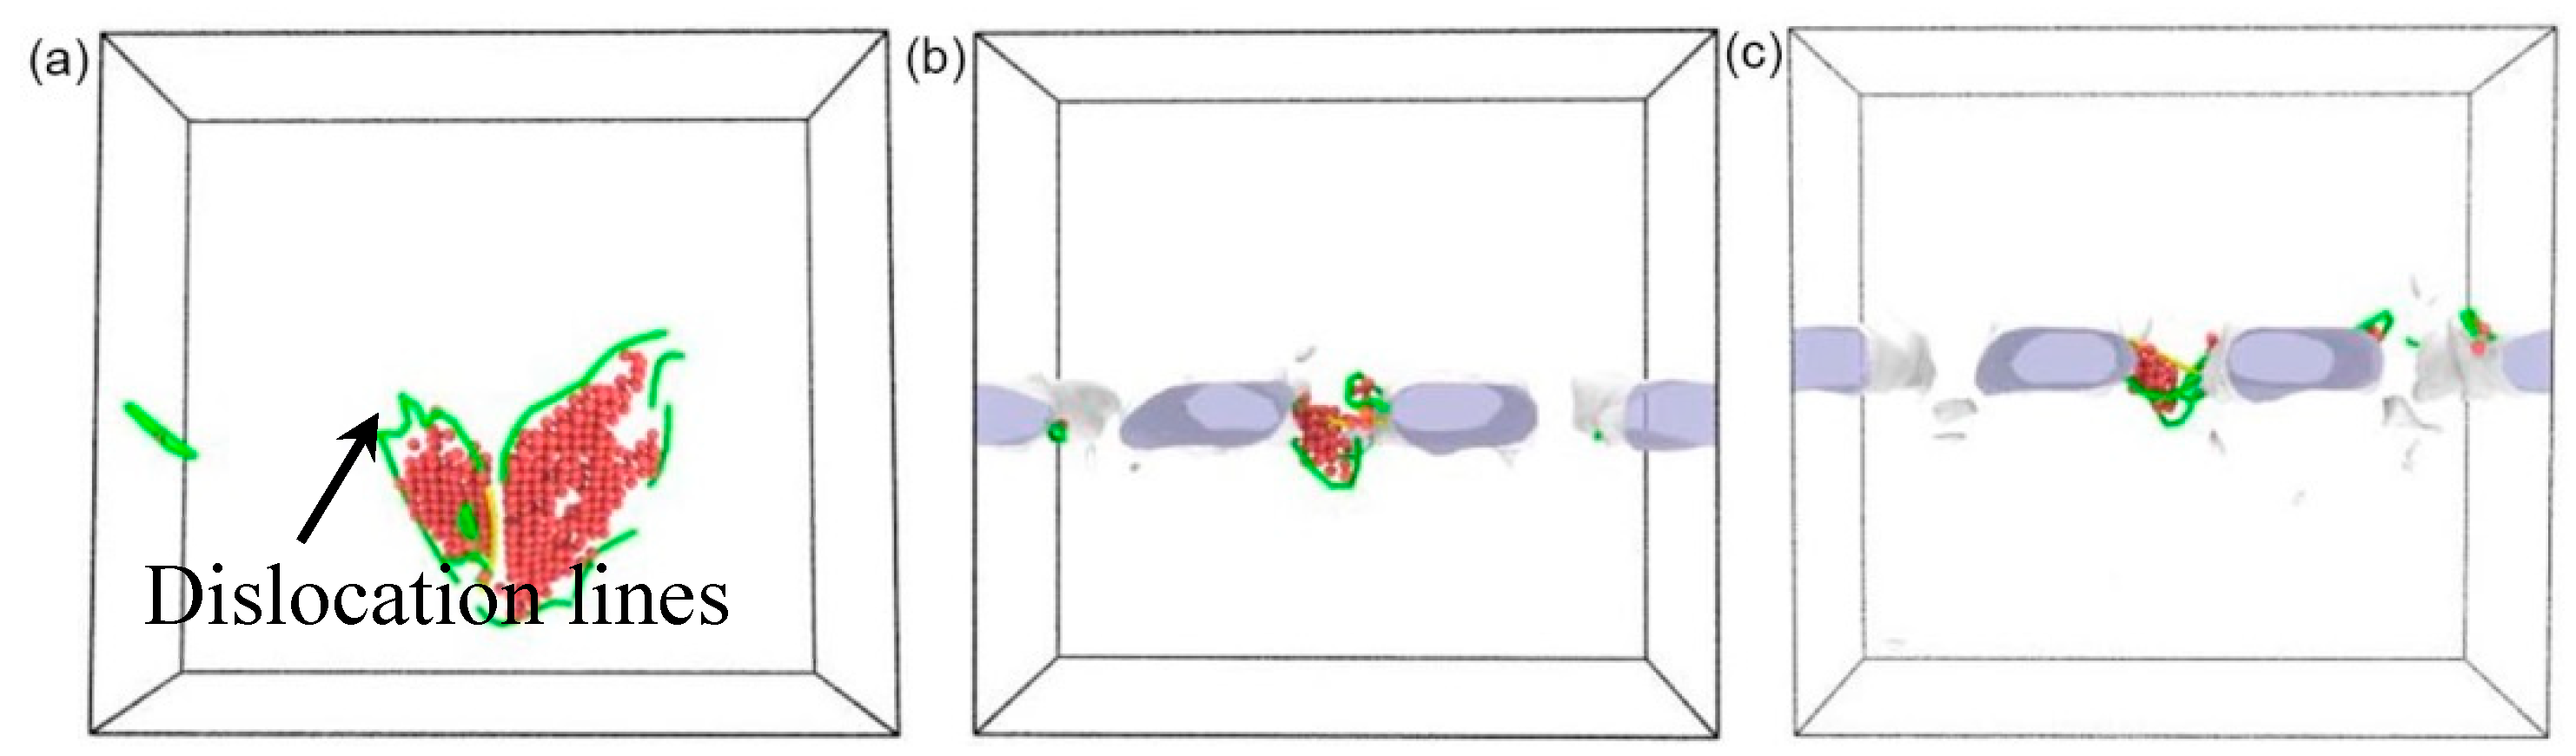
The dislocation extraction algorithm (DXA) [31] was adopted to identify the local environment of particles and determine the structural types of each atom. This method can be used to visualize the crystal defects and the evolution of the atomic structure. The defect microstructure of the three models at their yield point is shown in Figure 13, in which the perfect FCC atoms are removed, and the defect structures with dislocation lines shown. It is well known that a single layer composed of red atoms (HCP structure) means a twin boundary (TB), while two adjacent HCP layers mean an intrinsic stacking fault (ISF). No misfit dislocations were found at the interface of either model because the lattice parameters of FeCrNi and Fe have little difference. For model 1, the dislocation is first produced in the FeCrNi slab because the existence of Cr and Ni elements in the FeCrNi slab makes the lattice distortion easier and thus more prone to plastic deformation than the Fe slab. For models 2 and 3, the roughness peaks are more prone to plastic deformation than model 1 during the deformation process, so defect atoms appear at the roughness peak between the voids. Moreover, Shockley partial dislocation lines with burger vectors of 1/6<112> can be observed in each of the models.
During the elastic deformation stage, the distance between atoms changes while the arrangement of the atoms does not, so the closure rate of the interfacial voids is very slow. In the subsequent plastic deformation stage, the atoms begin to slip along the dislocation line and the lattice structure changes, which accelerates the closure rate of the voids.
(b) Elastic Deformation Stage
The deformation process of the three models in the plastic deformation stage is also different. For model 1, the stress drops rapidly after the yield point, and then the stress fluctuates slowly. However, for models 2 and 3, there are three peaks in the plastic deformation stage, thus having a stronger plastic deformability. To understand the strengthening mechanism of surface roughness during the plastic deformation stage, the stress–strain curve of model 2 and 3 were analyzed in detail. The evolution of the atomic microstructures from point A to E in Figure 14 was illustrated above.
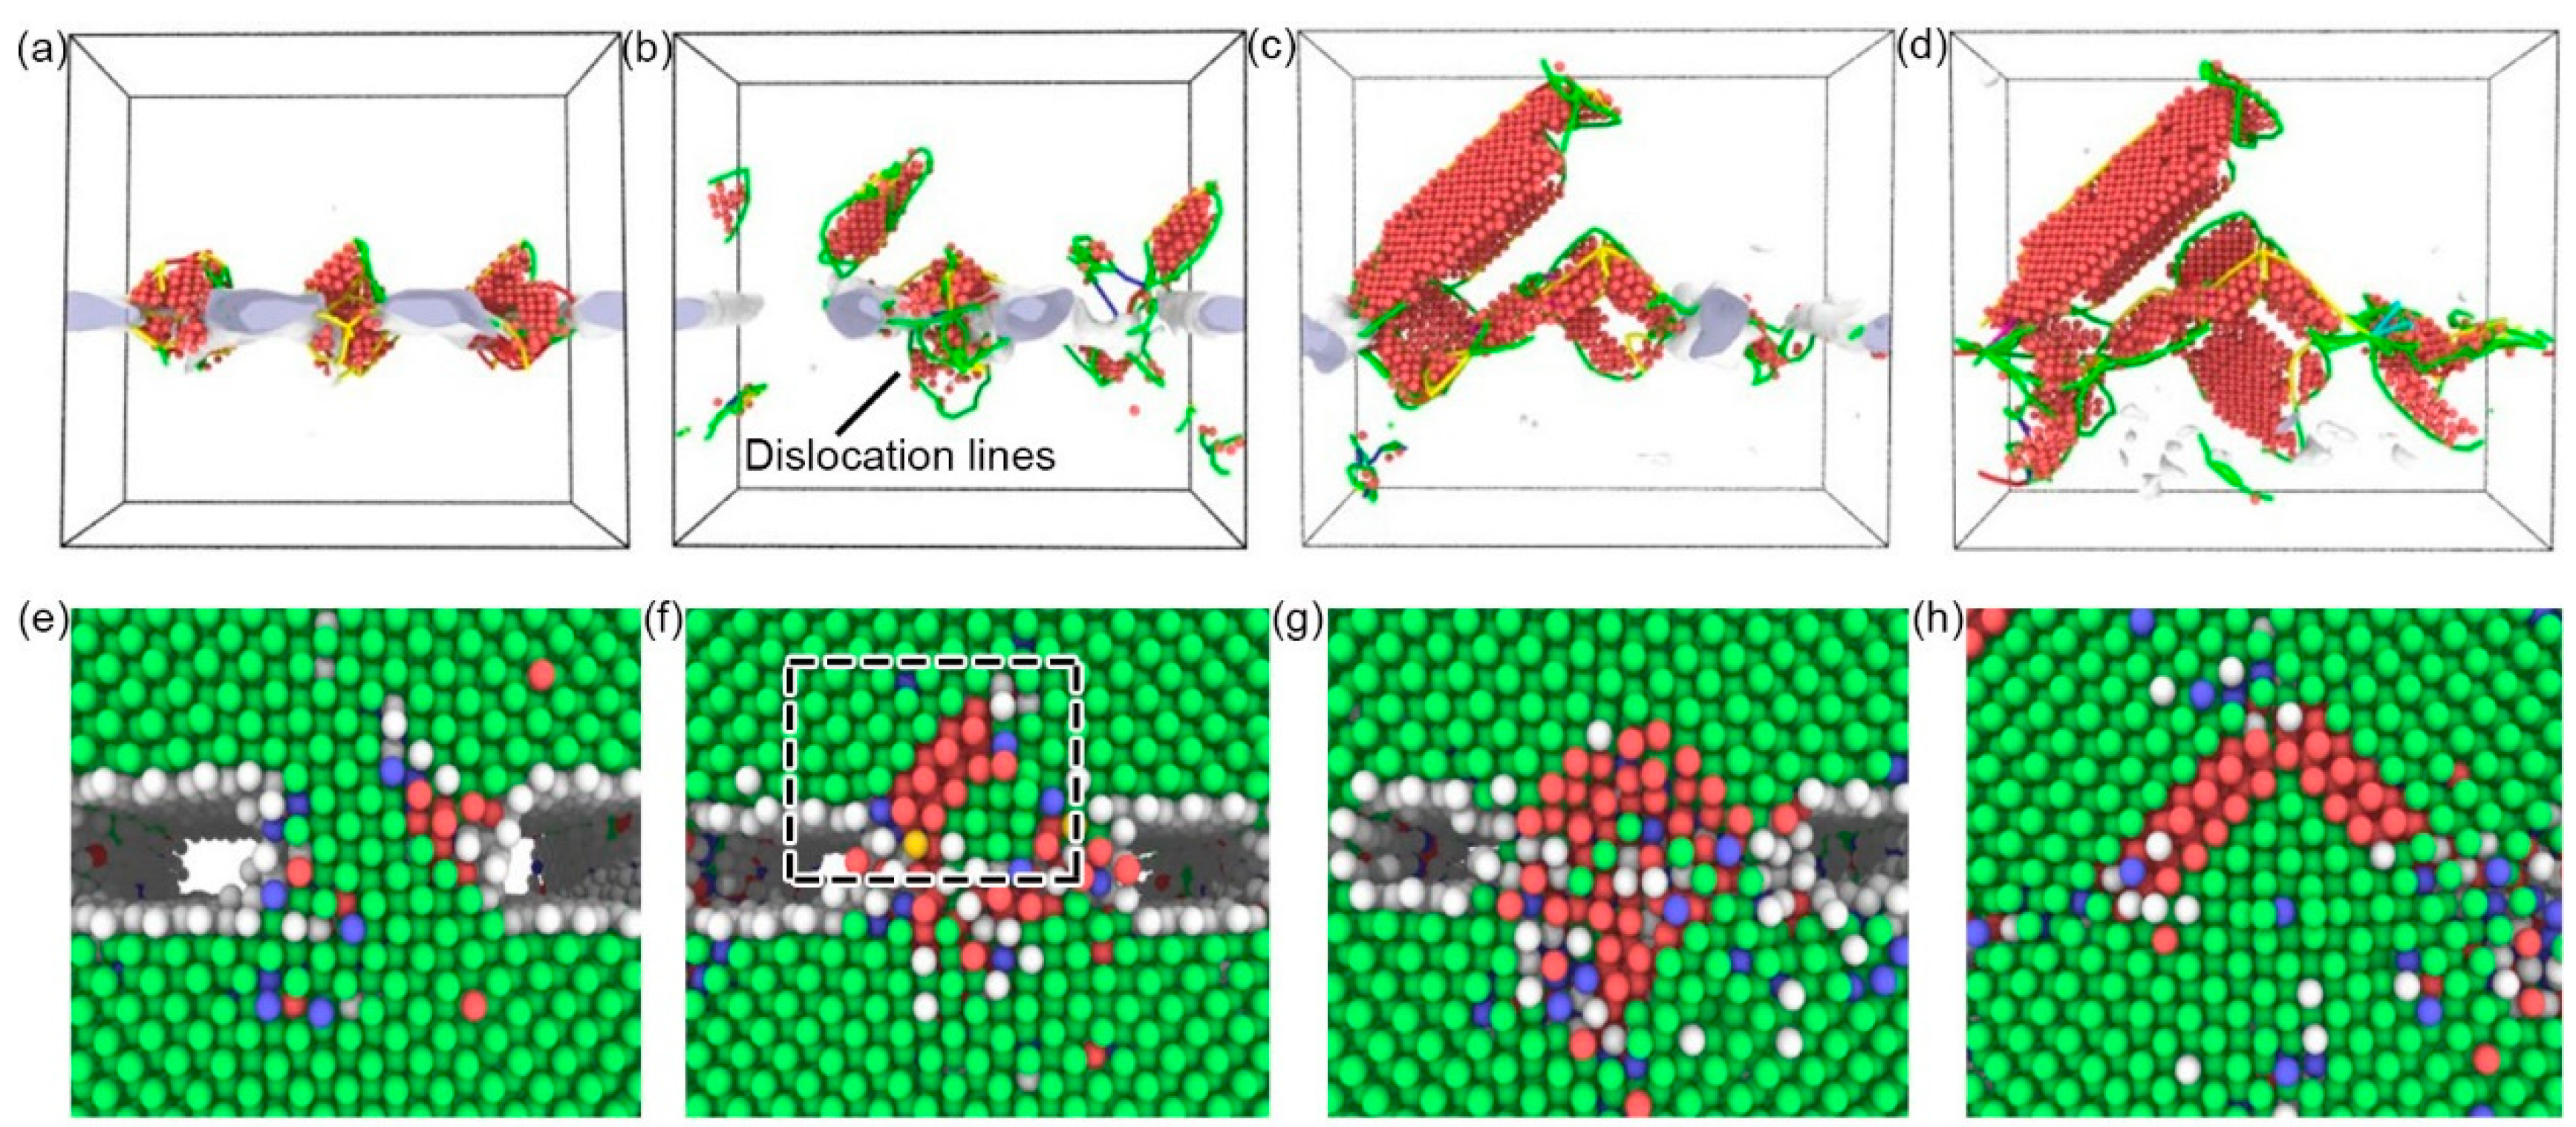
Figure 15a–d shows the distribution of defect atoms and dislocation lines at B–E points of model 2 and the corresponding magnified atomic images are shown in. Figure 15e–h, in which the green atom represents the FCC structure, the red atom represents the HCP structure, the blue represents the BCC structure, and the white represents the other type.
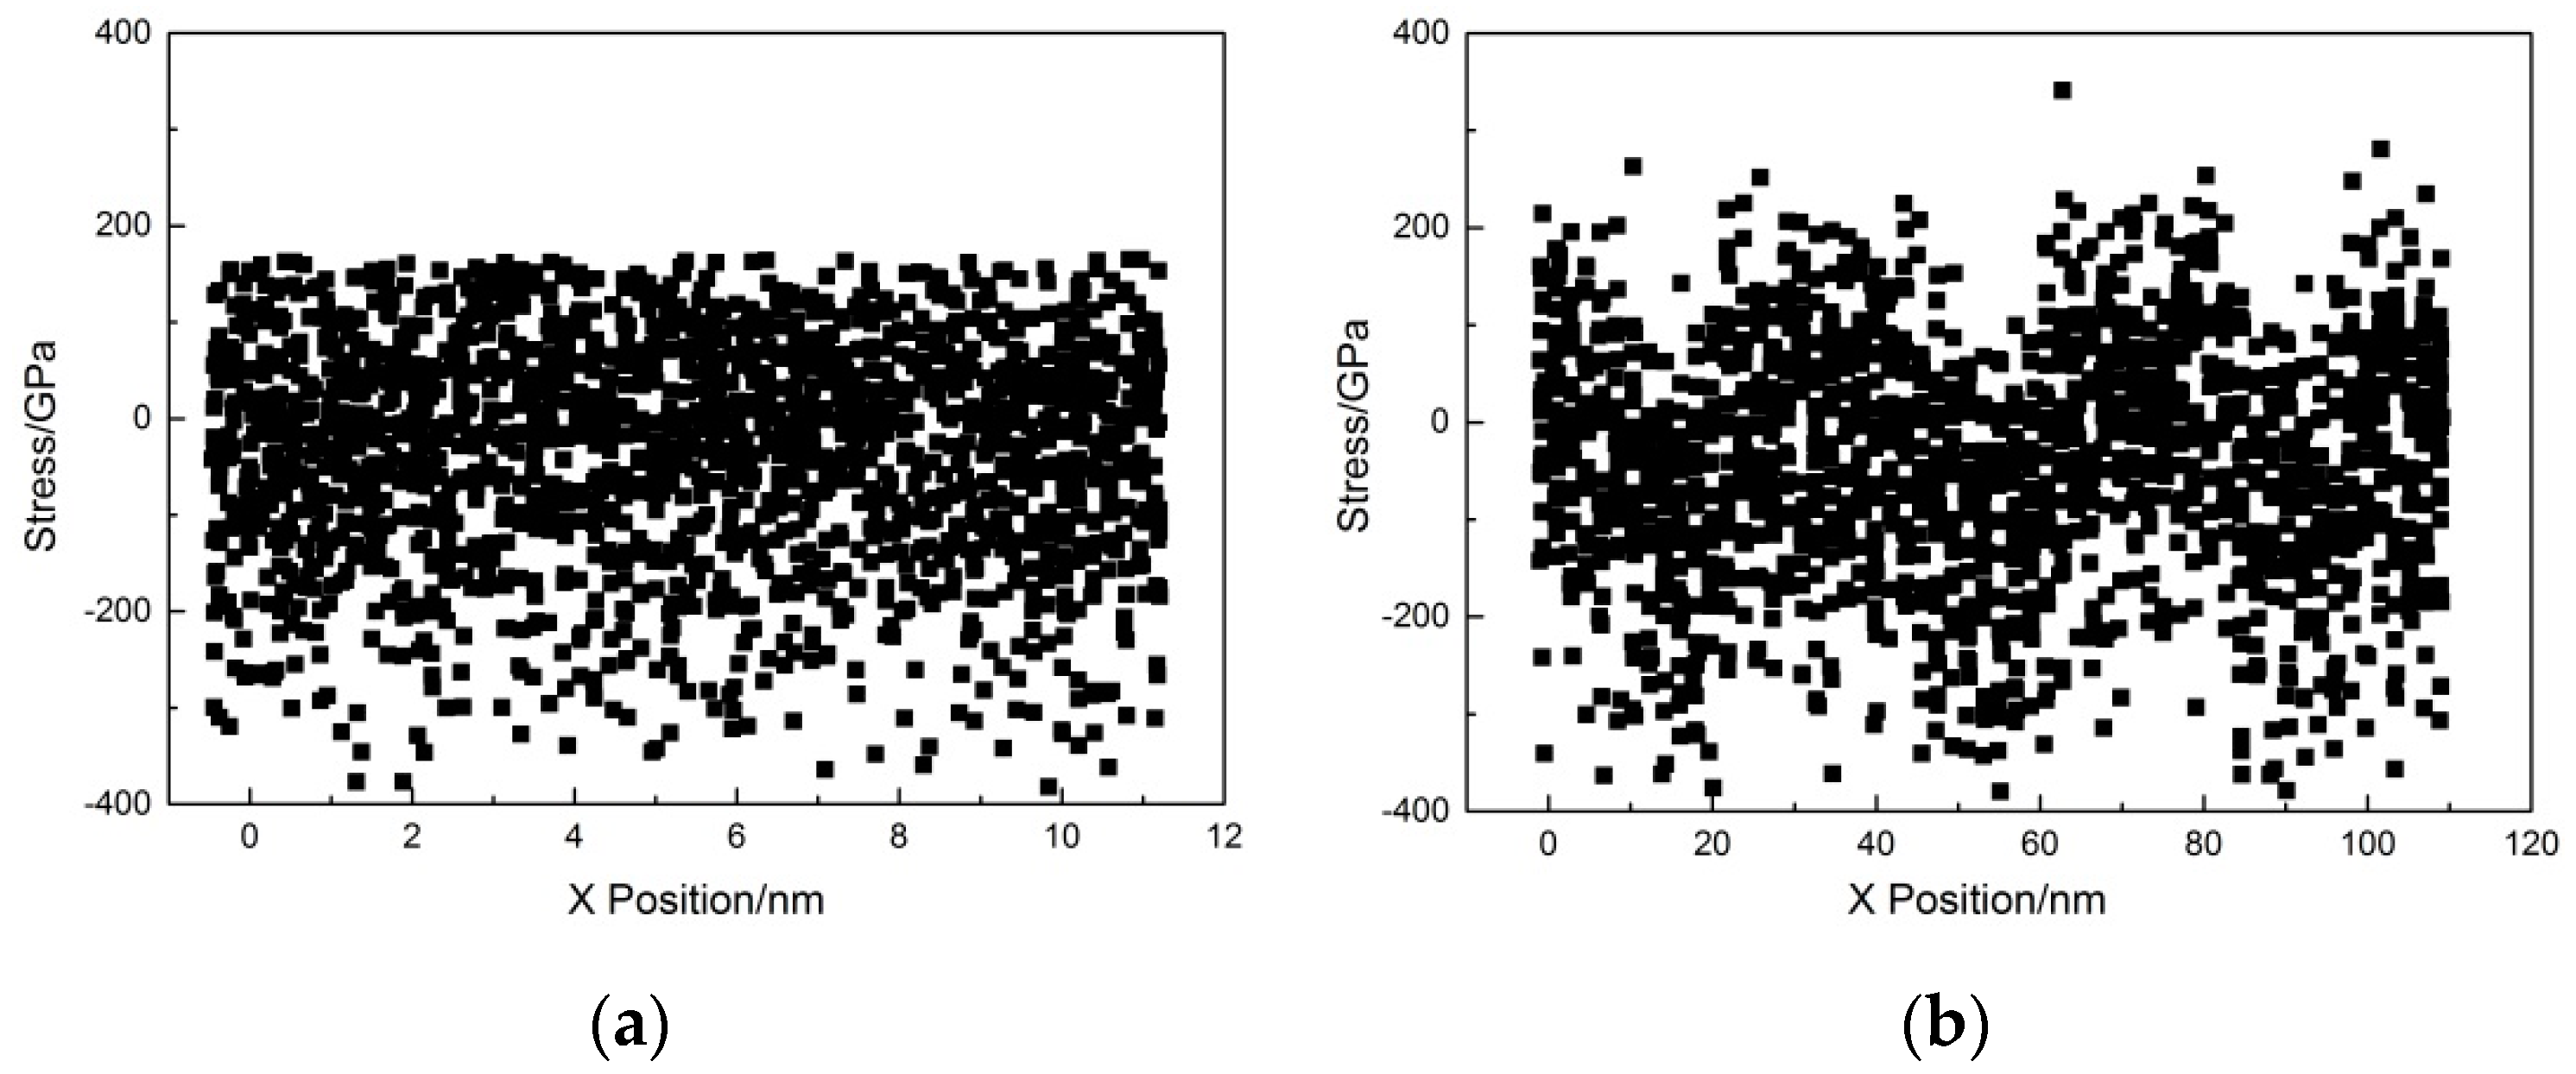
From the above analysis, it is known that dislocation generates near the interface at point A, resulting in a slight stress drop. At this stage, the original FCC structure changes to the BCC and HCP structures. After point B, the stress increases with strain due to dislocation gradually accumulating at the interface. As shown in Figure 15a, the partial dislocation and stacking fault interaction may produce the Hirth dislocation, colored with yellow lines. Subsequently, the atomic layer of the asperities is further disordered with further increase of strain. After point C, a drop in the stress occurs as dislocations begin to propagate to the Fe slab which can be seen from Figure 15b, and stacking faults can be found near the interface in the dashed box shown in Figure 15f. Figure 16 shows the stress distribution of the Fe slab atoms near the interface, where the discrete points represent the stresses in the Z direction of the single atom. The deformation of the asperities increases the inhomogeneous degree of the stress distribution in the interface, thus inducing the appearance of the dislocation in the Fe slab.
At point D, there are many intersecting dislocation lines near the interface as shown in Figure 15c. The deformation of the asperities acts as a barrier to obstruction and accumulation of the slip near the interfaces. Therefore, there is not a large number of dislocation lines and defective atoms in the FeCrNi slab. With the further increase of strain, the accumulation of dislocation in the Fe slab at the D–E stage increases the stress–strain curve. As shown in Figure 15d,h, the atomic alignment at point E tends to be consistent, and the FCC phase increases. The dislocations start to appear in the FeCrNi slab, resulting in a decrease in the stress–strain curve.
As mentioned above, in the stress–strain curves of both model 2 and 3, three peaks exist during the plastic deformation process. This may be ascribed to the fact that the evolution of dislocations in model 2 and 3 is basically similar. It is worth noting that the emission directions of dislocations at point C are different between model 2 and model 3. As shown in Figure 15b and Figure 17b, although the stress-strain curves of models 2 and 3 both drop at the C point, it can be found that dislocations in model 2 mainly nucleate in the Fe slab, while dislocations in model 3 mainly nucleate in the FeCrNi slab. This may be due to the difference in atomic composition and lattice constant between Fe and FeCrNi materials. The difference in lattice constants between Fe and FeCrNi materials is more likely to cause deformation. Moreover, in Figure 14, the three peaks of model 2 appear earlier than model 3, which accounts for the fact that model 2 has a higher void closure rate.
Compared with model 1 with a smooth surface, the asperities in model 2 and 3 produced a large number of interlaced dislocation lines at the interface during the deformation process, which reduced the yield strength of the material and hindered the transmission of dislocations in the two slabs. This indicates that the surface roughness can strengthen the FeCrNi/Fe via plastic deformation.
From the above analysis, it can be concluded that the process of interface void closure is divided into three stages. The first stage is the elastic deformation stage, in which the arrangement of atoms remains unchanged and the voids close slowly. In the second stage, voids close faster as dislocations nucleate near the interface. The arrangement of atoms near the interface changes from order to disorder under pressure, resulting in significant strengthening effects via plastic deformation. In the third stage, dislocations propagate to the slab as the deformation continues. The slab begins to undergo plastic deformation. Then, disordered atoms become ordered again with the voids completely healed.
5. Conclusions
In this paper, the voids closure mechanism during the roll-bonding process was investigated based on a multiscale approach. The following specific conclusions were drawn.
- (1)
- At the macro-scale, the closure rate of voids decreases with the increase of the real contact area between interfaces. The shape of voids changes from rectangular to circular or elliptical, and finally disappears completely. At the micro-scale, the arrangement of atoms near the interface become disordered under a certain pressure and move towards the voids, finally becoming ordered again with the voids completely healed.
- (2)
- The deformation law of surface roughness peaks at the macro- and micro-scales is different. The interface morphology after roll-bonding at the macro-scale was determined by the morphology of 304 stainless steel with a larger yield strength ratio, while the interface morphology at the micro-scale was mainly determined by the morphology of Q235 carbon steel with a higher yield strength.
- (3)
- At the micro-scale, the surface roughness affects the mechanical behavior of the material during deformation. Disordered atoms due to surface roughness hinder dislocation propagation through the interface, making the rough surface more plastically deformable than the ideal plane.
However, there are still some shortcomings in the MD model, such as ignoring the initial dislocations that may exist in the micro-rough peaks, while the influence of matrix deformation on the deformation behavior of micro-rough peaks was not considered. Further research should be done in the future to solve these problems.
Author Contributions
S.L. conducted most of the simulation work. Q.Z. designed the simulation cases and discussed the results with S.L., R.L. and B.Z. offered helpful suggestion and revised the paper. All authors read and approved the final manuscript.
Funding
This research was funded by [National Natural Science Foundation of China] grant number [51575040].
Conflicts of Interest
The authors declare no conflict of interest.
References
- Zhang, Q.D.; Li, S.; Liu, J.Y.; Wang, Y.N.; Zhang, B.Y.; Zhang, L.Y. Study of a Bimetallic Interfacial Bonding Process Based on Ultrasonic Quantitative Evaluation. Metals 2018, 8, 329. [Google Scholar] [CrossRef]
- Christian, W.S.; Patrick, K.; Heinz, W.H.; Mathias, G.P. Based Alloying by Accumulative Roll Bonding in the System Al-Cu. Metals 2011, 1, 65–78. [Google Scholar]
- Yilmaz, O.; Çelik, H. Electrical and thermal properties of the interface at diffusion-bonded and soldered 304 stainless steel and copper bimetal. J. Mater. Process. Technol. 2003, 141, 67–76. [Google Scholar] [CrossRef]
- Yao, G.C.; Mei, Q.S.; Li, J.Y.; Li, C.L.; Ma, Y.; Chen, F.; Zhang, G.D.; Yang, B. Hard copper with good electrical conductivity fabricated by accumulative roll-bonding to ultrahigh strains. Metals 2016, 6, 115. [Google Scholar] [CrossRef]
- Wang, A.; Ohashi, O.; Ueno, K. Effect of surface asperity on diffusion bonding. Mater. Trans. 2006, 47, 179. [Google Scholar] [CrossRef]
- Bahramian, A. The effect of heat treatment on the surface structure of polyaniline nanostructured film: An experimental and molecular dynamics approach. Appl. Surf. Sci. 2014, 311, 508–520. [Google Scholar] [CrossRef]
- Sayles, R.S.; Thomas, T.R. Surface topography as a nonstationary random process. Nature 1978, 271, 431–434. [Google Scholar] [CrossRef]
- Hill, A.; Wallach, E.R. Modelling solid-state diffusion bonding. Acta. Metall. 1989, 37, 2425–2437. [Google Scholar] [CrossRef]
- Ma, R.F.; Li, M.Q.; Li, H.; Yu, W.X. Modeling of void closure in diffusion bonding process based on dynamic conditions. Sci. China. Ser. E 2012, 55, 2420–2431. [Google Scholar] [CrossRef]
- Alegria, J.; Miranda, R.M.; Gomez, D.S.; Jose, M.; Fernandes, A.A. Modelling of voids closure in the diffusion bonding process. Mater. Sci. Forum 2008, 587–588, 731–735. [Google Scholar] [CrossRef]
- Rapaport, D.C. Multibillion-atom molecular dynamics simulation: Design considerations for vector-parallel processing. Comput. Phys. Commun. 2006, 174, 521–529. [Google Scholar] [CrossRef]
- Song, J.; Srolovitz, D.J. Molecular dynamics investigation of patterning via cold welding. J. Mech. Phys. Solids 2009, 57, 776–787. [Google Scholar] [CrossRef]
- Chen, S.D.; Ke, F.J.; Zhou, M.; Bai, Y.L. Atomistic investigation of the effects of temperature and surface roughness on diffusion bonding between Cu and Al. Acta. Mater. 2007, 55, 3169–3175. [Google Scholar] [CrossRef] [Green Version]
- Jiao, Z.; Song, C.; Lin, T.; He, P. Molecular dynamics simulation of the effect of surface roughness and pore on linear friction welding between Ni and Al. Comput. Mater. Sci. 2011, 50, 3385–3389. [Google Scholar] [CrossRef]
- Medyanik, S.N.; Shao, S. Strengthening effects of coherent interfaces in nanoscale metallic bilayers. Comput. Mater. Sci. 2009, 45, 1129–1133. [Google Scholar] [CrossRef]
- Misra, A.; Hirth, J.P.; Hoagland, R.G. Length-scale-dependent deformation mechanisms in incoherent metallic multilayered composites. Acta. Mater. 2005, 53, 4817–4824. [Google Scholar] [CrossRef]
- Wang, J.; Misra, A. An overview of interface-dominated deformation mechanisms in metallic multilayers. Curr. Opin. Solid St. M. 2011, 15, 20–28. [Google Scholar] [CrossRef]
- Rao, S.I.; Hazzledine, P.M. Atomistic simulations of dislocation–interface interactions in the Cu-Ni multilayer system. MRS Proceedings 1999, 578, 2011–2040. [Google Scholar] [CrossRef]
- Shao, S.; Wang, J.; Misra, A.; Hoagland, R.G. Spiral patterns of dislocations at nodes in (111) semi-coherent FCC interfaces. Sci. Rep. 2013, 3, 2448. [Google Scholar] [CrossRef]
- Hoagland, R.G.; Kurtz, R.J.; Henager, C.H. Slip resistance of interfaces and the strength of metallic multilayer composites. Scripta Mater. 2004, 50, 775–779. [Google Scholar] [CrossRef]
- Weng, S.; Ning, H.; Hu, N.; Cheng, Y.; Fu, T.; Peng, X.H.; Fu, S.Y.; Zhang, J.Y.; Xu, C.H.; Sun, D.Y.; et al. Strengthening effects of twin interface in Cu/Ni multilayer thin films – A molecular dynamics study. Mater. Des. 2016, 111, 1–8. [Google Scholar] [CrossRef]
- Zhang, X.; Misra, A.; Wang, H.; Shen, T.D.; Nastasi, M.; Mitchell, T.E.; Hirth, J.P.; Hoagland, R.G.; Embury, J.D. Enhanced hardening in Cu/330 stainless steel multilayers by nanoscale twinning. Acta. Mater. 2004, 52, 995–1002. [Google Scholar] [CrossRef]
- López de Lacalle, L.N.; Rodríguez, A.; Lamikiz, A.; Celaya, A.; Alberdi, R. Five-axis machining and burnishing of complex parts for the improvement of surface roughness. Adv. Manuf. Processes 2011, 26, 997–1003. [Google Scholar] [CrossRef]
- Pozo, D.D.; López de Lacalle, L.N.; López, J.M.; Hernández, A. Prediction of press/die deformation for an accurate manufacturing of drawing dies. Int. J. of Adv. Manuf. Tech. 2008, 37, 649–656. [Google Scholar] [CrossRef]
- Bonny, G.; Castin, N.; Terentyev, D. Interatomic potential for studying ageing under irradiation in stainless steels: the FeNiCr model alloy. Model. Simul. Mater. Sci. Eng. 2013, 21, 5897. [Google Scholar] [CrossRef]
- Mishin, Y.; Mehl, M.J.; Papaconstantopoulos, D.A.; Voter, A.F.; Kress, J.D. Structural stability and lattice defects in copper: Ab initio, tight-binding, and embedded-atom calculations. Phys. Rev. B 2001, 63, 224106. [Google Scholar] [CrossRef]
- Cohen, A.J.; Gordon, R.G. Theory of the lattice energy, equilibrium structure, elastic constants, and pressure-induced phase transitions in alkali-halide crystals. Phys. Rev. B 1975, 12, 3228–3241. [Google Scholar] [CrossRef]
- Yu, J.; Xin, L.; Wang, J.; Chen, J.; Huang, W. First-principles study of the relaxation and energy of bcc-Fe, fcc-Fe and AISI-304 stainless steel surfaces. Appl. Surf. Sci. 2009, 255, 9032–9039. [Google Scholar] [CrossRef]
- Plimpton, S. Fast Parallel Algorithms for Short-Range Molecular Dynamics. J. Comput. Phys. 1995, 117, 1–19. [Google Scholar] [CrossRef] [Green Version]
- Stukowski, A. Visualization and analysis of atomistic simulation data with OVITO-the Open Visualization Tool. IEEE T. Fuzzy Syst. 2010, 18, 2154–2162. [Google Scholar] [CrossRef]
- Moxnes, E.D.; Kristiansen, N.I.; Stohl, A.; Clarisse, L.; Durant, A.; Weber, K. Extracting dislocations and non-dislocation crystal defects from atomistic simulation data. Model. Simul. Mater. Sci. Eng. 2010, 18, 2131–2145. [Google Scholar]
Figure 1.
3D figures of specimen surfaces scanned by a white light interferometer microscope before roll-bonding.
Figure 1.
3D figures of specimen surfaces scanned by a white light interferometer microscope before roll-bonding.

Figure 2.
Schematic view of the roll-bonding process.

Figure 3.
Images of the bonding state detected by an ultrasonic “C” scanning detection system and the interface morphology of typical locations at various pressures: (a) 22 Torr, (b) 28 Torr, and (c) 40 Torr.
Figure 3.
Images of the bonding state detected by an ultrasonic “C” scanning detection system and the interface morphology of typical locations at various pressures: (a) 22 Torr, (b) 28 Torr, and (c) 40 Torr.

Figure 4.
Bonding rate of bonded specimens at various pressures.
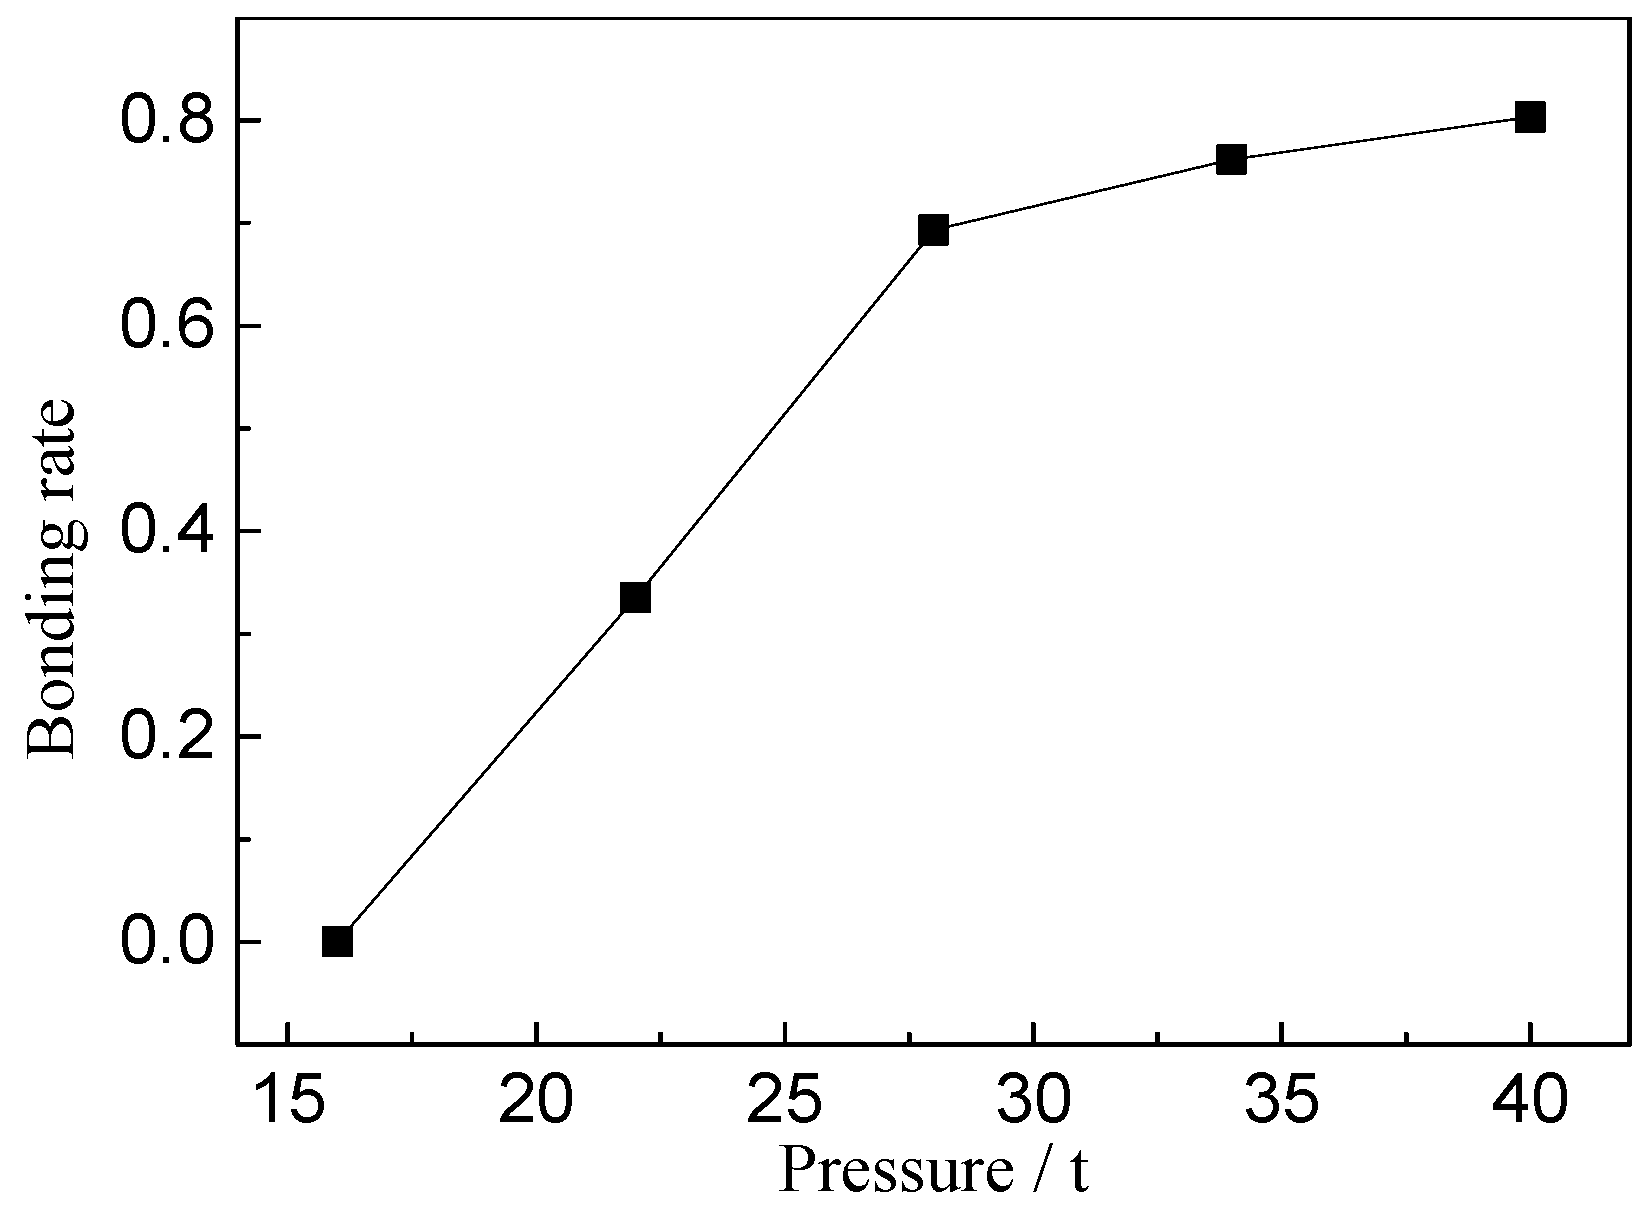
Figure 5.
2D models of the indenters and specimens.
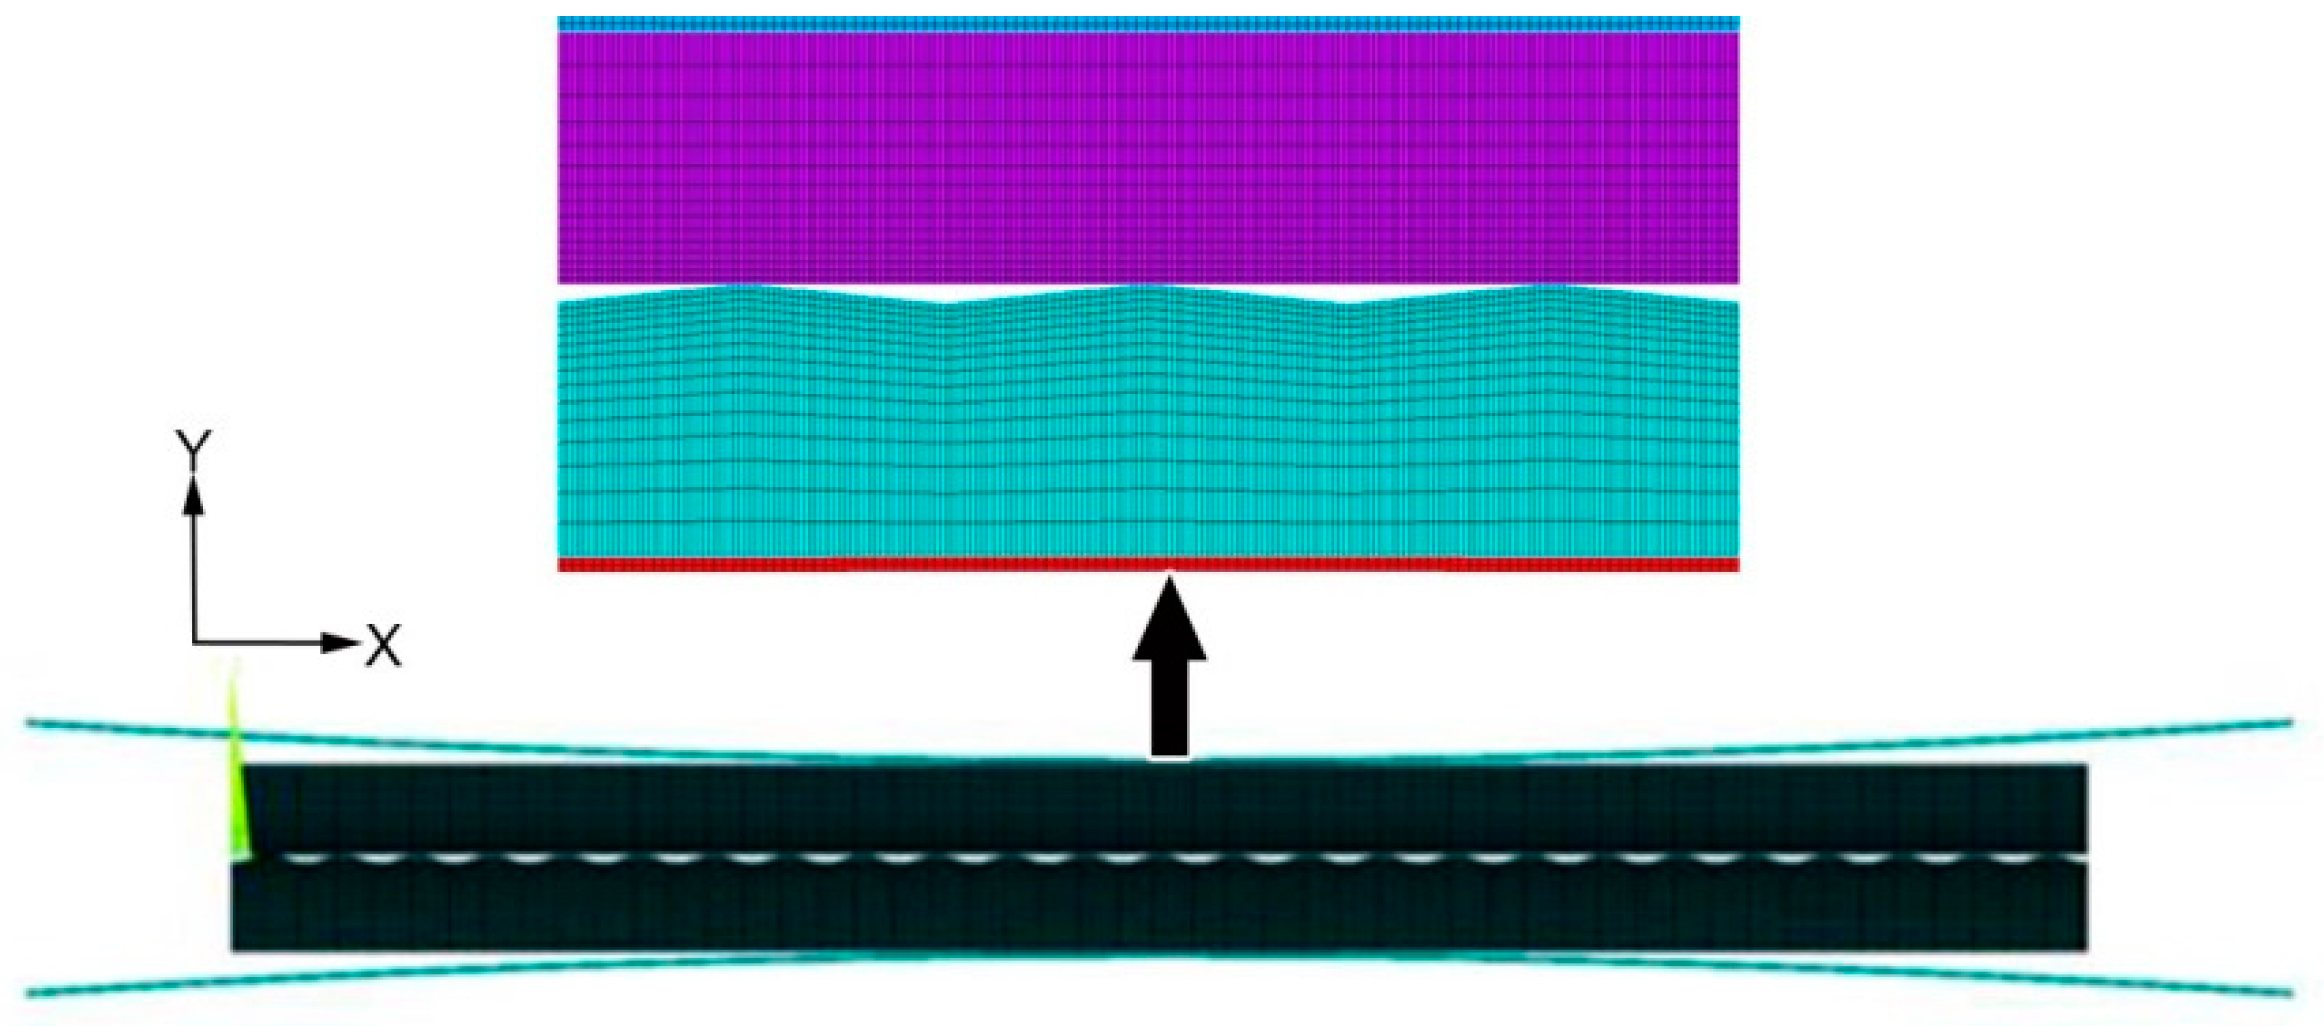
Figure 6.
Potential energy under different lattice constants: (a) Fe17Cr5Ni2 system and (b) Fe system.
Figure 6.
Potential energy under different lattice constants: (a) Fe17Cr5Ni2 system and (b) Fe system.

Figure 7.
Initial configuration of (a) model 1, (b) model 2, and (c) model 3. Fe (stainless steel), Cr, Ni, Fe (carbon steel).
Figure 7.
Initial configuration of (a) model 1, (b) model 2, and (c) model 3. Fe (stainless steel), Cr, Ni, Fe (carbon steel).

Figure 8.
Stress distribution in Y direction and partial enlarged drawing of (a) group 1, (b) group 2, and (c) group 3.
Figure 8.
Stress distribution in Y direction and partial enlarged drawing of (a) group 1, (b) group 2, and (c) group 3.
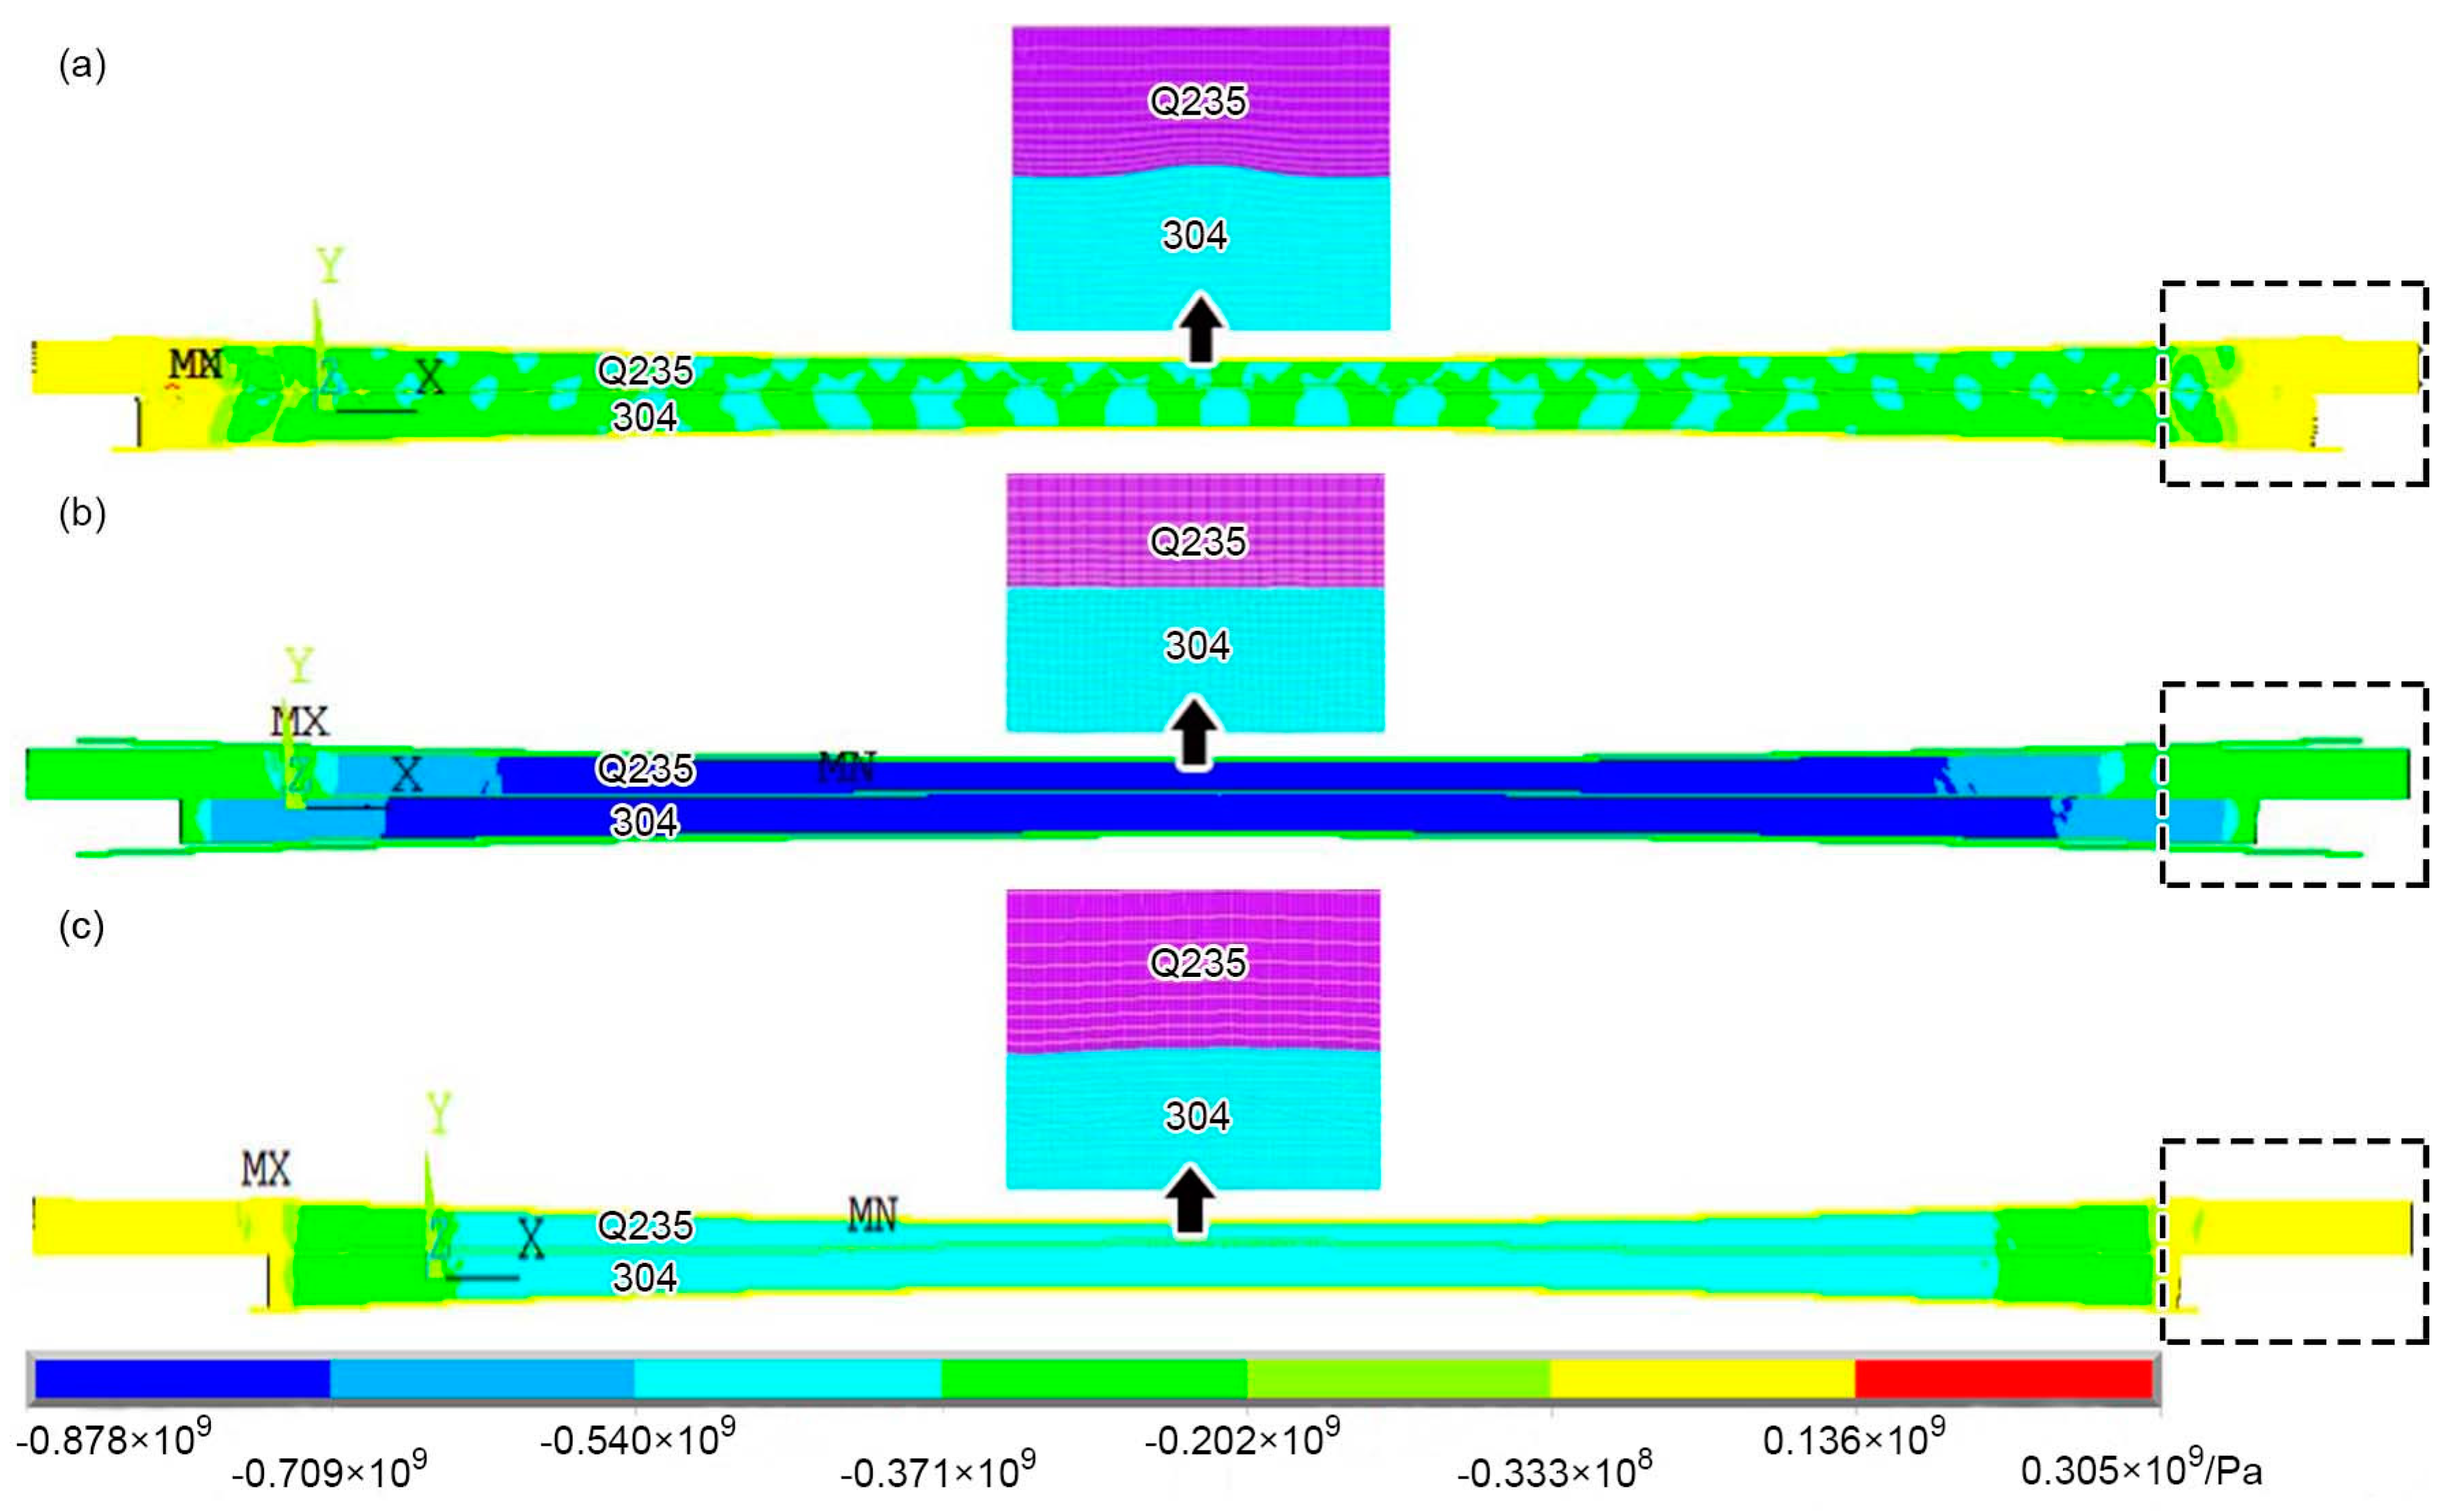
Figure 9.
The void closure rate and mean stress at the interface with different pressures.

Figure 10.
The deformation process of model 2 and model 3 at a strain of (a) and (d) 5%, (b) and (e) 7%, and (c) and (f) 9%.
Figure 10.
The deformation process of model 2 and model 3 at a strain of (a) and (d) 5%, (b) and (e) 7%, and (c) and (f) 9%.

Figure 11.
Void closure rate curves for models 2 and 3.

Figure 12.
Stress–strain curves of model 1, 2, and 3 with different types of asperities.

Figure 13.
Defect microstructures at the yield point with (a) model 1 at a strain of 0.067, (b) model 2 at a strain of 0.031 and (c) model 3 at a strain of 0.047.
Figure 13.
Defect microstructures at the yield point with (a) model 1 at a strain of 0.067, (b) model 2 at a strain of 0.031 and (c) model 3 at a strain of 0.047.

Figure 14.
Stress–strain curves with different surface roughnesses under compression for (a) model 2 and (b) model 3.
Figure 14.
Stress–strain curves with different surface roughnesses under compression for (a) model 2 and (b) model 3.

Figure 15.
Microstructures and magnified atomic image of model 2 corresponding to point B–E with strains of: (a,e) 3.9%, (b,f) 5.1%, (c,g) 6.3%, and (d,h) 10%.
Figure 15.
Microstructures and magnified atomic image of model 2 corresponding to point B–E with strains of: (a,e) 3.9%, (b,f) 5.1%, (c,g) 6.3%, and (d,h) 10%.

Figure 16.
The stress distribution of Fe slab atoms near the interface: (a) before deformation and (b) with a strain of 5.1%.
Figure 16.
The stress distribution of Fe slab atoms near the interface: (a) before deformation and (b) with a strain of 5.1%.

Figure 17.
Microstructures and magnified atomic image of model 3 corresponding to point B–E at four strains (a,e) 5.9%, (b,f) 7.1%, (c,g) 9.2% and (d,h) 11.0%.
Figure 17.
Microstructures and magnified atomic image of model 3 corresponding to point B–E at four strains (a,e) 5.9%, (b,f) 7.1%, (c,g) 9.2% and (d,h) 11.0%.


Table 1.
Chemical composition of AISI304 and Q235A (mass fraction/%).
| Material | Cr | Ni | C | Si | Mn | P | S | Fe |
|---|---|---|---|---|---|---|---|---|
| AISI304 | 18.97 | 8.86 | 0.04 | 1.00 | 2.00 | 0.035 | 0.03 | Bal |
| Q235A | - | - | 0.22 | 0.30 | 0.43 | 0.04 | 0.05 | Bal |
Table 2.
Mechanical character of Q235A carbon steel and AISI304 stainless steel.
| Material | Young’s Modulus (E/MPa) | Poisson’s Ratio (γ) | ||
|---|---|---|---|---|
| AISI304 | 67 | 2.02 × 10⁵ | 0.3 | 7.9 × 10³ |
| Q235A | 78 | 2.1 × 10⁵ | 0.3 | 7.8 × 10³ |
Table 3.
Simulation conditions of each group.
| Group | Surface of AISI304 | Surface of Q235A | Strain |
|---|---|---|---|
| 1 | Smooth | Rough | 0.5 |
| 2 | Smooth | Smooth | 0.5 |
| 3 | Rough | Smooth | 0.5 |
| 4 | Rough | Smooth | 0.1 |
| 5 | Rough | Smooth | 0.2 |
| 6 | Rough | Smooth | 0.3 |
| 7 | Rough | Smooth | 0.4 |
| 8 | Rough | Smooth | 0.6 |
© 2019 by the authors. Licensee MDPI, Basel, Switzerland. This article is an open access article distributed under the terms and conditions of the Creative Commons Attribution (CC BY) license (http://creativecommons.org/licenses/by/4.0/).
Share and Cite
MDPI and ACS Style
Zhang, Q.; Li, S.; Li, R.; Zhang, B. Multiscale Comparison Study of Void Closure Law and Mechanism in the Bimetal Roll-Bonding Process. Metals 2019, 9, 343. https://doi.org/10.3390/met9030343
AMA Style
Zhang Q, Li S, Li R, Zhang B. Multiscale Comparison Study of Void Closure Law and Mechanism in the Bimetal Roll-Bonding Process. Metals. 2019; 9(3):343. https://doi.org/10.3390/met9030343
Chicago/Turabian StyleZhang, Qingdong, Shuo Li, Rui Li, and Boyang Zhang. 2019. "Multiscale Comparison Study of Void Closure Law and Mechanism in the Bimetal Roll-Bonding Process" Metals 9, no. 3: 343. https://doi.org/10.3390/met9030343
Note that from the first issue of 2016, this journal uses article numbers instead of page numbers. See further details here.