Evaluation of Energy-Based Model Generated Strain Signals for Carbon Steel Spring Fatigue Life Assessment
by
 , , and
Yat Sheng Kong
1 ,
,
Shahrum Abdullah
1,*,
Dieter Schramm
2,
Mohd Zaidi Omar
3 and
Sallehuddin Mohamed Haris
1 1
Centre for Integrated Design for Advanced Mechanical Systems (PRISMA), Faculty of Engineering and Built Environment, Universiti Kebangsaan Malaysia, UKM Bangi 43600, Selangor, Malaysia
2
Departmental Chair of Mechatronics, University of Duisburg-Essen, 47057 Duisburg, Germany
3
Centre for Materials Engineering and Smart Manufacturing (MERCU), Faculty of Engineering and Built Environment, Universiti Kebangsaan Malaysia, UKM Bangi 43600, Selangor, Malaysia
*
Author to whom correspondence should be addressed.
Metals 2019, 9(2), 213; https://doi.org/10.3390/met9020213
Submission received: 30 November 2018
/
Revised: 9 January 2019
/
Accepted: 10 January 2019
/
Published: 12 February 2019
Abstract
:This paper presents the evaluation of the automobile coil-spring strain-displacement relationship for strain signals generation and fatigue life predictions. The development of a strain and spring vertical displacement relationship is significant because measuring vehicle wheel displacements and forces are complex and costly. Hence, there is a need to estimate the strain data using alternative measurement, such as vibration signals. In this analysis, strain and acceleration data were collected from a vehicle that has travelled on different road conditions. Through the material elastic strain energy and spring potential energy relationship, a coil-spring parameterise strain-displacement relationship has been developed and evaluated using a scatter band and correlation approach. Using this proposed model, the strain time histories were obtained based on acceleration data. For fatigue life analysis, most of the predicted fatigue life was distributed in the acceptable range using the scatter band approach where the data correlated at coefficient of determination value (R2) of 0.8788. With a suitable correlation value, this analysis proposed an alternative strain generation method for suspension coil spring fatigue life prediction, which could significantly shorten the spring development time.
1. Introduction
The control and stability of a ground vehicle depends on the friction between road surfaces and tyres where it has been reported to fluctuate rapidly [1,2]. Vehicles are exposed to random stochastic loadings due to the road unevenness and varying velocities, which affect ride quality [3], and failure due to fatigue [4]. Hence, it is significant to identify the road excitation input for vehicle durability and ride studies. Nowadays, generating loading profiles to represent the road surface has become an increasing demand to replace complex experimental setup for lengthy period field tests. Due to this constraint, numerical approaches have been extensively studied to reduce the numbers of field tests [5]. Early research by Tamboli et al. [6] has suggested that realistic wheel displacement function could be generated, even though only data displacement of a single wheel was known. In his research, a time lag correlation function has been introduced to create artificial data, and the generated stochastic road profile was used to optimize the passive suspension system of a car.
Until recently, another loading profile generation method using the test tailoring approach has been proposed by Xu et al. [7]. Furthermore, the load generation method was validated by Shafiullah et al. [8]. The generated load profile has been adopted for the accelerated durability test. Initially, the loading profile was generated through mission profiling, where the shock response spectrum and fatigue damage spectrum of vehicle response was determined [9]. Subsequently, the test tailoring approach also utilized a single degree freedom system to inversely regenerate the road profiles. Traditionally, road profiles were modelled using the Gaussian process [9]. However, the Gaussian process for the road profiles is applicable when the time histories are stationary [10]. Later, Bogsjo et al. [11] suggested a new class of random processes which known as the Laplace process. The Laplace process considered short periods of changing signal statistic due to transient behaviour. This is because the actual road conditions are mostly non-stationary, with the existence of potholes, curb strike, or bump events [12].
For vehicle oscillation analysis, bumps or potholes are usually modelled as a step input function and applied as an input to a two degree of freedom quarter vehicle model [13]. The vehicle oscillation was reduced through a proposed controller design for an active suspension system. Current trends in automotive suspension technology have focused on active suspension design and optimization of passenger vehicles, the passive suspension system. For example, Marzbanrad et al. optimized a passive suspension system to achieve minimum vehicle pitch angle using approximately-generated road data [14]. Another optimization research on semi-active suspension was based on suspension deflection, which utilized a step input road disturbance [15]. Most of the research work on suspension design has been approximated through step function road input, but the details on road data, in the forms of variable amplitude and time, are still very limited.
In recent years, continuous road load data, under various road conditions, measured using strain gauges, were widely used for the durability analysis of vehicle components, such as leaf springs [4], coil springs [16], and lower arms [17], due to its acceptable accuracy and inexpensive equipment. The strain time histories were used to predict the fatigue failure of the suspension components, where the data represents the road conditions. In research work of [16], the conversion of acceleration to strain data has been proposed as the tyre forces cannot be measured directly without the wheel force transducer. A wheel force transducer is an expensive and commercialized product with confidential technical information [18]. Hence, there is a need to approximate the time history data for the dynamic analysis of automotive components with affordable testing instruments.
In this study, a newly derived model has been proposed to obtain the coil spring strain by using the working space of coil spring. For vehicle oscillation studies when dealing with a bump event, the behaviour of the suspension characteristic reacts according to road inputs, where the road inputs are usually defined dynamically in time and in magnitude. A conventional measurement approach uses a displacement sensor on the wheel of the vehicle to collect wheel displacement time history. It was then used as the input for vehicle simulation. This research work intends to contribute to the case that, without a displacement sensor or wheel force transducer, the spring displacement time histories can be obtained through a newly developed strain and material elastic energy-based coil spring strain-displacement relationship. Based on the authors’ knowledge, no similar relationship has been proposed. The strain converted time and displacement data can be used to study the vehicle oscillation and fine-tune the vehicle suspension system design.
2. Methodology
2.1. Proposed Model
A vehicle quarter model is often used for ride characteristic studies. Most of the basic quarter vehicle models can be represented in the schematic diagram, shown in Figure 1. From Newton’s law, the dynamic equation of the spring mass damper is derived as follows [19,20]:
where m is the mass of the object, c is the damping coefficient, k is the spring stiffness, xn is the displacement of n body, is the velocity of n body, and is the acceleration of n body, respectively. In this context, x1 refers to vehicle, while x2 refers to vehicle sprung mass. Acceleration, velocity, and displacement consist of a direct relationship, where the conversion of each could be performed through integration or differentiation.
The vehicle suspension system assumed that the summation of forces, acting on both masses and integrating the accelerations of each mass, produce velocity, while the second integration gives the displacement of the masses. The assumptions could be formulated into the equation as follows:
The relative displacement between measured sprung and un-sprung masses is known as a working space. The working space of coil spring, q, could be derived as follows [21]:
The working space is also known as the range of displacement of the coil spring. The displacement of coil spring was expected to have a relationship with strain because of the variation in energy. The strain and displacement conversion of the system was established based on the elastic energy theory. Elastic energy is the potential mechanical energy stored in the configuration of a material, as work is performed to distort its volume and shape, where the equations of elastic potential energy could be stated as:
A typical elastic component for this formula is a coiled spring. A linear elastic performance of a spring is parameterized by spring constant, known as the spring rate. This constant is defined in Hooke’s Law and depends on the geometry, cross sectional area, pre-deformed length, and material properties. The spring constant is denoted as k and could be formulated as [22]:
where F is the force applied on the spring and x is the displacement of the spring. For each infinitesimal displacement, x, there is an infinitesimal transfer of energy into the spring. In general, elastic energy is linked to the Helmholtz potential per unit volume as a function of strain tensor components, as follows [23]:
where λ and μ are the Lamé elastic coefficients. The energy relationship between stretched length, Δl for a steel material, Young’s modulus, E, cross sectional area, Ao, initial length, lo, could be defined as:
where lo is the original length of the material and can be written as:
where U is the potential energy. The elastic potential energy per unit volume is given by:
where ε is the strain in the material and defined as:
Coil spring’s strain energy is related to its force deflection behaviour, according to Castigliano’s theorem, the deflection of a spring could be estimated through strain energy stored. The total strain energy for a helical spring is composed of torsional and shears, but the shear is quite negligible [24]. The total energy equation could be written as follows:
where T = , J = and G is shear modulus of the spring material.
where d is the wire diameter of spring material, D is the mean coil diameter, N is the number of active coil. The Castigliano’s theorem determines the displacements of a linear elastic system based on the partial derivatives of energy, and hence the deflection equation could be rewritten as follows:
Since the contribution of direct shear is negligible, the equation can be simplified into the following [24]:
According to Hooke’s Law in Equation (6), the stiffness of the spring could be derived as follows:
Substituting the spring stiffness, k into the potential energy equation, the spring parameter oriented potential energy equation could be obtained as follows:
By assuming that the spring parameter-oriented energy to strain-based elastic potential energy equation is in equilibrium, a new equation has been obtained as follows:
Equation (18) was then further simplified into form as below:
Equation (20) was produced from a combination of Equations (17) and (19) which was based on strain energy theory. It could be rewritten into strain form as follows:
Based on spring displacement and strain relationship, a conversion between strain and spring displacement was performed using this proposed elastic-energy model. According to the literature, spring stiffness and stress relationship has been widely applied in design [25]. For example, equivalent stiffness and stress relationship of coil spring was developed to approximate the multi-axial loadings, where strain and stress had a relationship referring to the elastic modulus [26]. This could be observed through a stress-strain analysis of coil spring using bi-material [27,28]. The analysis proposed the strain and displacement relationship of coil spring where the concept of potential energy was used.
2.2. Fatigue Life Assessment
In this analysis, the main task was to utilize the developed coil spring displacement to strain relationship to predict the fatigue life of a coil spring. The initial task is to perform conversion of acceleration-to-displacement, where the data collection from a vehicle was vital. The conversion of acceleration signal involved an experimental setup of a selected passenger vehicle in different road conditions. A single axis strain gauge and two accelerometers were used in this experimental data collection. A frontal coil spring of a 1300 cc sedan passenger car were selected as a case study vehicle, due to the common usage of this local manufacturer automobile. The details of acceleration to strain conversion process flow are shown in Figure 2. One of the accelerometers were attached on the top mount while another one was attached to the lower arm of the vehicle front suspension strut using strong adhesive glue. Meanwhile, the accelerometer attachments were examined to ensure the stability of measurement. The accelerometer setup for top mount and lower arm are shown in Figure 3a,b, respectively. On the other hand, a strain gauge was attached to the coil spring using adhesive glue for strain signal measurement as shown in Figure 4. The strain gauge was attached on the coil spring critical spot as proposed in [16]. Both strain gauge and accelerometers were connected to the data logger as shown in Figure 5 and the data loggers were then connected to a laptop for real time monitoring purposes. According to related literature [29], the sampling frequency for this application should be greater than 400 Hz to include all road-induced responses. Hence, the sampling frequency of 500 Hz was determined for this road measurement [30]. After setting up the measurement, the vehicle was driven over three different areas (urban, rural, and campus) for various road responses on spring data collection.
For signal processing, the collected acceleration signals were converted to velocity through single integration and integrated twice to obtain displacement time history. After the conversion of acceleration to displacement, the difference of displacement between top mount and lower arm was obtained through Equation (4). The difference, q was considered as the displacement of coil spring. Coil spring displacement was subsequently converted into strain with a developed relationship as described in Equation (19). Strain time histories were obtained through the calculation process and then used to predict the fatigue life of component using strain-life relationship. Prior to fatigue life calculation, the strain time histories were decomposed using the Rainflow cycle counting algorithm into simple stress reversals. The strain life approach was selected because it considered the crack initiation and propagation. In the automotive industry, components are designated to be replaced because they are considered as fail when a crack is initiated [31]. Hence, strain life approach is suitable for automotive applications, especially for steel-made components [32]. The Coffin-Manson strain life relationship can be mathematically defined as follows:
where εa is the total strain amplitude, is the fatigue strength coefficient, b is the fatigue strength exponent, is the fatigue ductility coefficient, c is the fatigue ductility exponent, E is the modulus of elasticity. The Coffin-Manson relationship does not take stress into consideration, hence, the Morrow and Smith-Watson-Topper (SWT) strain life models were further considered. The Morrow and SWT strain life models are listed respectively as below:
where σmax is the maximum stress and σmean is the mean stress. Subsequently, the fatigue life was calculated according to the Palmgren-Miner linear damage rule. The linear Palmgren-Miner rule is cited in [33]. The linear Miner’s rule is widely adopted in fatigue analysis due to its simplicity. Since the tolerance of fatigue analysis is high, this method is very safe and acceptable because the deviation was below 10% [34]. The fatigue life of the coil spring could be predicted with known material properties; steel alloy SAE 5160 is a type of carbon steel which is widely used in coil spring products, with the properties of the material shown in Table 1 [22,35]. With the material cyclic properties input, the fatigue life of the spring under various road conditions, based on the elastic-energy model, were estimated and compared to the measured strain signal predicted fatigue life.
3. Results and Discussions
Prior to strain generation, the vibration response of the coil spring, caused by strain amplitude, was studied. Since the acceleration consisted of zero time-varying mean, the strain data were also normalised to remove strain amplitudes with running mean value [16]. For strain life approaches, the Coffin-Manson strain life relationship did not take the mean stress effects into account. Nevertheless, this model considered cyclic strain hardening or softening of materials. To convert the acceleration into displacement, the time varying mean value of the vibration signal must be removed. With the existence of the mean value, acceleration signals were accumulated, and no displacement value could be observed. Through integration of acceleration signals over time, the displacement time histories of the spring were obtained [36]. The acceleration time histories of highway roads under top mount are shown in Figure 6, while the acceleration time histories of the lower arm are shown in Figure 7. Two different highway roads were adopted for data collection, named as Highway A and B according to the road classification. Although the vibration and strain signals were also collected from a highway road, each signal consisted of varying amplitude of strain and acceleration due to the random road surface roughness. On the other hand, the setup of accelerometer data acquisition position was based on the mechanism of a suspension system. An assumption has been made that the movement of a lower arm was regarded as motion of un-sprung mass, while the top mount was assumed as sprung mass vibration.
The most significance element in durability analysis is realistic strain signals generation. In this analysis, the strain time histories were generated by converting coil spring displacement measurement using the proposed elastic-energy formula. For the suspension strut displacement, the displacements of sprung mass and un-sprung mass were taken into consideration. It is noteworthy to mention that the displacement of a suspension strut is also known as the working space in vehicle design. The coil spring and damper were loaded for displacement measurements. The working space was considered during the suspension design stage to ensure that there was enough space for suspension deformation in order to avoid collision of suspension components [37,38]. The working space of this analysis was obtained by determining the difference between the sprung and un-sprung mass of the vehicle. Subsequently, the working space time histories were then transformed into strain using the elastic-energy relationship. The strain signals were obtained from the elastic-energy relationship as shown in Figure 8. The transformed strain time history consisted of total 90 s length which was the same as the original acceleration time history. Meanwhile, the actual collected spring strain signals from the highway road are shown in Figure 9. When comparing the elastic-energy derived and measured strain amplitude, the amplitude range was the same, at about 200 microstrain. The original strain signals were used to determine the fatigue life of the spring because it proposed the fatigue life results with acceptable accuracy. As observed, the elastic-energy converted strain signals were higher than the measured strain signals. This was due to the suspension system behaving non-linearly as the vehicle travelled on roads where roll and pitch occurs. In this case, the accelerometers used were uniaxial, which considered the movement in the vertical. Meanwhile, the attachment point of the lower arm accelerometer was close to the spring, which was also a limitation that could cause these deviations.
The strain and acceleration signals that were collected from road excitations usually possessed Gaussian characteristics as reported in [39]. Based on this concept, ISO 8608 suggested eight roughness levels of road surface profile under Gaussian stochastic processes [40]. Although stochastic processes mathematical models that followed a normal distribution were commonly used, the road profiles were not able to be accurately described by the stationary Gaussian model [41]. Furthermore, Chaika et al. [42] proved that in certain situations, the road surfaces are neither Gaussian nor stationary. Thus, measurements on various road surfaces were important for this strain elastic-energy model for validity. The rural area roads consisted of unpaved road surface and substantial numbers of potholes when compared to the smooth highway road. Hence, the rural road was contributing to automobile coil spring fatigue life reduction [43]. The acceleration signals of the top mount and lower arm from two selected rural measured roads are shown in Figure 10 and Figure 11, respectively. As observed, the accelerations of top mount were lower than the lower arm because the suspension spring and damper have partially filtered the ground transmitted vibrations. The elastic-energy model strain signals illustrated in Figure 12. The two selected rural roads are named as “Rural A” and “Rural B,” respectively, with the strain signals plotted into Figure 13 where the data were collected from two different areas. Even though these two roads were classified under a rural area, the road conditions were different, due to the different usage of heavy vehicles.
Additionally, the campus road of Universiti Kebangsaan Malaysia (UKM) was included in this analysis, due to its special curvy condition. The campus was built on a hill with many sharp turns and curves. The campus road also consisted of many speed bumps to slow down vehicles. However, the major difference of campus road and rural road was the curvy conditions, which caused a shifting of vehicle gravity towards the front and generated additional loads towards front suspension [44]. Hence, it was important to take the campus road into the fatigue analysis consideration, because the load shifting, due to the centre of gravity, changes. The collected acceleration signals of the top mount under a campus road are shown in Figure 14, while the lower arm acceleration time histories are shown in Figure 15. The elastic-energy model converted strain signals are illustrated in Figure 16, with the synchronized measurements of strain signals in Figure 17. Based on the observation on three types of road conditions, the highway road consisted of a less transient event where no sudden peak could be observed. The generated strain signals were observed to have the same trend where limited peak was detected in the signal. Meanwhile, a few critical peak occurrence for rural and campus road were observed because of the bump and pothole on the road surface. These peaks were identically detected from the elastic-energy model strain signals.
To study the characteristic of the signals, global statistic parameters were performed with the results shown in Table 2. As observed, the standard deviations of the elastic-energy and measured strains are within the same range. Meanwhile, all the strain signals consisted of kurtosis value above three. When the kurtosis values were above three, the signals were classified as non-Gaussian [45]. To validate the predicted fatigue life, the elastic-energy and measured strain signals were used as input to Coffin-Manson strain life relationship with material cyclic properties. For Coffin-Manson fatigue life prediction, the predicted fatigue lives are shown in Table 3 which indicated that under highway road excitation, the spring possessed higher fatigue life than other road conditions, due to the smooth road surface roughness. Meanwhile, the rural and campus road induced coil spring fatigue lives in the range of 1.98 × 10⁵ to 1.25 × 10⁶ blocks to failure. The fatigue results have revealed that both the road conditions generate a similar range of life because the collected strain signals have the same statistical properties. For Morrow and SWT models prediction, the predicted fatigue lives are plotted into Table 4 and Table 5, respectively. The Morrow and SWT models predicted fatigue lives have shown a same trend with the Coffin-Manson relationship, where the highway road induced strain signals provided the highest fatigue life.
Subsequently, the correlation between elastic-energy and strain measured fatigue lives were performed using scatter band as shown in Figure 18. Based on the 1:2 or 2:1 correlation graph, the elastic-energy model converted fatigue life during rural and campus road excitations have a good correlation. However, the highway-based strain signal predicted fatigue lives did not correlate well with the elastic-energy model estimations for all three strain life approaches. All two points were distributed beyond the 1:2 or 2:1 boundary. For the vehicle travelled on the highway road, the displacement of spring was small, which led to small amplitude strain data and high fatigue life. These small amplitude segments did not contribute much to fatigue damage which led to the deviation of predictions [46]. The deviated fatigue life has become a limitation of the energy-based model where extreme small strain value did not provide good fatigue life estimation.
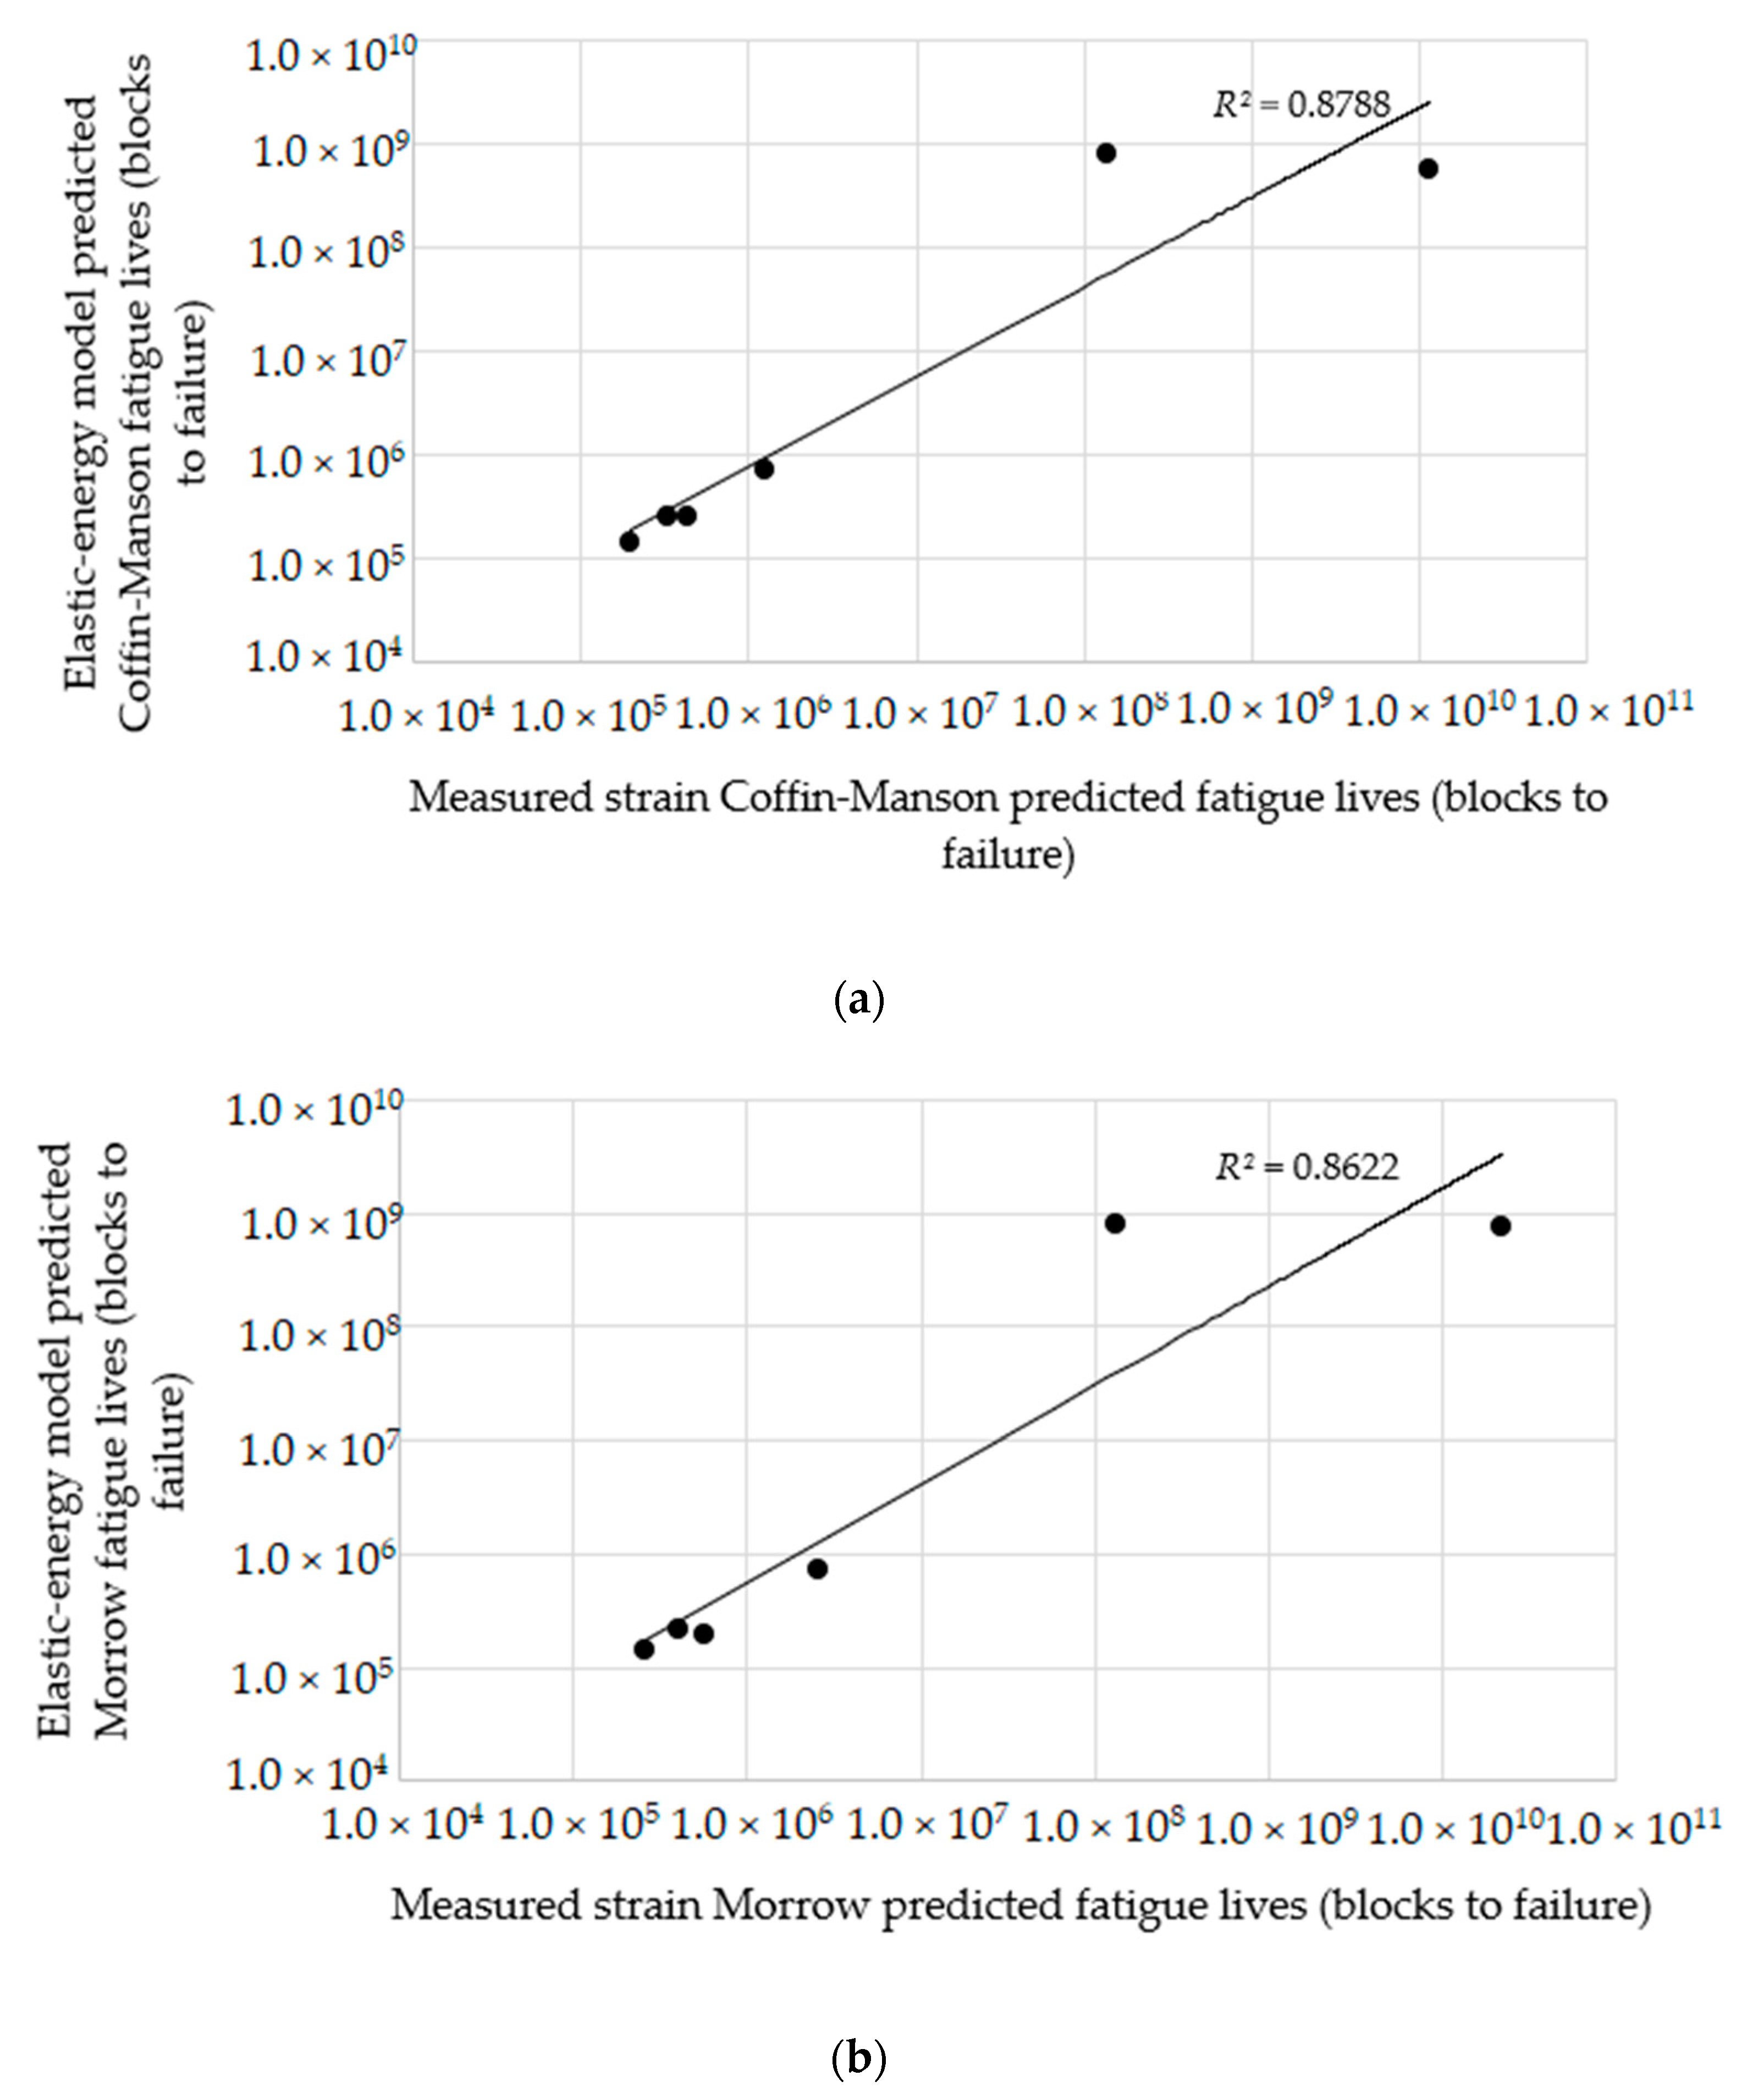
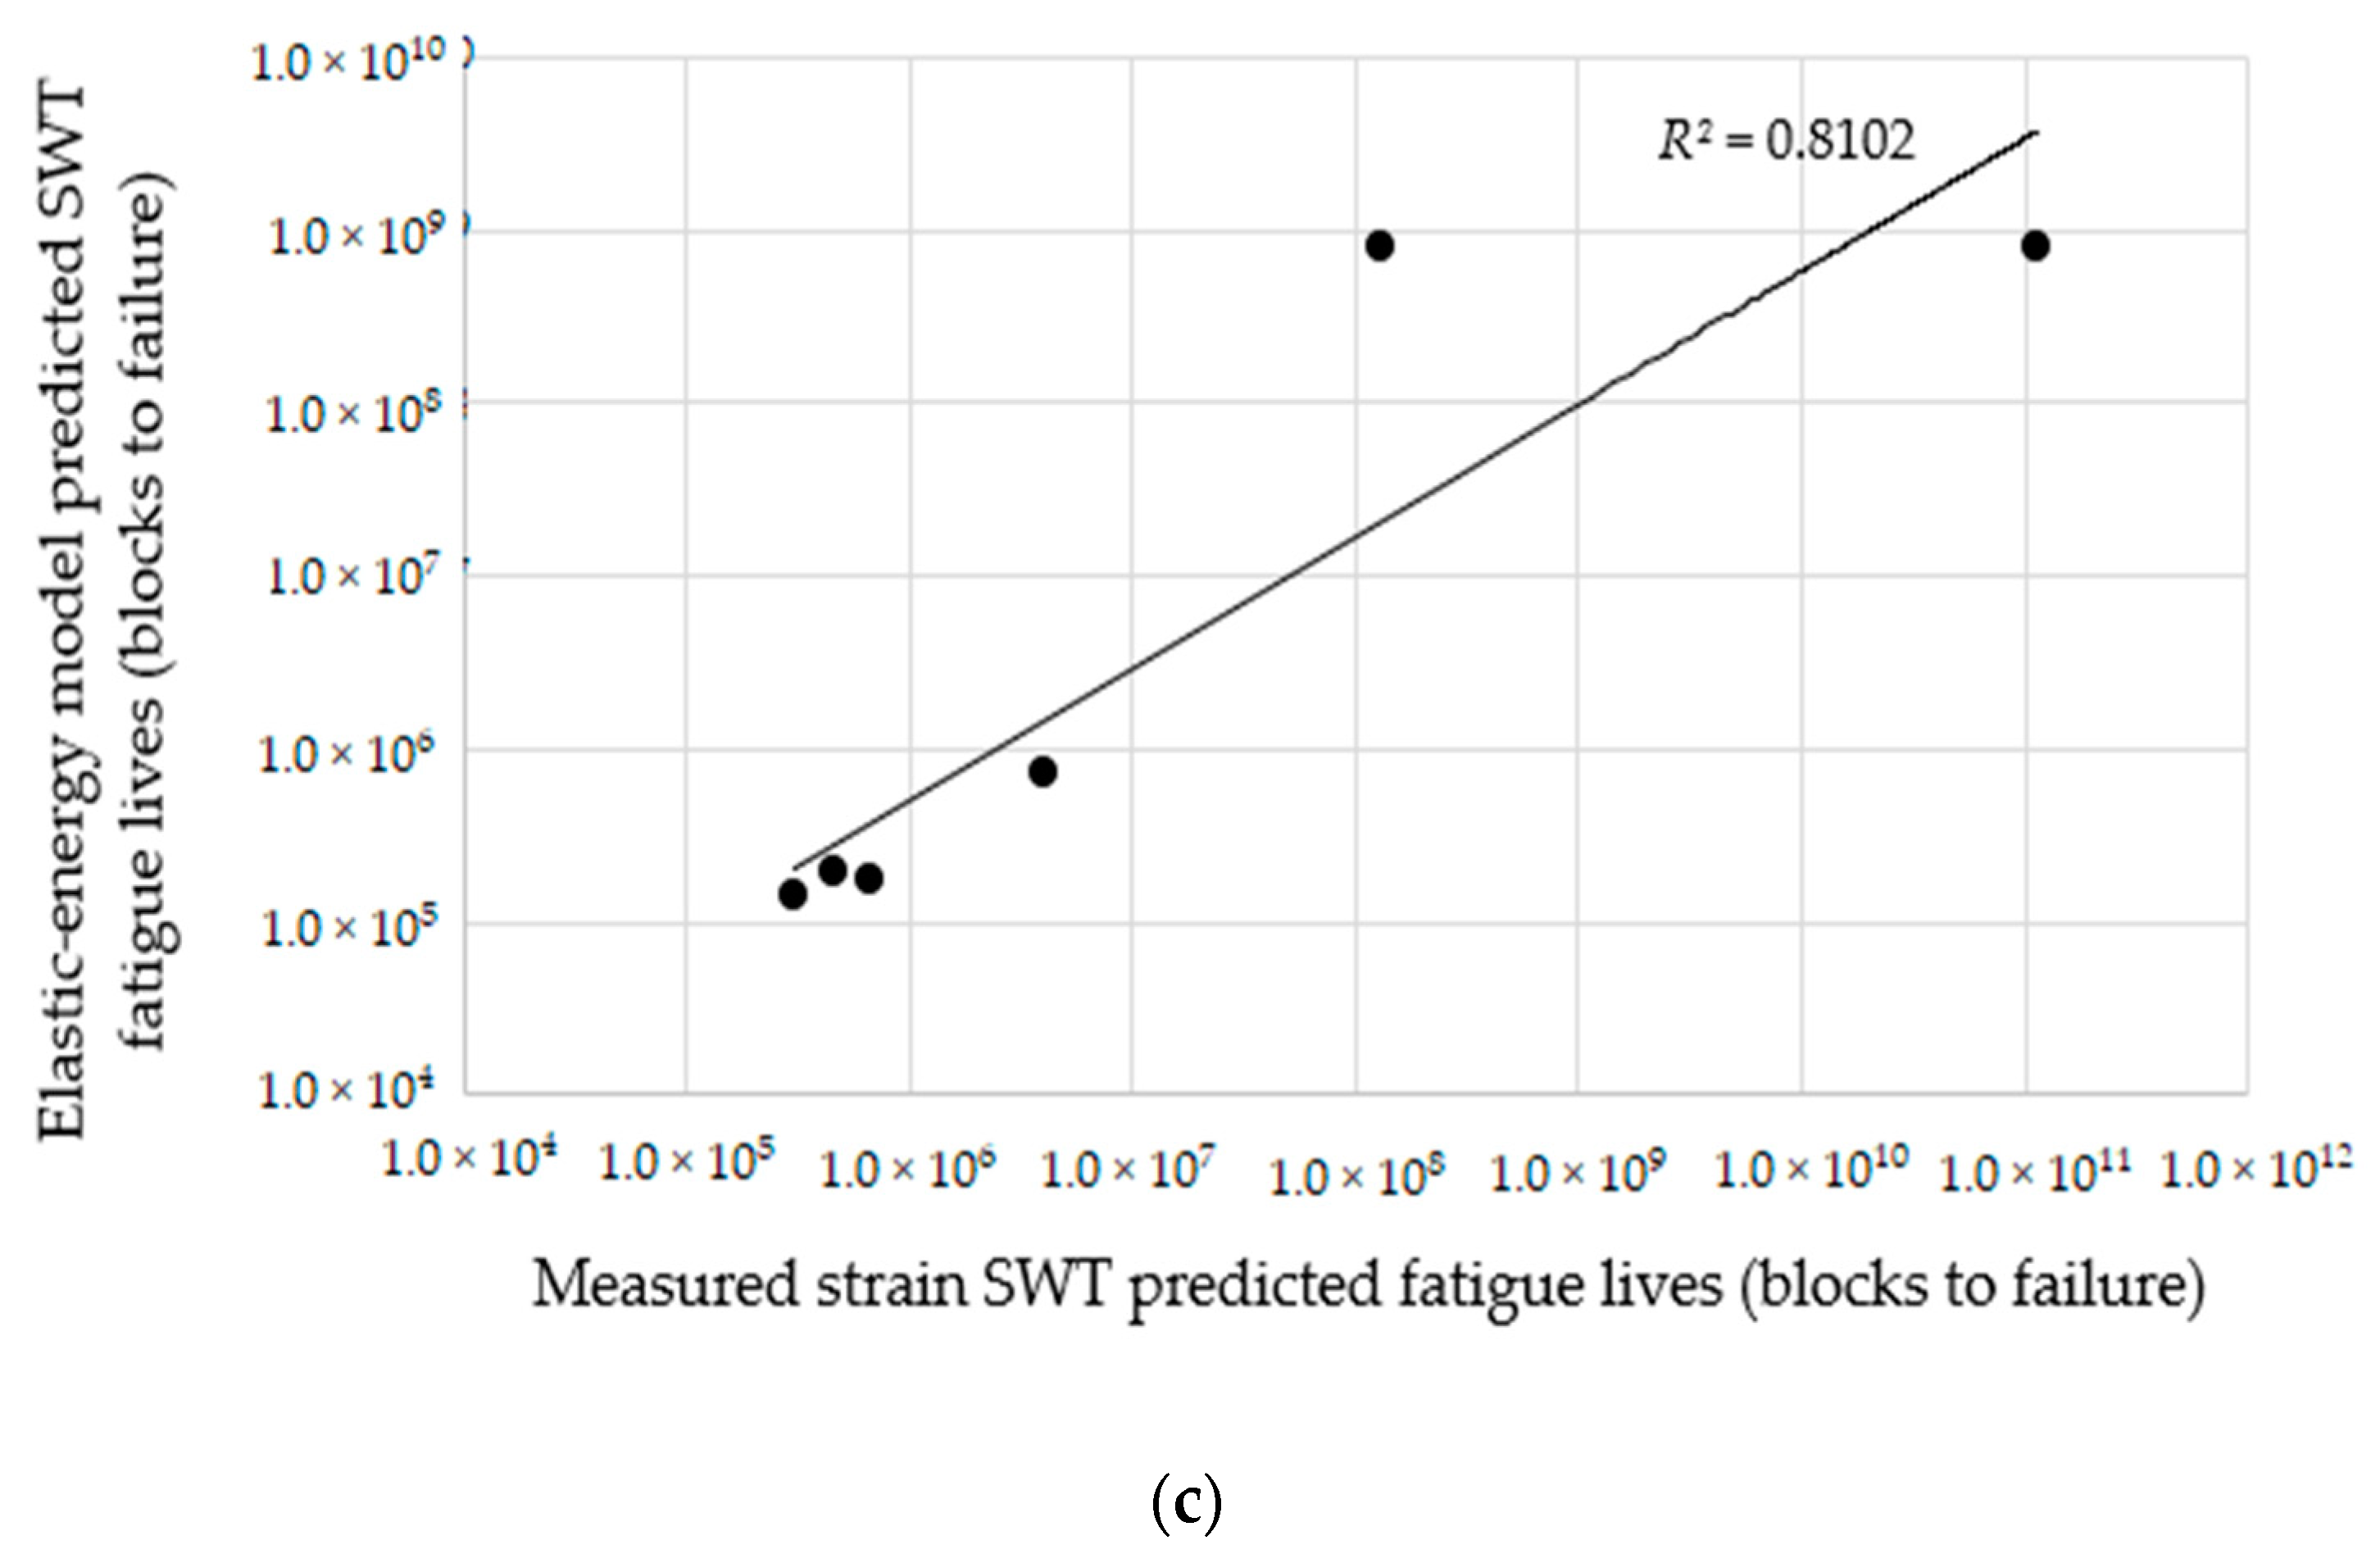
To quantify the correlation between the elastic-energy model and measured strain predicted fatigue lives, power law correlation was applied to evaluate the fatigue life data for three strain life approaches, as shown in Figure 19. In Figure 19a, the elastic energy and measured strain predicted fatigue life using Coffin-Manson method has shown a coefficient of determination (R2) value of 0.8788. On the other hand, the R2 value using Morrow model was 0.8622 and SWT model showed an R2 value of 0.8102. According to Sivak and Ostegova [47], when a R2 value for fatigue analysis was above 0.80, the correlation was considered as good. Hence, it suggested that the elastic-energy model was suitable for fatigue life predictions. Additionally, the Coffin-Manson approach has shown the highest R2 value which proposed that the mean stress models were less effective in the application of converted strain signals.
Although there were limitations in the low amplitude strain signals, the elastic-energy model still provided a close prediction for most of the fatigue life predictions. With the discovery of past and current research, the fatigue strain data could be developed via this proposed elastic-energy model. The analysis of strain data in the automotive industry is challenging and significant because each of the data is long and valuable [48,49]. Hence, the development of a durability model has been aggressively performed, such as regression models for fatigue life prediction [50]. More recently, strain data was also generated through a multi-body dynamics model for automotive suspension fatigue analysis [16]. However, the generation of strain signal through simulation could be deficient due to a large quantity of suspension kinematic data and linkage properties. In addition, the proposed elastic-energy model considers the torsional and surface tension of coil spring when performing strain generation. This research may significantly reduce the required testing equipment, such as strain gauges and data logger for automotive suspension component fatigue life prediction.
4. Conclusions
An elastic material energy and spring potential elastic-energy relationship for acceleration-displacement-strain signal conversion has been proposed. The elastic-energy-based model converted the acceleration into strain data for predicting fatigue life of an automobile coil spring. The elastic-energy model generated strain signals consisting of statistical properties in the same range, with measured data of predicted fatigue lives ranging from 1.37 × 10⁵ to 8.13 × 10⁸ blocks to failure. The fatigue lives were well correlated with the measured strain predicted fatigue lives. Based on the scatter band analysis, most of the fatigue lives were distributed within the acceptable boundary, but the highway-based strain signals predicted fatigue lives have deviated from the boundary due to the existence of a low amplitude strain. Hence, it suggested that this developed elastic-energy model for spring fatigue life prediction could be used to predict coil spring fatigue life with acceptable accuracy. This proposed model serves to shorten the fatigue analysis process of automotive suspension coil spring through realistic strain data generation.
Author Contributions
Y.S.K. conducted the simulation, analysis, and writing under the supervision of S.A. and D.S.; M.Z.O. and S.M.H. provided guidance on the manuscript writing.
Funding
This research received no external funding.
Acknowledgments
The authors wish to acknowledge Universiti Kebangsaan Malaysia research grant (FRGS/1/2015/TK03/UKM/01/2) for the research funding.
Conflicts of Interest
The authors declare no conflict of interest.
References
- Ferreira, C.; Ventura, P.; Morais, R.; Valente, A.L.G.; Neves, C.; Reis, M.C. Sensing methodologies to determine automotive damper condition under vehicle normal operation. Sens. Actuators A Phys. 2009, 156, 237–244. [Google Scholar] [CrossRef]
- Yang, X.; Wang, Z.; Peng, W. Coordinated control of AFS and DYC for vehicle handling and stability based on optimal guaranteed cost theory. Veh. Syst. Dyn. 2009, 47, 57–79. [Google Scholar] [CrossRef]
- Kong, Y.S.; Omar, M.Z.; Chua, L.B.; Abdullah, S. Ride quality assessment of bus suspension system through modal frequency response approach. Adv. Mech. Eng. 2014, 6, 269721. [Google Scholar] [CrossRef]
- Kong, Y.S.; Abdullah, S.; Schramm, D.; Omar, M.Z.; Haris, S.M. Generation of artificial road profile for automobile spring durability analysis. Jurnal Kejuruteraan 2018, 30, 123–128. [Google Scholar]
- Bridgelall, R.; Huang, Y.; Zhang, Z.; Deng, F. Precision enhancement of pavement roughness localization with connected vehicles. Meas. Sci. Technol. 2016, 27, 025012. [Google Scholar] [CrossRef] [Green Version]
- Tamboli, J.A.; Joshi, S.G. Optimum design of a passive suspension system of a vehicle subjected to actual random road excitations. J. Sound Vib. 1999, 219, 193–205. [Google Scholar] [CrossRef]
- Xu, K.; Wu, Y.; Wu, C.Q. Development of vibration loading profiles for accelerated durability tests of ground vehicles. In Proceedings of the 4th Annual Dynamic Systems and Control Conference, Arlington, VA, USA, 31 October–2 November 2011. [Google Scholar]
- Shafiullah, A.K.M.; Wu, Q. Generation and validation of loading profiles for highly accelerated durability tests of ground vehicle components. Eng. Fail. Anal. 2013, 33, 1–16. [Google Scholar] [CrossRef]
- Halfpenny, A.; Kihm, F. Mission profiling and test synthesis based on fatigue damage spectrum. In Proceedings of the FT342 Ninth International Fatigue Congress, Atlanta, GA, USA, 14–19 May 2006. [Google Scholar]
- Fauriat, W.; Mattrand, C.; Gayton, N.; Beakou, A.; Cembrzynski, T. Estimation of road profile variability from measured vehicle responses. Veh. Syst. Dyn. 2016, 54, 585–605. [Google Scholar] [CrossRef]
- Bogsjo, K.; Podgorski, K.; Rchlik, I. Models for road surface roughness. Veh. Syst. Dyn. 2012, 50, 725–747. [Google Scholar] [CrossRef]
- Lepine, J.; Rouillard, V.; Sek, M. Evaluation of machine learning algorithms for detection of road induced shocks buried in vehicle vibration signals. Proc. Inst. Mech. Eng. Part D J. Autom. Eng. 2018. [Google Scholar] [CrossRef]
- Patil, K.S.; Jagtap, V.; Jadhav, S.; Bhosale, A.; Kedar, B. Performance evaluation of active suspension for passenger cars using Matlab. IOSR J. Mech. Civ. Eng. 2013, 2, 6–14. [Google Scholar]
- Fayyad, S.M. Constructing control system for active suspension system. Contemp. Eng. Sci. 2012, 5, 189–200. [Google Scholar]
- Marzbanrad, J.; Mohammadi, M.; Mostaani, M. Optimization of a passive vehicle suspension system for ride comfort enhancement with different speeds based on design of experiment (DOE) method. J. Mech. Eng. Res. 2013, 5, 50–59. [Google Scholar] [CrossRef]
- Kong, Y.S.; Abdullah, S.; Schramm, D.; Omar, M.Z.; Haris, S.M. Vibration fatigue analysis of carbon steel coil spring under various road excitations. Metals 2018, 8, 617. [Google Scholar] [CrossRef]
- Abdullah, S.; Giacomin, J.A.; Yates, J.R. A mission synthesis algorithm for fatigue damage analysis. Proc. Inst. Mech. Eng. Part D J. Autom. Eng. 2004, 218, 243–258. [Google Scholar] [CrossRef]
- Feng, L.; Lin, G.; Zhang, W.; Pang, H.; Wang, T. Design and optimization of a self-decoupled six-axis wheel force transducer for a heavy truck. Proc. Inst. Mech. Eng. Part D J. Autom. Eng. 2015, 229, 1585–1610. [Google Scholar] [CrossRef]
- Qaji, A.J.; Silva, C.W.; Khan, A.; Khan, M.T. Performance analysis of a semiactive suspension system with particle swarm optimization and fuzzy logic control. Sci. World J. 2014, 2014, 174102. [Google Scholar]
- Kamalakannan, K.; ElayaPerumal, A.; Mangalaraman, S.; Arunachalam, K. Performance analysis and behaviour characteristic of CVD (semi active) in quarter car model. Jordan J. Mech. Ind. Eng. 2011, 5, 261–265. [Google Scholar]
- Mastinu, G.; Gobbi, M.; Miano, C. Optimal Design of Complex Mechanical Systems: With Applications to Vehicle Engineering; Springer: Berlin, Germany, 2006. [Google Scholar]
- Gonzales, M.A.C.; Barrios, D.B.; de Lima, N.B.; Goncalves, E. Importance of considering a material micro-failure criterion in the numerical modelling of the shot peening process applied to parabolic leaf spring. Lat. Am. J. Solids Struct. 2010, 7, 21–40. [Google Scholar]
- Bennett, K.C.; Regueiro, R.A.; Borja, R.I. Finite strain elastoplasticity considering the Eshelby stress for materials undergoing plastic volume change. J. Plast. 2016, 77, 214–245. [Google Scholar] [CrossRef] [Green Version]
- Graham Kelly, S. Mechanical Vibrations: Theory and Application; Cengage Learning: Boston, MA, USA, 2012. [Google Scholar]
- Zhao, H.; Bi, S. Stiffness and stress characteristics of the generalized cross-spring pivot. Mech. Mach. Theory 2010, 45, 378–391. [Google Scholar] [CrossRef]
- Keller, S.G.; Gordon, A.P. Equivalent stress and strain distribution in compression springs subjected to bending. J. Strain Anal. Eng. Des. 2011, 46, 405–415. [Google Scholar] [CrossRef]
- Dragoni, E.; Bagaria, W.J. Numerical and experimental validation of a theoretical model for biomaterial helical springs. J. Strain Anal. Eng. Des. 2011, 48, 166–176. [Google Scholar] [CrossRef]
- Dragoni, E.; Bagaria, W.J. Mechanical design of bimaterial helical springs with circular cross-section. J. Strain Anal. Eng. Des. 2011, 46, 304–314. [Google Scholar] [CrossRef]
- Ilic, S. Methodology of Evaluation of In-Service Load Applied to the Output Shaft of Automatic Transmission. Ph.D. Thesis, The University of New South Wales, Sydney, Australia, 2006. [Google Scholar]
- Haiba, M.; Barton, D.C.; Brooks, P.C.; Levesley, M.C. The development of an optimisation algorithm based on fatigue life. Int. J. Fatigue 2003, 25, 299–310. [Google Scholar] [CrossRef]
- Jiang, R.; Murthy, D.N.P. A study of Weibull shape parameter: Properties and significance. Reliab. Eng. Syst. Saf. 2011, 96, 1619–1626. [Google Scholar] [CrossRef]
- Curiel, F.F.; Ambriz, R.R.; García, M.A.; Ramírez, M.C.; García, S. Smith Watson and Topper model in the determination of the fatigue life of an automotive steel. In Proceedings of the 17th International Conference on New Trends in Fatigue and Fracture, Lisbon, Portugal, 17–20 July 2018. [Google Scholar]
- Peng, Z.; Huang, H.Z.; Zhou, J.; Li, Y.F. A new cumulative fatigue damage rule based on dynamic residual S-N curve and material memory concept. Metals 2018, 8, 456. [Google Scholar] [CrossRef]
- Fernández-Canteli, A.; Blasón, S.; Correia, J.A.F.O.; de Jesus, A.M.P. A probabilistic interpretation of the Miner number for fatigue life prediction. Frattura ed Integrità Strutturale 2014, 30, 327–339. [Google Scholar] [CrossRef]
- Kuttler, K.L.; Shillor, M. Dynamic bilateral contact with discontinuous friction coefficient. Nonlinear Anal. Theory Methods Appl. 2001, 45, 309–327. [Google Scholar] [CrossRef]
- Kong, Y.S.; Abdullah, S.; Schramm, D.; Omar, M.Z.; Haris, S.M.; Bruckmann, T. The need to generate a force time history towards life assessment of a coil spring. J. Mech. Eng. 2017, 4, 11–26. [Google Scholar]
- Valsange, P.S. Design of helical coil compression spring: A review. Int. J. Eng. Res. Appl. 2012, 2, 513–522. [Google Scholar]
- Shirahatti, A.; Prasad, P.S.S.; Panzade, P.; Kulkarni, M.M. Optimal design of passenger car suspension ride and road holding. J. Braz. Soc. Mech. Sci. Eng. 2008, 30, 66–76. [Google Scholar] [CrossRef]
- International Organization for Standardization. Mechanical Vibration—Road Surface Profiles—Reporting of Measured Data; ISO 8608; International Organization for Standardization: Geneva, Switzerland, 1995; p. 30. [Google Scholar]
- International Organization for Standardization. Reporting Vehicle Road Surface Irregularities; Technical Report ISO/TC108/SC2/WG4 N57; International Organization for Standardization: Geneva, Switzerland, 1982. [Google Scholar]
- Bogsjo, K.; Rychlik, I. Vehicle fatigue damage caused by road irregularities. Fatigue Fract. Eng. Mater. Struct. 2009, 32, 391–402. [Google Scholar] [CrossRef]
- Chaika, M.; Gorsich, D.; Sun, T.C. Some statistical tests in the study of terrain modelling. Int. J. Veh. Des. 2004, 36, 132. [Google Scholar] [CrossRef]
- Kong, Y.S.; Omar, M.Z.; Abdullah, S.; Chua, L.B. Fatigue life prediction of parabolic leaf spring under various road conditions. Eng. Fail. Anal. 2014, 46, 92–103. [Google Scholar] [CrossRef]
- Al Emran Hasan, M.M.; Ektesabi, M.; Kapoor, A. Fuzzy Logic Controller in an Electric Vehicle with Dynamically Changing Centre of Gravity. In Proceedings of the IEEE International Conference on Sustainable Energy Technologies (ICSET), Kandy, Sri Lanka, 6–9 December 2010; pp. 1–6. [Google Scholar]
- Chen, X. Analysis of Crosswind Fatigue of Wind-Excited Structures with Nonlinear Aerodynamic Damping. Eng. Struct. 2014, 74, 145–156. [Google Scholar] [CrossRef]
- Runciman, A.; Xu, D.; Pelton, A.R.; Ritchie, R.O. An equivalent strain/Coffin-Manson approach to multiaxial fatigue and life prediction in superelastic Nitinol medical devices. Biomaterials 2011, 32, 4987–4993. [Google Scholar] [CrossRef]
- Sivák, P.; Ostertagová, E. Evaluation of fatigue tests by means of mathematical statistics. Procedia Eng. 2012, 48, 636–642. [Google Scholar] [CrossRef]
- Kim, J.; Lei, L.P.; Kang, B.S. Preform design in hydroforming of automobile lower arm by FEM. J. Mater. Process. Technol. 2003, 138, 58–62. [Google Scholar] [CrossRef]
- Bartolozzi, R.; Frendo, F. Stiffness and strength aspects in the design of automotive coil springs for Mcpherson front suspensions: A case study. Proc. Inst. Mech. Eng. Part D J. Autom. Eng. 2011, 225, 1377–1391. [Google Scholar] [CrossRef]
- Kong, Y.S.; Abdullah, S.; Schramm, D.; Omar, M.Z.; Haris, S.M. Development of multiple linear regression-based models for fatigue life evaluation of automotive coil springs. Mech. Syst. Signal Process. 2019, 118, 675–695. [Google Scholar] [CrossRef]
Figure 1.
Schematic diagram of vehicle frontal suspension.

Figure 2.
Process flow of acceleration-strain conversion.
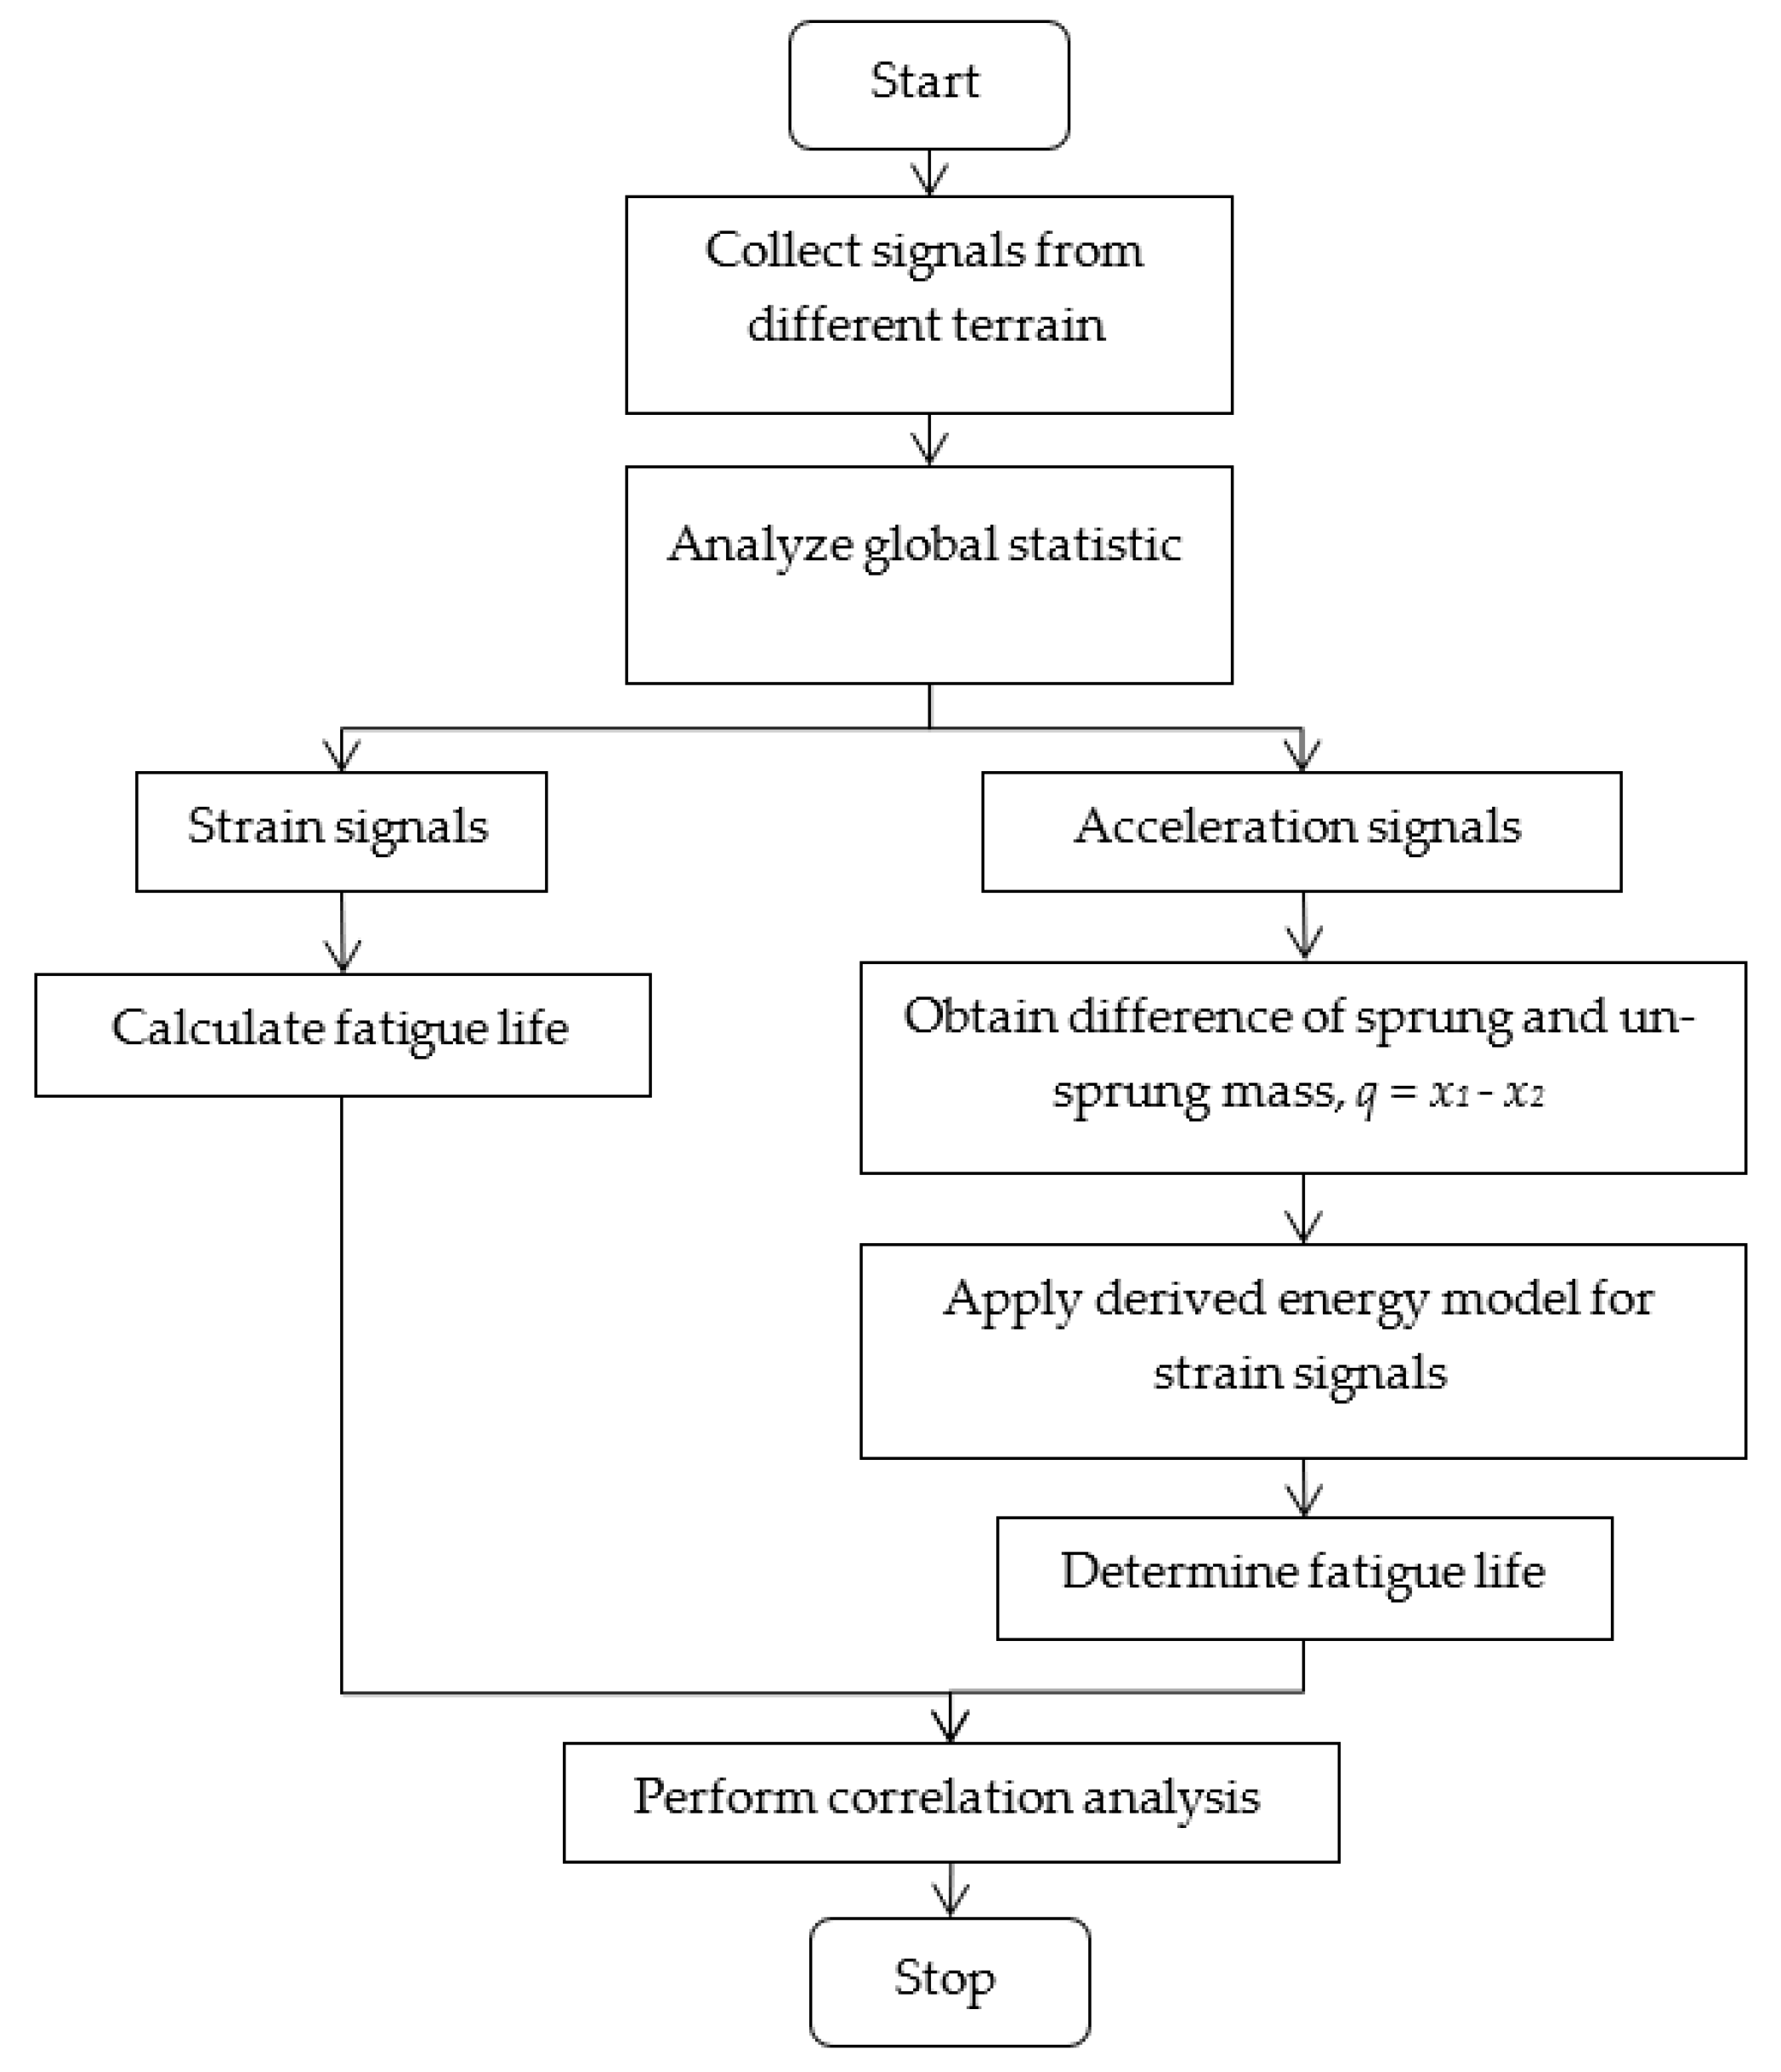
Figure 3.
Accelerometer setup: (a) Top mount, (b) lower arm.
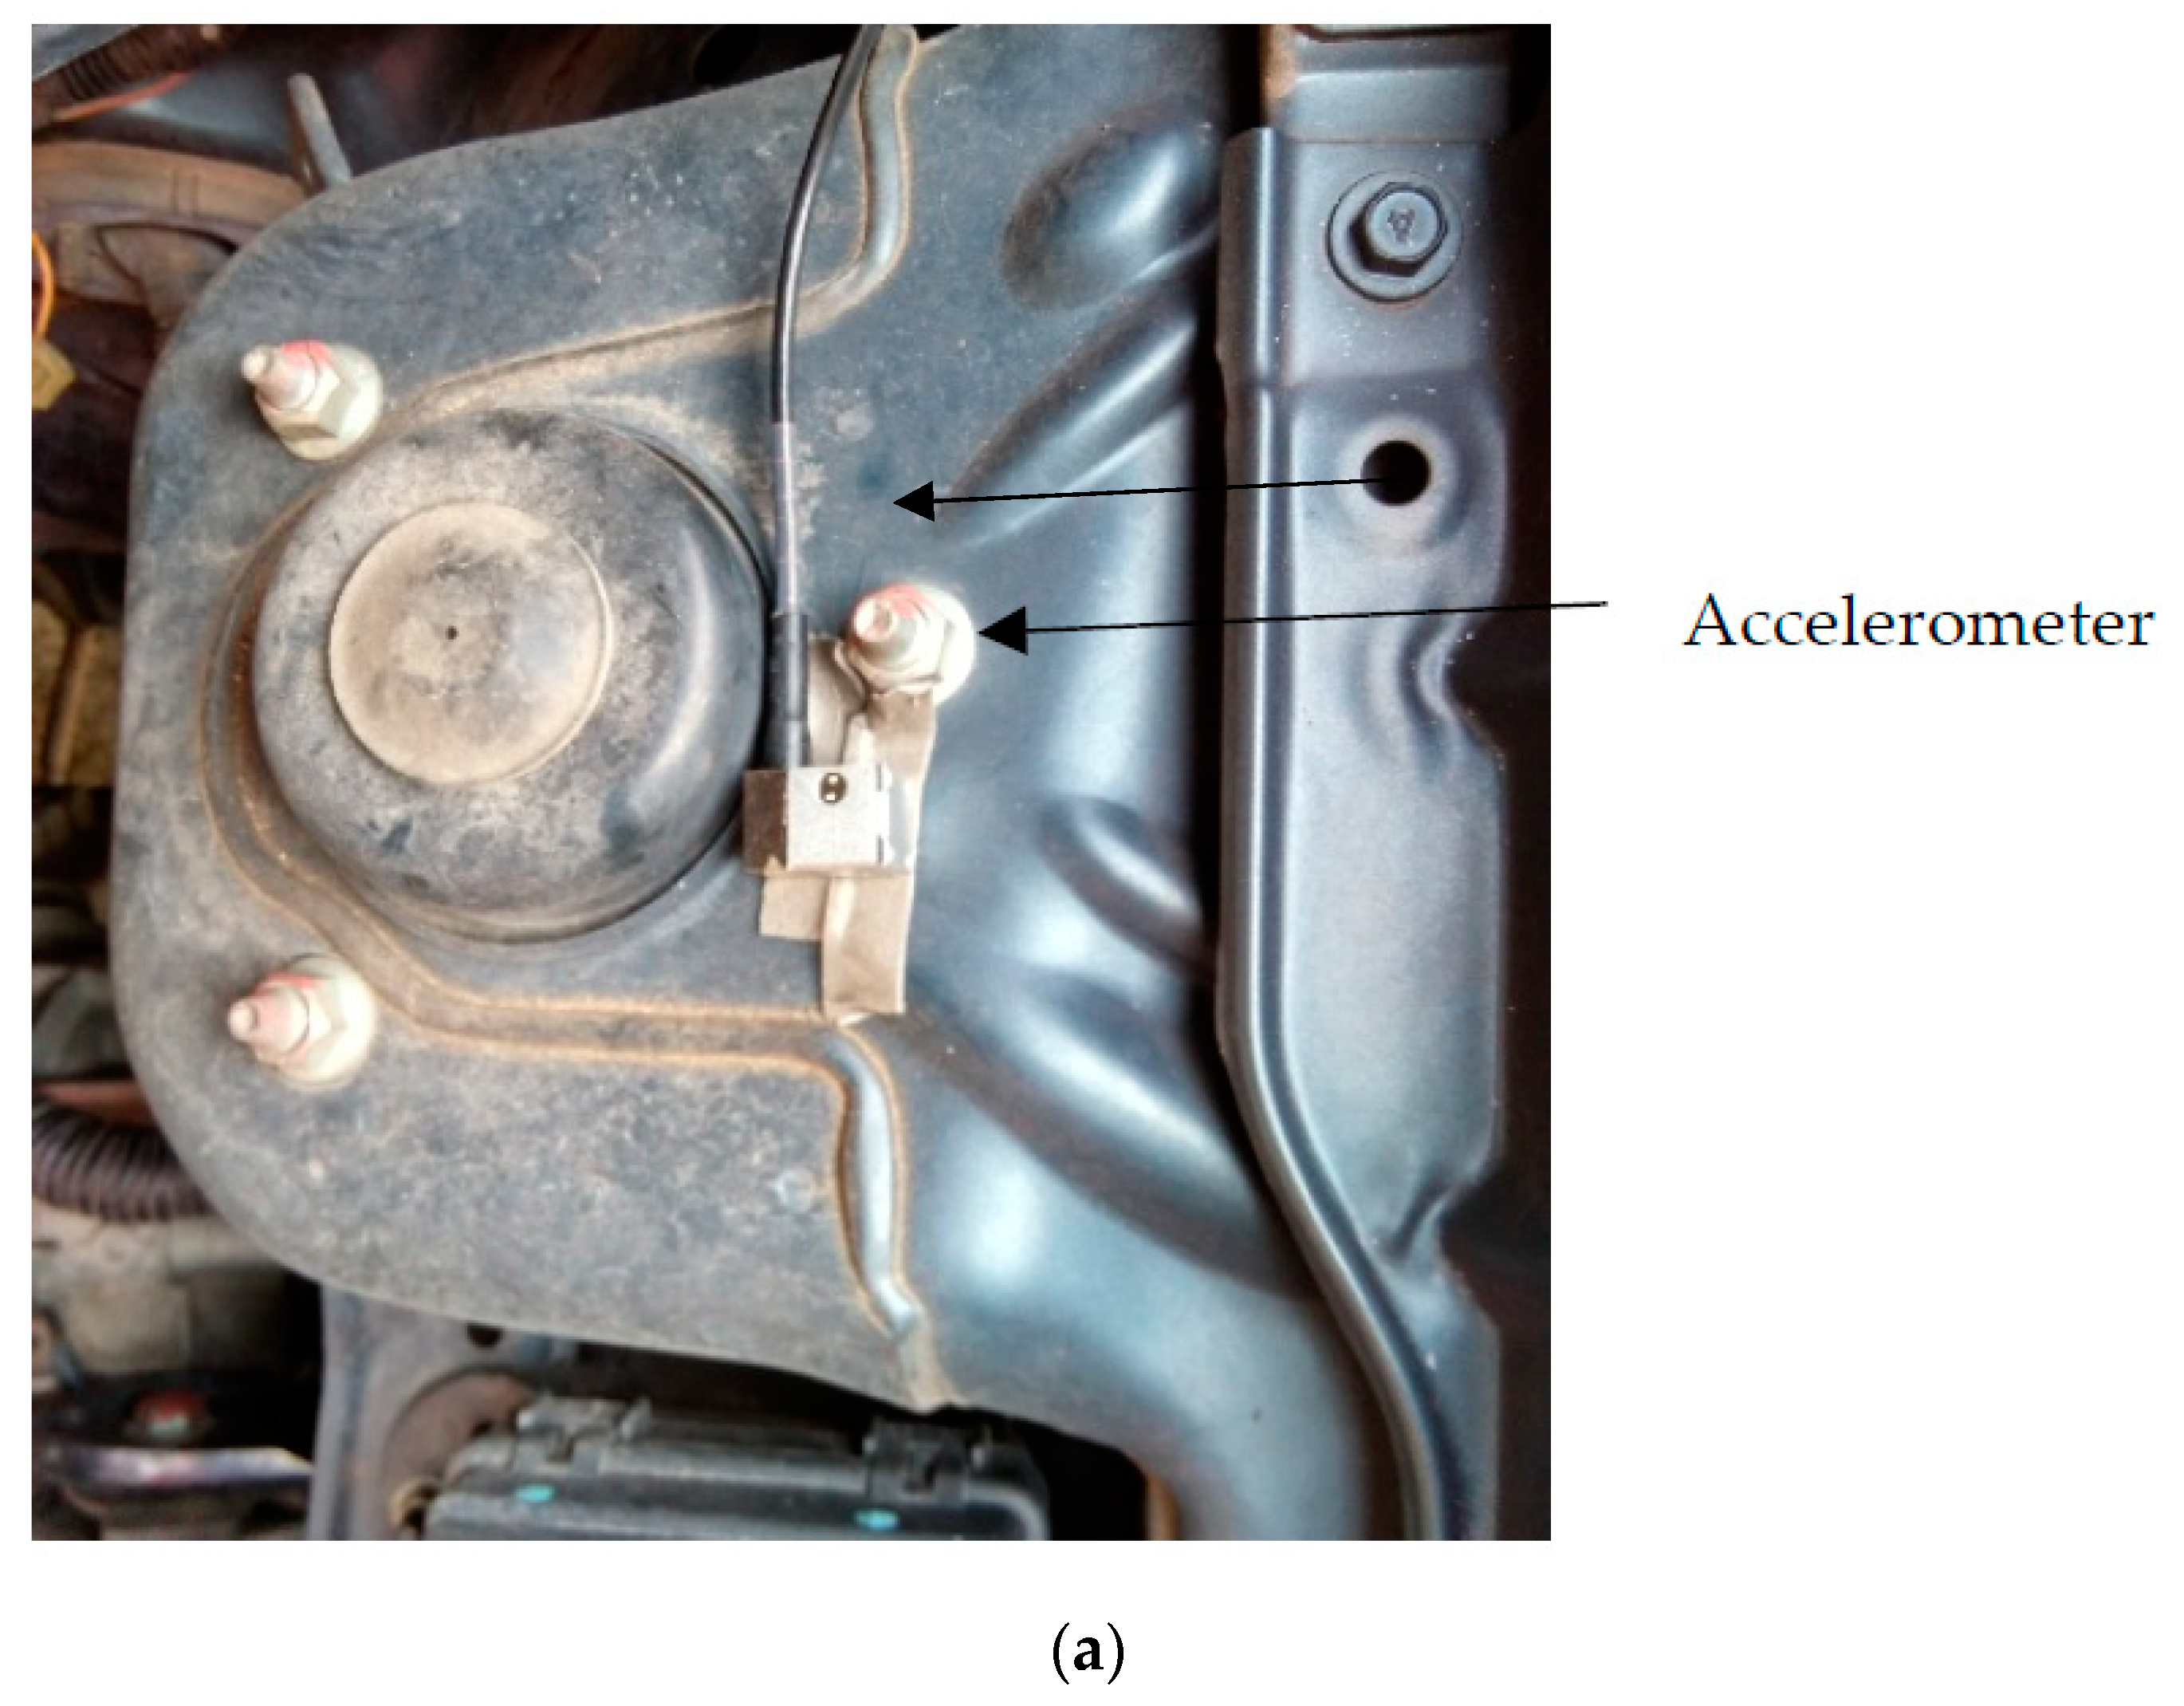
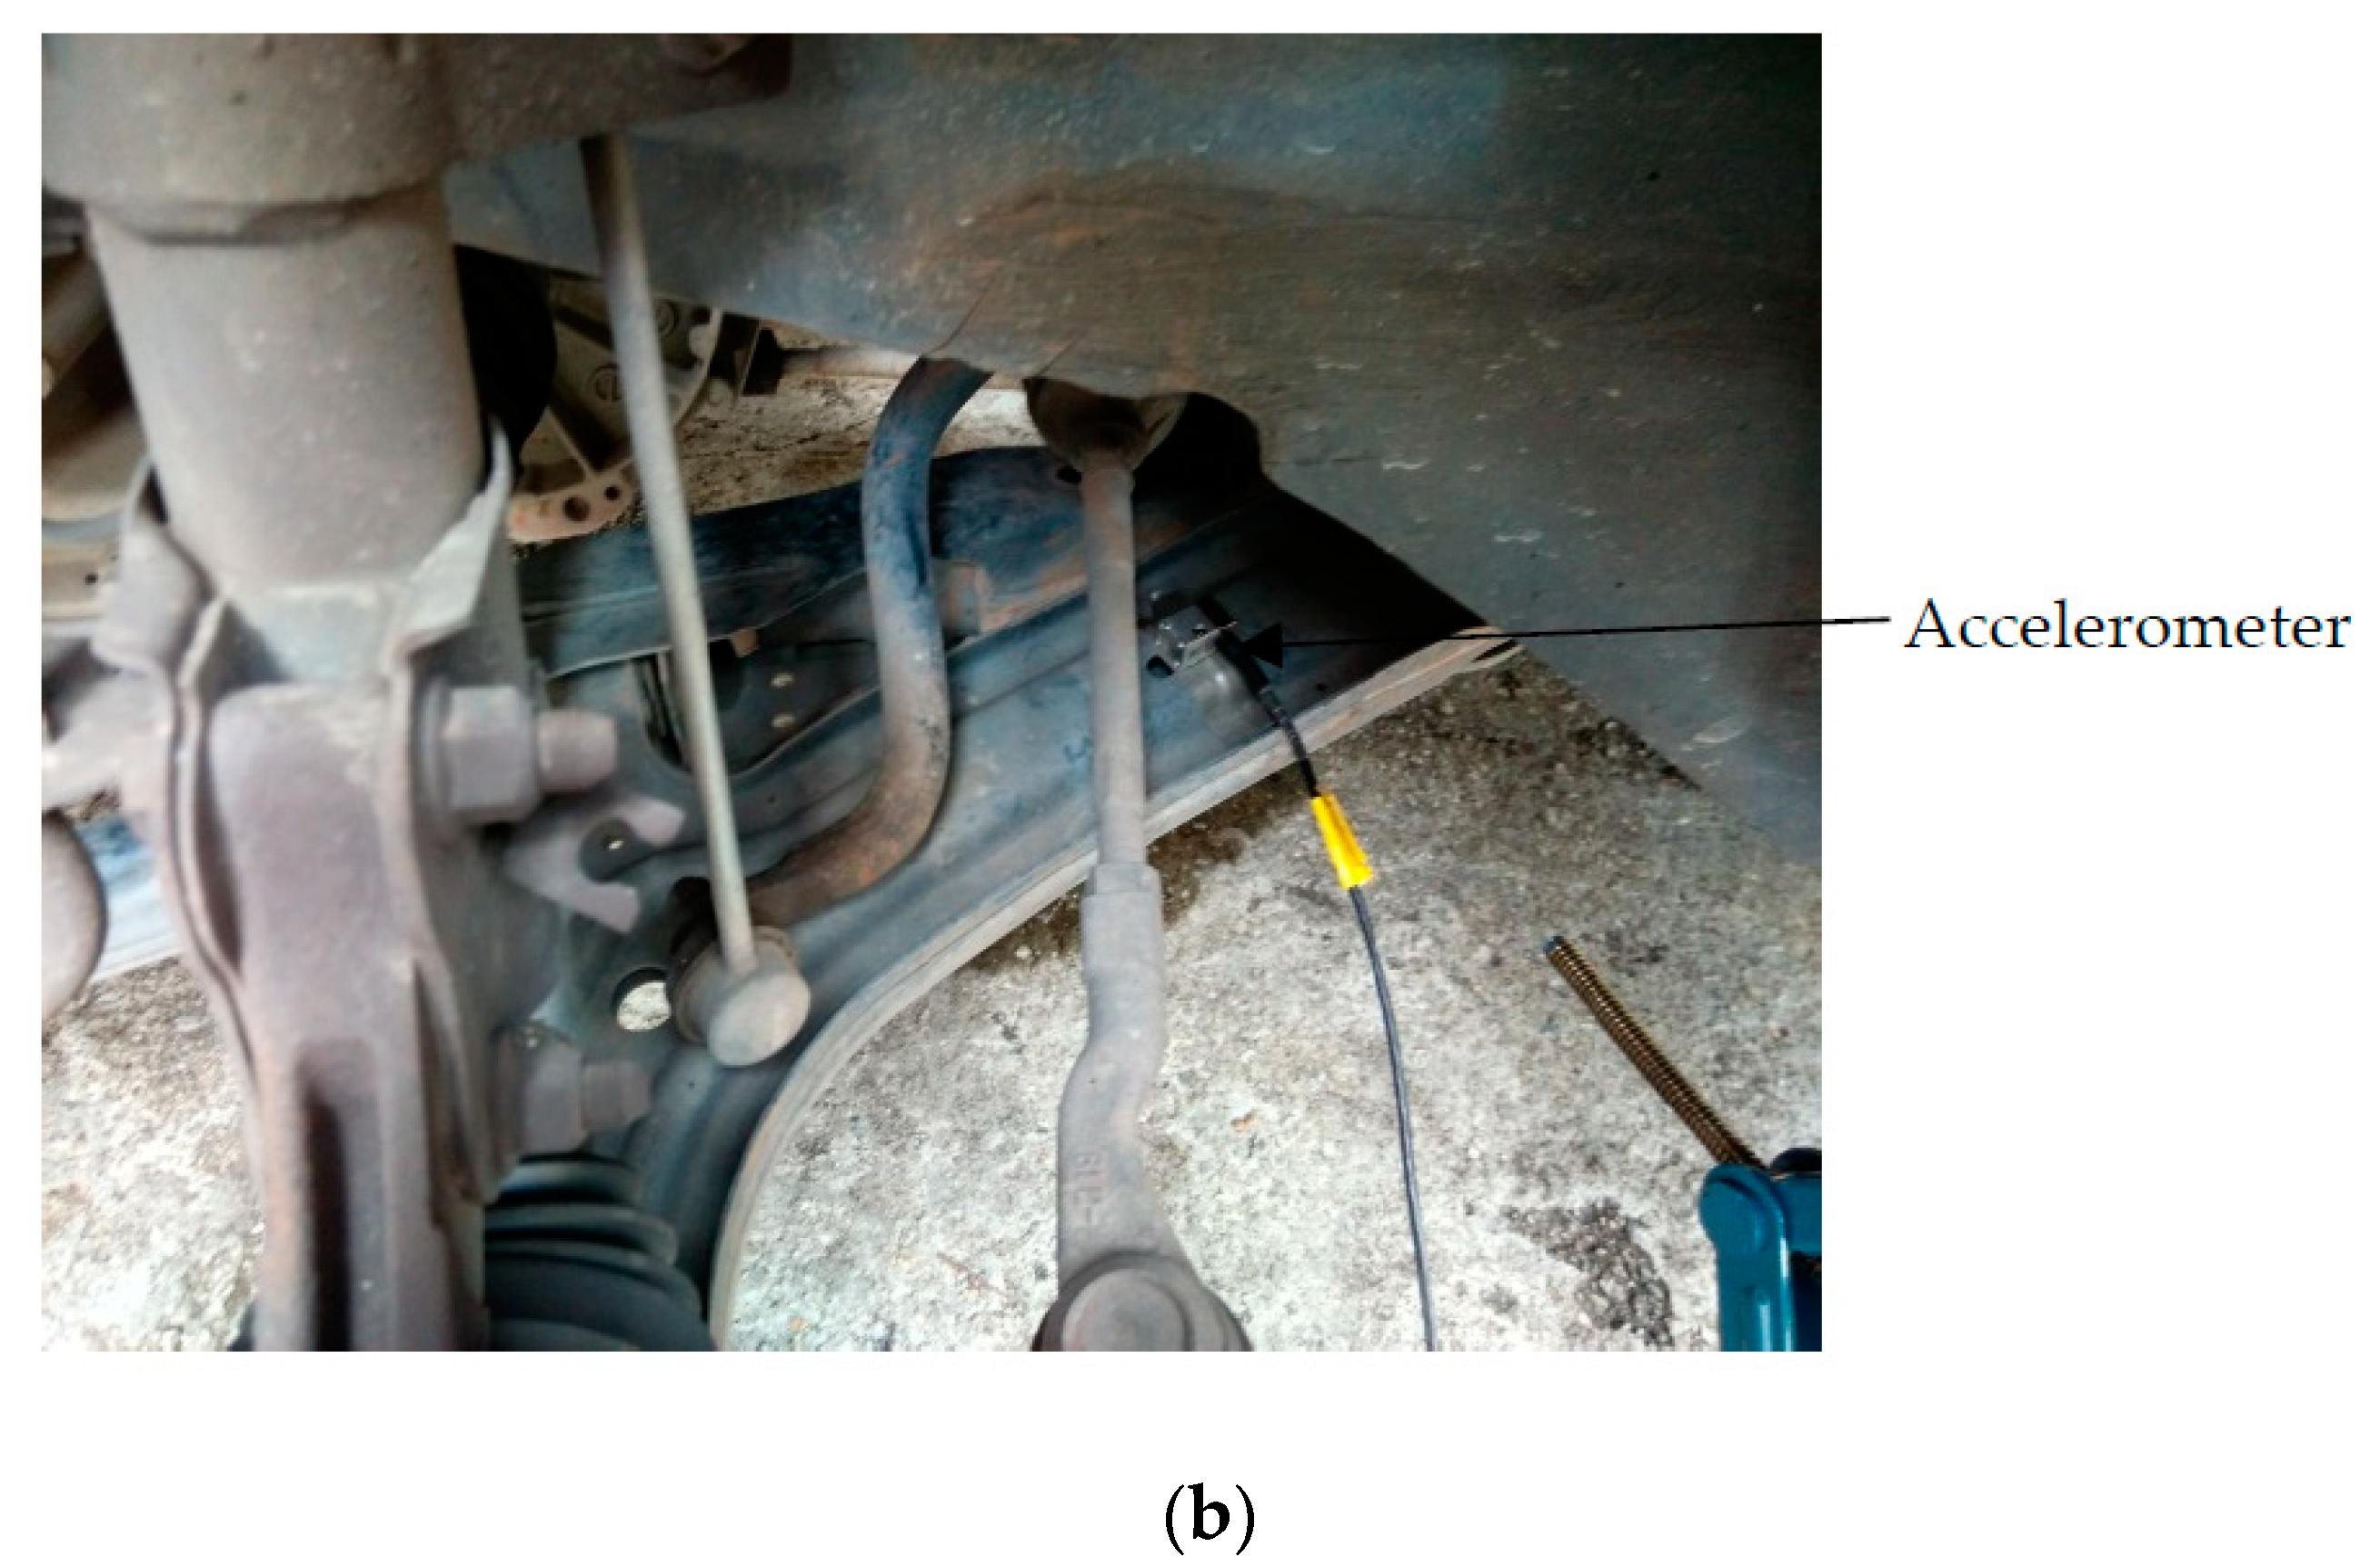
Figure 4.
Strain gauge setup on spring.
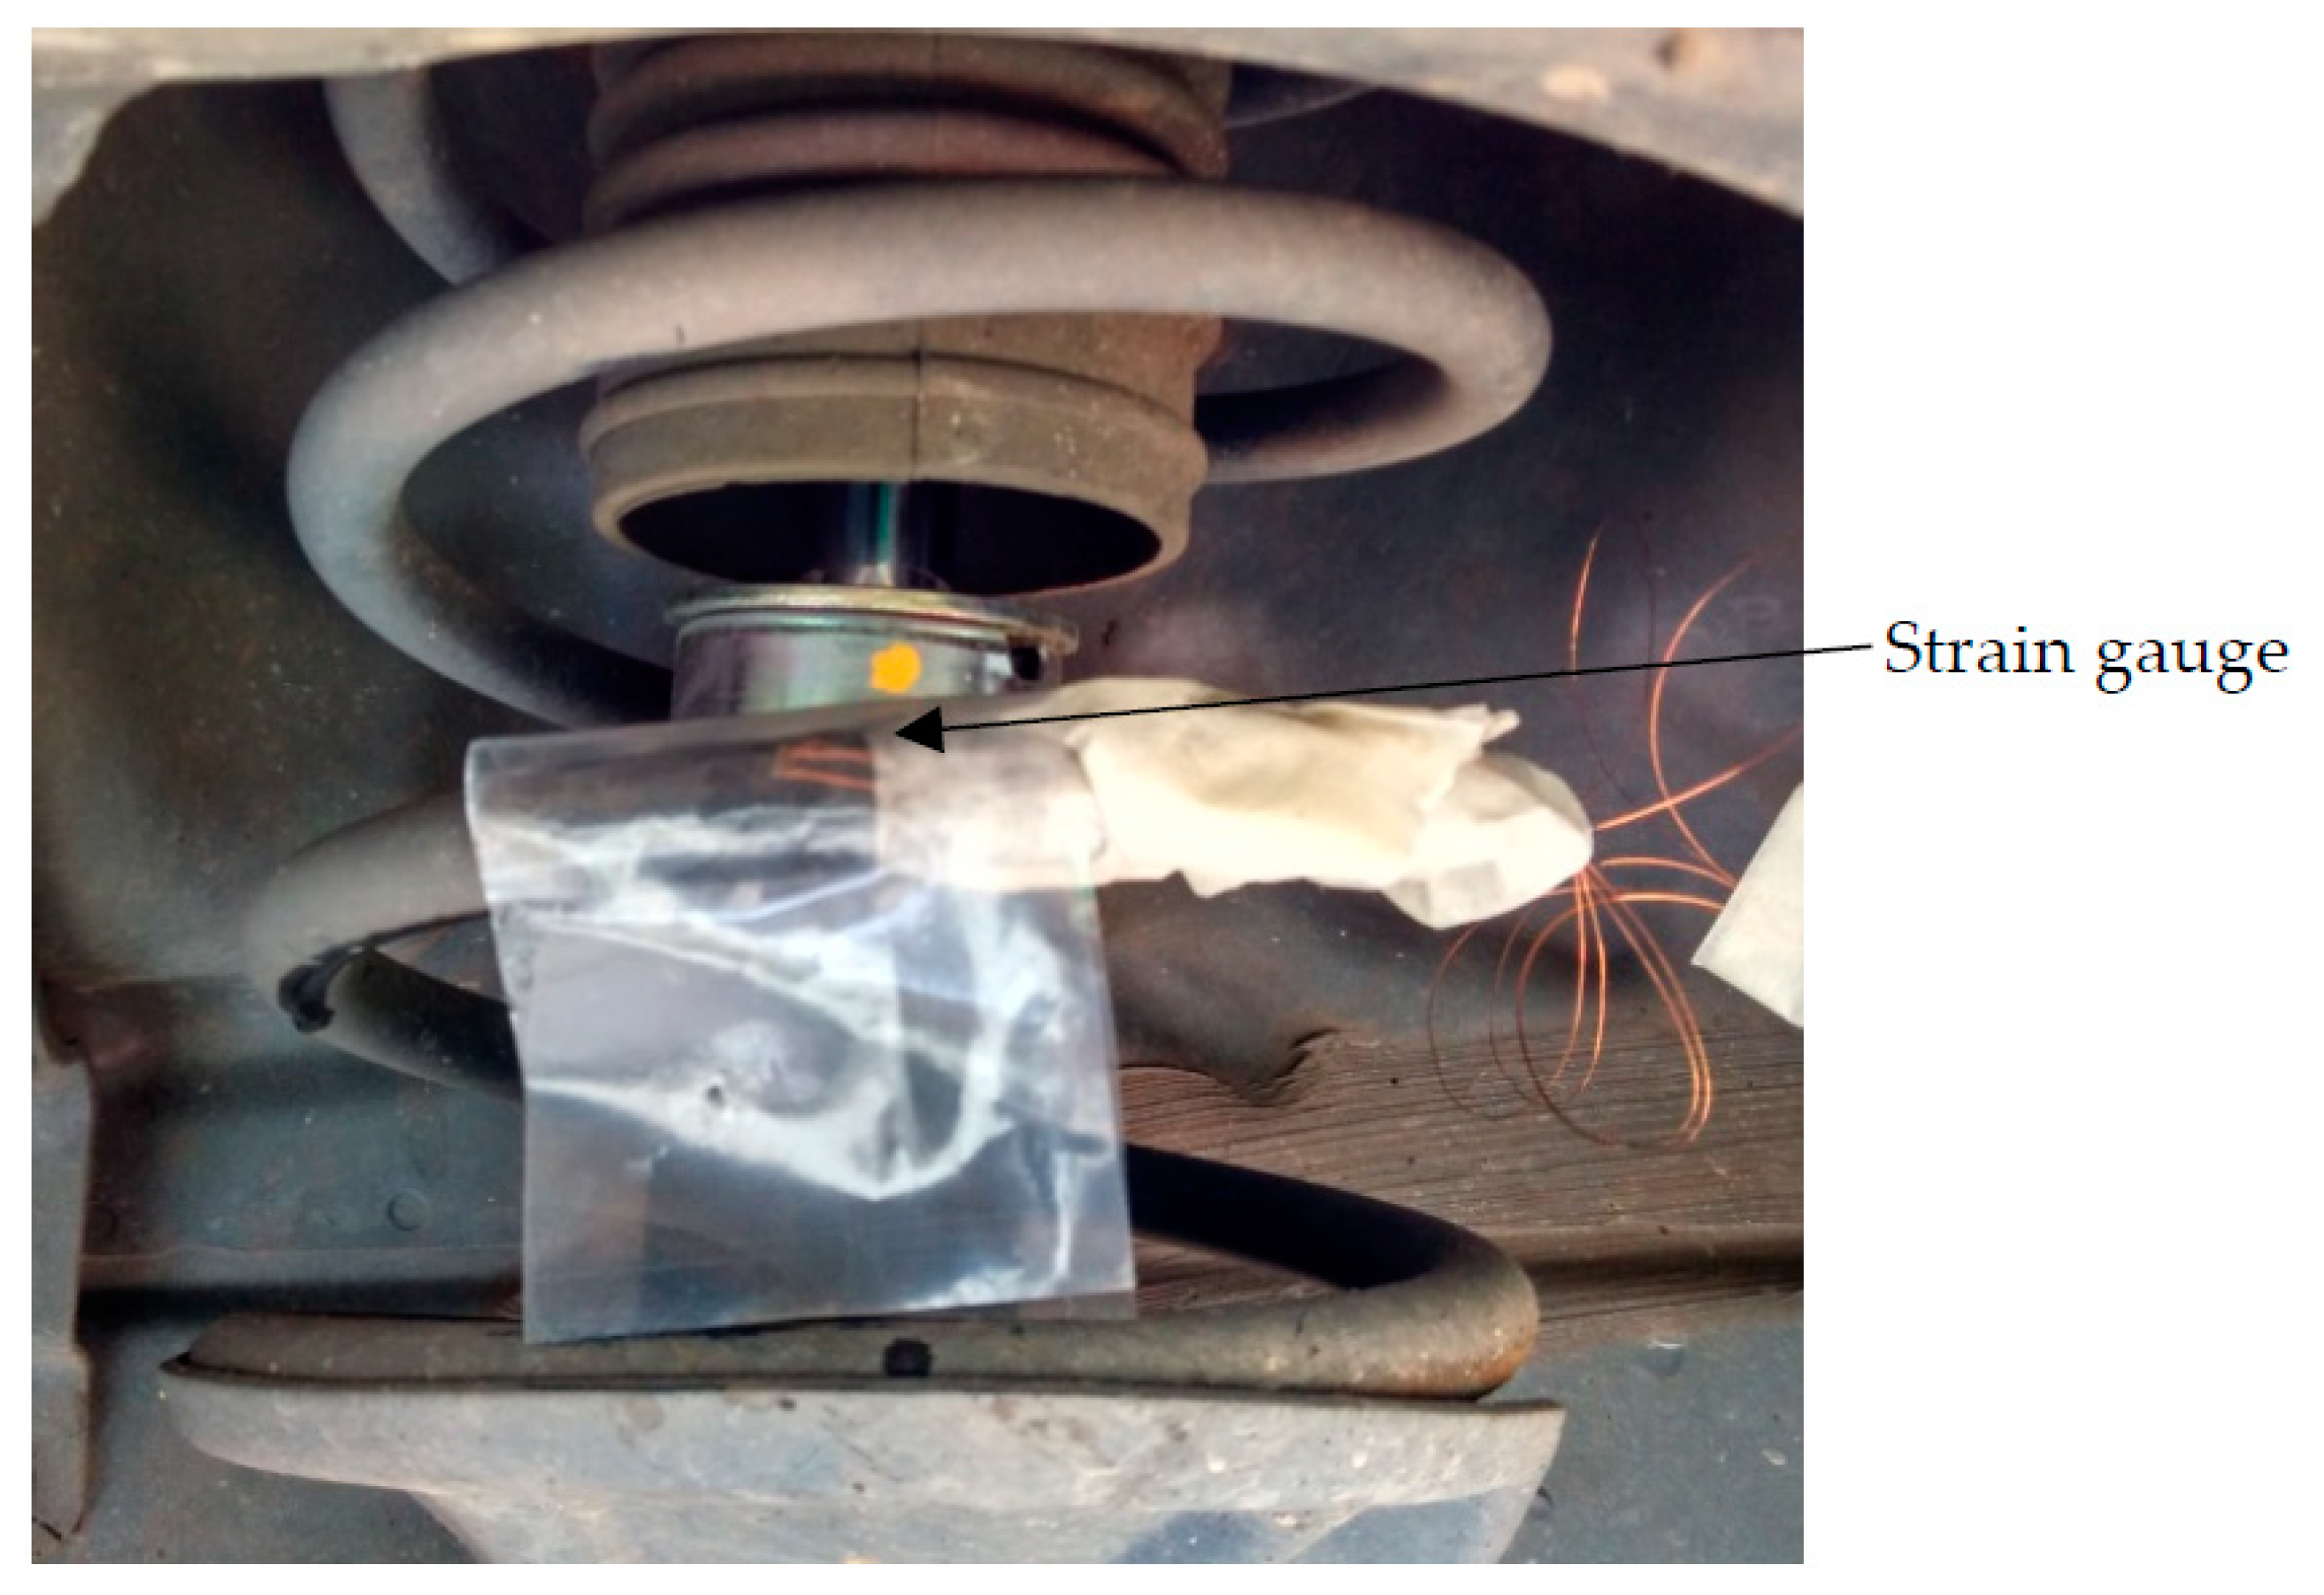
Figure 5.
Data acquisition system.
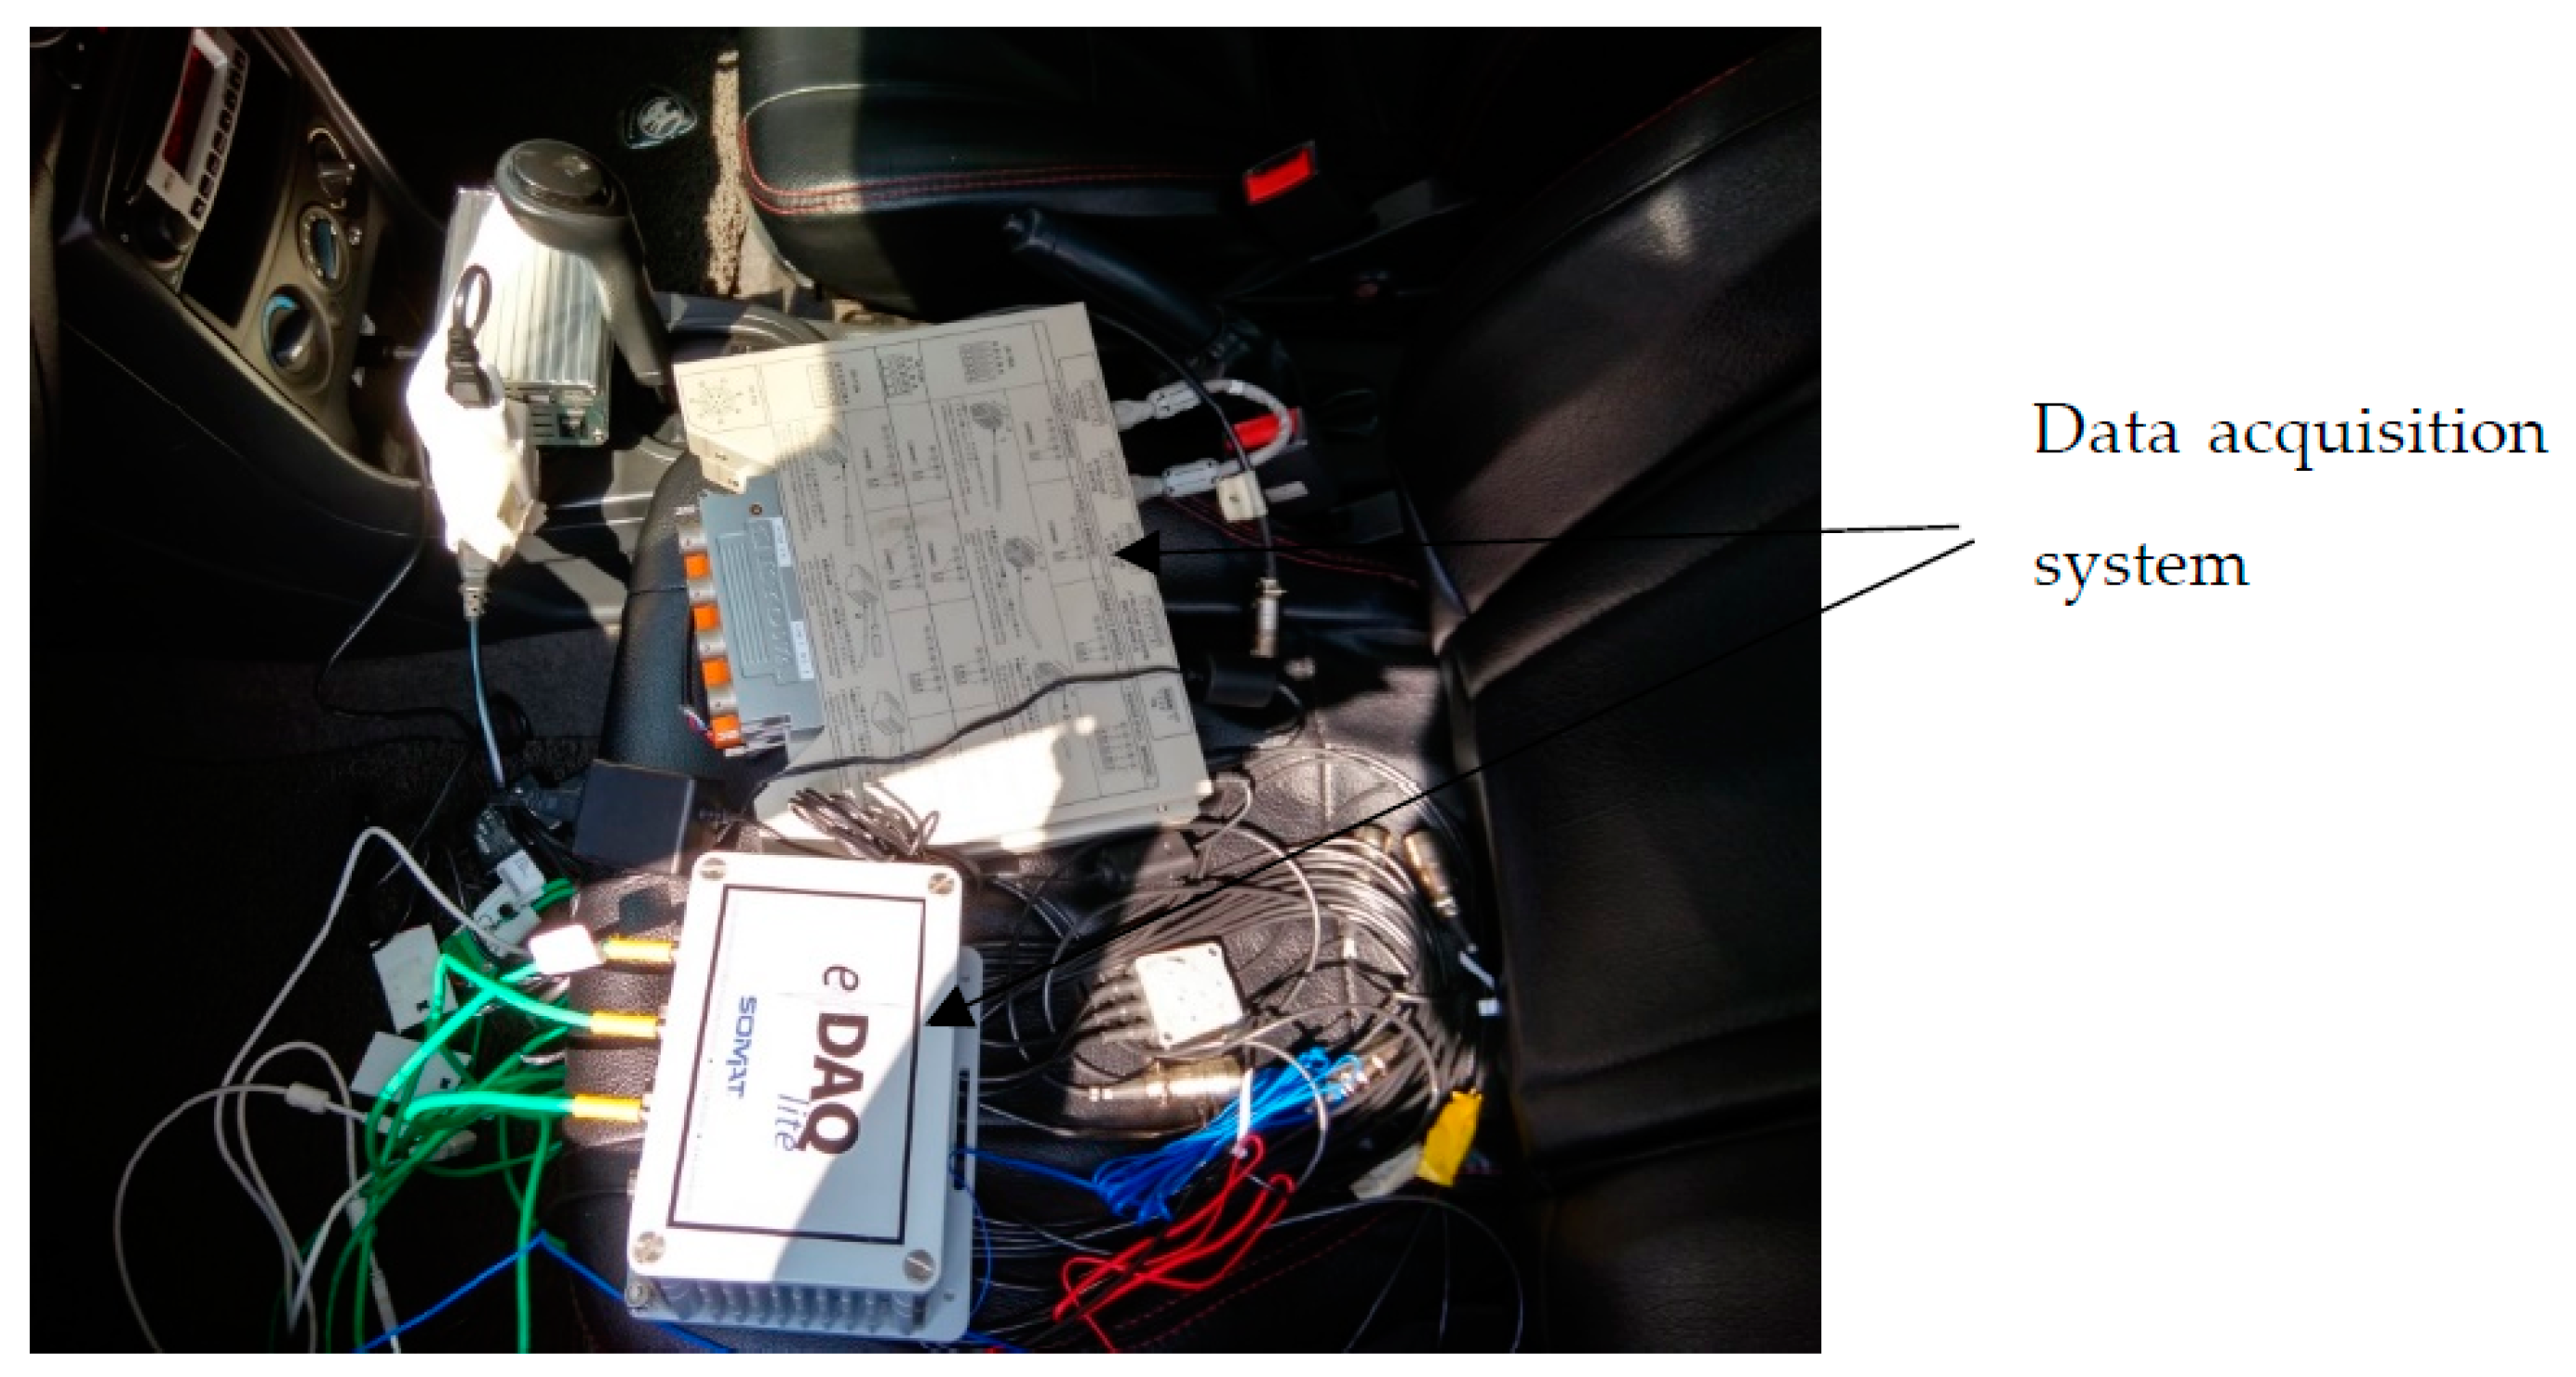
Figure 6.
Collected top mount acceleration time histories: (a) Highway A, (b) Highway B.
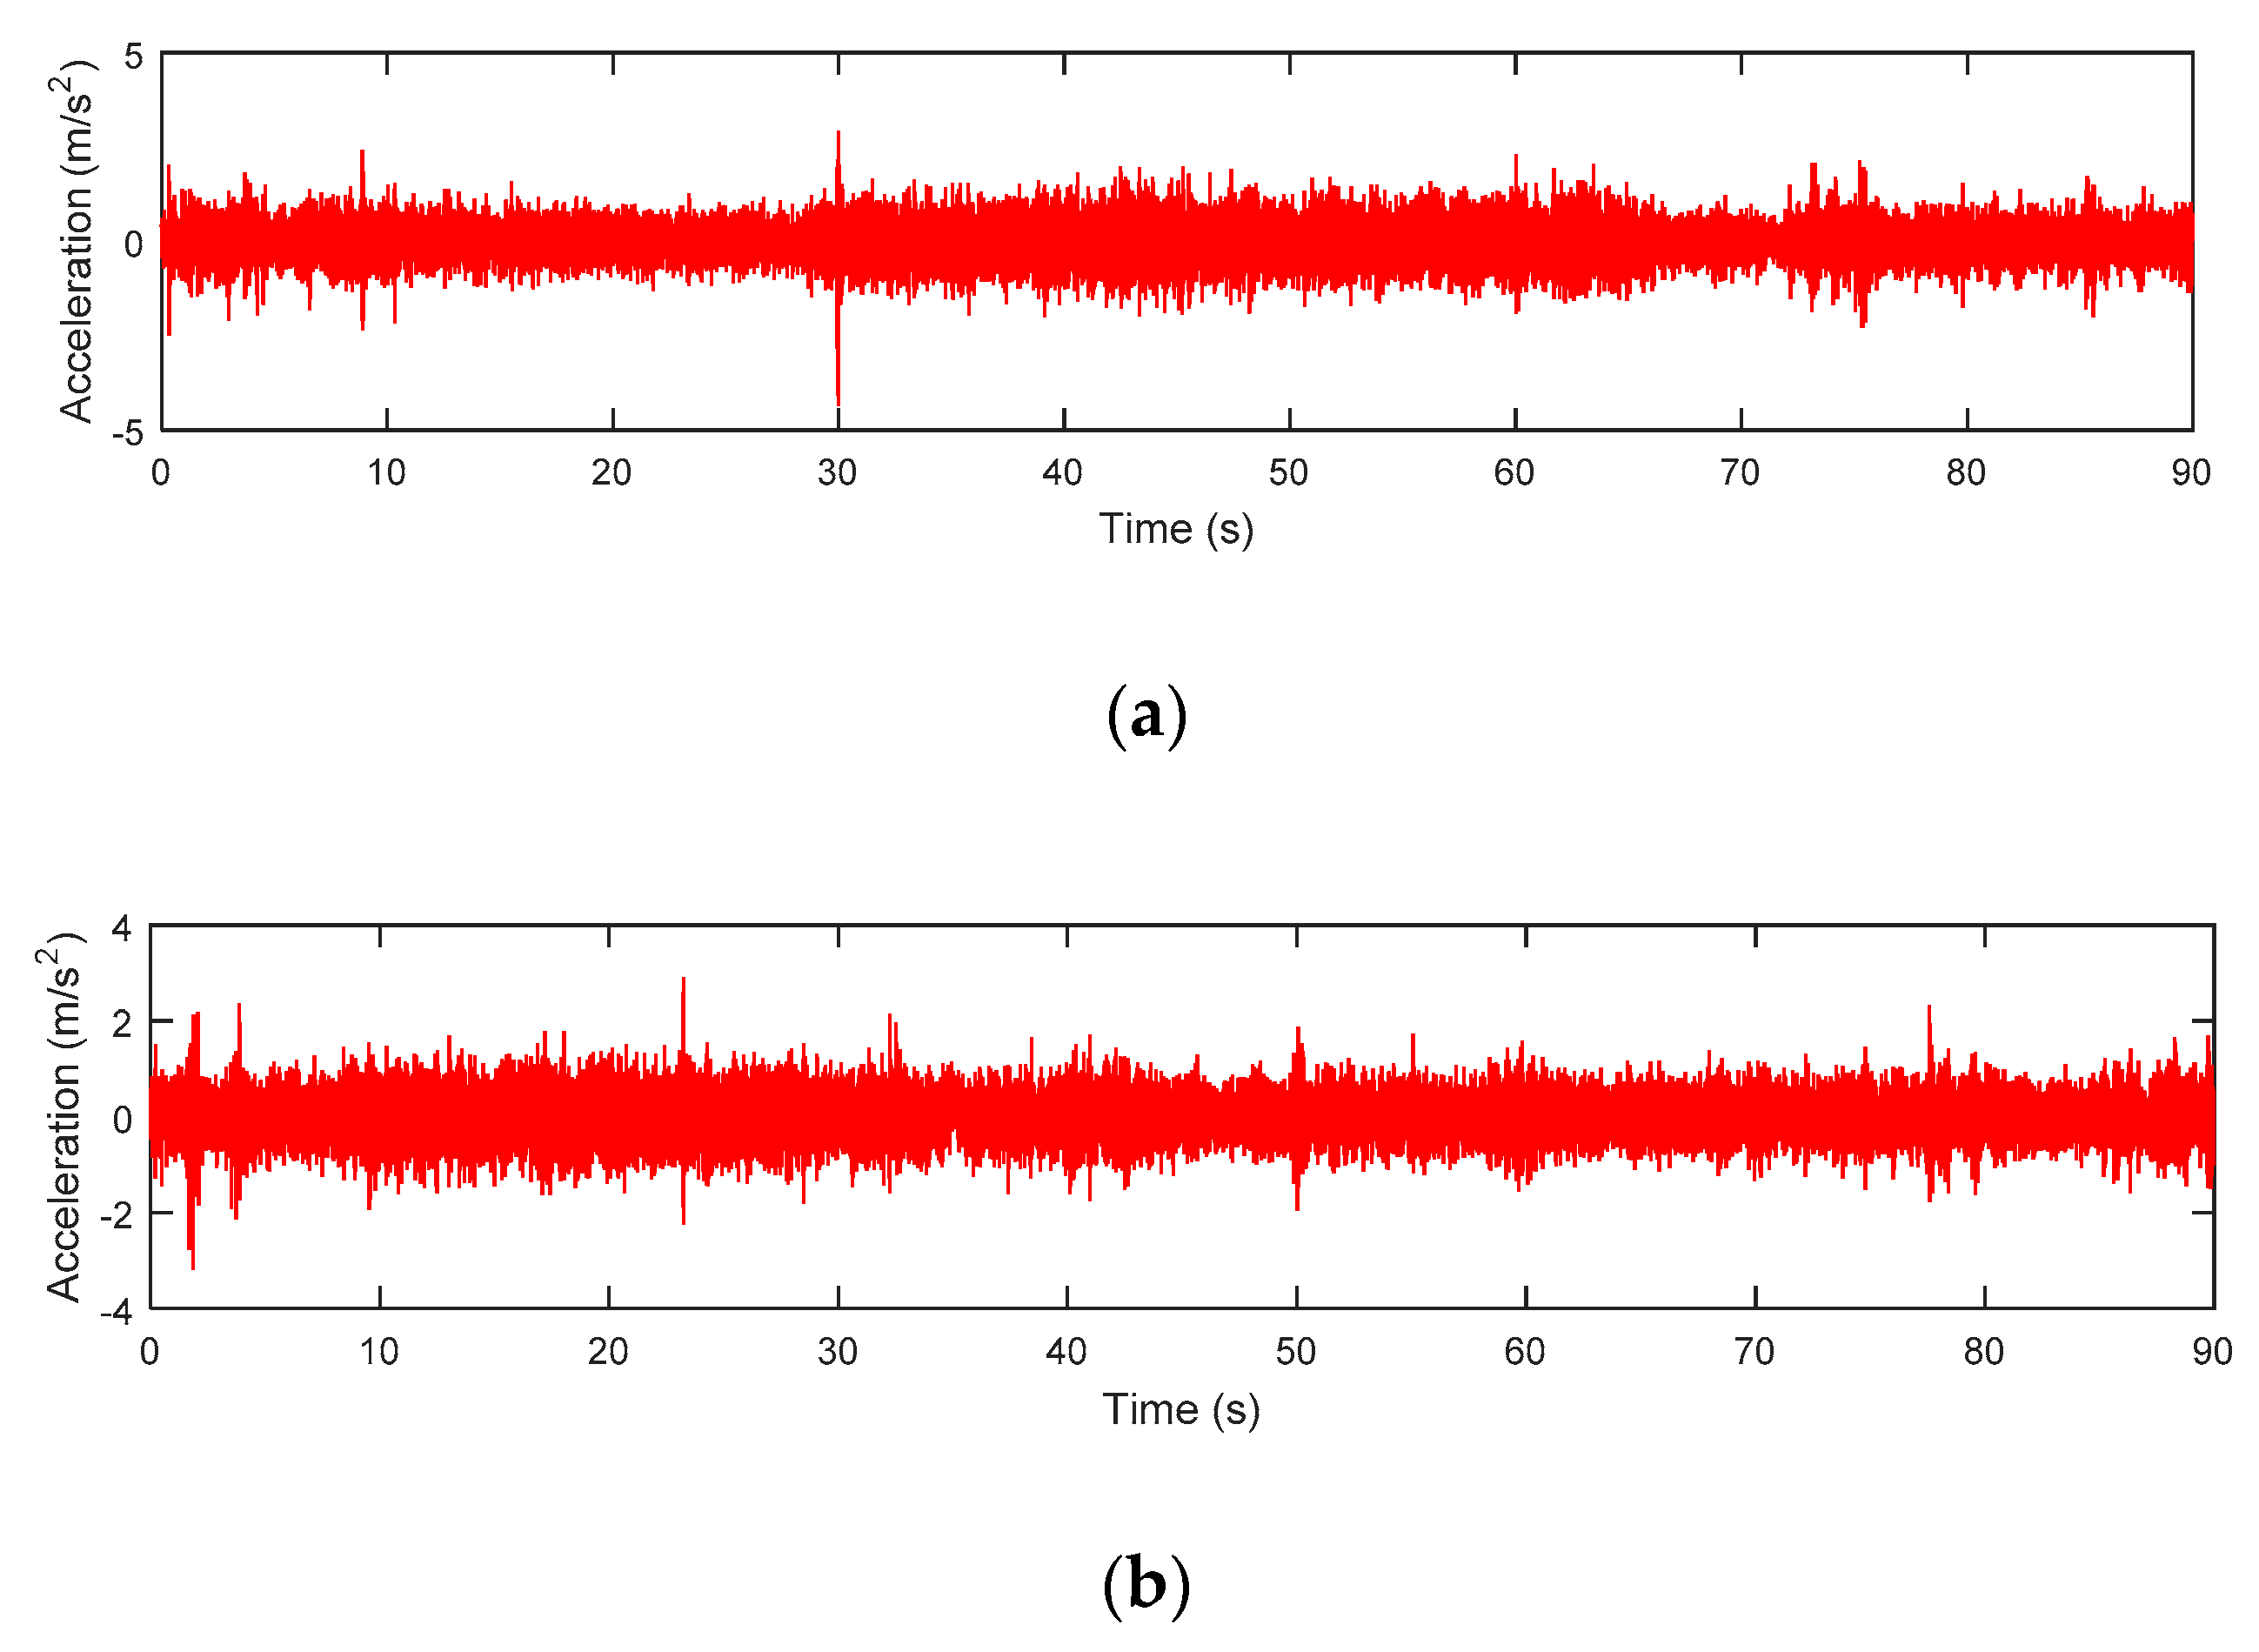
Figure 7.
Collected lower arm acceleration time histories: (a) Highway A, (b) Highway B.

Figure 8.
Elastic-energy model strain signals: (a) Highway A, (b) Highway B.
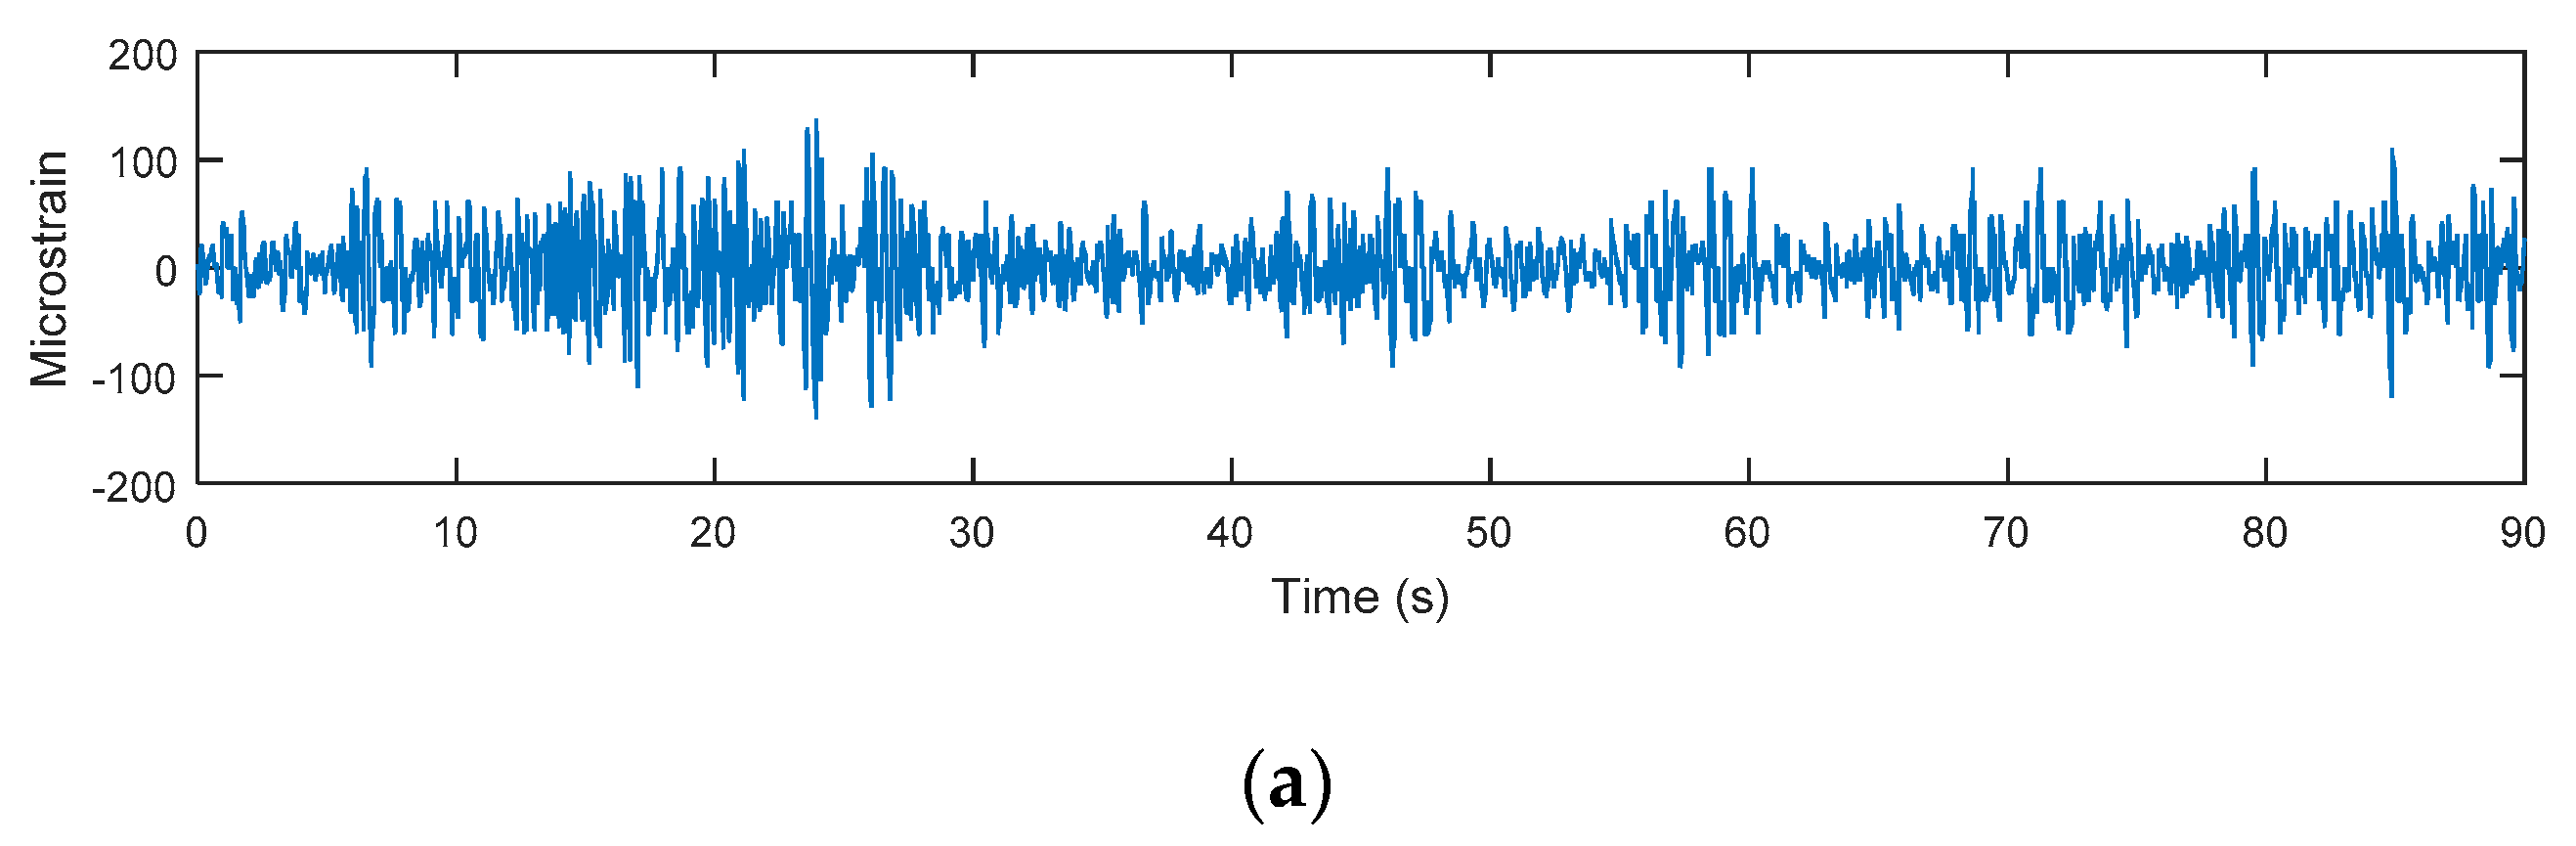

Figure 9.
Measured strain signals: (a) Highway A, (b) Highway B.
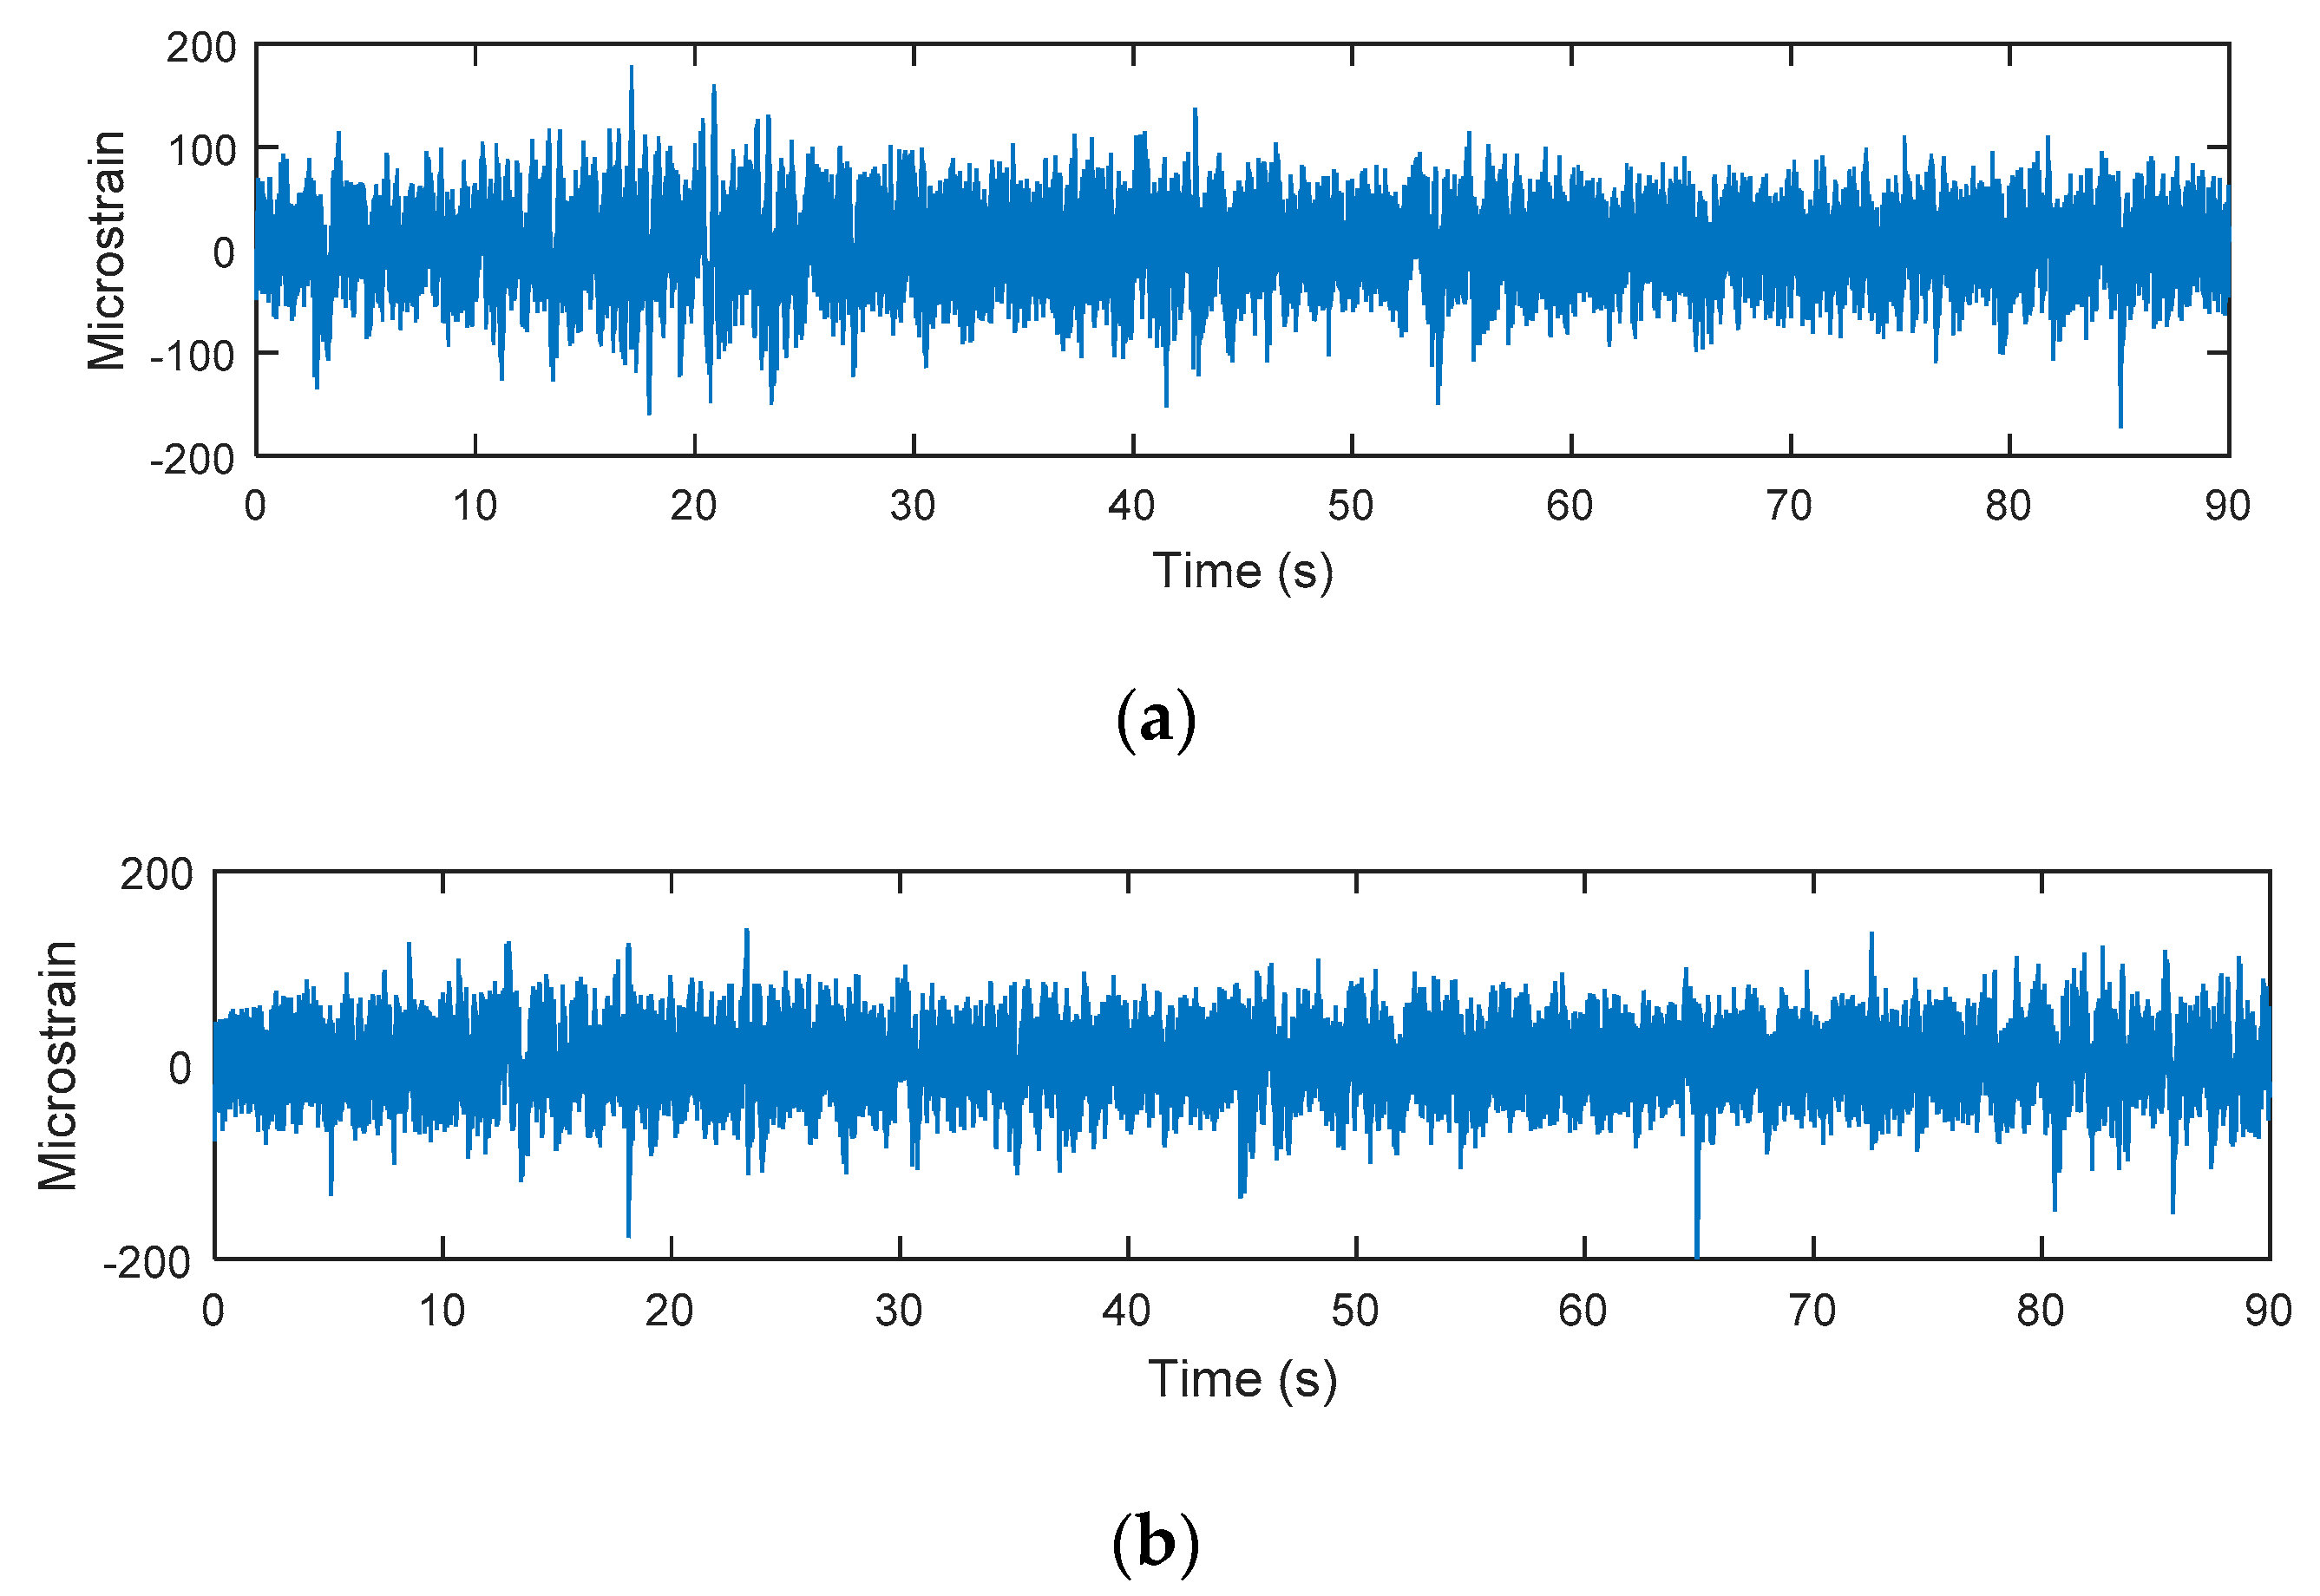
Figure 10.
Top mount acceleration signals: (a) Rural A, (b) Rural B.
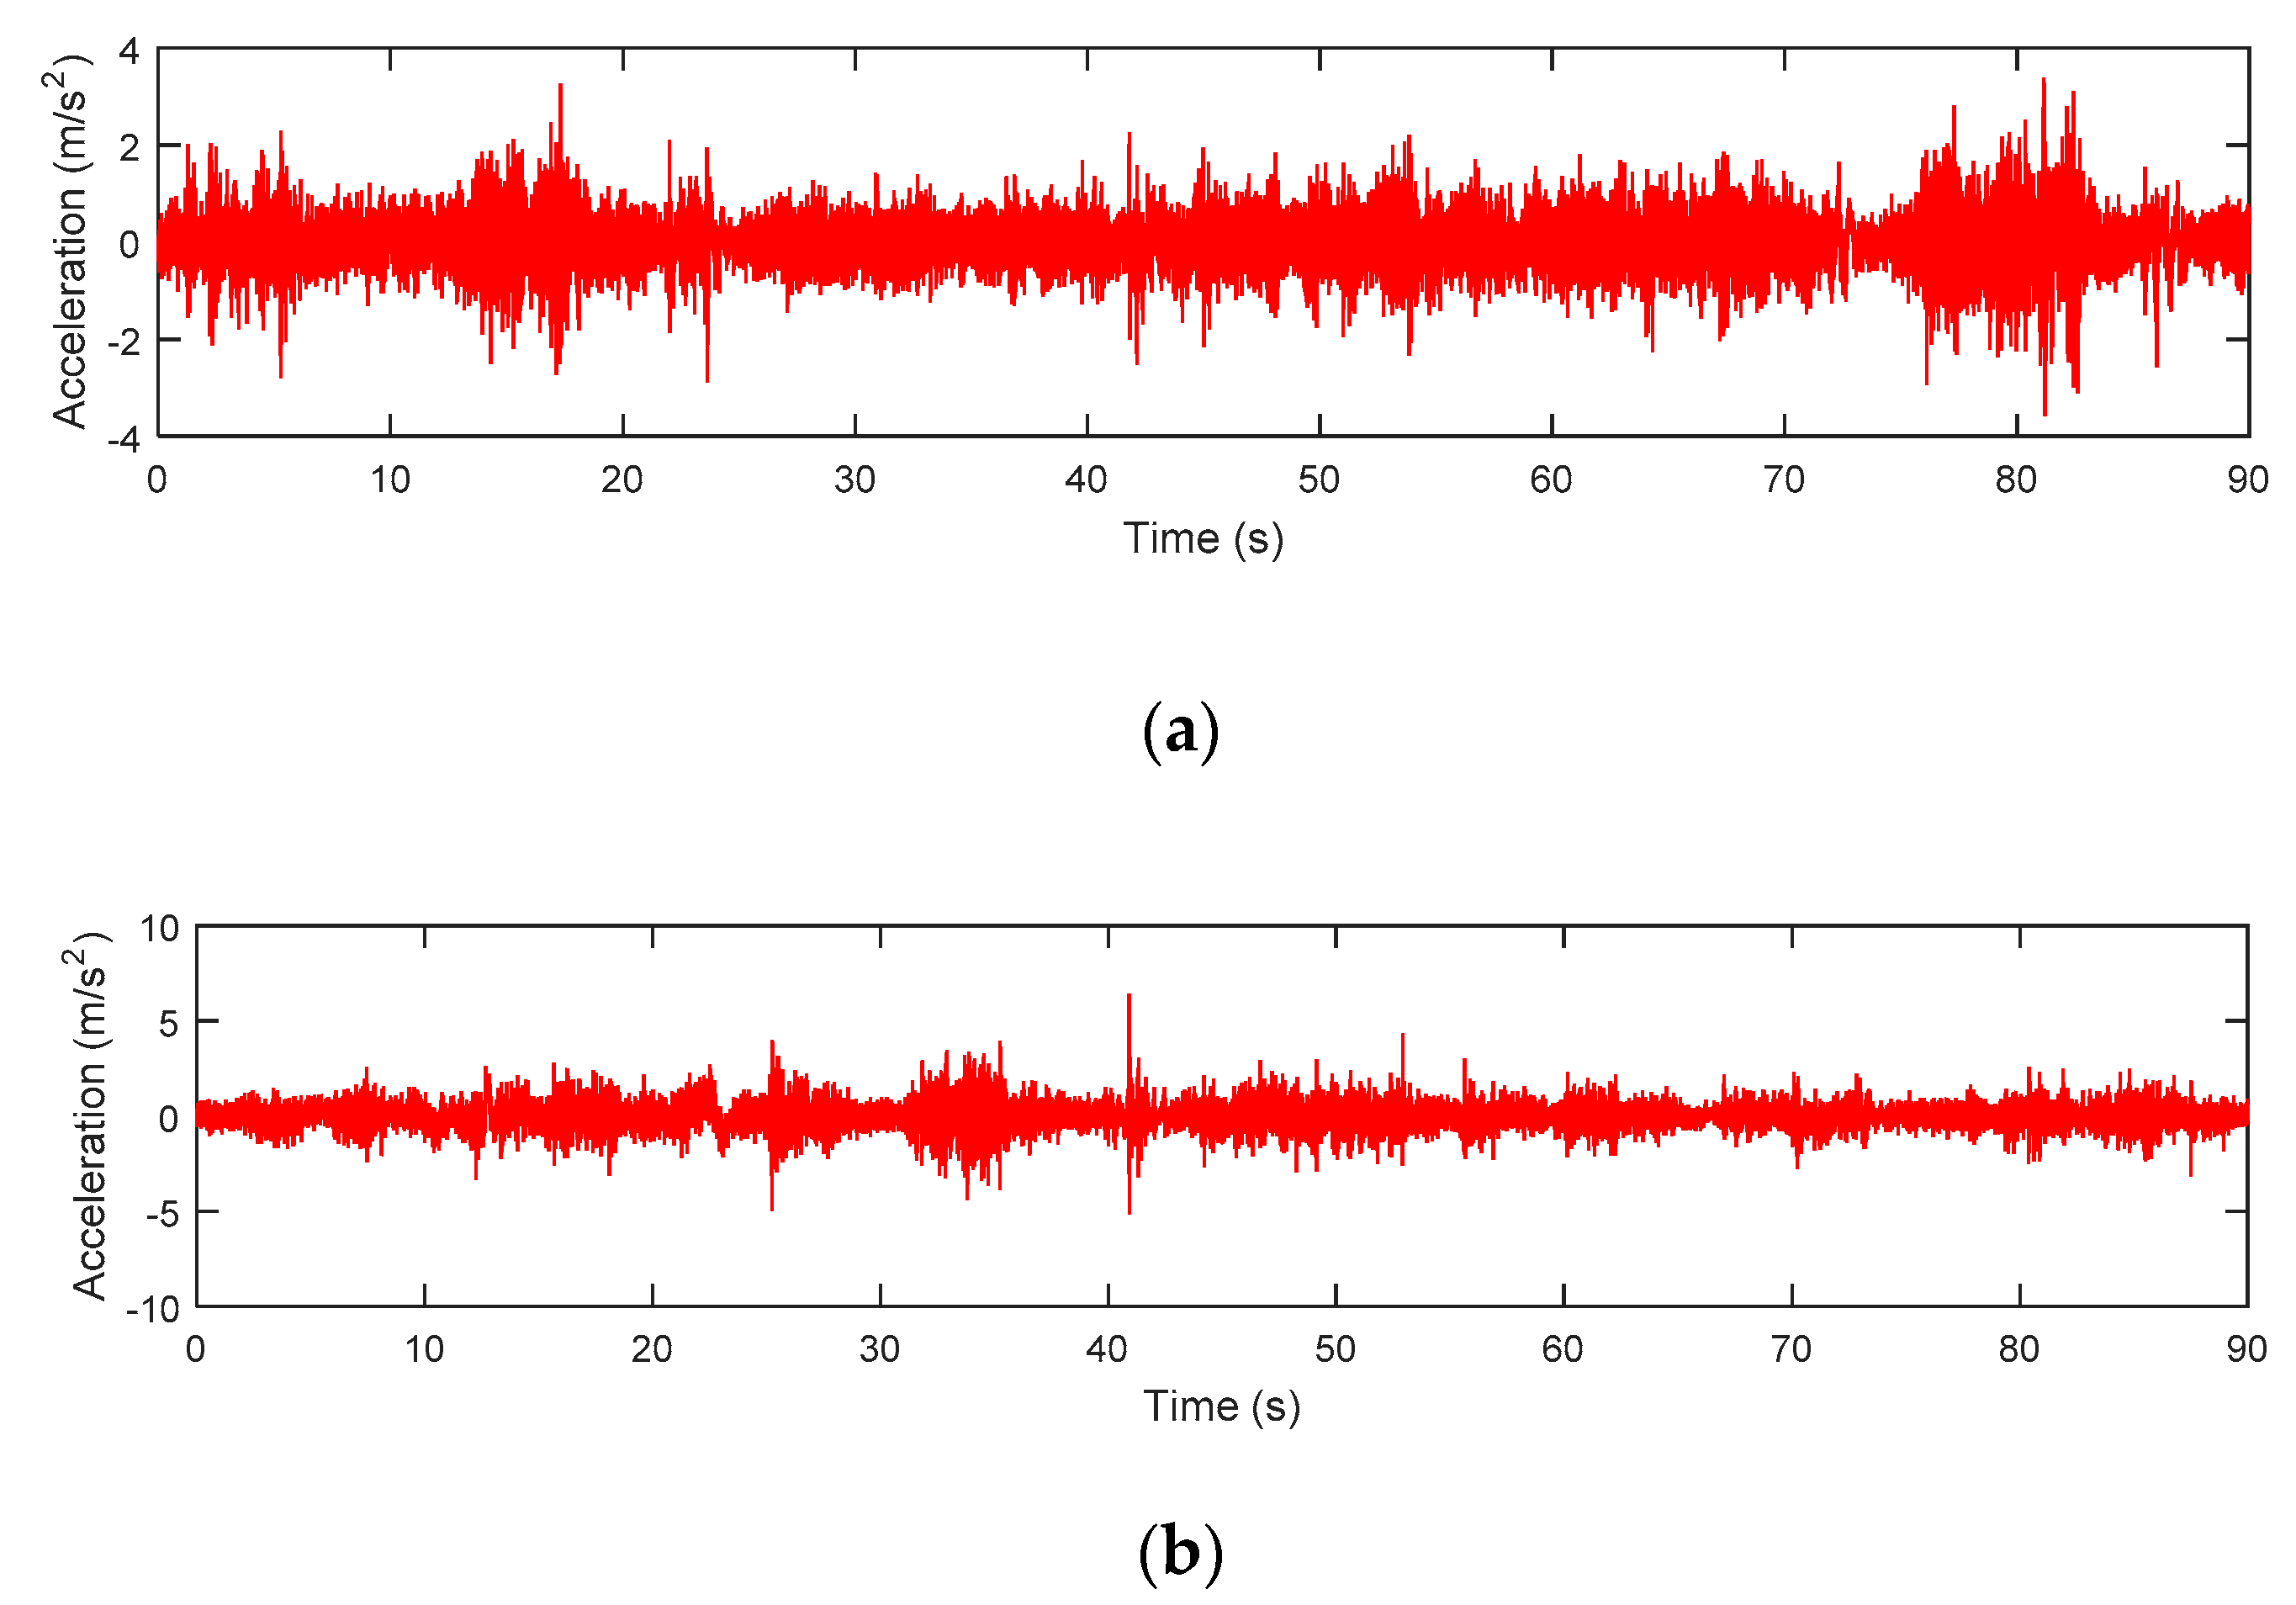
Figure 11.
Lower arm acceleration signals: (a) Rural A, (b) Rural B.
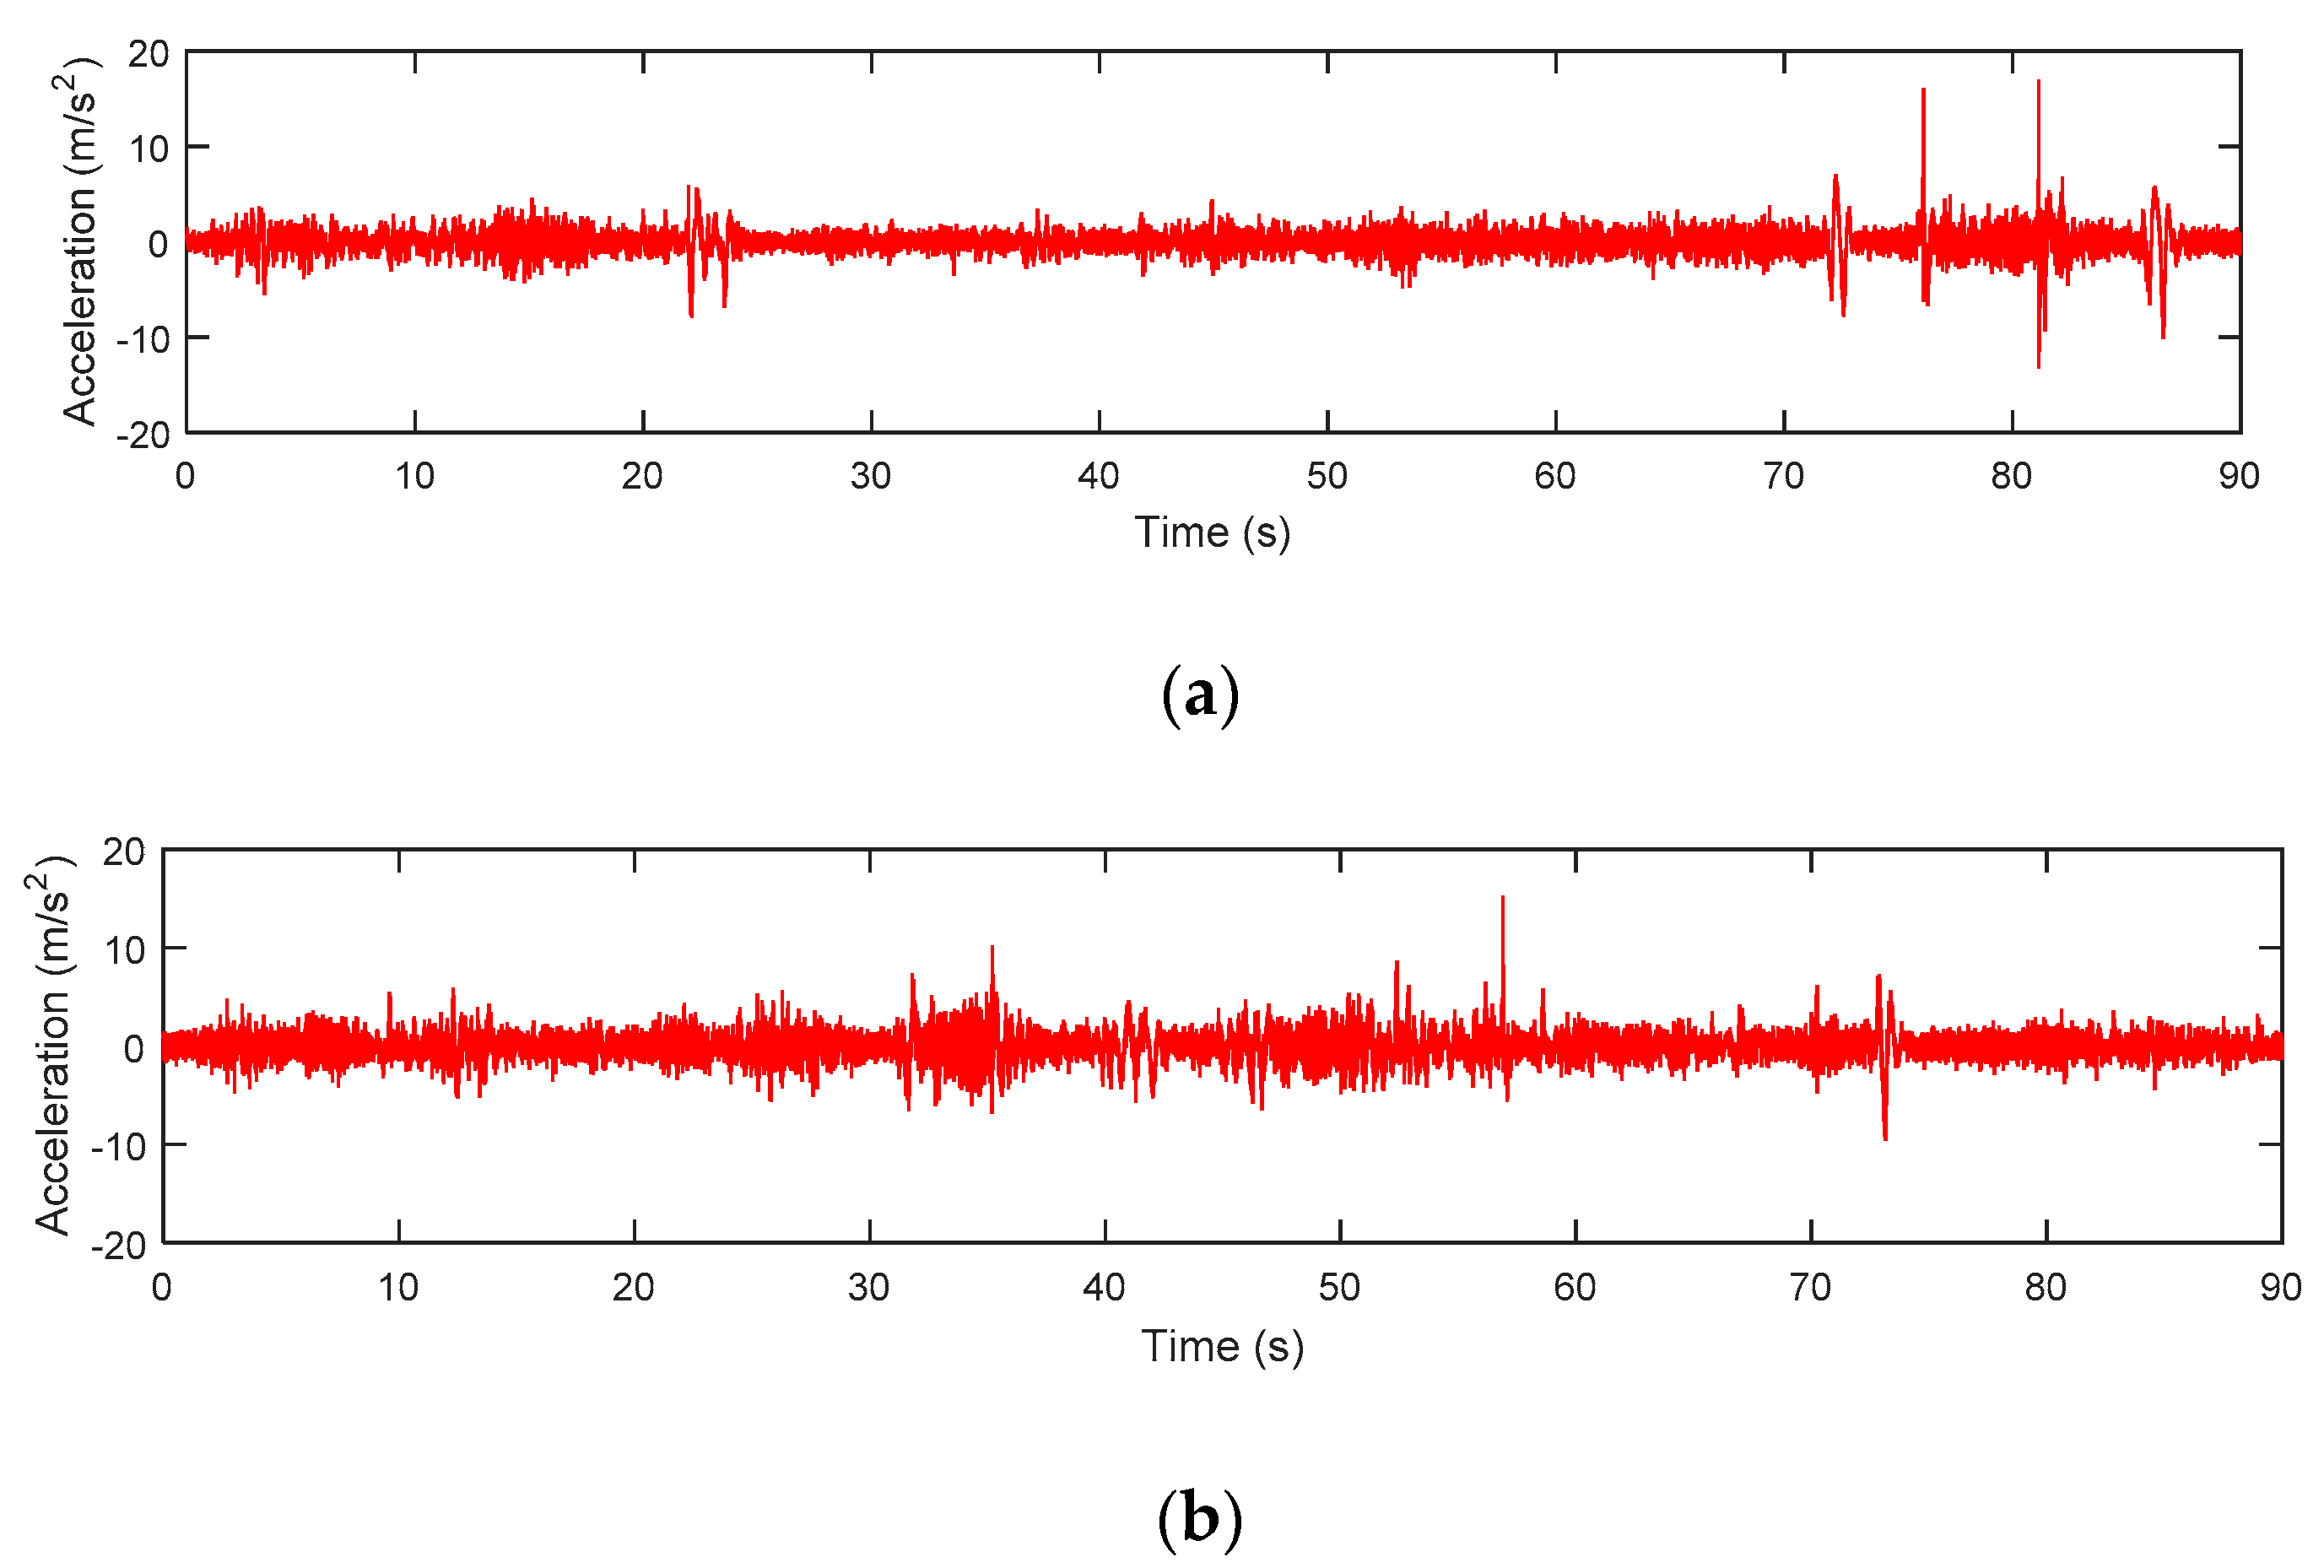
Figure 12.
Elastic-energy strain signals: (a) Rural A, (b) Rural B.
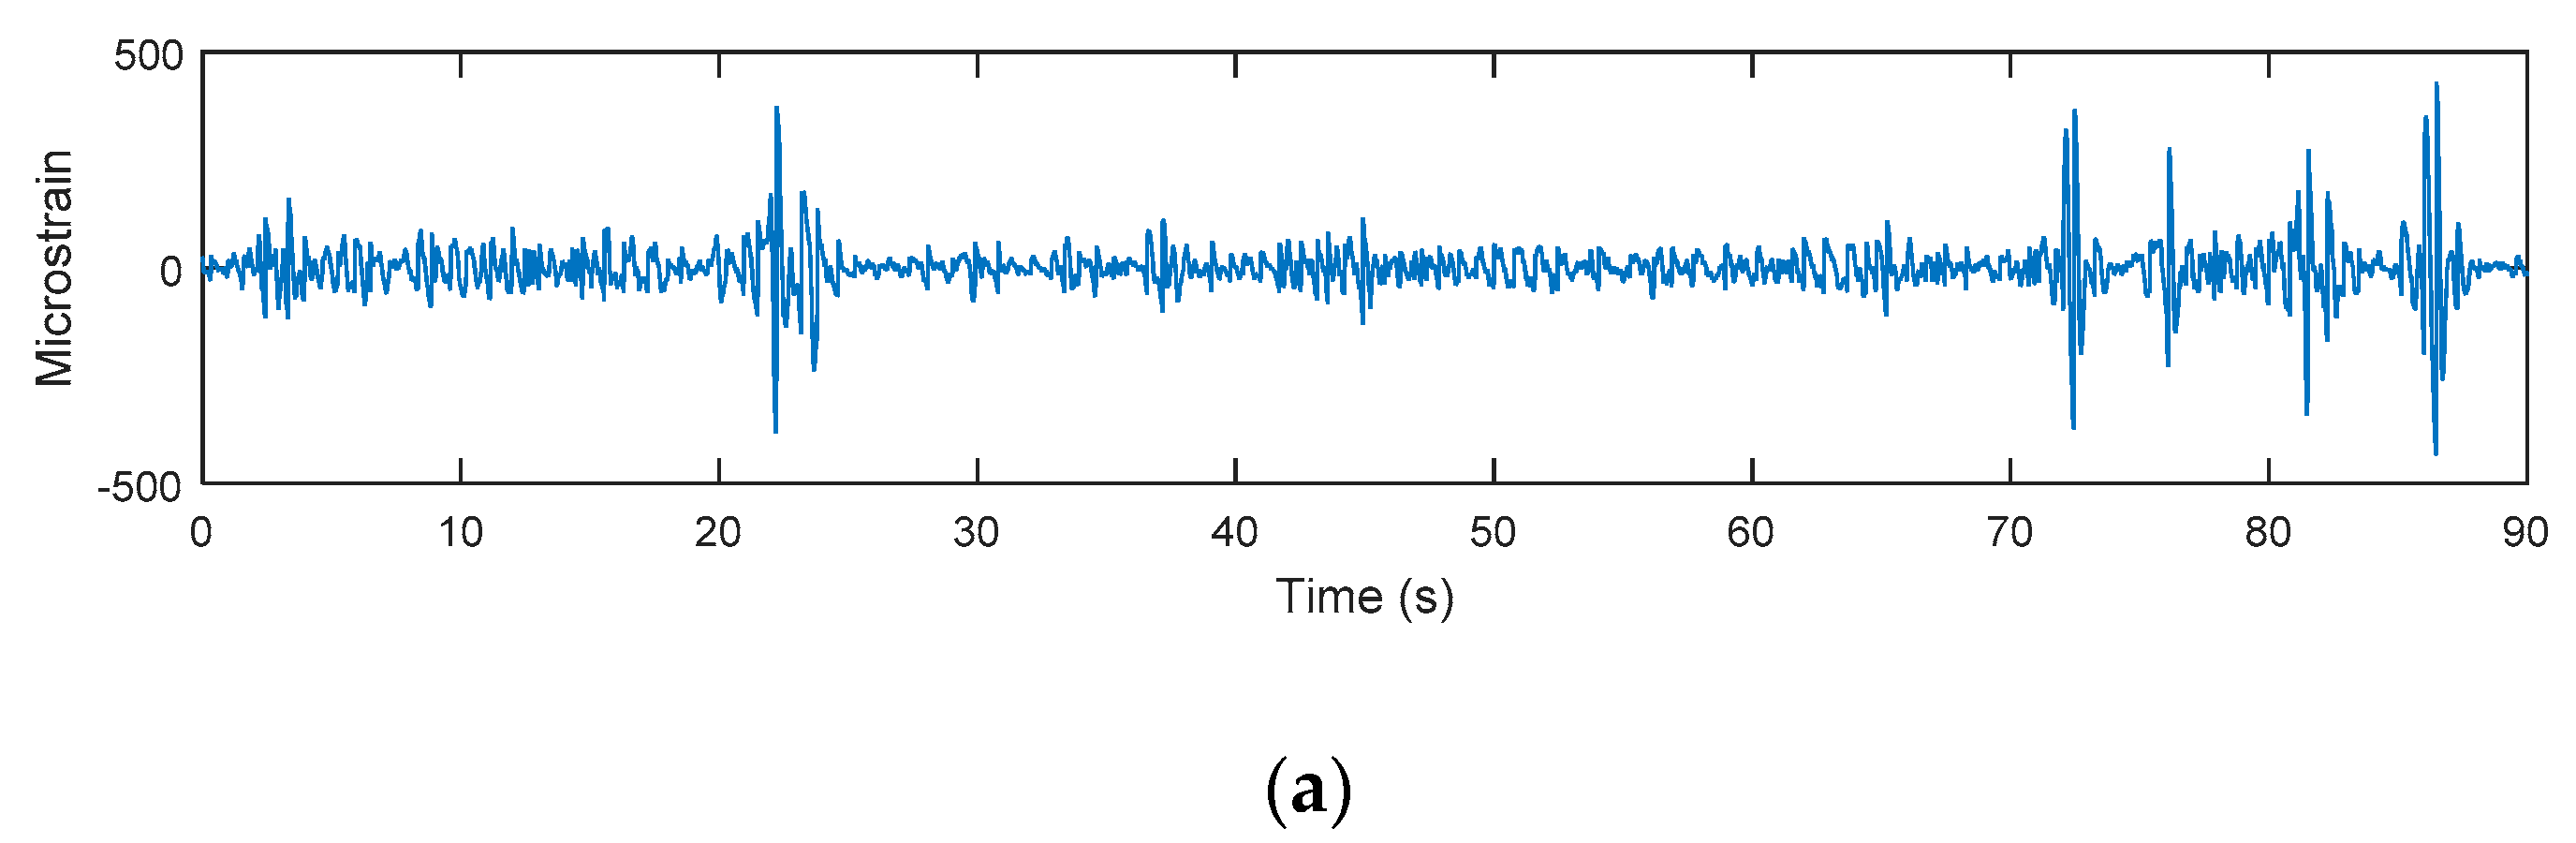
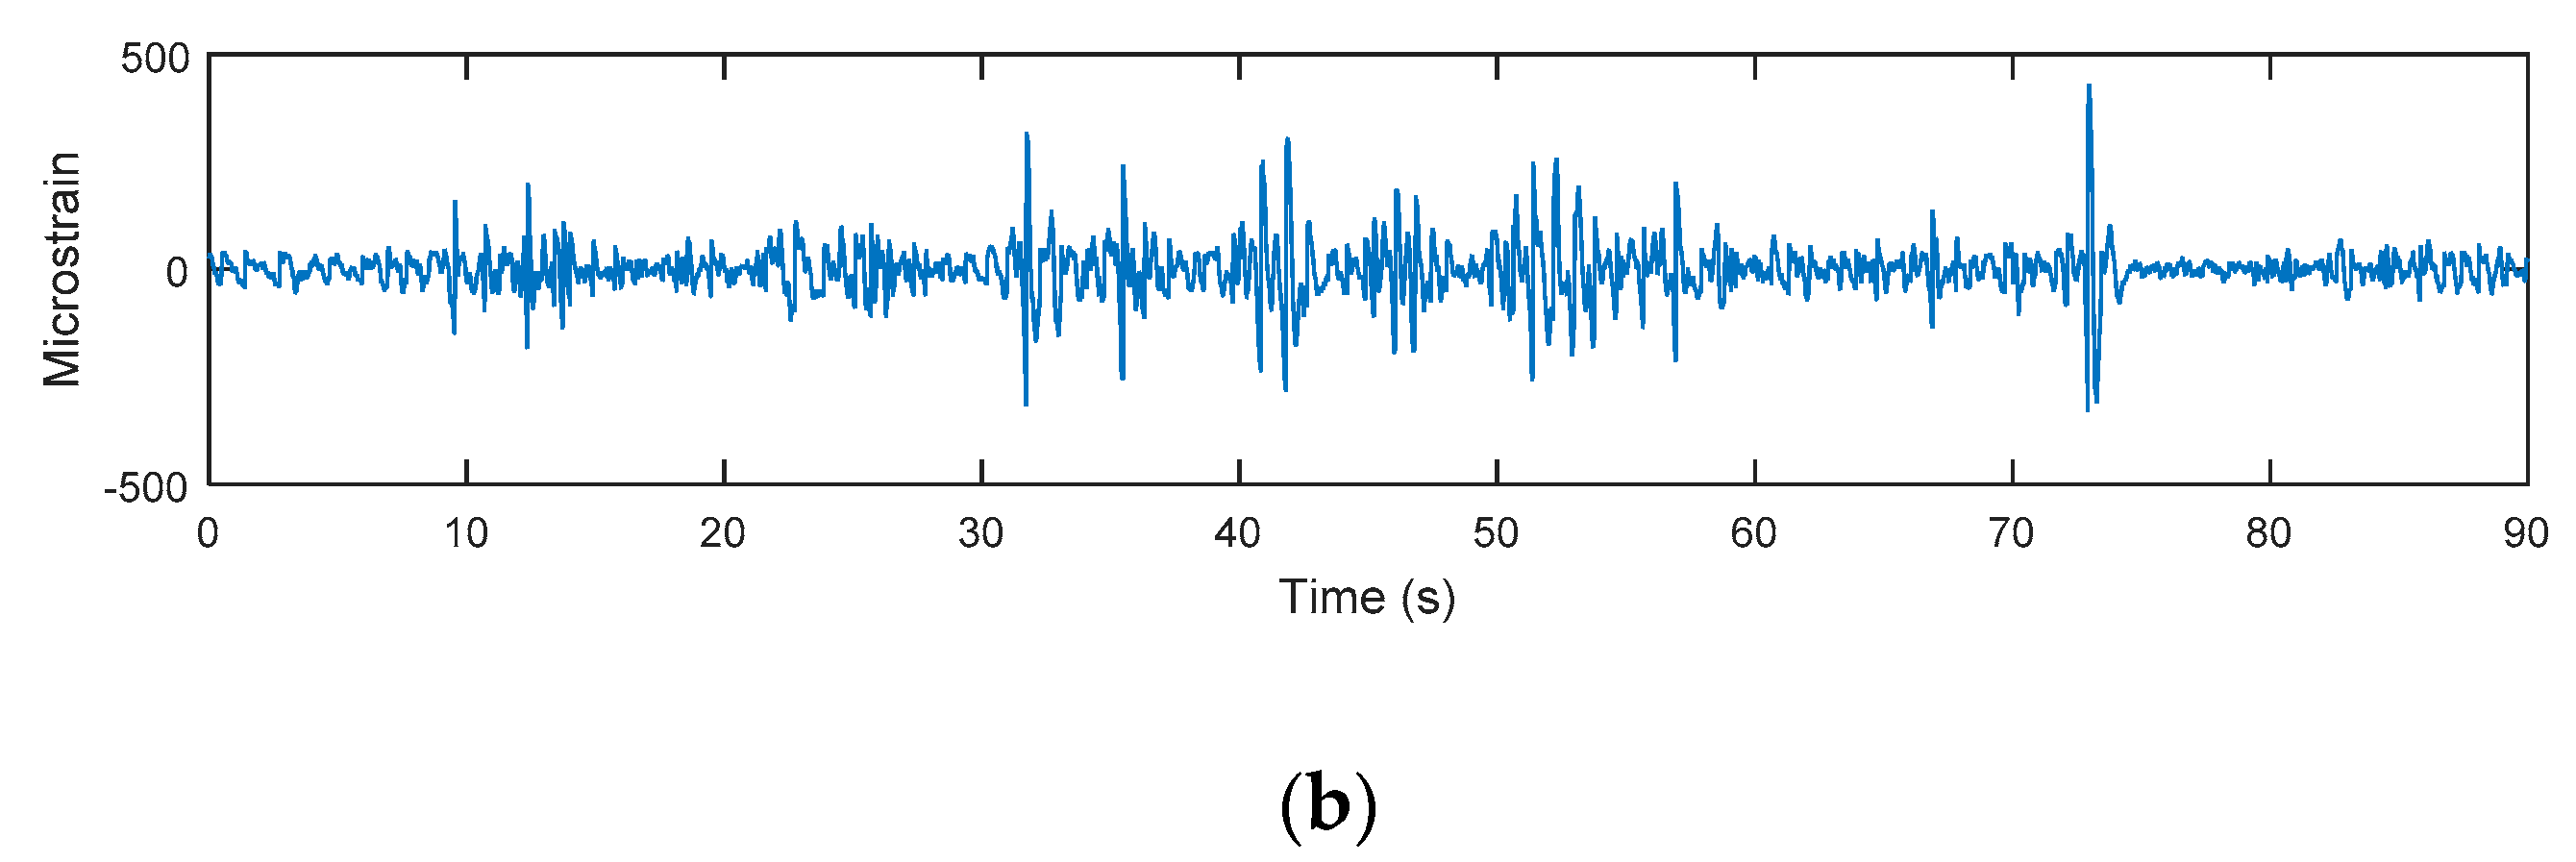
Figure 13.
Measured strain signals: (a) Rural A, (b) Rural B.
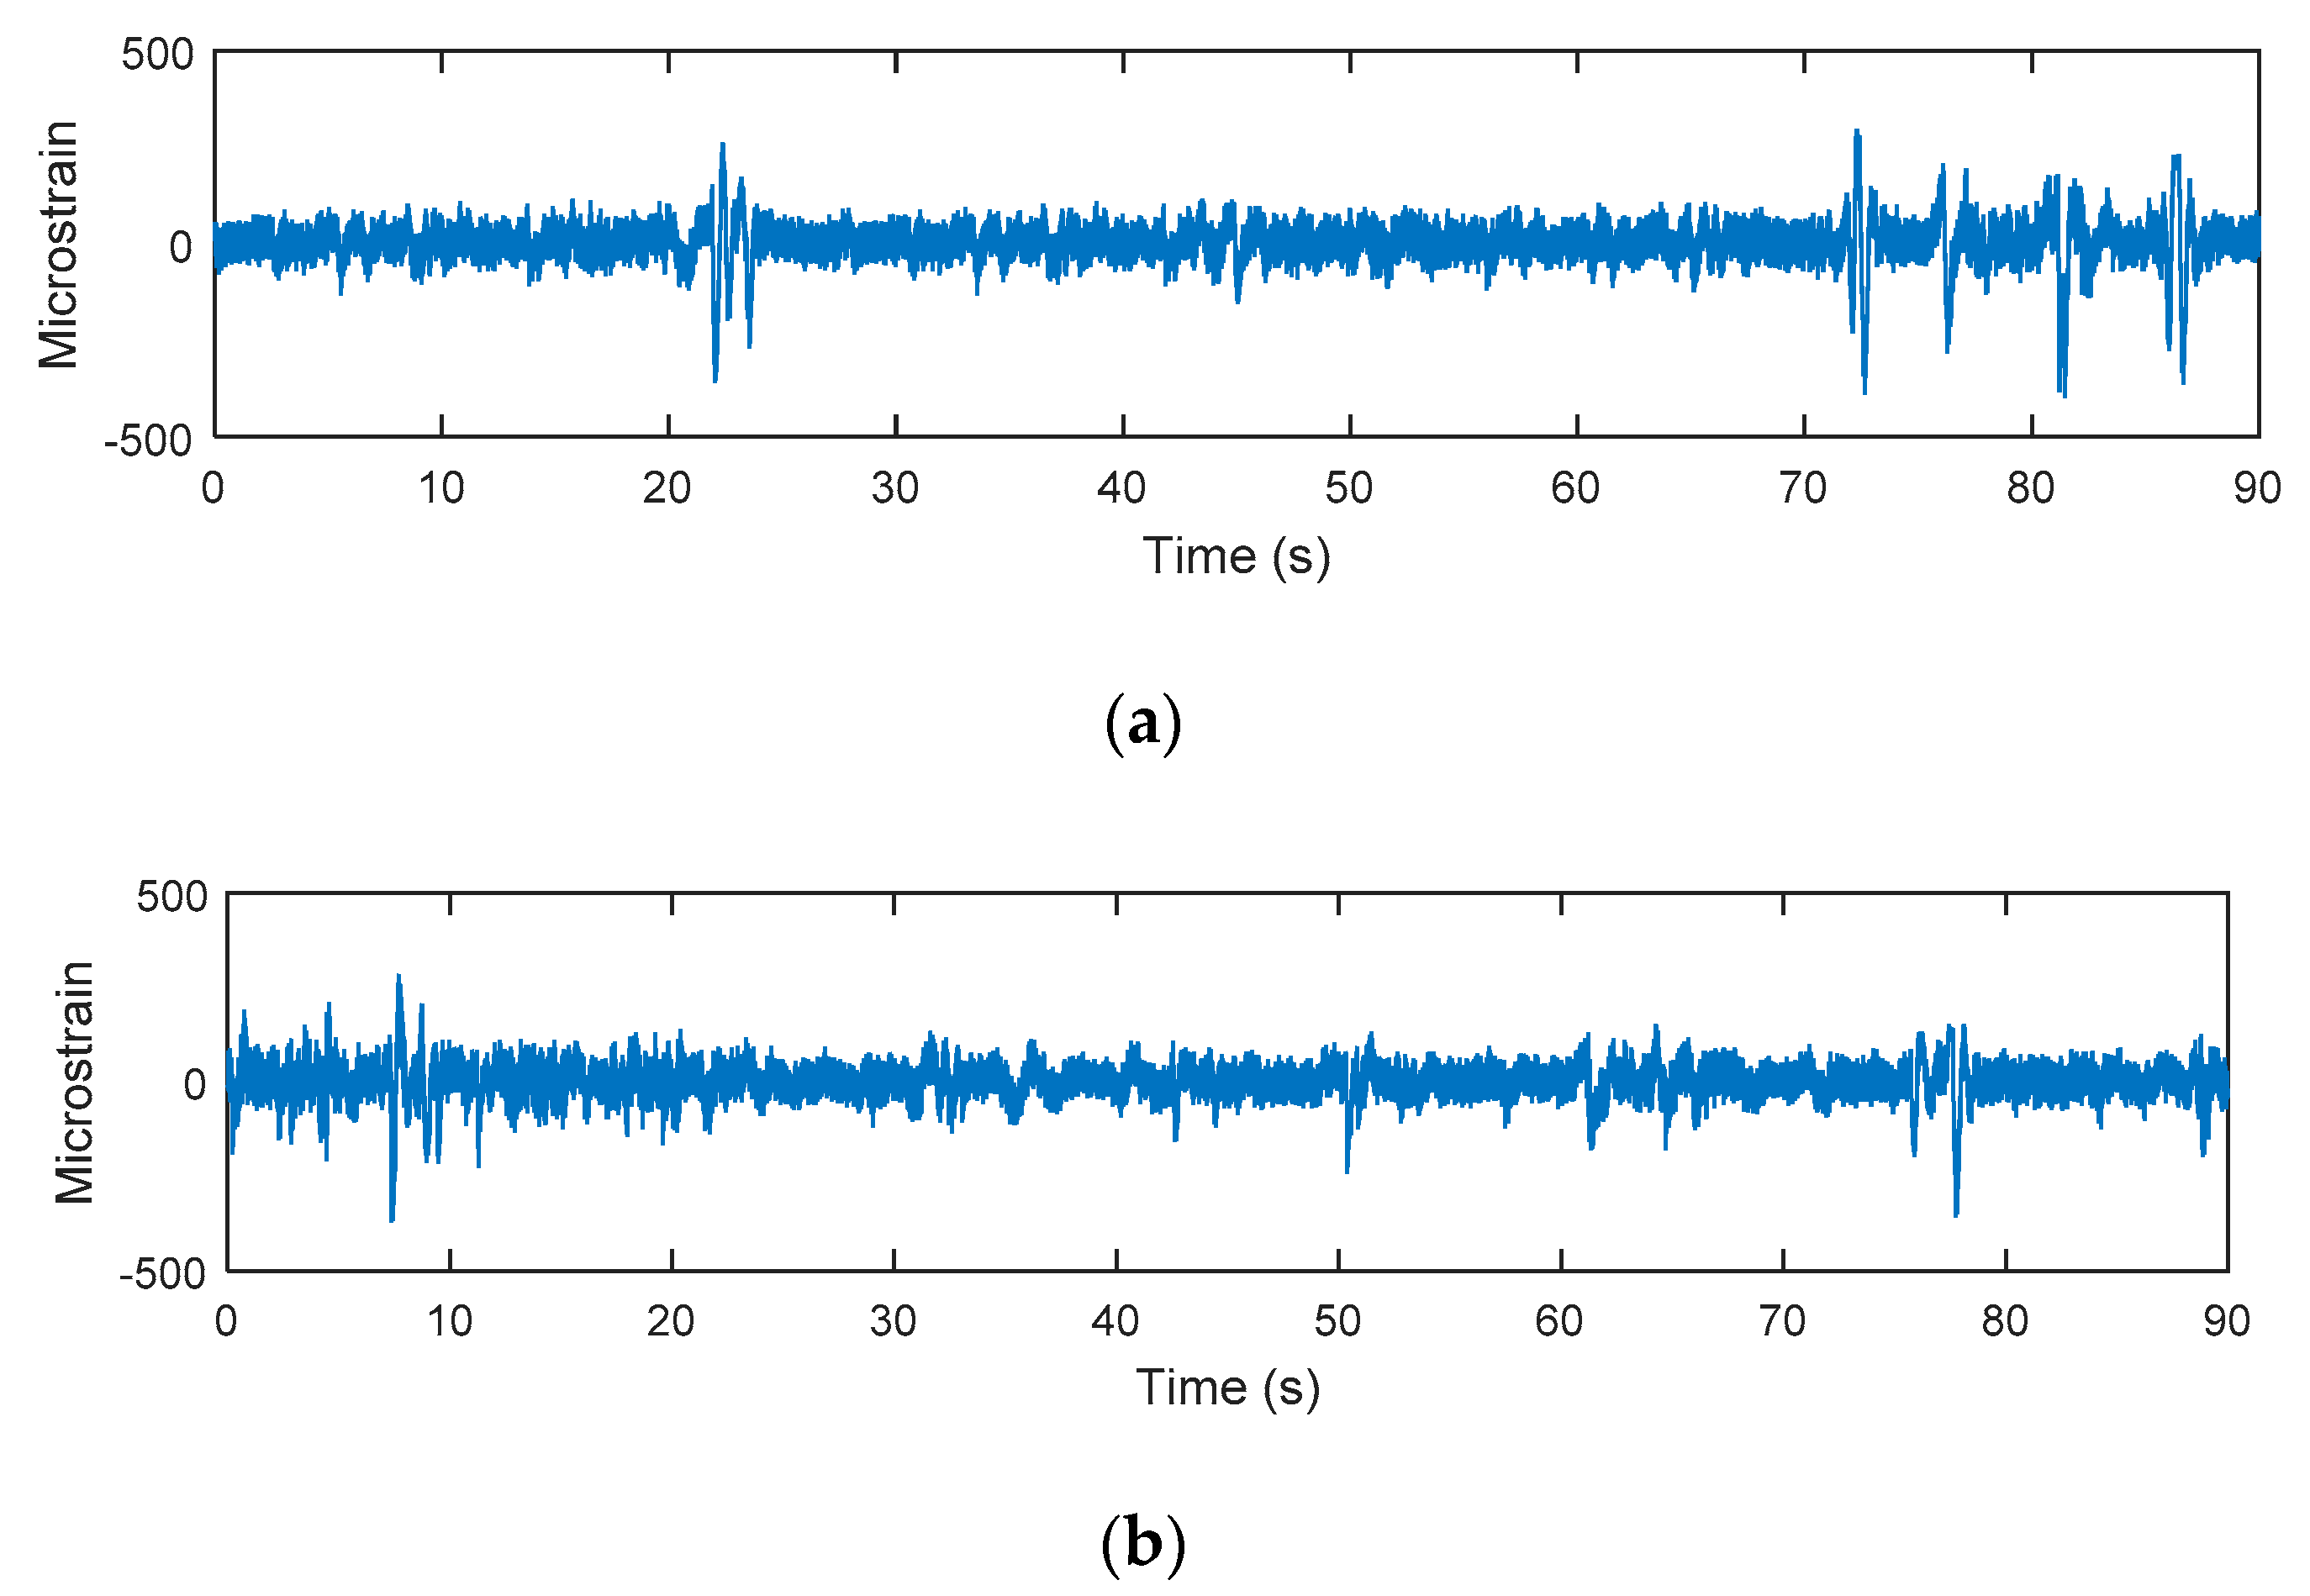
Figure 14.
Top mount acceleration signals: (a) Campus A, (b) Campus B.
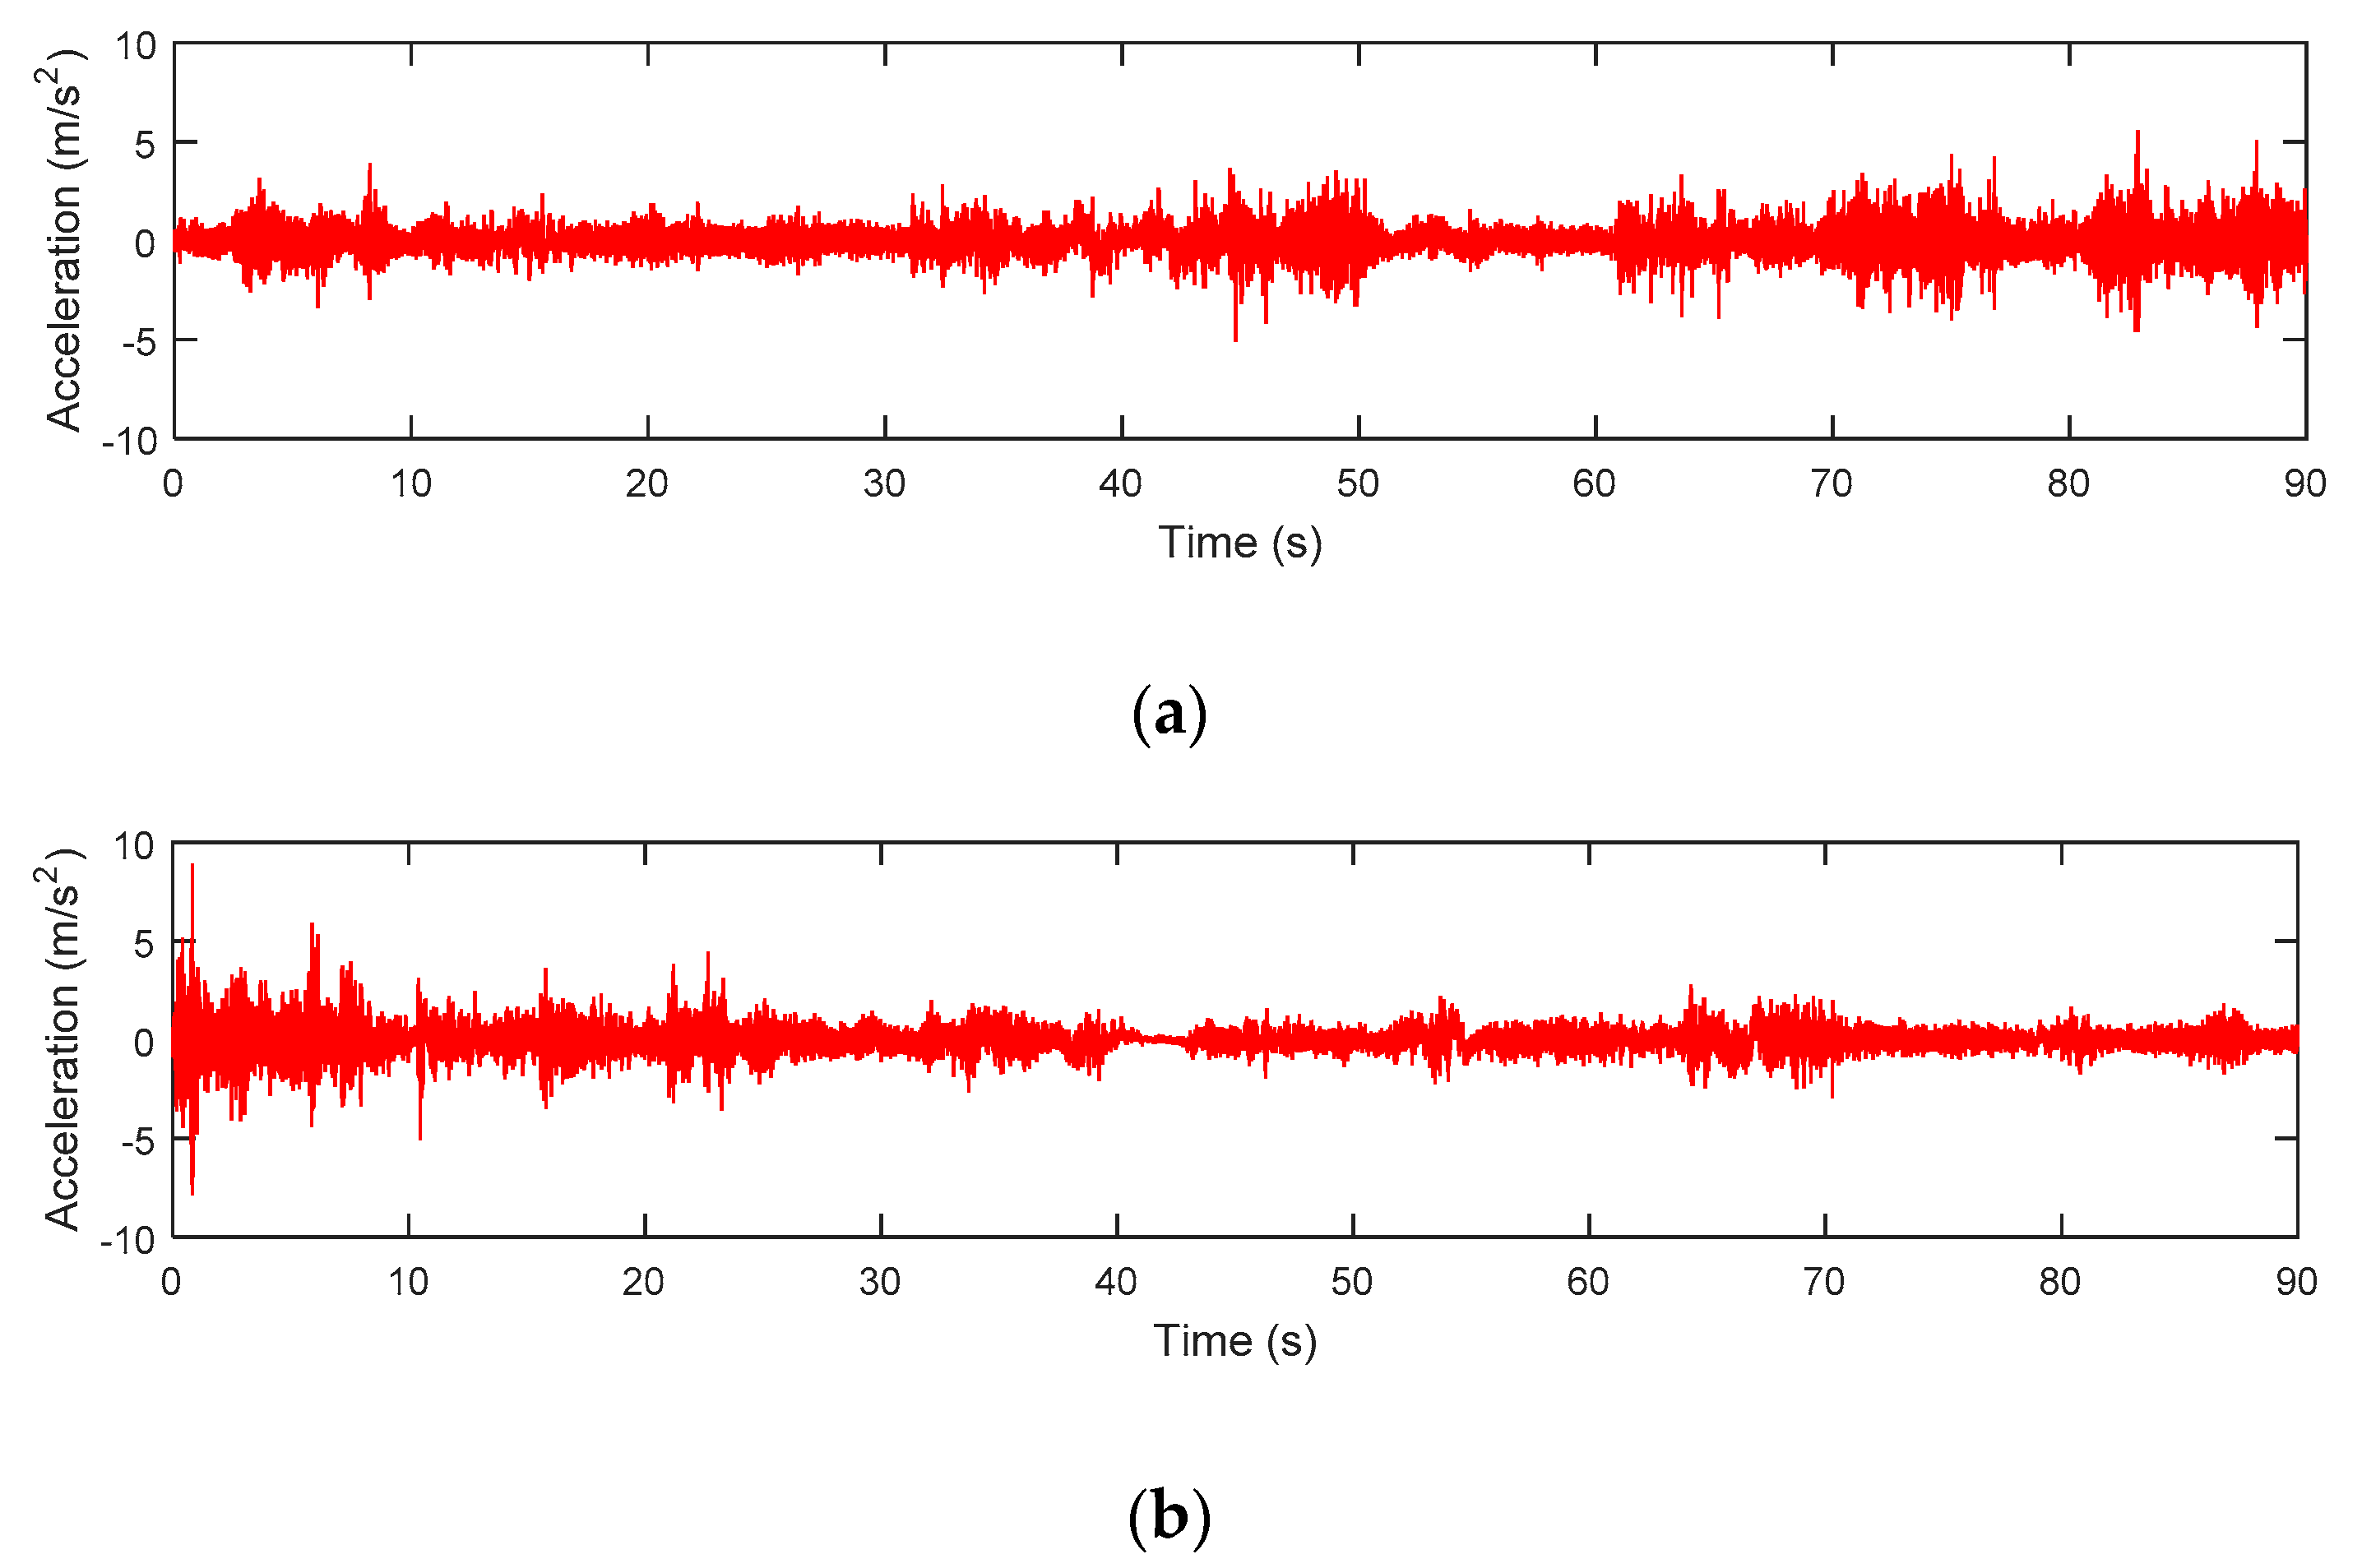
Figure 15.
Lower arm acceleration signals: (a) Campus A, (b) Campus B.
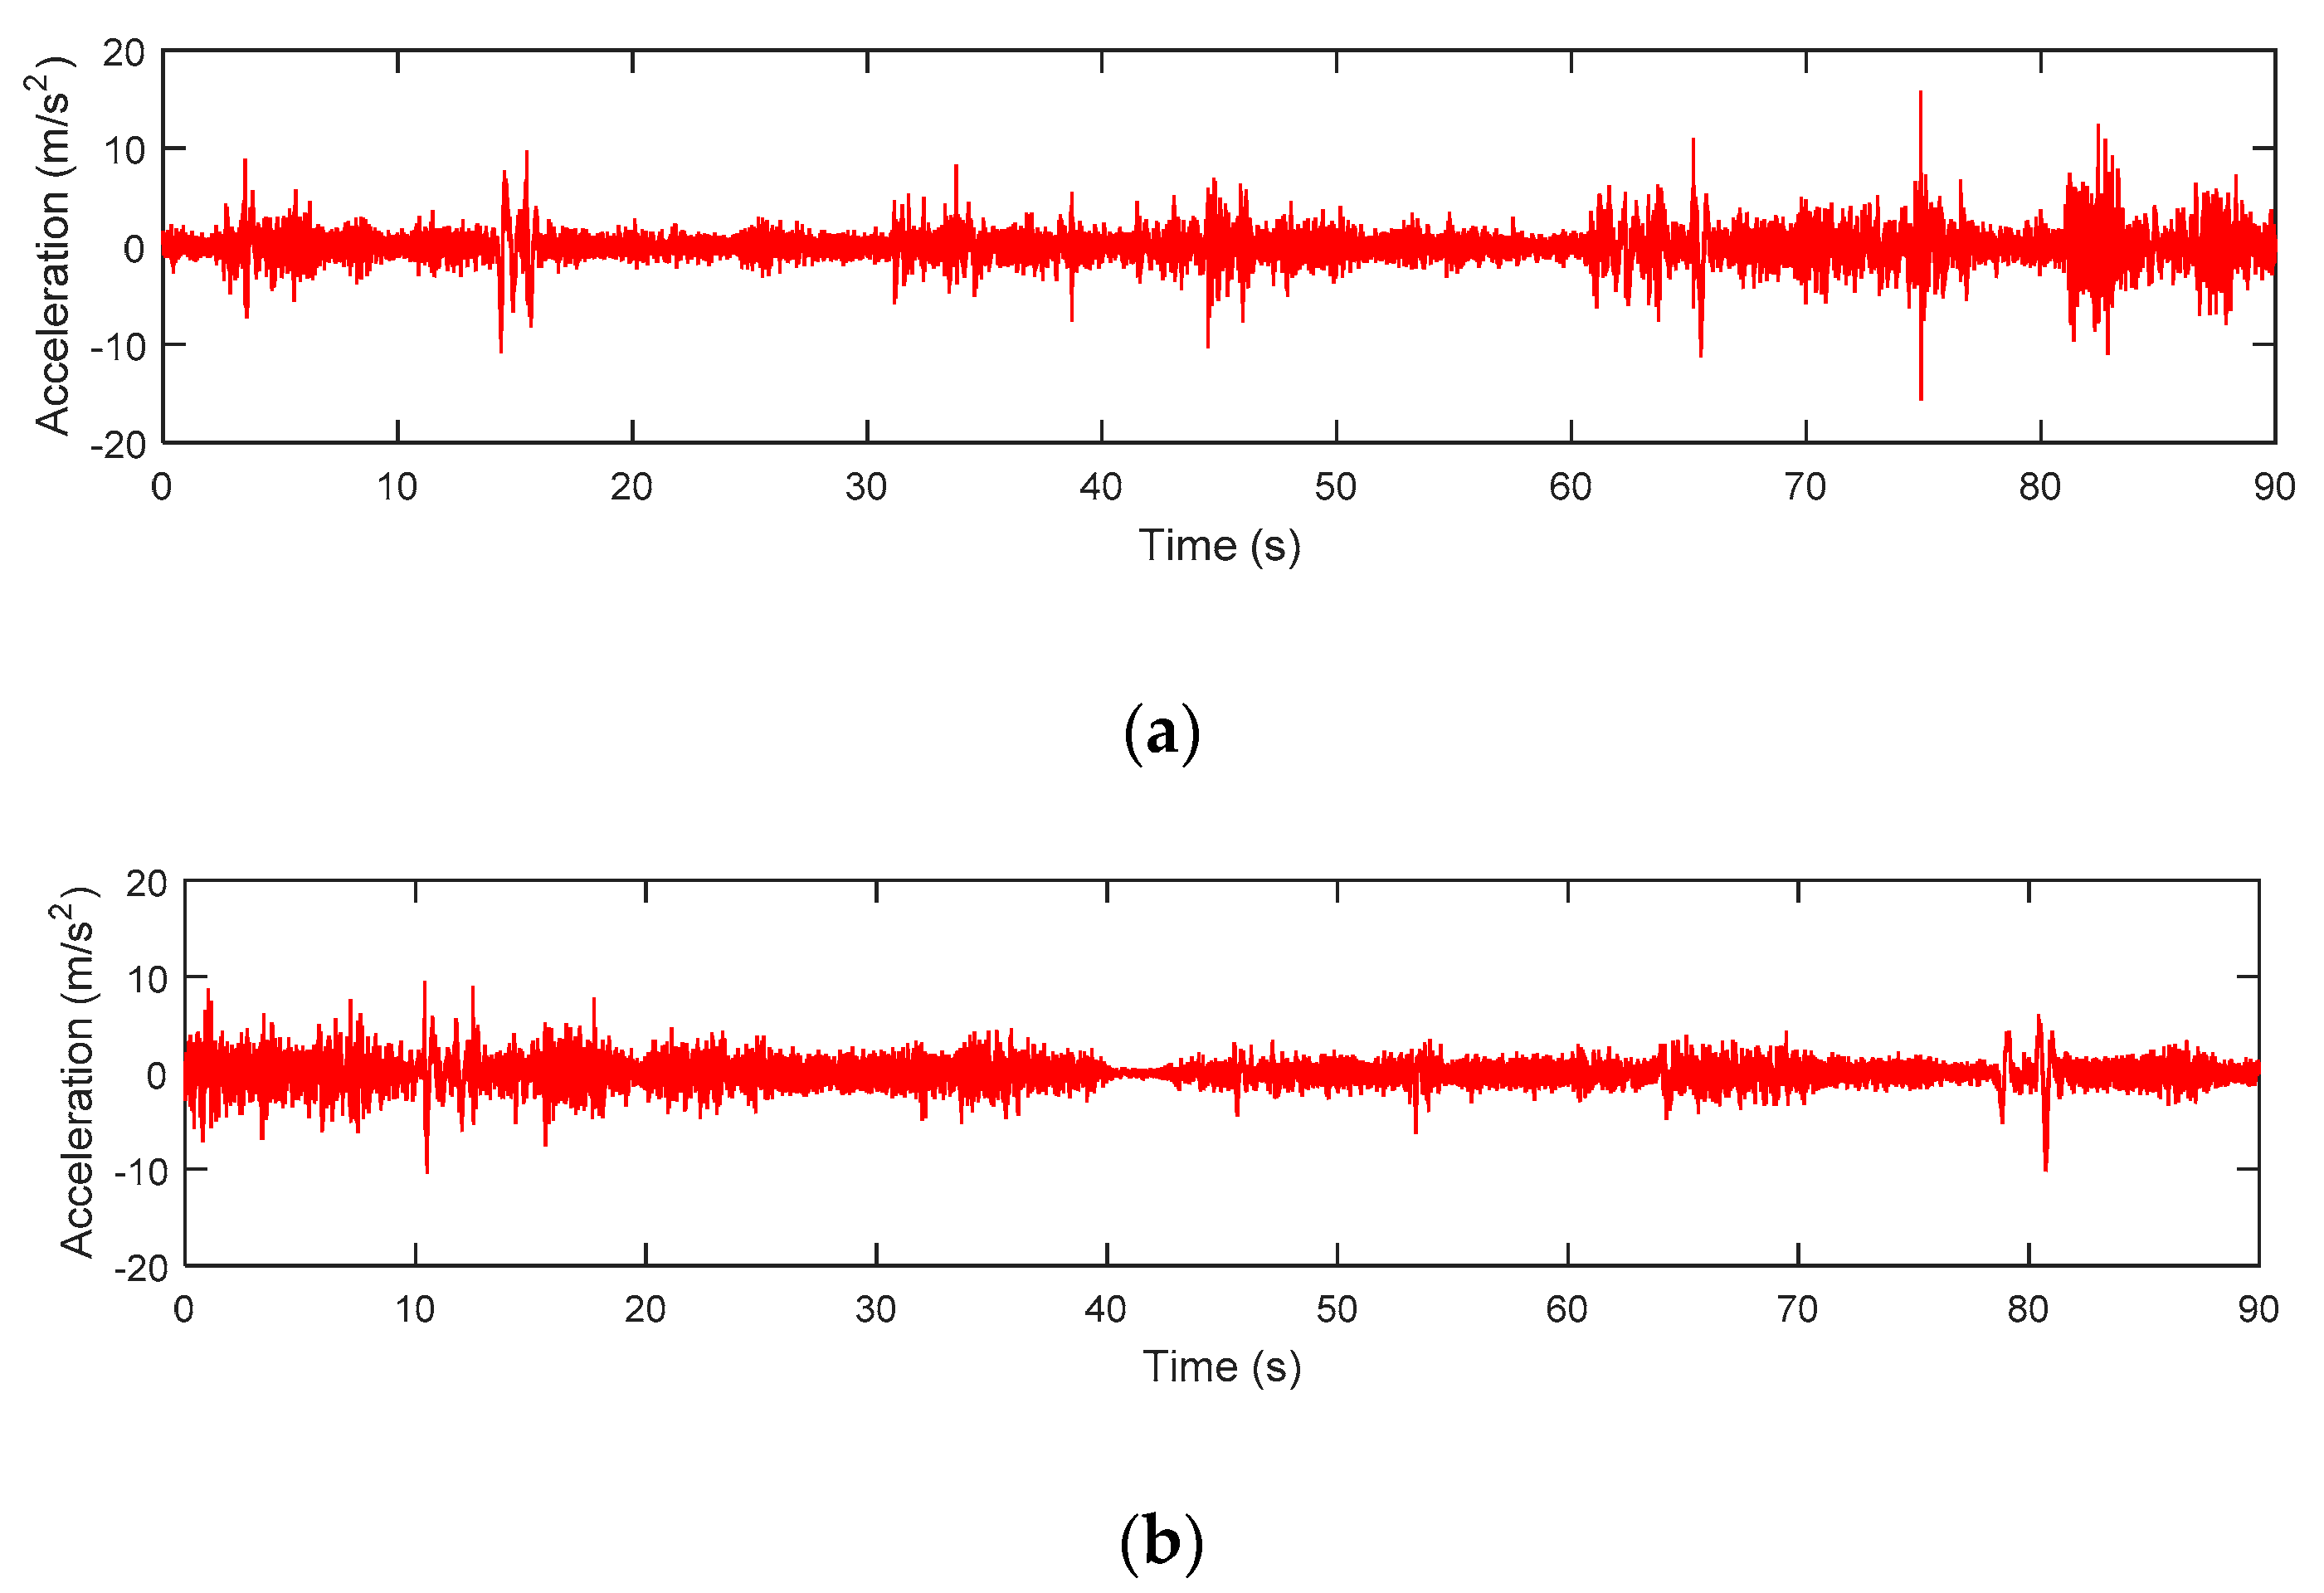
Figure 16.
Elastic-energy strain signals: (a) Campus A, (b) Campus B.
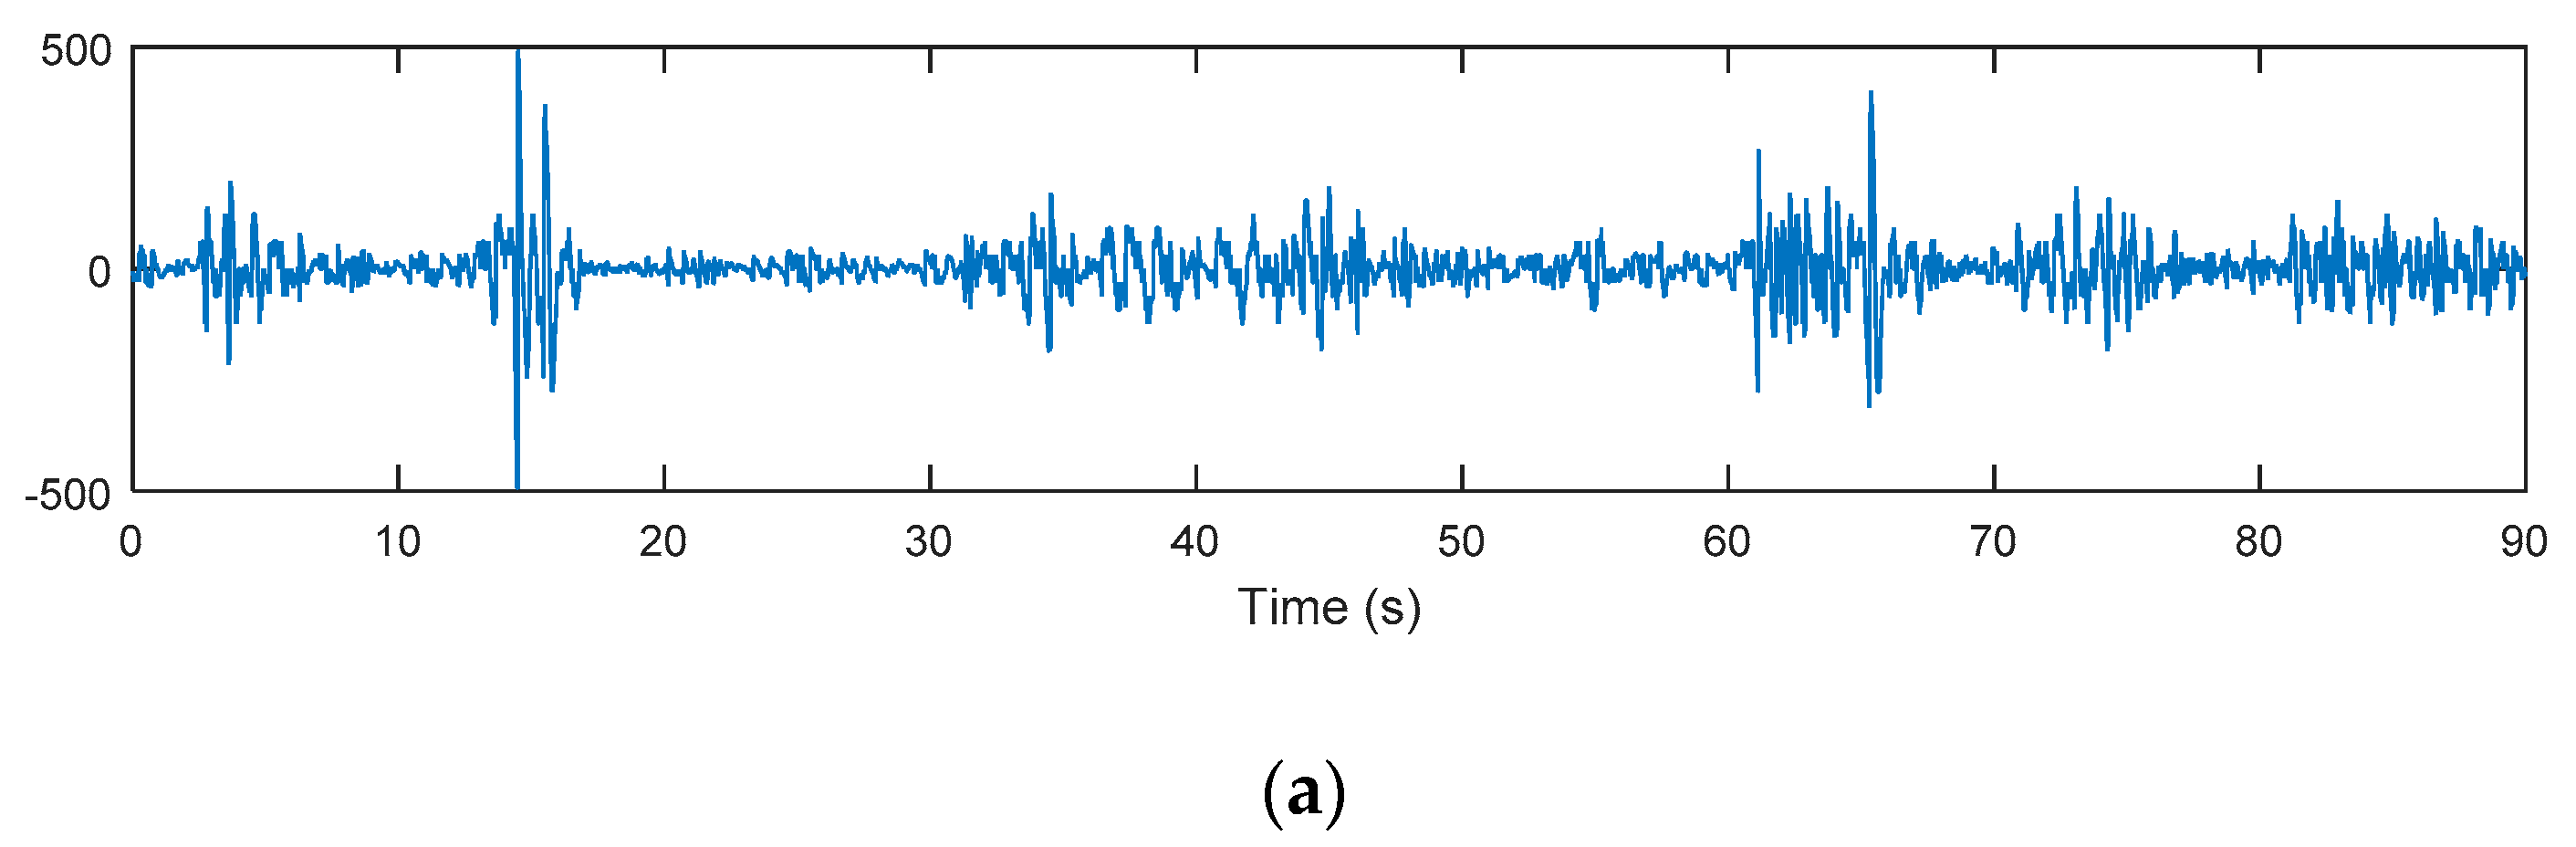
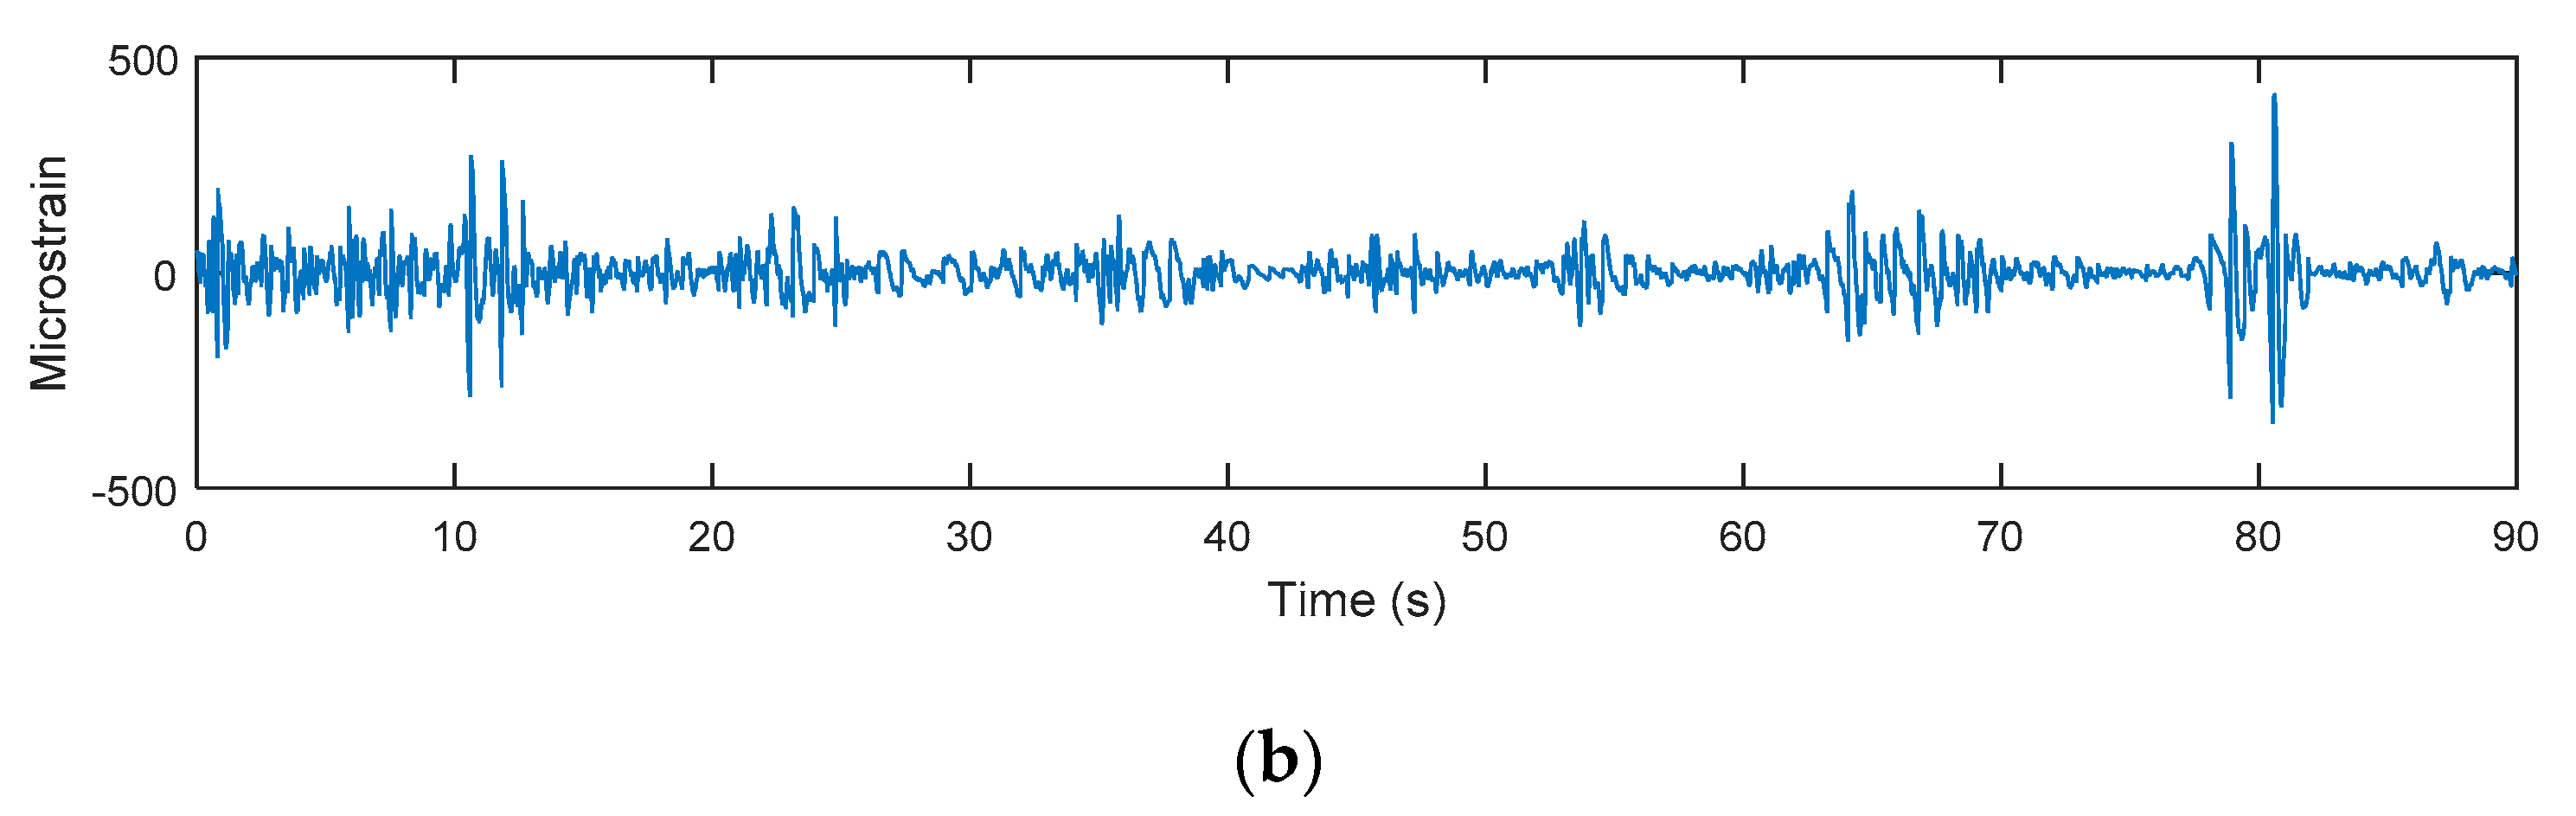
Figure 17.
Measured strain signals: (a) Campus A, (b) Campus B.

Figure 18.
Scatter band for strain measurement and elastic-energy model fatigue life using various models: (a) Coffin-Manson, (b) Morrow, (c) Smith-Watson-Topper (SWT).
Figure 18.
Scatter band for strain measurement and elastic-energy model fatigue life using various models: (a) Coffin-Manson, (b) Morrow, (c) Smith-Watson-Topper (SWT).
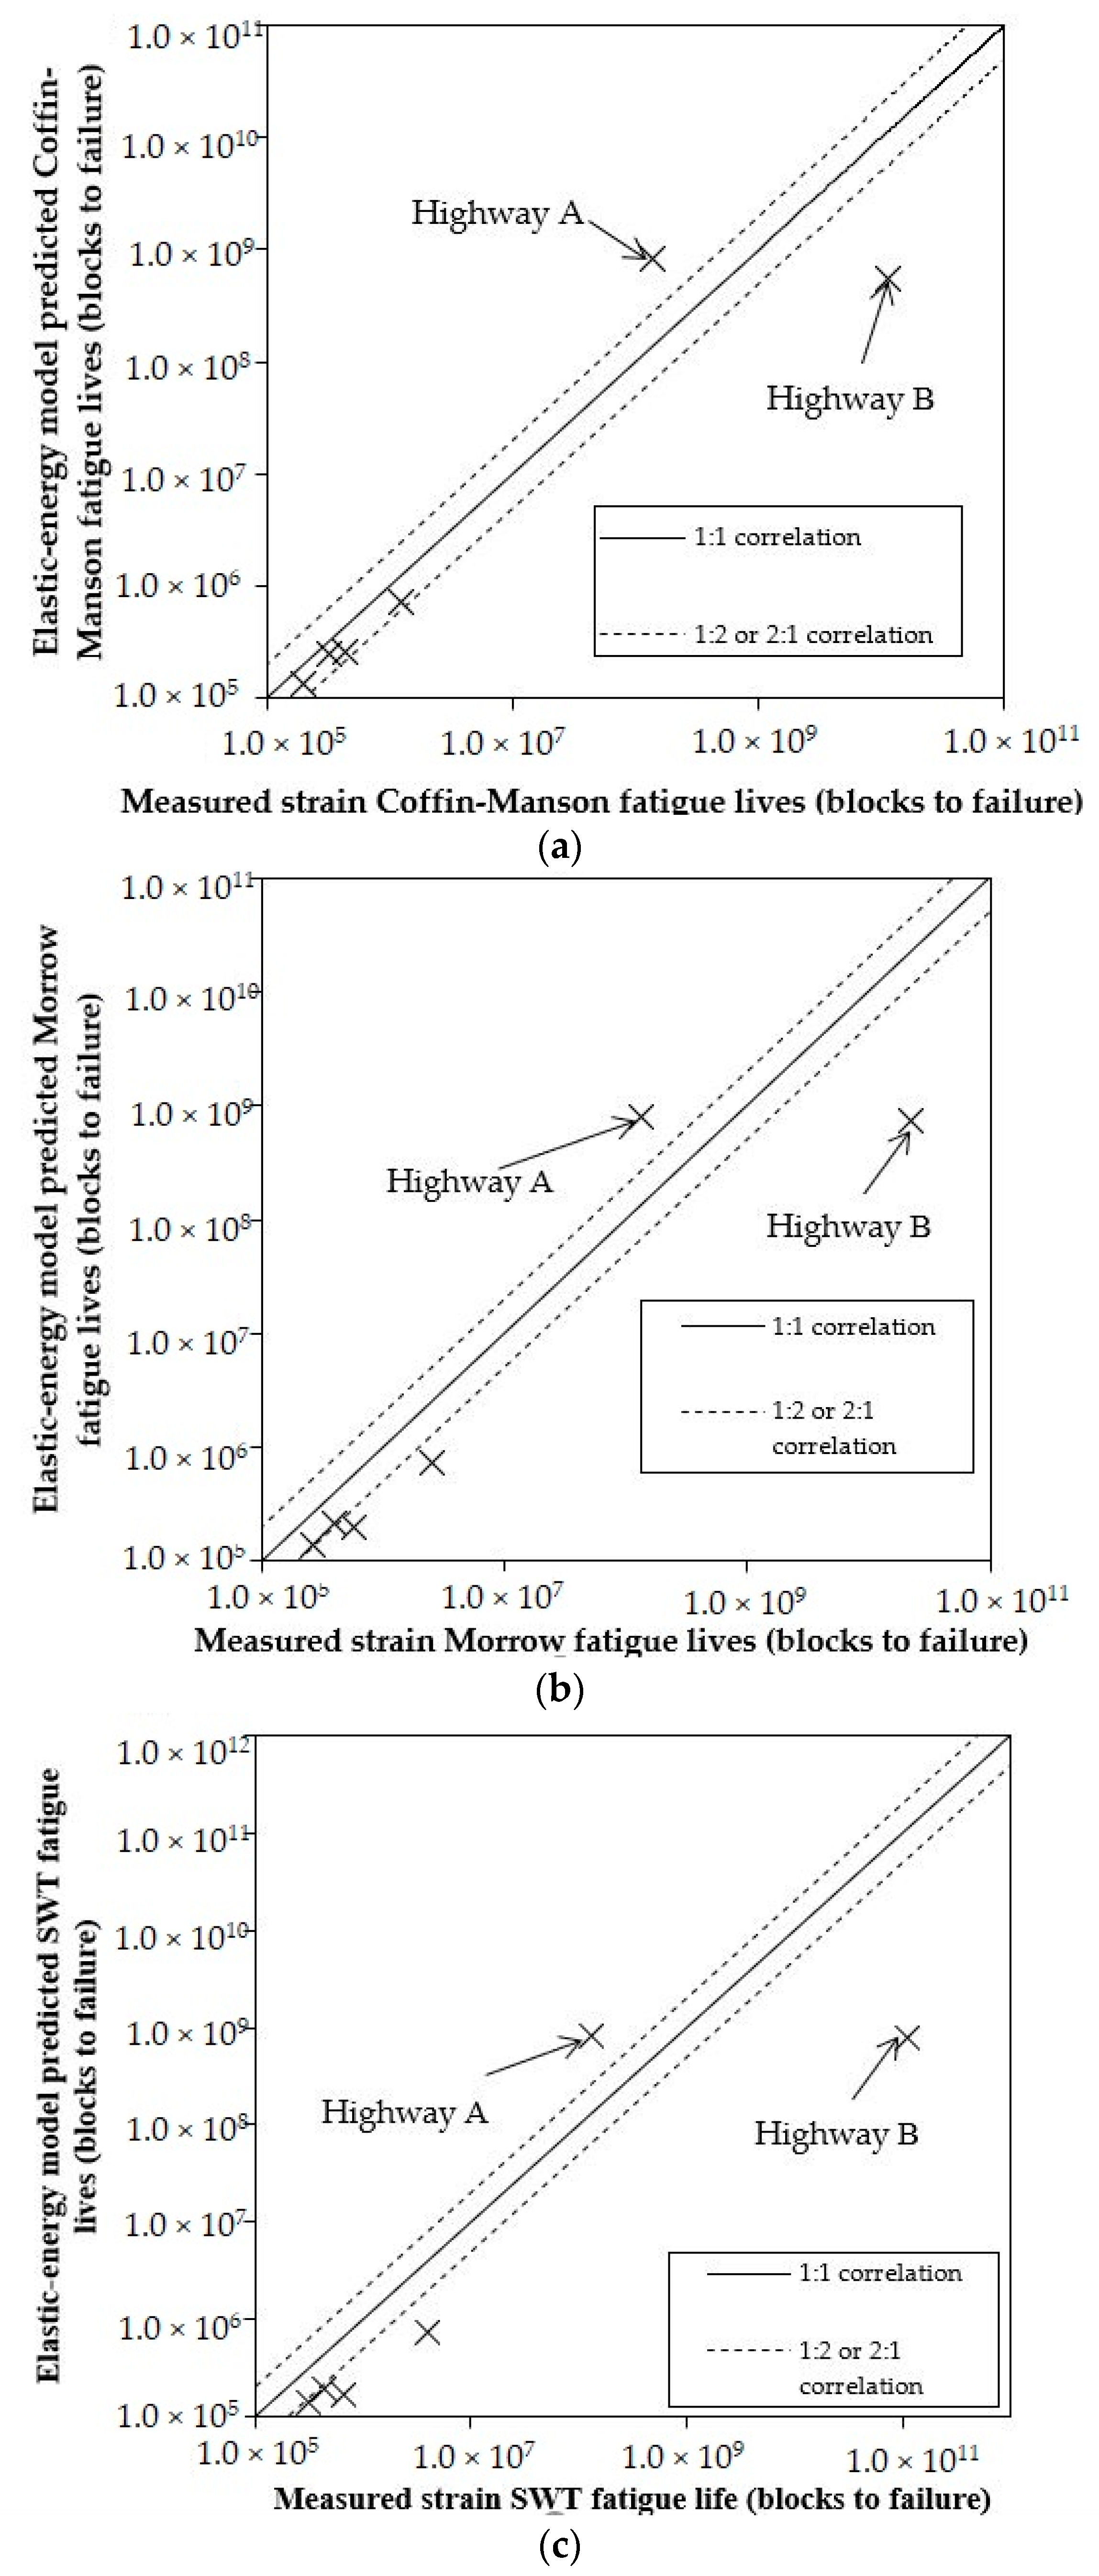
Figure 19.
Scatter band for strain measurement and elastic-energy model fatigue life using various models: (a) Coffin-Manson, (b) Morrow, (c) SWT.
Figure 19.
Scatter band for strain measurement and elastic-energy model fatigue life using various models: (a) Coffin-Manson, (b) Morrow, (c) SWT.

Table 1.
Cyclic properties of Carbon Steel SAE 5160
| Mechanical Properties | Value |
|---|---|
| Ultimate tensile strength, Su (MPa) | 1584 |
| Elastic modulus | 207 |
| Fatigue strength coefficient | 2063 |
| Fatigue strength exponent | −0.08 |
| Fatigue ductility coefficient | 9.56 |
| Fatigue ductility exponent | −1.05 |
Table 2.
Global statistic parameter for strain signals.
| Road Class | Elastic-energy Model | Measured | ||
|---|---|---|---|---|
| r.m.s | Kurtosis | r.m.s | Kurtosis | |
| Highway A | 29.42 | 4.02 | 35.16 | 3.32 |
| Highway B | 25.64 | 3.81 | 32.37 | 3.45 |
| Rural A | 56.06 | 18.27 | 53.86 | 12.68 |
| Rural B | 49.83 | 14.64 | 46.71 | 9.49 |
| Campus A | 57.19 | 11.35 | 52.20 | 7.75 |
| Campus B | 55.17 | 15.16 | 54.91 | 8.98 |
Table 3.
Predicted Coffin-Manson fatigue lives using measured and elastic-energy model converted strain.
Table 3.
Predicted Coffin-Manson fatigue lives using measured and elastic-energy model converted strain.
| Roads | Strain Fatigue Durability Life (Blocks to Failure) | Energy Model Converted Fatigue Life (Blocks to Failure) |
|---|---|---|
| Highway A | 1.37 × 10⁸ | 8.13 × 10⁸ |
| Highway B | 1.13 × 10¹⁰ | 5.46 × 10⁸ |
| Rural A | 1.98 × 10⁵ | 1.37 × 10⁵ |
| Rural B | 3.26 × 10⁵ | 2.50 × 10⁵ |
| Campus A | 4.28 × 10⁵ | 2.56 × 10⁵ |
| Campus B | 1.25 × 10⁶ | 7.25 × 10⁵ |
Table 4.
Predicted Morrow fatigue lives using measured and elastic-energy model converted strain.
| Roads | Strain Fatigue Durability Life (Blocks to Failure) | Energy Model Converted Fatigue Life (Blocks to Failure) |
|---|---|---|
| Highway A | 1.32 × 10⁸ | 7.91 × 10⁸ |
| Highway B | 2.20 × 10¹⁰ | 7.42 × 10⁸ |
| Rural A | 2.59 × 10⁵ | 1.39 × 10⁵ |
| Rural B | 3.99 × 10⁵ | 2.15 × 10⁵ |
| Campus A | 5.60 × 10⁵ | 1.94 × 10⁵ |
| Campus B | 2.55 × 10⁶ | 7.23 × 10⁵ |
Table 5.
Predicted SWT fatigue lives using measured and elastic-energy model converted strain.
| Roads | Strain Fatigue Durability Life (Blocks to Failure) | Energy Model Converted Fatigue Life (Blocks to Failure) |
|---|---|---|
| Highway A | 1.32 × 10⁸ | 8.15 × 10⁸ |
| Highway B | 1.12 × 10¹¹ | 8.01 × 10⁸ |
| Rural A | 3.05 × 10⁵ | 1.39 × 10⁵ |
| Rural B | 4.55 × 10⁵ | 1.99 × 10⁵ |
| Campus A | 6.58 × 10⁵ | 1.74 × 10⁵ |
| Campus B | 3.99 × 10⁶ | 7.19 × 10⁵ |
© 2019 by the authors. Licensee MDPI, Basel, Switzerland. This article is an open access article distributed under the terms and conditions of the Creative Commons Attribution (CC BY) license (http://creativecommons.org/licenses/by/4.0/).
Share and Cite
MDPI and ACS Style
Kong, Y.S.; Abdullah, S.; Schramm, D.; Omar, M.Z.; Mohamed Haris, S. Evaluation of Energy-Based Model Generated Strain Signals for Carbon Steel Spring Fatigue Life Assessment. Metals 2019, 9, 213. https://doi.org/10.3390/met9020213
AMA Style
Kong YS, Abdullah S, Schramm D, Omar MZ, Mohamed Haris S. Evaluation of Energy-Based Model Generated Strain Signals for Carbon Steel Spring Fatigue Life Assessment. Metals. 2019; 9(2):213. https://doi.org/10.3390/met9020213
Chicago/Turabian StyleKong, Yat Sheng, Shahrum Abdullah, Dieter Schramm, Mohd Zaidi Omar, and Sallehuddin Mohamed Haris. 2019. "Evaluation of Energy-Based Model Generated Strain Signals for Carbon Steel Spring Fatigue Life Assessment" Metals 9, no. 2: 213. https://doi.org/10.3390/met9020213
Note that from the first issue of 2016, this journal uses article numbers instead of page numbers. See further details here.