Article

The Evaluation of Laser Weldability of the Third-Generation Advanced High Strength Steel

by
António B. Pereira
1,*,
Rafael O. Santos
1,2,3,
Bruno S. Carvalho
1,
Marilena C. Butuc
1,
Gabriela Vincze
1 and
Luciano P. Moreira
3
1
TEMA—Centre of Mechanical Technology and Automation, Department of Mechanical Engineering, University of Aveiro, 3810-193 Aveiro, Portugal
2
Department of Mechanical Engineering, Centro Federal de Educação Tecnológica Celso Suckow da Fonseca CEFET/RJ, 23953-030 Rio de Janeiro, Brazil
3
Graduation Program of Metallurgical Engineering, Universidade Federal Fluminense, 27255-125 Volta Redonda, Brazil
*
Author to whom correspondence should be addressed.
Metals 2019, 9(10), 1051; https://doi.org/10.3390/met9101051
Submission received: 8 August 2019 / Revised: 22 September 2019 / Accepted: 25 September 2019 / Published: 27 September 2019

Abstract

:
To meet the demands of vehicular safety and greenhouse gas emission reduction, the automotive industry is increasingly using advanced high strength steels (AHSS) in the production of the components. With the development of the new generation of AHSS, it is essential to study their behavior towards manufacturing processes used in the automotive industry. For this purpose, the welding capability of newly developed third-generation Gen3 980T steel was investigated using the Nd:YAG (Neodymium:Yittrium Aluminum Garnet) laser-welding with different parameter conditions. The analysis was made by uniaxial tensile tests, micro-hardness, Scanning Electron Microscopy (SEM) and X-Ray Diffraction (XRD). The criteria used to evaluate the quality of the weld were the distance between the fracture and the weld bead and the surface finish. A relationship between the quality of the weld and the energy density was observed, expressed by a partial penetration for values below the optimal, and by irregularities in the weld bead and a high number of spatters for the values above the optimal.

1. Introduction

The first generation of AHSS, including the Dual-Phase steel (DP) and Transformation-Induced Plasticity steel (TRIP), benefited from the desired mechanical properties of sheet-metal forming obtained by multiphase structures. These steels were of great significance in the automotive industry, not only for the high performance of energy absorption in the crash test, but also by growing environmental concerns [1]. Materials with improved properties allowed manufacturing components with reduced thickness and, thus, lighter vehicles with reduced fuel consumption and fewer greenhouse gas emissions. The second generation brought the Twinning-Induced Plasticity steels (TWIP), Lightweight steel with Induced Plasticity (L-IP), and Austenitic Stainless Steel (AUST.SS), which displays, in the global formability diagram (so-called banana diagram), a higher level of elongation and tensile strength [2]. Despite excellent mechanical properties, the second generation showed some problems relating to the cost and processing that is associated with a high level of Mn (between 20 and 30 wt. %). The third generation refers to a new class of steel with cost slightly higher than the first generation that provides mechanical properties between the first and second generation by means of multiphase microstructure with a significant amount of retained austenite [2,3], in which the steel, known as Quenching and Partitioning steel (Q&P), stands out.
The automotive industry is increasingly using components produced from AHSS for chassis and Body-In-White (BIW). It is regarded as the most efficient way to satisfy the goal of being lightweight while also maintaining automotive safety. Recent studies developed by Chen et al. [4] evaluated the formability of Q&P 980 in comparison to DP 980. They found that the formability of Q&P 980 is better than DP 980. Liu et al. [5] investigated the microstructure and the mechanical properties of single- and double-pulse resistance spot-welding of Q&P 980 steel. The present authors showed that martensite was the predominate microstructure in the weldment and they concluded that the Q&P 980 steel was susceptible to liquation crack formation. Table 1 presents the mechanical properties found by [4,5] for the third-generation Q&P 980 steel.
According to Li et al. [6] and Guo et al. [7], welding is a primary manufacturing process used by the automotive industry to assembly mainly steel parts. The most widely adopted technique is resistance spot-welding (RSW) due to its low cost, robustness, and excellent mass-production capacity [8]. However, RSW presents significant problems regarding aluminum alloy applications, such as rapid electrode cap wear and inconsistent weld quality. Thus, different joining processes such as self-piercing riveting (SPR), clinching, and adhesive bonding are preferred for joining aluminum alloy parts and dissimilar materials [9,10]. However, mechanical joining processes have inconveniences such as the requirement of access to both sides of the join to support the materials during riveting, and quality finishing of the bottom surface potentially not being aesthetically acceptable [11]. Xue et al. [12] applied a pulsed Nd:YAG laser to weld dissimilar lap joints of titanium alloy (Ti6Al4V) with aluminum alloy (AA6060). In this case, the pulse laser-welding was considered to potentially replace some joining processes such as RSW and friction stir welding [13], even in BIW with parts composed of dissimilar materials. Laser-welding has gained popularity in the metal-joining industry due to its ease of automation and flexibility. Wang et al. [14] pointed out laser-welding advantages such as high energy density, low heat input, and little deformation after welding. In this work, the recently developed third-generation Gen3 980T steel was evaluated in terms of weldability. For this purpose, several sets of parameters were tested applying the Nd:YAG laser-pulsed type for butt joints. The welding quality was analyzed in terms of mechanical properties and microstructure transformation in the area affected by the process.

2. Experimental Procedures

The weldability of Gen3 980T steel, produced as a cold-rolled sheet with the nominal thickness of 1.58 mm, was investigated through uniaxial tensile testing, a micro-hardness test, and microstructural characterization. Figure 1 shows schematically the procedure of the laser pulse used in the present work. The material sheet was cut to 14 mm × 38 mm with a guillotine. To improve the contact between the strip’s sheared edges for the welding process, the plate edges were milled using a low feed rate and plentiful cooling.

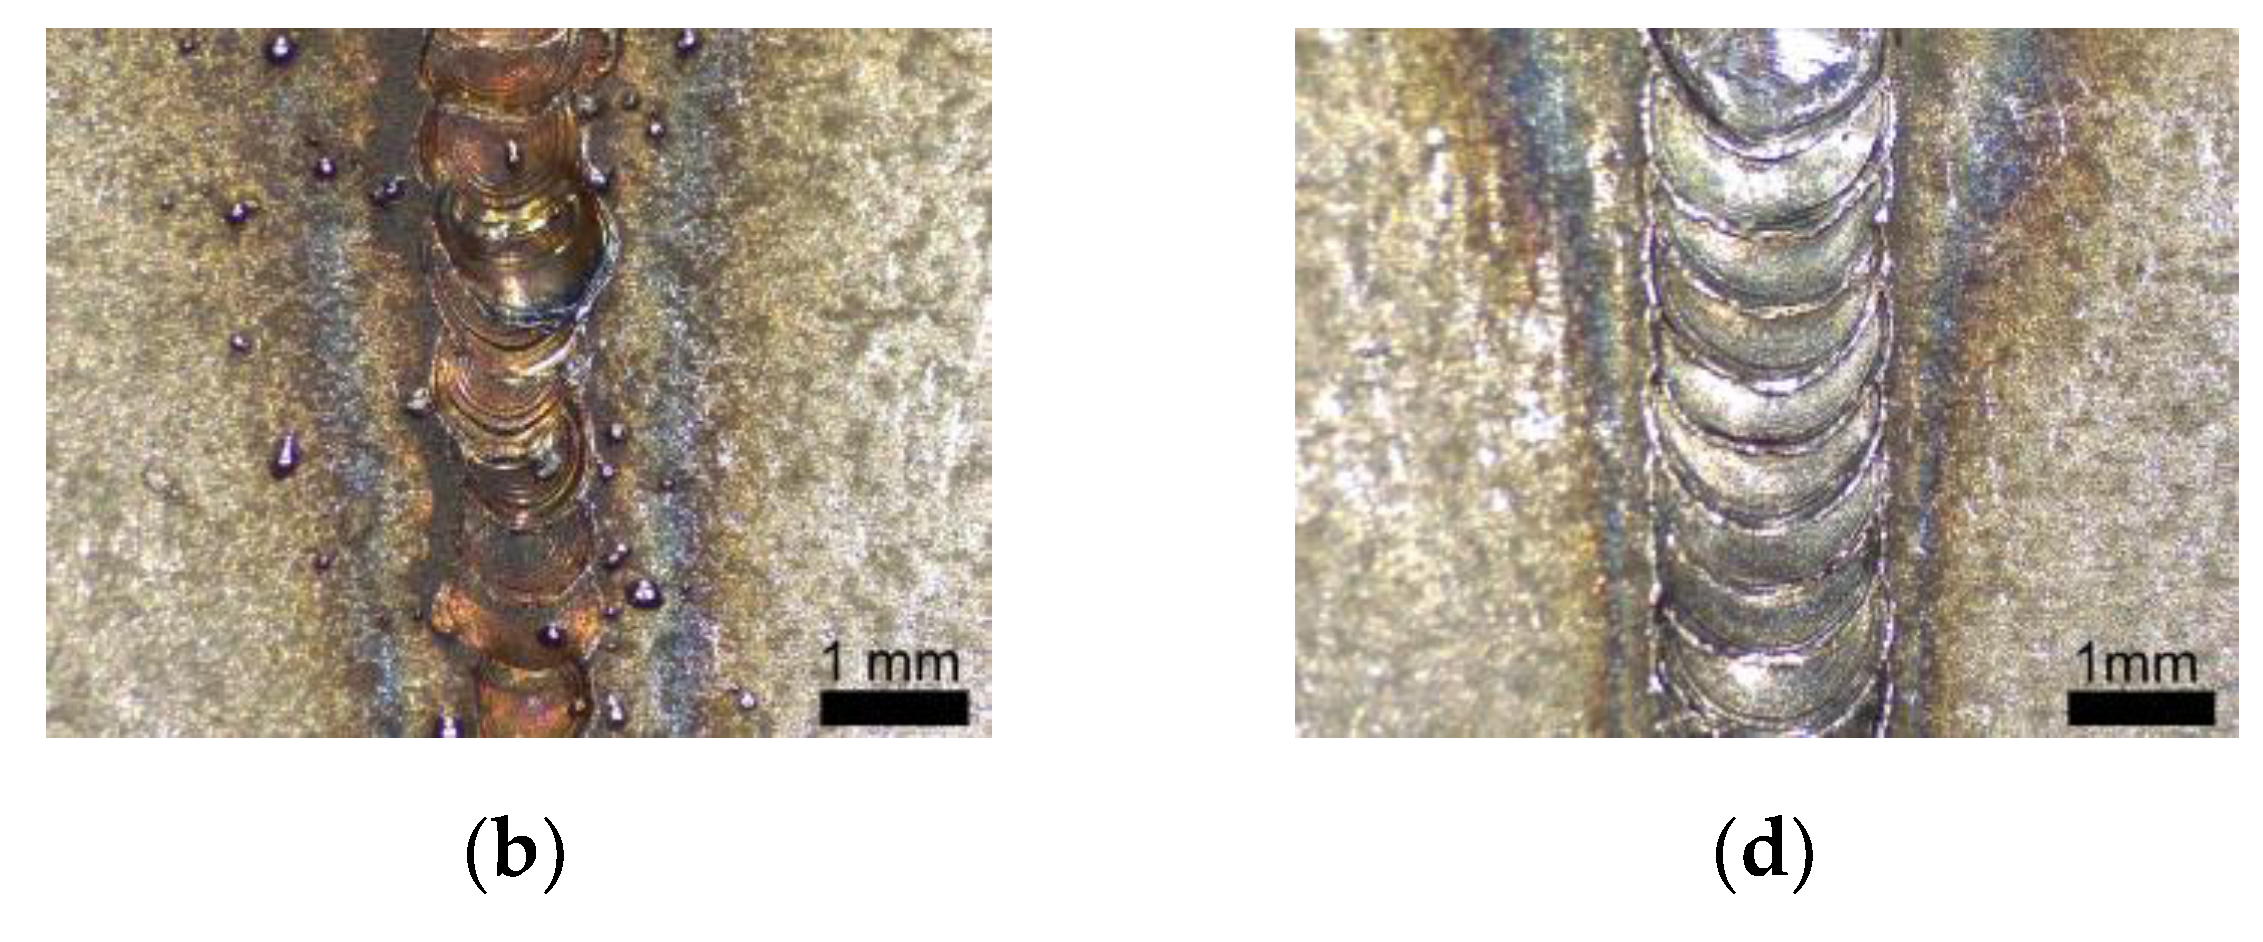
2.1. Laser-Welding Process Parameters

In this work, different sets of process parameters for the pulsed Nd:YAG laser-welding were tested to find the optimal conditions for the Gen3 980T steel with 1.58 mm thickness. The methodology used to select the best set of parameters was divided into three steps. In the first step, it was a trial-and-error process, based on the work developed by Xue et al. [15] that analyzed the variation of several parameters for the pulsed Nd:YAG laser-welding applied to a DP 1000 steel with 1 mm thickness. Then, the five best conditions obtained among the parameter sets tested were selected for the second step. Table 2 shows the selected sets of parameters used in the present work. Each sample composed of the connection of two Gen3 980T steel strips. For this purpose, the laser-welding machine SISMA SW A300 was employed, which provides an Nd:YAG laser beam with a focal length of 105 mm, as shown in Figure 1. For both samples, 50% of the rate of laser pulse overlapping, a simple rectangular pulse type, and 7 l/min of argon gas flow rate was used.
In the second step, to minimize the number of tests and the post-treatment of data, two criteria were established to evaluate the quality of the weld: (i) the material fracture should not occur in the weld bead. To this end, five different sets of parameters were tested in the uniaxial tensile test, using only the tensile test machine without additional equipment for strain measurement; (ii) the welded region must present a good appearance, with no or few superficial defects such as spatter, incomplete penetration, undercutting, and cracks.
The specimens that met both criteria were analyzed in more detail in the third step through their stress–strain curve response, hardness profile, and the microstructure transformation at the heat-affected zone (HAZ). For the selected case (Sample 3), two new specimens were prepared. In this case, the tensile tests were carried out using the digital image correlation (DIC) system for strain measurement.
The set of the parameters presented in Table 2 is intended for welding on only one side of the butt joints. One set of parameters for welding on both sides was also analyzed. During the first step it was observed that reducing pulse energy generated fewer spatters; however, there was incomplete penetration. Thus, the laser-welding on both sides of the specimens applying lower pulse energy was also tested. This strategy allows the obtaining of a complete penetration with fewer spatters. Table 3 presents the set of parameters used to produce the weld bead on both sides. The weld bead aspect was analyzed with the aid of the stereomicroscope Leica EZ4W using a magnification of 16×.

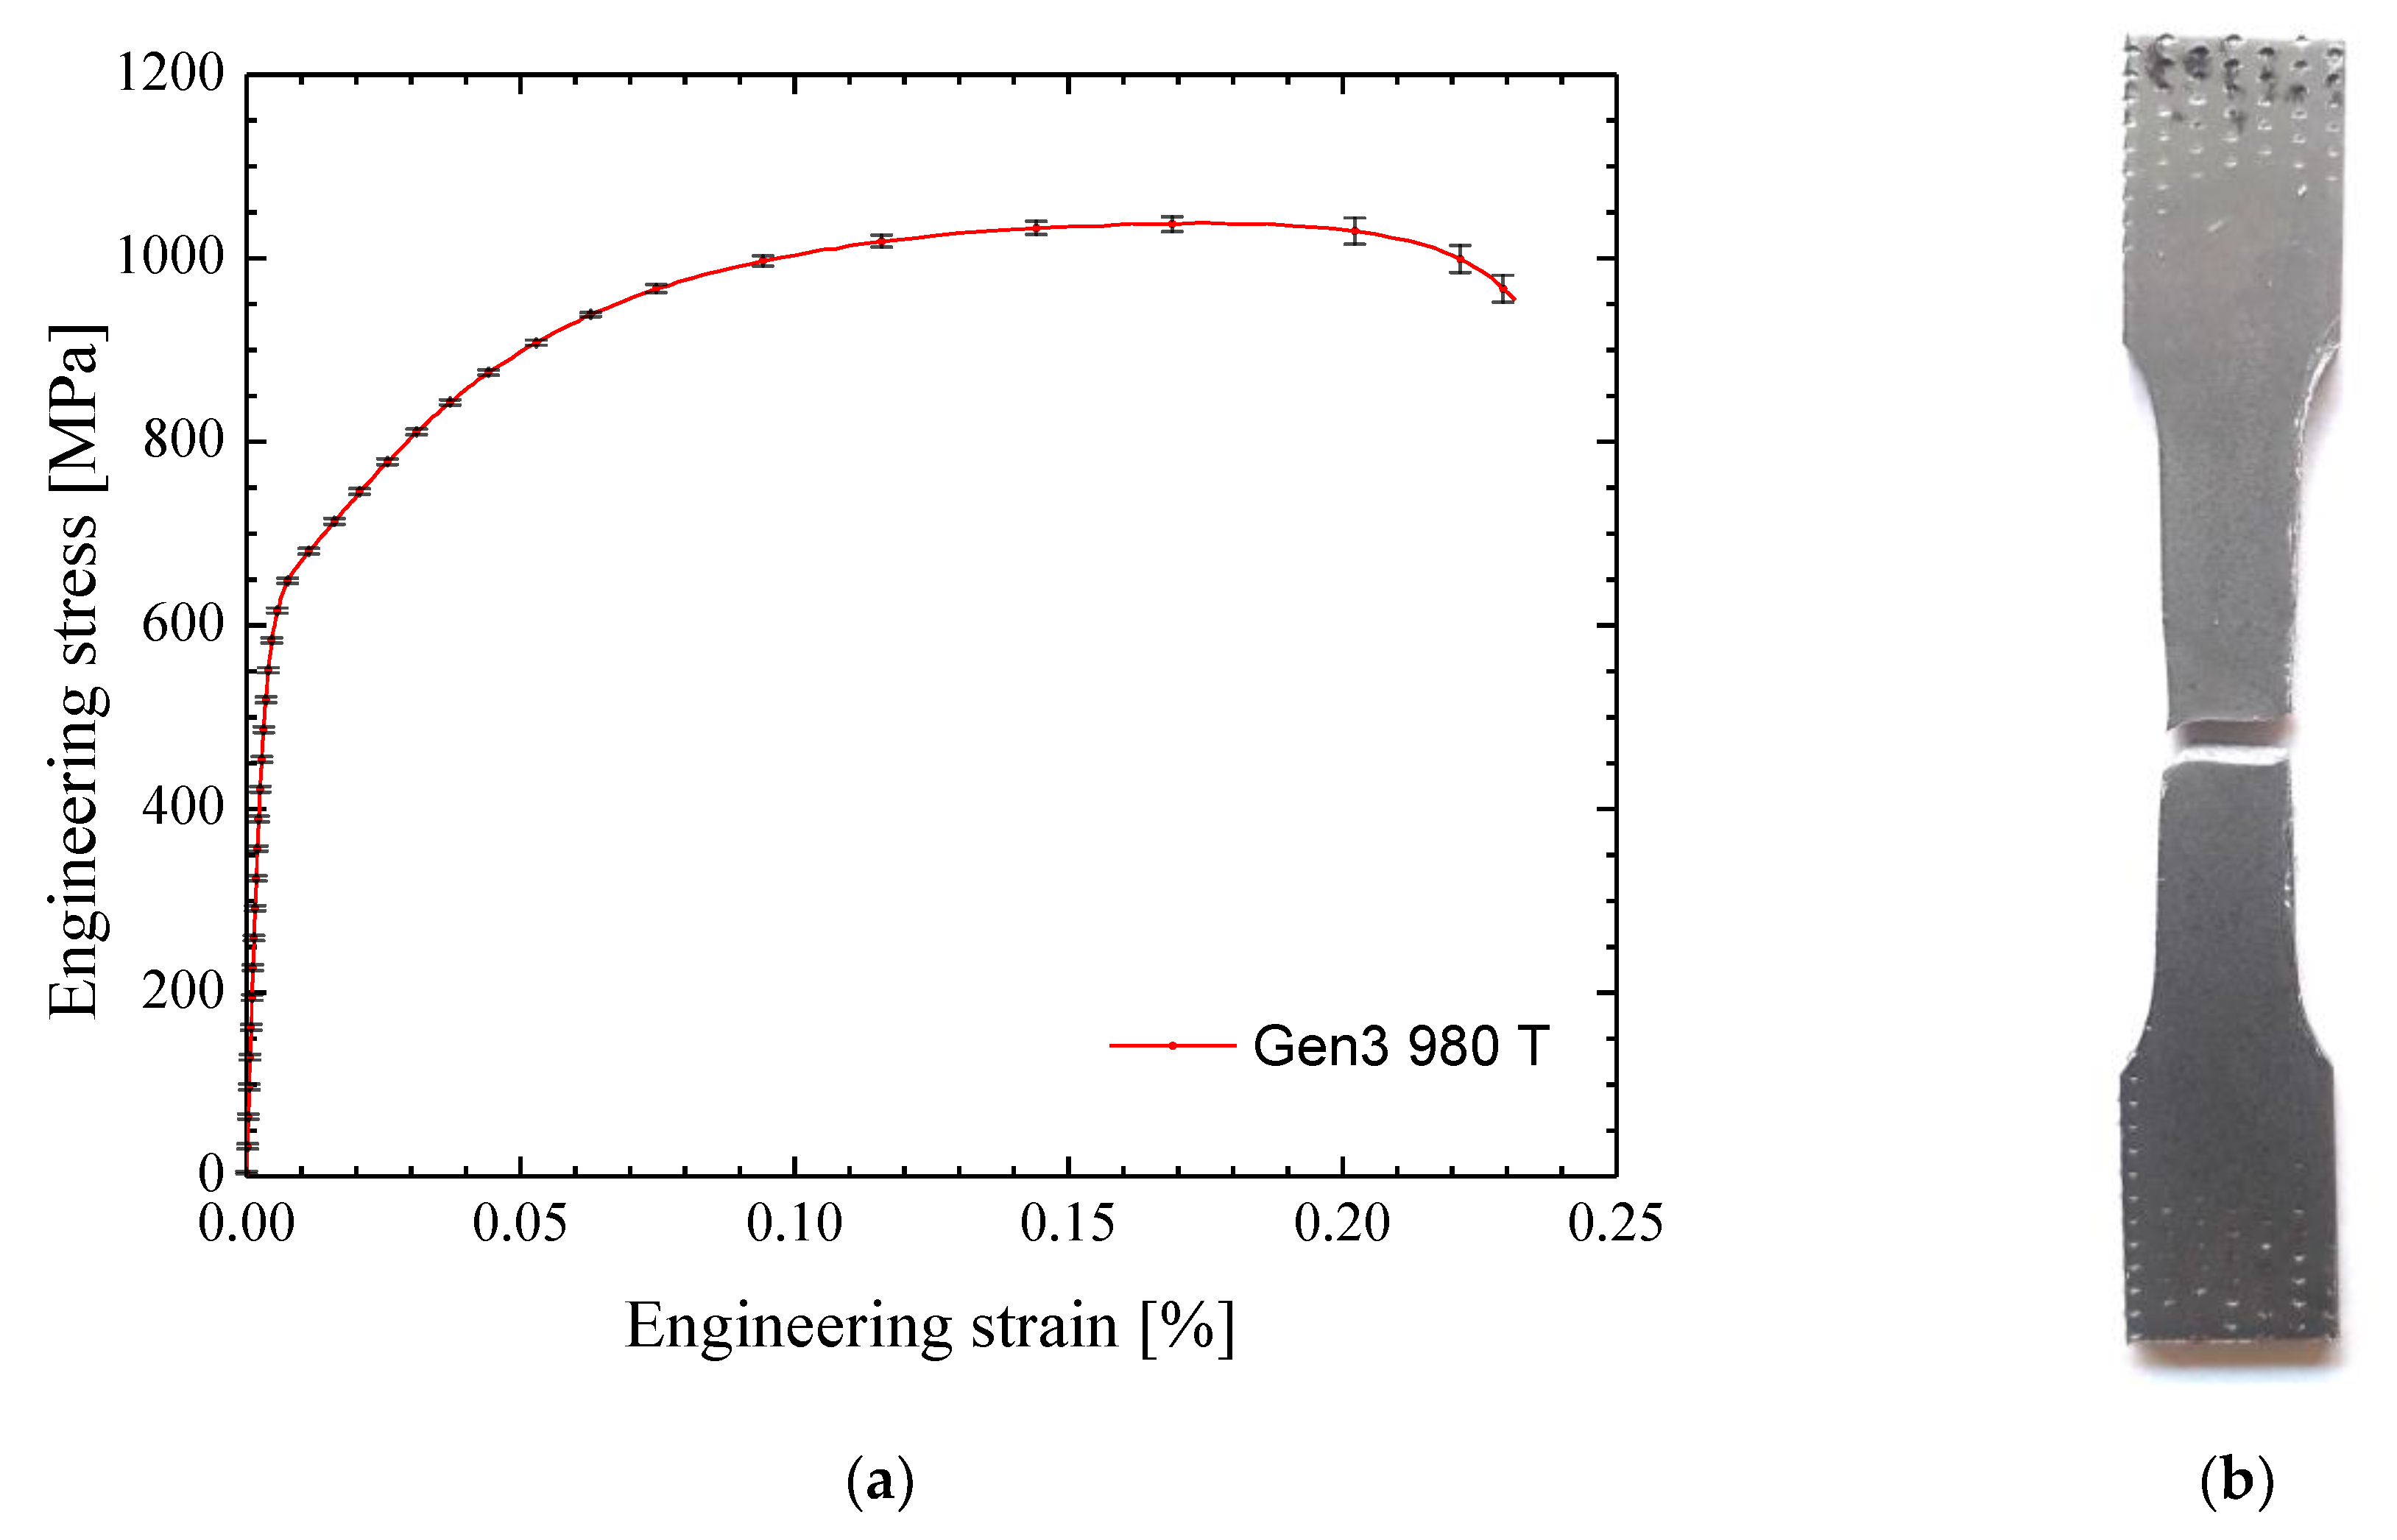
2.2. Tensile Testing

Uniaxial tensile testing was performed by the universal testing machine Shimadzu AG-X, with 100 kN load capacity, and equipped with the GOM ARAMIS digital image correlation system (GOM GmbH, Braunschweig, Germany) for strain measurement. The uniaxial specimens were manufactured through CNC (Computer Numerical Control) milling from strips welded perpendicular to the sheet-rolling direction in the middle point of the gauge length. For this purpose, the CNC machine MIKRON VCE 500 (Mikron Machining, Agno, Switzerland) was used. Continuous uniaxial tensile tests were performed at room temperature using a constant cross-head speed of 3 mm/min up to specimen fracture. Figure 2a presents the specimen dimensions adopted according to the ISO 6892-1:2016 standard. Besides the welded specimens, one specimen without welding has been tested, and this data is used as a reference. For each welding condition three samples were tested to check the repeatability.

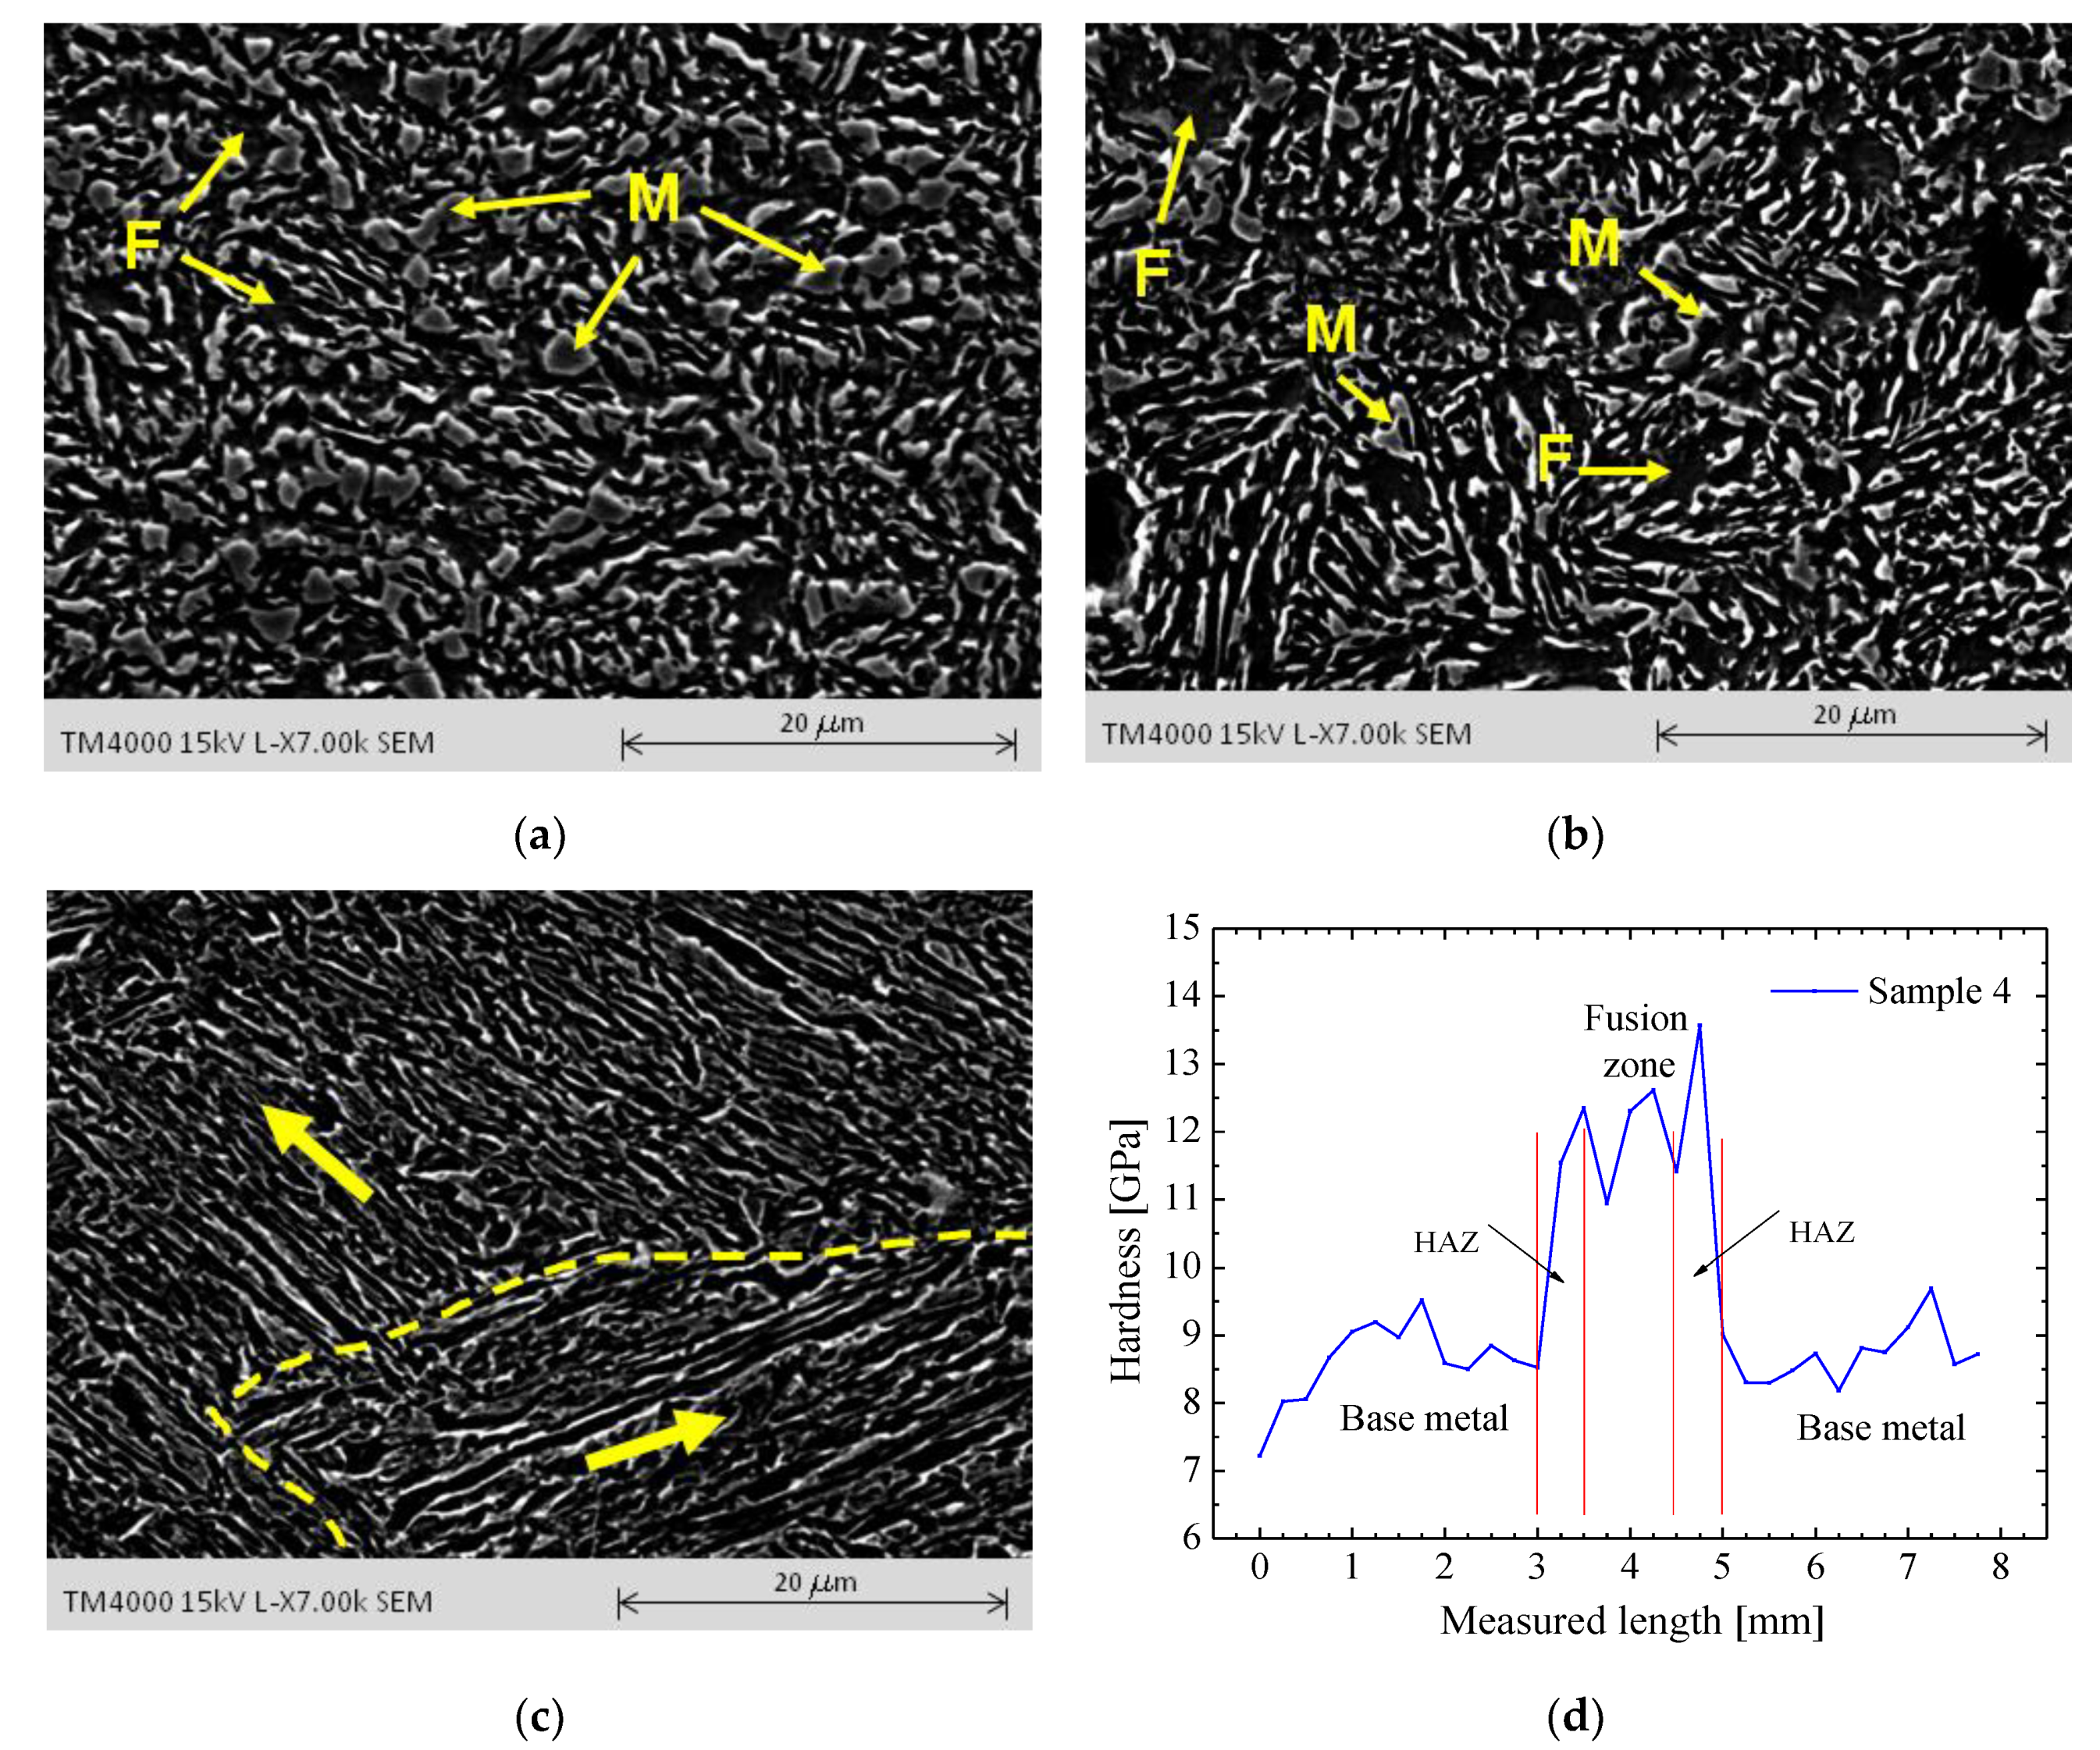
2.3. Microstructural Analysis and Micro-Hardness Profile

After the laser-welding process, the Gen3 980T steel welded sample with a set of parameters that corresponds to material fracture outside of the weld bead zone was cut and prepared according to standard metallographic procedure. The workpiece was sectioned by a precision metallographic cutter applying a low cutting feed and high cooling, aiming to keep the material properties as received. Figure 2b exhibits a scheme of the cut region into the middle of the specimen gauge length.
The sliced material was mounted into epoxy resin and mechanical grinding using SiC paper with a granulometry of 180, 240, 600, 800, 1200, 2400, and 4000 in a Struers TegraPol-2 machine (Struers, Tokyo, Japan). The polishing was performed applying a diamond paste of 3 microns. The samples were etched with Nital 5% for 4 s and then analyzed in the Scanning Electron Microscope (SEM) Hitachi TM4000Plus (Hitachi, Tokyo, Japan) by adopting different magnifications. To check the presence of the retained austenite, a sample with a surface of approximately 15 mm2 and 1.58 mm thickness was submitted for X-Ray Diffraction (XRD) using the Rigaku SmartLab X-Ray Diffractometer (Rigaku, Tokyo, Japan).
Concerning the inspection of the micro-hardness profile on the surface of the specimens, the sample preparation follows the same procedure but without the polishing step. The material was sectioned from the welded samples, as indicated by the blue surface in Figure 2b, and mounted with epoxy resin. The CSM Instrument Indentation machine (CSM Instruments, Needham, MA, USA) was used to perform the hardness test. The evaluated region corresponds to a discretized centerline, symmetric to the weld bead, with 7.75 mm length and 32 points of indentation equally spaced at 0.25 mm intervals. The nano-indentation was produced using the maximum indenter force of 150 mN. Moreover, to correlate the nano-hardness test, the Vickers hardness scale carried out micro-hardness tests in the material as received, and in the weld bead zone, with a load of 200 gf and dwell time of 15 s. The micro-hardness test was conducted using the Shimadzu HMV 2000 machine (Shimadzu, Kyoto, Japan). Five measurements were performed for each zone.

3. Results and Discussion

3.1. Longitudinal Mechanical Properties

The material without welding was tested to obtain the mechanical properties of the material Gen3 980T. The engineering stress vs. strain curve and the fractured specimen after tensile testing are shown in Figure 3.
Table 4 shows the results obtained from the uniaxial tensile test at zero degrees according to the rolling direction, namely Young’s modulus (E), Poisson coefficient (ν), yield strength (Sy), ultimate strength (Su), uniform elongation (eu), and total elongation (et), respectively. The mechanical properties found through the tensile test are consistent with the research developed by Hance and Link [16] where three different classes of AHSS with the same grade 980 MPa are compared, one of them being a third-generation AHSS.

3.2. Second Step-Tests until the Fracture

As described in Section 2.1, the first step of the methodology consisted of a preliminary analysis from the related literature to adjust the welding parameter value ranges for the Gen3 980 T and the thickness of the sheet. In the second step, the five best settings found among the tested cases in the first step were selected. The five specimens were carried out until fracture only to observe which one does not fracture in the welded zone. Figure 4 shows the fractured specimens for each set of parameters. Among the five analyzed set parameters, Sample 2, Sample 3, and Sample 4 presented the material fracture far from the weld bead.
According to Xue et al. [15], weld penetration can be estimated by Equation (1), as follows:
h = k · P v D
where k , v , P , and D are the material constant, welding speed, average laser power, and the bead diameter, respectively.
Equation (1) shows that the weld penetration has a strong dependency on the relation P / v D , also known as energy density ( E D ), [17]. The average laser power can be determined using Equation (2), which takes into account the pulse energy and the pulse frequency.
P =   E p   · f p
Moreover, the pulse frequency can be written in terms of welding speed, the bead diameter, and the pulse overlapping (Op), as shown in Equation (3):
f p =   v D ·   O p
Thus, the E D given in terms of [J/mm2] can be calculated according to Equation (4):
E D = P v D =   E p D 2 · O p
Table 5 presents the values of E D for each sample, calculated from the parameter shown in Table 1.
There is an optimal value for E D   that corresponds to the optimal welding parameters. If the energy density value is less than the optimal case, incomplete penetration defect will occur.
On the other hand, if the energy density is above the optimum case, then some defects such as spatter and porosity will also appear. Table 5 illustrates that Sample 1 presented the highest value among the five studied cases, whereas Sample 5 is the lowest value. In both cases, the welded zone becomes weak, and the specimen ends up fracturing near the weld bead.
Figure 5 shows the appearance of the weld bead before the tensile test for both weld face and root face. From Figure 5a,b, it can be noted that Sample 1 and Sample 2 have problems associated with the high energy density value, such as irregular weld bead and a high number of spatter on the weld face. It was also observed that Samples 4 and 5 showed incomplete penetration in the root face, Figure 5h,j, respectively. Thus, even without fracture in the weld bead, Sample 2 and Sample 4 were discarded due to their defects, and the only set of parameters selected to be analyzed in detail was that of Sample 3.

3.3. Third Step-Tests until the Fracture with Stress–Strain Measurement

Figure 6 presents the Gen3 980T steel behavior under uniaxial loading condition for the set parameters of Sample 3 in comparison with the material without welding.
In terms of the true stress–strain curve, it was observed for the same specimen gauge length that the weld produces a little shift-up of the material hardening and decreases the uniform elongation.
The material strength into weld bead is higher than outside the welded zone; this means that the material has less deformation in that region. This fact can be observed analyzing the strain field in the specimen gauge length. Figure 7a exhibits the von Mises strain field for Sample 3 in an instant before the material fracture. It is possible to state that the set of process parameters used in Sample 3 allows the 1.58 mm thick Gen3 980T steel sheet welded to butt joint to withstand tensile stresses without fracturing the weld bead. Figure 7b,c shows the repetitions performed for Sample 3, both with fracture away from the welded region.

3.4. Result of the Sample Welded on Both Sides

From the tensile test for sample BS, it was observed that there is a smoother transition between the elastic and plastic domain when compared to the sample without welding and Sample 3, Figure 8a.
Unlike the previously studied cases, Sample BS did not present the same shape in this region of the stress–strain curve. Besides that, the uniform elongation was lower when compared with Sample 3. Figure 8b shows the fractured specimen is also distant from the region affected by the welding process.
This strategy applies an energy density of E D = 75 J/mm2 in each welding pass. If the sum energy density for both passes were taken into account, the value would be equivalent to the Sample 1 case ( E D = 151 J/mm2), i.e., the highest level of energy density among the five tested samples, but with a better finish. For some practical cases, it is not possible to have access to both sides of the metal sheet to perform this welding technique. However, for the cases where it is possible, the welding on both sides may be a good alternative when it is desired to increase the quality aspect of the surfaces. This can be observed in Figure 9 where the images of the weld bead of Sample 3 and Sample BS are presented. The weld bead appearance for both cases was captured with the aid of the Leica EZ4W stereomicroscope, applying a magnification of 16×.

3.5. Material Microstructure and Micro-Hardness

The microstructure of AHSS Gen3 980T was analyzed after the metallography procedure using the SEM. Figure 10a shows the microstructure of the material, in which arrows are used to indicate the martensite (M) and ferrite (F).
According to the image scale of Figure 10a, it is possible to state that the average material grain size is less than 5 μm. The literature focused on the study of the third-generation steels, and reports the presence of three phases, namely martensitic, ferrite, and retained or residual austenite, [4,5,18]. Li et al. [6] and Guo et al. [7] analyzed the microstructure of AHSS Q&P 980 steel, and they also found these three material phases. To identify each phase, both authors combine techniques of optical microscopy, SEM, and XRD. To visualize the phases of martensite and ferrite for the AHSS, the SEM with samples etched by Nital reagent is generally applied. The authors [6,7] used a concentration of 4%. This analysis indicates that the lightest phase represents martensite, and the darkest phase is ferrite. However, the SEM adopted in this work did not indicate the presence of the retained austenite phase. We describe all phases contained in the material as a non-trivial microstructural characterization that requires special techniques, such as different etching and powerful microscopes. According to Wu et al. [19], the retained austenite and carbide precipitates could not be distinguished by optical microscopy due to limited resolution in metallography. To see the retained austenite, Radwanski et al. [20] employed two etching methods of color metallography knows as Klemm and Le Pera. According to the authors, Klemm’s etchant suggests the presence of small particles of retained austenite that was confirmed by XRD analysis. On the other hand, Le Pera highlights martensite + retained austenite of the rest of micro-constituents. However, there is no visible distinction between martensite and retained austenite.
Figure 10b presents the XRD spectrum of the as-received material, where were observed non- prominent peaks describe the phase related to retained austenite, while the more significant peaks indicate the ferrite + martensite. The diffraction peaks observed at 44.7° (110), 65.1° (200) and 82.4° (211) are composed by the presence of BCC (body-centered cubic) phase inherent in both martensite and ferrite, whereas the diffraction peaks observed at 43.9° (111), 50.5° (002), and 74.2° (022) are associated with the FCC (face-centered cubic ) phase corresponding to austenite. These intensity peaks are similar to the results found by [21], which are presented in the XRD for the undeformed TRIP and Q&P AHSS steels.
Figure 11 compares the material microstructure in different regions, namely (a) base metal, (b) HAZ, and (c) fusion zone, using the SEM images. Both regions display a distinct pattern. However, this fact is more evident when Figure 11a,c are compared directly because the microstructure in the fusion zone presents oriented acicular grains, and the structure is predominantly martensitic. Thus, Gen3 980T steel has its hardness increased in the fusion zone. This observation was confirmed with the nano-hardness profile in the bead zone, Figure 11d. The result of the nano-hardness test was displayed in terms of [GPa], a procedure similar to the work of Fernandes et al. [22] that studied the optimal parameters for laser-welding of Dual-Phase (DP600) AHSS. The hardness in the fusion zone is higher than in the base metal. The Vickers test also was carried out for Gen3 980T steel in the base metal and the fusion zone, and the average values and the standard deviation are exhibited in Table 6. The result shows an increase of 53.7% of hardness in the fusion zone. For Sample 3, with a bead diameter of 1.1 mm, a HAZ around 0.5 mm for each side of the weld bead was verified.

4. Conclusions

The pulsed Nd:YAG laser-welding process was applied to the Gen3 980T steel sheet with 1.58 mm thickness. The material showed good weldability for this process. For the case of butt joint welding, the best set of parameters among the analyzed ones is composed of power 80%, pulse duration 11.5 ms, pulse energy 84.2 J, bead diameter 1.1 mm, and welding speed 1.5 mm/s. These parameters correspond to an energy density of 139 J/mm2. The welding parameters adopted in the case of the sample welded on both sides also met the strength and appearance requirements. During welding, phase transformation occurs, leading to a high amount of martensite. This leads to an increase of 53.7% of hardness in the fusion zone. Further analyses need to be done to quantify the amount of each phase, but this is a topic for future research.

Author Contributions

Conceptualization, A.B.P.; Formal analysis, M.C.B. and G.V.; Funding acquisition, A.B.P.; Investigation, R.O.S. and B.S.C.; Supervision, A.B.P.; Writing—original draft, R.O.S.; Writing—review & editing, A.B.P., M.C.B., G.V. and L.P.M.

Funding

This work was supported by the projects UID/EMS/00481/2019-FCT—FCT—Fundação para a Ciencia e a Tecnologia; CENTRO-01-0145-FEDER-022083—Centro Portugal Regional Operational Programme (Centro2020), and Project POCI-01-0145-FEDER-032466, Aviso 02/SAICT/2017–SAICT under the PORTUGAL 2020 Partnership Agreement, through the European Regional Development Fund. Rafael O. Santos thanks the support given by CEFET/RJ.

Conflicts of Interest

The authors declare no conflict of interest.

References

  1. Frómeta, D.; Lara, A.; Molas, S.; Casellas, D.; Rehrl, J.; Suppan, C.; Larour, P. On the correlation between fracture toughness and crash resistance of advanced high strength steels. Eng. Fract. Mech. 2019, 205, 319–332. [Google Scholar] [CrossRef]
  2. Aydin, H.; Essadiqi, E.; Jung, I.H.; Yue, S. Development of 3rd generation AHSS with medium Mn content alloying compositions. Mater. Sci. Eng. A 2013, 564, 501–508. [Google Scholar] [CrossRef]
  3. Grajcar, A.; Kuziak, R.; Zalecki, W. Third generation of AHSS with increased fraction of retained austenite for the automotive industry. Arch. Civil Mech. Eng. 2012, 12, 334–341. [Google Scholar] [CrossRef]
  4. Chen, X.; Niu, C.; Lian, C.; Lin, J. The evaluation of formability of the 3rd generation advanced high strength steels QP980 based on digital image correlation method. Procedia Eng. 2017, 207, 556–561. [Google Scholar] [CrossRef]
  5. Liu, X.D.; Xu, Y.B.; Misra, R.D.K.; Peng, F.; Wang, Y.; Du, Y.B. Mechanical properties in double pulse resistance spot welding of Q & P980 steel. J. Mater. Process. Technol. 2019, 263, 186–197. [Google Scholar]
  6. Li, W.; Ma, L.; Peng, P.; Jia, Q.; Wan, Z.; Zhu, Y.; Guo, W. Microstructural evolution and deformation behavior of fiber laser welded QP980 steel joint. Mater. Sci. Eng. A 2018, 717, 124–133. [Google Scholar] [CrossRef]
  7. Guo, W.; Wan, Z.; Peng, P.; Jia, Q.; Zou, G.; Peng, Y. Microstructure and mechanical properties of fiber laser welded QP980 steel. J. Mater. Process. Technol. 2018, 256, 229–238. [Google Scholar] [CrossRef]
  8. Chabok, A.; Van der Aa, E.; De Hosson, J.T.M.; Pei, Y.T. Mechanical behavior and failure mechanism of resistance spot welded DP1000 dual phase steel. Mater. Des. 2017, 124, 171–182. [Google Scholar] [CrossRef] [Green Version]
  9. Xian, X.; Ma, Y.; Shan, H.; Niu, S.; Li, Y. Single-sided joining of aluminum alloys using friction self-piercing riveting (F-SPR) process. J. Manuf. Process. 2019, 38, 319–327. [Google Scholar] [CrossRef]
  10. Watson, B.; Nandwani, Y.; Worswick, M.J.; Cronin, D.S. Metallic multi-material adhesive joint testing and modeling for vehicle lightweighting. Int. J. Adhes. Adhes. 2019, 95, 102421. [Google Scholar] [CrossRef]
  11. Haque, R. Quality of self-piercing riveting (SPR) joints from cross-sectional perspective: A review. Arch. Civil Mech. Eng. 2018, 8, 83–93. [Google Scholar] [CrossRef]
  12. Xue, X.; Pereira, A.; Vincze, G.; Wu, X.; Liao, J. Interfacial characteristics of dissimilar Ti6Al4V/AA6060 lap joint by pulsed Nd: YAG laser Welding. Metals 2019, 9, 71. [Google Scholar] [CrossRef]
  13. Dong, D.; Liu, Y.; Yang, Y.; Li, J.; Ma, M.; Jiang, T. Microstructure and dynamic tensile behavior of DP600 dual phase steel joint by laser welding. Mater. Sci. Eng. A 2014, 594, 17–25. [Google Scholar] [CrossRef]
  14. Wang, J.; Yang, L.; Sun, M.; Liu, T.; Li, H. Effect of energy input on the microstructure and properties of butt joints in DP1000 steel laser welding. Mater. Des. 2016, 90, 642–649. [Google Scholar] [CrossRef]
  15. Xue, X.; Pereira, A.; Amorim, J.; Liao, J. Effects of pulsed Nd: YAG laser welding parameters on penetration and microstructure characterization of a DP1000 steel butt joint. Metals 2017, 7, 292. [Google Scholar] [CrossRef]
  16. Hance, B.M.; Link, T.M. Effects of fracture area measurement method and tension test specimen type on fracture strain values of 980 class AHSS. In Proceedings of the 38th International Deep Drawing Research Group Annual Conference, Enschede, The Netherlands, 3–7 June 2019. [Google Scholar]
  17. Katayama, S. Handbook of Laser Welding Technologies; Woodhead Publishing: Cambridge, UK, 2013. [Google Scholar]
  18. Cramer, J.; Adams, D.; Miles, M.P.; Fullwood, D.T.; Homer, E.R.; Brown, T.; Mishra, R.K.; Sachdev, A. Effect of strain path on forming limits and retained austenite transformation in Q & P 1180 steel. Mater. Sci. Eng. A 2018, 734, 192–199. [Google Scholar]
  19. Wu, R.M.; Wang, L.; Jin, X.J. Thermal stability of austenite and properties of quenching & partitioning (Q & P) treated AHSS. Phys. Procedia 2013, 50, 8–12. [Google Scholar]
  20. Radwanski, K.; Wrozyna, A.; Kuziak, R. Role of advanced microstructures characterization in modeling of mechanical properties of AHSS steels. Mater. Sci. Eng. A 2015, 639, 567–574. [Google Scholar] [CrossRef]
  21. Bhargava, M.; Chakrabarty, S.; Barnwal, V.K.; Tewari, A.; Mishra, S.K. Effect of microstructure evolution during plastic deformation on the formability of transformation induced plasticity and quenched & partitioned AHSS. Mater. Des. 2018, 152, 65–77. [Google Scholar]
  22. Fernandes, F.A.O.; Oliveira, D.F.; Pereira, A.B. Optimal parameters of laser welding of advanced high-strength steel used in the automotive industry. Procedia Manuf. 2017, 13, 219–226. [Google Scholar] [CrossRef]
Figure 1. Schematic procedure for the adopted Nd:YAG laser-beam welding process.
Metals 09 01051 g001
Figure 2. (a) Uniaxial tensile specimen dimensions (mm)—ISO 6892-1:2016 standard and (b) scheme of the sectioned region of the samples for microstructural (red area) and micro-hardness analysis (blue area).
Metals 09 01051 g002
Figure 3. (a) Engineering stress vs. strain curve of Gen3 980T steel, and (b) sample without welding after the tensile test.
Metals 09 01051 g003
Figure 4. Second step—tensile test until the fracture: (a) Sample 1, (b) Sample 2, (c) Sample 3, (d) Sample 4, (e) Sample 5. The parameters corresponding to each sample are given in Table 2.
Metals 09 01051 g004
Figure 5. The weld bead aspect before the tensile testing: weld face for (a) Sample 1, (b) Sample 2, (c) Sample 3, (d) Sample 4, (e) Sample 5, and root face for (f) Sample 1, (g) Sample 2, (h) Sample 3, (i) Sample 4, (j) Sample 5.
Metals 09 01051 g005
Figure 6. True stress vs. strain curve for Gen3 980T steel, with and without weld.
Metals 09 01051 g006
Figure 7. (a) The equivalent von Mises strain field in the gauge length for Sample 3; and (b) and (c) repetitions of welding conditions corresponding to Sample 3.
Metals 09 01051 g007
Figure 8. (a)True stress vs. strain curve for the selected set of the parameters to weld on both sides and (b) uniaxial tensile test carried out until the fracture for Sample BS.
Metals 09 01051 g008
Figure 9. Comparison of the surface aspect of: Sample 3 (a) weld and (b) root face; Sample BS (c) top and (d) bottom layer.
Metals 09 01051 g009aMetals 09 01051 g009b
Figure 10. (a) SEM micrograph of base metal and (b) intensity vs. 2° theta for the base metal—XRD spectrum analyze.
Metals 09 01051 g010
Figure 11. SEM micrographs of Sample 3: (a) base metal, (b) HAZ, (c) fusion zone, and (d) nano-hardness profile across to the weld bead.
Metals 09 01051 g011
Table 1. Mechanical properties of Q & P 980 steel. Data from [4,5].
MaterialAuthorThickness [mm]Yield Strength [MPa]Ultimate Tensile Strength [MPa]Elongation to Fracture [%]
Q & P 980Chen et al. [4]1.2689105423.41
Liu et al. [5]1.8594100726.00
Table 2. Laser-welding process parameters used to Gen3 980T steel sheet with 1.58 mm thickness.
SamplePower 1Pulse DurationPulse EnergyBead DiameterWelding Speed
[%]   t   [ ms ]   E p   [ J ]   D   [ mm ]   v   [ mm / s ]
18012.591.61.11.3
28012.087.91.11.4
38011.584.21.11.5
48012.591.61.31.6
58512.094.51.41.7
1 The power is related to the 12-kW laser peak power.
Table 3. Selected set of process parameters to weld the Gen3 980T steel sheet on both sides.
SamplePower 1Pulse DurationPulse EnergyBead DiameterWelding SpeedPulse Overlap
[%] t [ms] E p   [ J ] D [mm] v [mm/s] O p [%]
BS 2579.045.01.01.260
1 The power is related to the 12-kW laser peak power. 2 Both sides.
Table 4. Uniaxial mechanical properties of Gen3 980T steel.
Standard ISO 6892 E [GPa]ν S y [MPa] S u [MPa] e u [%] e t [%]
197 ± 50.289 ± 0.003604 ± 71040 ± 918.0 ± 0.523.4 ± 0.2
Table 5. Evaluation of weld penetration using energy density.
E D [J/mm2]Sample 1Sample 2Sample 3Sample 4Sample 5
15114513910896
Table 6. Vickers micro-hardness test of Gen3 980T steel.
Geb3 980T SteelAverageStandard Deviation
(5 indentations)[HV][HV]
Base metal304.411.5
Fusion zone468.024.0

