Combustion Synthesis of Chromium Nitrides

Research Institute of Applied Mathematics and Mechanics, National Research Tomsk State University, 36 Lenin Ave., 634050 Tomsk, Russia
*
Author to whom correspondence should be addressed.
Metals 2019, 9(1), 98; https://doi.org/10.3390/met9010098
Submission received: 11 December 2018
/
Revised: 6 January 2019
/
Accepted: 16 January 2019
/
Published: 17 January 2019
Abstract
:This paper explores different modes of synthesis by combustion of chromium-nitrogen and ferrochromium-nitrogen alloys. The SH-synthesis of chromium nitrides and ferrochromium nitrides was performed. Regular patterns in layer-by-layer and surface modes of Cr combustion in nitrogen were investigated. The mechanism of non-stationary combustion during the synthesis of chromium was investigated. Regular patterns of chromium and ferrochromium combustion in the cocurrent filtration mode were analyzed, and the possibility to intensify the SHS process using the pressure filtration principle was assessed. The process of chromium powder combustion in the cocurrent flow of nitrogen-containing gas in the range of specific flow rates from 20 cm3/s·cm2 was investigated. Pressure filtration intensifies the process of combustion wave propagation in the Cr–N2 system. Here, the combustion rate increases while the degree of nitridation decreases. We discovered superadiabatic heating modes when the reaction zone was blown with pure nitrogen and a nitrogen-argon mixture. The tempering mode that was realized during pressure filtration allows for the uptake of high-temperature single-phase non-stoichiometric phases of Cr2N.
1. Introduction
Alloying with nitrogen is a technique used in modern metallurgy to improve the properties of many grades of steel [1]. The content of nitrogen required by specifications for such steels may vary in the range from 0.0001% to 1% N. Good examples of modern steels where nitrogen is an indispensable component, are transformer steels (~0.01% N), rail steels (~0.012% N), high-strength low-alloy steels (~0.015% N), high-alloy steels for retaining rings in generators (0.4–0.9% N), valve steels for engines (0.3–0.6% N), high-strength stainless steels with reduced nickel content (0.08–0.45% N), etc. Currently, the most well-established steels are austenitic stainless steels with Cr-Mn and Cr-Mn-Ni bases [2]. Such nitrogen-containing steels are used in the construction, automotive, chemical and food industries; for example, they are used in making car parts, household appliances, and kitchenware. New ways of developing new grades of nitrogen-containing steels are actively searched for. In fact, solely alloying by nitrogen can simultaneously provide for the improved strength, toughness, and corrosion resistance of a metal.
The Earth’s atmosphere is the only available and virtually infinite natural source of nitrogen. Nitrogen is produced by air enrichment at cryogenic temperatures. This technology is a very mature and economically efficient process that is used at a large industrial scale. When nitrogen is introduced into steel, it is uptaken by different alloys. To produce stainless nitrogen-containing steels, chromium nitrides or ferrochrome nitrides are used [3]. Here, liquid metal is treated with nitrogen thus producing highly dense molten alloys. The maximum amount of nitrogen that can be achieved for ingots of such master alloys is determined by its solubility in specific alloy treatment modes. Virtually 100% uptake of nitrogen is an advantage of molten master alloys. Currently, molten master alloys are found to have limited use due to the low content of nitrogen.
Sintered nitrogen-containing master alloys are obtained by high-temperature treatment of powder-like alloys in a nitrogen-containing atmosphere at temperatures below the melting temperature of the initial alloys and products [4]. In such master alloys, the maximum content of nitrogen is determined by its content in the higher nitride of the nitrided metal. Sintered materials have high porosity, they are brittle, they can be easily ground, and they are suitable for being used as a filler for flux-cored wires.
The main advantage of steel nitridation with different alloying additives is its versatility. Such master alloys can be used in steelmaking with all types of steel-melting devices at metallurgical plants with different equipment capabilities. Using alloys containing nitrogen, we can produce the entire range of steels: From those that are micro-alloyed by nitrogen to those with maximum nitrogen content [5].
To our knowledge, the first study of the influence of nitrogen on alloys of the chromium-iron system was undertaken by Frank Adcock in 1926, as mentioned in the article [6]. Adcock studied nitrogen dissolution in iron-chromium alloys containing 0.21–58.5% Cr and pure metallic chromium. The research demonstrated that nitrogen improved the hardness of Cr-Fe alloys and had a positive impact on their structure.
For the purpose of smelting stainless steel and chromium steels of other grades, nitrided Fe-Cr is normally used [7]. In the production of Cr-Ni superalloys and alloys based on nickel, nitrided Cr (chromium nitride) is used. Chromium nitride is recommended for use in the smelting of high-nitrogen steels that are characterized by low content of carbon and other additives. Powders of Cr and its compositions can be used as initial materials for nitridation. Gaseous nitrogen or ammonia can be the source of nitrogen. The only economically viable option for the industrial production of nitrided Cr and its alloys is the technology of Cr powder treatment in vacuum furnaces.
Molten nitrogen-containing master alloys of chromium are produced by the treatment of liquid chromium alloys with nitrogen, and sintered master alloys are produced by the treatment of solid alloys. The maximum amount of nitrogen that can be uptaken in molten master alloys is determined by its solubility under the treatment conditions, and for sintered master alloys, this amount is determined by the content of nitrogen in CrN. In theory, when nitriding high-purity chromium powder, nitride with ~21.2% N could be obtained, and for ferrochromium with 70% of Cr, 15.8% N could be possible. In practice, these values can hardly be achieved, especially in large-scale production [8]. The resulting nitrogen content is influenced by impurities, limited treatment times, evaporation and contact melting processes, etc.
In this research, we study the process of furnaceless synthesis of chromium and ferrochromium nitrides in the filtration combustion mode, where the nitrides are to be used as master alloys for stainless steels and alloys.
2. Methodology of the Experiment
Cr powder produced by JSC POLEMA (Tula, Russia) was used in this research; the powder was obtained by means of calcium hydride reduction. Additionally, Cr and Fe-Cr powders produced via the aluminothermic process by the Kluchevskiy Ferroalloys Plant (624013, Dvurechensk, Russia) were used (see Table 1).
For the purpose of nitridation in the cocurrent filtration mode, Cr powder (particle size in the range of 63–80 µm) that was obtained by the calcium hydride process was used. The content of nitrogen was determined on a TS-600 analyzer (LECO Corporation, St. Joseph, MI, USA). The phase composition of combustion products was determined on an XRD-600 X-ray diffractometer (Shimadzu Corporation, Kyoto, Japan). Cr and Fe-Cr were nitrided via two methods. The first method envisaged, was synthesis on a laboratory high-pressure SHS reactor (Figure 1) in the mode: Natural nitrogen filtration. The second method envisaged, was synthesis on a laboratory flow-type SHS reactor (Figure 2) in the mode: Forced filtration of nitrogen. Natural filtration occurs spontaneously due to the pressure differential resulting from the consumption of gas in the combustion front. If the gaseous reactant (nitrogen) is forced through with a given flow rate through a porous sample, then this is forced filtration. In this case, the side surfaces of porous samples are gas-tight and nitrogen is supplied only through the ends of the sample [9].
For the synthesis in the high-pressure reactor, a batch of Cr or Fe-Cr powder was placed in a gas-permeable container (metal mesh), and a thermocouple (Tungsten Rhenium W-Re, 5/20 wire) was inserted into the bottom part of the container (Figure 3). From the top side, a tungsten coil heating element was brought into contact with the powder. The sample was placed into the unit, and the unit was then vacuumized and filled with nitrogen, having a purity of 99.9%, until the pressure reached 0.2–10 MPa. The interaction of the powder with the nitrogen was initiated by applying an electric pulse into the tungsten coil. Then, a combustion wave was formed by the exothermic reaction, which yielded Cr2N and CrN; and the combustion wave spread along the sample in a lengthwise direction.
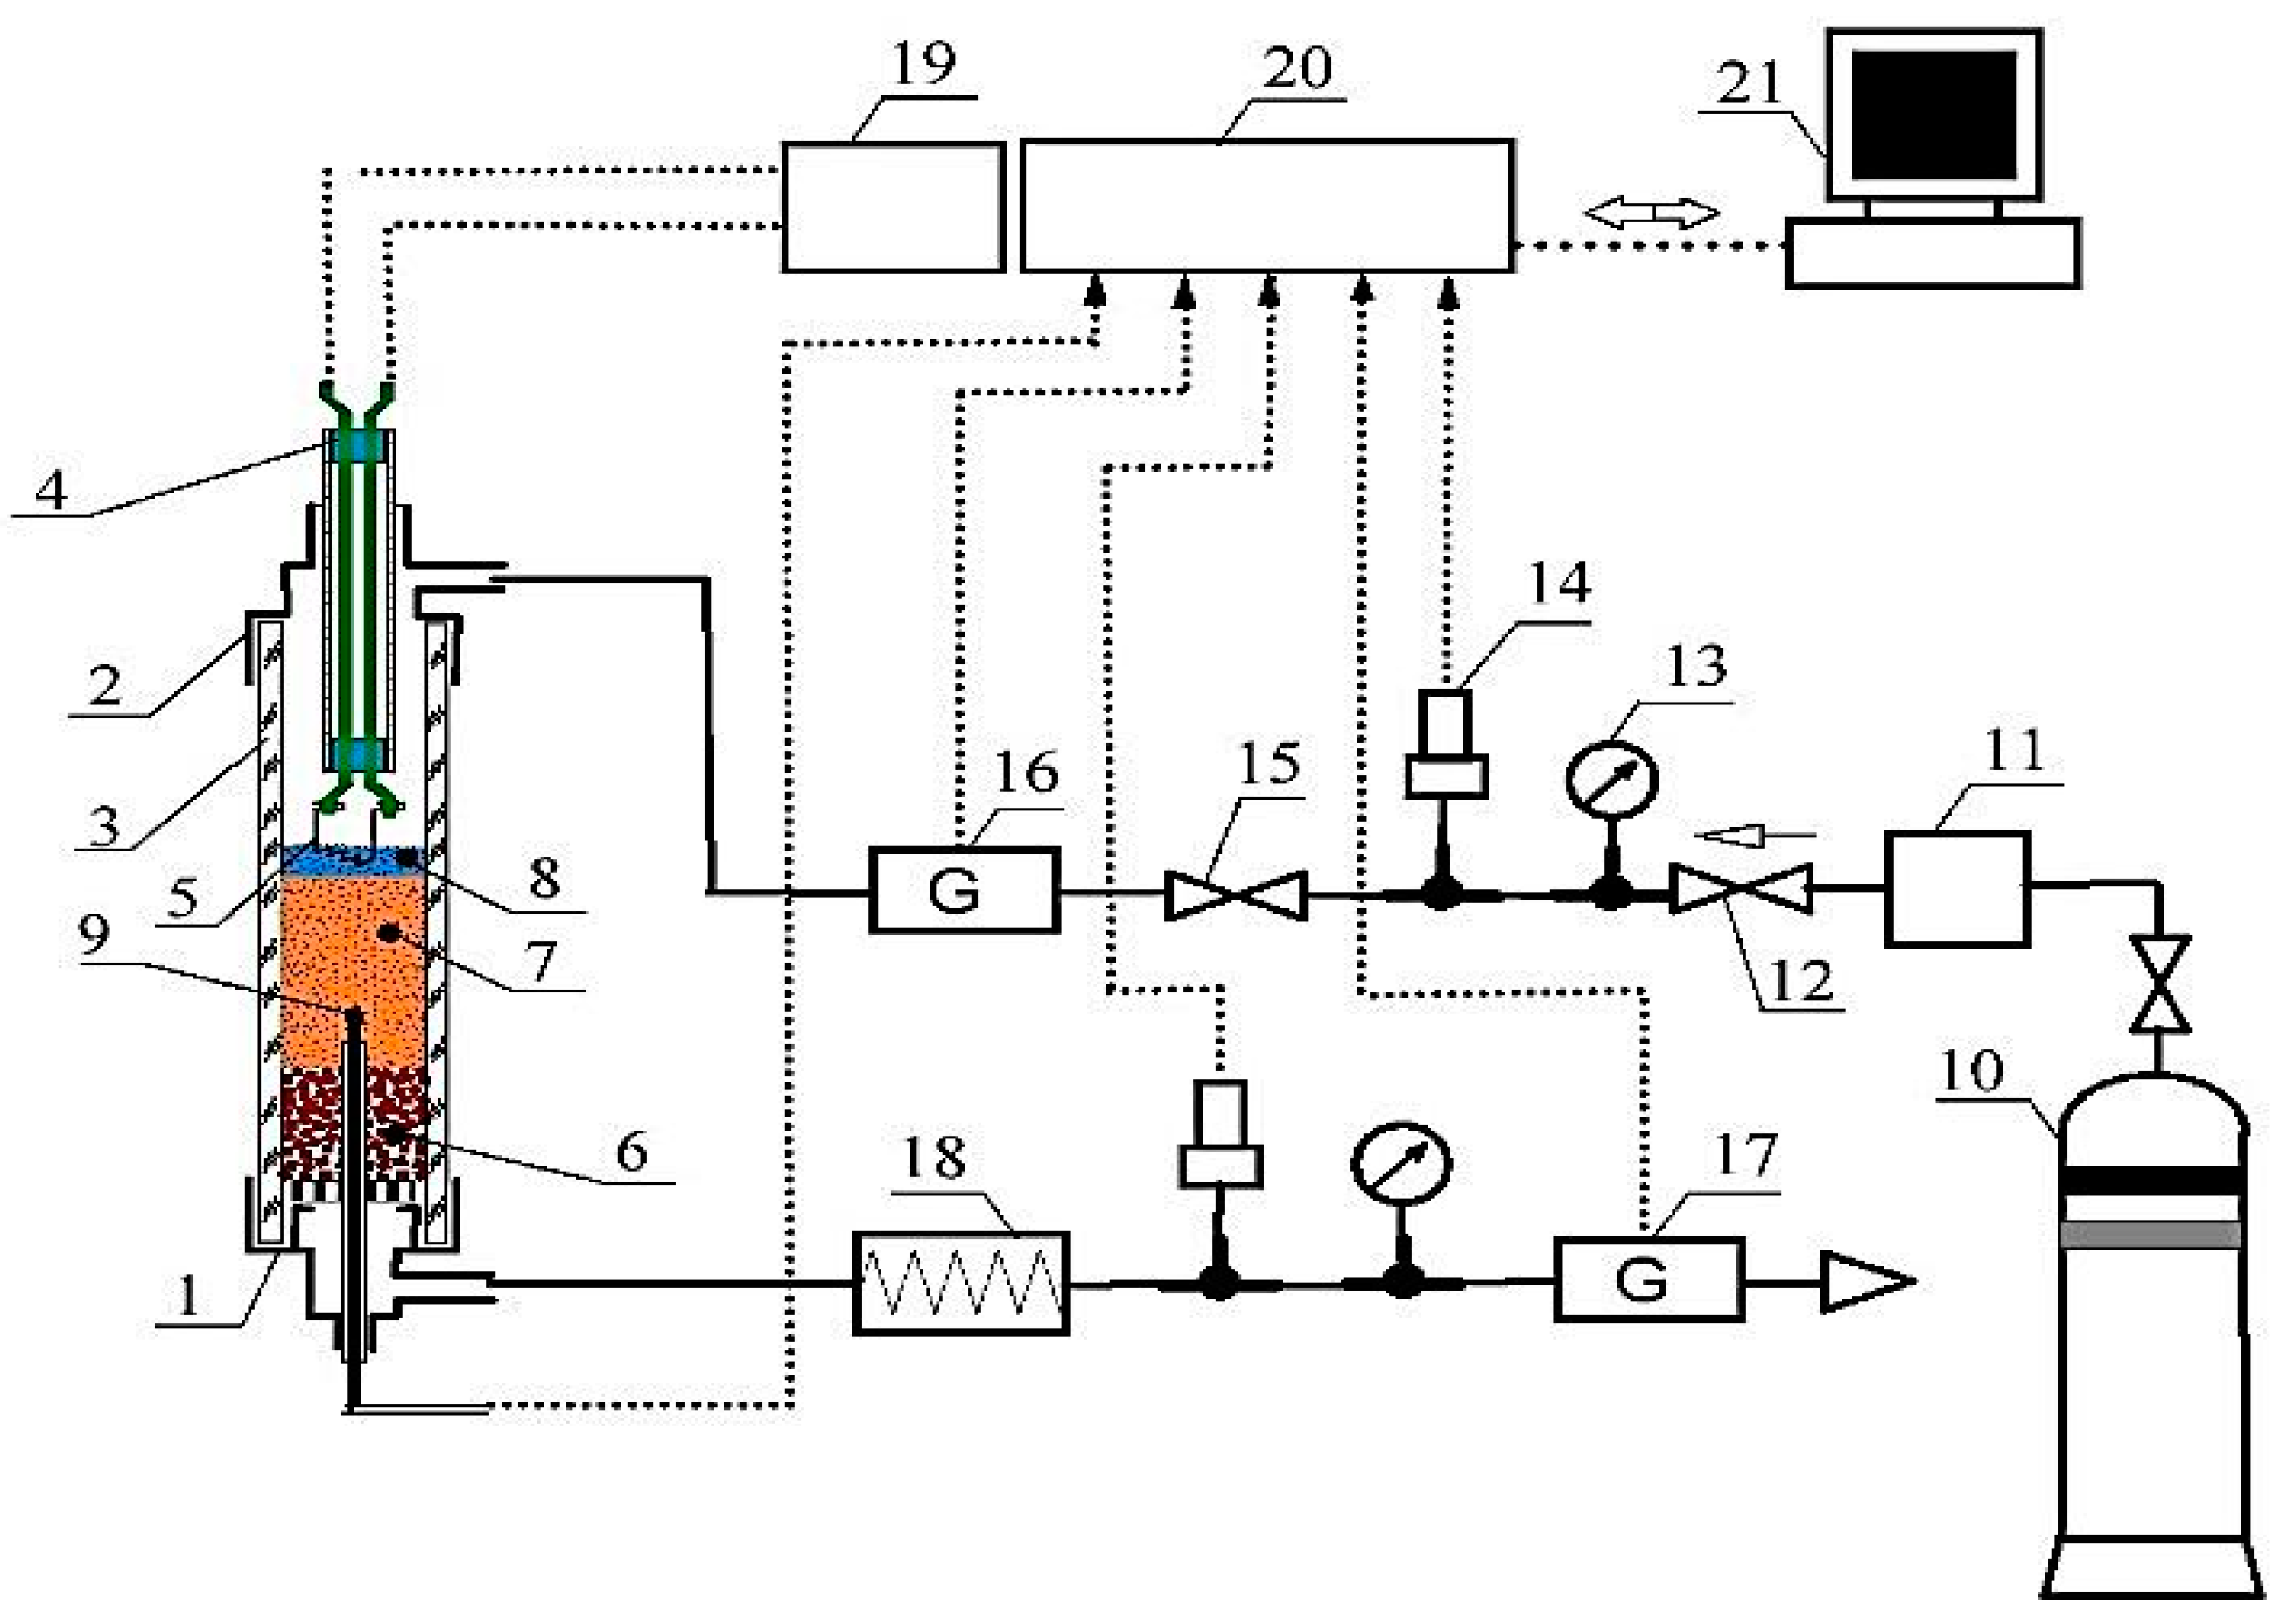
The flow-type reactor setup comprises three main parts: the combustion chamber (1–9), the gas feeding system (10–18), and the combustion parameters reading system (19–21). The setup allows for analyzing combustion processes in a powder layer with diameter 10 × 10−3 m–30 × 10−3 m, height of up to 0.2 m, and pressure of up to 0.2 MPa at the inlet and maximum gas flow rate of up to 0.83 × 10⁻³ m3/s·m2. A batch of Cr powder (7) was poured into the quartz tube (3). The upper layer of the powder was brought into contact with the heating coil (5). The tube was then sealed. Into the bottom part of the tube, a layer of aluminium oxide powder (6) was poured in order to cool down the escaping gases.
The nitrogen-containing gas from the tank (10) was fed into the quartz tube using the pressure reducer valve (11). An electric pulse was fed into the coil (8) to initiate an exothermic reaction in the surface layer of the Cr powder. A flat combustion front was formed and it started spreading along the sample in a lengthwise direction. The pressure was monitored via readings from the manometer (13) and the pressure sensor (14). Gas flow rate at the reactor inlet and outlet was adjusted by using the Red-y type electronic micro flow meters (16) and (17). The reaction temperature was measured with the W-Re BP5/20 thermocouple (9); the signal from the thermocouple was fed into the recorder device via an amplifier. The refrigerator (18) served to cool down gaseous products of the reaction before they entered the flow rate meter (17). The process parameters were read by the TRM-138 multi-channel meter regulator (20) and then they were processed by the computer (21).
3. Results and Discussion
3.1. Natural Filtration Mode
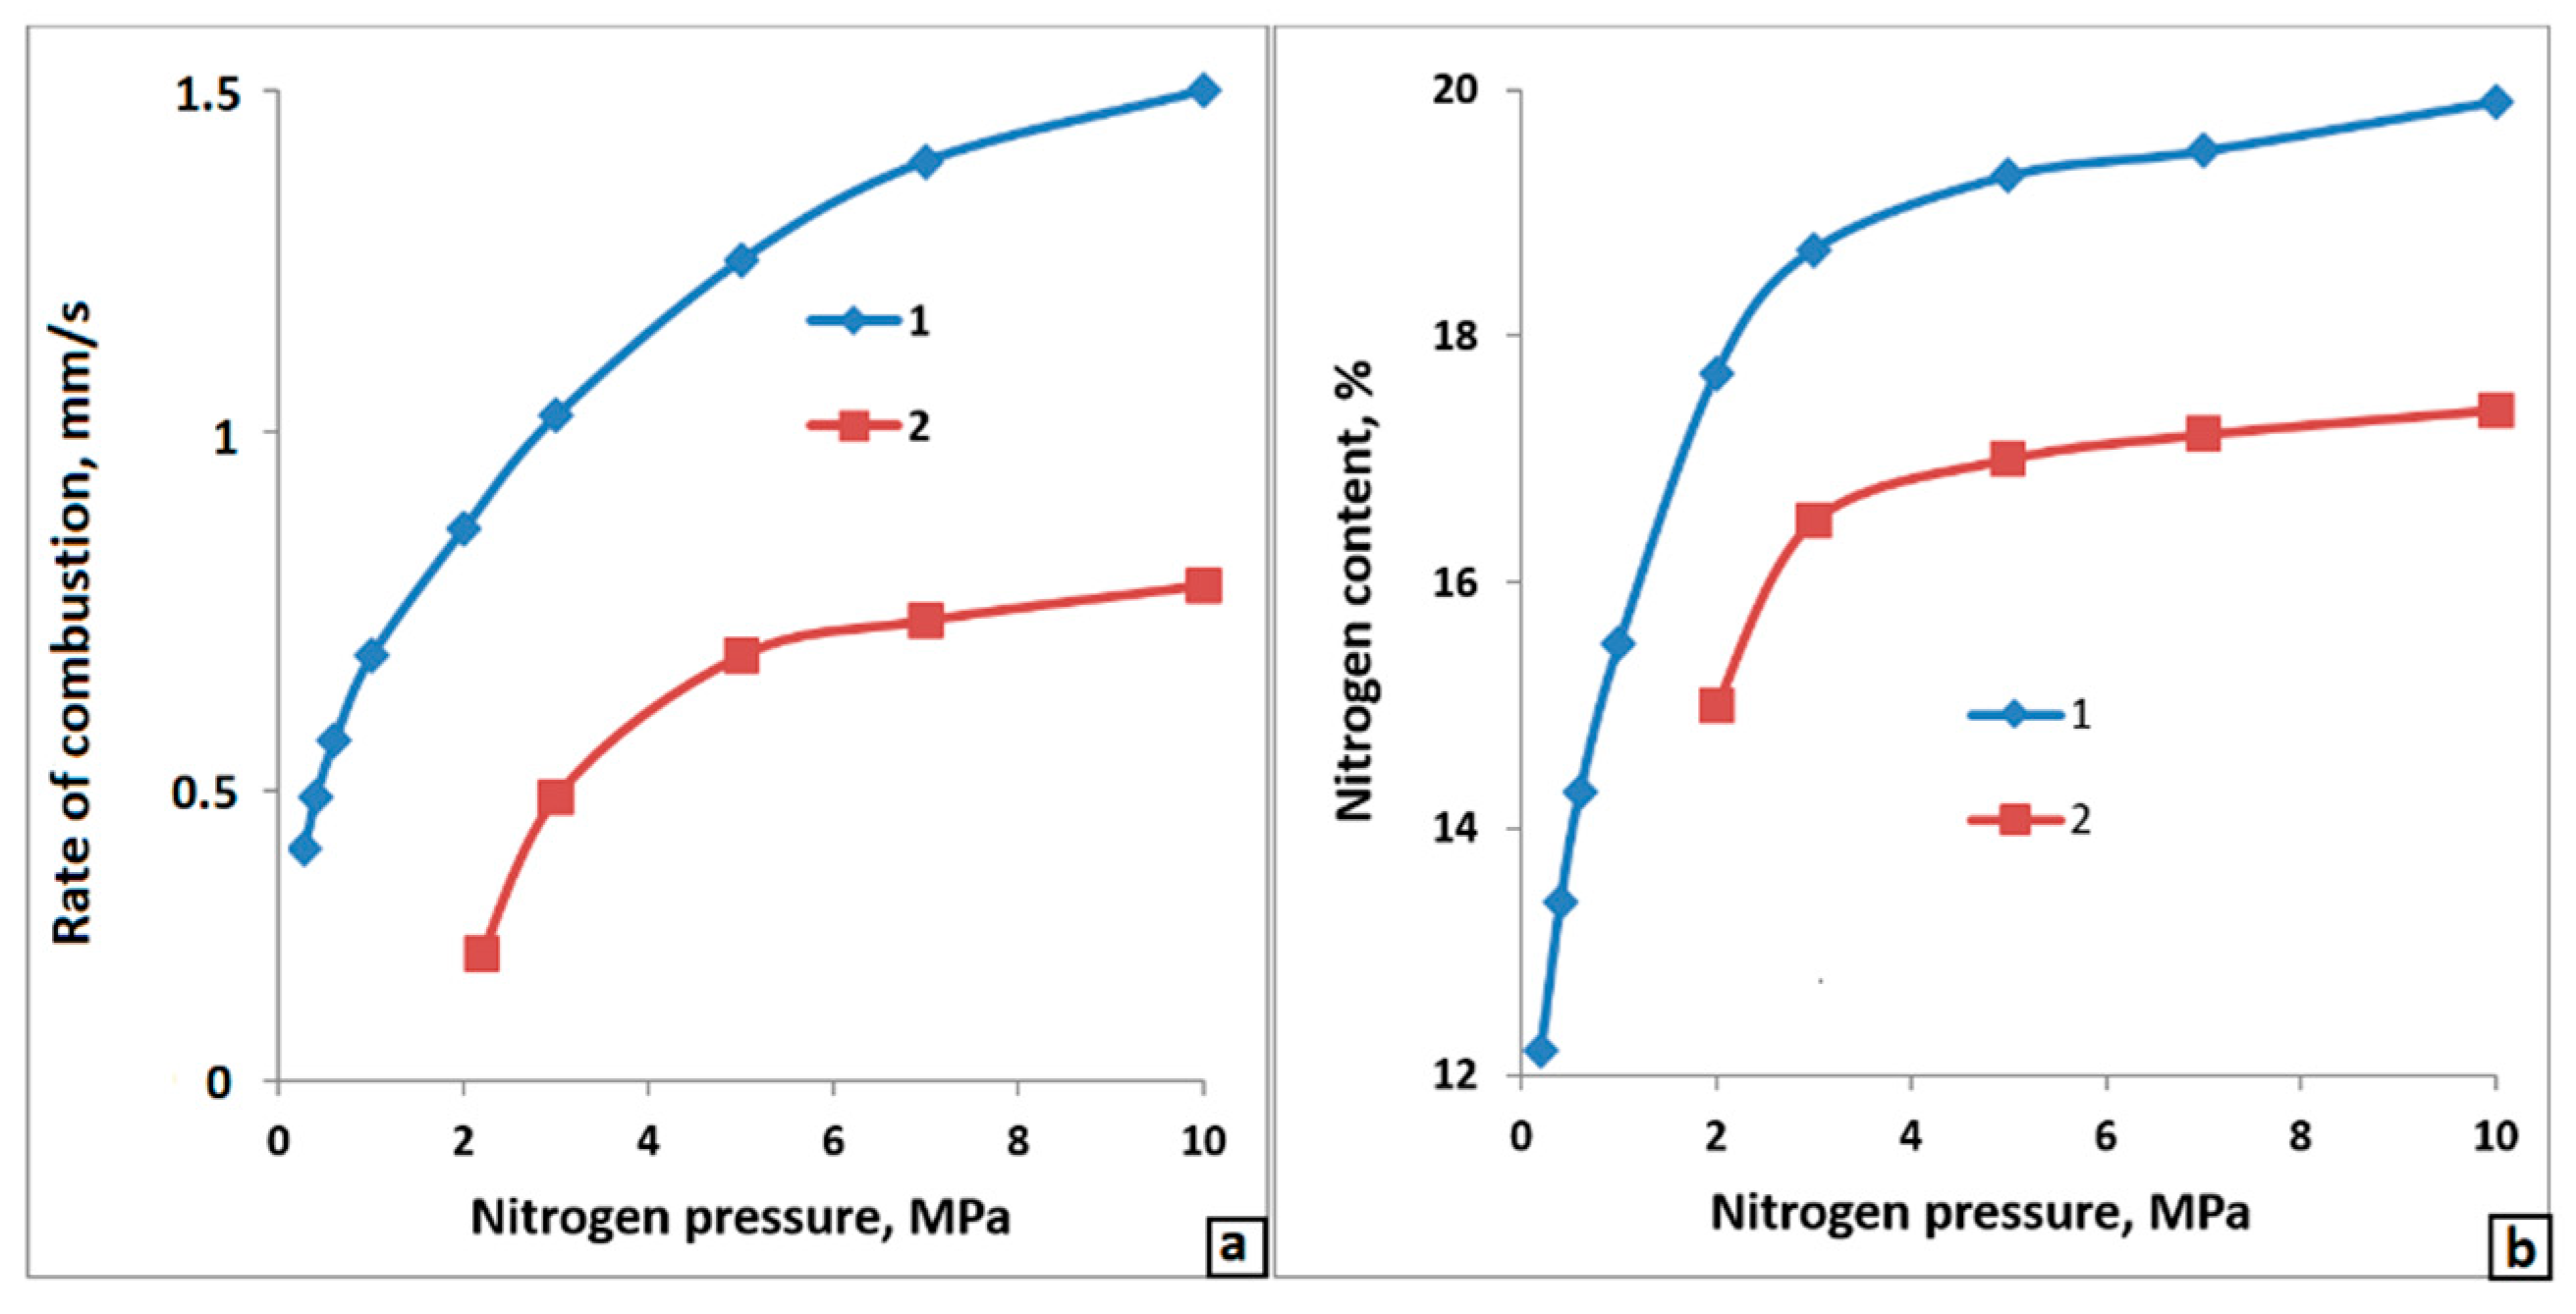
The rates of combustion of Cr that were obtained by the calcium hydride process in comparison to Cr obtained by the aluminothermic process (particle size below 40 µm) differ (Figure 4). The maximum combustion temperature read from the thermocouples increased from 1220 °C (0.1 MPa) to 1500 °C (10 MPa). It was also close to the estimated combustion temperature (Figure 5).
3.2. Layer-by-Layer and Surface Combustion of Chromium in Nitrogen
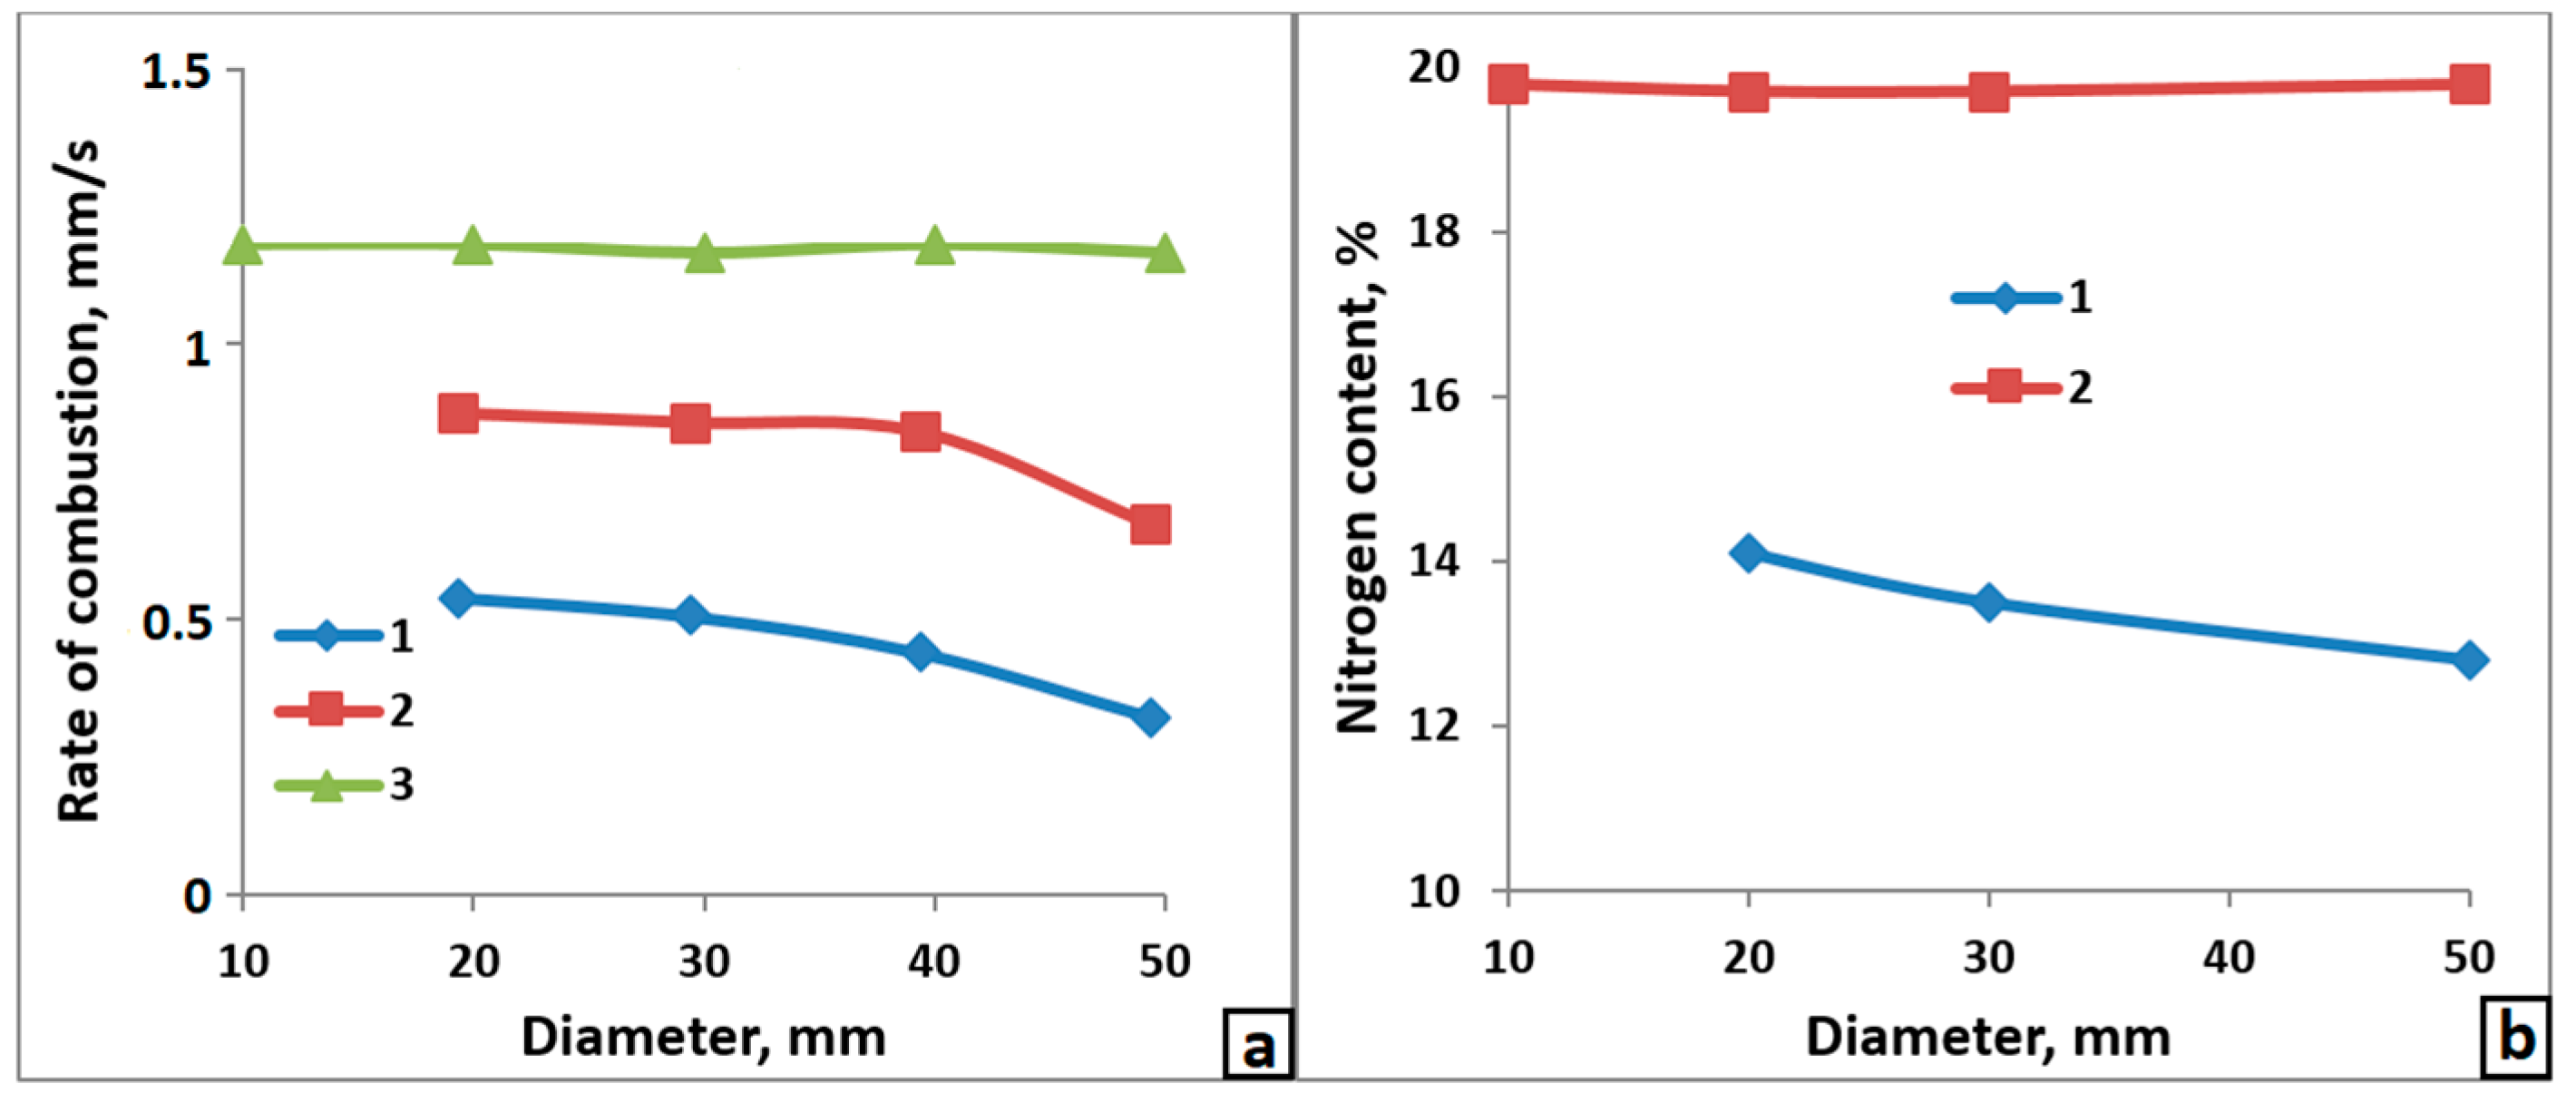
When filtration obstructions occur (the formation of combustion products prevents the passage of gas to maintain combustion processes), the nitridation mode switches from layer-by-layer to surface nitridation. This change exposes itself by the dependency of the combustion rate on the diameter of the samples, which was not observed before this change occurred (Figure 6a). At high pressures, changes in the diameter do not lead to changes in the combustion rate. The content of nitrogen in the combustion products also remains constant (Figure 6b). At low pressures, increases in the diameter leads to the reduction of the combustion rate and the degree of Cr nitridation. However, at 0.4 MPa the combustion rate is continuously decreasing, and at 1.0 MPa a considerable reduction of the combustion rate is only observed for diameters greater than 40 mm. An elemental analysis of the combusted samples has shown that, at high pressures, the content of nitrogen is virtually constant throughout the cross-section in the samples of different diameters.
When the pressure is changed to low, uniform nitrogen distribution throughout the cross-section is only retained in samples of minimal diameter. As the sample dimensions are increased, the concentration of nitrogen in the center becomes significantly lower than that in the surface layers. For samples with a diameter of 50 mm (and a pressure of 0.4 MPa), the difference between nitrogen concentrations in central and surface layers is 2–3% N. The results of X-ray diffraction analysis of the samples after combustion are in agreement with the results of elemental analysis. In the samples burning at 5 MPa, only the δ-CrN phase was discovered and at low pressures, β-Cr2N was the predominant phase.
A more prominent manifestation of uneven phase distribution was found in quenched samples. By quenching we imply sudden cut-off of nitrogen flow into the combustion zone. Quick depressurization and subsequent injection of inert gas (argon) into the reaction zone stopped the combustion. Thus, an intermediate state of the sample is conserved, which allowed us to analyze the processes taking place during each respective stage of combustion. Elemental analysis of samples of different sizes that burned at high pressures has shown that the concentration of nitrogen throughout the cross-section stayed virtually constant. The same pattern is observed in the samples of minimal diameter that burned at low pressures. The situation was different with concentration gradients on a sample with the maximum diameter that combusted at low pressure. In surface layers of that sample, the same amount of nitrogen was found, as in the samples of lesser diameter, and the concentration of nitrogen rapidly decreased towards the center. In the axial area of the sample, virtually no nitrogen was present.
3.3. Nitridation Process Stages when Chromium Is Burned in Nitrogen
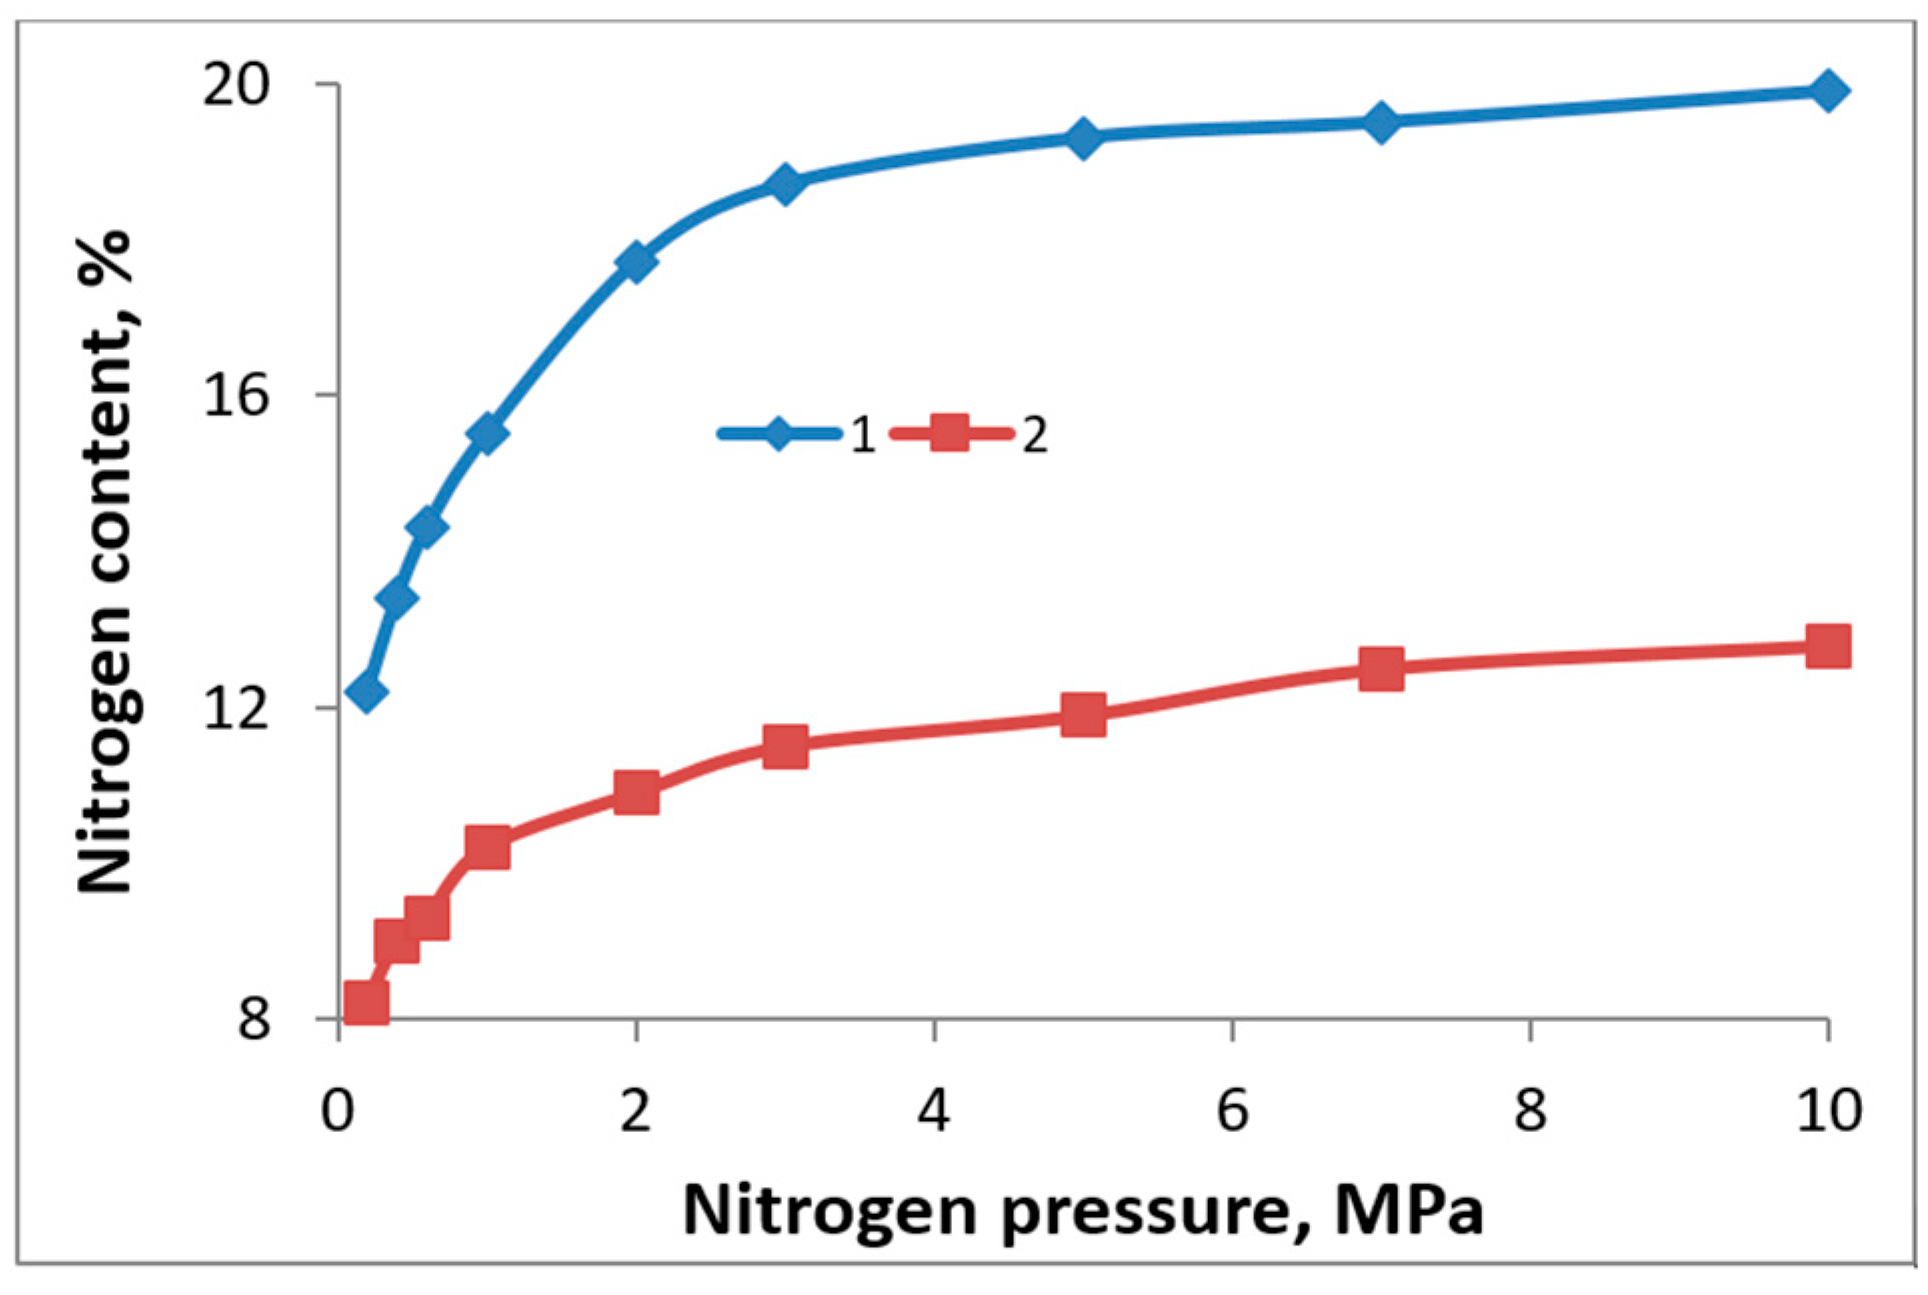
Figure 7 shows the dependency of N content in the combustion products of Cr on the pressure.
Curve 1 in Figure 7 is drawn for slowly cooling down samples, and Curve 2 is drawn for quenched samples. The sample with interrupted combustion consists of two parts. The upper sintered part is a burned part and the lower non-sintered part is the initial Cr. The half-burned samples obtained in this way were subjected to layer-by-layer elemental and phase analyses. The initial chromium contains at least 0.01% N. Between sintered and non-sintered parts of the sample, a thin non-sintered layer (~2 mm) with altered color was found with the nitrogen concentrations of up to 3% N (Figure 8). X-ray diffraction analysis showed that Cr forms the base of this layer with a significant amount of Cr2N. In the first layers of the sintered area of the quenched sample (3–5 mm thick), the concentration of nitrogen increases to ~9–11% N.
The predominant phase here is Cr2N with traces of Cr and CrN. In the subsequent layers, the traces of Cr disappear in the X-ray diagrams and the share of CrN increases. At the distance of ~20 mm from the quenched combustion front, the content of Cr2N and the content of CrN are approximately the same. The concentration of N stays within the range of 14–16%. The share of the mononitride increases as we go farther from the transitional layer. In Figure 7, Curve 2 characterizes the concentration of nitrogen from the layers that are ~10 mm away from the transitional layer. Thus, during the nitridation of chromium in the layer-by-layer combustion mode, the formation of elemental and phase composition of the combustion products is finalized in the afterburning zone. The reason for this is an incomplete transition in the combustion zone and the retention of the permeability of the samples behind this zone.
3.4. Microstructure of Nitrided Chromium
Figure 9 shows a typical microstructure of sintered nitrided chromium, synthesized at 0.2 and 5 MPa. After combustion, the samples retained high porosity, and the particles retained their initial shape and they were weakly bound. There were no traces of melting. After nitridation at 0.2 MPa, chromium particles had a two-phase microstructure, and after 5.0 MPa the microstructure was single-phase. These results are in agreement with the data of X-ray diffraction analysis. According to these data, the products of chromium combustion at 5.0 MPa are almost entirely single-phase and they are comprised exclusively of CrN. However, the products of chromium combustion at 0.2 MPa were two-phase (Cr2N + CrN). Cr2N is represented by the lighter-colored areas.
3.5. Nitridation of Ferrochromium
Figure 10 shows a dependency of the combustion rates of Fe-Cr powder with different particle sizes on nitrogen pressure. The finer the powder, the higher the rate of nitridation, and the greater the amount of nitrogen absorbed. In the investigated pressure range (1.0–10.0 MPa), the combustion temperature that was measured using the thermocouple was 1220–1300 °C. It is significantly lower than the estimated combustion temperature for ferrochromium (~1680 °C). Figure 11a shows a typical profile of Fe-Cr nitridation. Such a profile suggests that there is an extended after-reaction stage. Figure 11b shows the curves of the dependency of the combustion rates of Fe-Cr with different particle sizes on the initial powder temperature (T0). As T0 grows, the rate of Fe-Cr combustion significantly increases. When T0 reaches 400 °C, nitridation of more coarse powder (0.2 mm) becomes possible.
The metallographic analysis of the combustion products confirmed the absence of traces of melting in Cr-Fe-N. The solid-phase mechanism normally improves the degree of nitridation of both metals and ferrous alloys. The larger part of the nitrogen was absorbed by the alloy directly in the synthesis wave, and this also happened in the layer-by-layer combustion mode. The unreacted part of the ferrous alloy interacted with the nitrogen and this time it happened in the volumetric combustion mode. The high porosity retained behind the combustion front promotes this after-reaction. This afterburning may greatly increase the content of nitrogen in the product. Notwithstanding, we could not reach maximum nitridation by nitriding ferrochromium. For an alloy with 75.6% of Cr, the concentration of nitrogen is estimated at ~16.8% N for a reaction whereby chromium turns into CrN1,0. However, the maximum measured content of nitrogen in ferrochromium was ~13.0% N. Thus, the degree of nitridation was greater than 77%.
3.6. Nitridation of Chromium and Ferrochromium in Cocurrent Nitrogen Flow
In the above, we considered the filtration combustion of chromium and ferrochromium in N2 under natural filtration conditions. In this case, the oxidizer (N2) and the fuel (Cr) were spatially divided before the reaction. N2 was forced into the combustion zone by the constantly maintained difference between the pressure in the samples and their surrounding medium. Depressurization in the combustion zone was due to continuous absorption of nitrogen by chromium, which resulted in the filtration of gas into the bulk of the burning sample. Thus, combustion under natural filtration in this study was a self-regulatory process with a strong feedback. Nitrogen entered the reaction zone through an opening in the side.
In the case of nitridation in the cocurrent filtration mode, nitrogen was forcedly fed into the combustion zone. According to the preliminary experiments, stable combustion of chromium in a cocurrent flow of nitrogen at specific flow rates exceeding 8 cm3/s can only be maintained when powder with particle sizes of 63–80 µm is used. For finer powders, combustion is hampered due to reduced permeability.
Figure 12 shows the dependencies of Cr combustion rates on the pressure under normal conditions. Under normal filtration conditions, 63–80 µm Cr powder produced by the calcium-hydride process burns at 5 MPa only. To implement combustion at 0.2 MPa, a finer Cr powder was used. In such conditions, the combustion rate equals 0.04–0.05 cm/s. That is why it is not possible to compare the results of Cr combustion in nitrogen in different filtration modes under the same conditions (nitrogen pressure, powder fineness, and porosity). The results of chromium powder combustion under different conditions of natural filtration and pressure filtration are shown in Table 2. Minimum temperature and combustion rate are observed during nitridation in the conditions of natural filtration. Here, the degree of nitridation is at its highest. The products of Cr combustion in the cocurrent flow of nitrogen and nitrogen-argon (in ratio to 50:50) mixture were single-phase. In both cases, only the Cr2N phase had been detected by X-ray diffraction. However, in the samples that burned in the natural filtration mode, different amounts of the second phase (CrN) were detected. As the degree of nitridation grows, the amounts of the higher nitride also grow.
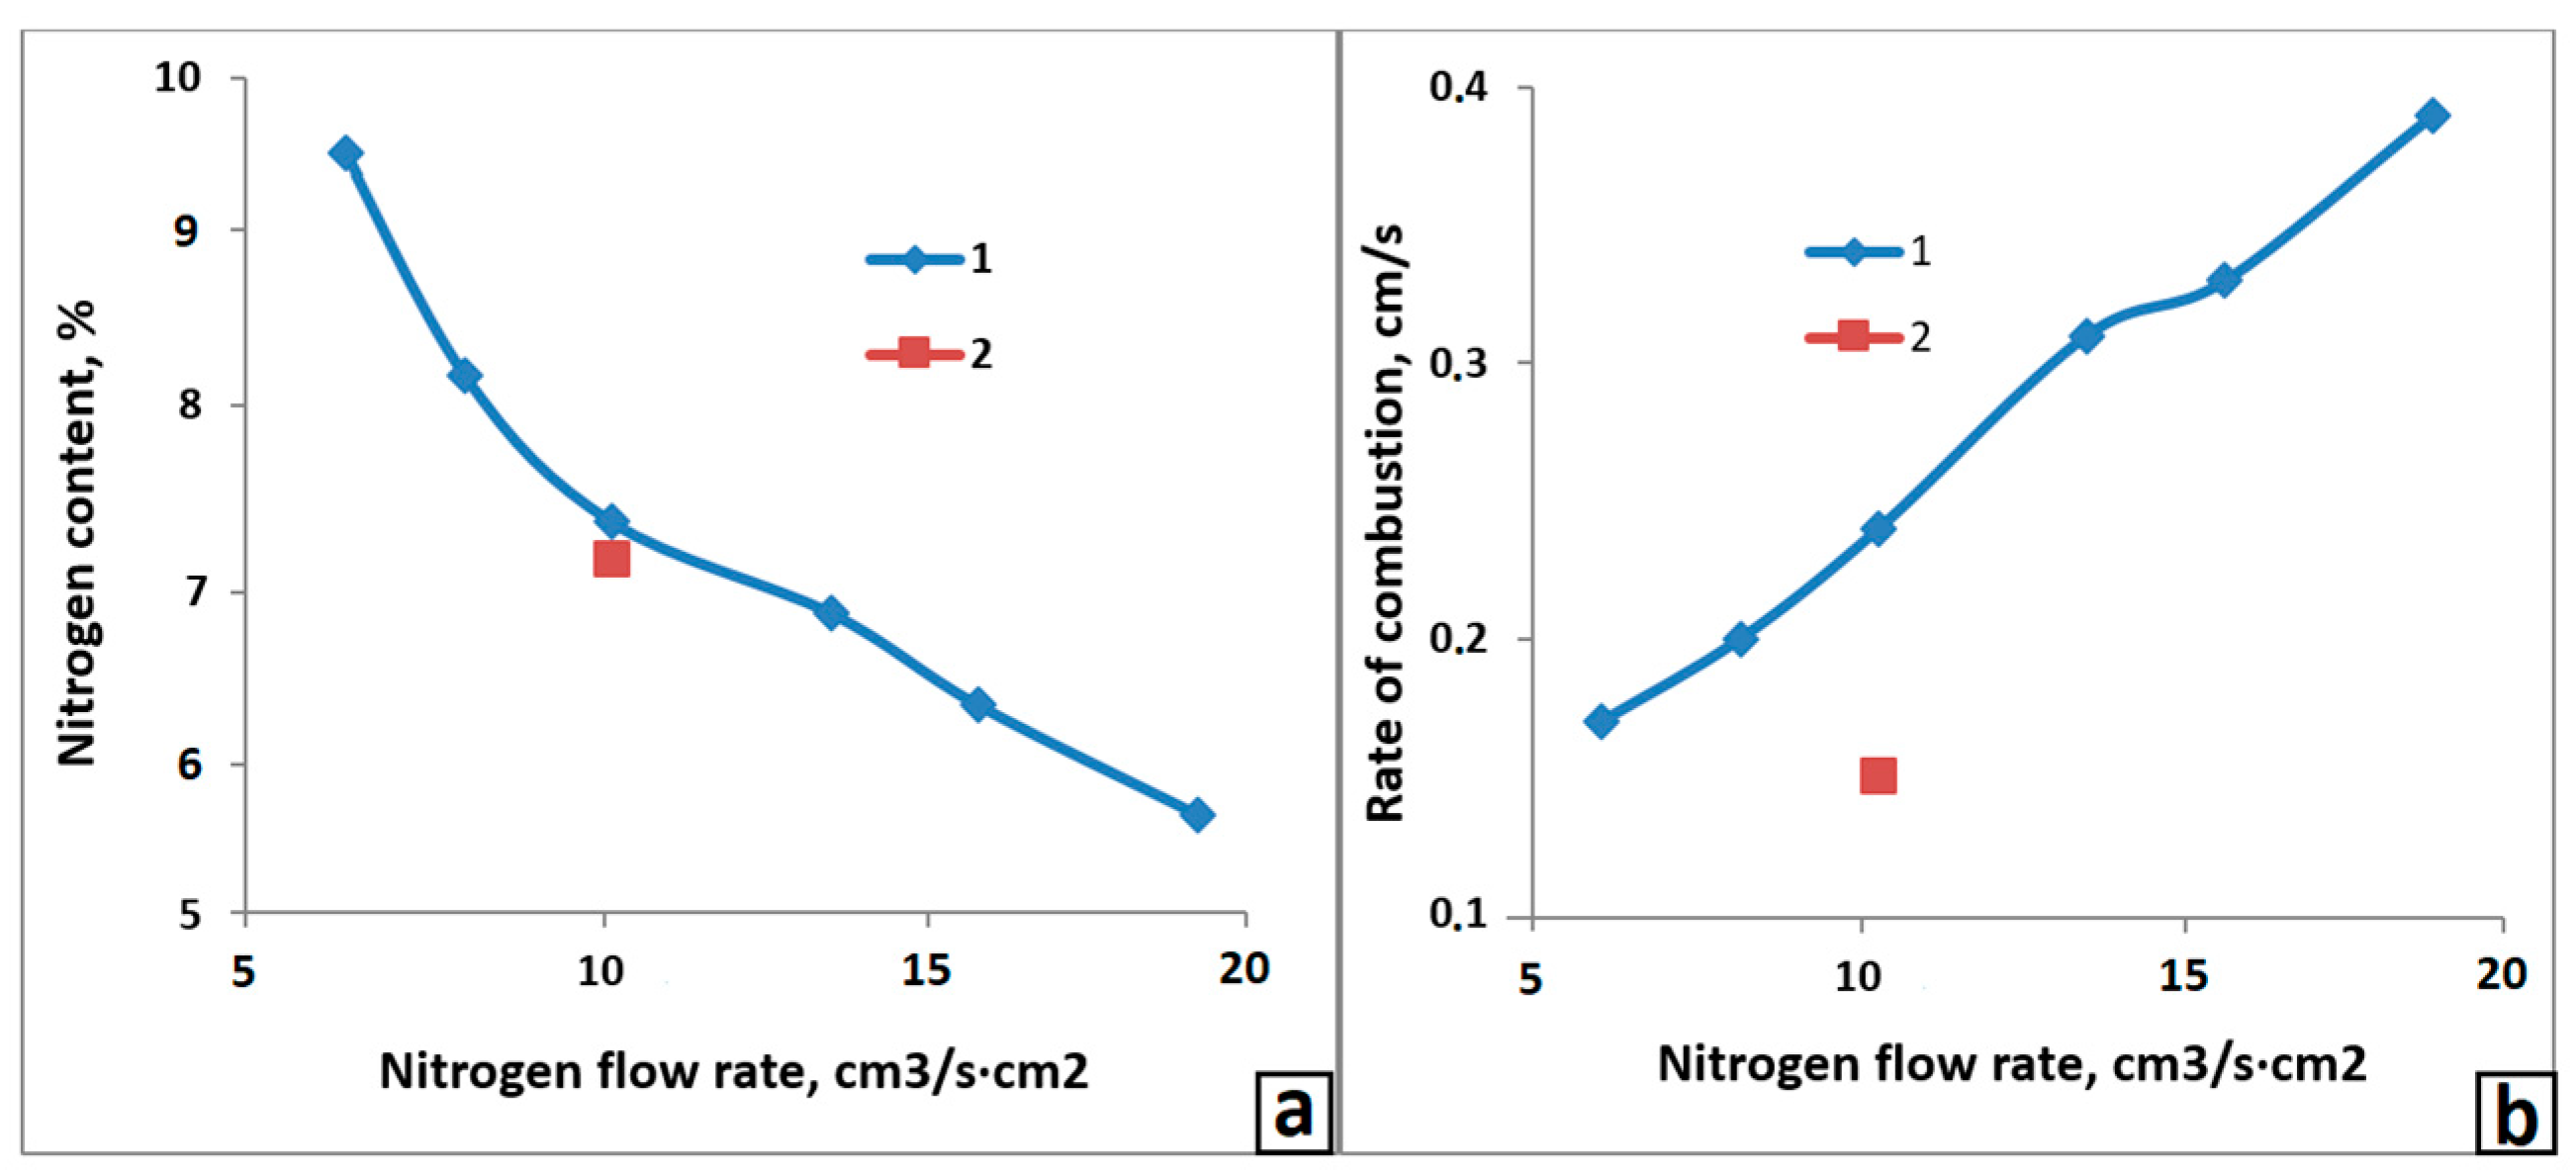
Figure 13 shows the curves of the dependency of the combustion rate and degree of Cr nitridation on the specific nitrogen flow rate. There is a rapid increase in the combustion rate as the flow rate of N2 is increased, while the degree of nitridation is decreasing. Therefore, switching the combustion mode to cocurrent filtration of the reacting gas may lead to an increase in the combustion rate by an order of magnitude. Additionally, Figure 13 shows the result of chromium nitridation in the nitrogen-argon mixture, for the sake of comparison. While the degrees of nitridation for both scenarios are virtually identical, the rate of combustion in diluted nitrogen is lower by almost two times.
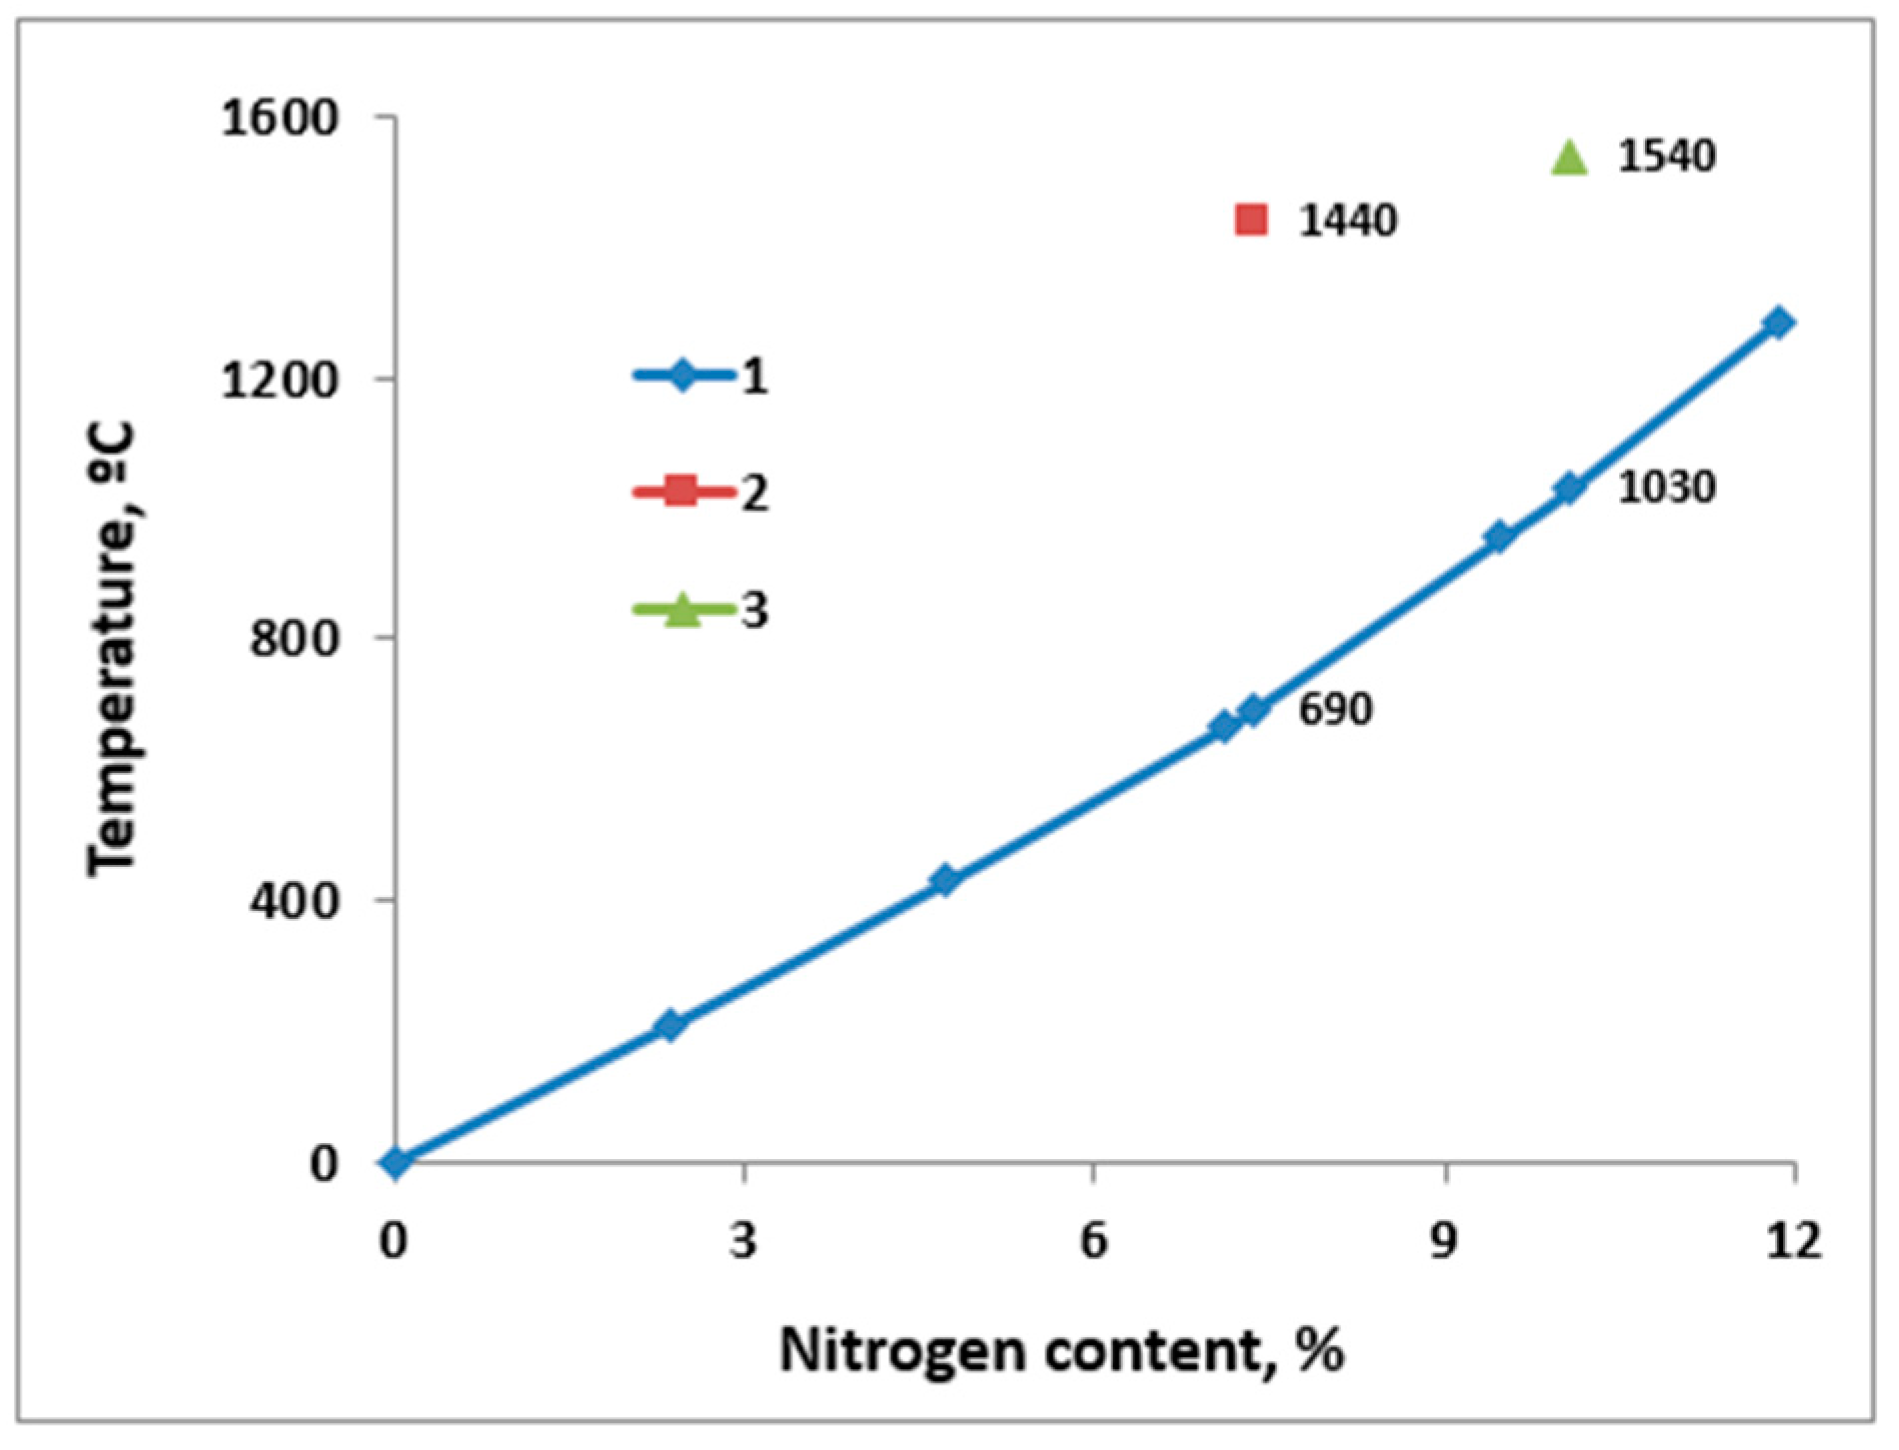
Table 2 shows the combustion temperatures for different combustion modes that were taken from the thermocouple inserted into the lower side of the sample at a depth of ~1.0 cm. The diameter of the powder fill was 18.8 mm and the height was ≈150 mm. For the natural filtration mode, the measured combustion temperature (1250 °C) is insignificantly lower than the estimated adiabatic temperature (~1320 °C). The phase composition corresponds to the equilibrium phase composition for the degree of nitridation measured after the combustion (12.21% N). The situation with the cocurrent nitrogen filtration modes is different. The combustion temperatures that were recorded for the thermocouple turned out to be significantly higher than the estimated temperatures: 1540/1030 °C and 1440/690 °C, respectively. Furthermore, this difference grows larger as the flow rate of nitrogen increases.
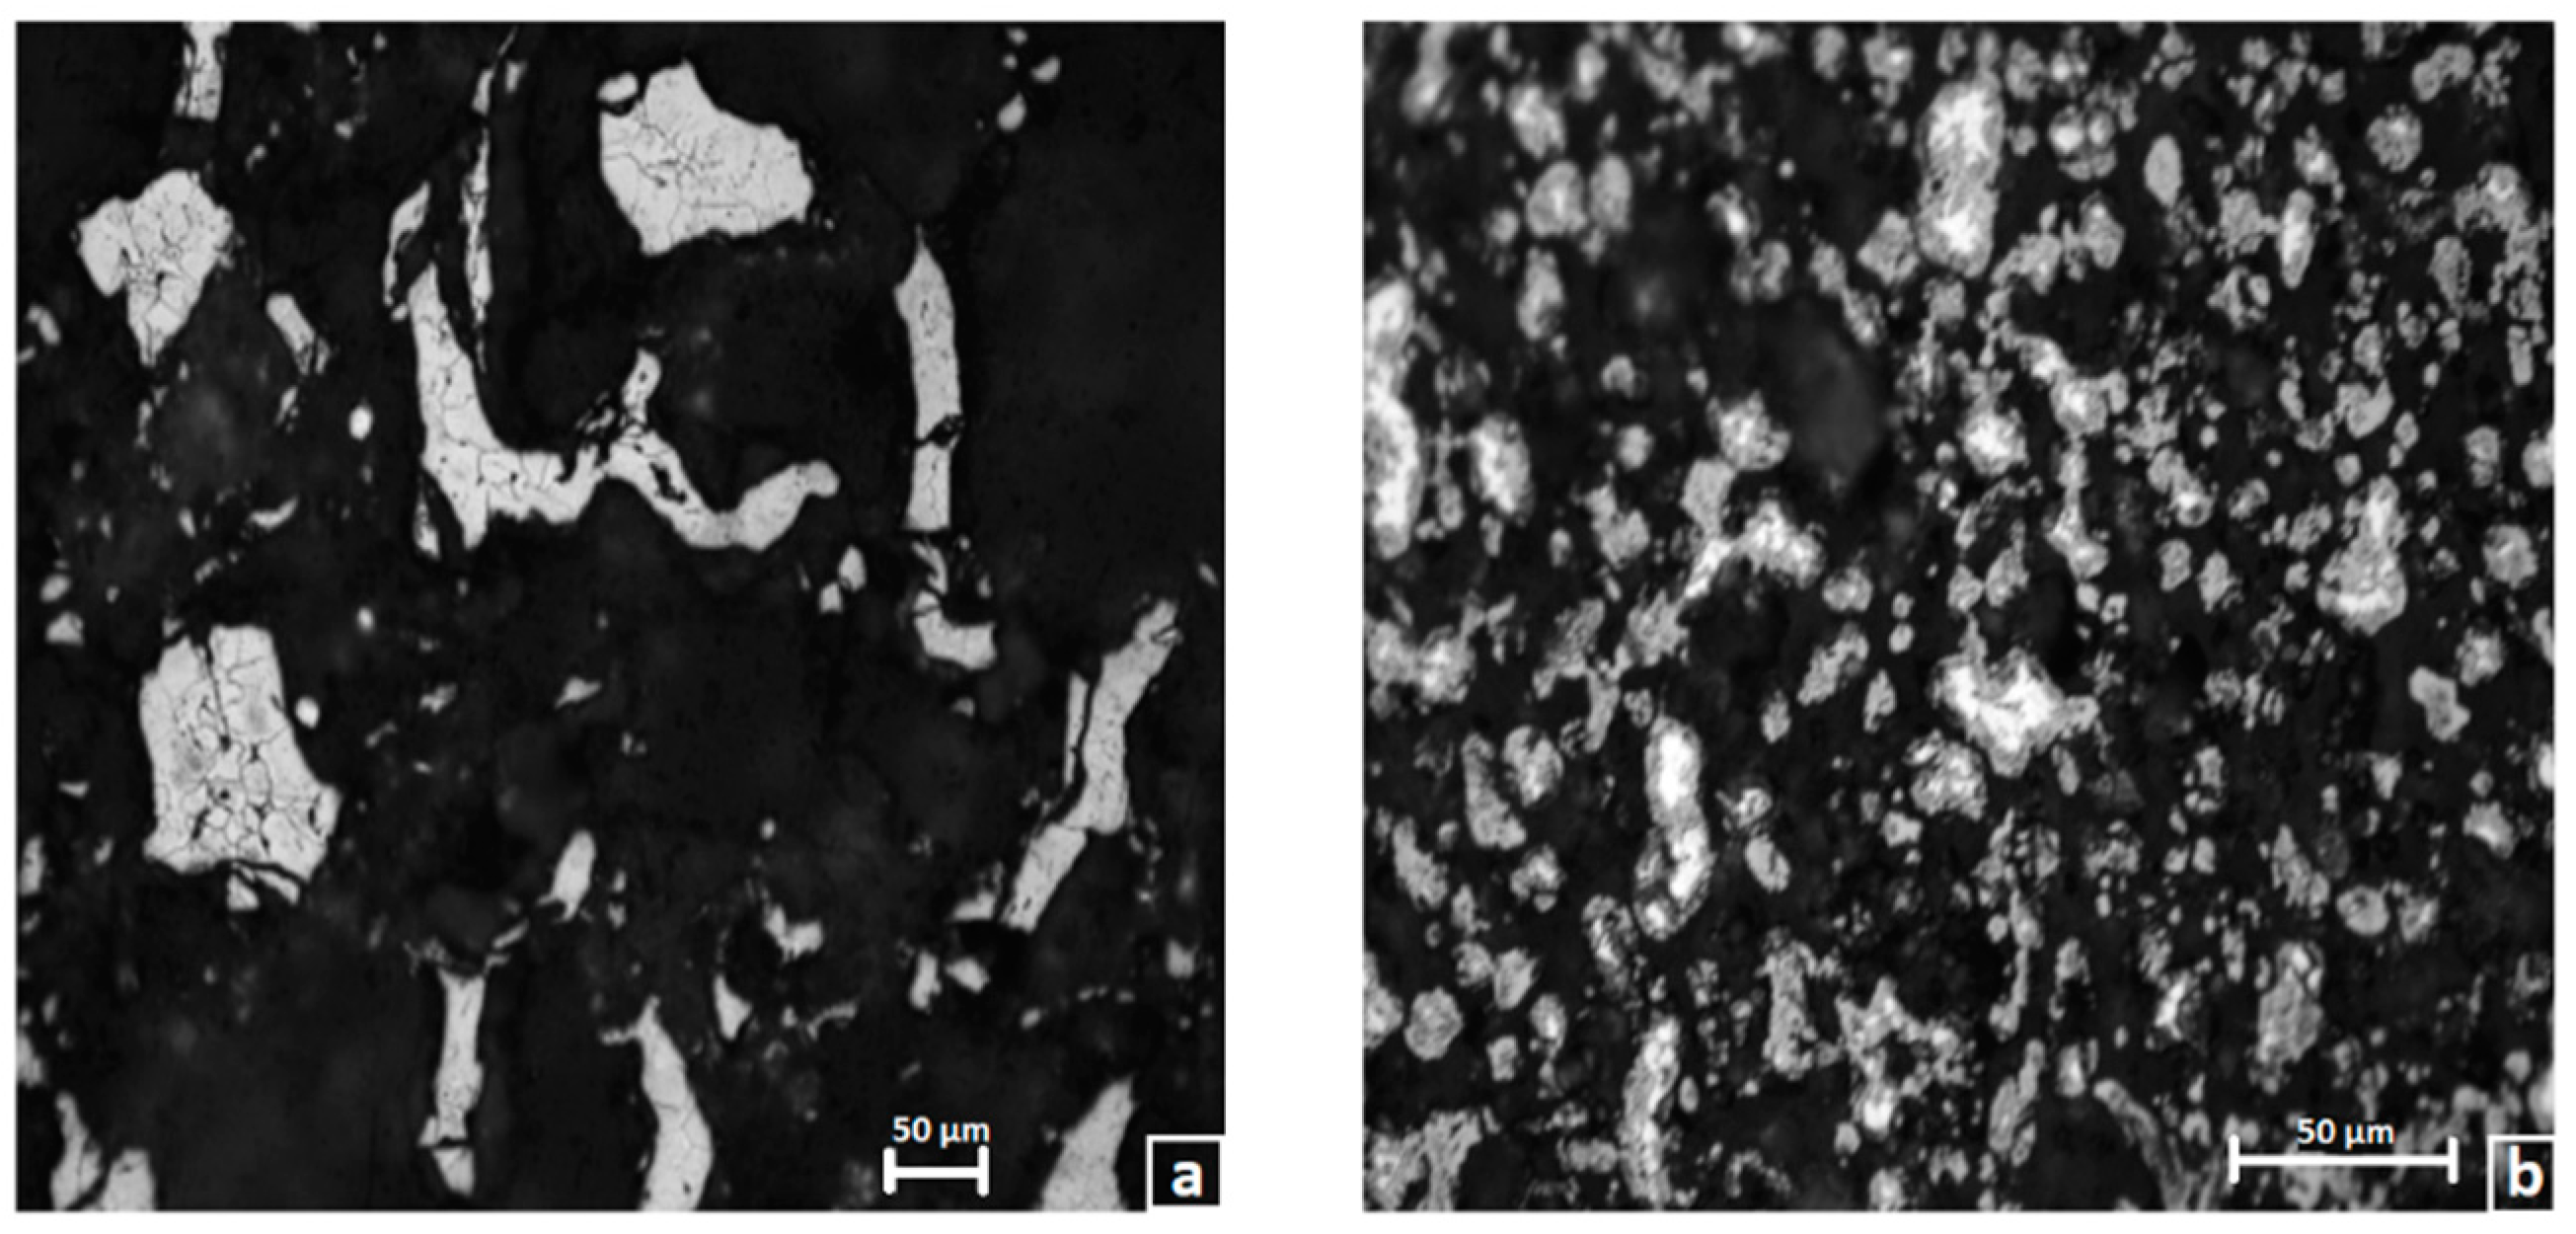
Figure 14 shows the microstructure of the PH 1S chromium sample that has been burned in the cocurrent flow of nitrogen-argon mixture as compared to the structure of chromium powder that has been nitrided under natural filtration conditions at 0.2 MPa. The first sample has retained high porosity (~80%) and the particles have retained their initial facet pattern. The microstructure of the particles treated in the mode of forced filtration combustion is single-phase, and in the natural filtration mode it is two-phase. The lighter-colored areas in the median parts of the particles represent the Cr2N phase, while the darker-colored areas represent the CrN phase.
3.7. Ferrochromium Nitridation in the Cocurrent Flow of Nitrogen
Figure 15 shows the curves that represent the dependency of the combustion rate and the degree of ferrochromium nitridation on the flow rate of nitrogen.
Ferrochromium in the cocurrent flow of nitrogen starts burning at greater gas flow rates. The combustion rate of Fe-Cr is significantly lower than that of Cr, both for forced filtration and natural filtration. However, the rate of combustion of Fe-Cr increases as the flow rate of nitrogen is increased, and the same applies to Cr. It is noteworthy that, in the investigated range of process parameters, the degree of Fe-Cr nitridation under forced filtration (4.7–7.5% N) is much lower than that under natural filtration (8.8–14.2% N). The reason for this lies in the absence of the after-reaction stage, in the case of the forced flow of nitrogen. In the course of tempering of the nitridation products by an overflowing stream of gas, the amount of uptaken nitrogen is equal to that which has been absorbed directly in the combustion zone.
The porosity of the chromium samples is ~80%. According to the estimations, the amount of nitrogen located in the pores of such samples was not enough to turn Cr into CrN. At 10.0 MPa, only ~12% of Cr may turn into CrN by reacting with nitrogen from the pores. Such a degree of nitridation will only provide for heating by no more than 300 °C, and this is not enough for the process to take place in the self-sustained combustion mode. Therefore, for the synthesis of Cr nitrides to be self-sustained by the heat from the exothermic nitridation reaction, the majority of the nitrogen must come to the reaction zone from an external source. In this case, nitrogen can only be delivered by the filtration of gas through the porous structure of the sample. Thus, in the chromium nitridation experiment conditions that were investigated in this research, chromium combustion would take place via the so-called filtration combustion mechanism. This type of SHS process is peculiar, due to the fact that the characteristics of the system that define the filtration delivery of the gaseous reagent into the combustion zone will influence the combustion trends and make combustion either possible or impossible.
The Cr-N system is peculiar, due to the fact that higher chromium nitride δ-CrN has low thermal stability: At 0.1 MPa, it is dissociated at ~1050 °C.
4CrN = 2Cr2N + N2
The dissociation temperature increases as the pressure is increased [6].
Tδ = 10,620 × (13.03 − lgP)−1
At 10 MPa, the dissociation temperature will be ~1490 °C, which is lower than the estimated combustion temperature by ~570 °C. That is why, when chromium burns in nitrogen, yielding CrN as a synthesis product, the temperature does not exceed the temperature of its stable state. As the pressure increases, the estimated combustion temperature also increases, from 1140 °C (0.1 MPa) to 1520 °C (10.0 MPa). That is why the combustion temperature that was recorded from the thermocouple was close to the estimated temperature.
In order that we could directly observe surface combustion, a series of chromium nitridation experiments were conducted, in which an ad hoc gas-permeable rectangular-block container (110 × 60 × 30 mm3) was used. Two faces of the block were made of quartz plates and the other two faces were made of metal mesh. At the initial stage, the shape of the combustion front is close to the shape corresponding to layer-by-layer combustion. The results of the visualization of the surface combustion of chromium in nitrogen using such a setup, are shown in [10]. Then, protrusions in the areas with more favorable filtration conditions (i.e., the surface of the sample) emerge. The dimensions of such protrusions gradually grow because the propagation of the combustion front is slowed down at the center. At the final stage, the shaped-up protrusions of the combustion front start moving towards each other, to eventually merge in the center of the sample.
The maximum temperature that was developed in the course of the layer-by-layer combustion of Cr in N2 was lower than the melting temperature of Cr (1860 °C) and that of the eutectic alloy in the Cr-N system (1640 °C).
The combustion products and the initial metal did not melt, and the sample retained good permeability. Due to this, conditions for post-nitridation were maintained behind the combustion wave.
The next curve (Figure 16) shows the estimated dependency of the adiabatic temperature of chromium combustion in the case of its incomplete transition. The estimation was performed for the formation of a two-phase Cr2N-Cr product. When a single-phase Cr2N (11.86% N) product was formed, the combustion temperature was 1287 °C. The combustion temperature that was close to that value was achieved by the nitridation of chromium powder in natural filtration conditions (Table 2).
4. Conclusions
In conclusion, both chromium and ferrochromium can be successfully nitrided both by natural and forced filtration. The conditions of nitridation can be adjusted to synthesize both single-phase products (Cr2N or CrN) and a mixture of phases with different component ratios. Here, to synthesize the CrN phase, we must use natural filtration mode and layer-by-layer combustion. However, we have managed to obtain the single-phase Cr2N half-nitride in the forced filtration mode only. Therefore, CrN was formed as a result of two-stage nitridation (layer-by-layer combustion—volumetric after-burning), while Cr2N was formed by single-stage nitridation. SHS nitridation of chromium and ferrochromium took place in the filtration mode. The main parameters governing the consistent patterns and mechanism of chromium and ferrochromium combustion were: (1) The elemental composition of the initial materials, (2) the particle size of the nitrided powder, (3) the porosity of the powder filler, (4) the pressure of nitrogen, and (5) the conditions of its transport into the combustion zone. It has been experimentally established in this research that layer-by-layer combustion of chromium in nitrogen takes place via the solid phase mechanism. The maximum temperature of chromium and ferrochromium combustion was limited by the dissociation temperature of CrN. As the pressure increased, the dissociation temperature increased, and the combustion temperature also increased.
It has been shown in this study, that the use of forced filtration extends the range of possible SHS process realizations for the Cr–N2 system with lower pressure conditions and larger metal particle sizes. It was discovered that forced filtration promotes the initiation of the combustion mode in superadiabatic heating conditions. The use of forced filtration modes allows for the synthesizing Cr2N of different composition in the self-sustained combustion mode. Switching the chromium nitridation process into the forced filtration mode using the N2-Ar mixture, promotes the formation of an inverse combustion wave. A single-stage mechanism of the formation of products was discovered.
To our knowledge, it has already been shown in theoretical research in the body of literature that, in the case of self-sustained combustion realization in the cocurrent filtration mode, the temperature that exceeds the adiabatic combustion temperature is quickly achieved. In our research, a significant exceedance of actual combustion temperature over the estimation has been noted for chromium powder nitridation in the forced gas filtration mode.
Author Contributions
V.P., M.Z.—Conceptualisation, methodology, writing, investigation; A.Z.—Supervision, investigation; N.S.—Investigation.
Funding
The research was supported by The Tomsk State University competitiveness improvement program (grant No. 8.2.2.06.2018) and was carried out with financial support from the Ministry of Education and Science of the Russian Federation (State assignment No. 11.11223.2018/11.12).
Conflicts of Interest
The authors declare no conflict of interest. The funders had no role in the design of the study; in the collection, analyses, or interpretation of data; in the writing of the manuscript, or in the decision to publish the results.
References
- Levashov, E.A.; Merzhanov, A.G.; Shtanskv, D.V. Advanced technologies, materials and coatings developed in scientific-educational center of SHS. Galvanotechnik 2009, 100, 2102–2114. [Google Scholar]
- Sytschev, A.E.; Merzhanov, A.G. Self-propagating high-temperature synthesis of nanomaterials. Russ. Chem. Rev. 2004, 73, 147–159. [Google Scholar] [CrossRef]
- Ponomarev, M.A.; Loryan, V.E.; Shchukin, A.S.; Merzhanov, A.G. SHS in preliminary structured compacts: II. Ti-2B and Ti-Al blends. Int. J. Self Propag. High Temp. Synth. 2013, 22, 202–209. [Google Scholar] [CrossRef]
- Ponomarev, M.A.; Loryan, V.E.; Kochetov, N.A.; Merzhanov, A.G. SHS in preliminary structured compacts: I. Ni-Al blends. Int. J. Self Propag. High Temp. Synth. 2013, 22, 193–201. [Google Scholar] [CrossRef]
- Rogachev, A.S.; Grigoryan, A.É.; Illarionova, E.V.; Kanel’, I.G.; Merzhanov, A.G.; Nosyrev, A.N.; Tsygankov, P.A. Gasless combustion of Ti-Al bimetallic multilayer nanofoils. Combust. Explos. Shock Waves 2004, 40, 166–171. [Google Scholar] [CrossRef]
- Merzhanov, A.G. Fundamentals, achievements, and perspectives for development of solid-flame combustion. Russ. Chem. Bull. 1997, 46, 1–27. [Google Scholar] [CrossRef]
- Merzhanov, A.G.; Ozerkovskaya, N.I.; Shkadinskii, K.G. Dynamics of thermal explosion in heterogeneous compositions interacting through a layer of the product. Chem. Phys. Rep. 2001, 19, 1931–1948. [Google Scholar]
- Kvanin, V.L.; Balikhina, N.T.; Merzhanov, A.G.; Karabakhin, V.G. The use of self-propagating high-temperature synthesis and argon-arc overlaying when strengthening the surface of products made of titanium alloys. Russ. J. Non Ferrous Met. 2012, 53, 155–162. [Google Scholar] [CrossRef]
- Amosov, A.P.; Borovinskaya, I.P.; Merzhanov, A.G. Powder Technology of Self-Propagating High-Temperature Synthesis, 1st ed.; Mashinostroenie: Moscow, Russia, 2007; pp. 75–83. [Google Scholar]
- Braverman, B.S.; Ziyatdinov, M.K.; Maksimov, Y.M. Combustion of chromium in nitrogen. Combust. Explos. Shock Waves 1999, 35, 50–52. [Google Scholar] [CrossRef]
Figure 1.
Schematic of the laboratory high-pressure SHS reactor. 1—video camera, 2—outlet to the vacuum pump, 3—nitrogen inlet, 4—window for video recording, 5—thermocouple, 6—gas-permeable container with the powder, 7—heating coil, 8—electric pulse source, 9—transformer, and 10—computer.
Figure 1.
Schematic of the laboratory high-pressure SHS reactor. 1—video camera, 2—outlet to the vacuum pump, 3—nitrogen inlet, 4—window for video recording, 5—thermocouple, 6—gas-permeable container with the powder, 7—heating coil, 8—electric pulse source, 9—transformer, and 10—computer.

Figure 2.
Schematic of the experimental Laboratory flow-type SHS reactor.

Figure 3.
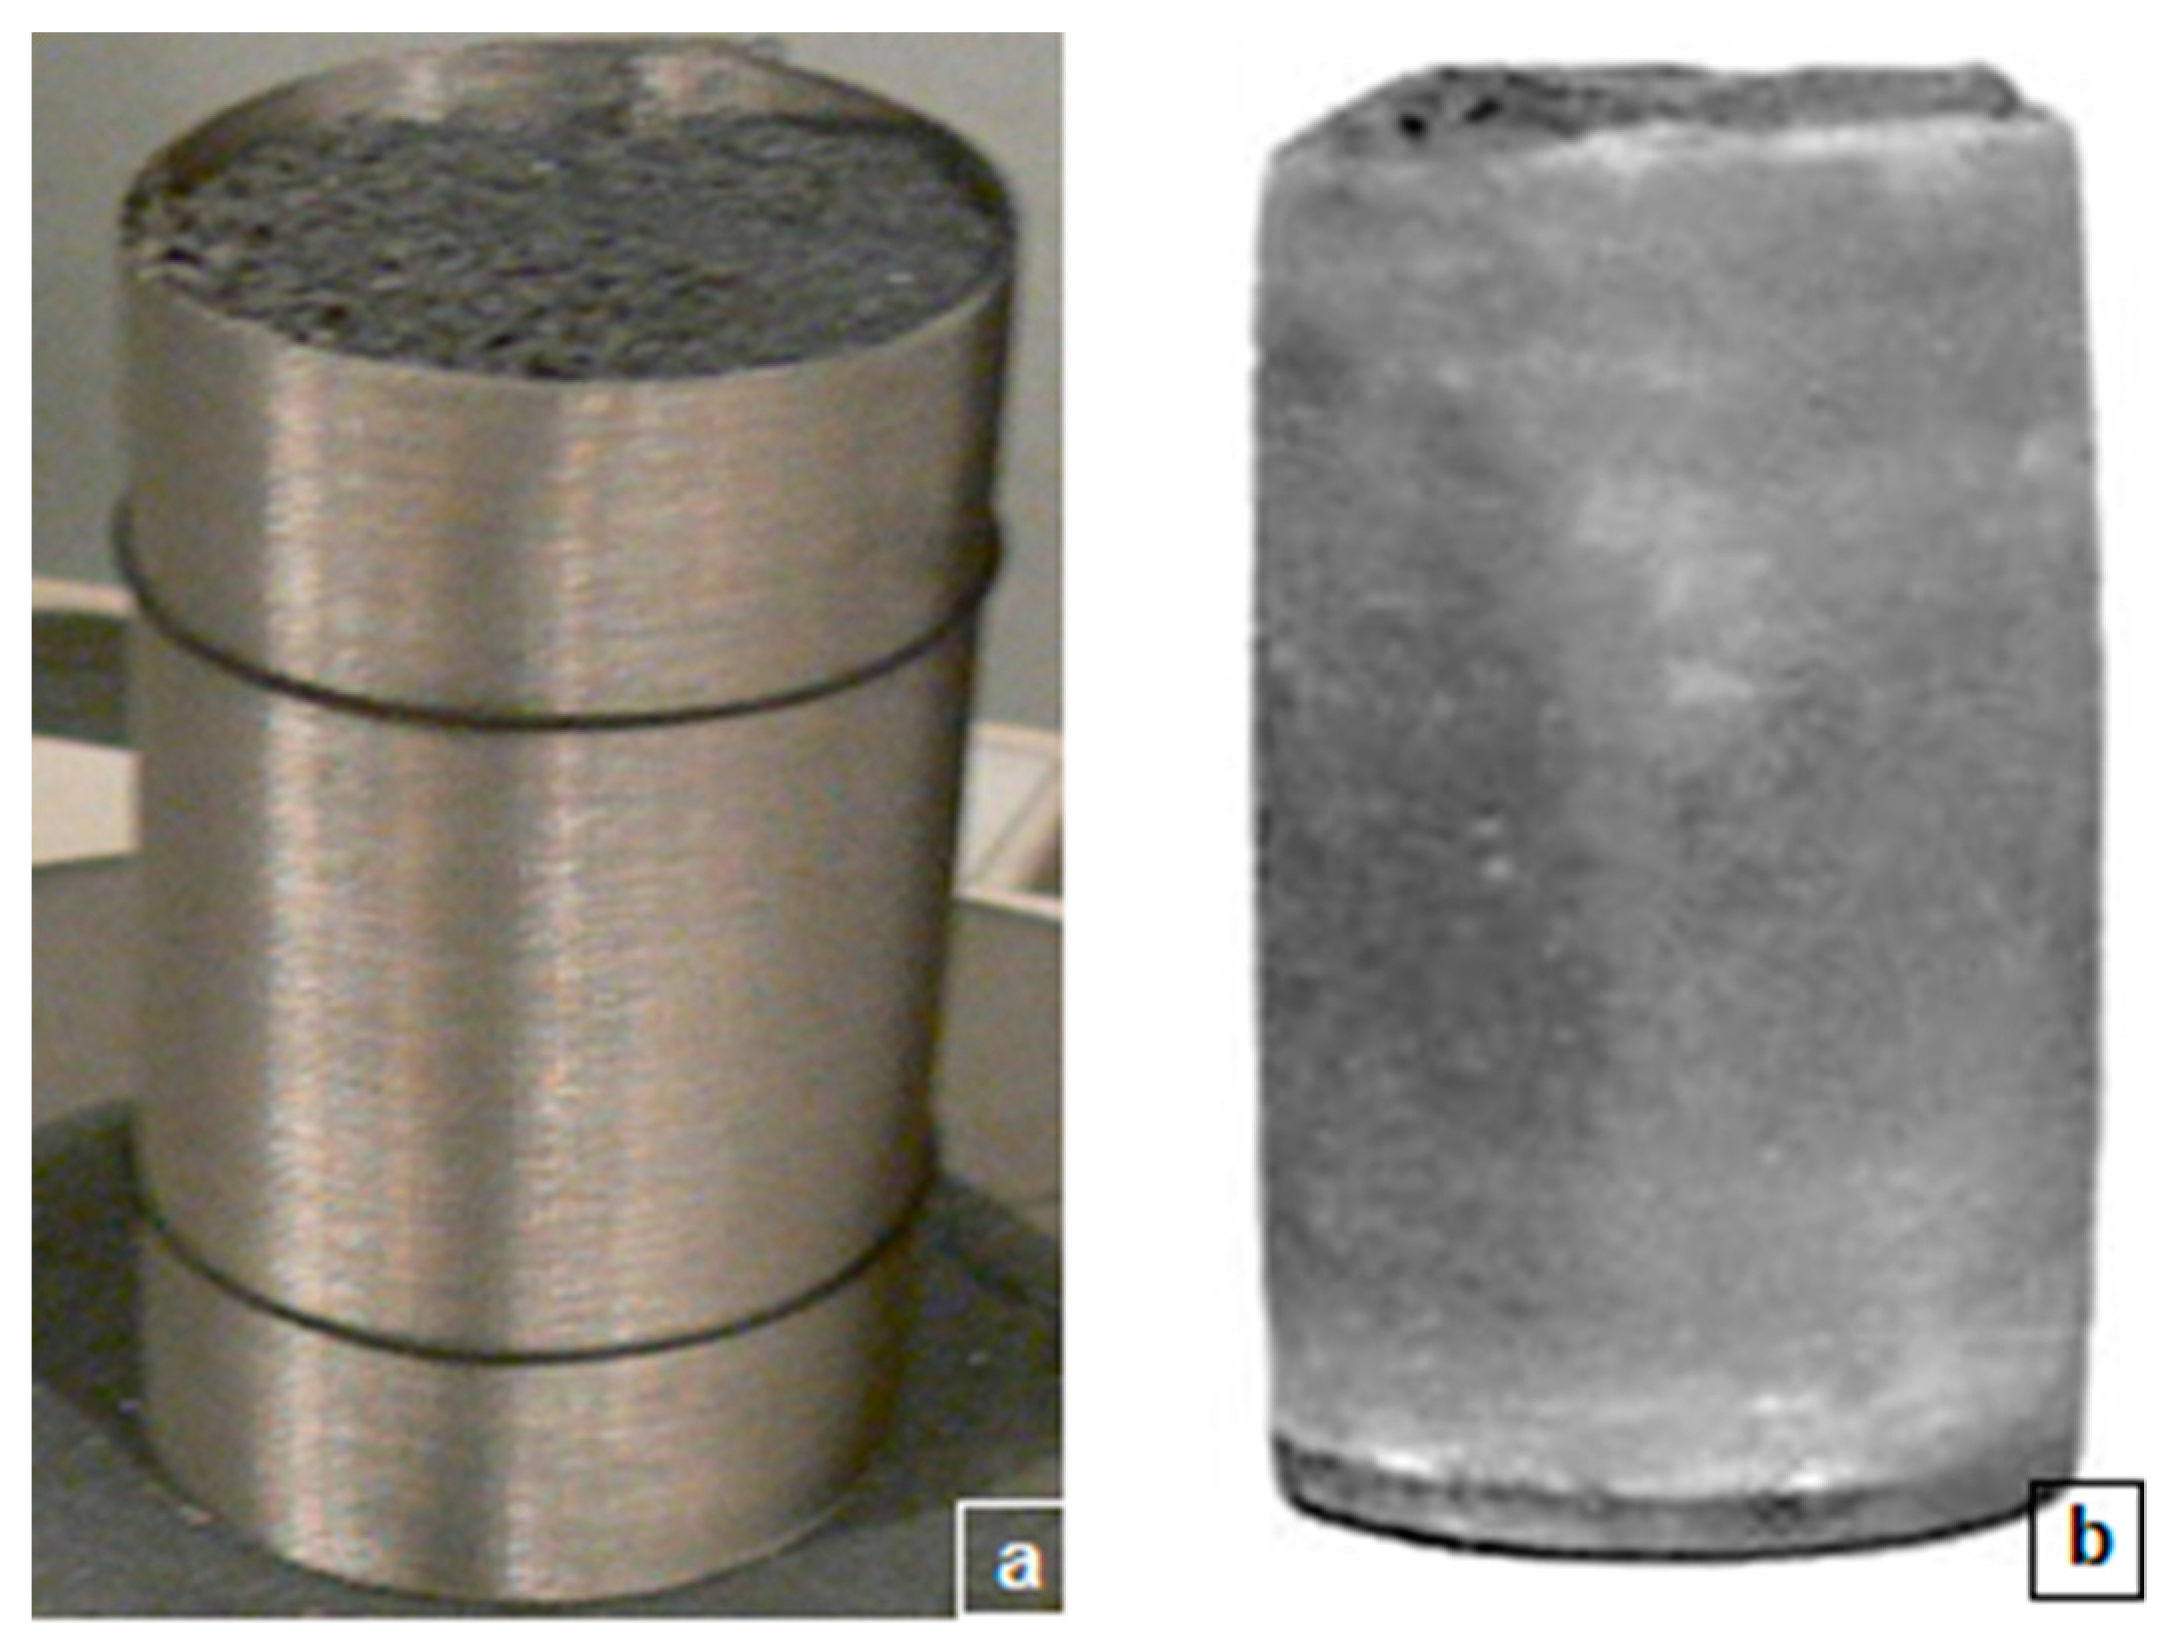
The appearance of the samples before and after combustion: (a) powder mixture before synthesis and (b) product after synthesis.
Figure 3.
The appearance of the samples before and after combustion: (a) powder mixture before synthesis and (b) product after synthesis.

Figure 4.
(a) the impact of nitrogen pressure on the rate of chromium combustion and (b) nitrogen content in the product. 1—calcium-hydride process chromium; and 2—aluminothermic process chromium.
Figure 4.
(a) the impact of nitrogen pressure on the rate of chromium combustion and (b) nitrogen content in the product. 1—calcium-hydride process chromium; and 2—aluminothermic process chromium.

Figure 5.
The impact of nitrogen pressure on the maximum combustion temperature; 1—estimated and 2—measured.
Figure 5.
The impact of nitrogen pressure on the maximum combustion temperature; 1—estimated and 2—measured.

Figure 6.
(a) Impact of sample diameter on chromium combustion rate. 1—0.4 MPa, 2—1.0 MPa, 3—5 MPa. (b) Impact of sample diameter on nitrogen content in chromium. 1—0.4 MPa, 2—5 MPa.
Figure 6.
(a) Impact of sample diameter on chromium combustion rate. 1—0.4 MPa, 2—1.0 MPa, 3—5 MPa. (b) Impact of sample diameter on nitrogen content in chromium. 1—0.4 MPa, 2—5 MPa.

Figure 7.
The impact of nitrogen pressure on the extent of chromium nitridation. 1—slowly cooling down samples and 2—quenched samples.
Figure 7.
The impact of nitrogen pressure on the extent of chromium nitridation. 1—slowly cooling down samples and 2—quenched samples.

Figure 8.
(a) Microstructure of particles at the initial stage of nitridation. (b) The formation of the Cr2N layer. Nitrogen pressure—4 MPa.
Figure 8.
(a) Microstructure of particles at the initial stage of nitridation. (b) The formation of the Cr2N layer. Nitrogen pressure—4 MPa.

Figure 9.
Microstructure of nitrided chromium. (a)—0.2 MPa; (b)—5.0 MPa.

Figure 10.
(a) Impact of nitrogen pressure on combustion rates, and (b) degree of nitridation of Fe-Cr. 1—0.02 mm, 2—0.04 mm, and 3—0.08 mm.
Figure 10.
(a) Impact of nitrogen pressure on combustion rates, and (b) degree of nitridation of Fe-Cr. 1—0.02 mm, 2—0.04 mm, and 3—0.08 mm.

Figure 11.
(a) Typical temperature profile of ferrochromium nitridation. PN2—5 MPa, Tmax = 1280 °C. (b) Impact of (T0) on the rate of ferrochromium combustion. 1 and 2—0.04 mm, 3—0.2 mm; and 1 and 3—6 MPa and 2—2 MPa.
Figure 11.
(a) Typical temperature profile of ferrochromium nitridation. PN2—5 MPa, Tmax = 1280 °C. (b) Impact of (T0) on the rate of ferrochromium combustion. 1 and 2—0.04 mm, 3—0.2 mm; and 1 and 3—6 MPa and 2—2 MPa.

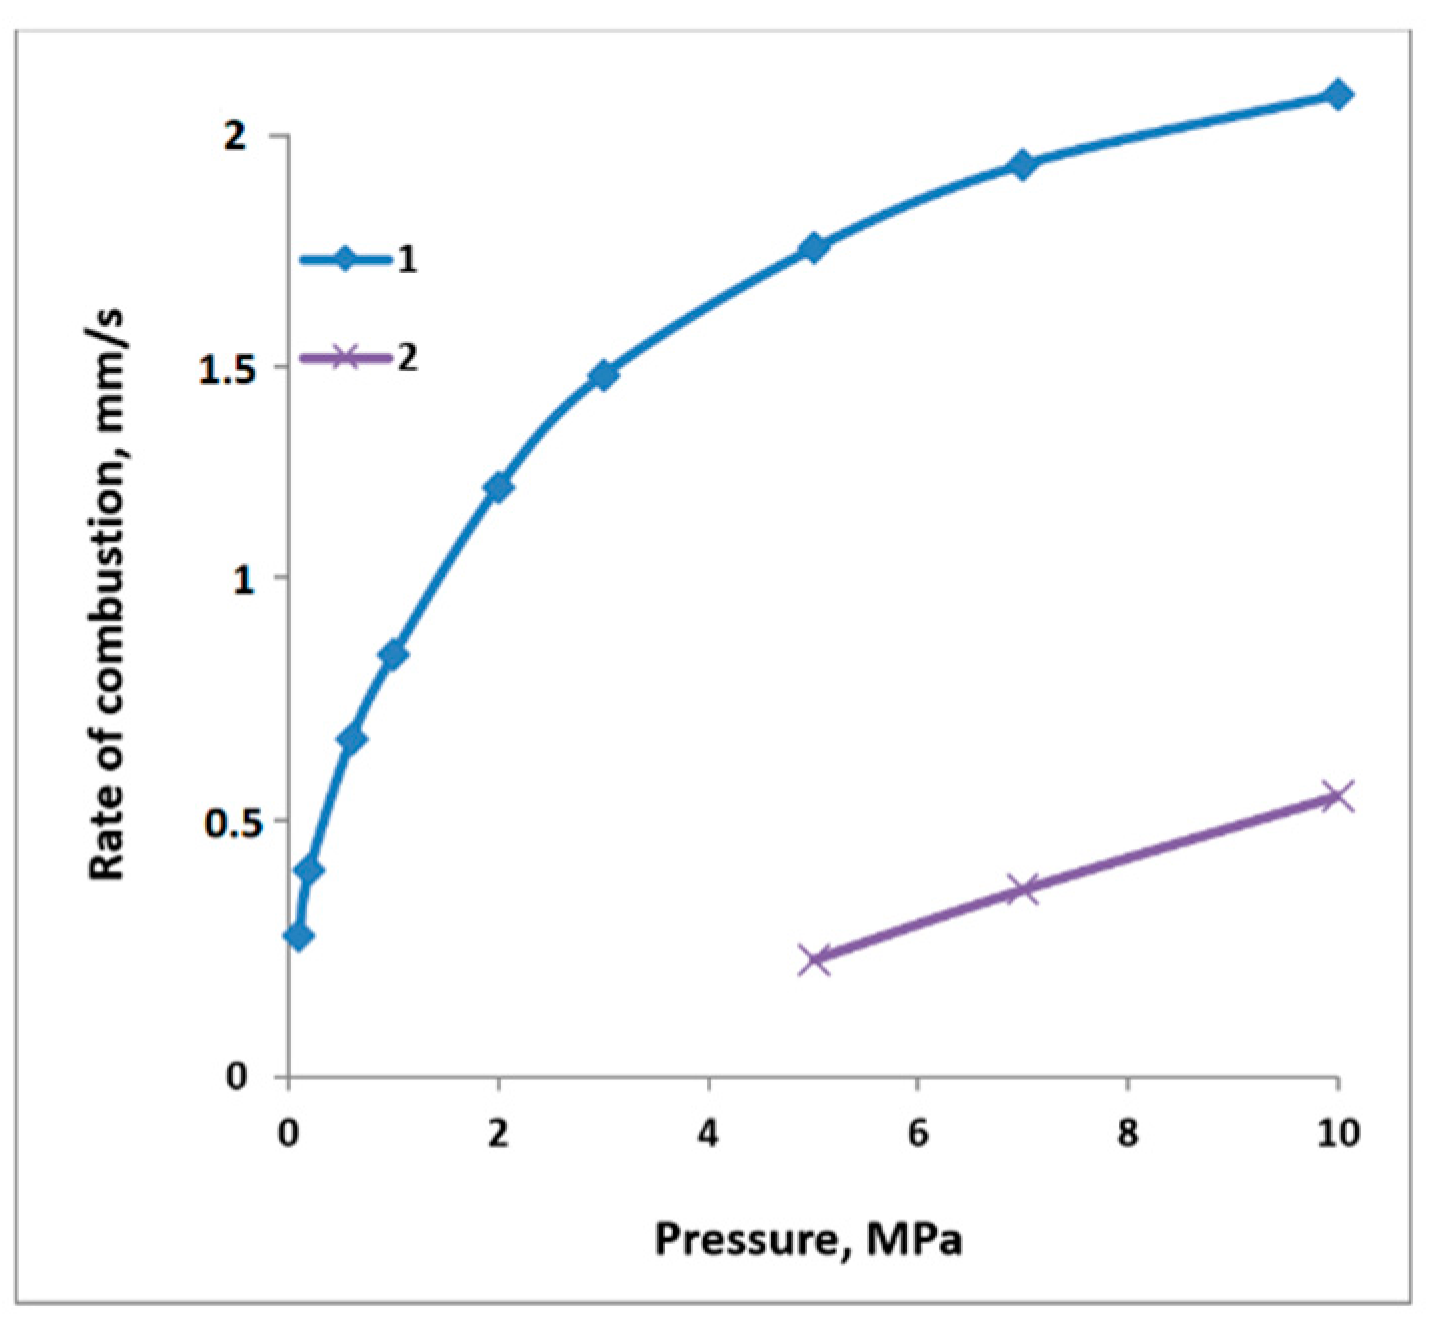
Figure 12.
Impact of pressure on the rate of combustion of Cr under natural filtration conditions. 1—avg. ≈ 5 µm, 2—63–80 µm.
Figure 12.
Impact of pressure on the rate of combustion of Cr under natural filtration conditions. 1—avg. ≈ 5 µm, 2—63–80 µm.

Figure 13.
(a) Impact of the specific flow rate of nitrogen on the combustion rate, and (b) degree of nitridation of chromium. 1—combustion in nitrogen, 2—combustion in the mixture of nitrogen and 3—argon.
Figure 13.
(a) Impact of the specific flow rate of nitrogen on the combustion rate, and (b) degree of nitridation of chromium. 1—combustion in nitrogen, 2—combustion in the mixture of nitrogen and 3—argon.

Figure 14.
Microstructure of chromium that has been burned in the forced (a) and natural (b) filtration modes.
Figure 14.
Microstructure of chromium that has been burned in the forced (a) and natural (b) filtration modes.

Figure 15.
(a) Impact of the specific flow rate of N2 on the combustion rate, and (b) degree of nitridation of Fe-Cr and Cr. 1—Cr, 2 and 3—Fe-Cr. 1 and 2—particle size of 63–80 µm, and 3—particle size of 63–200 µm.
Figure 15.
(a) Impact of the specific flow rate of N2 on the combustion rate, and (b) degree of nitridation of Fe-Cr and Cr. 1—Cr, 2 and 3—Fe-Cr. 1 and 2—particle size of 63–80 µm, and 3—particle size of 63–200 µm.

Figure 16.
Impact of nitrogen content on the combustion temperature. 1—estimation; 2,3—experimental data; 2—combustion in the mixture of nitrogen and argon, and 3—combustion in nitrogen.
Figure 16.
Impact of nitrogen content on the combustion temperature. 1—estimation; 2,3—experimental data; 2—combustion in the mixture of nitrogen and argon, and 3—combustion in nitrogen.


Table 1.
Chromium and ferrochromium powders.
| Grade | Component Mass Share, % | ||||||
|---|---|---|---|---|---|---|---|
| Cr | Si | Al | C | Fe | S | P | |
| PH 1S | base | 0.09 | 0.01 | 0.05 | 0.15 | 0.02 | 0.02 |
| PHA 97.5 | base | 0.35 | 0.62 | 0.04 | 0.49 | 0.02 | 0.02 |
| PFN | 75.6 | 0.56 | 0.32 | 0.03 | base | 0.03 | 0.03 |
Table 2.
Parameters of the combustion of chromium under natural and forced filtration.
| Combustion Parameters | Natural Filtration | Forced Filtration | ||||
|---|---|---|---|---|---|---|
| Particle Size, µm | Avg. ≈ 5 | 63–80 | 63–80 | 63–80 | 63–80 | 63–80 |
| Porosity, | ~60 | ~80 | ~80 | ~80 | ~80 | ~80 |
| Gas composition | N2 | N2 | N2 | N2 | N2 | N2 + 7% Ar |
| Pressure, MPa | 0.2 | 6.0 | 0.2 | <0.2 | <0.2 | <0.2 |
| Gas flow rate, cm3/s | - | - | - | 8 | 12 | 12 |
| Rate of combustion, cm/s | 0.04 | 0.034 | - | 0.17 | 0.24 | 0.13 |
| Nitrogen content, % N | 12.21 | 16.73 | - | 9.80 | 7.50 | 7.36 |
| Degree of transition | 0.58 | 0.79 | - | 0.46 | 0.36 | 0.35 |
| Adiabatic combustion temperature, °C | ~1320 | ~1630 | - | ~1030 | ~700 | ~690 |
| Maximum combustion temperature, °C | 1250 | 1380 | - | 1540 | ~1640 | 1440 |
| Phase composition of the combustion products | Cr2N, CrN | CrN, Cr2N | - | Cr2N | Cr2N | Cr2N |
© 2019 by the authors. Licensee MDPI, Basel, Switzerland. This article is an open access article distributed under the terms and conditions of the Creative Commons Attribution (CC BY) license (http://creativecommons.org/licenses/by/4.0/).
Share and Cite
MDPI and ACS Style
Ziatdinov, M.; Zhukov, A.; Promakhov, V.; Schulz, N. Combustion Synthesis of Chromium Nitrides. Metals 2019, 9, 98. https://doi.org/10.3390/met9010098
AMA Style
Ziatdinov M, Zhukov A, Promakhov V, Schulz N. Combustion Synthesis of Chromium Nitrides. Metals. 2019; 9(1):98. https://doi.org/10.3390/met9010098
Chicago/Turabian StyleZiatdinov, Mansur, Alexander Zhukov, Vladimir Promakhov, and Nikita Schulz. 2019. "Combustion Synthesis of Chromium Nitrides" Metals 9, no. 1: 98. https://doi.org/10.3390/met9010098
Note that from the first issue of 2016, this journal uses article numbers instead of page numbers. See further details here.