Hydrometallurgical Process for Zinc Recovery from C.Z.O. Generated by the Steelmaking Industry with Ammonia–Ammonium Chloride Solution

Abstract
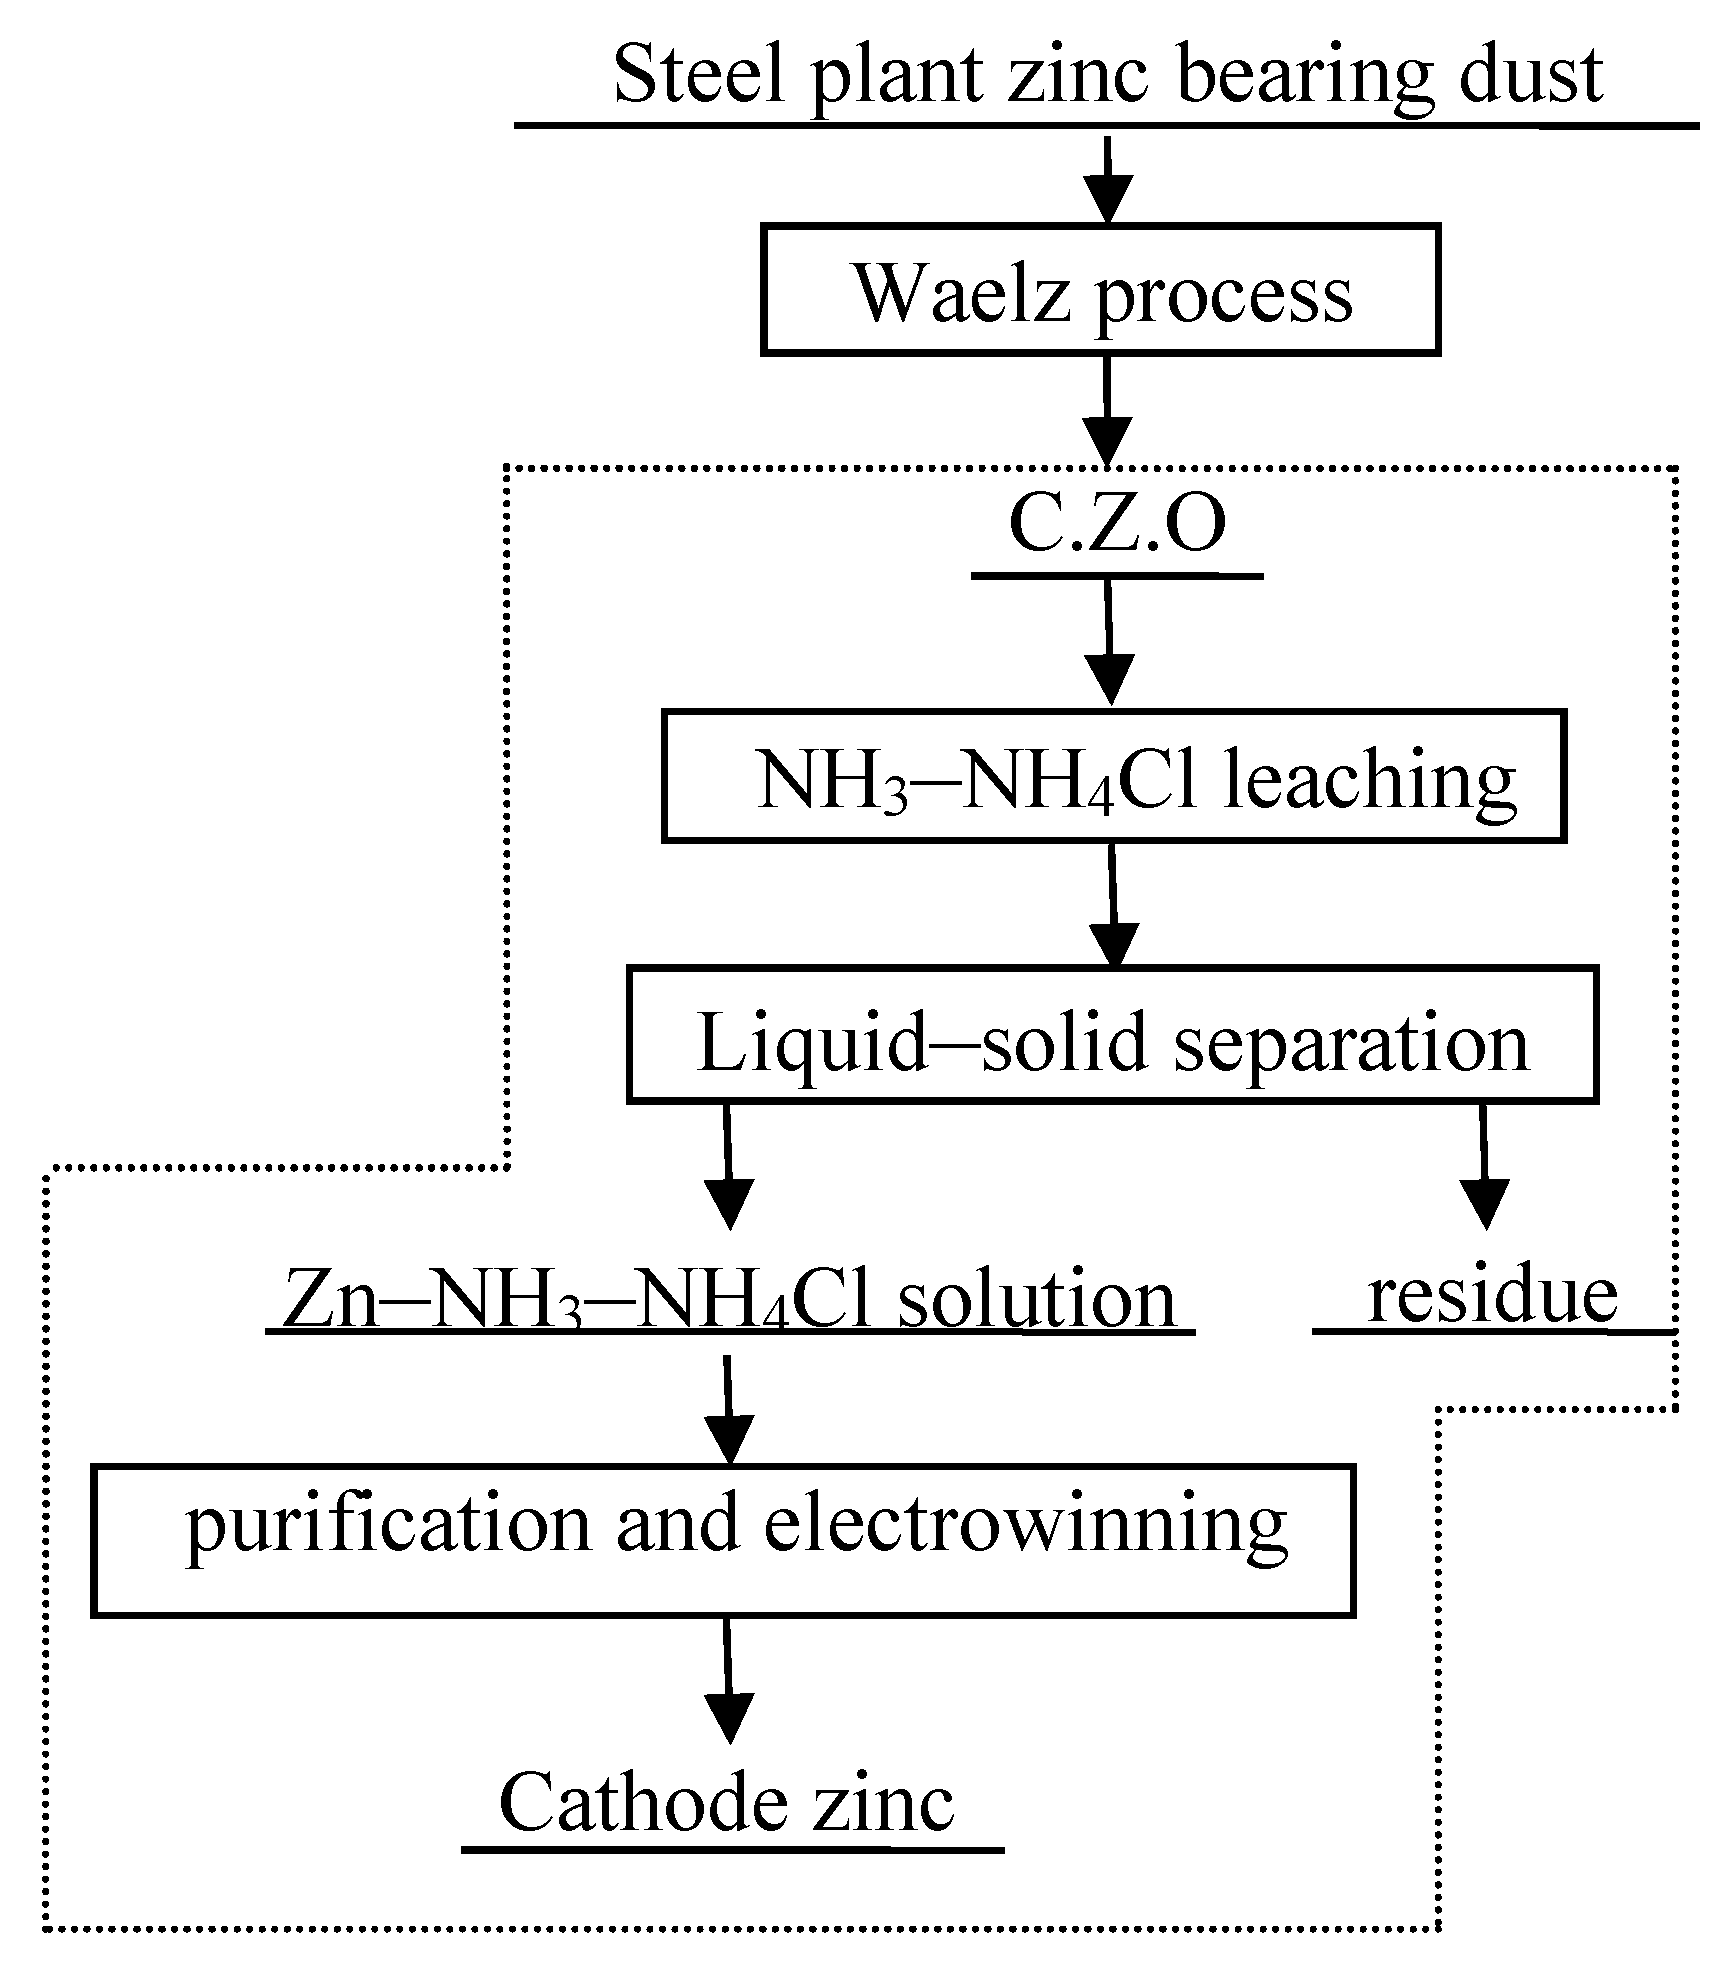
:1. Introduction
2. Experimental
2.1. Material
2.2. Experimental Setup and Procedure
2.3. Analyses and Detection
3. Results and Discussion
3.1. Characterizations of C.Z.O.
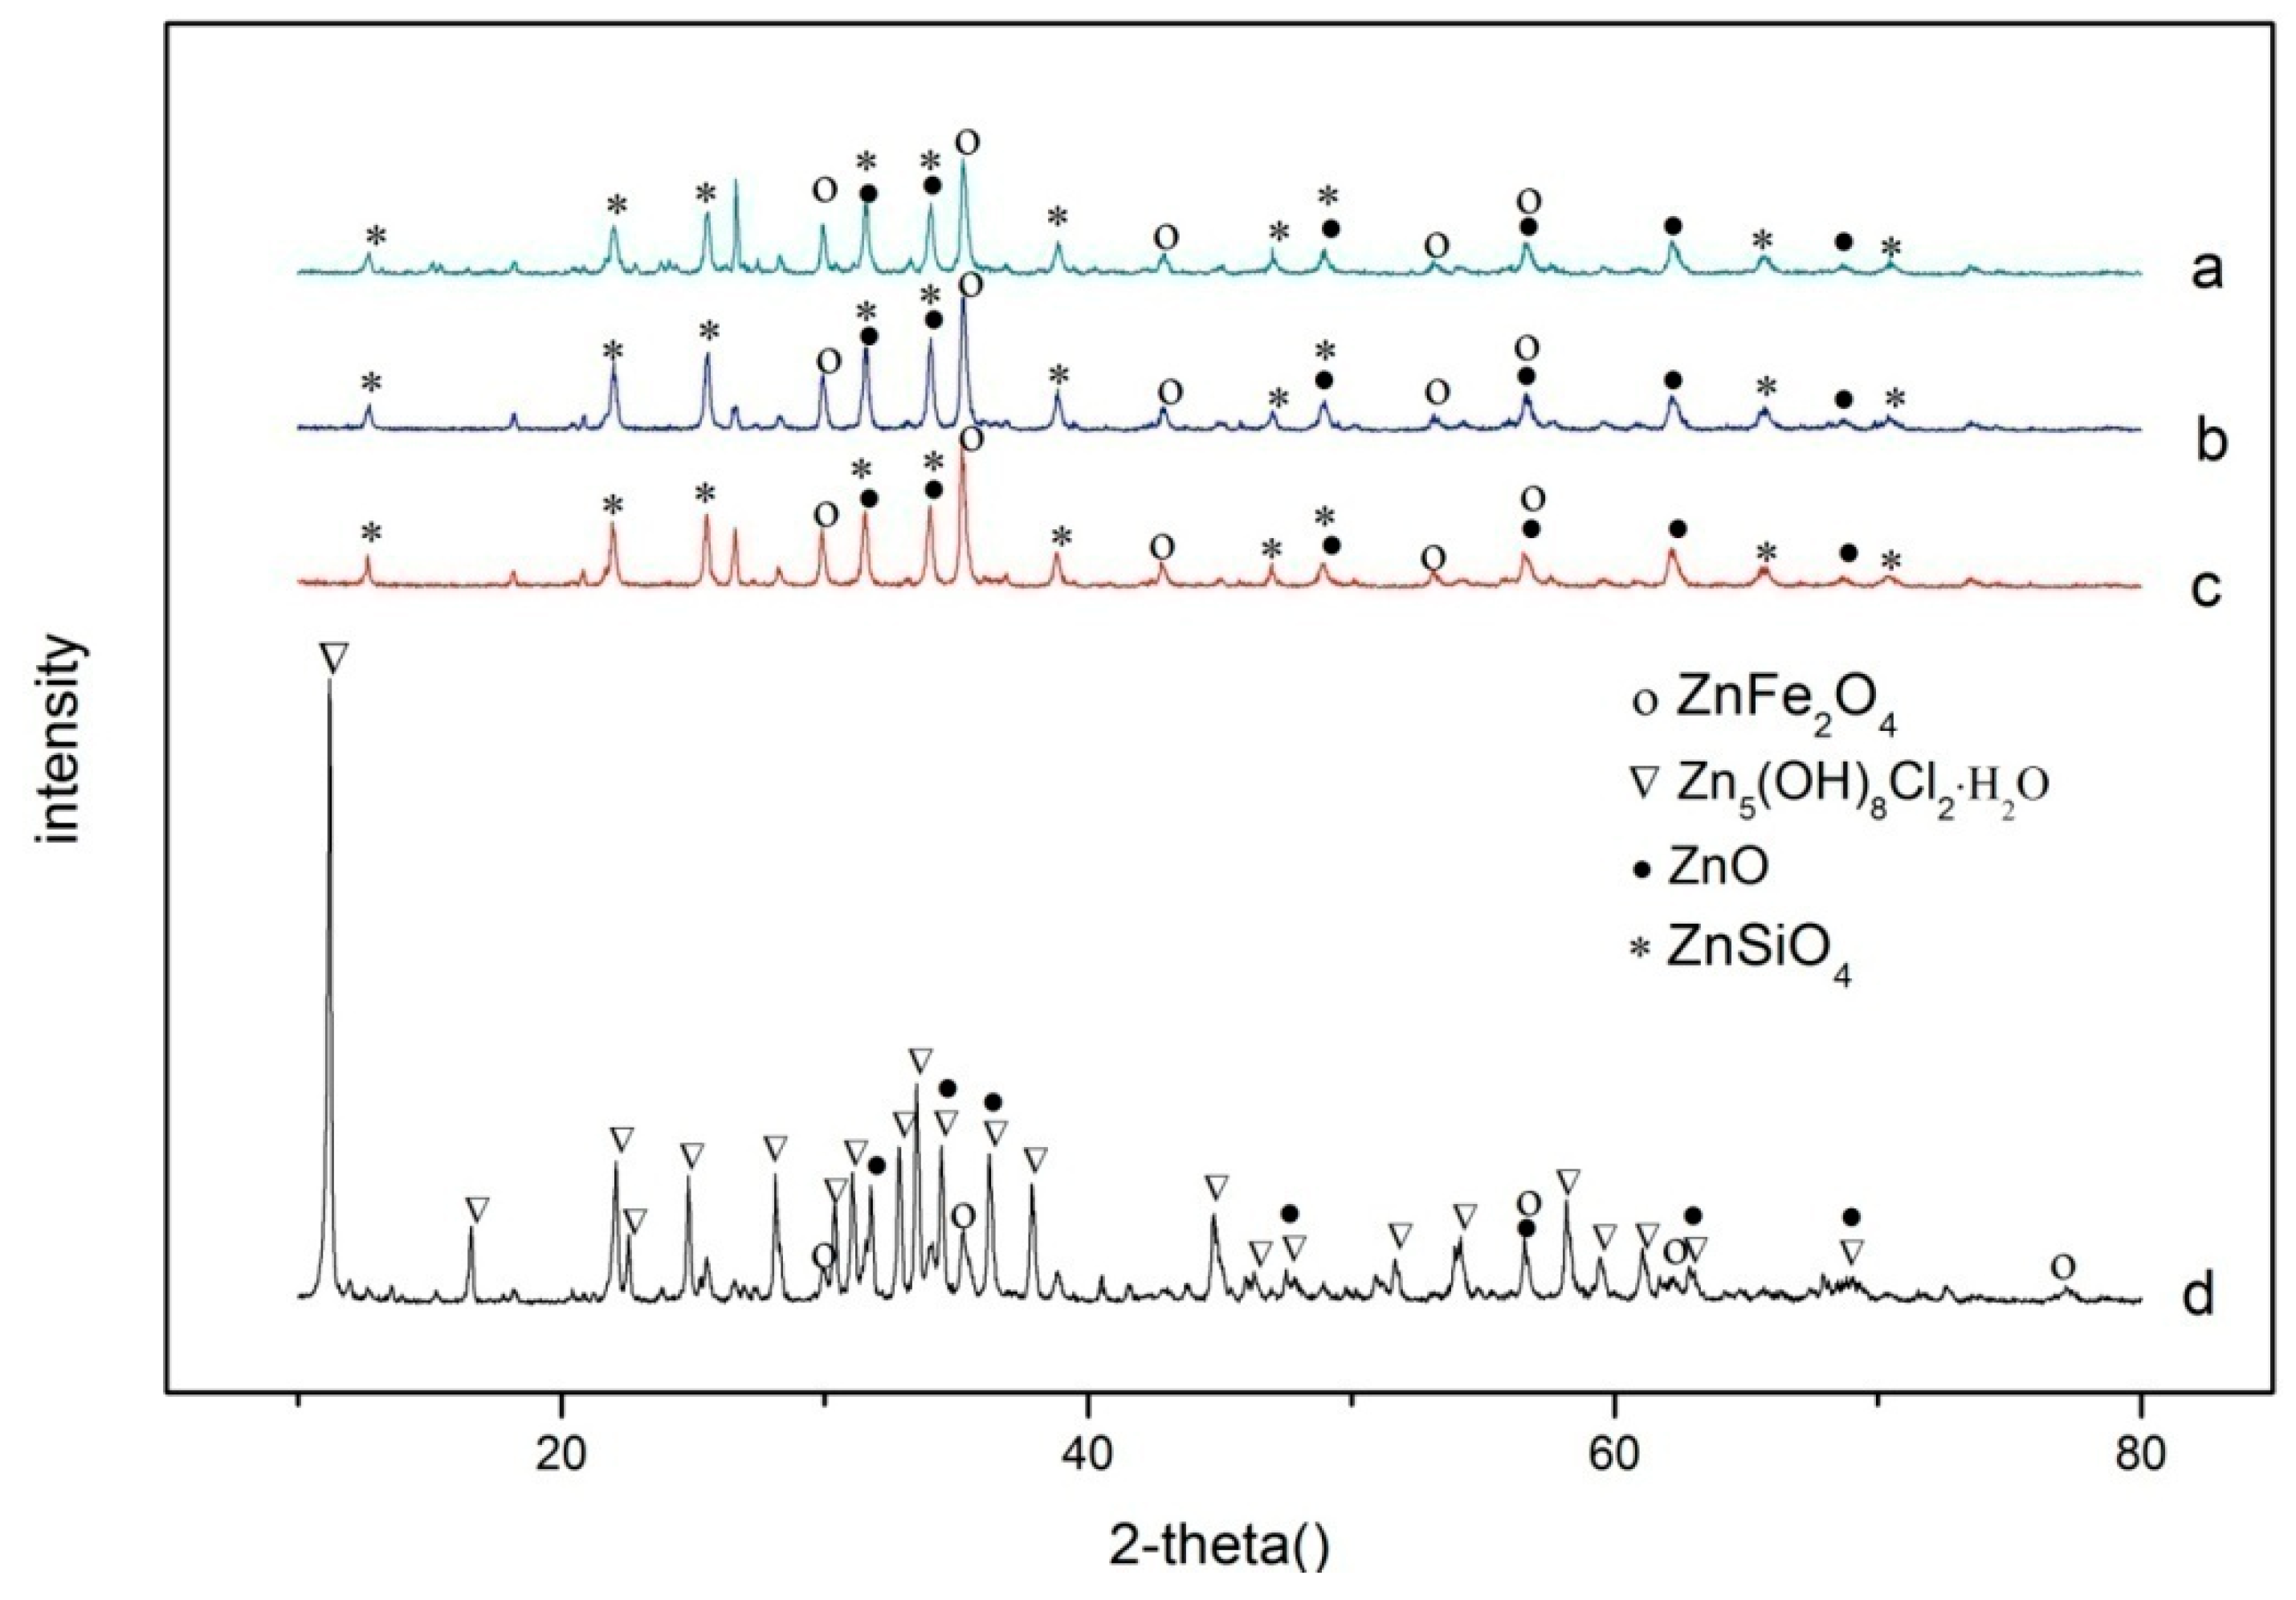
3.2. XRD Analyses
3.3. Mineralogical Composition Analyses
3.4. SEM Analyses
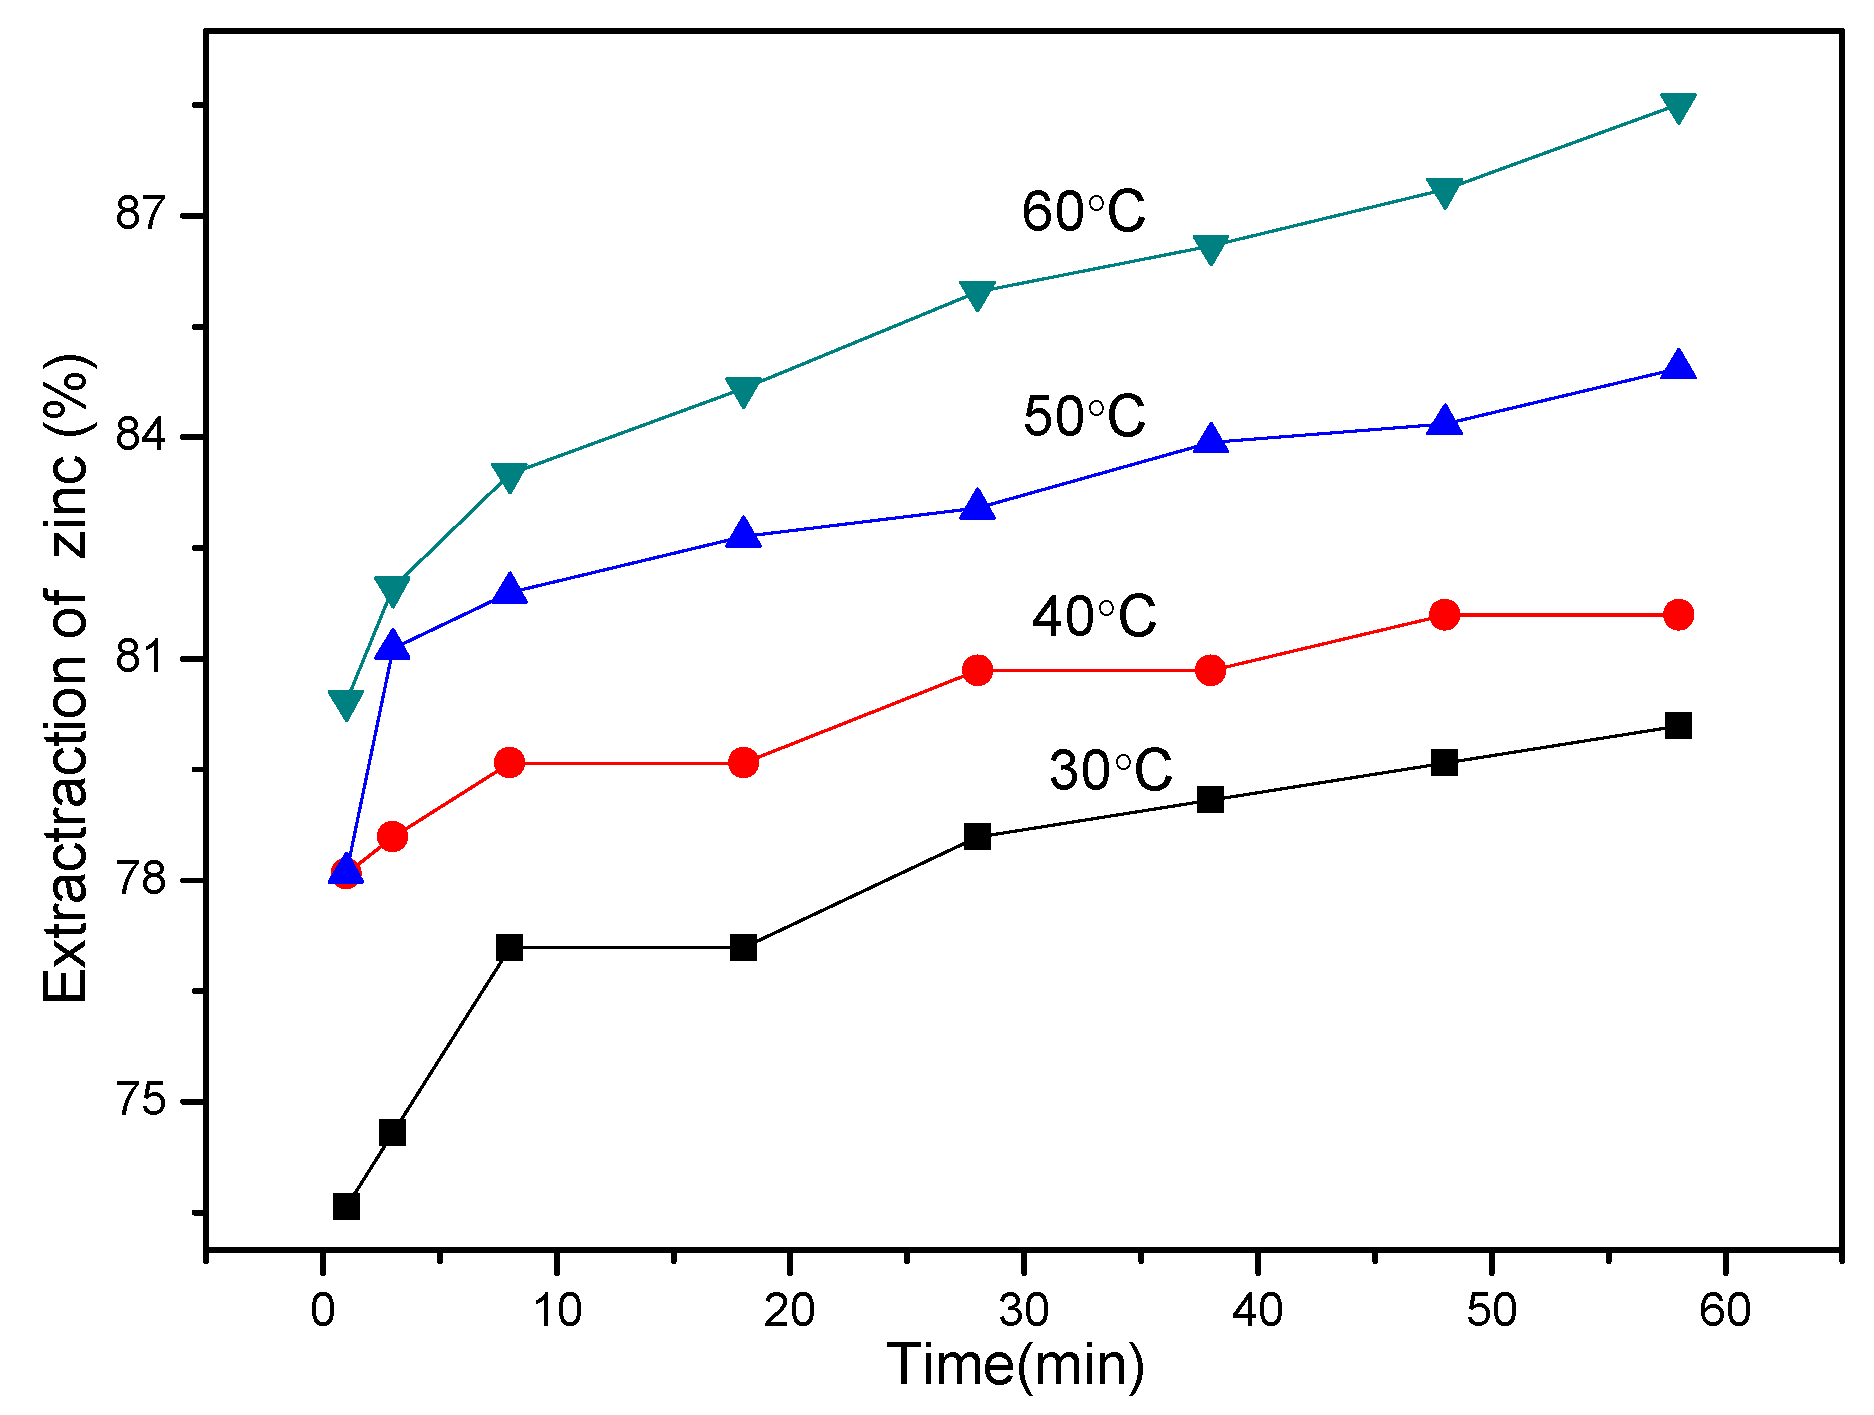
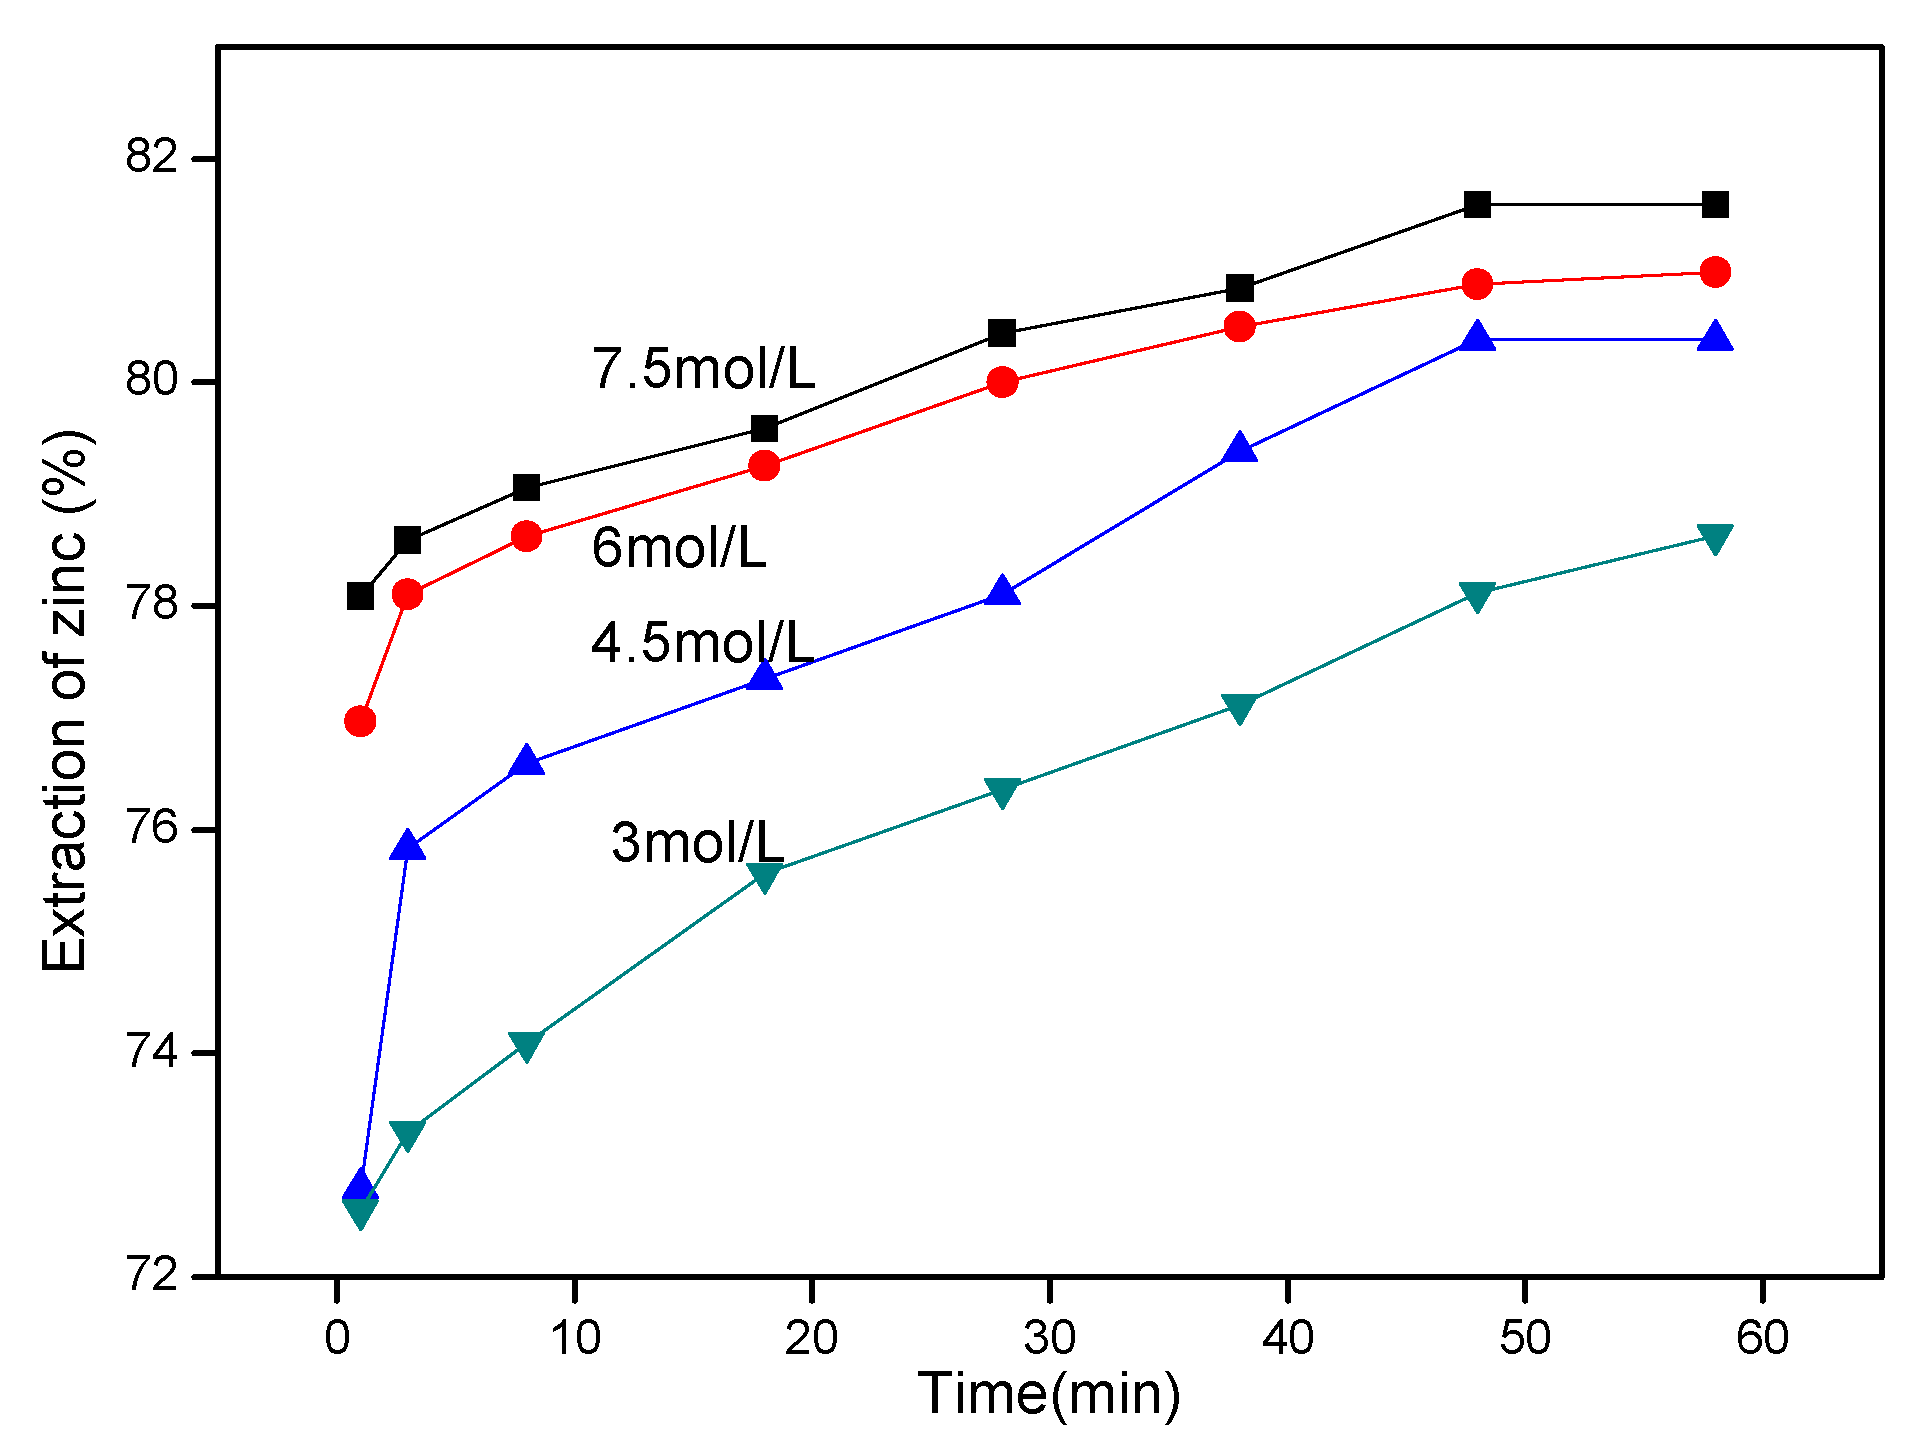
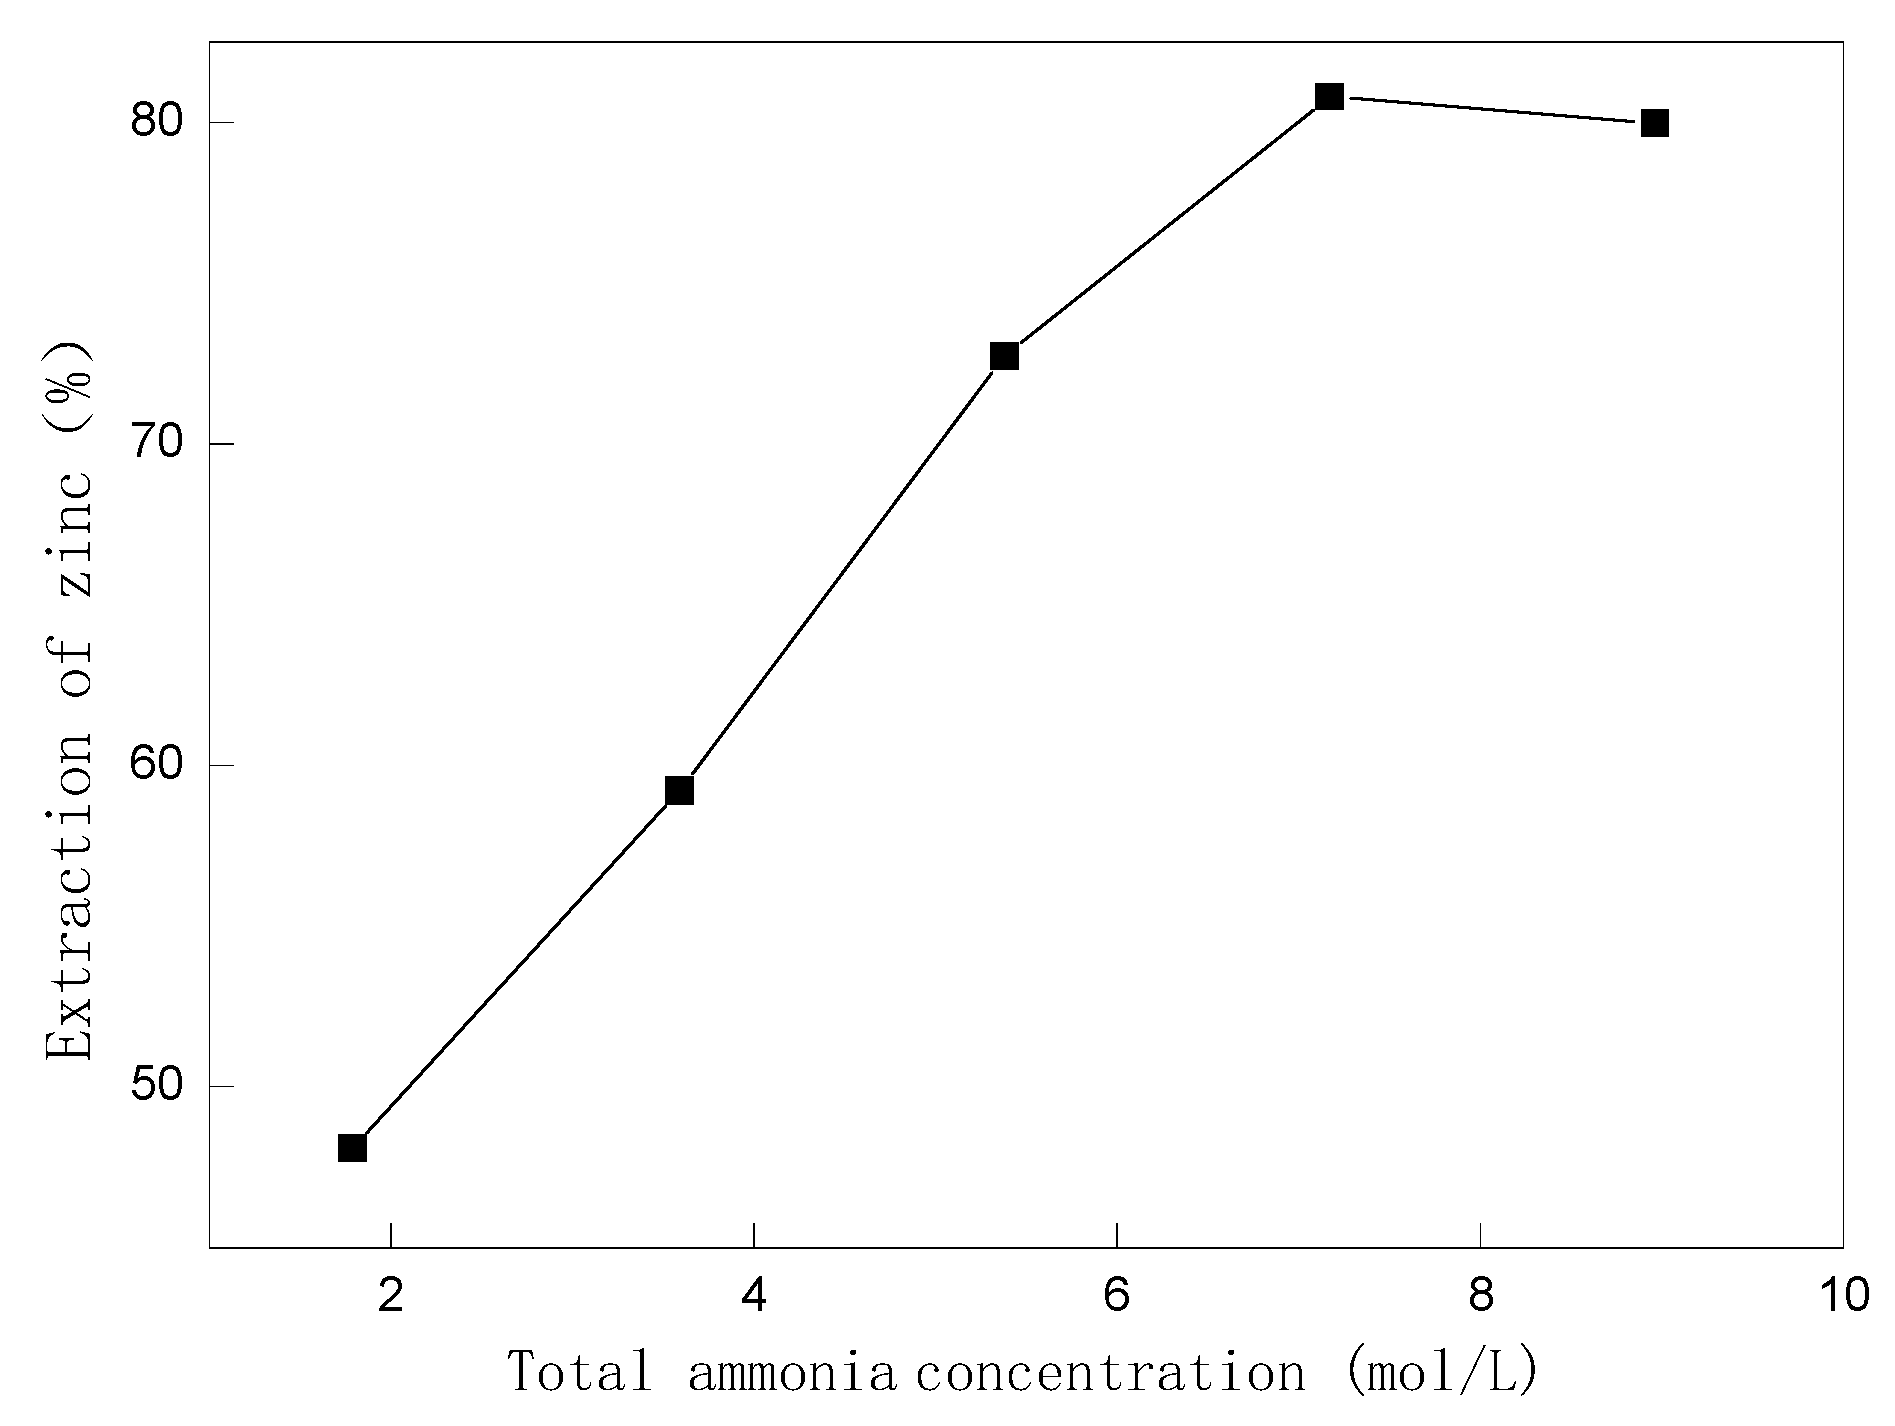
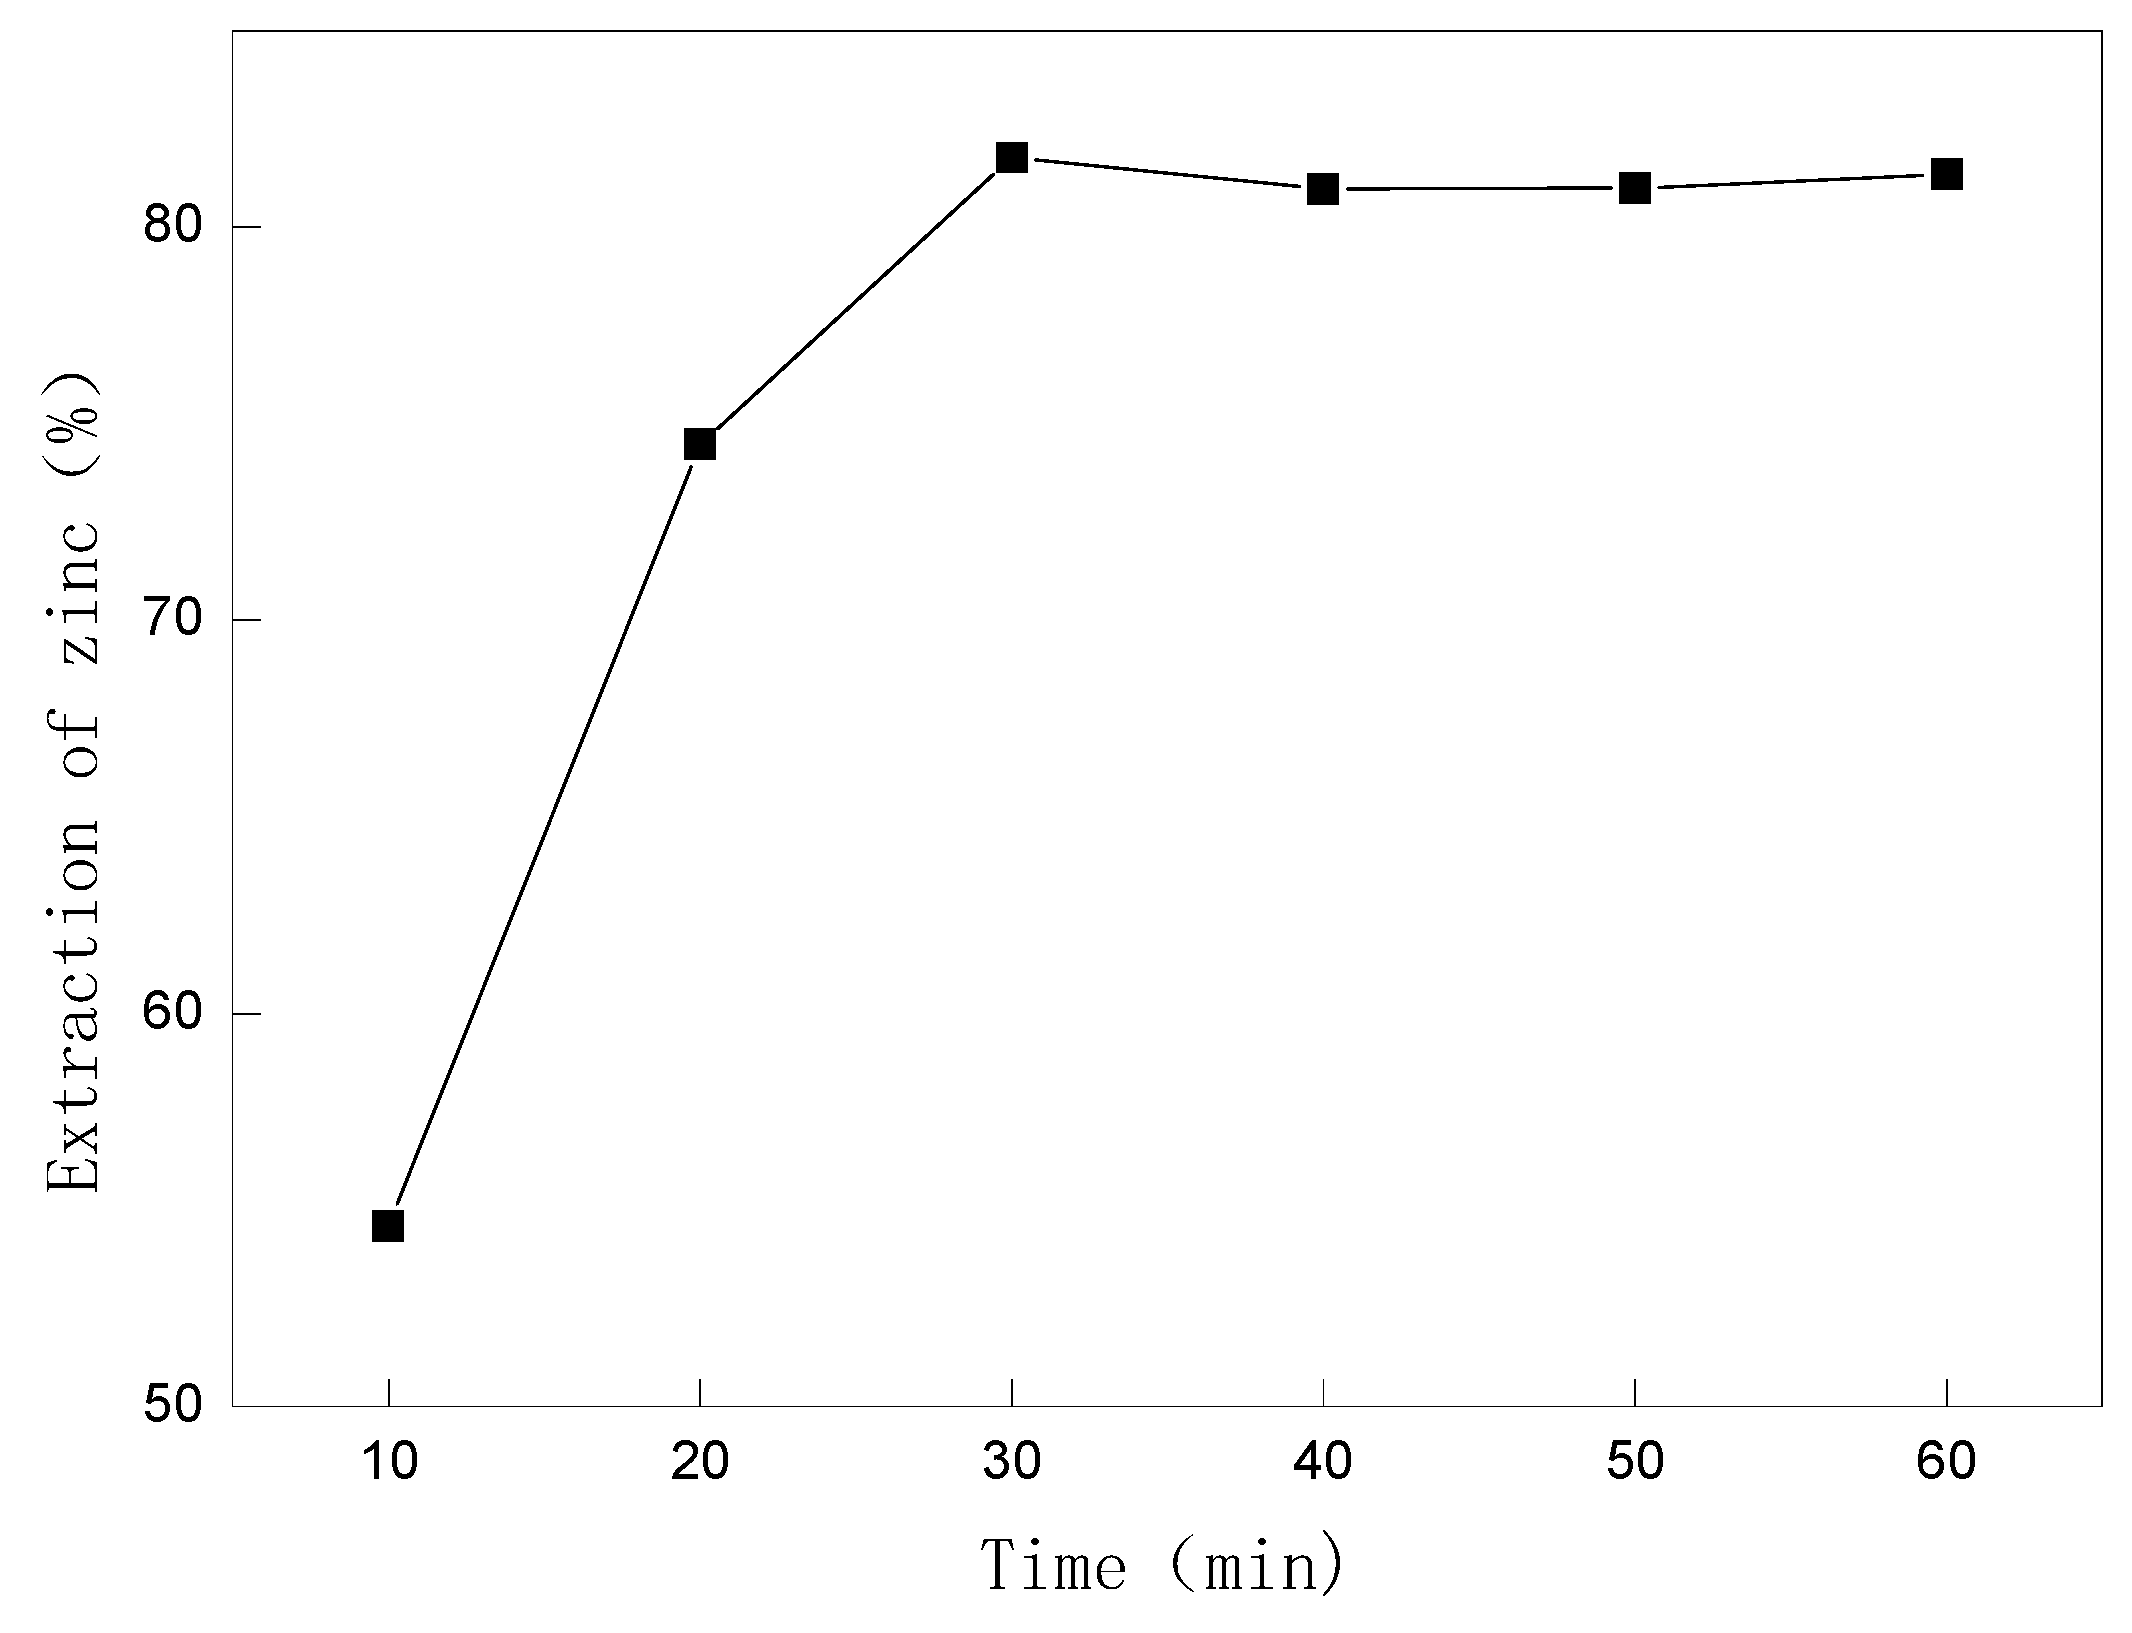
3.5. Kinetics
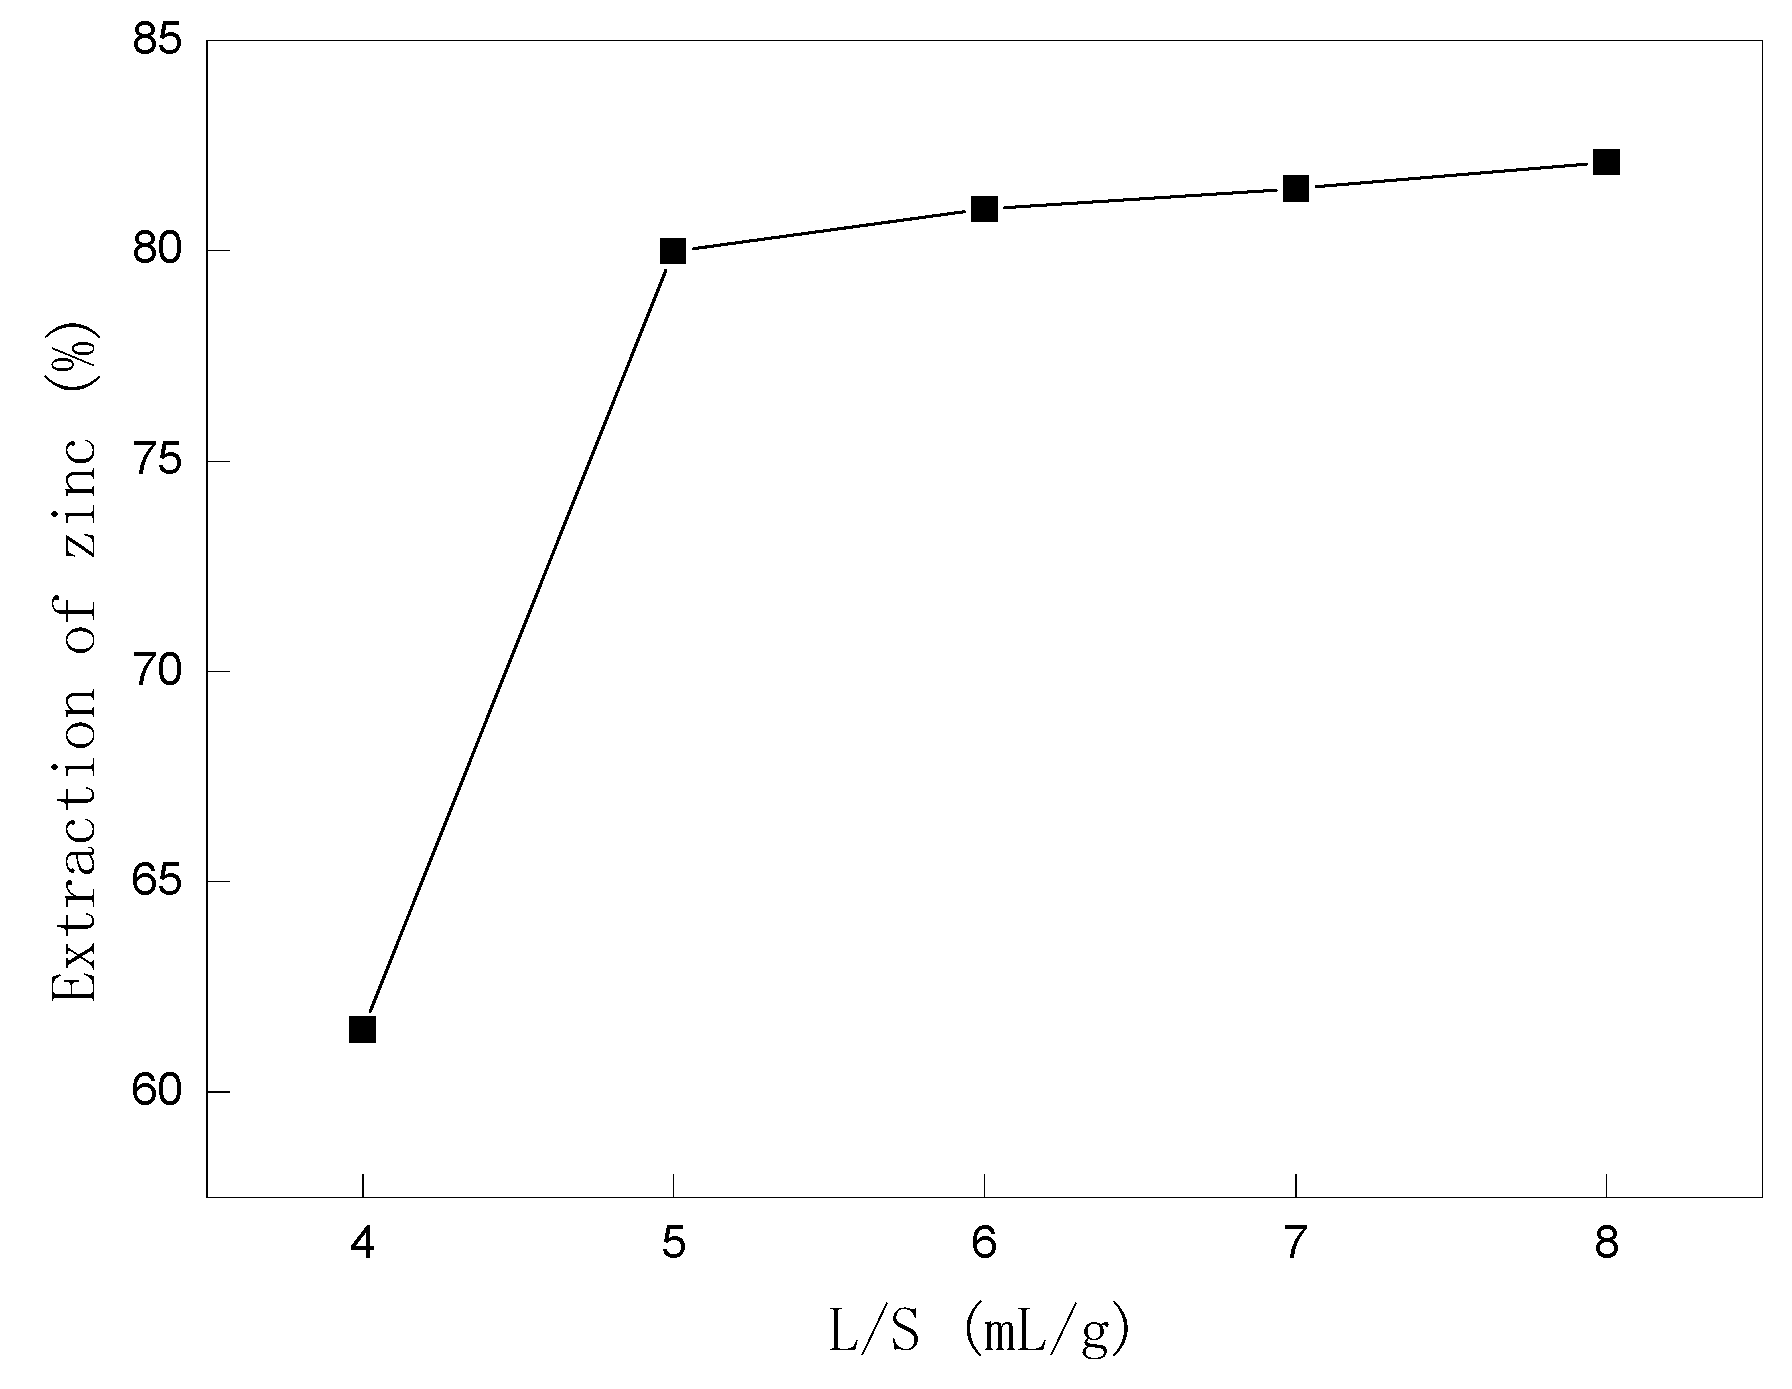
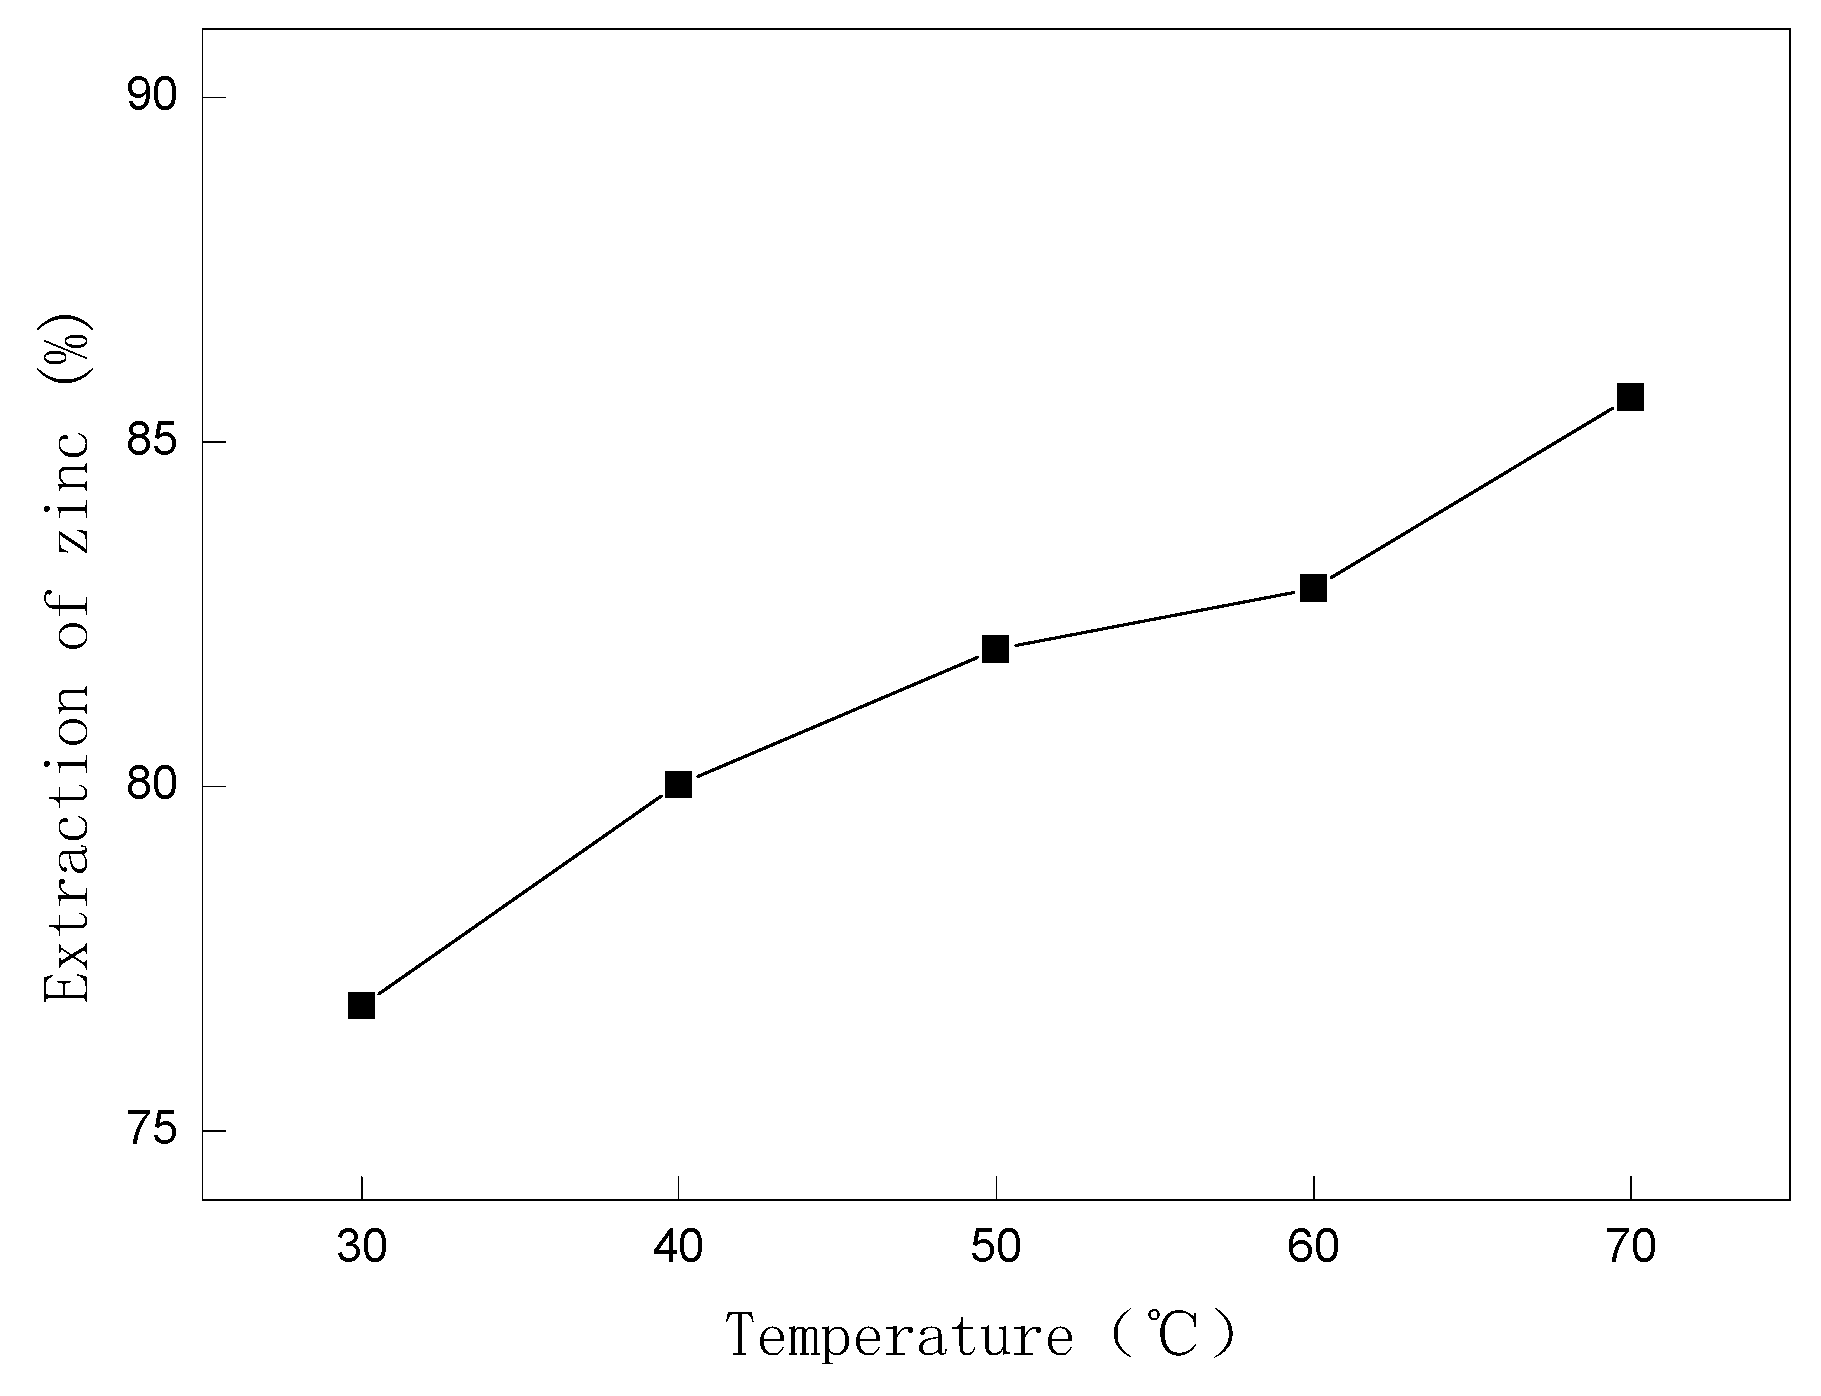
3.6. Batch Experiment
3.7. Purification of Lixivium
3.7.1. Removal of Sb and As
3.7.2. Removal of Cu, Cd, and Pb
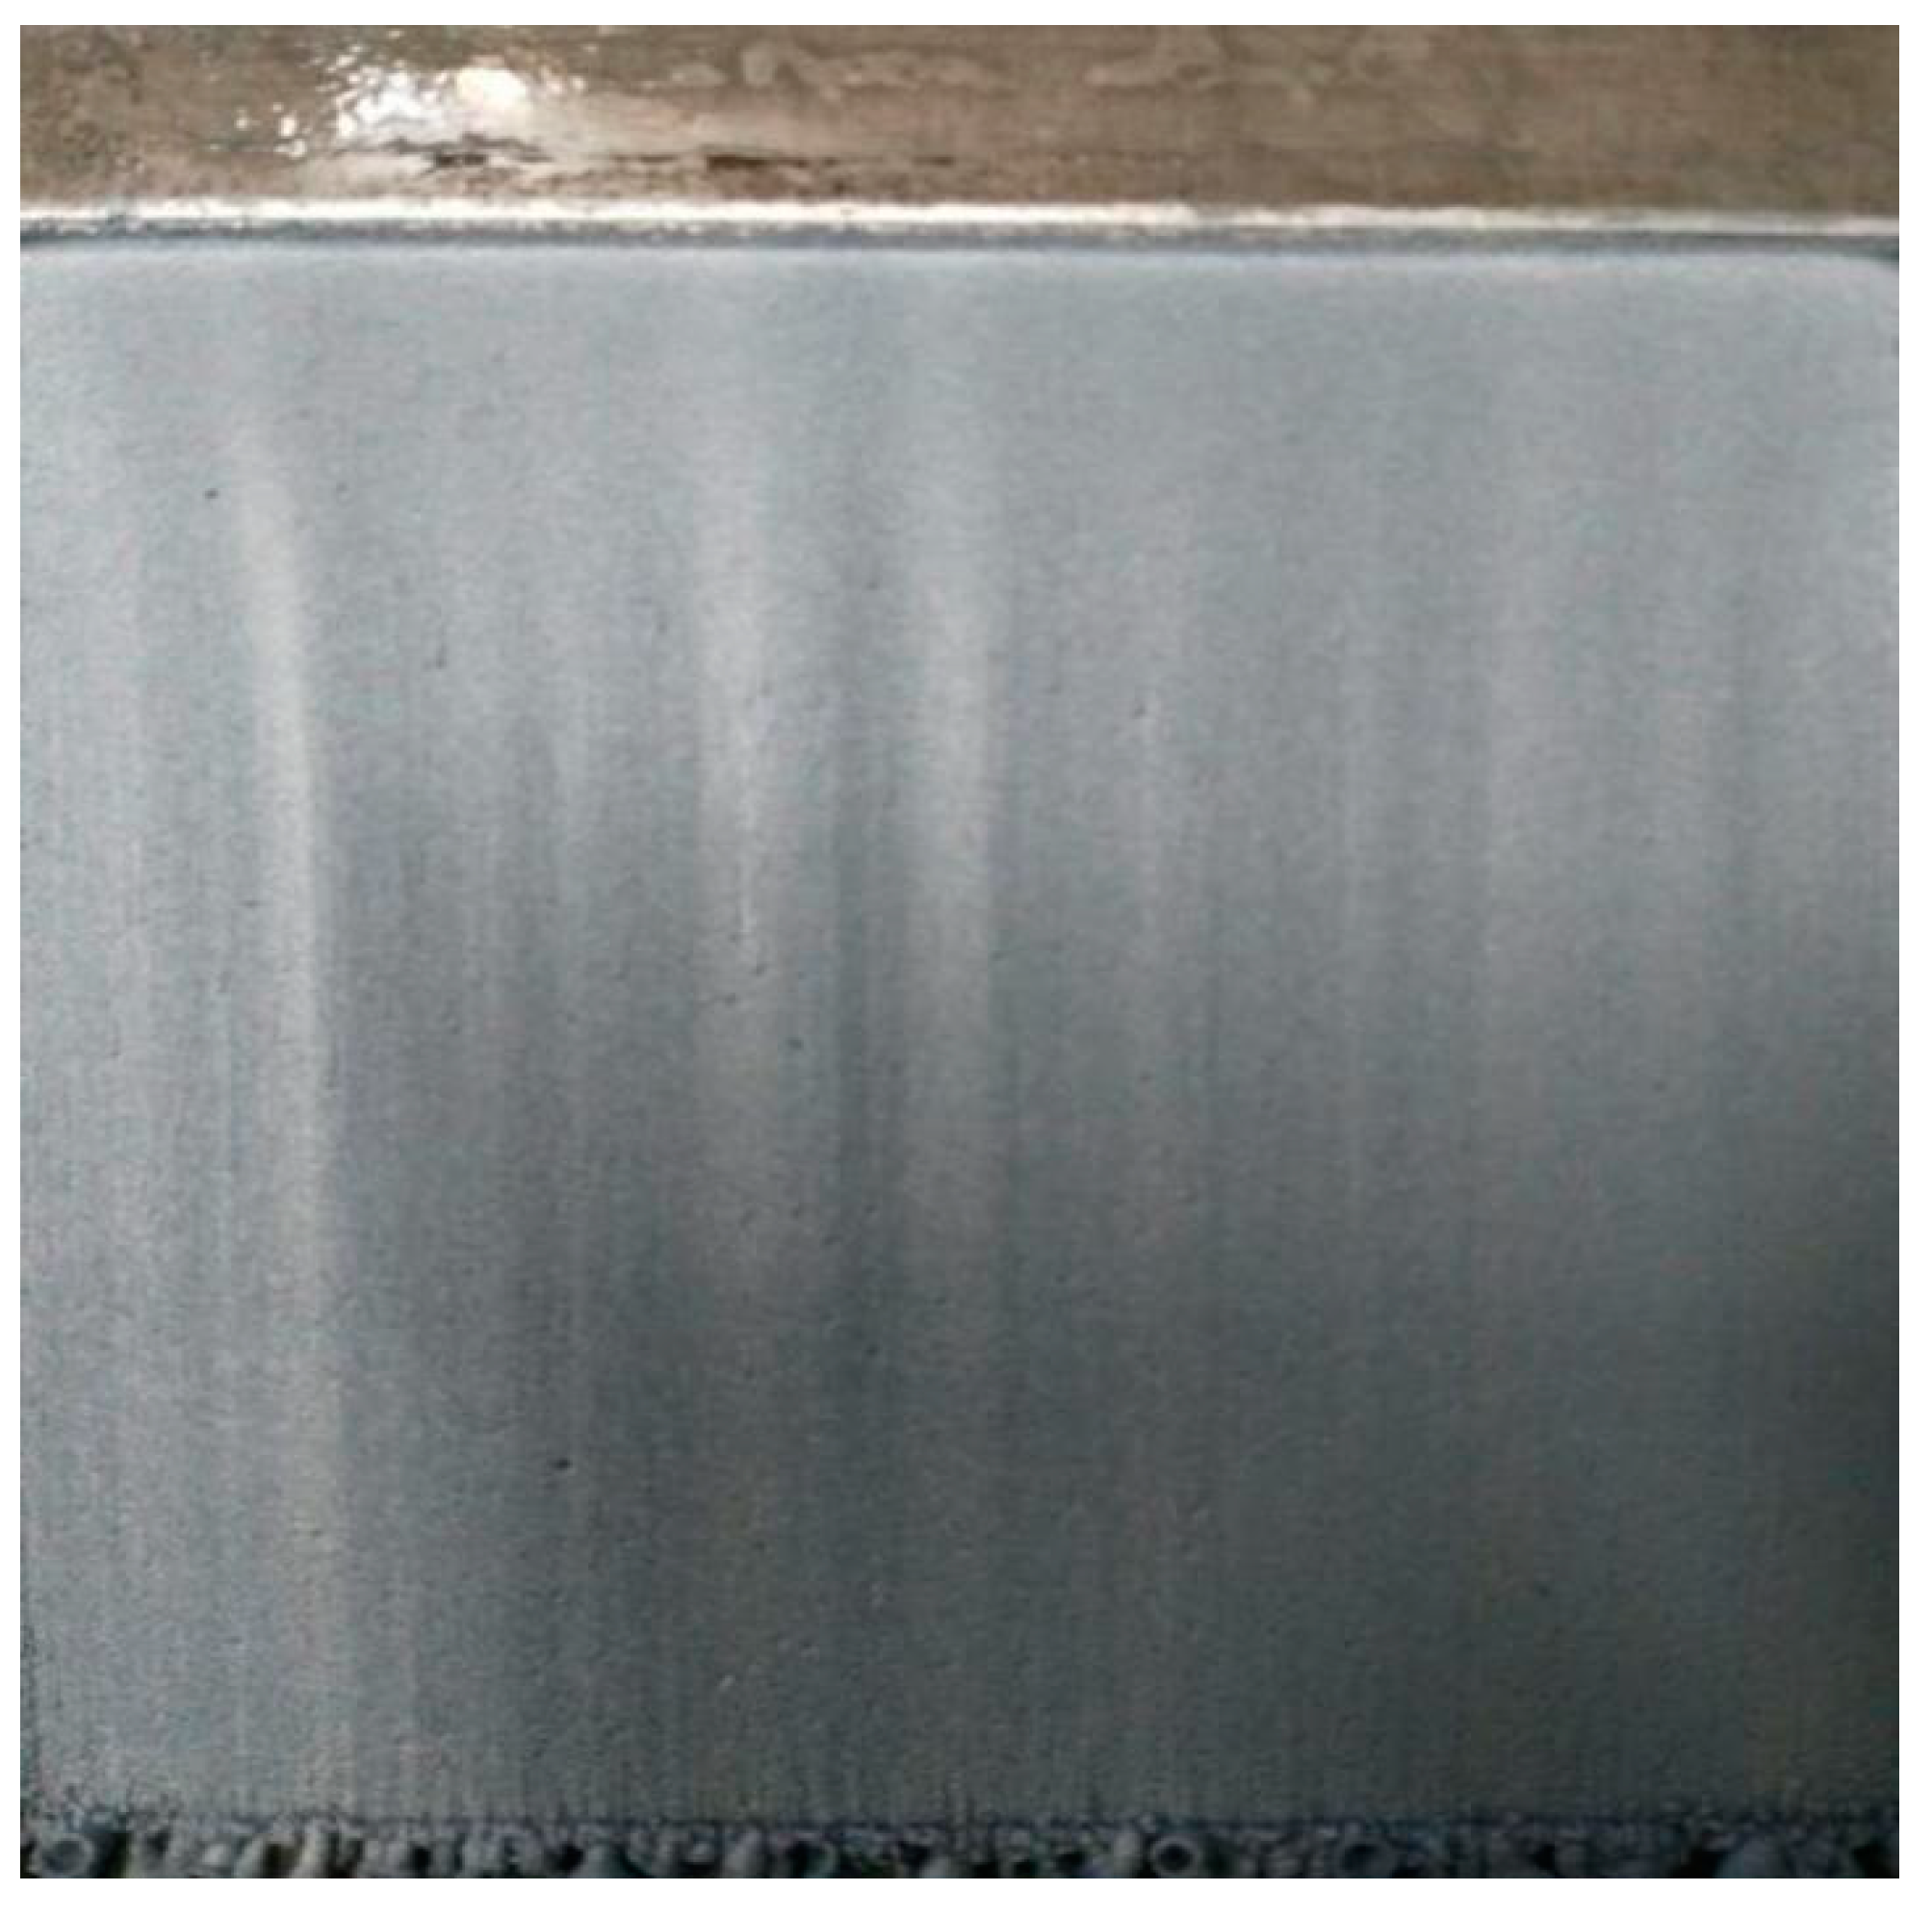
3.8. Electrowinning
4. Conclusions
Author Contributions
Funding
Conflicts of Interest
References
- Worldsteel Association, Steel Statistical Yearbook 2012. Available online: http://www.worldsteel.org/statistics/statistics-archive/yearbook-archive.html (accessed on 10 February 2013).
- Olper, M.; Maccagni, M. From CZO to zinc cathode without any pretreatment. The Ezinex Process. Lead and Zinc. In Proceedings of the International Symposium on Lead and Zinc Processing, Jochannesburg, South Africa, 25–29 February 2008; pp. 85–97. [Google Scholar]
- Ruiz, O.; Clemente, C.; Alonso, M.; Alguacil, F.J. Recycling of an electric arc furnace flue dust to obtain high grade ZnO. J. Hazard. Mater. 2007, 141, 33–36. [Google Scholar] [CrossRef] [PubMed]
- Shawabken, R.A. Hydrometallurgical extraction of zinc from Jordanian electric arc furnace dust. Hydrometallurgy 2010, 104, 61–65. [Google Scholar] [CrossRef]
- Dutra, A.J.B.; Paiva, P.R.P.; Tavares, L.M. Alkaline leaching of zinc from electric arc furnace steel dust. Miner. Eng. 2006, 19, 478–485. [Google Scholar] [CrossRef]
- Strohmeier, G.; Bonestell, J.E. Steel Works Residues and the Walez Kiln Treatment of Electric Arc Furnace Dust. Iron Steel Eng. 1996, 73, 87–90. [Google Scholar]
- Ruetten, J. Application of the waelz technology on resource recycling of steel mill dust. Baosteel Tech. Res. 2010, S1, 137–140. [Google Scholar]
- Puta, W.D. The Recovery of Zinc from EAF Dust by the Waelz Process. Steel Times 1989, 217, 194–195. [Google Scholar]
- Palumbo, F.J.; Marsh, R.L.; Gabler, R.C. Recovery of metal values from copper converter flue gas. USBM Rep. Investig. 1985, 8995, 10. [Google Scholar]
- Havlik, T.; Vidore, E.S.B.; Bernardes, A.M. Hydrometallurgical processing of carbon steel EAF dust. J. Hazard. Mater. 2006, 135, 311–318. [Google Scholar] [CrossRef] [PubMed]
- Šárka, L.; Riplová, J.; Vallová, S. Atmospheric leaching of steel-making wastes and the precipitation of goethite from the ferric sulphate solution. Hydrometallurgy 2007, 87, 157–162. [Google Scholar]
- Wu, X.; Liu, Z.; Liu, X. Chloride ion removal from zinc sulfate aqueous solution by electrochemical method. Hydrometallurgy 2013, 134, 62–65. [Google Scholar] [CrossRef]
- Antunano, N.; Cambra, J.F.; Arias, P.L. Fluoride removal from double leached waelz oxide leach solutions as alternative feeds to Zinc Calcine leaching liquors in the electrolytic zinc production process. Hydrometallurgy 2016, 161, 65–70. [Google Scholar] [CrossRef]
- Harvey, T.G. The hydrometallurgy extraction of zinc by ammonium carbonate: A review of the Schnabel process. Miner. Process. Extr. Metal. Rev. 2006, 27, 231–279. [Google Scholar] [CrossRef]
- Yang, S.H. Leaching of zinc oxide ore with ammonium chloride solution. Hydrometal. China 2006, 25, 179–182. [Google Scholar]
- Nogueira, C.A.; Margarido, F. Selective process of zinc extraction from spent Zn–MnO2 batteries by ammonium chloride leaching. Hydrometallurgy 2015, 157, 13–21. [Google Scholar] [CrossRef]
- Liu, Z.; Li, Q. Dissolution behavior of willemite in the (NH4)2SO4–NH3–H2O system. Hydrometallurgy 2012, 125, 50–54. [Google Scholar] [CrossRef]
- Wang, R.X.; Tang, M.T.; Liu, W. NH3–NH4Cl–H2O system for production of electrolytic zinc. Chin. J. Process Eng. 2008, 8, 219–222. [Google Scholar]
- Yang, S.H.; Tang, M.T. Thermodynamics of Zn(II)–NH3–NH4Cl–H2O system. Trans. Nonferr. Metals Soc. China 2000, 10, 830–833. [Google Scholar]
- Yang, S.H. Theory and Application Studies on Preparing High Purity Zinc in the System of Zn(II)–NH3–NH4Cl–H2O; Central South University: Changsha, China, 2003. (In Chinese) [Google Scholar]


| Zn | F | Mg | Al | Si | P | S | Cl | K | Ca | Ti |
|---|---|---|---|---|---|---|---|---|---|---|
| 50.25 | 0.18 | 0.04 | 0.11 | 2.31 | 0.03 | 0.33 | 9.26 | 0.90 | 0.43 | 0.07 |
| Pb | Sn | Cd | Br | O | Cu | Ni | Fe | Mn | Cr | |
| 1.32 | 0.07 | 3.71 | 0.14 | 18.9 | 0.05 | 0.02 | 6.18 | 0.37 | 0.04 |
| Phase | Water-Soluble Zinc I | Zinc Oxide II | Franklinite III | Zinc Sulfide | T Zinc |
|---|---|---|---|---|---|
| ➀ Zinc content % | 5.6 | 39 | 4.5 | 0.12 | 49.22 |
| ➁ Zinc content % | 0.11 | 12.85 | 7 | 0.23 | 20.19 |
| Extraction percentage % | 99 | 84 | 22 | 4 | 80 |
| Zn ▽ | Cu | Cd | Pb | Sb | As |
|---|---|---|---|---|---|
| 69.2 | 34.3 | 53.7 | 637 | 5.6 | 0.17 |
| Zn (g/L) | Cu | Cd | Pb | Sb | As |
|---|---|---|---|---|---|
| 69.4 | 0.03 | 0.09 | 0.82 | 0.22 | 0.12 |
| 69.2 | 0.02 | 0.08 | 0.87 | 0.21 | 0.12 |
| 69.6 | 0.03 | 0.04 | 0.76 | 0.19 | 0.1 |
| Zn ▽ | Cu | Cd | Pb | Sb | As | Fe |
|---|---|---|---|---|---|---|
| 99.9930 | 0.1 | - | 6.0 | 0.5 | - | 0.5 |
| 99.9907 | 0.2 | - | 8.0 | 0.4 | - | 0.7 |
| 99.9916 | 0.4 | - | 7.0 | 0.6 | - | 0.4 |
© 2019 by the authors. Licensee MDPI, Basel, Switzerland. This article is an open access article distributed under the terms and conditions of the Creative Commons Attribution (CC BY) license (http://creativecommons.org/licenses/by/4.0/).
Share and Cite
Yang, S.; Zhao, D.; Jie, Y.; Tang, C.; He, J.; Chen, Y. Hydrometallurgical Process for Zinc Recovery from C.Z.O. Generated by the Steelmaking Industry with Ammonia–Ammonium Chloride Solution. Metals 2019, 9, 83. https://doi.org/10.3390/met9010083
Yang S, Zhao D, Jie Y, Tang C, He J, Chen Y. Hydrometallurgical Process for Zinc Recovery from C.Z.O. Generated by the Steelmaking Industry with Ammonia–Ammonium Chloride Solution. Metals. 2019; 9(1):83. https://doi.org/10.3390/met9010083
Chicago/Turabian StyleYang, Shenghai, Duoqiang Zhao, Yafei Jie, Chaobo Tang, Jing He, and Yongming Chen. 2019. "Hydrometallurgical Process for Zinc Recovery from C.Z.O. Generated by the Steelmaking Industry with Ammonia–Ammonium Chloride Solution" Metals 9, no. 1: 83. https://doi.org/10.3390/met9010083