Influences of Alloying Elements on Continuous Cooling Phase Transformation and Microstructures of Extremely Fine Pearlite
by
Lulu Feng
1,2, 
Feng Hu
1,*,
Wen Zhou
1,
Rui Ke
1,
Guohong Zhang
1,
Kaiming Wu
1,* and
Wenwei Qiao
3 1
The State Key Laboratory for Refractories and Metallurgy, Hubei Collaborative Innovation Center on Advanced Steels, International Research Institute for Steel Technology, Wuhan University of Science and Technology, Wuhan 430081, China
2
School of Mechanical Engineering, Jing Chu University of Technology, Jingmen 448000, China
3
Jiangsu Huaneng Cable Co., Ltd., Gaoyou 225613, China
*
Authors to whom correspondence should be addressed.
Metals 2019, 9(1), 70; https://doi.org/10.3390/met9010070
Submission received: 27 December 2018
/
Revised: 8 January 2019
/
Accepted: 9 January 2019
/
Published: 11 January 2019
Abstract
:In the present research, the cooling phase transformation characteristics and microstructures of a Co- and Al-containing high-carbon steel were investigated under slow cooling rates (0.02–2.0 °C/s). In addition, by means of a Thermecmastor thermal simulator, the phase transformation temperatures were measured, and the corresponding continuous cooling transformation (CCT) curves were plotted. It was found that an extremely fine, fully pearlitic structure with an interlamellar spacing of 45 nm, and a hardness of 425 HV1 (Vickers hardness under 1 kg load) were obtained at a cooling rate of 0.1 °C/s. The addition of Co and Al accelerated the pearlitic reaction and reduced the interlamellar spacing by increasing the free energy of phase transformation, thus a fully pearlitic structure was obtained at slow cooling rates.
1. Introduction
Ultra-high strength, super bainite steel was first developed by Bhadeshia et al. from The University of Cambridge [1,2,3,4]. Low-temperature bainites obtained from the austenitization of super bainite steel at low temperatures (125–300 °C), possess super thin (thickness of 20–40 nm) bainite-ferrite strips and carbon-rich retained austenites. The values of tensile strength, hardness, and fracture toughness of super bainite steel are generally found as 1.7–2.2 GPa, 600 HV, and 30–40 MPa·m1/2, respectively [5]. However, a very long isothermal transition time (sometimes two weeks) is generally required during low-temperature bainite transformations [6]. Therefore, in order to accelerate the transformation of low-temperature bainite isothermal transitions, Co and Al are usually added to improve the driving force of the transformation [7], because Co and Al can increase the diffusion rate of carbon in austenite, increase the temperature of transformation, and shorten the time of transformation. Adding Co and Al to steel accelerates the bainitic transformation, shortens the austenite-to-bainite transformation time, and refines grain of bainite [8].
Jaramillo et al. [9] were the first to completely austenitized a super bainitic steel (0.78 wt% C) under 30 T super magnetic field and then cooled to room temperature at a cooling rate of 1 °C/s, to obtain an ultra-fine pearlite structure (lamella spacing of 50–100 nm). However, the synthesis of bainitic steels under such high magnetic field (30 T) is very expensive and difficult in practice. Shi [10] obtained an ultra-fine pearlitic structure (lamella spacing of 80–150 nm) during the transformation of ultra-high carbon steel (1.5–2 wt% C) in the pearlite phase region. However, proeutectoid cementite easily precipitated from austenite, and consequently, reticular carbide and graphite were formed. Houin et al. [11] produced a full pearlite structure (lamella spacing of ~150 nm) from medium carbon steel (0.4 wt% C), under super-fast cooling conditions (70–140 °C/s); however, it is impossible to achieve such a high cooling rate in practice.
Ultra-fine pearlitic structures can also be obtained after plastic deformation, including thermal and non-thermal deformation treatments [12]. Sun et al. [13] found that the proportion of fine pearlite lamella increased with the increasing rolling reductions; however, the manufacturing process was complex and the production efficiency was low.
The role of Co and Al elements in bainitic steels were investigated by Garcia-Mateo and Caballero et al. [4]. In the present work, we studied their role in pearlitic steels. Co and Al were added to a high-carbon steel in order to increase the driving force of phase transformation, and to obtain an ultra-fine fully pearlitic structure at slow cooling rates without any deformation treatment. The extremely fine pearlite steel, not only has high strength (tensile strength up to 2000 MPa), but also has good plasticity and toughness (torsion performance up to 24 times) [14]. It therefore has more and more wide potential application in bar products, cable steels, etc., especially for the long-span suspension and cable-stayed bridges, which are usually manufactured under slow cooling.
2. Materials and Methods
The alloy was prepared in a vacuum furnace (50 kg), all alloying material (including Co and Al) was added to the smelting process, and the alloy was cast into ingots in the laboratory. The chemical composition of the experimental steel is presented in Table 1, and Alloy 1 contained 3.87 wt% Co and 1.37 wt% Al. The sample was first homogenized for two days at 1200 °C in a vacuum annealing furnace (Hengjin, Shenyang, China), and then cooled to room temperature (at cooling rates of 0.02 °C/s, 0.05 °C/s, 0.1 °C/s, 0.5 °C/s, 1 °C/s, and 2 °C/s) in order to obtain a full pearlite structure. The thermal simulation sample (Ø8 mm × 12 mm) was obtained by the line cutting method. The thermal simulation experiment was carried out using a Thermecmastor thermal simulator (Gleeble 3800, DSI, St. Paul, DE, USA), whose maximum heating temperature was 1700 °C. Both of the maximum heating and cooling rates were 10,000 °C/s, and the temperature precision was at ±1 °C. The precise control of temperature, time, and cooling speed was computerized. Moreover, the rate of temperature increase, the austenitization temperature, and the holding time were set to 10 °C/s, 1000 °C, and 10 min, respectively. The expansion parameters of the sample during heating (cooling) were measured by a helium-neon laser, and the corresponding data were analyzed using the Origin 8.0 software (Origin Lab, Northampton, MA, USA), in order to obtain the thermal expansion curves and the continuous cooling transformation (CCT) curves.
Samples of the thermal simulation experiment were first ground by a SiO2 sandpaper, then polished with a 2.5 µm diamond polishing agent, and finally, etched in a 4 vol% nitric alcohol solution. The structures and the surface morphologies of the samples were analyzed by optical microscopy (OM; Olympus BM51, Olympus Corporation, Tokyo, Japan), scanning electron microscopy (SEM; Sirion 200, FEI, Hillsboro, OR, USA), and transmission electron microscopy (TEM; JEM–2010HT, Hitachi, Ibaraki, Japan) techniques. The TEM sample were treated as follows: (1) cut into a thickness of 0.3 mm by the linear cutting method; (2) ground to a thickness of 50–80 µm by the SiO2 sandpaper; (3) punch out a small circle of 3 mm diameter on a special puncher; and finally (4) polish on an MTP–1A type electrolytic double-sprinkler at a temperature of 20 °C and a polishing voltage of 70 V. In addition, 4% perchloric acid and anhydrous ethanol were used in the electrolytic double-sprinkler. The Buchler’s hardness measurement test was carried out for 20 s under 1.0 kg loading, and 10 points were measured to calculate the average value and the standard deviation. The volume fraction of pearlite was measured using the standard point counting technique [15], and the lamellar spacing of pearlite was calculated by the linear intercept method (Circular test line method) [16].
3. Results
3.1. Transformation Microstructure
Figure 1 displays the optical microstructures of Alloy 1 at different cooling rates. The complete pearlite structure was obtained at cooling rates less than 0.1 °C/s (Figure 1a). Moreover, a mixed structure of pearlite (volume fraction of 17 ± 6%) and martensite was formed at cooling rates less than 0.5 °C/s (Figure 1b), and a complete martensite structure was formed at cooling rates higher than 1 °C/s (Figure 1c).
Figure 2 exhibits the optical microstructures of Alloy 2 at different cooling rates. A complete pearlite structure was obtained at cooling rates less than 0.05 °C/s (Figure 2a). In addition, a mixed structure of pearlite (78 ± 8%) and martensite was formed at cooling rates less than 0.1 °C/s (Figure 2b), and a complete martensite structure was obtained at cooling rates higher than 0.5 °C/s (Figure 2c).
3.2. Thermal Expansion and CCT Curves
A spinodal point appeared in the expansion curve during continuous cooling from austenitization to room temperatures. The relationship between the linear expansion of steel and temperature at 0.02 °C/s and 0.2 °C/s cooling rates was obtained by a thermal simulator (Figure 3). It is evident that under the same cooling conditions, Alloy 1 manifested a higher transformation temperature and a shorter transformation time compared to Alloy 2. Based on the temperature–expansion curves, the starting temperatures, the ending temperatures, and the transformation times at different cooling rates were measured, and the CCT curves were plotted based on the obtained temperature points and holding times of pearlite and martensite. The CCT curves of the experimental steels are depicted in Figure 4. These data show that the starting and the ending temperatures of the perlite transformation significantly increased, and the transformation time remarkably decreased due to the addition of 3.87 wt% Co and 1.37 wt% Al. For example, in the case of Alloy 1, at a cooling rate of 0.1 °C/s and pearlite transformation starting and ending temperatures of 683 °C and 661 °C, respectively, the transformation holding time was 198 s; whereas for Alloy 2, the pearlite transformation starting and ending temperatures were 673 °C and 629 °C, respectively, and the transformation holding time increased to 235 s.
3.3. Lamellar Spacing and Hardness of the Pearlite.
The morphology of pearlite structure was studied using SEM (Figure 5), and the results of lamellar spacing and hardness of pearlite are presented in Table 2 and Figure 6. At a cooling rate of 0.1 °C/s, Alloy 1 yielded an ultrafine pearlite structure, with a lamellar spacing of 45 nm and a hardness of 425 HV1. However, when the cooling rate was reduced to 0.02 °C/s, the value of lamellar spacing increased to 95 nm, and the value of hardness decreased to 355 HV1. In contrast, Alloy 2 manifested larger lamellar spacings (80–130 nm) and smaller hardness values (310–400 HV1). Therefore, the addition of Co and Al significantly reduced the lamellar spacing and simultaneously, increased microstructure hardness.
4. Discussion
4.1. Effects of Co and Al on the Structure and Lamellar Spacing of Pearlite
Figure 7 illustrates the effects of 3.87 wt% Co and 1.37 wt% Al on the time temperature transformation (TTT) curve, and free energy driving force (calculated by MUCG 83.Mod software [17]) of the experimental steel. Figure 7a shows that the addition of Co and Al increased the temperature of the pearlite transformation, shifted the C curve left, and shortened the duration of the pearlite transformation. Moreover, Co and Al increased the diffusion rate of carbon in austenite, accelerated the pearlite transformation, increased the eutectoid transformation temperature, and increased the supercooling degree. Takahashi [18] developed a model based on the relationship between the lamellar spacing of pearlite and the supercooling degree after applying the eutectoid transformation.
where denotes pearlite lamellar spacing, is the eutectoid transformation temperature, and signifies the supercooling degree. It is discernible that smaller lamellar spacings were obtained at higher supercooling degrees; therefore, Co and Al significantly reduced the lamellar spacing of pearlite. Consequently, shorter dislocation slips occurred during plastic deformation, resulting in higher hardness values of pearlite structures. Capdevila et al. [19] employed a neural network model to evaluate the effects of different alloy elements on lamellar spacing of pearlite, and found that austenite stabilizing elements, such as Mn, Cr, Ni, and Mo, significantly increased the spacing of pearlite lamellae; however, the stable elements of ferrite, such as Co and Al, reduced the spacing of pearlite lamellae.
4.2. Effects of Co and Al on Kinetics and Thermodynamics of the Pearlite Transformation
For Alloy 1, the SEM image after isothermal treatment and TEM image for the cooling rate of 0.1 °C/s are displayed in Figure 8 and Figure 9, respectively. Although the carbon content in Alloy 1 was 0.78 wt%, it remained hypoeutectoid steel due to the addition of Co and Al. For example, Alloy 1 was first heated at 1000 °C for 30 min, then heated at 700 °C for 5 h, and finally quenched in water to room temperature. Consequently, a martensite structure with a small amount of proeutectoid ferrite was obtained [20,21], which were intimately connected with the complete or incomplete wetting of grain boundaries by the second solid phase, proeutectoid ferrite was obtained in case of high amount of a wetting phase [22,23]. Generally, a complete pearlite structure can be obtained in hypoeutectoid steel at higher cooling rates. For example, a complete pearlite structure can be obtained in Fe–0.4C–0.62Mn–0.30Si–0.024Al (in wt%) alloy at a cooling rate of 140 °C/s [11]. It is evident from the free energy curve in Figure 7b, that Co and Al significantly increased the free energy of austenite to pearlite transformation. Pearlite transformation is a local equilibrium phase transformation process; therefore, the increase in the transformation’s driving force can be attributed to the transformation from a system’s para-equilibrium to equilibrium [24]. Hence, during the transformation from para-equilibrium to equilibrium, precipitation of fine cementite can be obtained [24].
Hultgren and Honeycombe [25] published that by extending the local region of phase or phase in a low-carbon or hypoeutectoid steel, it is possible to transform the austenite structure into fully pearlite structure when the transformation temperature is lower than the equilibrium eutectoid temperature. This process requires a very high cooling rate in order to avoid the formation of proeutectoid ferrite. Co and Al significantly increase the chemical driving force and inhibit the formation of proeutectoid ferrite during para-equilibrium to equilibrium transformations. An extremely fine layer of cementite (Figure 9a) or a granular structure of cementite (Figure 9b) was formed at very slow cooling rates (both of them were formed at a cooling rate of 0.1 °C/s).
5. Conclusions
In the present paper, the microstructures and hardness of a Co- and Al-containing high-carbon steel were investigated under slow cooling rates (0.02–2.0 °C/s). Moreover, by means of a Thermecmastor thermal simulator and metallographic-hardness test method, the corresponding continuous cooling transformation (CCT) curves were plotted.
(1) In comparison to conventional high-carbon steel, the experimental steel (3.87 wt% Co and 1.37 wt% Al) increased the pearlite transformation temperature and shortened the transition time under cooling rates of 0.02–0.1 °C/s (for example, at 0.1 °C/s cooling rate, the temperature increased from 673 °C to 683 °C, and the reaction time decreased from 235 s to 198 s). Therefore, the addition of Co and Al increased the driving force of austenite to pearlite transformation and accelerated the pearlite transformation.
(2) In comparison to conventional high-carbon steel, the experimental steel yielded an extremely fine pearlitic structure with an interlamellar spacing of 45 nm and a hardness of 425 HV1, under slow cooling rates. Therefore, the addition of Co and Al significantly reduced the lamellar spacing.
Author Contributions
Literature search, L.F., W.Z. and R.K.; Figures, L.F. and R.K.; Study Design, L.F., G.Z., K.W. and W.Q.; Data Collection, L.F.; Data Analysis, L.F., F.H., W.Z., R.K. and K.W.; Data Interpretation, F.H., W.Z., G.Z. and K.W.; Writing, L.F.; Article Modification, F.H., W.Z., G.Z. and K.W.; Funding Support, K.W. and W.Q.
Funding
The authors sincerely thank the support from the National Key Research and Development Program of China (No. 2017YFB0304800), the Major Technology Innovation of Hubei Province (No. 2016AAA022), the Hubei Provincial Natural Science Foundation of Innovation Team (No. 2016CFA004), the National Natural Science Foundation of China (NSFC) (No. 1532268; 51601134; 51671149), the Jingmen Science and Technology Planning Project (No. 2018YFYB054) and the 111 Project.
Conflicts of Interest
The authors declare no conflict of interest.
References
- Bhadeshia, H.K. Bainite in Steels, 2nd ed.; IOM Communications: London, UK, 2001. [Google Scholar]
- Bhadeshia, H.K. Nanostructured bainite. Proc. R. Soc. A 2010, 466, 3–18. [Google Scholar] [CrossRef] [Green Version]
- Caballero, F.G.; Bhadeshia, H.K. Very strong bainite. Curr. Opin. Solid State Mater. Sci. 2004, 8, 251–257. [Google Scholar] [CrossRef] [Green Version]
- Garcia-Mateo, C.; Caballero, F.G. Ultra-high-strength bainitic steels. ISIJ Int. 2005, 45, 1736–1740. [Google Scholar] [CrossRef]
- Garcia-Mateo, C.; Caballero, F.G.; Bhadeshia, H.K. Mechanical Properties of Low-Temperature Bainite. Mater. Sci. Forum. 2005, 500, 495–501. [Google Scholar] [CrossRef]
- Timokhina, I.B.; Beladi, H.; Xiong, X.Y.; Adachi, Y.; Hodgson, P.D. Nanoscale microstructural characterization of a nanobainitic steel. Acta Mater. 2011, 59, 5511–5522. [Google Scholar] [CrossRef]
- Sherif, M.Y. Characterisation and Development of Nanostructured, Ultrahigh Strength and Ductile Bainitic Steels. Ph.D. Thesis, University of Cambridge, Cambridge, UK, 2006. [Google Scholar]
- Garcia-Mateo, C.; Caballero, F.G.; Bhadeshia, H.K. Acceleration of low-temperature bainite. ISIJ Int. 2003, 43, 1821–1825. [Google Scholar] [CrossRef]
- Jaramillo, R.A.; Babu, S.S.; Ludtka, G.M.; Kisner, R.A.; Wilgen, J.B.; Mackiewicz-Ludtka, G.; Nicholson, D.M.; Kelly, S.M.; Murugananth, M.; Bhadeshia, H.K. Effect of 30T magnetic field on transformations in a novel bainitic steel. Scrip. Mater. 2005, 52, 461–466. [Google Scholar] [CrossRef]
- Shi, S.Q. Phase Transformation and Mechanical Properties of Fe-1.5C-1.5Cr-xAl Ultra High Carbon Steel. Ph.D. Thesis, Nanjing University of Science, Nanjing, China, 2006. [Google Scholar]
- Houin, J.P.; Simon, A.; Beck, G. Relationship between Structure and Mechanical Properties of Pearlite between 0.2% and 0.8%C. Trans. ISIJ 1981, 21, 726–731. [Google Scholar] [CrossRef]
- Wang, B.Q.; Song, X.Y.; Li, H.J.; Gu, N.J. Microstructure Ultra-fining Treatment of Ultrahigh Carbon Steel. J. Iron Steel Res. 2004, 16, 5–9. [Google Scholar]
- Sun, S.H.; Xiong, Y.; Fu, W.T.; Xing, G.Z.; Furuhara, T.; Maki, T. Microstructure changes of eutectoid pearlitic steel during cold rolling. Acta Metall. Sin. 2005, 41, 267–270. [Google Scholar]
- Yan, Z.G.; Xue, H.J. Test research on 2000 MPa 7 mm diameter steel wire for hutong Changjiang River bridge. J. China Railw. Soc. 2018, 7, 115–120. [Google Scholar]
- ISO 9042. Steels—Manual Point Counting Method for Statistically Estimating the Volume Fraction of a Constituent with A Point Grid; IHS: Zurich, Switzerland, 1988. [Google Scholar]
- Caballero, F.G.; Capdevila, C.; Garcia de Andres, C. Modeling of the interlamellar spacing of isothermally formed pearlite in a eutectoid steel. Scrip. Mater. 2000, 42, 537–542. [Google Scholar] [CrossRef] [Green Version]
- Peet, M.; Bhadeshia, H.K. Materials Algorithms Project. Available online: www.msm.cam.ac.uk/map/steel/tar/mucg83.exe. (accessed on 11 January 2019).
- Takahashi, M. Reaustenitization from Bainite in Steels. Ph.D. Thesis, University of Cambridge, Cambridge, UK, 1992. [Google Scholar]
- Capdevila, C.; Caballero, F.G.; Garcia de Andres, C. Neural network model for isothermal pearlite transformation. Part I: Interlamellar spacing. ISIJ Int. 2005, 45, 229–237. [Google Scholar] [CrossRef]
- Hu, F.; Wu, K.M.; Shirzadi, A.A. Influence of Co and Al on pearlitic transformation in superbainitic steels. Ironmak. Steelmak. 2012, 39, 535–539. [Google Scholar] [CrossRef] [Green Version]
- Wu, K.M.; Bhadeshia, H.K. Extremely fine pearlite by continuous cooling transformation. Scrip. Mater. 2012, 67, 53–56. [Google Scholar] [CrossRef] [Green Version]
- Straumal, B.B.; Kucheev, Y.O.; Efron, L.I.; Petelin, A.L.; Majumdar, J.D.; Manna, I. Complete and incomplete wetting of ferrite grain boundaries by austenite in the low-alloyed ferritic steel. J. Mater. Eng. Perform. 2012, 21, 667–670. [Google Scholar] [CrossRef]
- Straumal, A.B.; Bokstein, B.S.; Petelin, A.L.; Straumal, B.B.; Baretzky, B.; Rodin, A.O.; Nekrasov, A.N. Apparently complete grain boundary wetting in Cu–In alloys. J. Mater. Sci. 2012, 24, 8336–8343. [Google Scholar] [CrossRef]
- Yi, H.L. Full Pearlite Obtained by Slow Cooling in Medium Carbon Steel. Mater. Sci. Eng. A 2010, 527, 7600–7604. [Google Scholar] [CrossRef]
- Bhadeshia, H.K.; Honeycombe, R.W.K. Steels: Microstructure and Properties, 3rd ed.; Butterworth-Heinemann: London, UK, 2006. [Google Scholar]
Figure 1.
Optical micrographs of Alloy 1 at the cooling rates of (a) 0.1 °C/s, (b) 0.5 °C/s, and (c) 1.0 °C/s.
Figure 1.
Optical micrographs of Alloy 1 at the cooling rates of (a) 0.1 °C/s, (b) 0.5 °C/s, and (c) 1.0 °C/s.

Figure 2.
Optical micrographs of Alloy 2 at the cooling rates of (a) 0.05 °C/s, (b) 0.1 °C/s, and (c) 0.5 °C/s.
Figure 2.
Optical micrographs of Alloy 2 at the cooling rates of (a) 0.05 °C/s, (b) 0.1 °C/s, and (c) 0.5 °C/s.

Figure 3.
Dilatational strain as a function of temperature: (a) Alloy 1, and (b) Alloy 2.

Figure 4.
The CCT (Continuous Cooling Transition) curves of the tested steels: (a) Alloy 1 and (b) Alloy 2.
Figure 4.
The CCT (Continuous Cooling Transition) curves of the tested steels: (a) Alloy 1 and (b) Alloy 2.

Figure 5.
SEM (Scanning Electron Microscope) micrographs of the tested steels at a cooling rate of 0.1 °C/s; (a) Alloy 1, and (b) Alloy 2.
Figure 5.
SEM (Scanning Electron Microscope) micrographs of the tested steels at a cooling rate of 0.1 °C/s; (a) Alloy 1, and (b) Alloy 2.
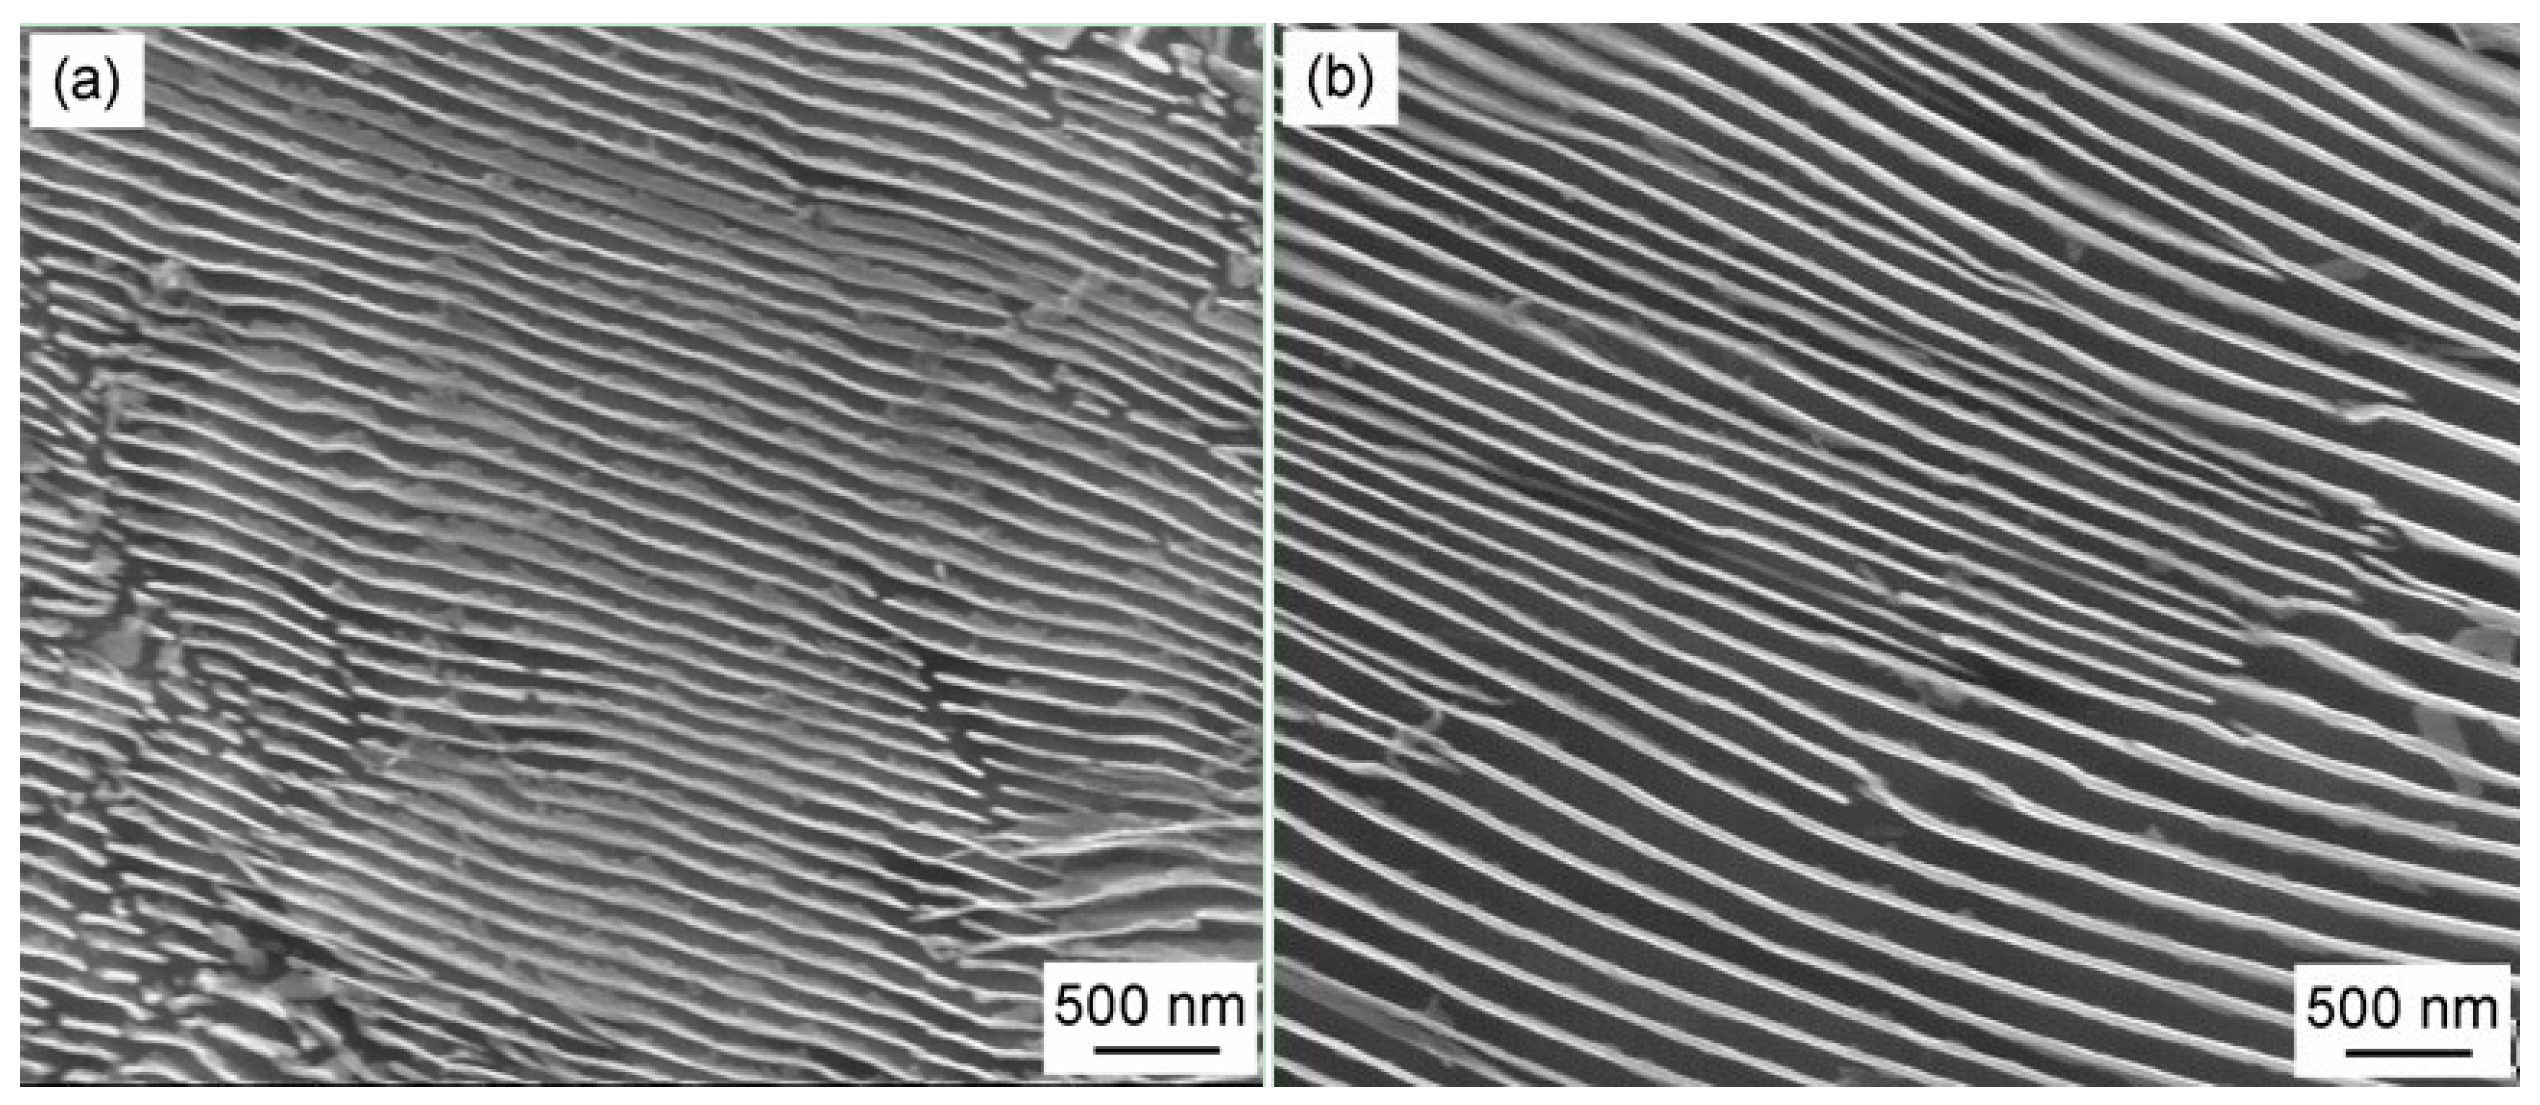
Figure 6.
The phase fraction and hardness of the tested steels at different cooling rates.
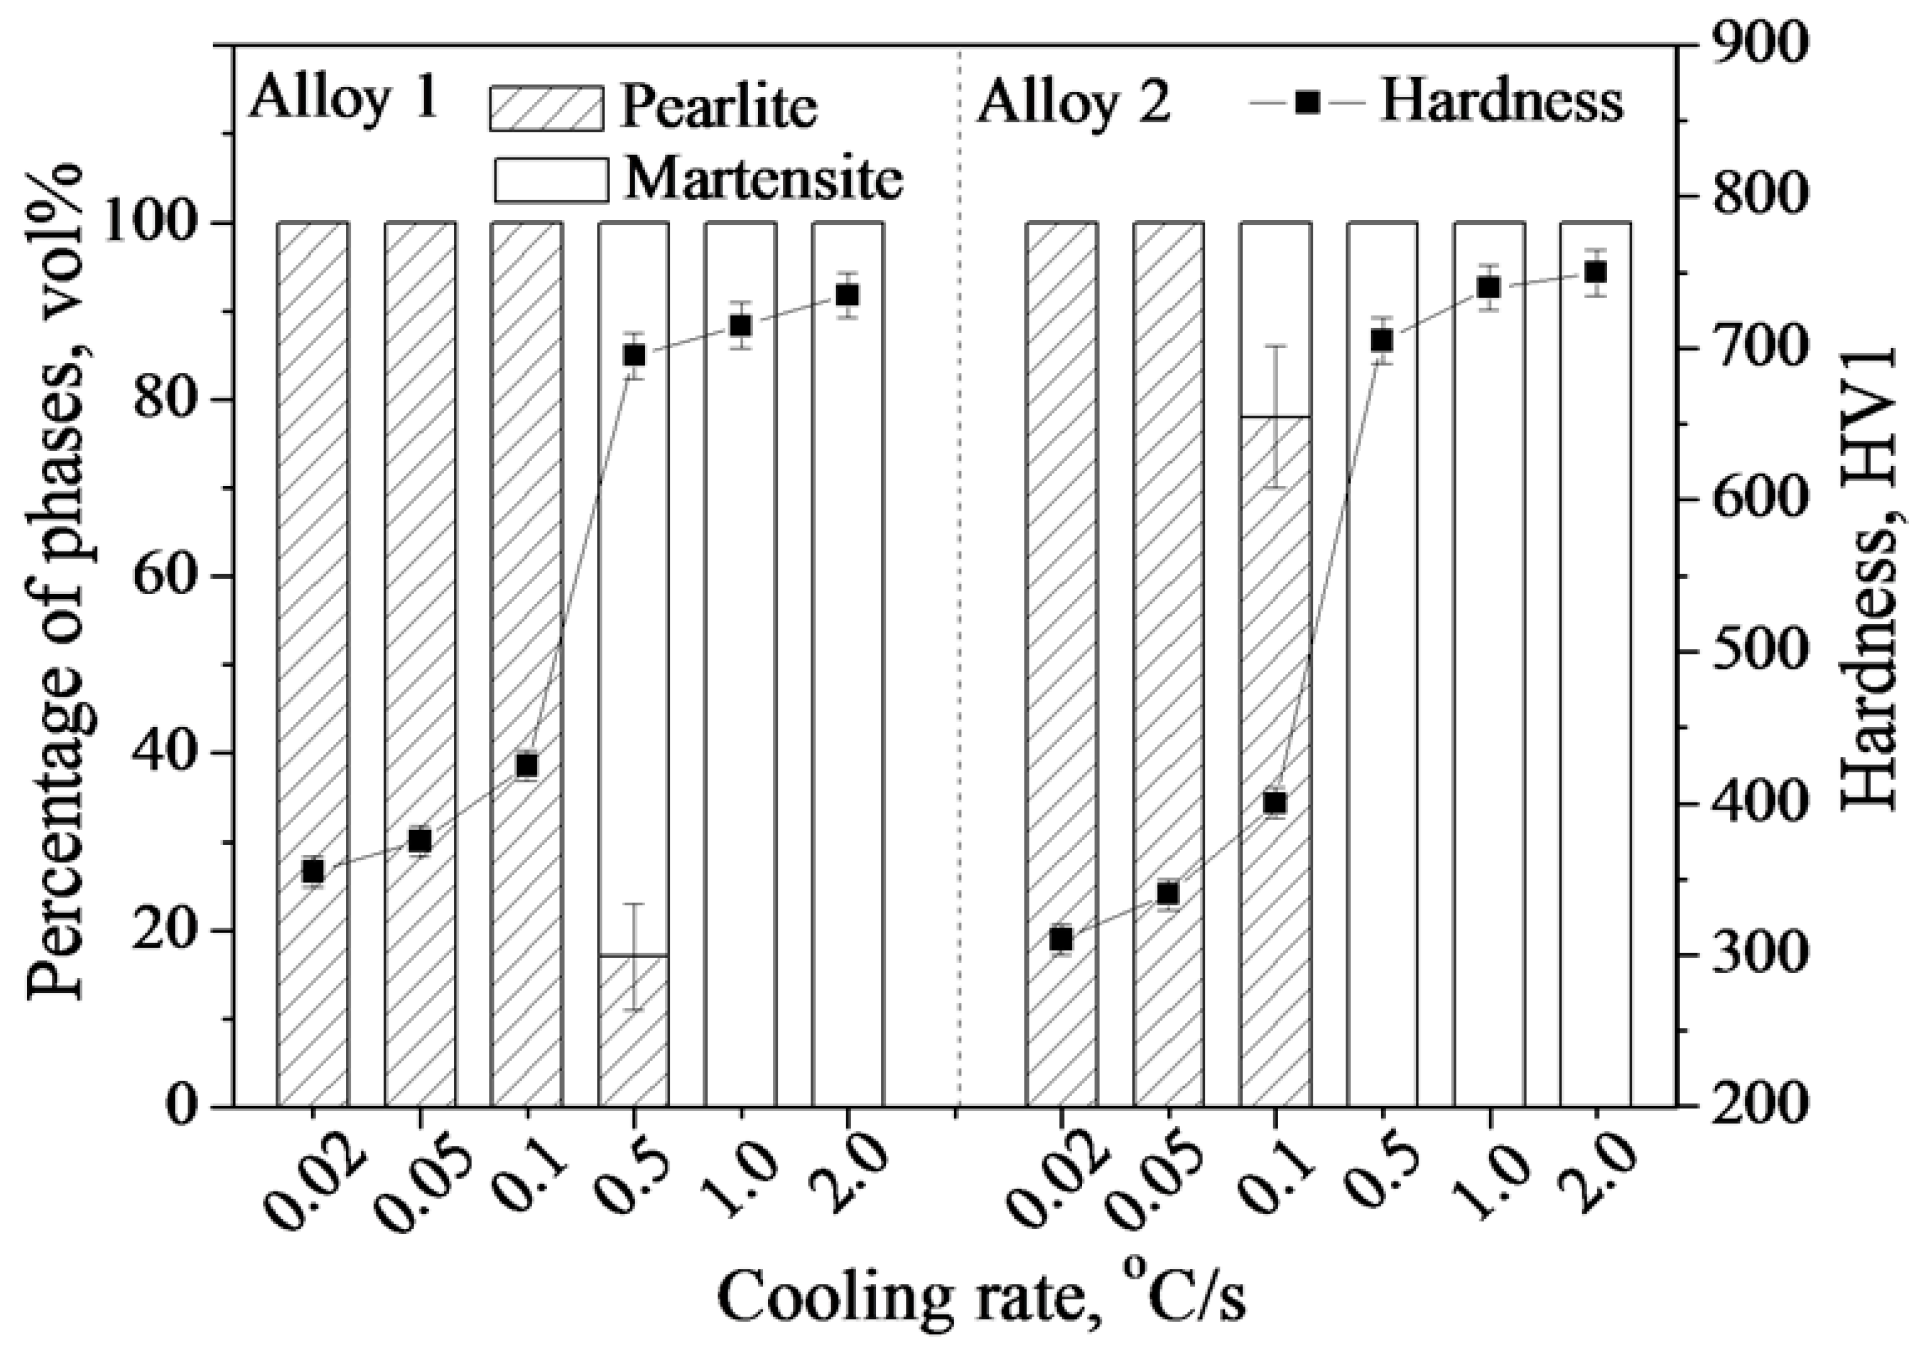
Figure 7.
Effect of Co and Al addition on phase transformation; (a) the shifting of TTT (Time, Temperature, Transformation) curves, and (b) the free energy change.
Figure 7.
Effect of Co and Al addition on phase transformation; (a) the shifting of TTT (Time, Temperature, Transformation) curves, and (b) the free energy change.
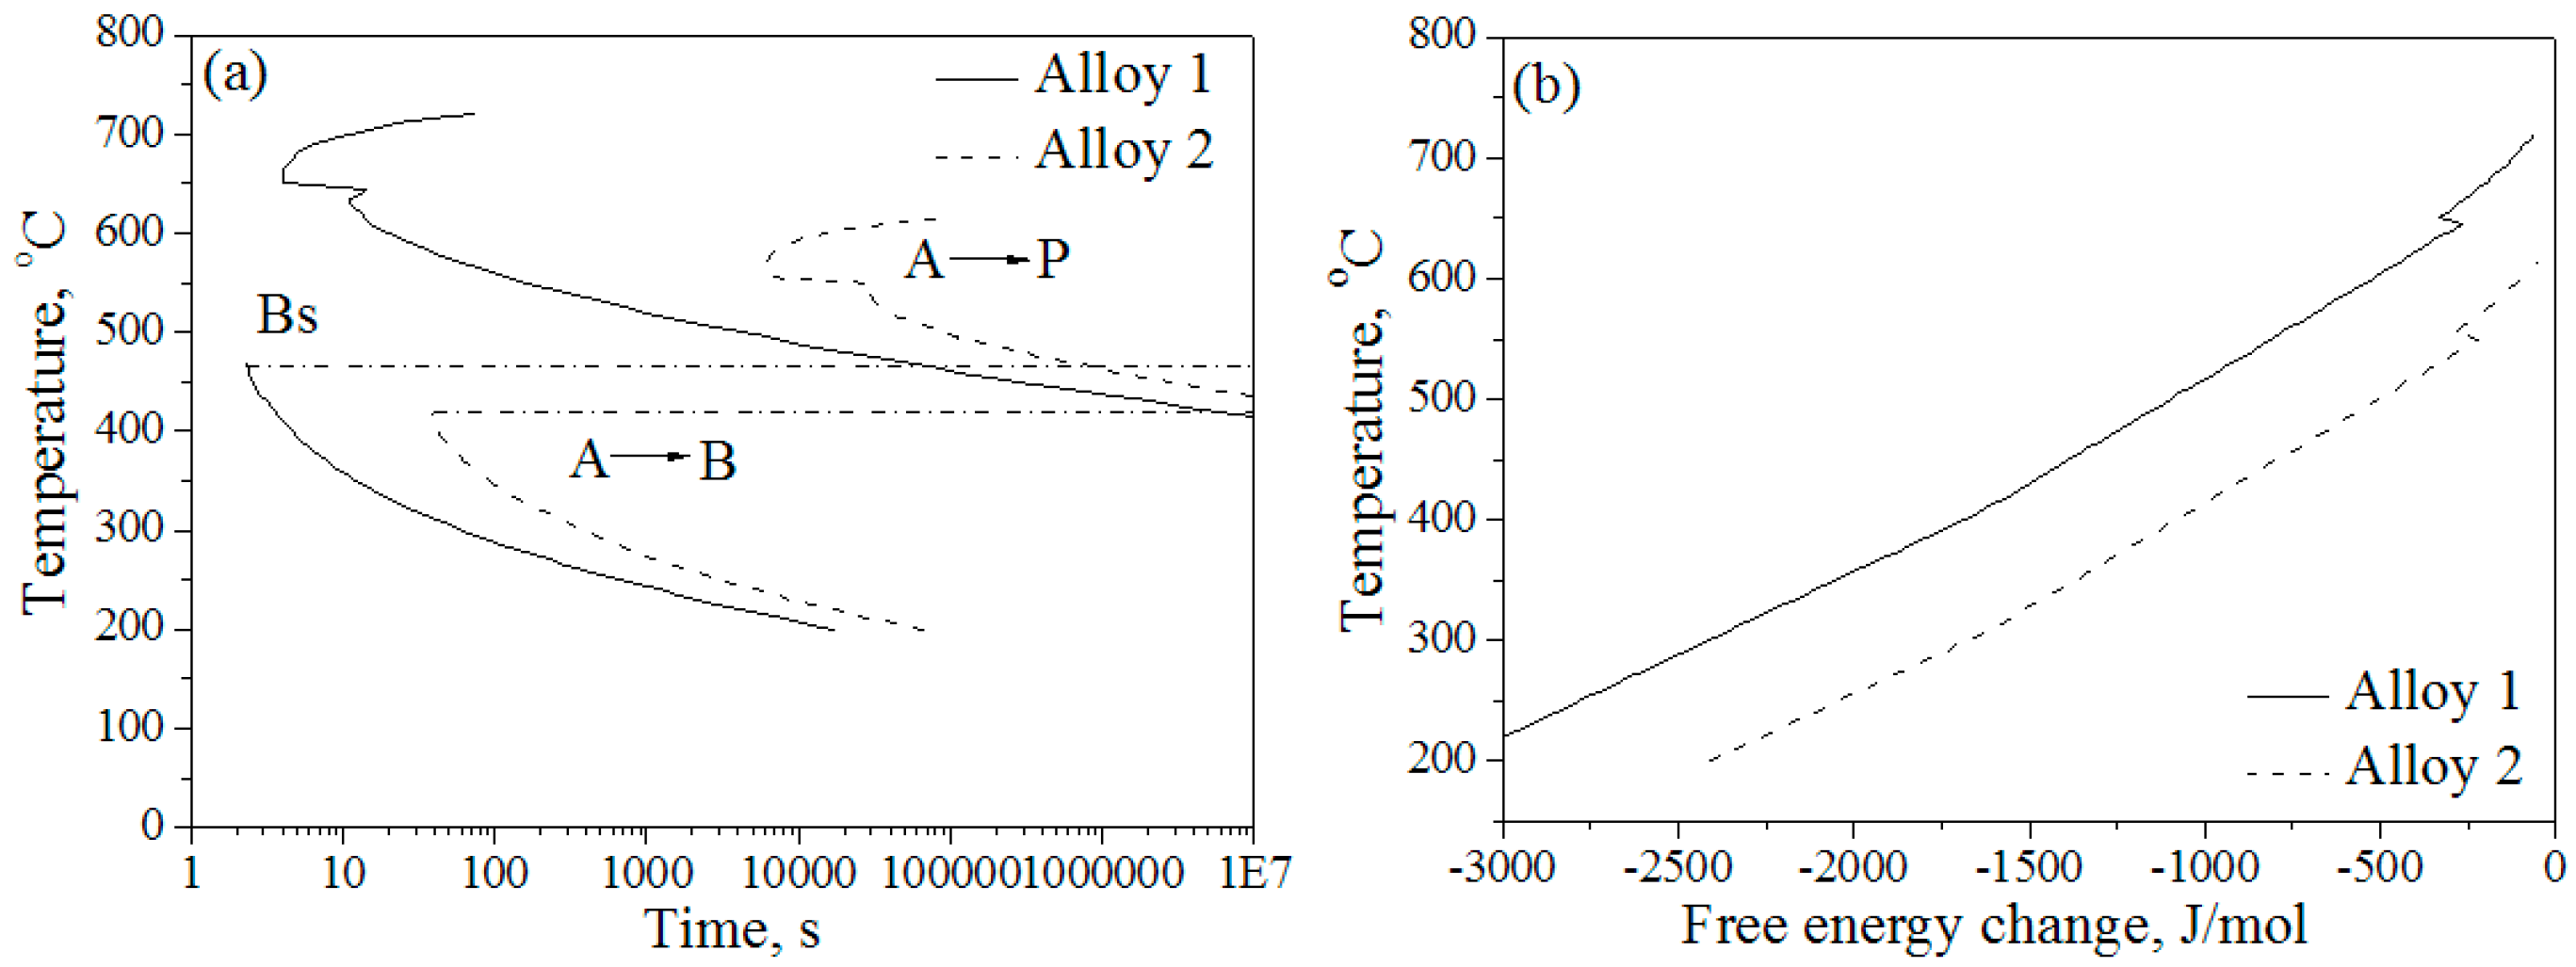
Figure 8.
SEM micrographs of Alloy 1 that consists of martensite and a little allotriomorphic ferrite (Specimen was austenitized at 1000 °C for 30 min, then isothermally transformed at 700 °C for 5 h, before being quenched into the water at room temperature). (a) 1000 magnification times and, (b) 4000 magnification times.

Figure 9.
TEM micrographs of Alloy 1 at a cooling rate of 0.1 °C/s; (a) cementite lamellae, and (b) cementite particle.
Figure 9.
TEM micrographs of Alloy 1 at a cooling rate of 0.1 °C/s; (a) cementite lamellae, and (b) cementite particle.


Table 1.
Chemical composition of the tested steels (wt%).
| Alloys | C | Si | Mn | Mo | Cr | Co | Al |
|---|---|---|---|---|---|---|---|
| Alloy 1 | 0.78 | 1.60 | 2.02 | 0.24 | 1.01 | 3.87 | 1.37 |
| Alloy 2 | 0.79 | 1.59 | 1.94 | 0.30 | 1.33 | - | 0.01 |
Table 2.
Relationship between cooling rate and lamellar spacing or hardness.
| Sample | Alloy 1 | Alloy 2 | ||||
|---|---|---|---|---|---|---|
| Cooling Rate, °C/s | 0.02 | 0.05 | 0.1 | 0.02 | 0.05 | 0.1 |
| Interlamellar Spacing, nm | 95 ± 15 | 65 ± 10 | 45 ± 10 | 130 ± 15 | 100 ± 15 | 80 ± 10 |
| Hardness, HV1 | 355 ± 10 | 375 ± 10 | 425 ± 10 | 310 ± 10 | 340 ± 10 | 400 ± 10 |
© 2019 by the authors. Licensee MDPI, Basel, Switzerland. This article is an open access article distributed under the terms and conditions of the Creative Commons Attribution (CC BY) license (http://creativecommons.org/licenses/by/4.0/).
Share and Cite
MDPI and ACS Style
Feng, L.; Hu, F.; Zhou, W.; Ke, R.; Zhang, G.; Wu, K.; Qiao, W. Influences of Alloying Elements on Continuous Cooling Phase Transformation and Microstructures of Extremely Fine Pearlite. Metals 2019, 9, 70. https://doi.org/10.3390/met9010070
AMA Style
Feng L, Hu F, Zhou W, Ke R, Zhang G, Wu K, Qiao W. Influences of Alloying Elements on Continuous Cooling Phase Transformation and Microstructures of Extremely Fine Pearlite. Metals. 2019; 9(1):70. https://doi.org/10.3390/met9010070
Chicago/Turabian StyleFeng, Lulu, Feng Hu, Wen Zhou, Rui Ke, Guohong Zhang, Kaiming Wu, and Wenwei Qiao. 2019. "Influences of Alloying Elements on Continuous Cooling Phase Transformation and Microstructures of Extremely Fine Pearlite" Metals 9, no. 1: 70. https://doi.org/10.3390/met9010070
Note that from the first issue of 2016, this journal uses article numbers instead of page numbers. See further details here.