Article

Effect of Mg Concentration on the Aluminothermic Reduction of Mn2O3 Particles Obtained from Cathodes of Discharged Alkaline Batteries: Mathematical Modeling and Experimental Results

by
Orlando Flores Dávila
*,
Jesús Torres Torres
and
Alfredo Flores Valdes
Centro de Investigación y de Estudios Avanzados del IPN, Unidad Saltillo Avenida Industria Metalúrgica 1062, Parque Industrial Saltillo-Ramos Arizpe, 25900 Ramos Arizpe, Coahuila, México
*
Author to whom correspondence should be addressed.
Metals 2019, 9(1), 49; https://doi.org/10.3390/met9010049
Submission received: 4 December 2018 / Revised: 27 December 2018 / Accepted: 29 December 2018 / Published: 7 January 2019

Abstract

:
This paper aimed at studying the effect of magnesium concentration in molten aluminum produced from beverage cans on the process of aluminothermic reduction of Mn2O3 particles obtained from the cathodes of discharged alkaline batteries. The experimental results were analyzed by using thermodynamic fundamentals and kinetic modeling, while the characterization of the reaction products obtained allowed the mechanism of the process to be described. It was found that the addition of magnesium improves the wettability of solid particles by molten aluminum, thus increasing the reaction and its subsequent incorporation into the molten aluminum solution of Mn released from the reduction reaction. This work was carried out using several initial magnesium concentrations; 1.0, 2.0, 3.0, and 4.0 wt %, under a constant temperature of 1073 K, a constant treatment time of 240 min, and a constant agitation speed of 200 rpm. The results show that the higher the initial magnesium concentration in the molten alloy, the higher the speed of the chemical reduction reaction of the Mn2O3 particles.

1. Introduction

Discharged alkaline batteries should be considered as hazardous residues due to their high toxicity levels and the quantities produced worldwide. Once exhausted, they are normally disposed of in the garbage, so that the metals and toxic materials that they contain have harmful effects on the health of the human beings [1,2].
It is important to mention that aluminium, with an annual global consumption of 24 million metric tons, is the most highly consumed non-ferrous metal in the world. Of this quantity, 75% is primary aluminum extracted directly from bauxite; the remainder is secondary aluminum or recycled aluminum [3], which does not lose any of the properties that it had before being processed. To process secondary aluminum, only 5% of the total energy is required, in comparison to the energy required to produce aluminum from alumina [4]. At present, the tendency to recycle has been increasing, not only due to the economic aspects, but also due to the detrimental impacts of certain metals on the environment. The usage of certain materials that are discarded every day, such as aluminum cans from beverages and discharged alkaline batteries, is an opportunity for researching the preparation of new materials or alloys.
The metallothermic reduction process refers to the extraction of metals and alloys by the reduction of their oxides or halides with metals. There are certain metals that are used in this process, such as Al, Ca, and Mg, and each possesses specific properties and processes.
One of the most commonly employed metal according to its properties is aluminum, which is used in a process called aluminothermic reduction [5,6]. The nature of the solid–liquid interface that is in contact is determined in order to achieve the wettability that is required for a reaction to occur between them, either a dissolution or a chemical reaction. For the aluminothermic process to be carried out, it is required that there is wettability between the molten aluminum and the solid particles of the oxides to be reduced. Therefore, without good wettability, the chemical reaction and mass transport velocities are greatly reduced. In an extreme case where wettability between the solid oxide and the molten phase does not exist, the reduction will simply not occur. Therefore, the initial magnesium concentration in molten aluminum can have great importance for the aluminothermic reduction process, due to its tensoactive nature, since the surface tension value of molten aluminum without Mg is greater compared to that of aluminium, with up to 4 wt % Mg (γAl-4 wt %Mg = 0.56 N/m, against γAl-0 wt %Mg = 0.91 N/m) [7,8,9]. Thus, it could be established that when adding magnesium to a bath of molten aluminium, the surface tension will be decreased, leading to an improvement in wettability between the solid particles and the molten fraction, thus increasing the kinetics of the reactions that are carried out at the solid–liquid interface. The wettability of molten metals by solid particles strongly influences the kinetics and dissolution mechanisms [6]. The chemical reaction that takes place during the aluminothermic reduction reaction of particles of Mn2O3 is given as follows:
2Al + Mg + 4/3Mn2O3 = 8/3Mn + MgAl2O4
ΔG°1073 K = −529.41 kJ
From the beginning, it is established that the aluminothermic reduction process can be used for the reduction of Mn2O3 powders that are obtained from the cathodes of discharged alkaline batteries, using aluminum obtained from the melting of beverage cans, as presented and discussed in this paper.

2. Materials and Methods

Mn2O3 powders were obtained from the cathodes of discharged AA- and AAA-type alkaline batteries from different manufacturers. They were manually collected and disassembled, cutting the battery body to remove Mn2O3 from inside, and exposing the tissue containing the zinc oxide. The Mn2O3 powder was washed with deionized water in order to remove the electrolyte (KOH) [6,10]. Later, it was filtered and calcined at 1223 K for 3 h, to eliminate the graphite contained in the cathode [11]. Melting of aluminium was carried out in a medium-frequency induction furnace (Inductotherm corp. Rancocas, Burlington, NJ, USA) equipped with a silicon carbide crucible with 11,000 g molten aluminium capacity. A mechanical agitator made of graphite was attached to the furnace through a specially designed lid positioned at the geometrical center of the coil of the furnace. Figure 1 shows the scheme of the experimental set-up.
The materials used in the experiments performed were cans of aluminum beverages, magnesium scrap with a purity of 96 wt %, and Mn2O3 powder of 99.99 wt % (average particle size 45 µm), obtained from the cathodes of discharged alkaline batteries. The chemical composition of the aluminum cans and of the other materials used are shown in Table 1. The base alloy was obtained by melting aluminum cans at 1023 K, where the initial Mg concentration was on average 1.07 wt %. In turn, this alloy was used to prepare the alloys described in Table 2, with the addition of commercial-purity magnesium, and calculating from mass balances the amount that is required, according to Equation (2).
Mg ( g ) = W Al ( % Mg F % Mg I   ) %   P Mg
where WAl is the total weight of molten aluminum; %MgF is the weight percentage magnesium required in the alloy; %MgI is the initial weight percentage concentration of magnesium in the starting alloy, and %PMg is the weight percent of magnesium in the scrap metal. In order to carry out the process of aluminothermic reduction of solid Mn2O3 particles, the following sequence of steps was implemented. First, 5000 g of the base alloy was loaded inside the SiC crucible in the induction furnace; once a working temperature of 1073 K was reached, the mechanical agitator, operating a speed of 200 rpm, was immersed inside the molten alloy. In order to estimate the amount of Mn2O3 powder needed to reach a final target concentration of 1.5 wt %, stoichiometric calculations, taking into account the global chemical reaction given by Equation (1) and the weight of the aluminium load (5000 g), as well as the percentage of manganese in the starting alloy, were balanced. This resulted in a total of 126 g of powder to be added in a selected period of 240 min. This calculated amount was divided into 16 packages that were added at 15 min intervals, so that 16 samples were collected. As a response variable, the manganese concentration during the aluminothermic reduction process as a function of addition time and initial magnesium concentration in the alloy was selected. The chemical analysis of the collected metallic samples was carried out by SPECTRO brand spark emission spectrometry (Spectro Scientific, Chelmsford, MA, USA).
For the collection of X-ray diffraction patterns of the slag particles, a byproduct of the aluminothermic reduction of the Mn2O3, they were analyzed by an X-ray diffractometer brand Phillips model TW-3040, with vertical goniometer and high temperature camera. The analyses of XRD (Royal Philips, Amstelplein 2, Amsterdam, The Netherlands). were performed using the X-ray technique powder (approximately 3 g) in the range of 10° to 80° in 2 θ, using a radiation Cu-k α = 0.15405 at a rate of 0.02°/s. The diffraction was carried out at room temperature.
The morphology and distribution analyses of the phases in the slag samples were carried out using a scanning electron microscope (SEM) (Royal Philips, Amstelplein 2, Amsterdam, The Netherlands) brand Phillips model XL-30ESEM equipped with a microanalysis system by EDS brand EDAX model PEGASUS (Pegasus Scientific Inc. Rockville, MD, USA). The samples were mounted in cold resin of slow curing. They were metallographically prepared using SiC abrasives with different abrasion particle sizes, ranging from #120 (coarse types) to #2400 (fine types). Alcohol was used as a lubricant to prevent the sample from being hydrated. After finishing the roughing, they were polished with 3 and 1 µm diamond pastes. Finally they were covered with Ag to analyze the morphology and distribution of phases that each sample presents.

3. Results and Discussion

This section presents and discusses the results obtained from the study of the aluminothermic reduction process of Mn2O3 powder as a function of the initial magnesium concentration. First of all, the thermodynamic analysis is presented.

3.1. Thermodynamics in the Aluminothermic Reduction Process of Mn2O3

According to classical thermodynamics, the chemical reactions described below arise during the aluminothermic reduction process of Mn2O3. Their standard Gibbs free energy values at 1073 K per mole of the oxide species were calculated using HSC 6.12 software (Outotec Oyj, Espoo, Finland), which has a menu of tools called reaction (equations) that provides theoretical data of Gibbs free energies at the temperature of interest. This software has a database of cp, ΔH, and ΔS at different temperatures, which will facilitate thermodynamic calculations and eliminate mathematical errors.
2Al + 3/2O2 = Al2O3
ΔG°1073 K = −1336.71 kJ
Mg + 1/2O2 = MgO
ΔG°1073 K = −485.04 kJ
2Al + Mg + 4/3Mn2O3 = 8/3Mn + MgAl2O4
ΔG°1073 K = −529.41 kJ
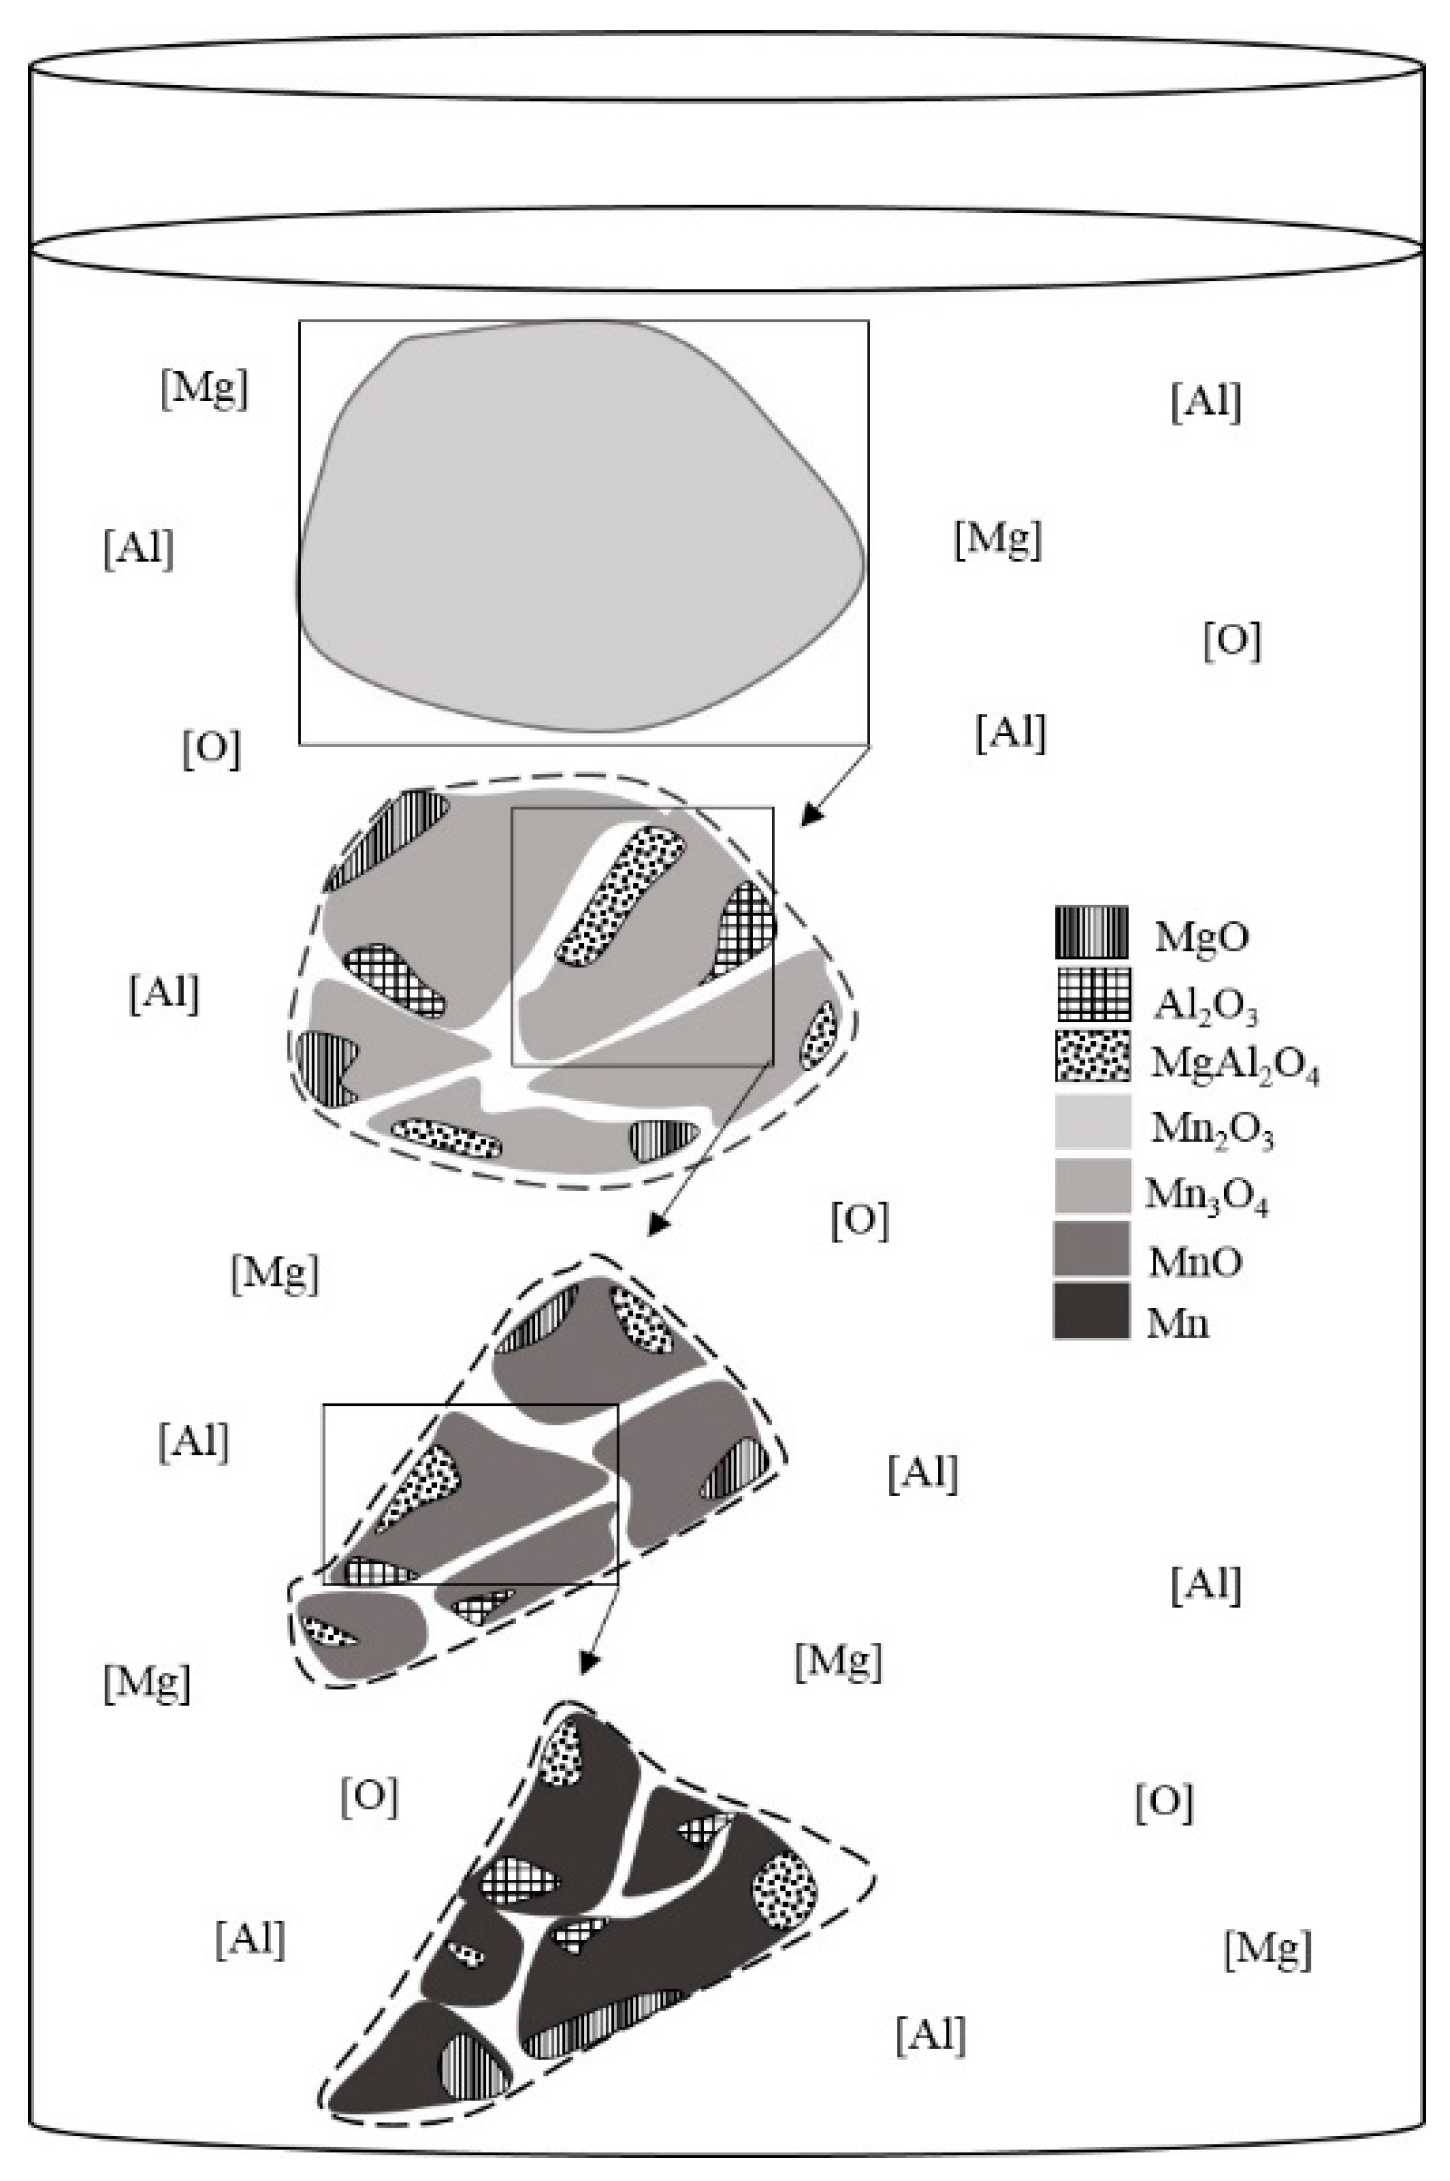
2Al + Mg + Mn3O4 = 3Mn + MgAl2O4
ΔG°1073 K = −423.14 kJ
2Al + Mg + 4MnO = 4Mn + MgAl2O4
ΔG°1073 K = −212.40 kJ
Al + 1/2N2 = 2AlN
ΔG°1073 K = −203.16 kJ
Equations (3) and (4) describe the reaction that occurs between aluminum and magnesium fused with dissolved oxygen in the liquid, forming Al2O3 and MgO, respectively, these being the only products of oxidation of these two metals. According to the thermodynamics, the first to be formed is Al2O3 because it has a high affinity for oxygen [12]; however, the possibility of simultaneously forming MnO is not ruled out, because the magnesium is present at concentrations up to a maximum of 4 wt % in the alloy. The formation of spinel is only possible by the chemical reactions (5), (6), or (7). In turn, after the formation of the compounds MgAl2O4, MgO, and Al2O3, due to their low density, they will float to the surface of the molten bath [13]. The reactions, as given by Equations (6) and (7), were considered according to the sequence of deoxidation of Mn2O3, because the Mn2O3 particles have to go through a series of manganese compounds of lesser degree of oxidation, up to metallic manganese, which, once released, pass directly in solution within molten aluminium.

3.2. X-Ray Diffraction of Reaction Products in the Aluminothermic Reduction Process of Mn2O3

The X-ray diffraction (XRD) patterns shown in Figure 2 correspond to the analysis of the different slags obtained after the aluminothermic reduction reaction, as a function of initial magnesium concentration in the alloy. The samples for the X-ray diffraction analysis were taken at the end of the process, the amount of slag was 150 g. Once cooled, it was crushed in a mortar by hand, then sieved until it reached −200 meshes. Finally, the quartering method was used to obtain a representative sample of the slag. As it can be seen, compounds such as Mn3O4, MnO, MgAl2O4, MgO, and AlN are clearly evident, which confirm that the reactions proposed for the process of thermic reduction of Mn2O3 were carried out.
As can be seen in Figure 2, the MgAl2O4 compound was present in all of the studied slags, proving that Al and Mg are oxidized by the oxygen that comes from the reduction of the Mn2O3 particles. The compounds Mn3O4 and MnO, observed in the corresponding XRD patterns, are the result of the oxidizing stages that Mn2O3 undergoes, until the oxidizing stage of metallic Mn is attained. It is known that Mn forms compounds with oxidation states from +1 to +7, with the most common states being +2, +4, and +7 [14,15]. Mn2O3 particles (containing 30.3% oxygen), pass to Mn3O4 in the first stage (containing 27.9% of oxygen, with an oxygen loss of 2.4%). In the second stage, Mn3O4 passes to MnO (containing 22.5% oxygen, with a 5.4% oxygen loss). This last compound is reduced to metallic manganese. From this analysis, it is observed that the rate of the aluminothermic reduction reaction of solid particles of Mn2O3 can be limited, because Mn2O3 follows a sequence of reduction until it reaches the stage corresponding to the complete loss of oxygen, forming metallic manganese, which enters the molten solution.
On the other hand, because the process was carried out in an open system, AlN was formed by the reaction of molten aluminum with nitrogen from the atmosphere, according to the reaction given by Equation (8).

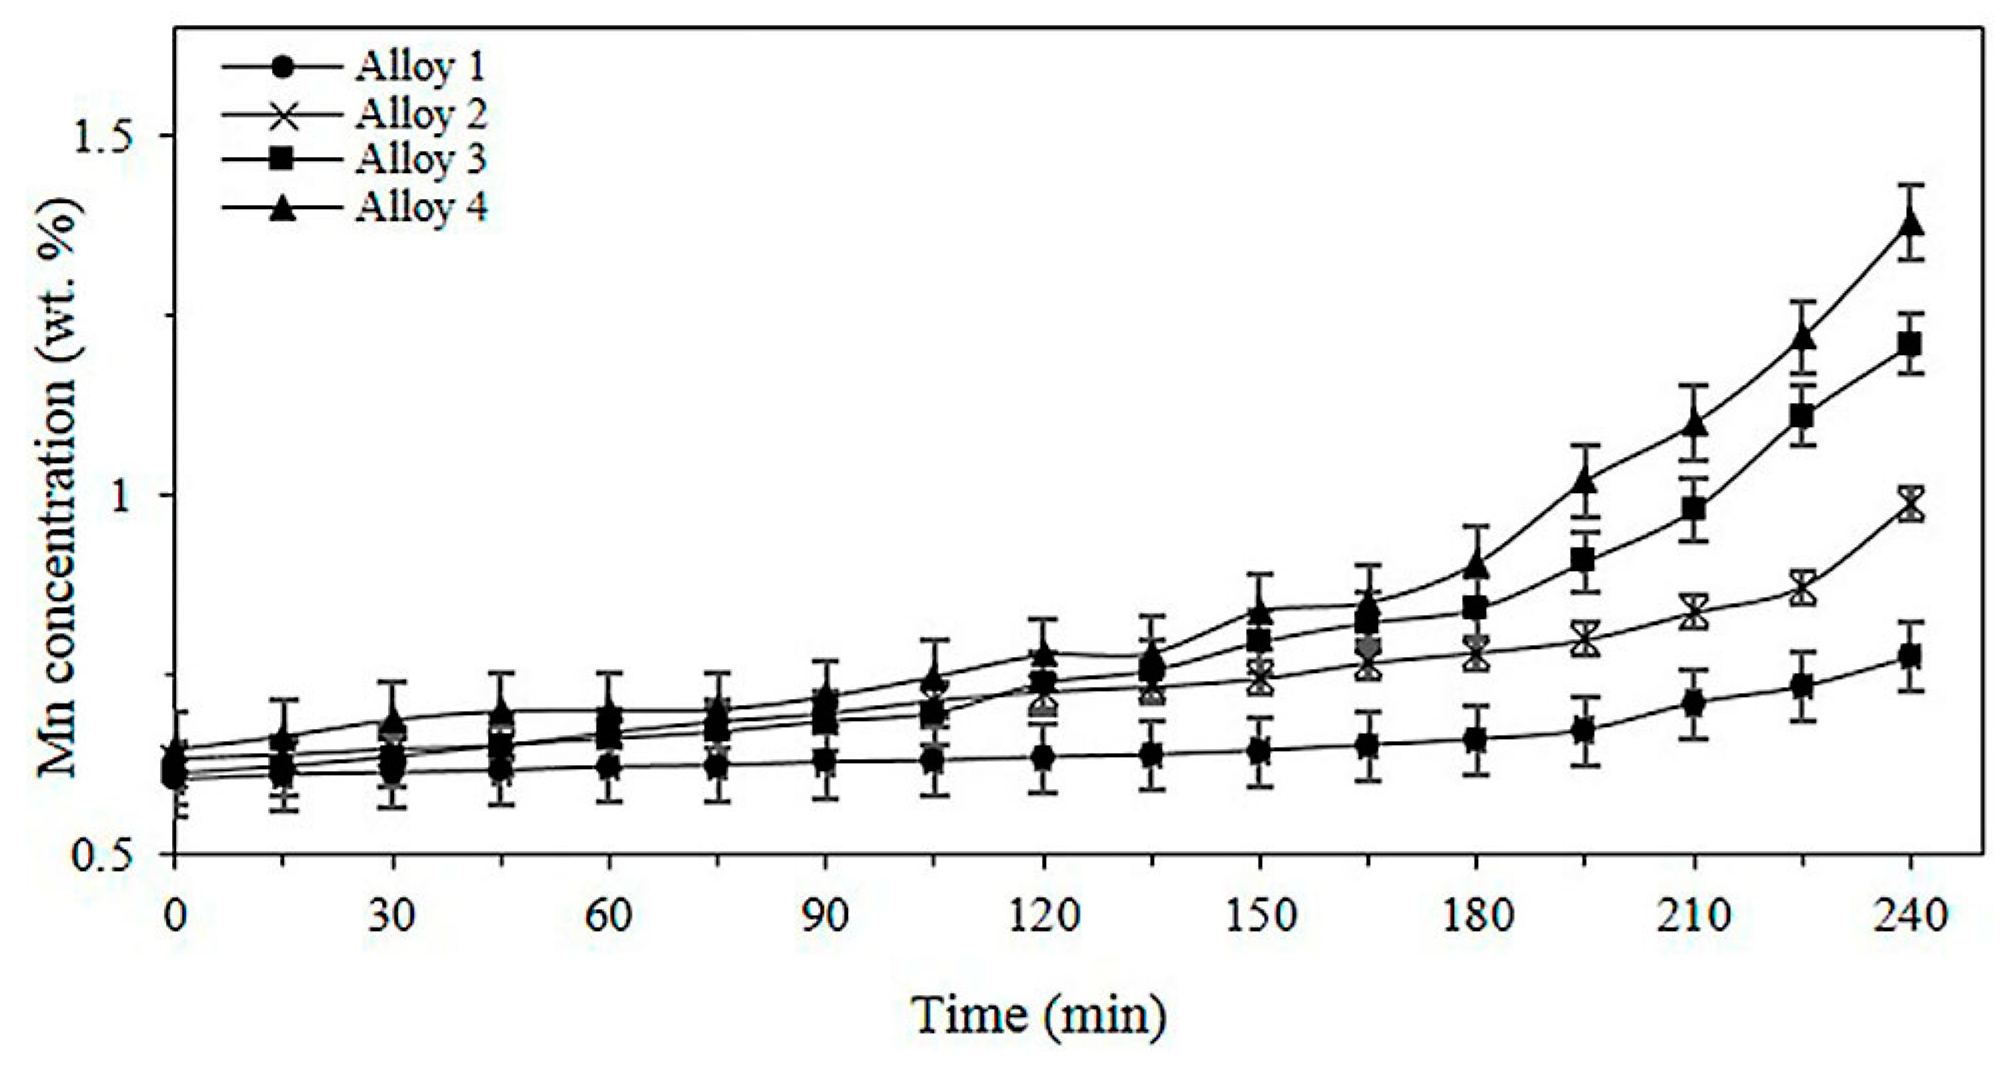
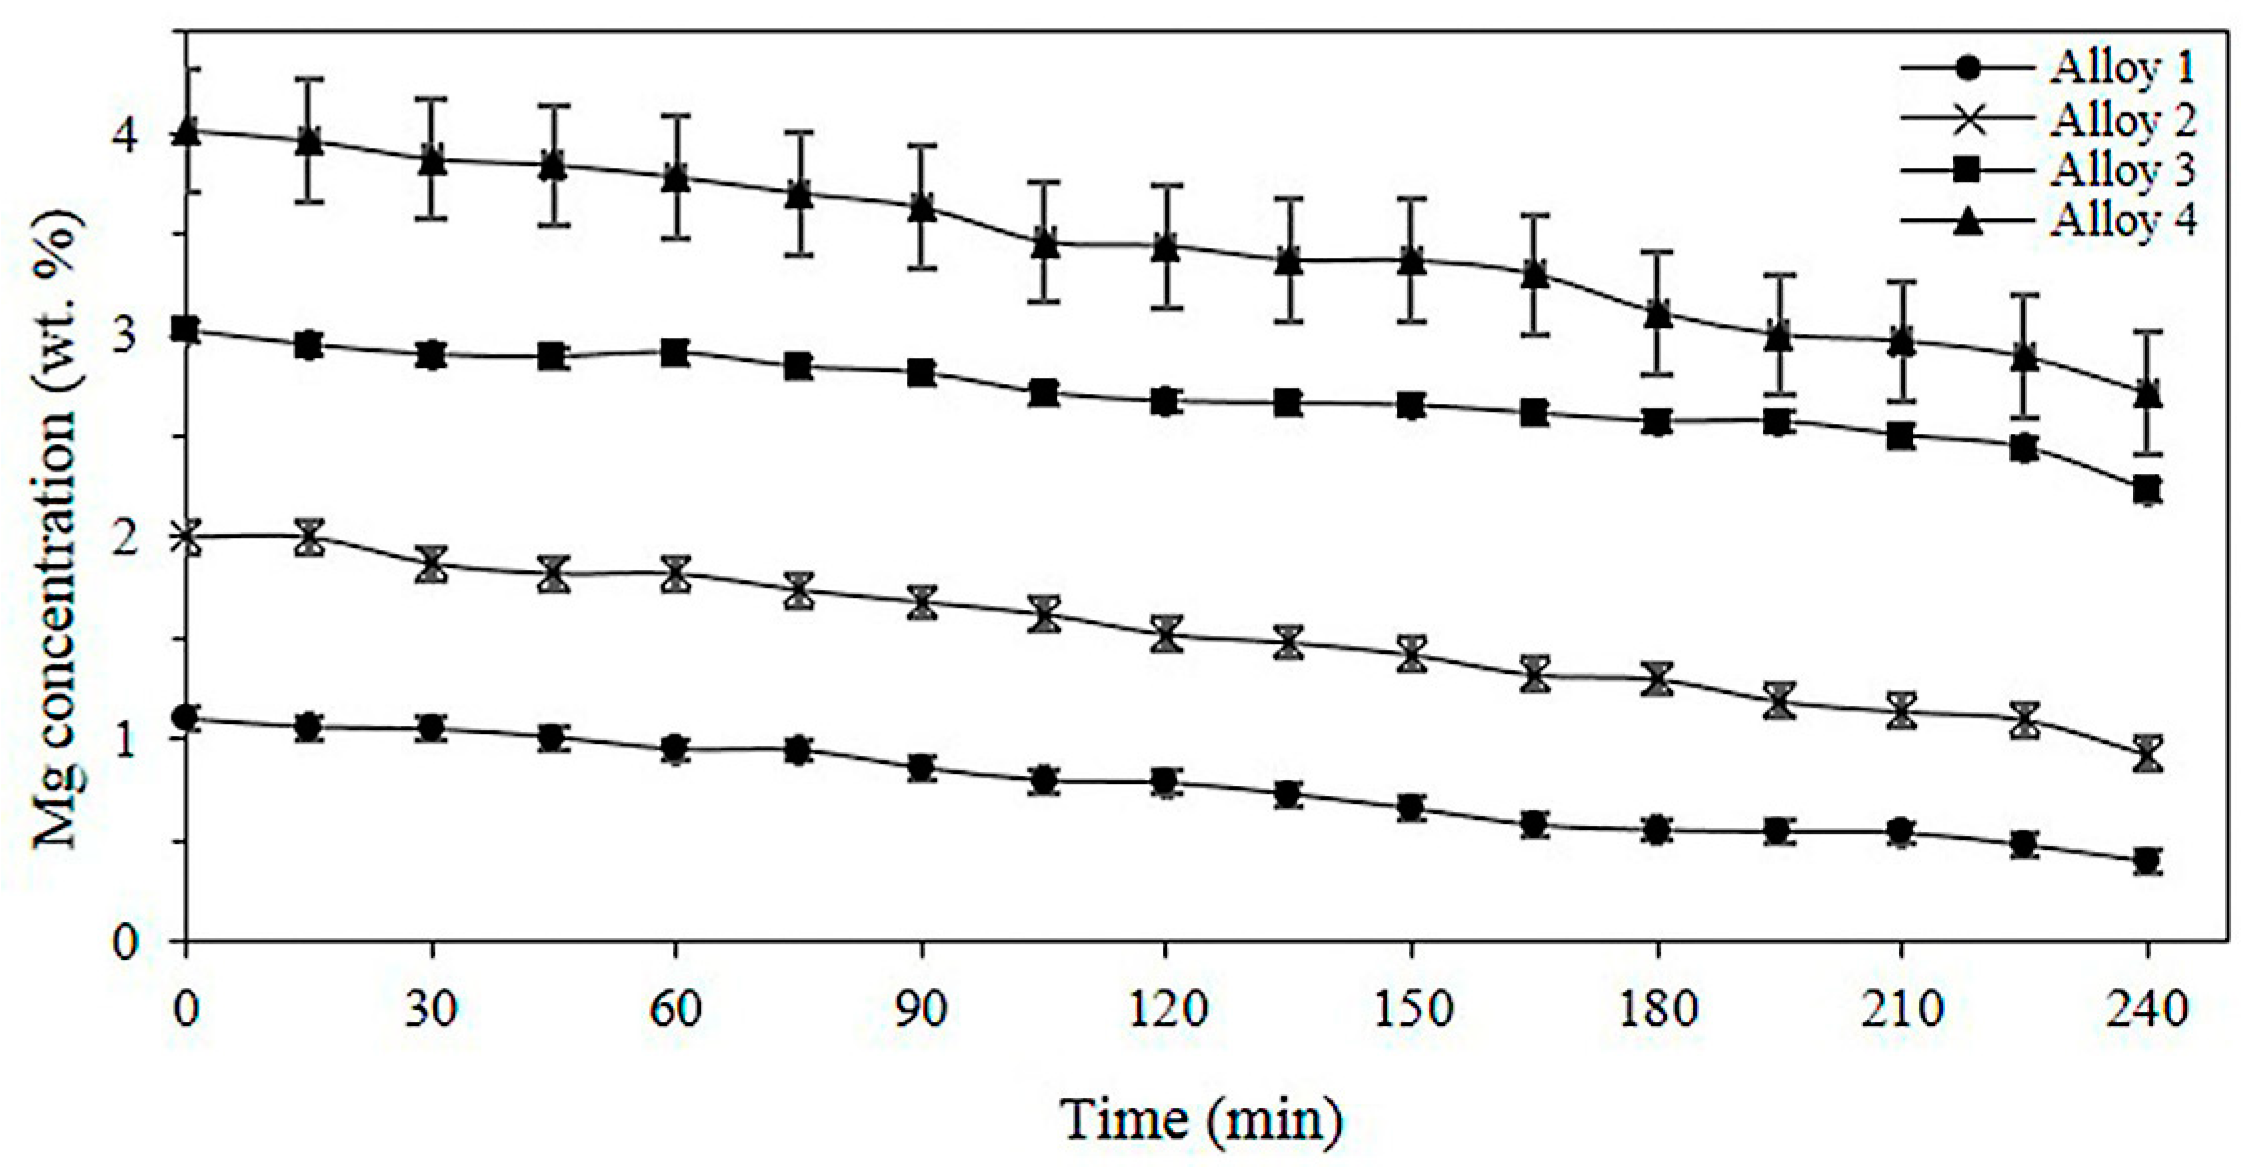
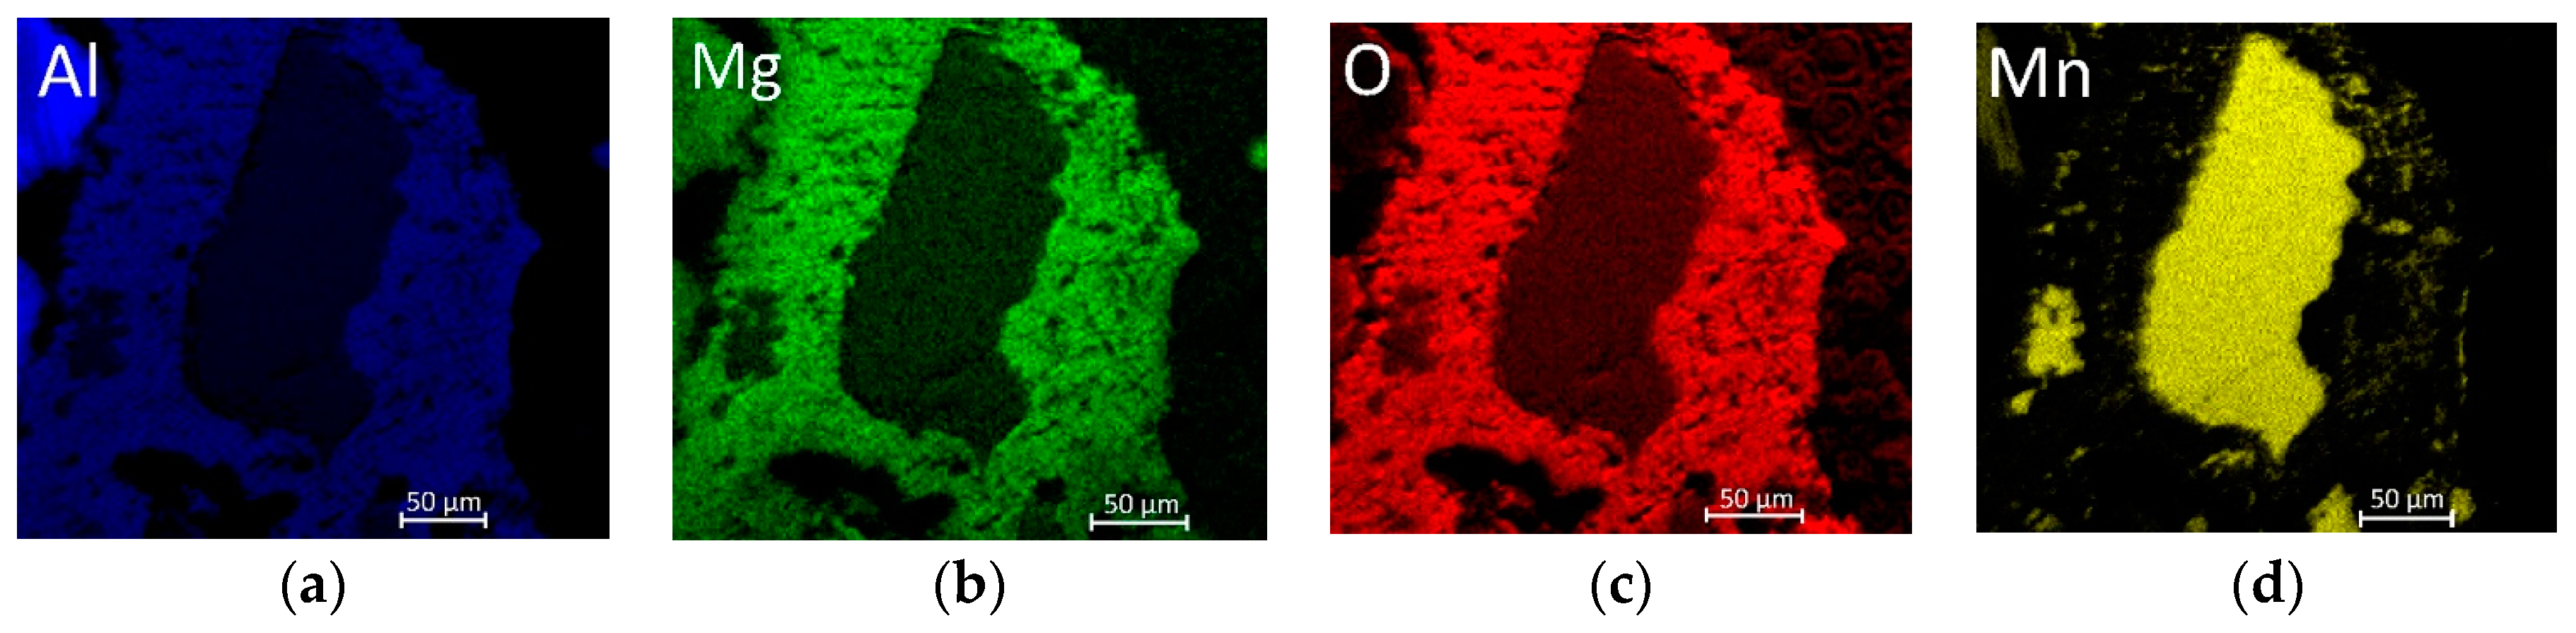
3.3. Effect of Mg on the Aluminothermic Reduction of Solid Particles of Mn2O3

Figure 3 shows the results of the variation in the concentration of manganese in the molten aluminium alloy, as a function of the addition time of Mn2O3 particles at constant temperature and agitation speed, for different initial concentrations of Mg in the base alloy. As can be seen in Figure 3, when the magnesium concentration increases, the amount of manganese that enters the molten alloy also increases. This is because there is enhanced wetting between the solid particles (Mn2O3) and the molten aluminium, because magnesium is a surfactant element that decreases the surface tension of the molten phase, therefore increasing the rate of the solid–liquid reaction.
The best results were obtained with initial concentrations of Mg of 4 wt %. (Alloy 4), reaching a maximum level of incorporation of 1.39 wt % Mn. For Alloy 3, the incorporation was 1.23 wt %, while for Alloy 2 the incorporation of Mn was 0.99 wt %; in Alloy 1, the lowest degree of incorporation was obtained, reaching only 0.77 wt %.
Figure 4 shows the results of the variation of the magnesium concentration as a function of time, for each of the experiments performed at the experimental conditions described above.
As seen from the graph, the concentration of Mg decreases constantly during the aluminothermic reduction reaction of Mn2O3, regardless of the initial concentration of Mg. However, the largest loss of magnesium occurs at initial concentrations of magnesium of 4 wt %. In addition to the effect of Mg on the surface tension of molten aluminum, magnesium also has a high affinity for oxygen, so that this element can also reduce Mn2O3 particles. Proof of this is the continuous decrease of the magnesium content in the molten alloy, as shown in Figure 4.

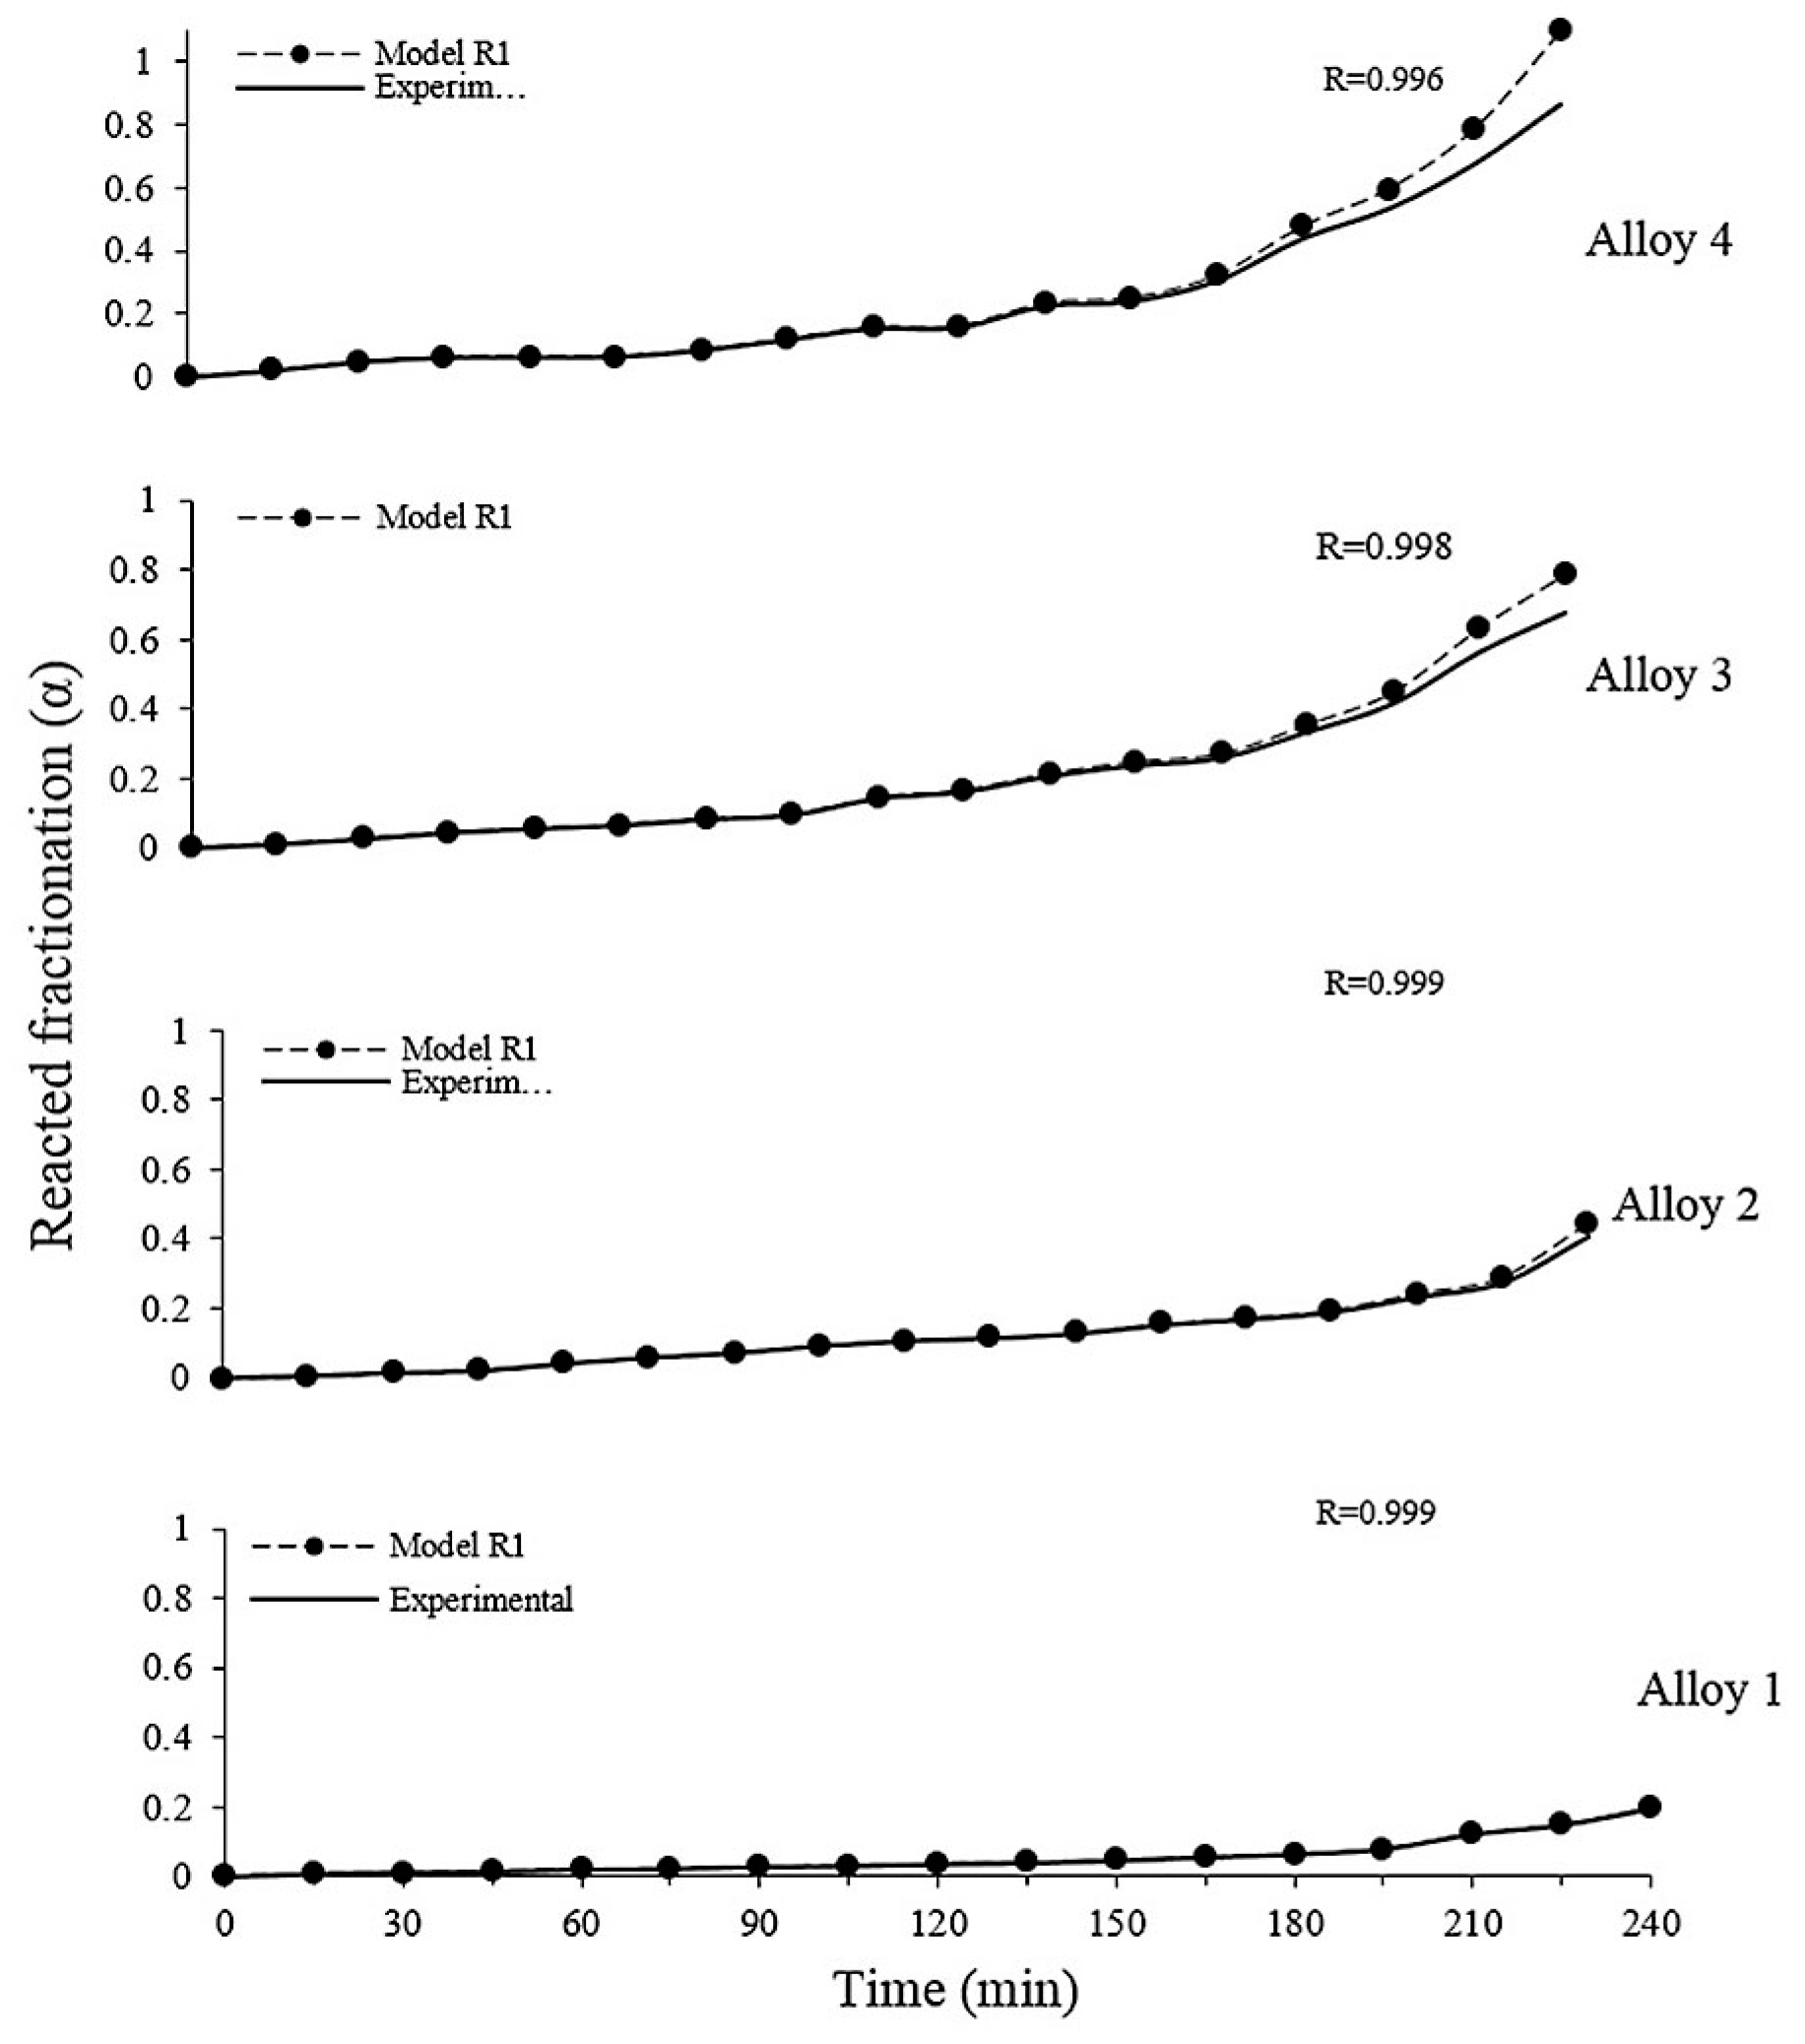
3.4. Kinetics of the Aluminothermic Reduction of Mn2O3 for Different Mg Contents in the Alloy

To characterize the rate law in the type of reaction studied in this work, the so-called degree of transformation or fraction transformed was measured. In this sense, the models that best fit the description of the progress of the reactions were experimentally measured. The models were conceived by theoretical considerations about the limiting step of the reaction, which involve aspects such as the diffusion of products from the decomposition of the reactants through the boundary layer, and considerations on the advancing geometry of the particle, as well as the size and shape of the particles. The heterogeneous reactions [16,17] to which this research is directed are of the type:
A(Solid) + B(Fluid) = C(solid) + D(Fluid)
It is for this reason that the reaction rate is defined as the rate of change or the degree of transformation (α) with time (t), given by:
R e a c t i o n   r a t e = d α d t
The magnitude associated with the advance of the reaction front is numerically equal to the reacted fraction that has been transformed at actual time, t, written as follows:
α = ( x o x i ) ( x o x f )
where X0, Xi, and Xf are the concentrations measured at the beginning, the actual time, and at the end, respectively. Thus, any physical–chemical parameter that varies in a linear way with the advance of the reaction can be used to calculate α.

3.5. Mathematical Modelin

In a fluid media (gas and liquid), g(α) can describe the dependence of the conversion with the concentration of reactants and/or products. However, in solids where the molecular movement is highly restricted and the reactions are dependent on the local structure and activity, the concept of concentration is much less well employed, and lacks a clear physical meaning. Therefore, the model g(α) usually plays the role of an empirical function. Several functions based on simple mathematical models are commonly used in these systems.
Experimental tests indicate that the reaction rate in the process has been controlled by the chemical reaction, mainly Al and Mg, where they reacted with Mn2O3. To correctly establish the mathematical model that best fits our system, we evaluated the 27 mathematical models [18] with the model (R1) three-dimensional contraction that best adjusted the aluminothermic reduction process obtaining a correlation index of 0.99.
To determine the speed of the aluminum reduction of the Mn2O3 particles and the controlling step in the kinetics of the process, different mathematical models were evaluated [18,19], with the equation of the model of chemical reaction three dimensional contraction (R1) chemical reaction, and the model that best predicted the reacted fraction, whose mathematical expression is given by:
g ( α ) = [ 3 2 ( 1 ( 1 α ) 2 3 ) ]
Figure 5 shows the data of the reacted fraction (α) against time (t), where the solid line represents the reacted fraction for the experimental data of the aluminothermic reduction process of the Mn2O3 particles to different Mg concentrations in the base alloy (1, 2, 3, and 4 wt %). The dots (•) represent the integral function g (α) = kt of the kinetic models, assuming that 1.5 wt % of manganese in the alloy corresponds to the value of the reacted fraction (α) equal to 1, because it is the maximum conversion value that can be reached by the reaction, equivalent to 100% of the reaction. In this kinetic reaction model, it is assumed that the reaction occurs quickly on the surface of the particle, and that the reaction rate is controlled by different states of manganese deoxidations, so that it is important to mention that whether the particles were spherical, as there will be a contraction in volume.
Figure 5 shows that the curves obtained have a good fit to the experimental data, having a correlation coefficient of 0.99. It is also observed that for Alloy 4 (4 wt % Mg), the reacted fraction was 87%, while for the rest, i.e., Alloys 1, 2, and 3, the values were 0.18, 0.42, and 0.69%, respectively.

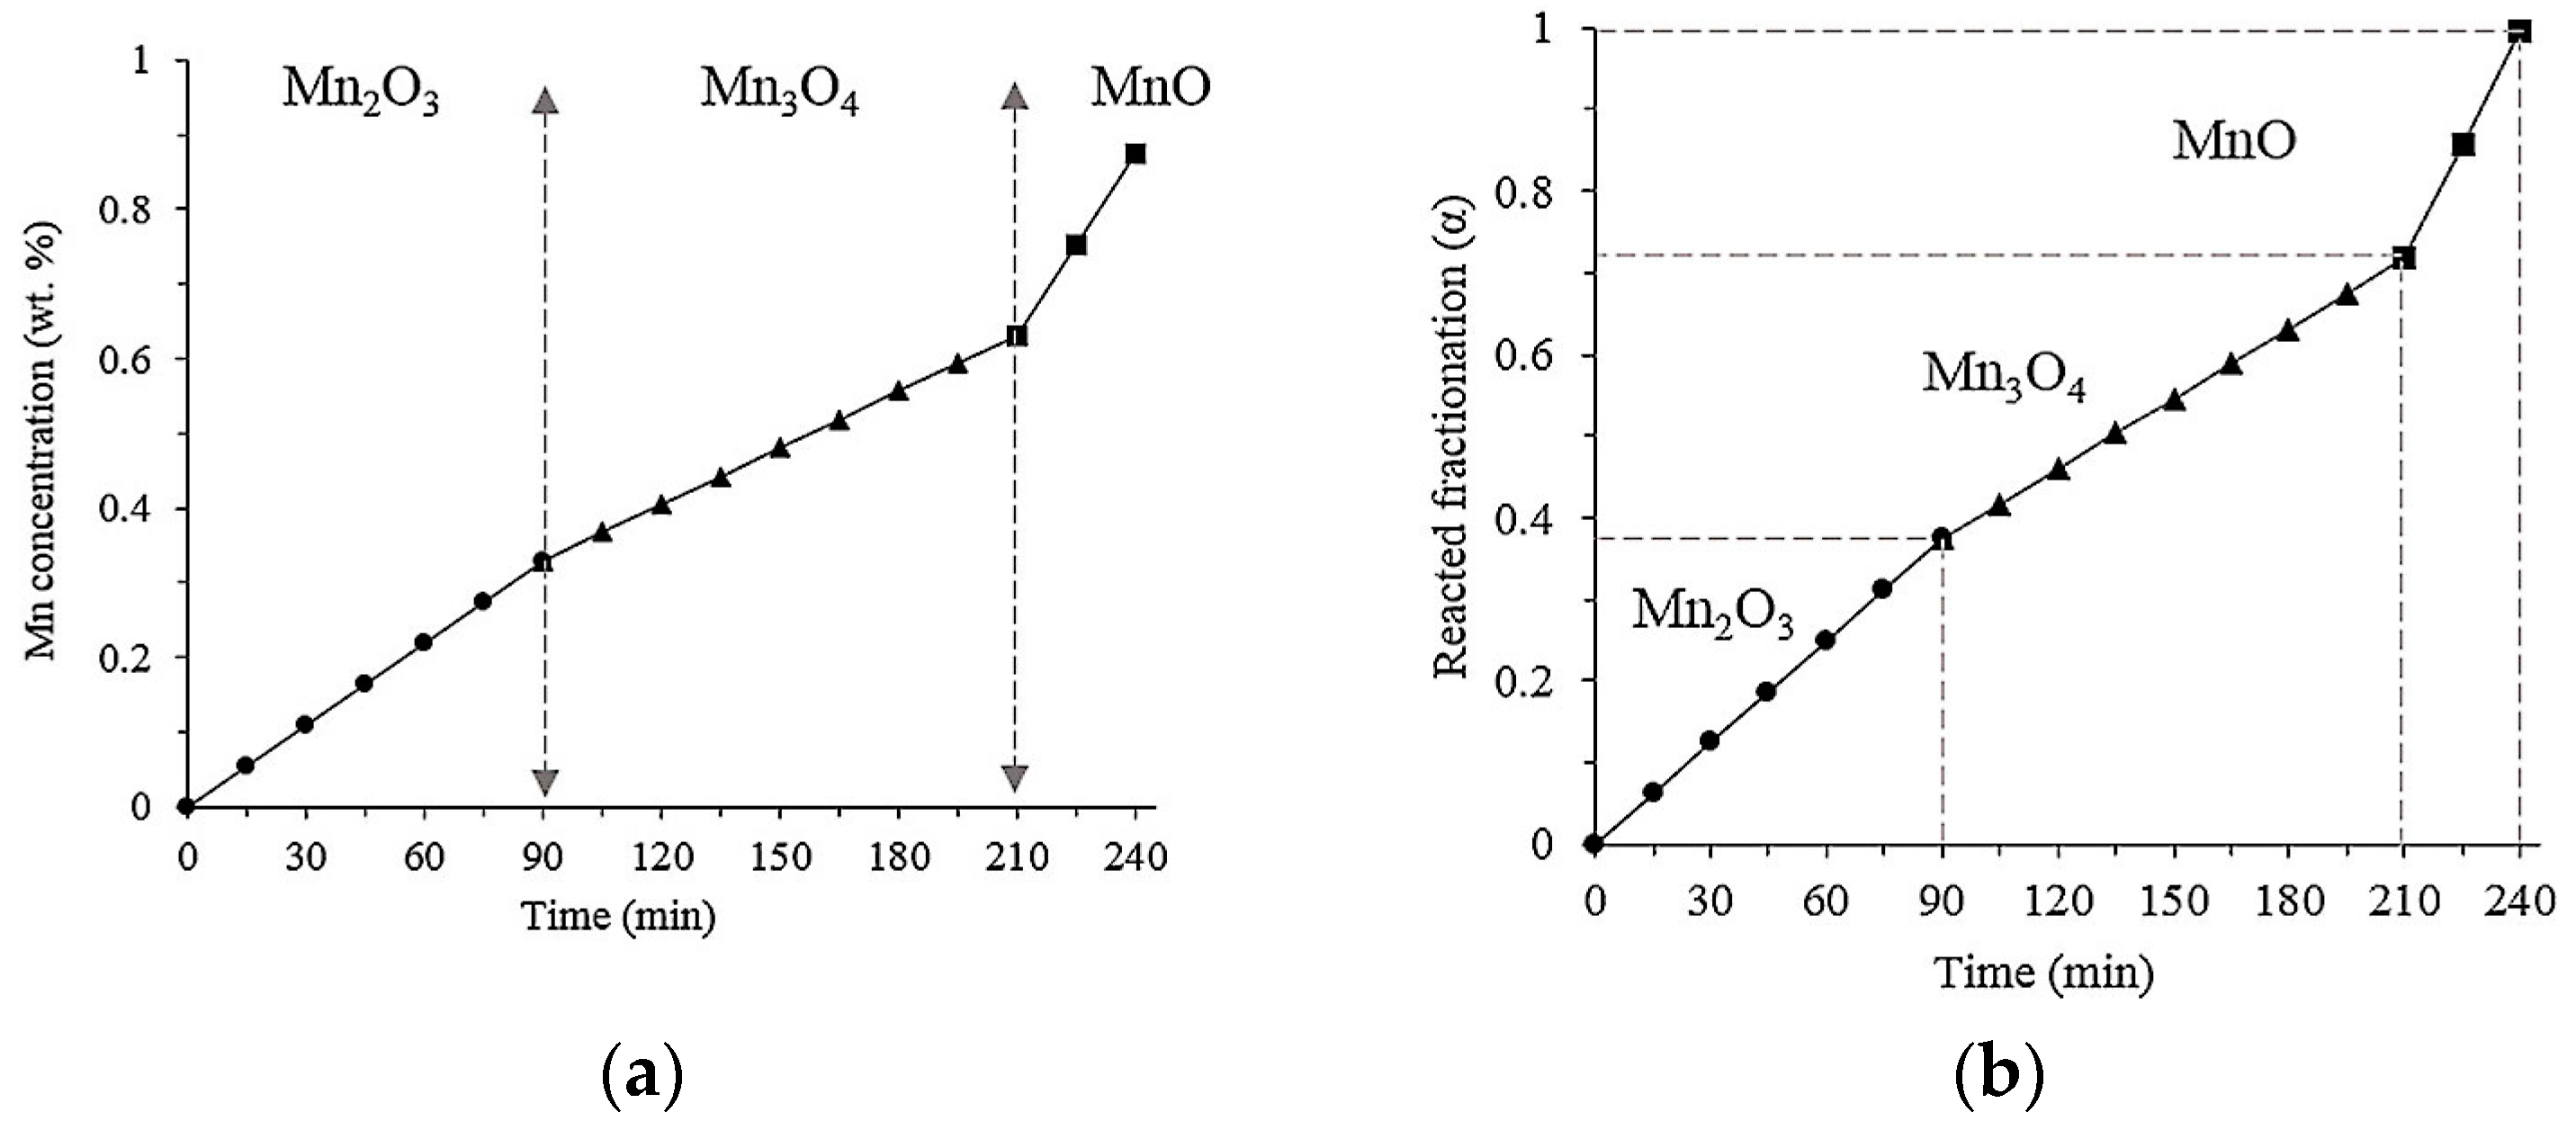
3.6. Reaction Mechanism

To propose a mechanism of the reduction of solid particles of Mn2O3 by applying the aluminothermic reduction process, it is necessary to start from the analysis of the X-ray diffraction patterns of the reaction products, which are shown for different experimental conditions in Figure 2. The presence of Mn3O4 and MnO can be observed in states of oxidation that are lower than Mn2O3, which is consistent with the reactions shown in Section 3.1, which indicates the sequence of deoxidation with their respective energy values and free standard Gibbs. The former implies that the reduction of Mn2O3 to metallic manganese in solution is not direct, obtaining intermediate compounds with lower oxidation states, as would be expected.
Table 3 was constructed to indicate the amount of manganese that each oxide of this element should provide, taking as a base the total weight of the powder to be added after 240 min of treatment, with intervals of addition of 15 min. In this sense, 5000 g of Alloy were melted, to reach a final concentration of 1.5 wt % Mn in the alloy. The above assumes that the thermic reduction reactions are 100% efficient, and that the transformation of Mn2O3 into subsequent oxides could occur after the onset of the addition of the original oxide. For example, the third column indicates the amount of grams of Mn that each addition of Mn2O3 contributes. It also shows in the fourth and fifth columns, the grams of Mn that would pass directly to the alloy (fourth column) and the expected increase in the concentration of Mn in the alloy, starting from an initial concentration of 0.62 wt % Mn (fifth column). For reasons of comparison with the model describing the kinetics of the total reaction measured experimentally, columns 6 and 7 include the theoretical values that should be generated from the thermic reduction of Mn2O3, which is the oxide that considers the model R1.
In Table 3, the third column, designated β (A1–3), is the result of the balance of the expected mass, where (A) varies for each of the three oxidation states present in the system (A1 = Mn2O3, A2 = Mn3O4 or A3 = MnO) calculated by the following equation:
β ( A 1 3 ) = Aggregate   quantity   ( A 1 3 ) ( atomic   weight   Mn molecular   weight   ( A 1 3 ) 100 % ) 100 %
The fourth column is the percentage of manganese that dissolves in the alloy, where (P) varies for each of the oxidation states present in the aluminum reduction (P1 = Mn2O3, P2 = Mn3O4 and P3 = MnO) given by the following equation:
θ ( P 1 3 ) = G r a m s   d e   M n   e n   ( P 1 3 ) ( 100 % )   w e i g h t   a l u m i n i u m   ( 5000 g )
The fifth column represents the increase of manganese in the alloy that will be given by the sum of manganese dissolved (column 4), where it is part of an initial concentration of 0.62 wt % Mn in the alloy, assuming a yield of 1.5 wt % at the end of treatment. The sixth column, showing the reacted fraction (α) for Mn2O3, is calculated by Equation (12), as described in the chemical kinetics section. The seventh column was obtained by applying the model of the heterogeneous reaction of three-dimensional contraction (R1) and Equation (12) to the data of the fraction reacted with Mn2O3.
Table 4 and Table 5 were constructed based on the same procedure as for obtaining data from Table 3, but in these cases, Mn3O4 and MnO are considered respectively as oxides to be reduced aluminothermically.
Table 4 shows the calculated values; according to the stoichiometry of Mn3O4, (A2) there are intermediate compounds of lower oxidation state during the aluminothermic reduction of Mn2O3. The third column is the quantity of grams of manganese contained in Mn3O4, which was calculated by Equation (13).
The fourth column is the percentage of manganese dissolved in the alloy, for (P2 = Mn3O4) which is calculated by Equation (14).
The sixth column, called the reacted fraction (α) for Mn3O4, was calculated by Equation (12) using the resulting data from the fifth column. The seventh column was obtained by applying the mathematical model of the three-dimensional contraction (R1) to the data of the fraction that reacted with Mn3O4.
Table 5 shows the calculated values; according to the stoichiometry of MnO, (A3) there are compounds of lower oxidation state during the aluminothermic reduction of Mn2O3. The third column, showing grams of manganese in MnO, was calculated by Equation (13).
The fourth column is the percentage of manganese dissolved in the alloy, for (P3 = MnO) which is calculated by Equation (14).
The fifth column represents the increase of manganese in the alloy, which is given by the sum of dissolved manganese, starting from the same aluminum alloy, with an initial concentration of Mn of 0.62 wt %. The sixth column, called the reacted fraction (α) for MnO, was calculated using Equation (12), using the resulting data from the fifth column. The seventh column was obtained by applying the mathematical model (R1) to the values of the reacted fraction for MnO.
Figure 6 was constructed with the theoretical α data (column 6 in Table 3, Table 4 and Table 5) and applying the three-dimensional contraction model R1 for the α data (column 7 of Table 3, Table 4 and Table 5). It is observed that the behaviors of the three compounds (Mn2O3, Mn3O4, and MnO) were linear. For the case of Mn2O3, the reacted fraction calculated was equal to one, which indicates that theoretically, all of the solid reacted and transformed to metallic manganese in solution with the molten aluminium. Applying the mathematical model R1 only adjusted the first 90 min. For the case of Mn3O4, the theoretical reacted fraction reached was 0.69, and applying the reaction model, only the first 120 min were adjusted. The reacted fraction of MnO reached its maximum value of 0.97 at 105 min; however, the reaction model R1 only adjusted the first 30 min.
With disagreement to the former, it is proposed that according to the theoretical data of the reacted fraction (α) and the application of the mathematical model (R1), for each of the oxides, these only conform to certain periods of time. In the case of Mn2O3, adjustment of the theoretical data with the mathematical model was only made during the first 90 min of treatment; for the case of Mn3O4, adjustment was made only during the first 120 min, and finally for MnO, the setting was 30 min.
By globally analyzing the behavior of each one of the oxides, and by applying theoretical data and models of three-dimensional contraction, it can be established that the reduction of Mn2O3 to Mn3O4 was carried out from 0 to 90 min. The reduction of Mn3O4 to MnO occurred from 90 to 210 min, and finally the reduction of MnO to metallic manganese occurs from 210 min to 240 min, as shown in the graphs of Figure 7.
Figure 7a shows that the simulated manganese concentration increased to 0.87 wt %, and that it needed to reach 1.5 wt % in the final alloy; the reacted fraction (b) reached its maximum of 0.99 wt % at 240 min.
As shown in the diffraction patterns in Figure 1, which were taken for slags obtained at the end of the aluminothermic reduction process, no remains of Mn2O3 were found, which leads to the affirmation that there was 100% transformation efficiency to compounds of lower oxidation states such as Mn3O4 and MnO, and if they appeared within X-ray diffraction patterns, only 87% transformation was achieved.
To establish the reaction mechanism during the reaction process of aluminothermic reduction of solid particles of Mn2O3, it was established that the formation of MgAl2O4 depends largely on the initial concentration of magnesium, i.e., for initial concentrations of magnesium of about 1 wt %, where the stable phase is MgAl2O4 [20,21].
On the other hand, the reduction of Mn2O3 particles in molten aluminium occurs because the aluminum atoms diffuse and infiltrate between the spaces that are generated in the solid particles of Mn2O3 when transforming to Mn3O4. According to the characteristics of each of the states of manganese oxidation that are found in the literature [22], the density of Mn2O3 is 4.5 g/cm3, Mn3O4 is 4.85 g/cm3, and MnO is 5.37 g/cm3. If we take into account the total amount of Mn2O3 (126 g) that was added to the process to achieve the desired composition, through the relationship between volume and mass density, the volume of each oxide was calculated, taking into account the loss of oxygen for the different types of oxides (Mn2O3, Mn3O4, and MnO) until it became a metallic manganese solution in molten aluminium. According to the above-mentioned process, the volume for Mn2O3 is 28 cm3; in the first stage, on the surface of the Mn2O3 particles, Mn3O4 compound is formed, which is a product of deoxidation by the effect of the aluminum and magnesium in solution. At this stage, 2.4 wt % of oxygen is released, which is subtracted from the total weight of Mn2O3, resulting in a volume of 25.35 cm3. The resulting volume of Mn3O4 is lower compared to that of the starting Mn2O3, which generates a discontinuity in the superficial layer, generating space or cracks where it can continue to infiltrate aluminum and magnesium atoms in solution. In the second stage, as in the first, particles of Mn3O4 begin to reduce by the effect of the thermic process, transforming it to MnO; at this stage, there is a loss of 5.4 wt % by the release of oxygen, resulting in a volume of 21.66 cm3. On Mn3O4, particulate compounds of smaller volume MnO exist in a discontinuous distribution. Because MnO has a smaller volume, its particles cannot completely cover the Mn3O4 particles, leaving free sites where it can continue to infiltrate the base alloy on the particle. In the third stage, MnO transforms to metallic manganese, which comes into solution.
As shown in Figure 6, the process is slow over the first 90 min, because smaller Mn3O4 particles begin to form on the Mn2O3 particles; subsequently, from 90 to 210 min, the process begins to accelerate, because on the Mn3O4 particles, smaller-sized MnO particles form, which results in an increase of the area of contact, and in the last few minutes, the process becomes exponential, increasing the kinetics of the reaction.
Figure 8 shows the schematic representation of the reaction mechanism that is proposed for the aluminothermic reduction process of Mn2O3.
The particle shown in Figure 9 is a sample obtained from the slag at the end of the aluminothermic reduction process of Mn2O3 to 1073 K and initial content of Mg of 4 wt %, was analyzed by the spectroscopic technique of energy dispersion in the SEM. Microassay measurements show that the Mn nucleus is surrounded by a rich phase in Mg and Al. The EDS spectra of the reaction product layer are shown in Figure 9 (b), (c). These results prove that the Mn2O3 was reduced by aluminum and magnesium as we raised in the Equation (1), forming reaction products as the spinel compound (MgAl2O4).
In the X-ray map by EDS in Figure 10, which was taken from the slag at the end of the aluminothermic reduction process at 1023 K and at initial Mg contents of 4 wt %, the metal manganese particles are surrounded by spinel, corresponding to the reaction product of Mn2O3.

4. Conclusions

A very important factor in the aluminothermic reduction is the magnesium content in the base alloy, since this element improves the wettability of aluminium on the Mn2O3 particles, which allows for a reaction between solid and liquid.
Magnesium has two main effects on the aluminothermic reduction process. The first is to decrease the surface tension of the liquid aluminium. The second effect is to be an oxidized metal reducer (Mn2O3), according to the reactions that are involved during the process.
Mn2O3 from cathodes of discharged alkaline batteries, considered toxic, can be reused as a raw material for the elaboration of Al–Mn alloys of the series 3000, by the aluminothermic reduction process.
The reduction of Mn2O3 allows for the incorporation of 0.77, 1.11, 1.25, and 1.39 wt % manganese in aluminium, for initial concentrations of magnesium of 1, 2, 3, and 4 wt %, respectively, at a temperature of 1073 K and a time of 240 min.
The initial concentration of Mg in the base alloy is crucial in the preparation of alloys of Al–Mn; the best operating conditions were with a high content of 4 wt % Mg in the initial alloy, reaching levels of dissolution of manganese of up to 1.39 wt %, a 92% level of incorporation.
The compounds of the slag identified by XRD were MgO and MgAl2O4; these compounds corroborate that Mn2O3 is reduced by aluminum and magnesium, as shown by thermodynamic reactions. On the other hand, the identification of Mn3O4 and MnO indicates that Mn goes through a series of states of lesser oxidation during the aluminothermic reduction tests.
The slag produced after the aluminothermic reduction reactions contained the expected species: Al2O3, MgO, and MgAl2O4.
When particles of Mn2O3 are introduced to the center of the liquid metal, they obey the mathematical model of chemical reaction (R1), which is adjusted correctly across the entire period of the process.
One of the most important contributions of this research is the feasibility of preparing Al–Mn alloys made from aluminum cans and cathodes of discharged alkaline batteries using the aluminothermic reduction process, which can be an alternative for the aluminum industry. At the same time, it can contribute to the use of hazardous wastes such as discharged alkaline batteries, because there is currently no good management program for these wastes.

Author Contributions

Investigation, O.F.D.; supervision J.T.T. and A.F.V.

Funding

This research was financed by foundries within the program of stimuli to the innovation 2018 of CONACYT Mexico.

Acknowledgments

The authors, as the supervisors wish to thank the program stimulus for the research from CONACYT Mexico for financial support that was provided throughout this project.

Conflicts of Interest

The author declares no conflict of interest.

References

  1. Castro, J.; Diaz, M.L. La Contaminacion por pilas y Baterias en México. Gaceta Ecologica 2004, 72, 53–70. [Google Scholar]
  2. Torres, L.G. Recuperacion de Zinc y Manganeso de Baterias Alcalinas Descargadas Utilizando Lixiviacion. Master’s Thesis, CINVESTAV Saltillo, Ramos Arizpe, Mexico, 2008. [Google Scholar]
  3. Ochoa, R.M. Utilización de Electrodos de Baterías Alcalinas Descargadas como Materia Prima para la Elaboración de Aleaciones Al-Zn-Mg y Al-Mn’. Master’s Thesis, CINVESTAV Saltillo, Ramos Arizpe, Mexico, 2009. [Google Scholar]
  4. Ochoa, R. Relación Microestructura—Propiedades Mecánicas de las Aleaciones Al-Zn-Mg-Cu y Al-Zn-Mg-Cu-1% Li Elaboradas por Reducción Aluminotérmica del Ánodo de Pilas Alcalinas Descargadas y Latas para Bebidas. Ph.D. Thesis, CINVESTAV Saltillo, Ramos Arizpe, Mexico, 2016. [Google Scholar]
  5. Luna, S.; Flores, A.; Muñiz, R.; Fernández, A.; Torres, J.; Rodriguez, N.; Ortíz, J.C.; Orozco, P. Cerium extraction by metallothermic reduction using cerium oxide powder injection. J. Rare Earths 2011, 29, 74–76. [Google Scholar] [CrossRef]
  6. Flores, A.; Ochoa, R.; Torres, J. Elaboration of alloys by aluminothermic reduction of Mn2O3, Aluminium Alloys. Mater. Today Proc. 2015, 2, 4964–4968. [Google Scholar] [CrossRef]
  7. Coudurier, L. Fundamentals of Metallurgical Processes; Pergamon Press: Oxford, UK, 1985; Volume 27, pp. 128–136. [Google Scholar]
  8. Langlais, J.; Harris, R. Strontium extraction by aluminothermic reduction. Can. Metall. Q. 1991, 31, 127–131. [Google Scholar] [CrossRef]
  9. Garcia, C.; Louis, E.; Pamies, A. Surface tension of binary and ternary aluminium alloys of the systems Al-Si-Mg and Al-Zn-Mg. J. Mater. Sci. 1992, 27, 5247–5251. [Google Scholar]
  10. Barrett, H.A.; Borkiewicz, O.; Krekeler, P.S. An investigation of zincite from spent anodic portions of alkaline batteries: An industrial mineral approach for evaluating stock material for recycling potential. J. Power Sources 2011, 508. [Google Scholar] [CrossRef]
  11. Linden, D.; Reddy, T.B. Handbook of Batteries, 3rd ed.; Mc Graw Hill: New York, NY, USA, 2002. [Google Scholar]
  12. Candan, E.; Atkinson, H.V.; Turen, Y.; Salaoru, I.; Candan, S. Wettability of Aluminum–Magnesium Alloys on Silicon Carbide Substrates. J. Am. Cerm. Soc. 2011, 94, 867–871. [Google Scholar] [CrossRef]
  13. Afshar, S.; Allaire, C. Furnaces: Improving low cement castables by non-wetting additives. JOM 2001, 24–27. [Google Scholar] [CrossRef]
  14. Cotton, A.; Wikinson, G. Química Inórganica Avanzada, 8th ed.; Limusa: México City, México, 1998; pp. 20–29. [Google Scholar]
  15. Sharpe, A.G. Química inorgánica, 3rd ed.; Reverté: Barcelona, España, 1993; pp. 275–419. [Google Scholar]
  16. Levenspiel, O. Ingeniería de las Reacciones Químicas, 3rd ed.; Limusa: México City, México, 2015; pp. 369–415. [Google Scholar]
  17. Rosenquist, T. Cinética de la Reacción en Fundamentos de Metalurgia Extractiva. Limusa, México City, México, 1987, Volume 2, pp. 127–139.
  18. Romero, M. Expresiones analíticas de los modelos cinéticos para la reducción a temperatura programada en la ecuación general de Kissinger. Minera Geología 2004, 20, 78–86. [Google Scholar]
  19. Brown, M. Handbook of Thermal Analysis and Calorimetry; Elsevier: New York, NY, USA, 1998; Volume 1, pp. 136–208. [Google Scholar]
  20. Zhong, W.M.; L’Espérance, G.L.; Suery, M. Interfacial reactions in Al-Mg (5083)/SiCp composites during fabrication and remelting. Metall. Mater. Trans. 1995, 26, 2625–2635. [Google Scholar] [CrossRef]
  21. Mcleod, A.D.; Gabryel, C.M. Kinetics of the growth of spinel, MgAl2O4, on alumina particulate in aluminum alloys containing magnesium on. Metall. Mater. Trans. A 1992, 23, 1279–1283. [Google Scholar] [CrossRef]
  22. HSC Chemistry Software, Version 6.12. Outotec, 2007. Available online: https://www.outotec.com (accessed on 9 July 2018).
Figure 1. Scheme of the induction furnace with a mechanical agitator used as experimental apparatus (1. Induction furnace, 2. Graphite paddle, 3. Mechanical agitator, and 4. Liquid aluminum).
Metals 09 00049 g001
Figure 2. X-ray diffraction (XRD) pattern of the slags obtained from experiments at constant temperature and constant agitation of the molten bath, for alloys with different initial concentrations of Mg.
Metals 09 00049 g002
Figure 3. Variation in Mn concentration as a function of the time of the addition of particles from Mn2O3 to 1073 K and 240 rpm of agitation speed, for the indicated alloys.
Metals 09 00049 g003
Figure 4. Variation in the concentration of Mg during the aluminothermic reduction of Mn2O3 to 1073 K and 240 rpm of agitation speed, for the indicated alloys.
Metals 09 00049 g004
Figure 5. Experimental values of the reacted fraction (α) versus time, and the curves corresponding to the function g (α) of the three-dimensional kinetic model of contraction R1, at a constant temperature of 1073 K, and at a constant agitation speed of 240 rpm, for the different alloys investigated.
Metals 09 00049 g005
Figure 6. Comparison of the theoretical behavior of the different manganese oxidation states with the R1 model present in the aluminothermic reduction process (a) Mn2O3, (b) Mn3O4 and (c) MnO.
Metals 09 00049 g006
Figure 7. Manganese concentration as a function of time (a) and a fraction reacted to time (b), simulating the oxidation states present in the aluminothermic reduction process (Mn2O3, Mn3O4, and MnO).
Metals 09 00049 g007
Figure 8. Schematic representation of the reaction mechanism.
Metals 09 00049 g008
Figure 9. (a) SEM micrograph of a Mn rich particle, presumably the MgAl2O4, (b) pattern of Mn particle, and (c) pattern of spinel particles.
Metals 09 00049 g009
Figure 10. X-ray maps by EDS of manganese particle (a) aluminum, (b) magnesium, (c) oxygen, and (d) manganese.
Metals 09 00049 g010
Table 1. Chemical composition of the materials used during the aluminothermic reduction of Mn2O3 powders (wt %).
MaterialsSiFeCuMnMgNiZnAl
Aluminum cans0.260.640.240.621.070.090.10Balance
Mg Scrap0.010.01--Balance-0.023.28
Table 2. Chemical composition of the alloys prepared for studying the aluminothermic reduction of Mn2O3 powders (wt %).
Alloys of AlSiFeCuMnMgNiZnAl
Alloy 10.260.640.240.621.070.090.10Balance
Alloy 20.260.630.240.622.050.090.10Balance
Alloy 30.250.620.240.603.020.090.10Balance
Alloy 40.250.620.230.594.010.090.10Balance
Table 3. Data calculated for the simulation of the quantities of Mn that would provide Mn2O3 for each addition made, according to the time of treatment.
Treatment Time (min)Aggregate Quantity A1 Mn2O3 (g)Grams Mn in Mn2O3 (β Mn2O3)Mn Dissolved in Alloy θ (wt %)Dissolved Mn Increase (wt %)Reacted Fraction (Mn2O3)Reacted Fraction by Applying the R1 Model
00.000.000.000.620.000.00
157.882.740.050.670.060.06
3015.755.480.110.730.120.13
4523.638.220.160.780.190.19
6031.5010.960.220.840.250.26
7539.3813.700.270.890.310.33
9047.2516.440.330.950.370.40
10555.1319.190.381.000.440.48
12063.0021.930.441.060.500.55
13570.8824.670.491.110.560.63
15078.7527.410.551.170.620.72
16586.6330.150.601.220.690.81
18094.5032.890.661.280.750.90
195102.3835.630.711.330.811.00
210110.2538.370.771.390.871.12
225118.1341.110.821.440.931.26
240126.0043.850.881.501.001.47
Table 4. Data calculated for the simulation of the quantities of Mn that would provide Mn3O4 for each addition made according to the time of treatment.
Treatment Time (min)Aggregate Quantity Mn3O4 (g)Grams Mn in Mn3O4 (β Mn3O4)Mn Dissolved in Alloy θ (wt %)Dissolved Mn Increase (wt %)Reacted Fraction (Mn3O4)Reacted Fraction by Applying the R1 Model
00.000.000.000.620.000.00
157.881.890.040.660.040.04
3015.753.780.080.700.090.09
4523.635.670.110.730.130.13
6031.507.560.150.770.170.18
7539.389.460.190.810.210.22
9047.2511.350.230.850.260.27
10555.1313.240.260.880.300.32
12063.0015.130.300.920.340.37
13570.8817.020.340.960.390.42
15078.7518.910.381.000.430.47
16586.6320.800.421.040.470.52
18094.5022.690.451.070.520.57
195102.3824.580.491.110.560.63
210110.2526.470.531.150.600.69
225118.1328.370.571.190.640.75
240126.0030.260.611.230.690.81
Table 5. Data calculated for the simulation of the quantities of Mn that would provide MnO for each addition made, according to the time of treatment.
Treatment Time (min)Aggregate Quantity MnO (g)Grams Mn in MnO (β MnO)Mn Dissolved in Alloy θ (wt %)Dissolved Mn Increase (wt %)Reacted Fraction (MnO)Reacted Fraction by Applying the R1 Model
00.000.000.000.620.000.00
157.886.100.120.740.140.14
3015.7512.200.240.860.280.29
4523.6318.300.370.990.420.45
6031.5024.400.491.110.550.63
7539.3830.500.611.230.690.82
9047.2536.600.731.350.831.04
10555.1342.700.851.470.971.36

