Article

Phase Field Simulations of Microstructure Evolution in IN718 Using a Surrogate Ni–Fe–Nb Alloy during Laser Powder Bed Fusion †

by
Balasubramaniam Radhakrishnan
1,
Sarma B. Gorti
1,
John A. Turner
1,
Ranadip Acharya
2,
John A. Sharon
2,
Alexander Staroselsky
2,* and
Tahany El-Wardany
2
1
Computational Engineering & Energy Sciences Group, Oak Ridge National Laboratory, 1 Bethel Valley Rd, Oak Ridge, TN 37830, USA
2
Physical Sciences Department, United Technologies Research Center, 411 Silver Ln, East Hartford, CT 06118, USA
*
Author to whom correspondence should be addressed.
This manuscript has been authored by UT-Battelle, LLC under Contract No. DE-AC05-00OR22725 with the U.S. Department of Energy. The United States Government retains and the publisher, by accepting the article for publication, acknowledges that the United States Government retains a non-exclusive, paid-up, irrevocable, world-wide license to publish or reproduce the published form of this manuscript, or allow others to do so, for United States Government purposes. The Department of Energy will provide public access to these results of federally sponsored research in accordance with the DOE Public Access Plan (http://energy.gov/downloads/doe-public-access-plan).
Metals 2019, 9(1), 14; https://doi.org/10.3390/met9010014
Submission received: 6 November 2018 / Revised: 9 December 2018 / Accepted: 19 December 2018 / Published: 21 December 2018

Abstract

:
The solidification microstructure in IN718 during additive manufacturing was modeled using phase field simulations. The novelty of the research includes the use of a surrogate Ni–Fe–Nb alloy that has the same equilibrium solidification range as IN718 as the model system for phase field simulations, the integration of the model alloy thermodynamics with the phase field simulations, and the use of high-performance computing tools to perform the simulations with a high enough spatial resolution for realistically capturing the dendrite morphology and the level of microsegregation seen under additive manufacturing conditions. Heat transfer and fluid flow models were used to compute the steady state temperature gradient and an average value of the solid-liquid (s-l) interface velocity that were used as input for the phase field simulations. The simulations show that the solidification morphology is sensitive to the spacing between the columnar structures. Spacing narrower than a critical value results in continued growth of a columnar microstructure, while above a critical value the columnar structure evolves into a columnar dendritic structure through the formation of secondary arms. These results are discussed in terms of the existing columnar to dendritic transition (CDT) theories. The measured interdendritic Nb concentration, the primary and secondary arm spacing is in reasonable agreement with experimental measurements performed on the nickel-base superalloy IN718.

Graphical Abstract

1. Introduction

Additive manufacturing (AM) process, where a complex, three-dimensional component is built layer-by-layer, offers significant potential for design breakthroughs, as well as permits agile manufacturing of custom designs. In a class of AM processes, each layer is built by repeated melting and solidification of a powder bed using moving heat sources based on electron beam or laser. Part of the previously solidified layer is re-melted during a subsequent pass. The solidification microstructure that develops during the process is influenced both by the thermal history as well as the underlying structure in the previously solidified layer. The characteristics of the solidification microstructure including primary and secondary dendrite arms spacing, solute distribution within the dendrites and the dendrite orientations have a direct bearing on the mechanical properties of the as-processed component. Also, during post-processing heat treatment, evolution of the microstructure depends on the primary solidification structure due to potential solid-state transformations. Therefore, it is important to quantitatively predict the solidification microstructure in a given alloy, under a given set of processing parameters. An excellent review of the processing-structure relationships during AM of structural alloys is available in a recent publication [1].
A key feature of the powder bed fusion processes is the extremely high cooling rate experienced by the melt pool. Typical cooling rates are of the order of 106 K/s. Under extreme conditions, the velocity of the solid-liquid (s-l) interface can approach several meters per second, especially along the heat source travel direction. This could cause significant deviation from thermodynamic equilibrium at the moving s-l interface. Non-equilibrium solute-partitioning could lead to a reduction in the solute segregation in the inter-dendritic space. Another important consequence of reduced partitioning of solute to the liquid is the reduction in the extent of constitutional undercooling in the liquid. This can potentially alter the solidification morphology. For an extreme condition where solidification occurs with no solute partitioning, the planar interface is stabilized. The solidification morphology depends on the prevailing ratio of the local temperature gradient at the s-l interface, G, and the local solidification velocity, R. For G/R higher than a critical alloy-specific value, a plane front is stabilized. As the G/R ratio is reduced either through smaller G or higher R, the plane front is no longer stable, and it breaks down into a columnar structure. The columnar structure can be either fully cellular or under certain conditions it can transition into a columnar dendritic structure. The columnar cell to columnar dendrite transition (CDT) during solidification leads to distinctly different segregation pattern for solute elements that strongly partition to the liquid during solidification. This may result in a significant change in the spatial distribution and size scale of secondary phase precipitation in the alloy. Modeling the thermal conditions within the melt pool during AM processes has been the subject of recent research [2,3,4,5]. The standard approach is to solve energy diffusion coupled with the external term from a moving heat source and including the latent heat of solidification. The fluid flow due to Marangoni convection affects the distribution of G and R within the solidifying mushy zone and could be accounted for. Recently, the predicted G/R values along with a process map for IN718 have been used to analytically predict the transition from a columnar to equiaxed microstructure during AM conditions [6].
The phase-field method has been established as a standard technique for simulating the solidification microstructures in metallic alloys during casting processes although the application of the method to rapid solidification occurring under AM conditions has been limited. A brief review of the recent effort in this area is presented below.
Keller et al. [4] recently performed phase field simulations of a binary Ni–Nb alloy driven by the steady-state thermal conditions. The thermal conditions were obtained by simulating the laser powder bed fusion (LPBF) process using a finite-element heat transfer model ignoring fluid flow. The simulations showed the formation of a cellular structure; however, the experimentally obtained microstructure showed the presence of columnar dendrites. Acharya et al. [5] performed a thermal analysis of the LPBF process using computational fluid dynamics to predict the melt pool thermal conditions for a linear laser track on a pre-placed powder bed of IN718. The time-dependent thermal fluxes have been used to simulate the solidification microstructure using a two-dimensional phase field formulation implemented in COMSOL multi-physics solver (Released version 5.2, COMSOL Inc., Burlington, MA, USA). These simulations showed the formation of a columnar dendritic microstructure in a model binary alloy that was used as a surrogate to the multi-component Ni-based alloy IN718. Phase field simulations with G and R values similar to the ones used in powder-based additive manufacturing have been used as input to simulate the solidification microstructures under directional solidification conditions. Wu and Zhang [7] performed simulations of the solidification microstructure of Ti–6Al–4V alloy assuming it to be a pseudo-binary of Ti with 10% solute for which a linear liquidus slope was specified along with a solidus and liquidus temperature. The 2D simulations showed the formation of a columnar structure after the breakdown of a planar morphology under the given values of G and R. The main disadvantage of the phase field model used was that it was not integrated with the thermodynamics of the ternary alloy. Roehling et al. [8] simulated the solidification microstructure of a binary Ti–Nb alloy during rapid solidification conditions encountered during laser track melting of initially arc-melted beads. The phase field simulations based on the AMPE code allowed direct integration of the alloy thermodynamics with the solidification model. The phase field model used within AMPE was based on the formulation by Kim et al. [9] that we have chosen as the basis of the phase field modeling effort presented in this research. The simulations closely captured the experimentally measured intercellular spacing and the non-equilibrium partitioning of Nb in the intercellular regions. Coupling of the phase field simulations with thermodynamics of multi-component alloys has also been carried out using the multi-phase field model developed by Steinbach et al. [10].
In the phase field approach, a diffuse interface models the boundary between two evolving phases. The solute diffusion and the kinetics of interface motion are coupled using a set of thermodynamic and kinetic assumptions. Extensive reviews of the method and its application to simulating microstructure evolution during thermal processing of metallic alloys are available in the literature [11,12,13]. In this paper, we report phase field simulations for the solidification of a surrogate Ni–Fe–Nb system that mimics the solidification range of IN718 alloy. The computational fluid dynamics (CFD) simulation was used to obtain a steady state temperature gradient and mean solidification velocity using a small representative volume, and these inputs are used to drive the phase field simulation. The thermodynamics of the Ni–Fe–Nb alloy was fully integrated with the phase field simulations. The excess Gibbs free-energies for the liquid and the solid phases as a function of temperature were obtained using the CALPHAD approach, which permitted computing the concentration of Fe and Nb in liquid and solid. The microstructural parameters such as primary dendrite arm spacing (PDAS), secondary dendrite arm spacing (SDAS) along with segregation profiles obtained from the simulation are compared with experimental findings. The key features of the phase field simulations presented here include (1) the inclusion of an anti-trapping term to eliminate spurious solute trapping effects expected at high s-l interface velocities, (2) the superimposition of a noise term in the order parameter that facilitates the formation of side-arms during solidification in the dendritic mode, and (3) the use of high performance computing capabilities to perform simulations in large domains with high spatial resolution. The simulations can capture the key morphological features of the solidification microstructure, including primary and secondary dendrite arm spacing (PDAS and SDAS) and the extent of microsegregation that are in reasonable agreement with those measured in LPBF experiments performed using the nickel base alloy 718. The paper is organized as follows:
In Section 2, we describe the computational approach that includes the thermal modeling of the heat source and material interaction, and description of the phase field modeling along with description of surrogate Ni–Fe–Nb alloy. Section 3 presents the LPBF experiments and results obtained from the experiments; Section 4 presents a description of the numerical analysis performed, followed by the results from the numerical simulation. Finally, the paper is closed with a discussion of the results in Section 5 and concluding remarks in Section 6.

2. Computational Approach

2.1. Heat and Fluid Flow

Details of the computational fluid dynamics (CFD) modeling about the relevant initial and boundary conditions for phase field modeling have been described elsewhere [5]. In this section, the basic steps of model formulations are provided to describe different aspects of the single bead depositions of IN718 using the LPBF process. The deposition step is initialized with localized laser melting of the powder and partial re-melting of the substrate in order to obtain a strong bond. The primary interest of doing the CFD analysis is to obtain the temperature field as the function of time, temperature gradients at the boundaries for representative volumes and to compute the solidification time required for the representative volume elements to go from liquidus temperature to solidus temperature. These results are then used as initial parameters and boundary conditions for phase field simulation. Finite-volume based CFD has been employed to accurately estimate the temperature field. Commercial software ANSYS CFX (Released version 16.0, ANSYS Inc., Canonsburg, PA, USA) has been used and “Volume-of-fluid” (VoF) or Free Surface approach is adopted to track the melt pool top surface. This essentially allows capturing the top surface of the melt pool in addition to the prediction of melt pool width and depth. Additionally, the effect of Bernard-Marangoni convection is modeled by using surface tension coefficient as a function of temperature. The surface tension coefficient of IN718 reduces with temperature, providing higher shear stress near the edges of the melt pool, thus extending the melt pool laterally and making it shallower. At the adjacent solidified region, the liquid velocity ceases to exist. To account for this effect, Darcy-like momentum sink model is used. During the LPBF experiment, the laser heat source was focused at the powder-substrate interface to permit better wetting for the powder and to avoid balling. In order to replicate that, volumetric heat source model has been utilized to simulate the laser heat source [14]. Laser beam energy distribution is assumed to be a Gaussian bell in scan (x) and transverse (y) directions, with exponential decays in depth direction (z) for both powder layer and substrate depth.
The average value of the temperature gradient in the mushy zone is evaluated with time to find the steady state zone where the temperature gradient stops changing temporally as the laser heat source is traversed further. The experimental cross-sections are always cut at this steady regime. While the CFD solution is done on single bead scan for a longer length, a representative cubic volume element of 20 μm3 is then analyzed to evaluate the average temperature gradient (G) in vertical (z) direction as it passes from melt pool to mushy zone and finally to solidified region. The solidification period is computed based on the time taken for the volume averaged temperature of the representative volume element to drop from liquidus temperature to solidus temperature. Table 1 provides the G and solidification period for the representative element for the two experimental data points chosen.
In the present work, we use the steady-state temperature gradient, G, and the steady-state cooling rate, GR, to drive the phase field simulations. The steady-state s-l interface velocity R is calculated from the thermal gradient and the cooling rate provided in Table 1.

2.2. Phase Field Theory

In general, the phase field method involves simulating the movement of diffuse phase interfaces in a given alloy system driven by relevant chemical driving forces and interfacial energies. The decrease in the total energy of the system due to interface motion is simulated by solving a set of partial differential equations that evolve the (1) non-conserved order parameter that represents the relative amounts of the evolving phases (Allen-Cahn or time-dependent Ginzburg-Landau equation) and (2) conserved variable such as species concentrations (Cahn-Hilliard equation). The phase field simulations in this research involved a coupled solution to the above equations using MEUMAPPS (Microstructural Evolution Using Massively Parallel Phase Field Simulations) a code that is being developed at Oak Ridge National Laboratory (ORNL) through the Exascale Computing Project, ExaAM. The simulation approach used in MEUMAPPS is described below.
The phase field approach used in this research is based on the formulation proposed by Kim [15], which is an extension of the earlier approach proposed by Kim et al. for binary alloys [9] to multicomponent alloys. In these models, the diffuse interface between two phases is assumed to consist of mixtures of the two phases with different compositions that have the same chemical potential. In the current work, the enforcement of the equal chemical potential was obtained using Calphad based expressions for the free energies of the solid and liquid phases instead of making use of ideal or regular or dilute solution approximations such as those used in the original model development. In the current work, phase field models described in [9] and [15] were chosen because of our previous experience in using the model for solid-state transformations in Ti–6Al–4V alloy with thermodynamic input from Calphad based free-energy models [16]. An anti-trapping flux term in the concentration evolution equation has been included to eliminate solute-trapping that occurs due to non-equilibrium effects at the s-l interface at high solidification velocities. An additional feature of the phase field simulations is the inclusion of a random noise that is superimposed on the order parameter.
The free energy density f is typically written in terms of the bulk free energy density of the solid and liquid phases using the interpolation function h p ( ϕ ) as,
f = h p ( ϕ ) G s ( c 1 S , c 2 S , , c n S , T ) + [ 1 h p ( ϕ ) ] G L ( c 1 L , c 2 L , , c n L ,   T ) + W g ( ϕ )
where, c i S and c i L , i = 1, n are the concentrations of species i = 1, n in the solid and liquid phases. The last term in the above equation models the energy barrier associated with the interface between the solid and liquid phases, given by height W , and double-well potential g ( ϕ ) , written as
f g ( ϕ ) = ϕ 2 ( 1 ϕ ) 2
Several interpolation functions h p ( ϕ ) , are used in the phase field literature for representing the Gibbs free energy of a mixture of solid and liquid phases. In this research h p ( ϕ ) is assumed to be equal to
h p ( ϕ ) = ϕ 3 ( 6 ϕ 2 15 ϕ + 10.0 )
The evolution equation for the phase field variable ϕ , is based on the Ginzburg-Landau equation given by,
ϕ t = M ( · f g r a d ( ϕ ) f ϕ ) + ξ
where, M is the phase field mobility and
f g r a d = σ 2 2 | ϕ | 2
σ 2 is the orientation dependent gradient energy coefficient that introduces an energy penalty for the presence of gradients in the order parameter. Since the s-l interface varies with the spatial orientation of the interface, σ = σ ( ϕ ) = σ ( n x , n y , n z ) where n x , n y ,   and   n z are the direction cosines of the local normal to the interface. The phase field parameters σ and W are related to the s-l interfacial energy, γ and the width of the diffuse interface, λ used in the simulations. In the case of the double well potential shown in Equation (2), the relationships between the phase field and real interfacial parameters are given by [13],
σ 2 = γ λ
and
W = 18 γ λ
The anisotropy in the s-l interfacial energy is given by
γ ( x , y , z ) = γ ˜ ( 1 3 δ ) [ 1 + 4 δ 1 3 δ { ( n x ) 4 + ( n y ) 4 + ( n z ) 4 } ]
In the above expression, δ is the strength of the anisotropy, γ is the orientation dependent s-l interfacial energy, γ ˜ is the average value of γ . The components of the vector n are given by the rotation matrix that transforms the interface normal vector n given in the global coordinate system to a local coordinate system that is associated with the orientation of that particular dendrite. Thus
n x = r 11 n x + r 12 n y + r 13 n z n y = r 21 n x + r 22 n y + r 23 n z n z = r 31 n x + r 32 n y + r 33 n z
With, n x = ϕ x ϕ ,   n y = ϕ y ϕ ,   n z = ϕ z ϕ
The derivative of the free energy density with respect to ϕ is given by
f ϕ = h p ( ϕ ) { [ G S G L ] + G S c 1 S ( c 1 L c 1 S ) + G S c 2 S ( c 2 L c 2 S ) } + W g ( ϕ )
In the above equation, h p ( ϕ ) ,   g ( ϕ ) are the derivatives of h p ( ϕ ) and g ( ϕ ) with respect to ϕ .
Using the above expressions, it can be shown that the evolution equation for ϕ can be written as,
ϕ t = M ( σ 2 · ϕ + σ 2 2 ϕ + · { | ϕ | 2 σ σ ( ϕ ) } f ϕ ) + ξ
With,
· { | ϕ | 2 σ σ ( ϕ ) } =
x [ σ | ϕ | { σ n x ( r 11 n x n x ) + σ n y ( r 21 n x n y ) + σ n z ( r 31 n x n z ) } ] +
y [ σ | ϕ | { σ n x ( r 12 n y n x ) + σ n y ( r 22 n y n y ) + σ n z ( r 32 n y n z ) } ] +
z [ σ | ϕ | { σ n x ( r 13 n z n x ) + σ n y ( r 23 n z n y ) + σ n z ( r 33 n z n z ) } ]
In Equation (11), M is the phase field mobility and ξ is the random noise rate that is added at every time step to the order parameter at every site. The noise is introduced using a Gaussian form with amplitudes ranging from d ϕ to + d ϕ with a mean of d ϕ = 0 . The magnitude of the noise term used in the simulations ( | d ϕ | ~ 10−6) was very small compared to the value of the order parameter in the vicinity of the s-l interface. The noise term was added to all sites with ϕ < 0.5. M is calculated using the procedure outlined in [15]. Assuming that the thin-interface limit condition is satisfied, and that local equilibrium is maintained at the s-l interface, the phase field mobility M is given by
M = W 3 σ 2 a 2 ζ
where a2 = 0.7833 (for a description of a2 please refer to Ref. [15]) for the assumption of a double well potential (Equation (2)), ζ is inversely proportional to the diffusion coefficient in the liquid, and directly proportional to the second derivative of the free energy of the liquid with respect to the solutes. The derivation of the solute evolution equation given below is based on the assumption that (1) the diffusivity of the solutes in the solid is very small compared to those in the liquid, and (2) the thin-interface limit criterion, D i L V λ , where D i L is the diffusivity of the ith solute in the liquid, V is the interface velocity and λ is the interface width, is satisfied. The random noise term is used in the code (1) to destabilize and initially flat s-l interface at the beginning of the solidification due to the prevailing G and R, and (2) to facilitate the development of dendritic side-arms. The evolution equation for the concentration of species i is written as [15]
c i t = · [ h d ( ϕ ) D i S c i S + { 1 h d ( ϕ ) } D i L c i L ] + · α i ϕ t ϕ ϕ
where D i S is the diffusivity of species i in the solid, D i L is the diffusivity of species i in the liquid, and h d ( ϕ ) is an interpolation function, taken to be equal to ϕ , the phase field order parameter that differentiates the solid ( ϕ = 1 ) and liquid ( ϕ = 0 ) phases. The form of the interpolation function h d ( ϕ ) is tied to a symmetry requirement that must be imposed in order to eliminate anomalous interface effects, such as interface diffusion and interface stretching that give rise to solute trapping effects [15]. The last term on the right-hand side of Equation (14) is the anti-trapping flux term where α i is given by
α i = ε 2 W ( C i L C i S )
and ε is the square root of the gradient energy coefficient, and W is the height of the energy barrier associated with the s-l interface.
The species concentration at any location for species i is given by
c i = h r ( ϕ ) c i S + [ 1 h r ( ϕ ) ] c i L
Equation (15) assumes that the interpolation function h r ( ϕ ) is also given by ϕ . Following the Kim-Kim-Suzuki (KKS) approach [9], it is assumed that the chemical potential for each species is the same in the solid and liquid phases, so that for each species i
G S c i S = G L c i L
The concentrations c i S and c i L in Equation (16) are the solute concentrations at the diffuse interface. Equations (16) and (17) yield a set of 4 equations for a ternary alloy with two types of solutes. These equations are solved using a Newton-Raphson technique.
The equations above are for a full three-dimensional (3D) dendrite/cellular growth with arbitrary orientations. However, the equations can be reduced to 2D form by setting gradients in the third direction to zero. The diffusion equation (Equation (14)) and the final form of the phase-field equation that incorporates the anisotropic interfacial energy and the crystal orientation (Equations (11) and (12)) are solved using an explicit finite difference approach. Since phase field simulations at the length scale and spatial resolution shown in this research are computationally intensive, the numerical solutions were performed using an XC30 supercomputer (Cray Inc., Seattle, WA, USA) at ORNL using MPI (Message Passing Interface) commands to communicate data between subdomains assigned to each CPU in the multi-processor machine.

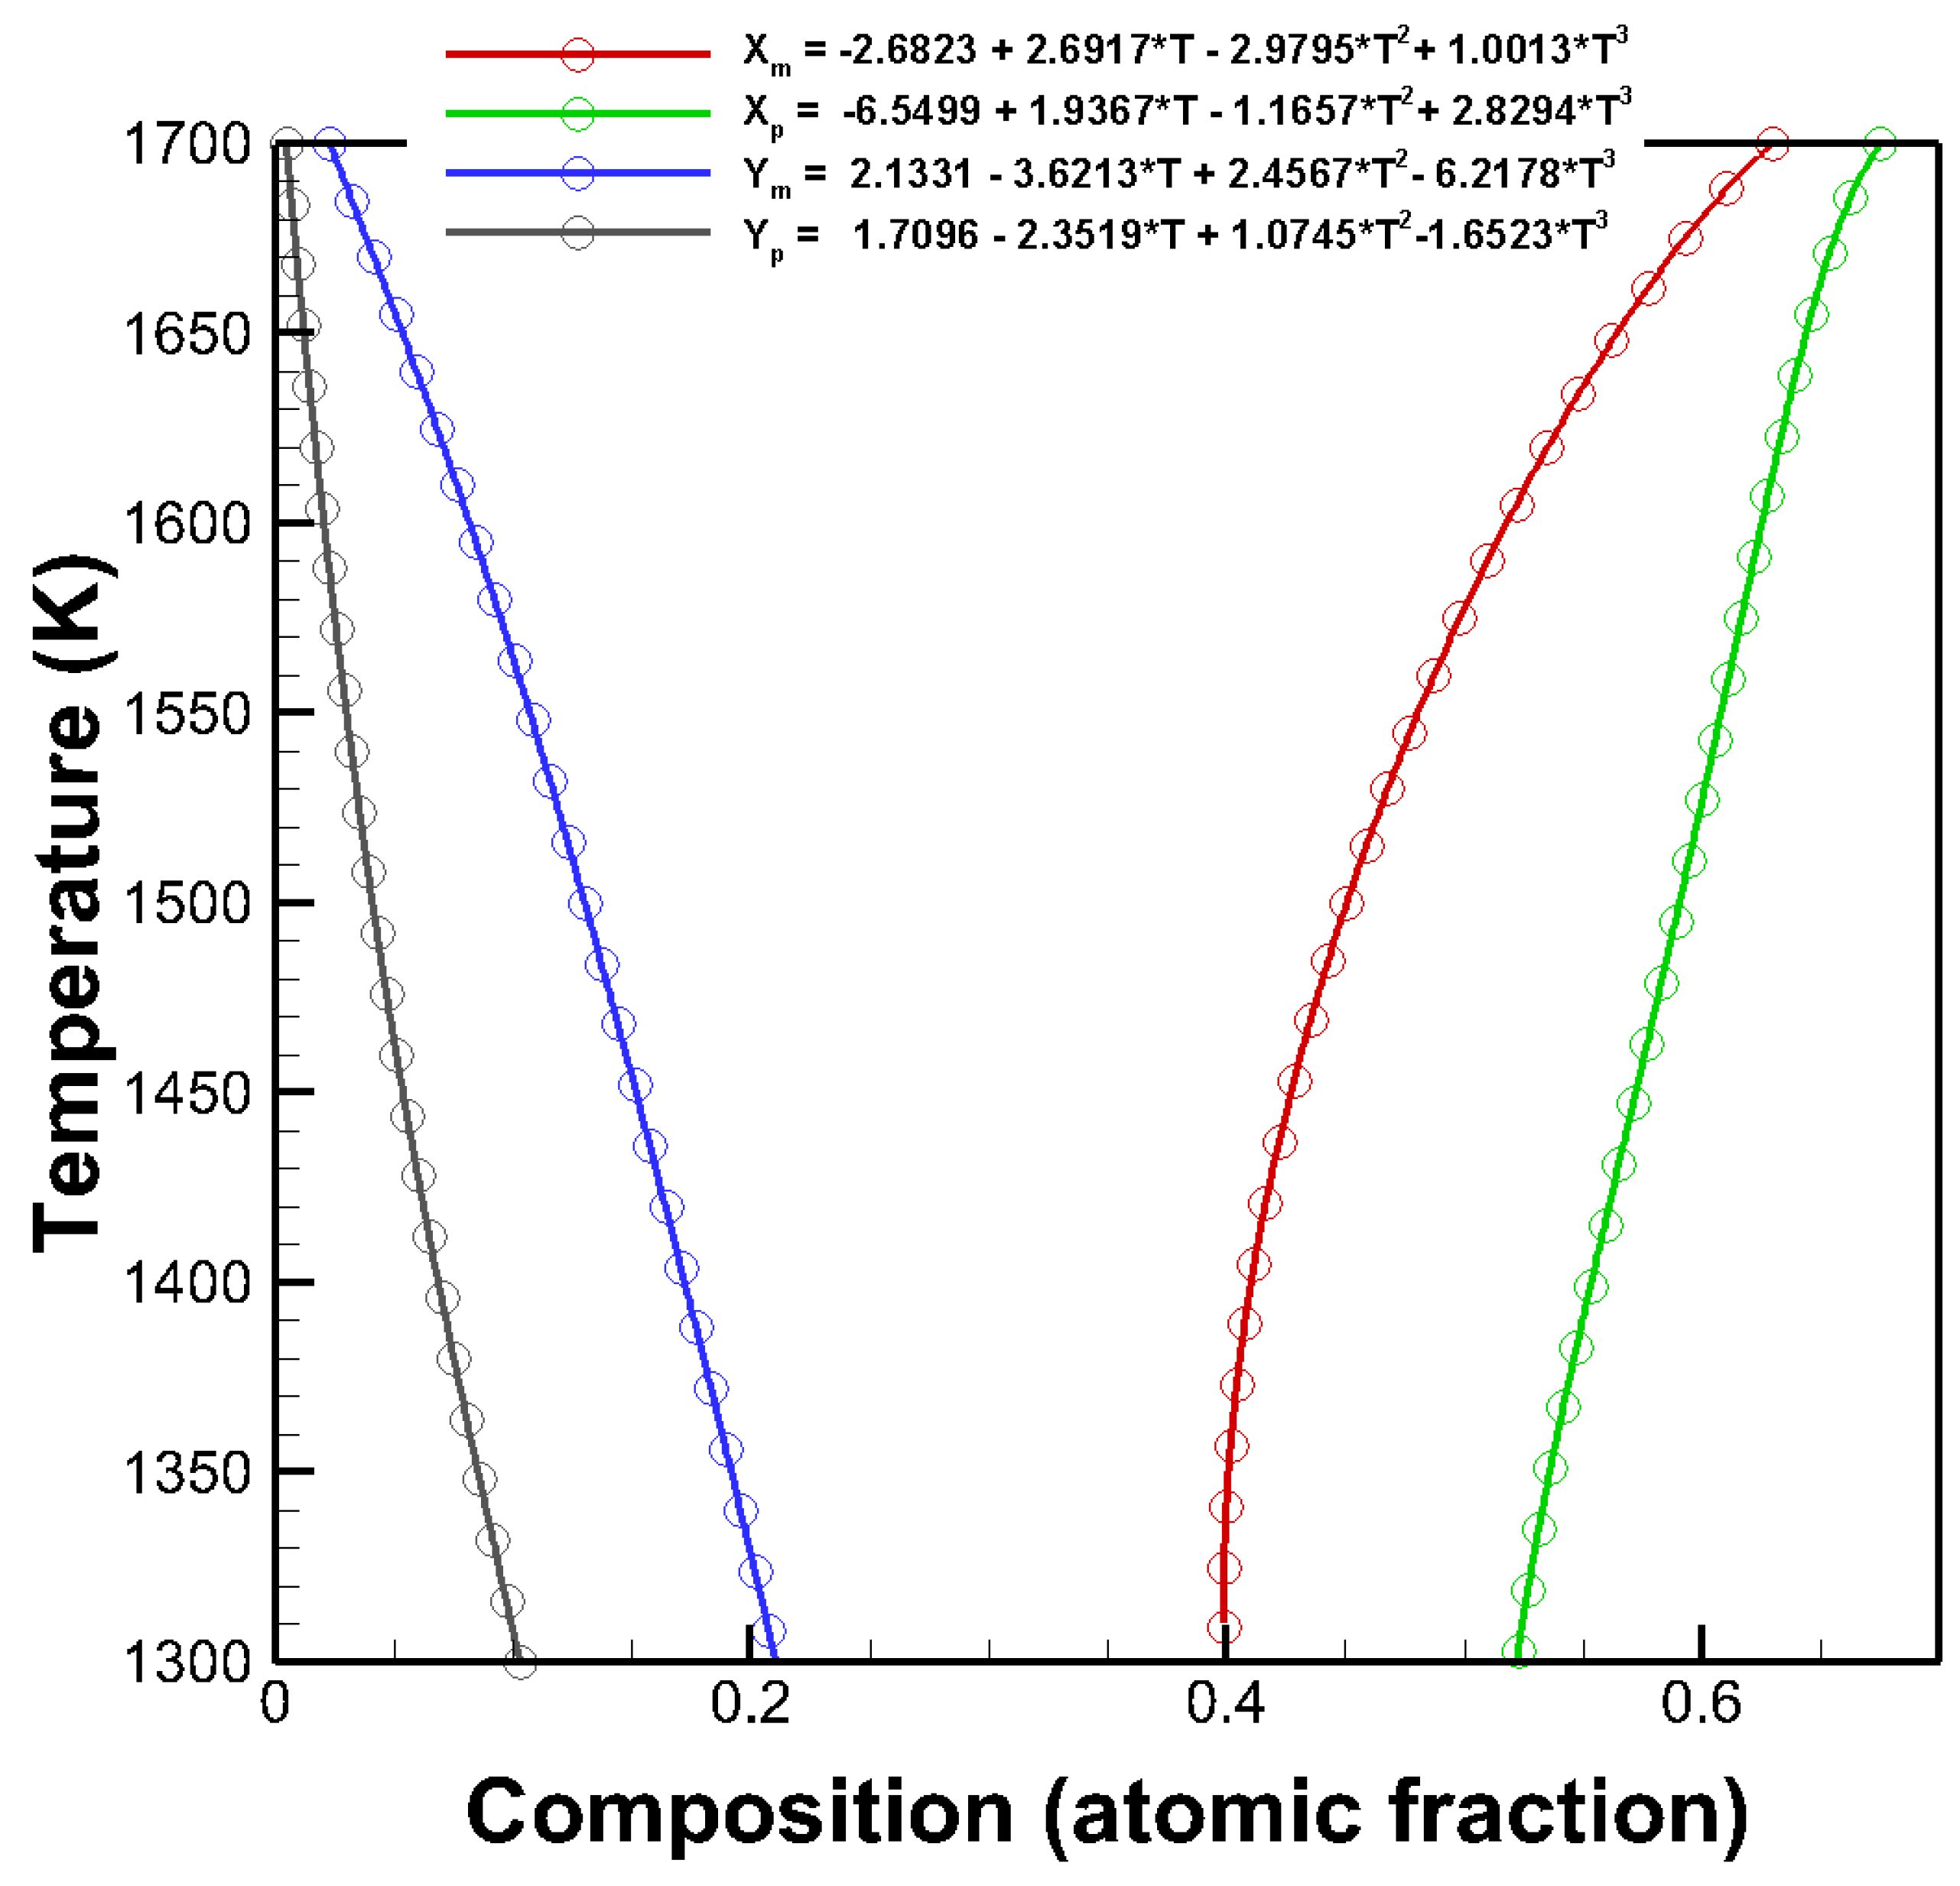
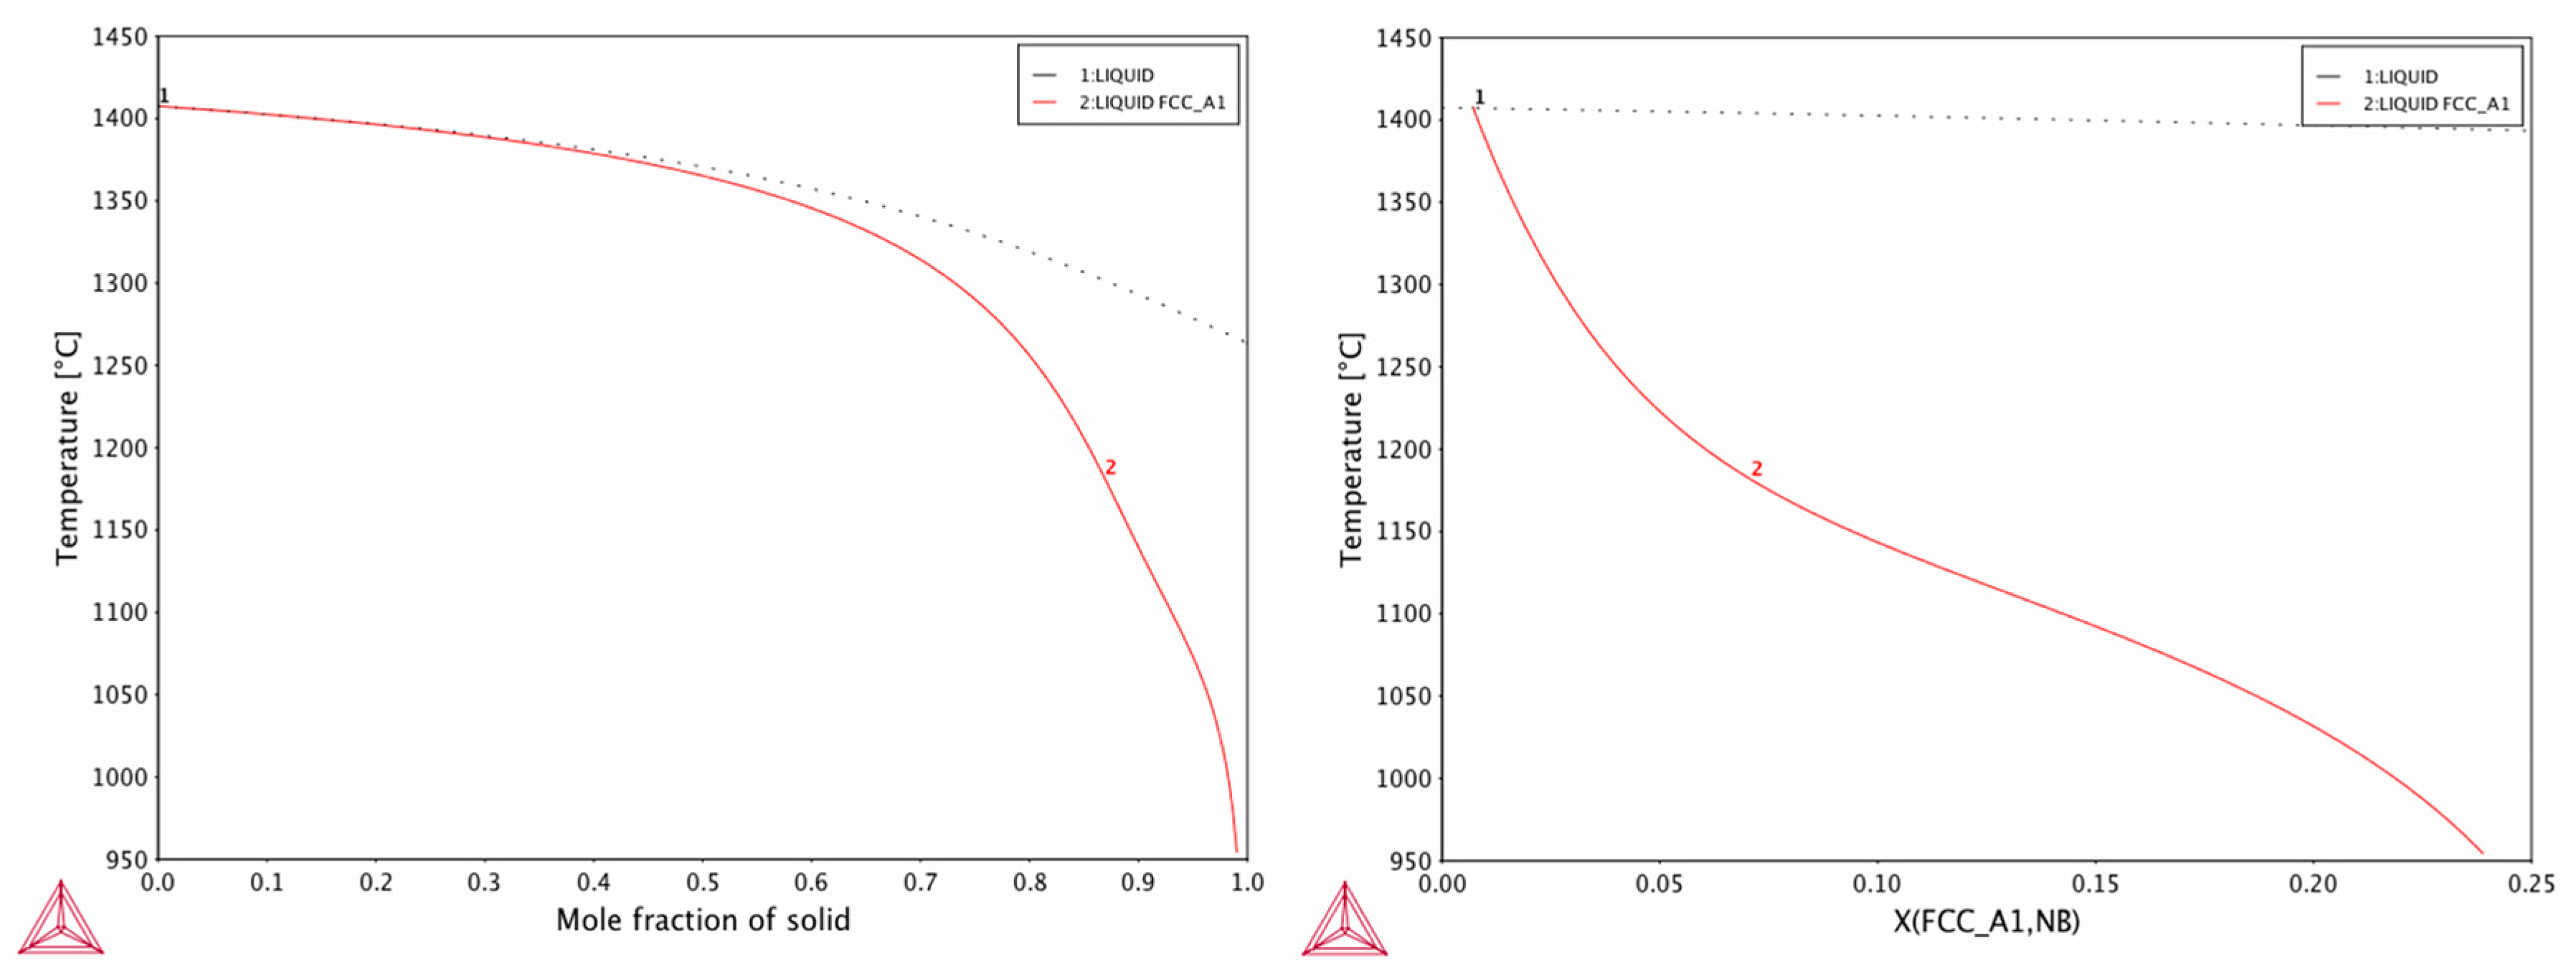
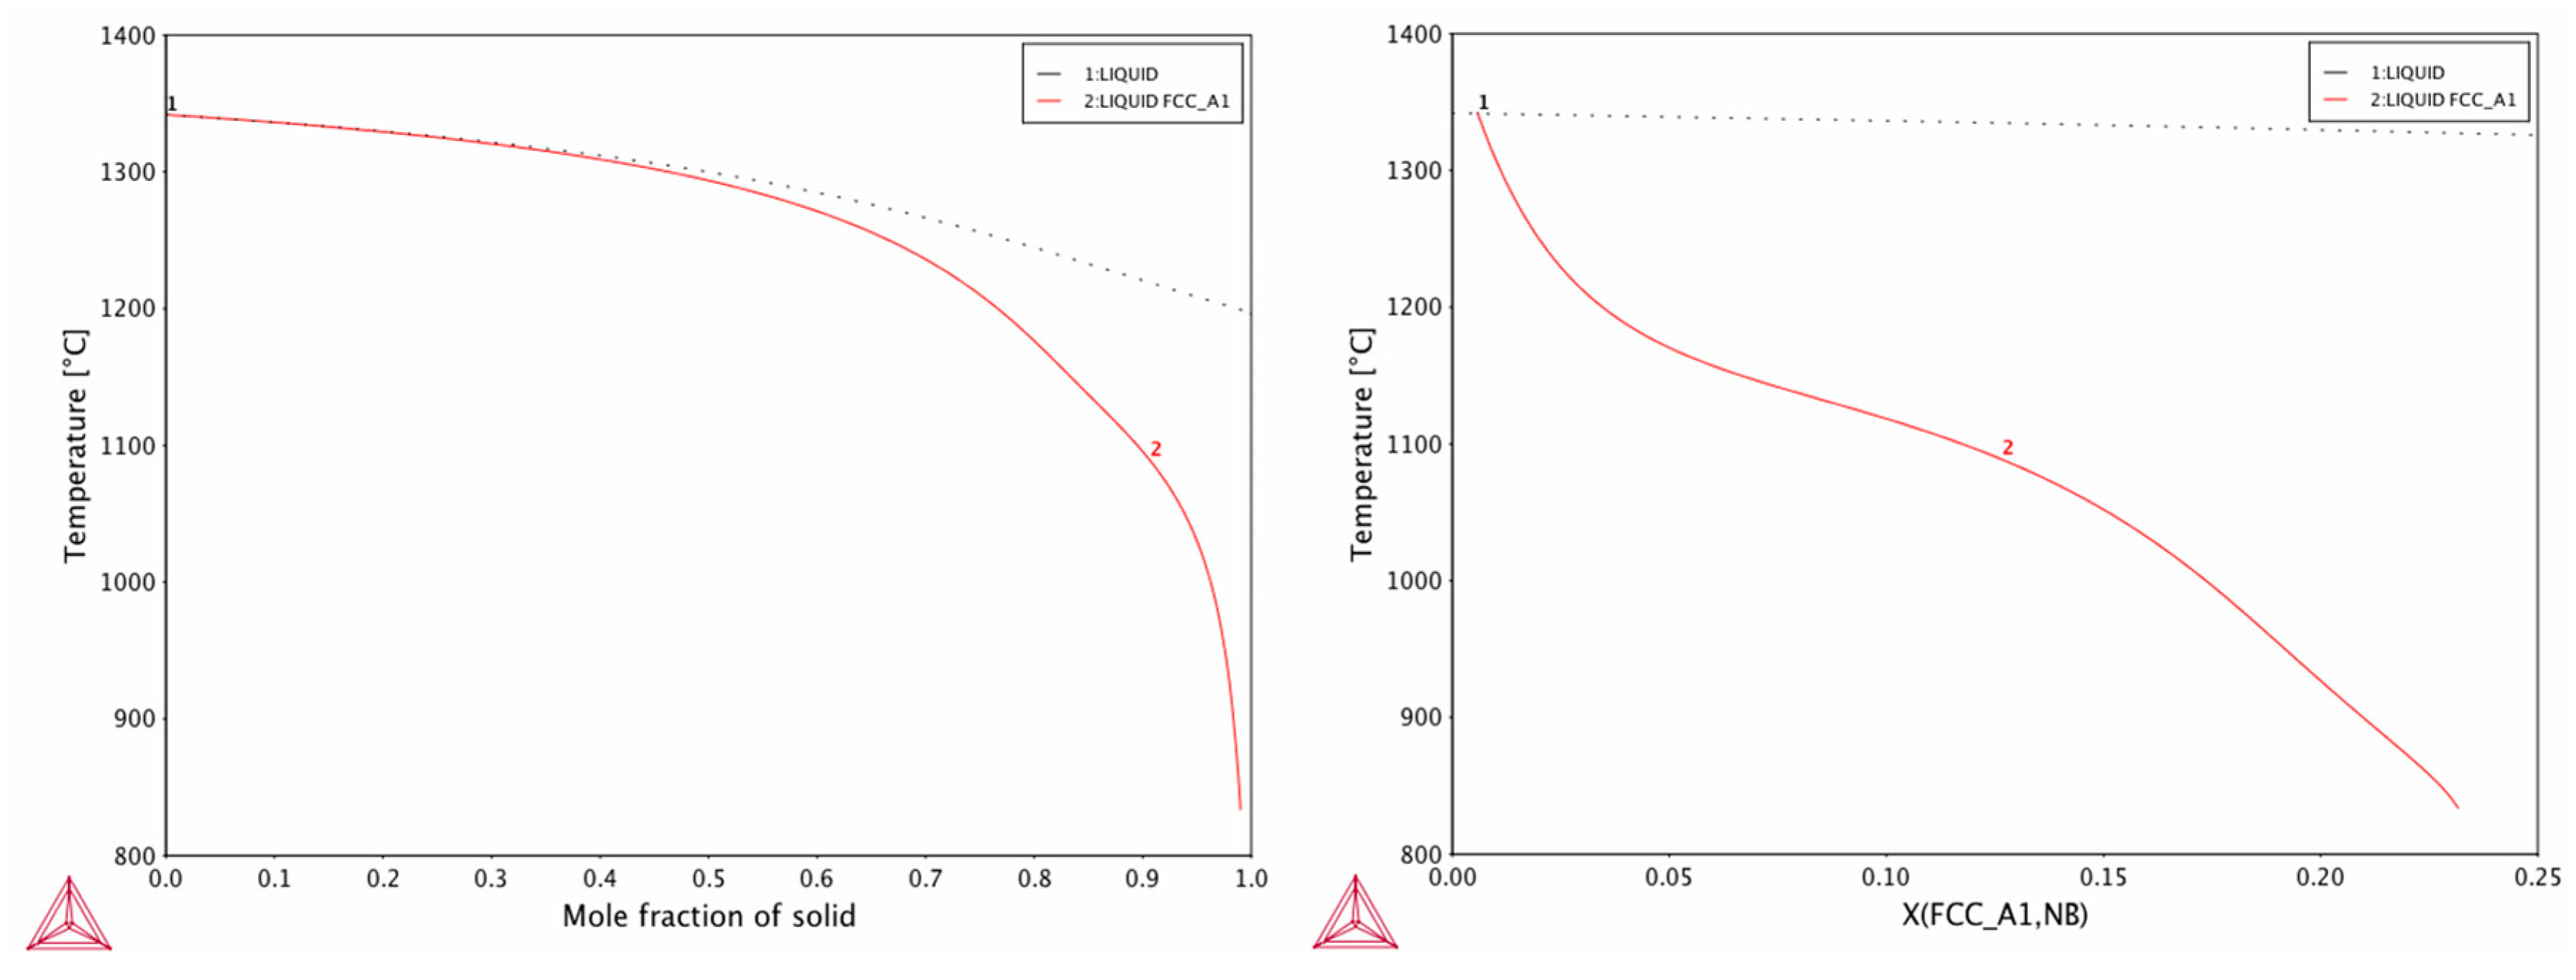
2.3. Surrogate Alloy and CALPHAD Integration

The phase field approach described above was used to simulate the solidification microstructures obtained for single track laser depositions made on an additively manufactured IN718 base plate. Since IN718 is a complex, multicomponent system for which the Gibbs free energy functions for the solid and liquid phases are complex functions of the components of the alloy, it was decided to use a model ternary alloy composed of Ni, Fe, and Nb. The equilibrium solidification range is an important characteristic that influences the extent of constitutional undercooling during solidification, and hence, the columnar to dendritic transition during directional solidification. Therefore, matching the equilibrium solidification range was considered as the most important criterion in deciding the composition of the model Ni–Fe–Nb alloy. The solidification temperature range for a nominal 718 alloy consisting of main alloying elements Ni–Cr–Fe–Mo–Nb were calculated using Thermocalc [17] and the TCFE9 databsase within the range of the nominal composition limits of these alloying elements. The solidification range varied from 145K to 133K. The Nb content of the ternary alloy was kept at 5.5 wt% (3.5 at. %), within the range of Nb content in IN718 (The compositions are subsequently represented in the simulations as atom fractions). The Fe content was adjusted such that the equilibrium solidification range for the ternary alloy was close to that of IN718. With a composition of Ni–0.60Fe–0.035Nb (concentrations in atom fraction), a solidification range of 137K was obtained. The Ni–0.6Fe–0.035Nb ternary alloy was used in all the phase field simulations performed in this research.
The excess Gibbs free-energies for the liquid and the solid phases as a function of temperature used in the above thermodynamic equilibrium calculations were obtained using the CALPHAD approach in the form of Redlich-Kister polynomials [18] that contain the binary and ternary interaction coefficients for Nb, Ni, and Fe in the ternary system. The equilibrium interface Nb and Fe concentrations obtained using the Gibbs energy functions are fitted to polynomials as shown in Figure 1. These polynomial expressions are used as initial approximations in the calculation of interface concentrations c i S and c i L in the KKS approach (Equations (16) and (17)), and are described in Appendix A. The use of CALPHAD based equilibrium concentrations in phase field simulations assumes that deviation from thermodynamic equilibrium at the moving s-l interface is negligible at interface velocities ≤0.1 m/s used in this study. The assumption is reasonable based on the experimental measurements made on alloy 718 samples obtained by LPBF technique reported in Section 3 and the concept of non-equilibrium partitioning at moving s-l interfaces described in Section 5.

3. Experimental Approach

These LPBF experiments were performed with an EOS M280 (EOS GmbH Electro Optical Systems; Munich, Germany) LPBF unit that was fed with IN718 powder. The test results analyzed in this paper are obtained from single track specimen deposited on top of an additively constructed base pad. Two single track specimens were considered; the parameters are listed in Table 2.
After deposition, the build articles were sectioned, mounted, and polished for metallography.
Transverse cross sections of the single-track specimens were imaged using a Helios Nanolab 600 dual beam microscope (FEI; Hillsboro, OR, USA). The gallium ion beam was employed to local etch the surface of the coupon to better discern dendrites. The composition was probed using an X-MaxN 80 Energy Dispersive Spectroscopy (EDS) unit (Oxford Instruments; Concord, MA, USA). Figure 2a presents the transverse cross section of the sample deposited at 285 W power and 960 mm/s scan speed. Figure 2b highlights the region of analysis and 2c shows a few representative dendrite measurements. The results of the analysis for primary dendrite arm spacing (PDAS) and secondary dendrite arm spacing (SDAS) are listed in Table 2 along with the parameters. The standard deviation is on the high side, but this is likely because only a limited number of dendrites were sampled. Sample 1 data were made from 13 primary arm measurements and 11 secondary arm measurements. Sample 2 data were made from 11 primary arm measurements and 4 secondary arm measurements. Detailed dendrite characterization was not the focus of this effort and more thorough measurements to obtain better statistics is reserved for a follow up study.
Figure 3 shows the segregation profile for Ni and Nb across primary and secondary arms for sample 1. For line scans across primary arms, the Nb composition varies from ~4.0 wt.% at dendrite core to 8.0–9.0 wt.% at the interdendritic region. Scans across secondary arms suggest Nb content varies from ~4.5 wt.% at the core to 7.0 to 8.0 wt.% at the interdendritic region. For sample 2, line scans across primary arms show Nb composition to vary from 3.5–4.0 wt.% at dendrite core to 7.0–8.0 wt.% at the interdendritic region. Scans across secondary arms suggest Nb content varies from ~3.5 to 4.0 wt.% at the core to >7.0 wt.% at the inter-dendritic region. For both samples, the dendrite arm spacing, as estimated from the EDS line scan, agrees with manual measurements highlighted in Table 2.

4. Numerical Results

4.1. Simulation Details

Phase-field simulations were carried out in two-dimensions (pseudo 2D) or three-dimensions (3D), using the same set of simulation and material parameters so that comparisons could be made between the two. Initially, isothermal simulations were carried out in 2D or 3D using different levels of the superimposed noise on the order parameter in order to assess the influence of the noise level on the tendency to form sidearms during dendritic solidification. The simulations were then performed in the presence of an imposed temperature gradient in the liquid using optimized superimposed noise. In both 2D and 3D simulations with imposed temperature gradient, the solidification direction was along the z axis. 2D simulations were carried out by limiting the thickness of the 3D simulation domain along the y-direction. The temperature gradient along the z-direction was kept constant but the temperatures at the mesh points during subsequent time-steps were varied according to the cooling rate which is given by a product of the steady-state G and steady-state R obtained from the thermal simulations described in Section 2.1. Two different levels of the steady-state thermal gradient of 2.6 × 10⁶ K/m, and 4.6 × 10⁶ K/m and an R value of 0.1 m/s were used in accordance with the data given in Table 1. The nucleation of solidification was initiated by two different approaches. In one approach, a single hemispherical nucleus (seed) of a given radius was placed at the bottom. In the second approach, a flat s-l interface at the bottom of the simulation domain was perturbed by using the random noise term in the Ginzburg-Landau equation (Equation (11)). In the first nucleation approach, the simulations were repeated with or without the noise term in order to illustrate the effect of noise on the tendency for side-arm formation. Two types of growth simulations were carried out. In one set of growth simulations, the s-l undercooling was kept initially at a relatively low value (30 K) and a cooling rate G × R with R = 0.1 m/s was imposed. The objective was to capture the unsteady solidification during initial epitaxial growth from the underlying solid substrate and to determine the undercooling required to obtain a steady-state velocity of 0.1 m/s. In the second set of growth simulations, the initial s-l undercooling was kept at a value corresponding to a steady-state velocity of 0.1 m/s. The initial composition of the alloy was prescribed for all the points in the simulation domain which is all liquid with an initially prescribed order parameter of 0.0.
The solidification microstructure shown in Figure 2 is characterized by several packets of columnar dendrites. The orientation of the columnar dendrite within each packet is the same, and it represents the underlying structural length scale of the baseplate that was fabricated by the LPBF AM process. The length scale of the phase field simulations covers a single dendrite packet size which is of the order of micrometers. The “random” nucleation approach where solidification was initiated by introducing random fluctuations in an initially flat s-l interface is an attempt to capture the epitaxial solidification from a single base orientation. The parameters used in the phase-field simulations are shown in Table 3. Phase mobility was calculated at each site using the model proposed by Kim [15] as shown in Equation (13).

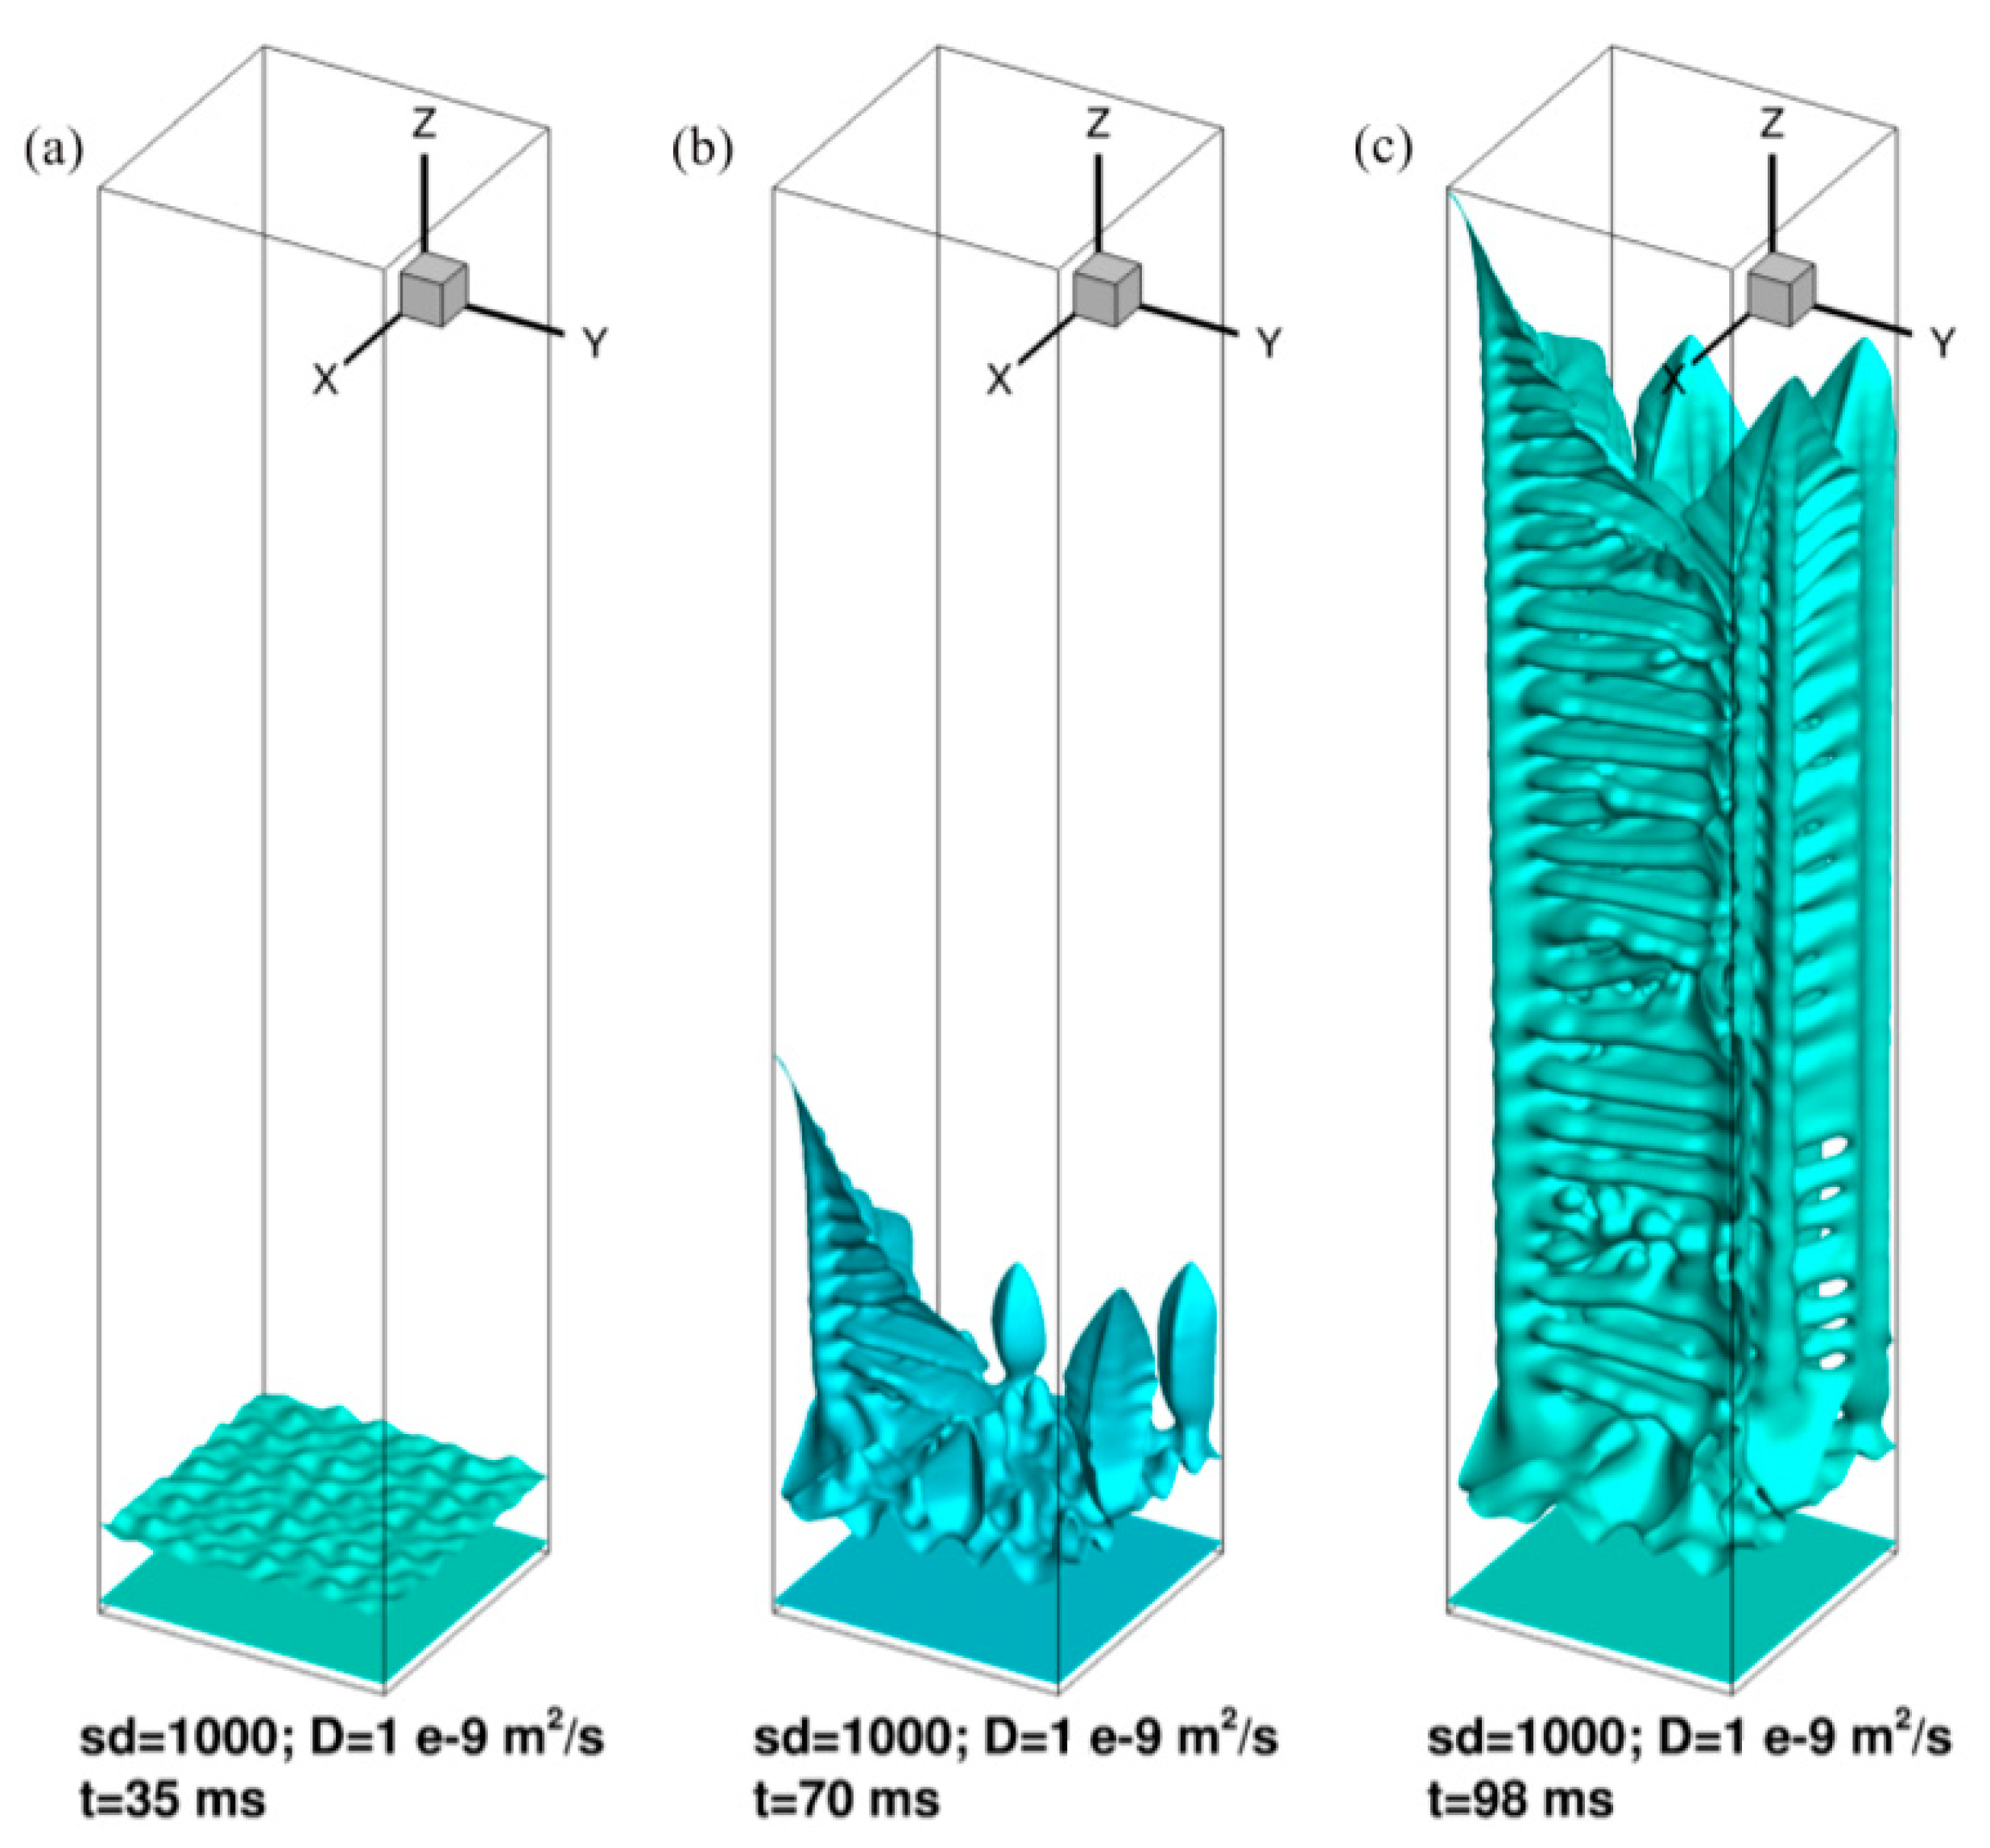
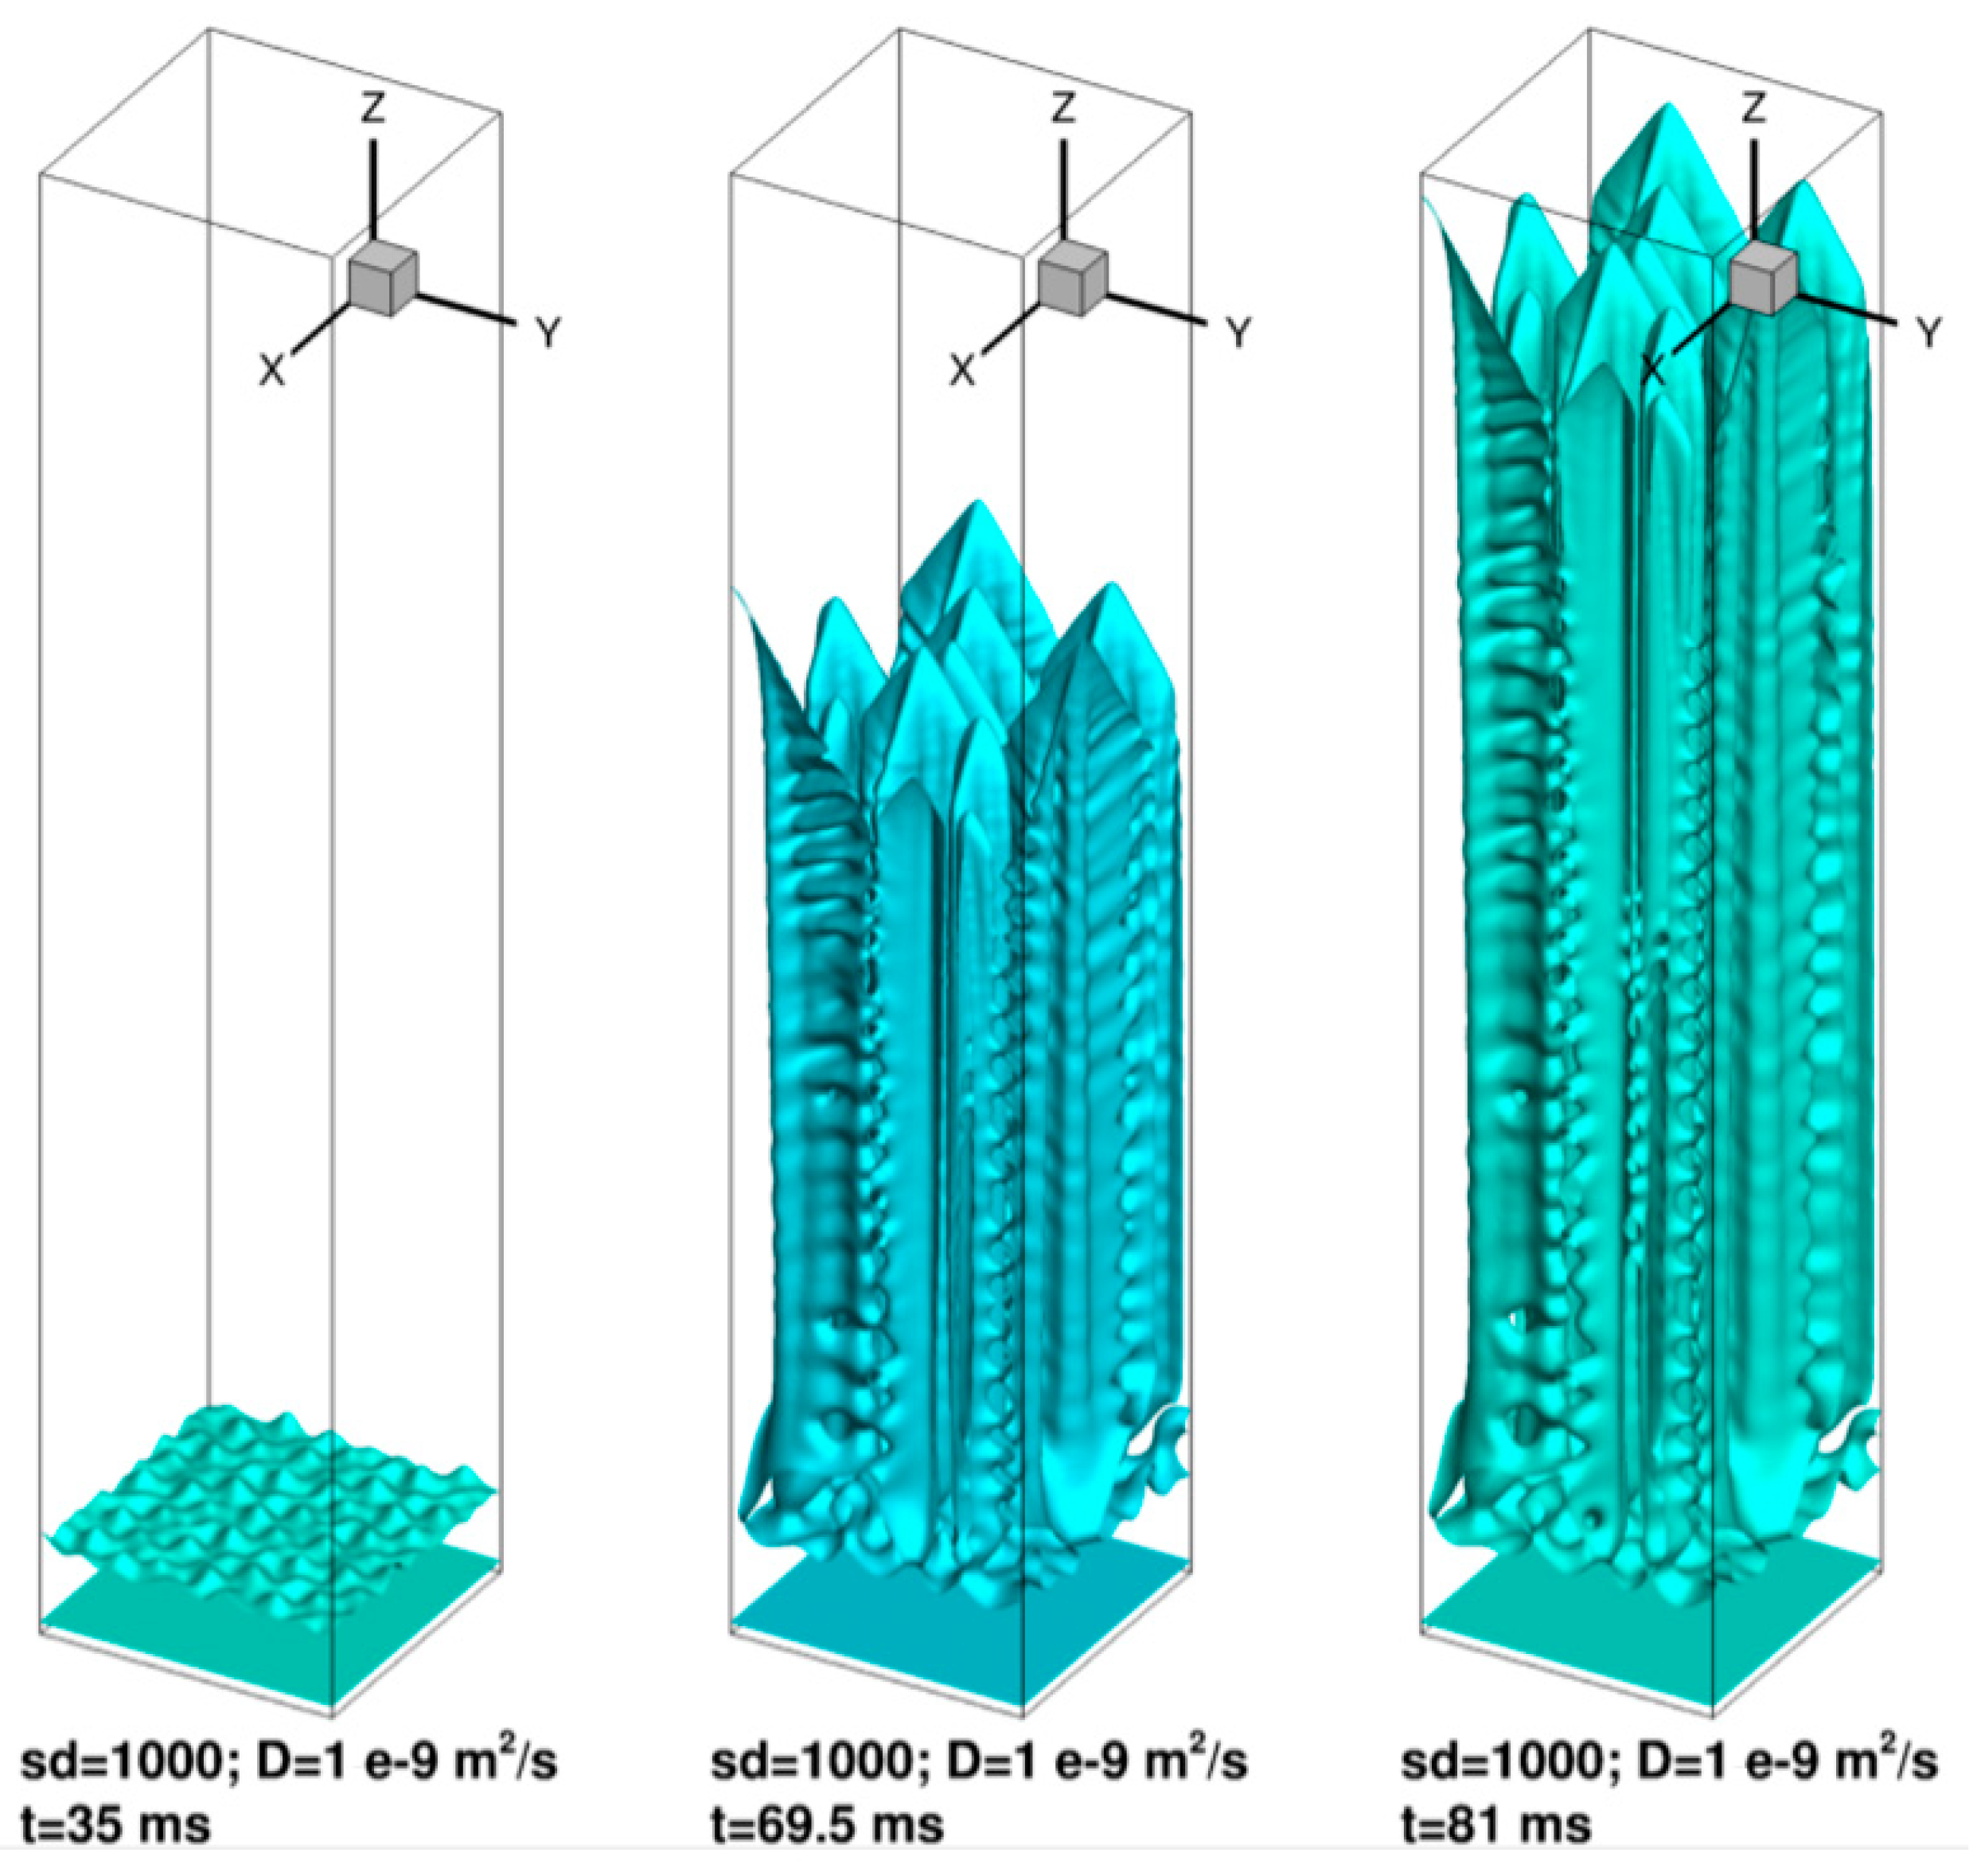
4.2. Effect of Superimposed Noise–Isothermal Solidification

The simulations indicated the need for superimposed noise in order to initiate secondary arm formation during dendritic solidification. This is demonstrated in the 2D simulations shown in Figure 4 and 3D simulations shown in Figure 5. Both 2D and 3D simulations were carried out isothermally at a temperature of 1617 K.
2D simulations were initiated by a seed located at the center of 2000 × 2 × 2000 domain and the 3D simulations were initiated by a seed located at the bottom x-y surface. The simulations were repeated by using different amplitudes of the random noise imposed on the order parameter as indicated by the parameter sd. With increasing sd, the distance behind the primary dendrite tip at which the secondary arms initiate decreases as seen in Figure 4 and Figure 5, in 2D and 3D, respectively. This causes the secondary arms to coarsen and the tertiary arms to form as sd is increased. This can be seen clearly in 2D simulations while such coarsening is not seen to be significant in 3D. The measured secondary arm spacing in 3D simulations was roughly 135–155 nm for the range of sd values used. In 2D simulations, the secondary arm spacing measured close to the tip of the primary arms (before coarsening) is essentially unchanged by the magnitude of sd in the range of 135 to 145 nm. In the subsequent simulations, a superimposed noise level of sd = 500 or 1000 was used.

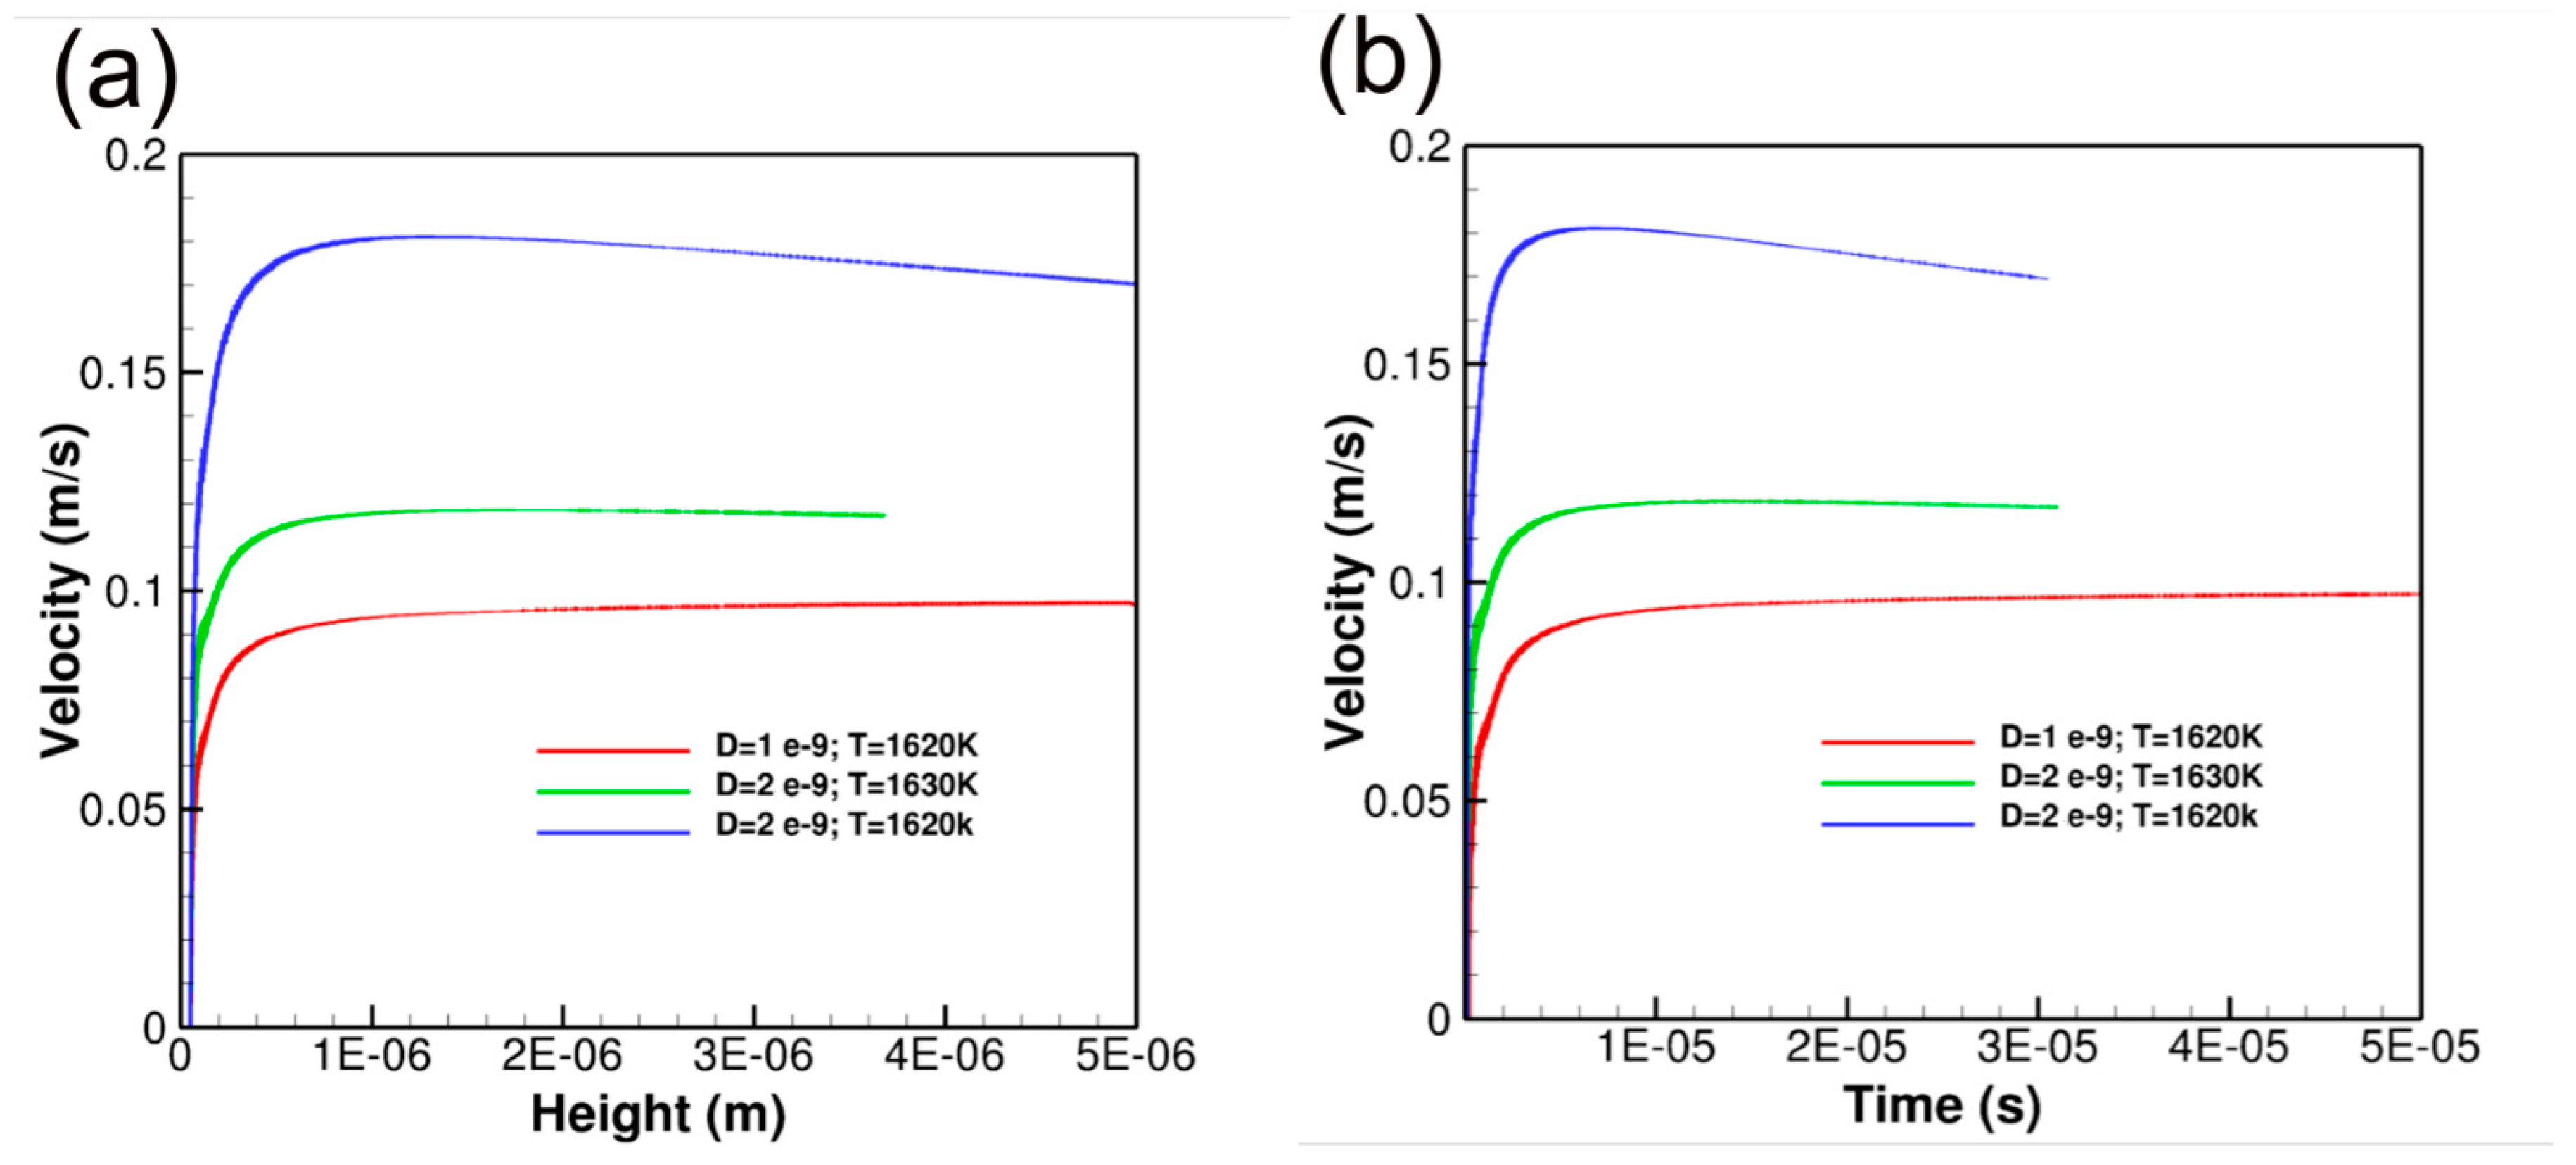
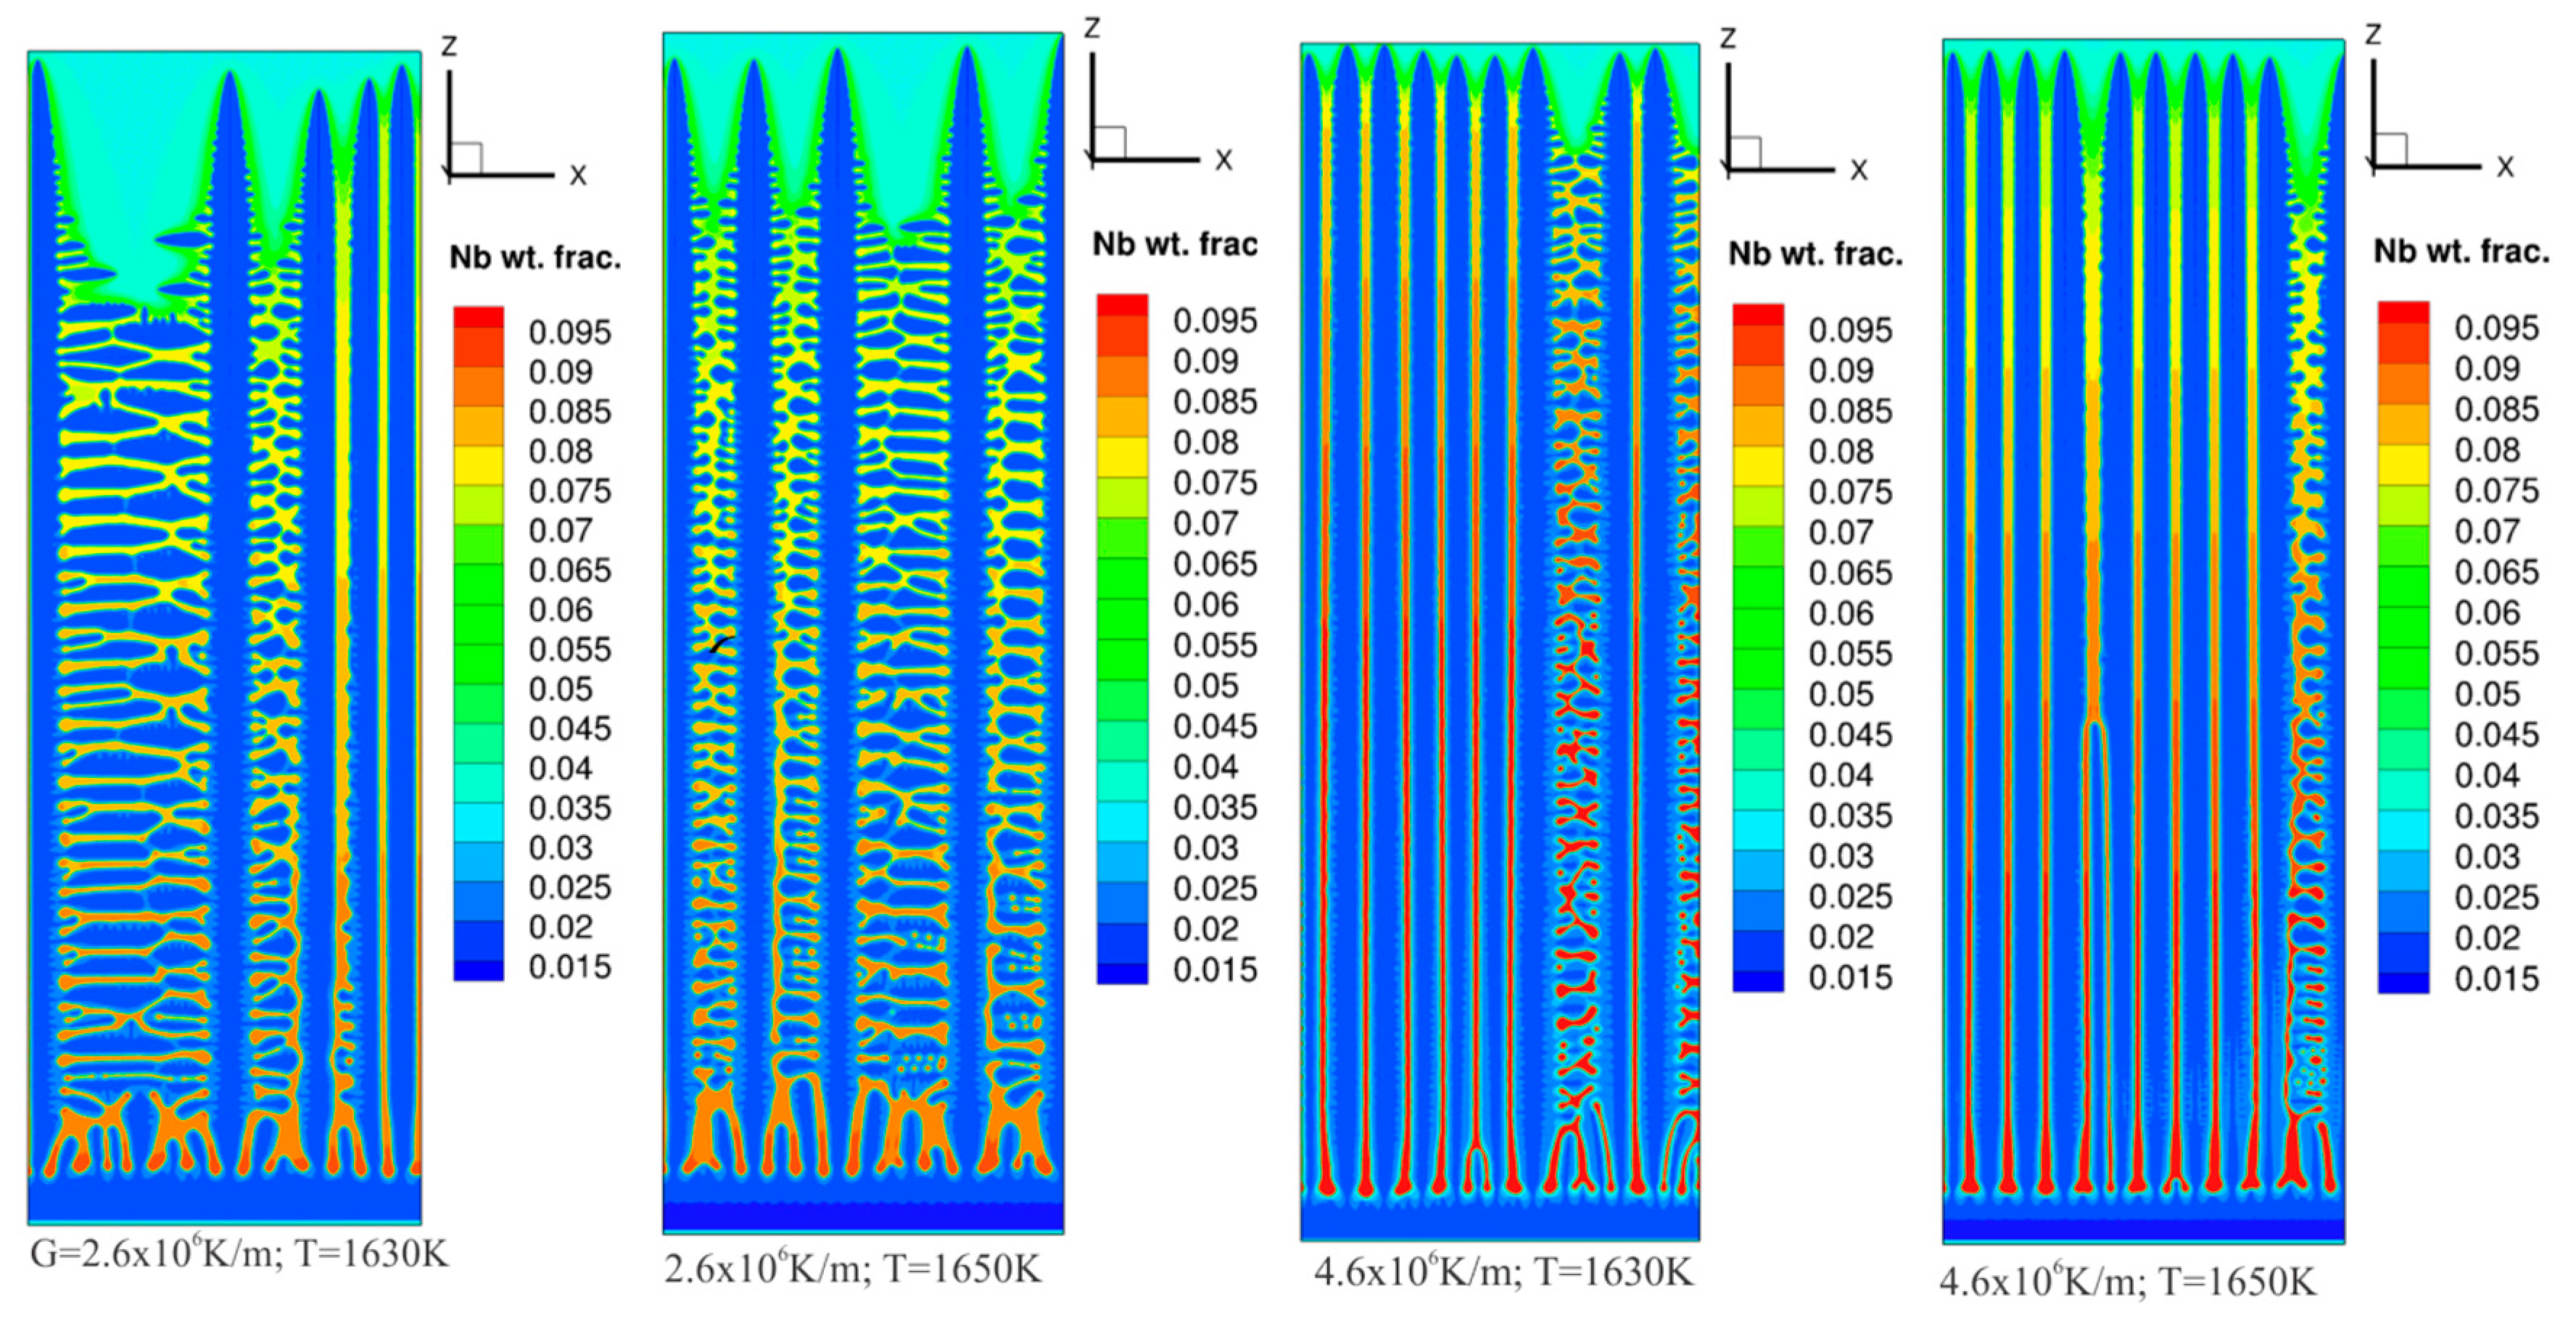
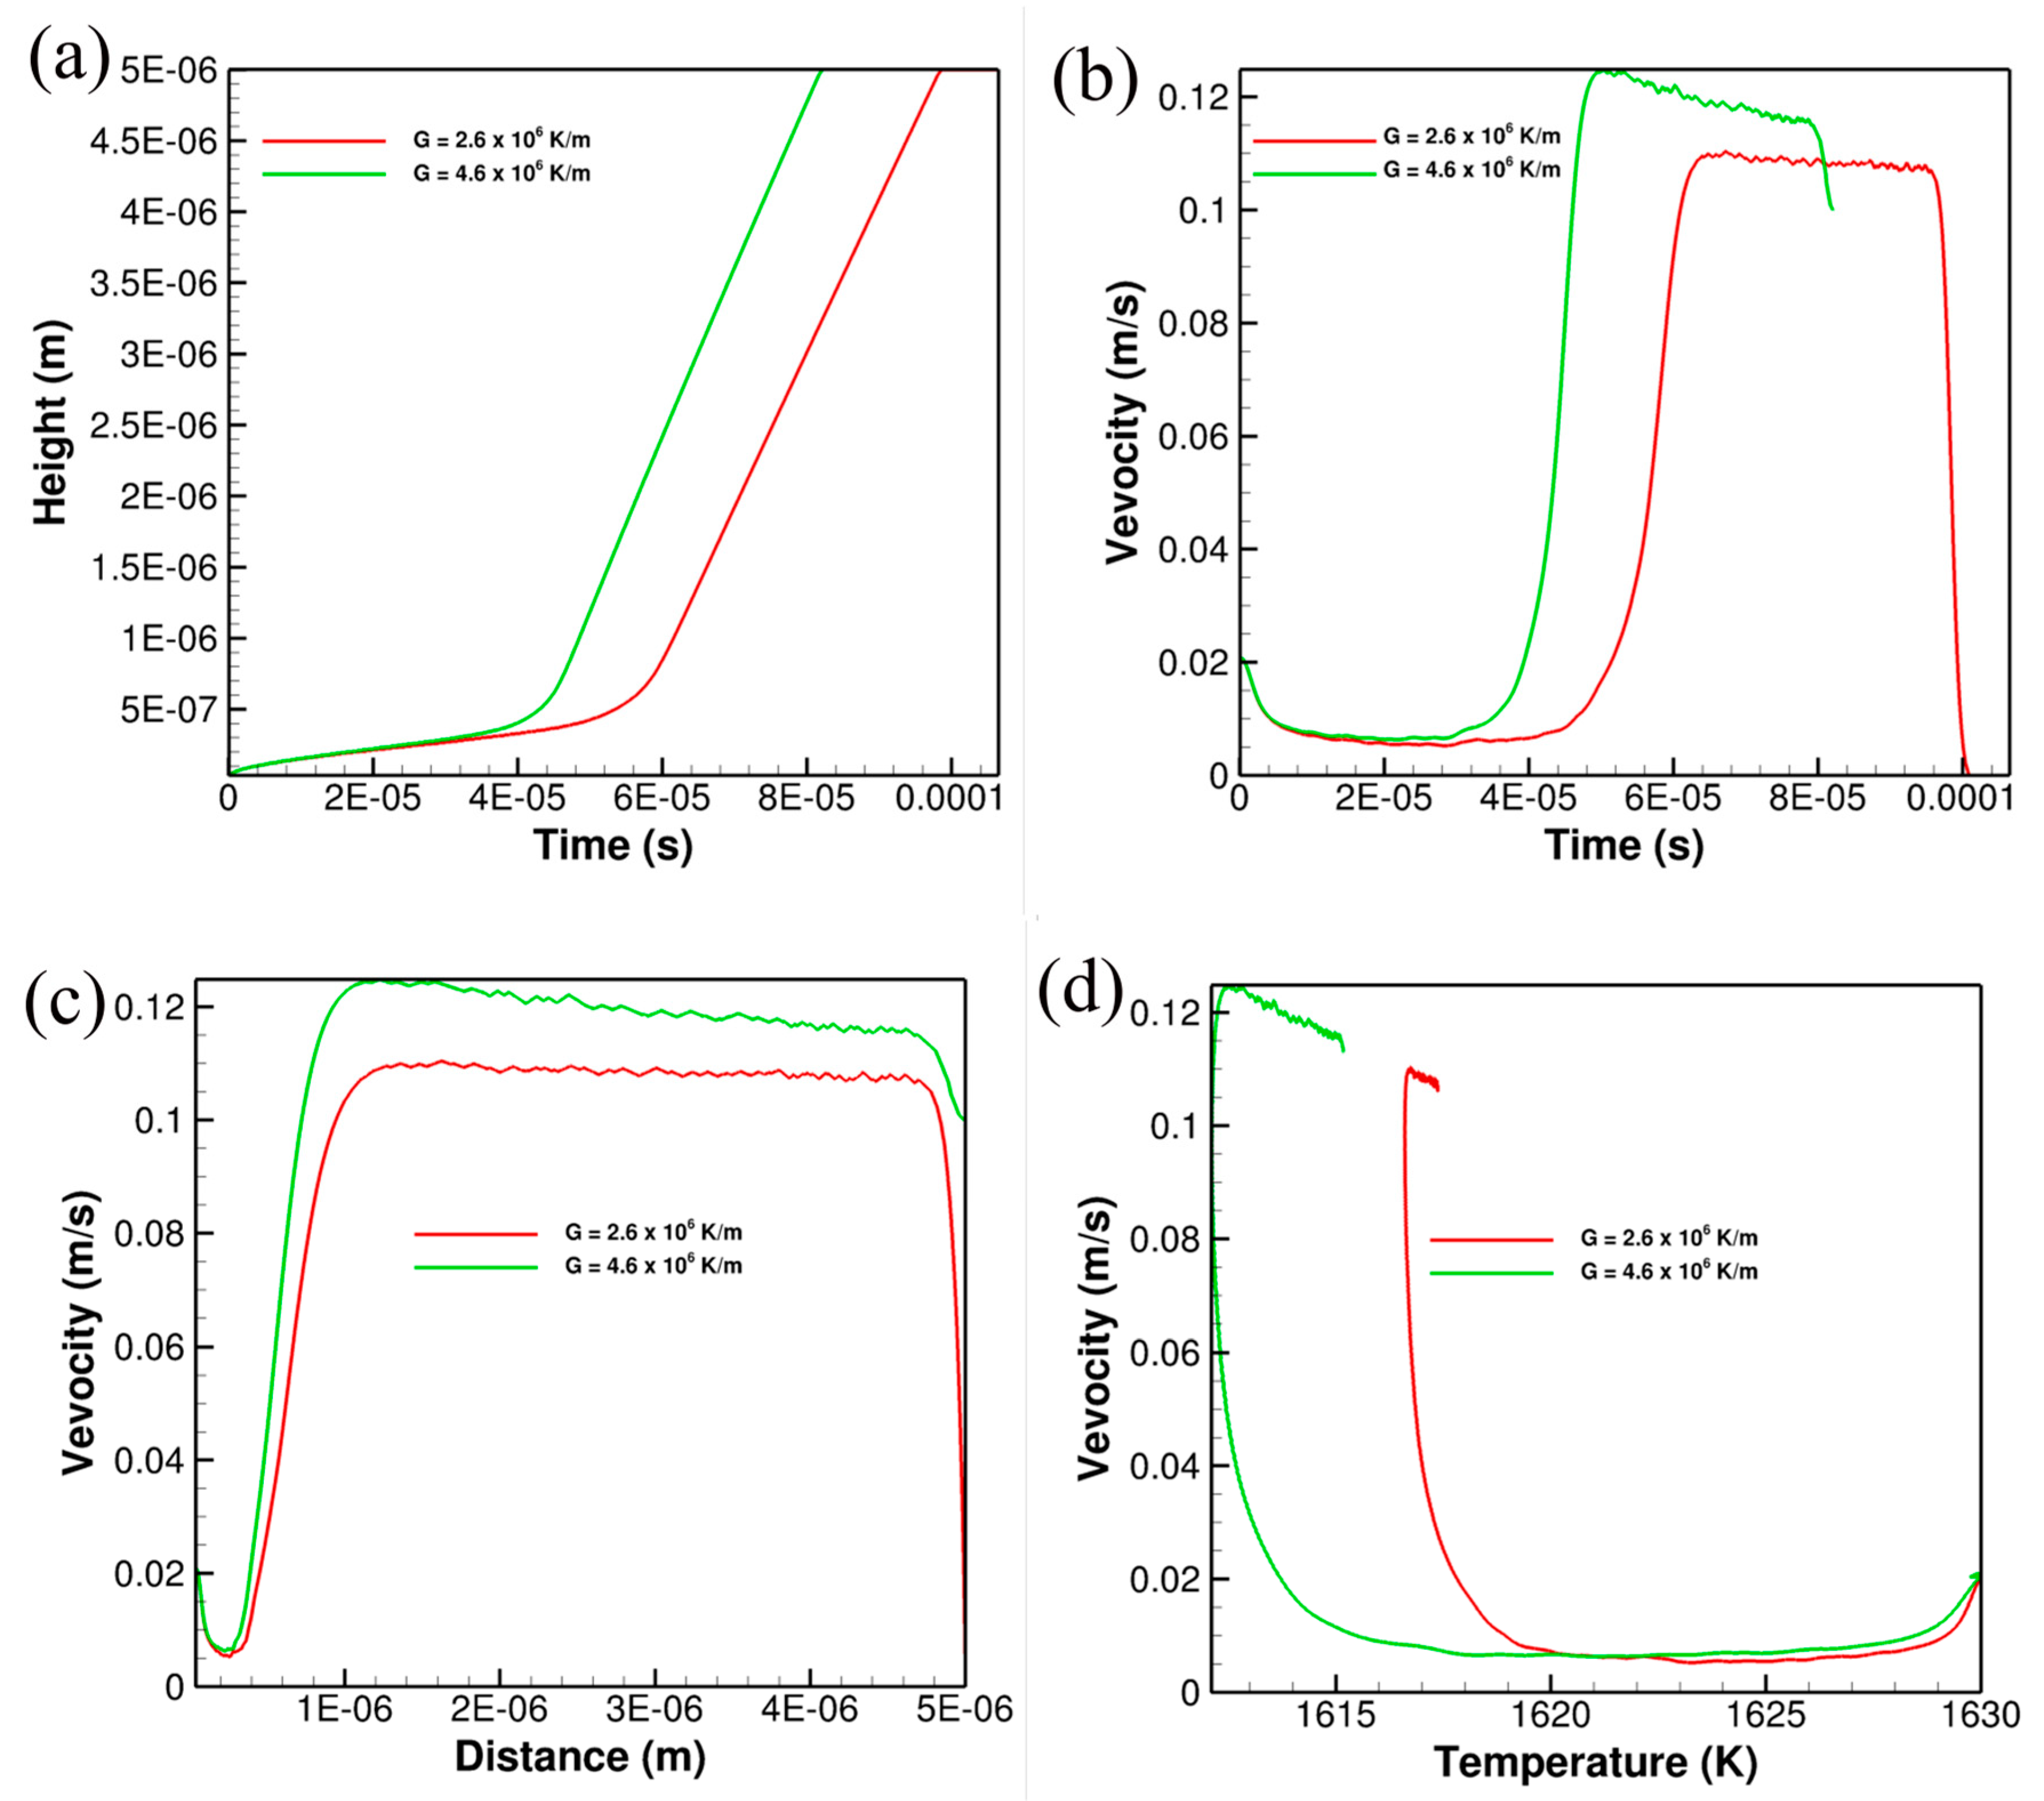
4.3. Directional Solidification–Steady State

Next, the sensitivity of the noise parameter (sd) and the diffusion coefficient in the liquid to the growth velocity and dendrite morphology was simulated using 2D and 3D simulations. This is done in the presence of a prescribed temperature gradient in the liquid (2.6 × 10⁶ K/m or 4.6 × 10⁶ K/m) and a s-l interface velocity of 0.1 m/s. The bottom of the simulation cell was kept at either 1609 K or 1620 K depending on the diffusivity in the liquid. Two values of the diffusion coefficient in the liquid, 1 × 10⁻⁹ m2/s and 2 × 10⁻⁹ m2/s, were tried in the simulation, given the uncertainty in the magnitude of this parameter. 3D simulations were carried out using a 0.65 × 0.65 × 10.0 μm3 simulation domain, while the 2D simulations used a 0.65 × 6.5 μm2 simulation domain in the x-z plane with a thickness of 10 nm in the y-direction. The spatial resolution of the simulation domain was 5 nm. The simulations were initiated with a single seed placed at the bottom center of the simulation domain. Figure 6 shows the s-l interface velocity as a function of the interface position along the growth direction (height) and the solidification time. It is clear that the magnitude of the noise parameter (sd) has no effect on the s-l interface velocity. However, increasing the diffusion coefficient increases the s-l interface velocity for a given undercooling. For example, if the diffusion coefficient in the liquid is increased from 1 × 10⁻⁹ m2/s to 2 × 10⁻⁹ m2/s, the target velocity of 0.1 m/s would be reached at a lower undercooling, with an s-l interface temperature of 1620 K. This is attributed to the increased phase field mobility (Equation (13)) when the diffusion coefficient is increased. The two undercooling levels of 71 K or 60 K are close to the known steady-state undercooling for an s-l interface velocity of 0.1 m/s for alloy IN718 [19].
The growth morphology of the dendrite for the various 2D cases is shown in Figure 7. The results indicate a similar trend shown in the isothermal simulations in that the tendency to form the sidearms increases with increasing noise level. Increasing the noise level from sd = 500 to sd = 1000 did not result in a significant increase in the measured dendrite arm spacing, thus indicating insignificant coarsening. However, increasing the diffusion coefficient had a significant negative impact on the side-arm formation in that the side-arms were not well developed. The measured secondary arm spacing was roughly similar to the lower diffusivity case. The measured secondary dendrite arm spacing varied from 180 nm to 232 nm for the case where D = 1 × 10⁻⁹ m2/s for the top and bottom portion of the simulation domain. The SDAS at the bottom is higher due to the dendrite coarsening that occurs with continued holding at temperature.
The single seed 2D simulations were extended to full 3D case. The growth kinetics are shown in Figure 8.
Comparing the growth kinetics shown in Figure 6 and Figure 8 for the 2D and 3D cases respectively, it can be observed that the s-l interface velocity is higher in 3D for a given interface undercooling, superimposed noise level, and diffusion coefficient in the liquid. The reason for this effect is not clear, but it could be due to the fact that the effective diffusion coefficient in 3D could be higher than in 2D due to the additional degree of freedom. Figure 9 shows the dendrite morphologies obtained under the growth conditions shown in Figure 8.
The dendrite morphologies shown in Figure 9 indicates that for a given level of superimposed noise, the tendency to form side-arms decreases with increasing s-l interface temperature and the solute diffusion coefficient in the liquid. For D = 2.0 × 10⁻⁹ m2/s and a s-l interface temperature of 1630 K, the resulting interface velocity is close to the target value of 0.1 m/s. However, there is very little indication of sidearm formation (Figure 9a). However, when the s-l interface temperature is decreased to 1620 K, the increased thermodynamic driving force results in increased interface velocity in the range of roughly 0.15 to 0.17 m/s. In this case, the G/R ratio decreases further, and it promotes increased sidearm formation (Figure 9b). On the other hand, when the D is reduced to 1.0 × 10⁻⁹ m2/s at the same s-l interface temperature, the interface velocity is close to 0.1 m/s and the G/R ratio is very similar to that for Figure 10a, but the tendency to form side-arms is the highest in this case (Figure 9c). The lower diffusion coefficient reduces the diffusion distance and promotes the formation of a concentration gradient normal to the primary arm. The formation of secondary arms is increased if the diffusion distance is lower than the distance between the primary arms, as described earlier for the CDT. This will be further demonstrated in later sections where simulations of multiple primary arm formation will be presented. The measured secondary dendrite arm spacing for the dendrite shown in Figure 9c is roughly 150 nm.

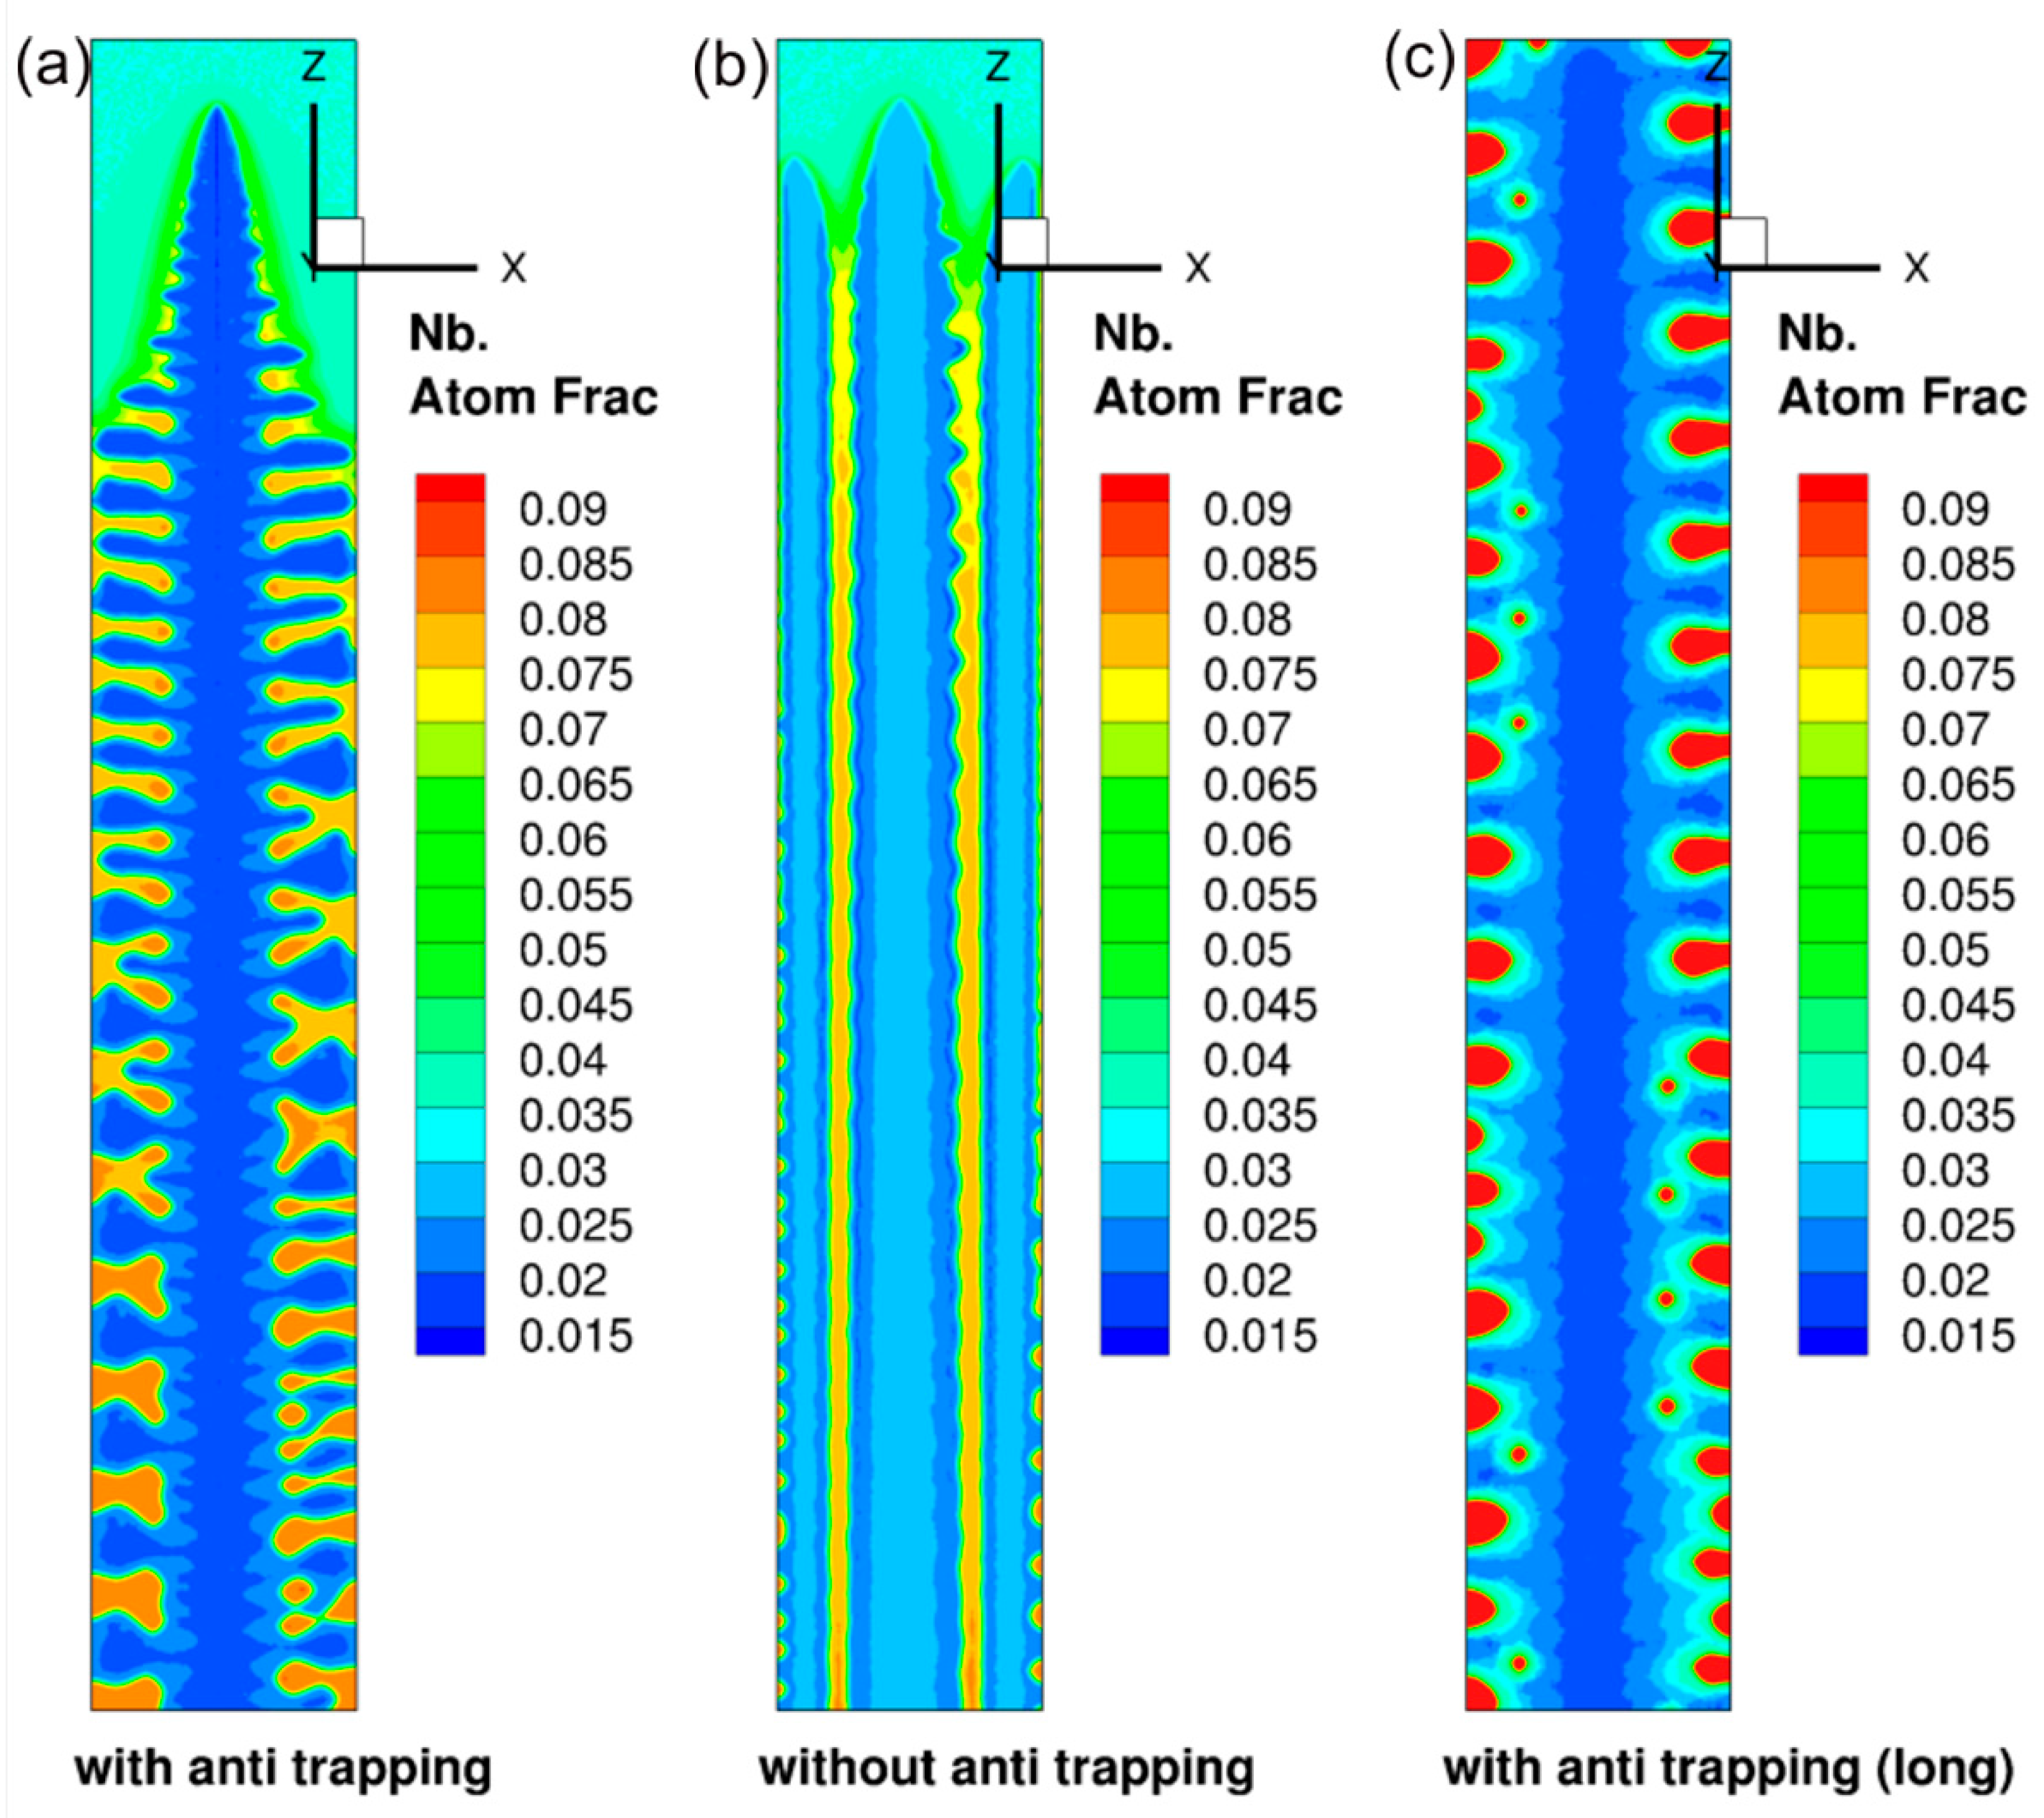
4.4. Effect of Anti-trapping Current

One of the aspects of the phase field simulations presented here is the introduction of the anti-trapping flux term in the diffusion equation. Due to the diffuse nature of the s-l interface used in phase field simulations, spurious non-equilibrium effects in solute partitioning could occur even at moderate s-l interface velocities of the order of 0.1 m/s used in the current simulations. As explained later, such non-equilibrium effects are expected to occur at real physical s-l interfaces only at velocities that are higher at least by one order of magnitude. Figure 10 shows the simulation results in quasi 2D conditions for the growth of a single columnar dendrite in a temperature gradient. The simulations were carried out in a 160 × 2000 mesh with a mesh resolution of 5 nm corresponding to a physical size of 0.8 μm × 10 μm, with a solute diffusion coefficient in the liquid of 1 × 10⁻⁹ m2/s and a noise level of sd = 1000 with an imposed temperature gradient in the liquid of 2.6 × 10⁶ K/m and a s-l interface velocity of 0.1 m/s.
The presence of a spurious solute trapping in the solid can be clearly observed by comparing the Nb concentration in the solid with and without anti-trapping term as shown in Figure 10a,b, respectively. The Nb concentration in the solid is higher in the absence of the anti-trapping term that clearly shows solute trapping. The calculated Nb concentration immediately below the dendrite tip in the presence of the anti-trapping term was 0.017 atom fraction at a tip temperature of 1609 K. The equilibrium Nb concentration shown in Figure 1 and 1609 K is 0.019 atom fraction. However, in the absence of the anti-trapping term, the simulated Nb concentration just below the dendrite tip is 0.032 atom fraction. Due to the increased partition coefficient in the absence of anti-trapping current, the s-l interface velocity was higher than the target value of 0.1 m/s and it ranged from 0.14 m/s to 0.13 m/s with a tip temperature of 1614 K. In addition, the reduced partitioning of Nb in the absence of the anti-trapping term resulted in a significant change in the simulated dendrite morphology at the same level of imposed noise (sd = 1000). With the anti-trapping flux, a well-defined dendritic structure with side-arms is formed as shown in Figure 6a, while in its absence the sidearm formation is significantly reduced, and the structure looks more columnar as shown in Figure 10b.

Nb Enrichment in Re-Solidified Interdendritic Areas

Experimental measurements indicate that the Nb enrichment in the interdendritic region ranges from about 7 wt.% to 9 wt.% (4.3–5.67 at.%). In order to capture the Nb levels in the simulations, the 2D simulation with anti-trapping current was extended to long solidification times where the bottom of the simulation domain was cooled below the solidus temperature of 1526 K and the Nb level in the re-solidified interdendritic region was measured. The temperature in Figure 6c linearly increased from 1516 K at the bottom to 1531 K at the top of the domain. The calculated Nb level in the resolidified regions shown in Figure 10c was found to be in the 4.1 to 4.2 at.% range, in very good agreement with the experimental measurements.

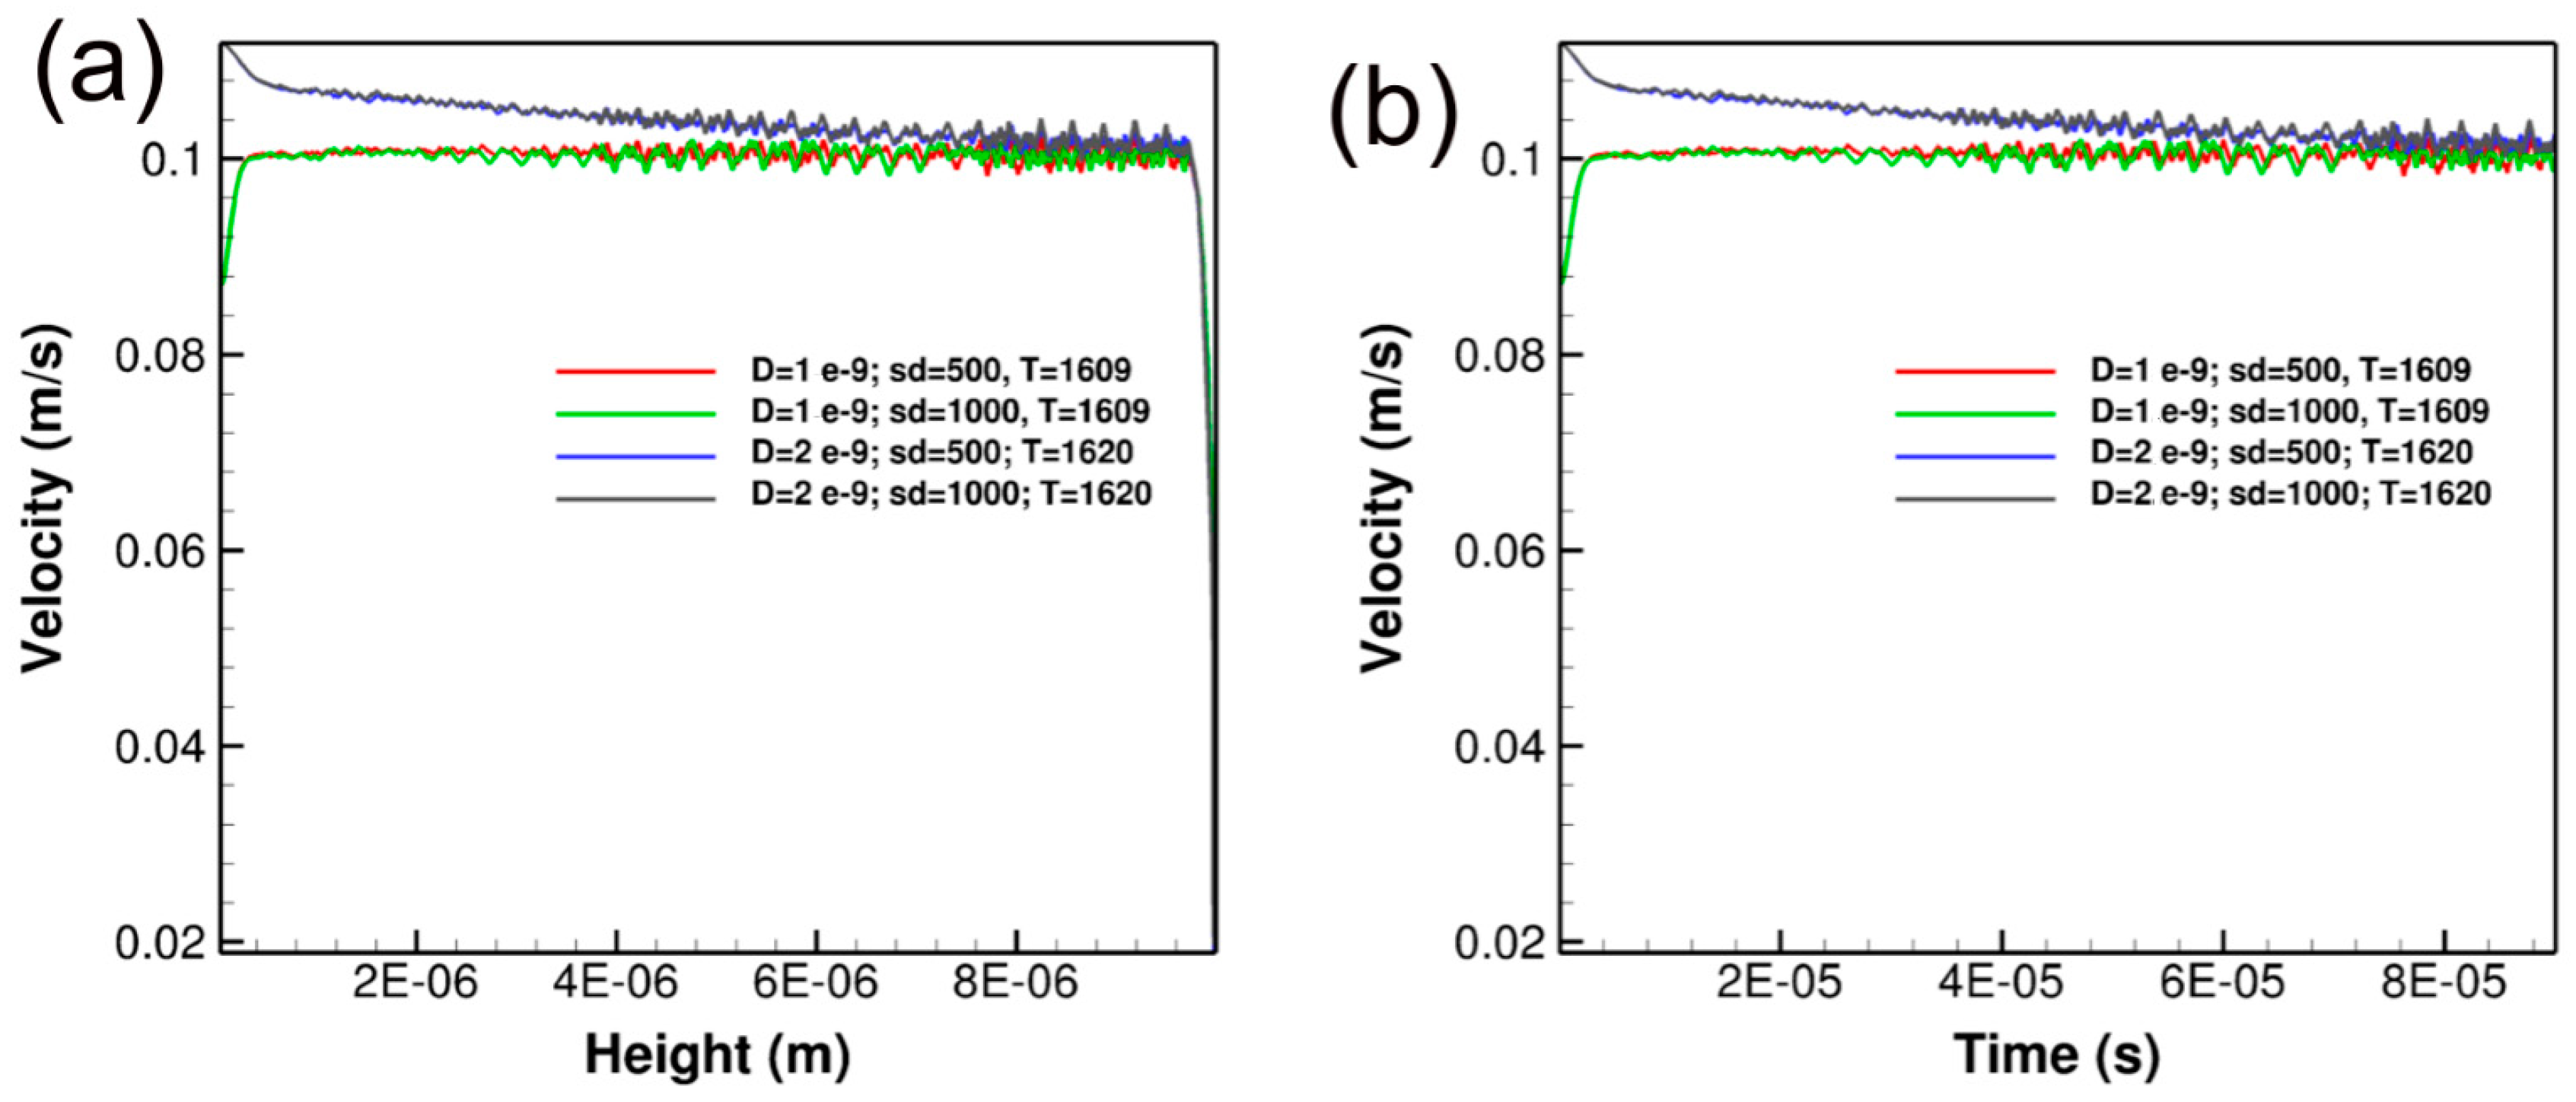
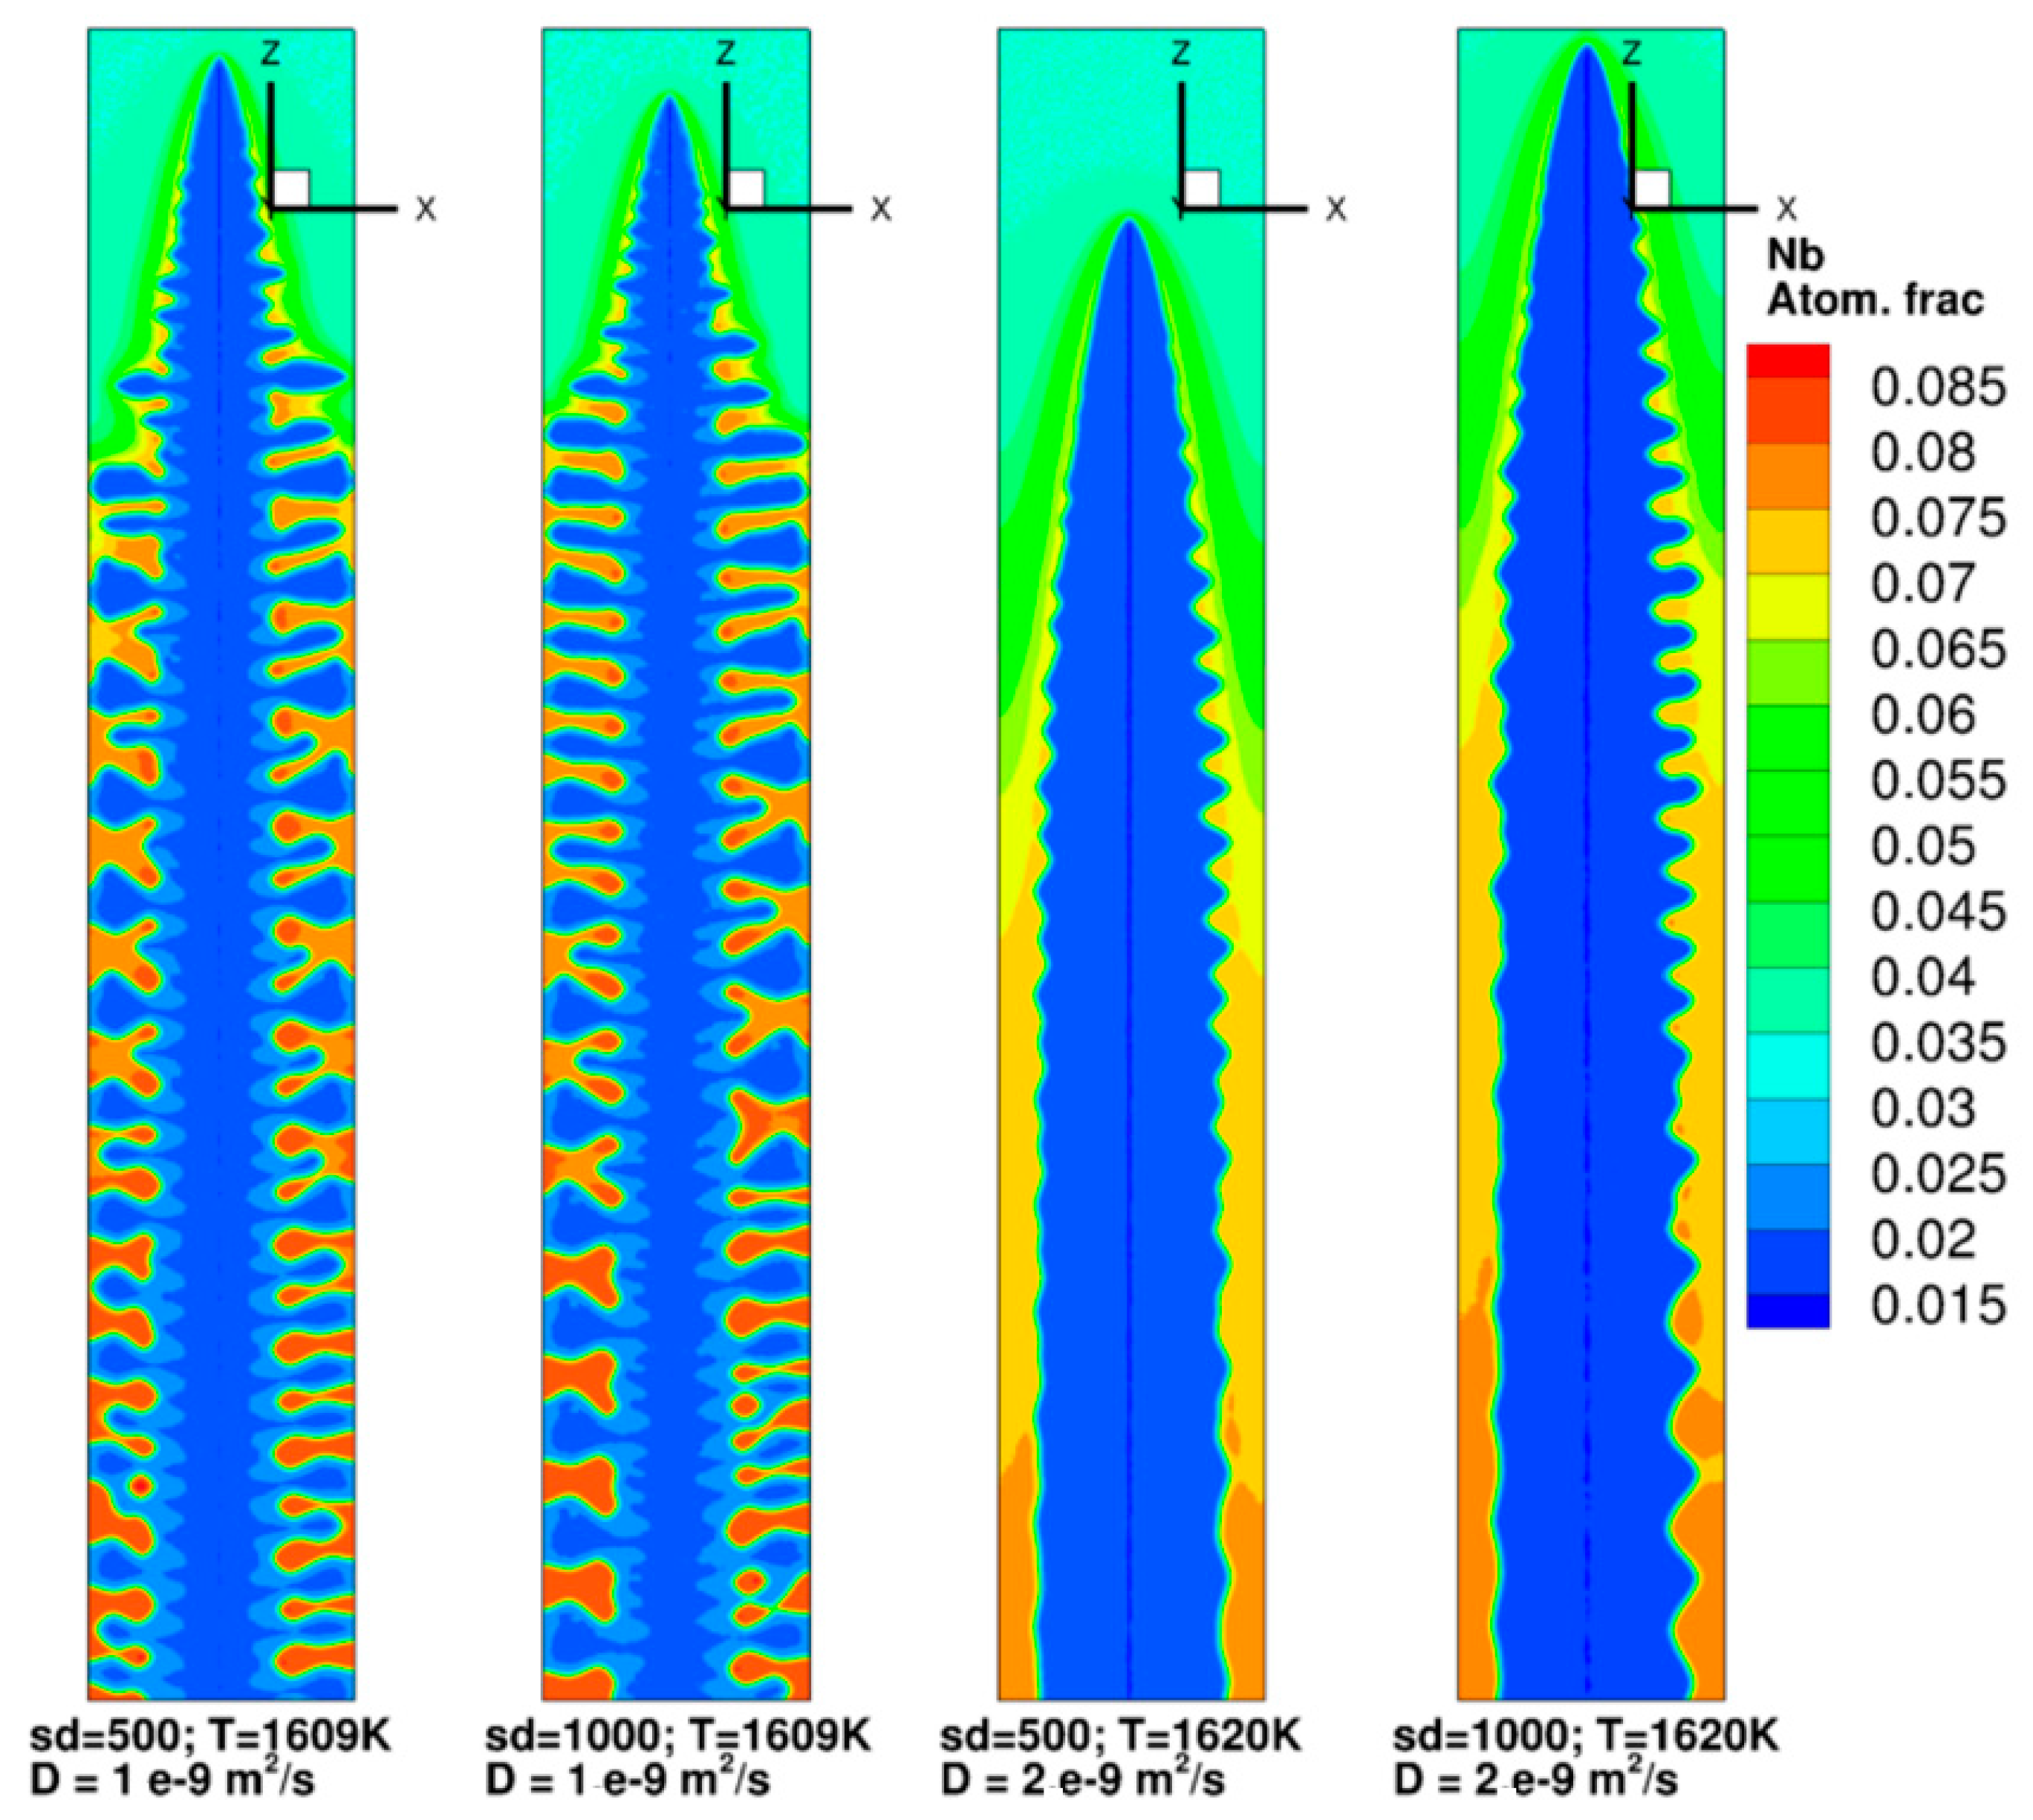
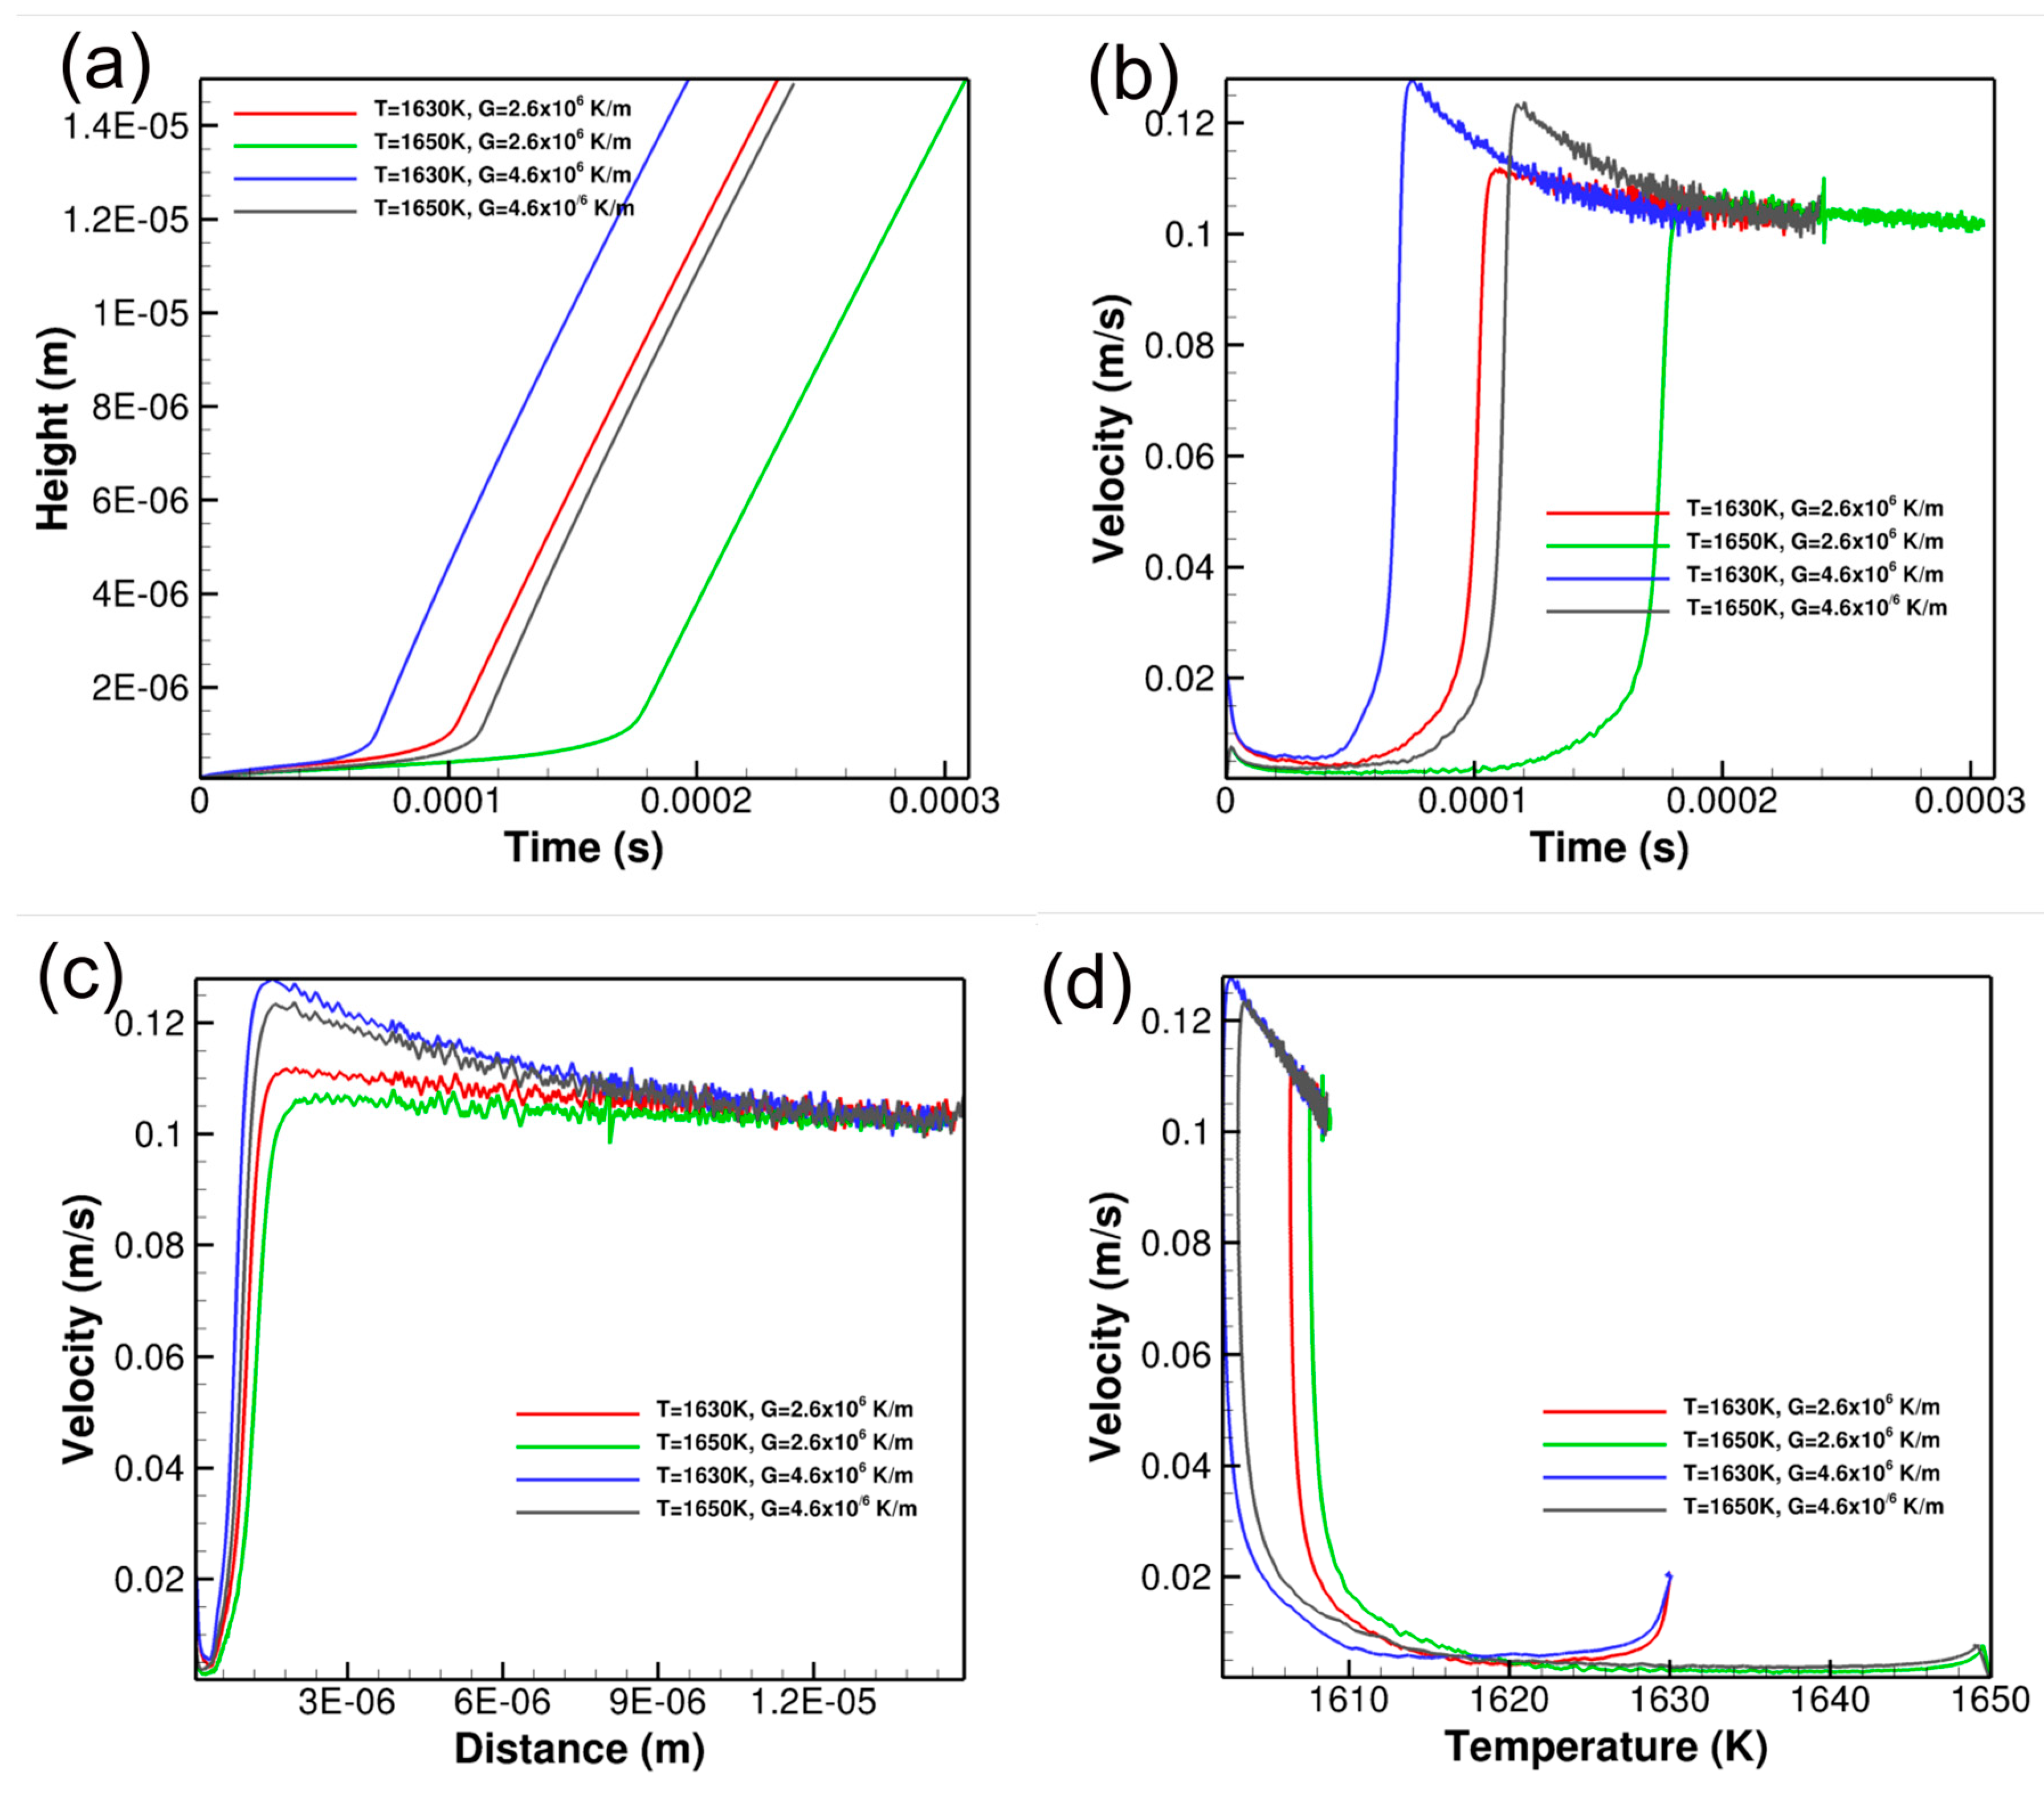
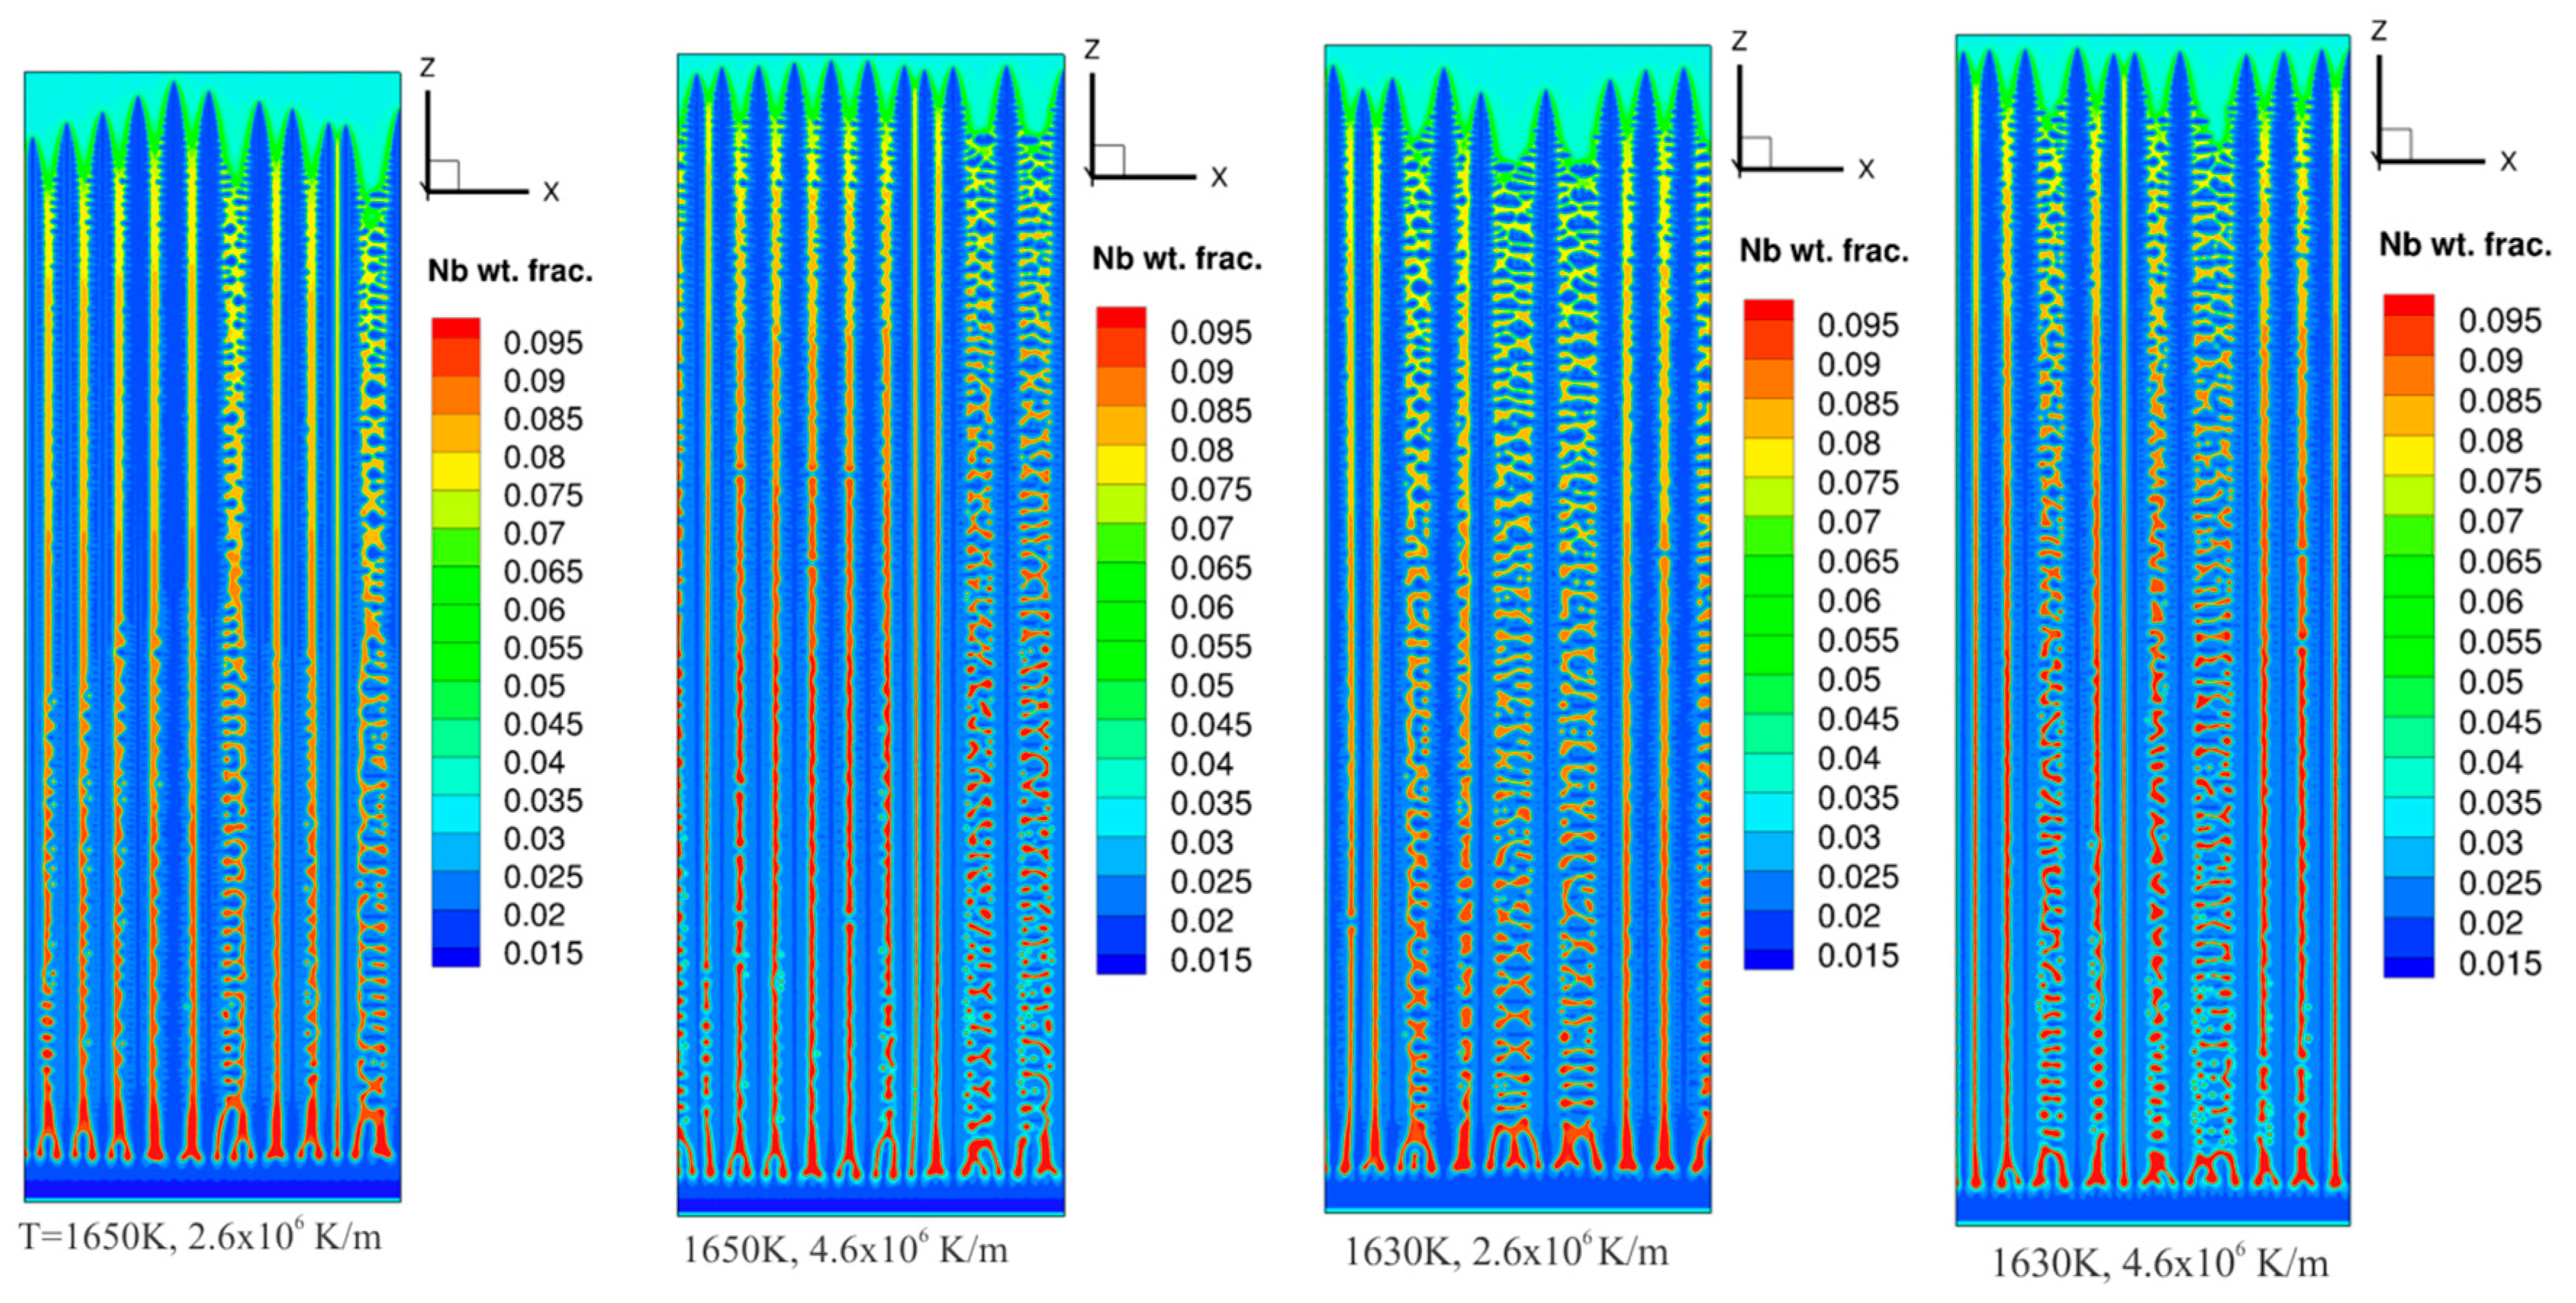
4.5. Directional Solidification Unsteady State Conditions

Pseudo-2d simulations: While the above simulations were carried out under steady-state conditions, unsteady-state simulations were also performed with an initial undercooling of 30 K or 50 K corresponding to initial s-l interface temperature of 1650 K or 1630 K, and with an imposed temperature gradient of 2.6 × 10⁶ K/m or 4.6 × 10⁶ K/m. Two different diffusion coefficients in the liquid, 1 × 10⁻⁹ m2/s and 2 × 10⁻⁹ m2/s were also considered. The superimposed noise parameter sd was fixed at 500 for all of these simulations. In the unsteady-state simulations, the dendritic growth was initiated through the instability of an initially flat s-l interface by the introduction of the random noise in the order parameter, as described earlier. The unsteady-state simulations were first performed in quasi-2D conditions. The simulation domain is cooled at a rate of G × R where R was set to 0.1 m/s. These simulations were carried out in a simulation domain of 1000 × 3000 mesh points corresponding to a physical size of 5 μm × 15 μm. The simulations required the use of 1024 processors in a cray × c30 machine with a simulation wall clock time of roughly 6 h.
Figure 11 shows the interface kinetics for the case where the diffusion coefficient in the liquid was kept at 1 × 10⁻⁹ m2/s and a target steady-state interface velocity of 0.1 m/s. Figure 11a shows the position of the s-l interface as a function of the simulation time. The interface evolution undergoes an initial transient during which the initially flat interface undergoes instability and establishes columnar dendrite arms. The extent of the transient period depends on the initial undercooling and the cooling rate (proportional to the temperature gradient). The minimum transient period corresponds to T = 1630 K (high undercooling) and G = 4.6 × 10⁶ K/m (high temperature gradient) and increases with decreasing cooling rate and decreasing undercooling with the highest transient occurring for T = 1650 K (low undercooling) and G = 2.6 × 10⁶ K/m (low temperature gradient). The undercooling appears to have a greater effect on destabilizing the interface than the cooling rate (temperature gradient) as seen by comparing the red and the black curves. It is clear that that the initial transient period is very short, corresponding to only about 1 μm compared to the simulation domain height of 15 μm. The interface velocity was obtained by taking the derivative of the distance-time plots. Figure 11b shows the interface velocity as a function of simulation time. After the transient period, the interface velocity dramatically increases and overshoots the target velocity of 0.1 m/s and slowly drops down to the steady-state value at larger simulation times. The overshoot is seen to be much more pronounced with increased cooling rate corresponding to higher imposed temperature gradient. The interface velocity as a function of s-l interface height is shown in Figure 11c. The steady-state velocity of 0.1 m/s is not reached until the s-l interface height is about 12 μm compared to the simulation domain size of 15 μm. However, the deviation from the target value of 0.1 m/s is not significant in spite of the initial overshot. The interface velocity as a function of the interface temperature (undercooling is 1680 K–interface temperature) is given in Figure 11d. Following the initial transient, the s-l interface velocity increases with increasing undercooling. The presence of the overshoot in the interface velocity causes the interface temperature to drop to about 1605 K, especially for the higher cooling rate, after which the interface temperature slowly increases to about 1610 K when the target velocity of 0.1 m/s is reached. The initial drop in the interface velocity with decreasing undercooling occurs prior to the onset of the interface instability when the interface is flat. During this period, the interface velocity cannot keep pace with the drop of the interface temperature that occurs with a rate of G × R where R = 0.1 m/s. Increased thermodynamic undercooling and the associated build-up of solute in the liquid leads to constitutional undercooling that causes the interface to destabilize and form stable, super-critical perturbations. Once formed, these perturbations grow very quickly that leads to the abrupt increase in the interface velocity and the observed overshoot of the velocity beyond the target velocity of 0.1 m/s. The target velocity occurs only after the interface has further migrated over considerable distance. This is significant because, under rapid solidification conditions such as in additive manufacturing, the steady-state velocity undercooling relationships obtained using steady-state assumptions may not be valid. The evolution of the structure during the unsteady-state solidification is illustrated in Figure 12, Figure 13 and Figure 14.
The temperature distribution in the liquid corresponding to the time of solidification is given in Figure 12a. Figure 12b shows the distribution of the phase field mobility in the system as calculated by the numerical approach outlined above. It shows that the phase field mobility is a function of the location in the domain and it varies as a function of the temperature and the local composition since both of these quantities influence the mobility through Equation (13). The Nb concentration profile and the order parameter profiles are shown in Figure 12c,d respectively. From the solid morphologies shown in Figure 12c,d, it is clear that the side-arm formation depends on the distance between the adjacent primary trunks. It appears that secondary formation occurs only above a certain primary spacing, a feature that is characteristic of the columnar to dendritic transition (CDT) described previously. Such behavior was observed for all of the parameters used in the simulations as shown in Figure 13. Figure 13 also shows that while the primary dendrite arm spacing is determined by the evolution of the instability of the initially flat s-l interface, the transient part of the solidification shown in Figure 11 is nearly independent of the initial undercooling or the temperature gradient in the liquid. The average primary arm spacing was measured to be roughly 500 nm for the four cases considered. The average secondary arm spacing is measured to be 227 nm.
Changing the diffusion coefficient to 2 × 10⁻⁹ m2/s had a profound effect on the solidification morphology. Both the primary and the secondary arm spacing decreased significantly on increasing the temperature gradient in the liquid (cooling rate). The solidification morphologies are shown in Figure 14. When the temperature gradient in the liquid was kept at 2.6 × 10⁶ K/m, the primary arm spacing showed a significant variation in the simulation domain, and a mean value of roughly 1000 nm was obtained. In this case the mean secondary arm spacing was roughly 300–330 nm indicating significant coarsening during solidification. When the gradient in the liquid was increased to 4.6 × 10⁶ K/m, the primary arm spacing became more uniform, decreased significantly, and an average spacing of roughly 550 nm was obtained. The secondary arm spacing was roughly 286 nm in this case.
3D Simulations: The unsteady-state simulations were extended to full 3D by using a simulation domain of 1 μm × 1 μm × 5 μm simulation volume with a spatial resolution of 5nm. The imposed temperature gradient in the liquid was 2.6 × 10⁶ K/m or 4.6 × 10⁶ K/m and the target s-l interface velocity was 0.1 m/s. The initial s-l interface temperature was kept at 1630K and the solidification was initiated by introducing random perturbations to the order parameter for an initially flat s-l interface. Figure 15 shows the dendrite growth kinetics.
The growth kinetics shown in Figure 15 is very similar to the results shown in 2D in Figure 11. There is a transient period during which the interface temperature drops from the initial set value of 1630 K and during which the s-l interface velocity is low. As the interface cools and reaches a critical value, the interface velocity increases and reaches a steady state value where the cooling rate G × R is consistent with a s-l interface velocity of 0.1 m/s. When the imposed temperature gradient is increased, and the target interface velocity is kept the same, the cooling rate increases. The critical s-l interface velocity is reached at a shorter time as shown in Figure 15a,b. The steady-state interface velocity is reached in 3D simulations at G = 2.6 × 10⁶ K/m around 1620 K, while the velocity is not fully converged to 0.1 m/s within the simulation domain size. However, it is clear that the steady-state s-l interface temperature will also be probably around 1620 K if the simulations are continued to longer times in a domain with a larger height.
The evolution of the solidification morphology for the non-steady state solidification in 3D is shown in Figure 16. Figure 16a shows the formation of the initial perturbation from a flat surface at t = 35 μs. The nucleation and growth of new dendrites at 70 μs is shown in Figure 16b. The interface instability leads to the formation of a few primary dendrite columns. Figure 16c shows the microstructure at longer solidification time with a well-developed columnar dendritic morphology. The calculated secondary arm spacing, in this case, was roughly 170 nm.
The morphology evolution during non-steady-state solidification with an imposed temperature gradient of 4.6 × 10⁶ K/m is shown in Figure 17. The higher temperature gradient (higher G/R) and the increased density of nucleation of primary columns appear to decrease the tendency for formation of secondary arms although the columnar dendritic morphology is clearly observable.

5. Discussion

5.1. Impact of Anti-Trapping Term

The deviation from thermodynamic equilibrium at rapidly moving s-l interfaces has been well studied. The continuous growth model by Aziz and Kaplan [20] laid the foundation for describing the non-equilibrium partitioning of solute(s) at the s-l interface as described in their equation
k v = k e + v v d 1 + v v d
where k e is the equilibrium partition coefficient for a solute, k v is the partition coefficient when the s-l interface moves with a velocity v , and v d is the diffusive velocity defined as the maximum theoretical diffusion flux of solute atoms across the interface, divided by the solute’s molar volume. Since the diffusion coefficient of many solutes in liquid metals is of the order of 10−9 m2/s and the interatomic spacing in metals is of the order of 10−10 m, the diffusive velocity is of the order of several m/s. Therefore, it is expected that significant deviation from equilibrium at the s-l interface should occur only at interface velocities of several m/s. Such conditions might exist in the wake of the molten pool where the solidification velocity reaches the velocity of the heat source.
The use of a diffuse interface in phase field models can potentially lead to deviation from thermodynamic equilibrium at the s-l interface. The thin interface limit, at which most theoretical phase field formulations are accurate, states that D i L V ξ where D i L is the diffusivity of solute i in the liquid and ξ is the interface width. For v = 0.1 m/s, D i L V is roughly 10−8 m. Therefore, for the thin-interface limit criterion to be satisfied, ξ should be much smaller than 10−8 m, say 10−9 m. Since ξ is roughly 5 times the mesh resolution, the mesh resolution at the interface should be 2 × 10⁻¹⁰ m. However, at least an order of magnitude increase in interface width must be accommodated in order to extend the simulation length scale to realistic microstructural length scales. If a resolution of 5 × 10⁻⁹ m is used, the diffusive velocity in Equation (18) becomes 0.2 m/s if the interatomic distance is replaced by the phase field interface width. Therefore, the deviation in the partition coefficient is expected to occur at a velocity of 0.1 m/s used in the current simulations. The equilibrium partition coefficient of Nb in the Ni–0.6Fe–0.035Nb alloy is not constant but slightly varies with temperature, as shown in Fig. 1. The partition coefficient at 1600 K is calculated to be 0.25. From Equation (18), k v under these conditions becomes 0.5, with an expected Nb concentration of 0.036 atom fraction. The measured Nb concentration behind the dendrite tip in the absence of the anti-trapping term from the simulations shown in Figure 6 is 0.032 atom fraction as opposed to an equilibrium value of 0.017 atom fraction, clearly demonstrating solute trapping.

5.2. Effect of Superimposed Noise

There have previous studies on the effect of random noise on sidearm formation in phase field simulations of dendritic solidification. Karma and Rappel [21] performed 2d phase field simulations in a pure metal by introducing random thermal noise and showed that the thermal noise was effective in the formation of sidearms. More recently Tourret and Karma [22] simulated dendritic growth with sidearm formation in a succinonitrile-acetone binary alloy by imposing Gaussian noise to the phase field order parameter. They studied the competitive selection of primary arms in a bicrystal containing differently oriented grains. The methodology used here is a modification of this approach, where the Gaussian noise was imposed only locations where the order parameter was less than 0.5. One significant result from the current simulations is that the distance behind the growing tip at which a stable secondary arm forms is inversely proportional to the magnitude of the random noise. This seems to support the theory that the mechanism for the formation of the sidearms in the presence of noise is the amplification of the microscopic fluctuations into a macroscopic self-sustaining feature such as the secondary arm. This appears to be a common feature of all phase-field simulations to-date with superimposed noise. However, there are a few studies in which deterministic sidearm formation have been observed during phase field simulations of dendritic solidification. Mulllis [23] showed that under conditions of high undercooling and intermediate values of the interfacial energy anisotropy deterministic sidebranching occurred during the formation of equiaxed dendrites. An advanced numerical solution technique with multi-grid solver was used in order to minimize the numerical noise in the simulations to show that the deterministic sidebranching was not due to the numerical noise. A similar advanced, adaptive multi-grid solver was used by Wu et al. [24] to perform a coupled thermal and mass transfer solution of the solidification problem involving equiaxed dendrites using phase field simulations. The simulations showed that when the Lewis number (ratio of thermal to mass diffusivity) was greater than 103, which is typical in metallic alloys, the simulations naturally yielded sidebranching without the need for superimposed random noise. However, in both [23] and [24] the coupled solution to the heat and mass diffusion was obtained using an implicit solver where the time step was at least an order of magnitude higher than the ones used in explicit techniques. The use of a higher time step especially in the presence of a large difference in thermal and mass diffusion probably introduced a numerical noise that was responsible for the observed deterministic sidebranching behavior. The material, process and simulation parameters used in the MEUMAPPS simulations were used as inputs to another phase field code AMPE (Adaptive Mesh Phase-field Evolution) where the solution to the governing equations was performed using an implicit technique and a multi-grid solver. When a higher time step that was tolerated by the implicit method was used in AMPE, deterministic sidebranching was observed. However, when the time step in AMPE was reduced to the lower value used in the MEUMAPPS explicit code, no sidebranching was observed unless a noise in the order parameter was introduced, indicating the probable effect of numerical noise [25]. The above effect was observed both in 2D and 3D simulations. More detailed simulations are required to investigate the effect of numerical noise on sidebranch formation, which will be the subject of a future study.

5.3. Columnar to Dendritic Transition

There have been several studies of cellular to columnar dendrite transition (CDT) during steady-state directional solidification. Trivedi et al. [26] investigated the phenomenon in a transparent succinonitrile-salol binary system. Their experimental results indicated that the cellular structure shows a spread in the cell spacing, and wherever the cell spacing exceeded a critical value, λ c d , the secondary arms began to form. The CDT was found to occur over a range of growth conditions and the alloy composition characterized by, C 0 λ c d / G R 3 = c o n s t , where C0 is the average alloy composition. λ c d was found to be proportional to the geometric mean of the thermal, solutal and capillary lengths. Rocha et al. [27] experimentally investigated the CDT in the Sn-Pb system during unsteady state directional solidification where G and R varied with the position of the s-l interface. Their findings indicated that the CDT did not occur at a sharp value of G and R but over a range of G and R conditions defined by, ( G / R ) / C 0 < 0.7 . Rosa et al. [28] performed directional solidification experiments on Pb–Sn alloys and found that the cooling rate dependence of the cellular spacing and interdendritic spacing was of the form A(GR)−0.55. Cellular structure was found when cell amplitude A = 60 and dendritic structures were found when A = 115. The transition from cell to dendrite was thought to be due to the increase in the cell amplitude. The current phase field simulations are able to capture the formation of a columnar-dendritic microstructure seen in the experiments. The formation of the columnar dendrites with well-defined secondary arms is seen to be very sensitive to the PDAS, characteristic of the CDT described above. The superimposition of the random noise at the levels used in the simulations did not seem to have any effect on the CDT in that the dependence on the primary spacing was clearly observable. More detailed analysis of CDT under AM conditions along the lines described [26,27,28] will form the subject of future research.

5.4. Primary Dendrite Arm Spacing (PDAS)

The spacing between the primary dendritic columns is a function of the initial nucleation density at the s-l interface. In the current simulations, the mechanism for primary arm formation from an initial flat s-l interface is the instability of the interface induced by the prevailing G and R values. However, in phase field simulations the instability cannot be introduced in the absence of a perturbation in the order parameter or species concentration that imparts the activation energy required for the nucleation process. The nucleation density depends on the s-l interfacial energy and the thermodynamic driving force that depends on the constitutional undercooling at the s-l interface. For a given interface temperature, the constitutional undercooling depends on the solute diffusion coefficient in the liquid. In the current simulations, two different values of D, 1 × 10⁻⁹ m2/s and 2 × 10⁻⁹ m2/s were considered. For D = 1 × 10⁻⁹ m2/s, it appears that the extent of constitutional undercooling during the nucleation stage was nearly independent of G and the s-l interface temperature, giving rise to a constant nucleation density. Therefore, the number of primary arms that nucleated within the simulation domain was constant under these conditions, giving rise to a PDAS of about 500–550 nm. However, when D was increased to 2 × 10⁻⁹ m2/s, the extent of constitutional undercooling appeared to be very sensitive to G and solid-liquid interface temperature during the nucleation stage. Therefore, when G was increased from 2.6 × 10⁶ K/m to 4.6 × 10⁶ K/m, the PDAS was reduced from about 1000 nm to about 500–550 nm. The simulated value of 500–550 nm under these conditions is well within the range of PDAS measured experimentally in alloy 718. In order to fundamentally link the noise term with the nucleation of the instability and hence the density of nucleation of the primary arms, the simulations have to be performed at a much lower length scale, which will be the subject of a future investigation. Given the sensitivity of the PDAS to D, it appears that an accurate prediction of the PDAS during AM conditions will be a challenge, especially under AM process conditions where steady-state growth conditions between adjacent deposition layers are not achieved.

5.5. Secondary Dendrite Arm Spacing (SDAS)

For D = 1 × 10⁻⁹ m2/s, and G = 2.6 × 10⁶ K/m, the measured SDAS in 2D simulations ranges from 180 nm at the top part of the dendrites to about 230 nm in the bottom part under steady-state growth conditions with R = 0.1 m/s. When G is increased to 4.6 × 10⁶ K/m, SDAS decreases to about 170 nm in the bottom part of the dendrite. These simulated SDAS spacing are in close agreement with the measured values shown in Table 2. When the dendrite sidearms form between two primary arms as in the unsteady state growth simulations, the interdendritic structure gets complicated due to the interaction of the sidearms from the adjacent primary trunks. Therefore, under these conditions, it was difficult to identify the influence of G on the SDAS, but an average value of 227 nm was obtained for D = 1 × 10⁻⁹ m2/s in agreement with the measurements. However, when D was increased to 2 × 10⁻⁹ m2/s, the average value of SDAS increased to 300–330 nm when G = 2.6 × 10⁶ K/m and 286 nm when G = 4.6 × 10⁶ K/m, indicating significant dendrite coarsening. For full 3D simulations, the SDAS ranged from 150–170 nm, somewhat lower than in pseudo 2D simulations under similar set of parameters. The reason for the discrepancy is not clear. Further investigations using larger domain sizes have to be performed in order to accurately account for dendrite coarsening in 3D that would yield larger SDAS.

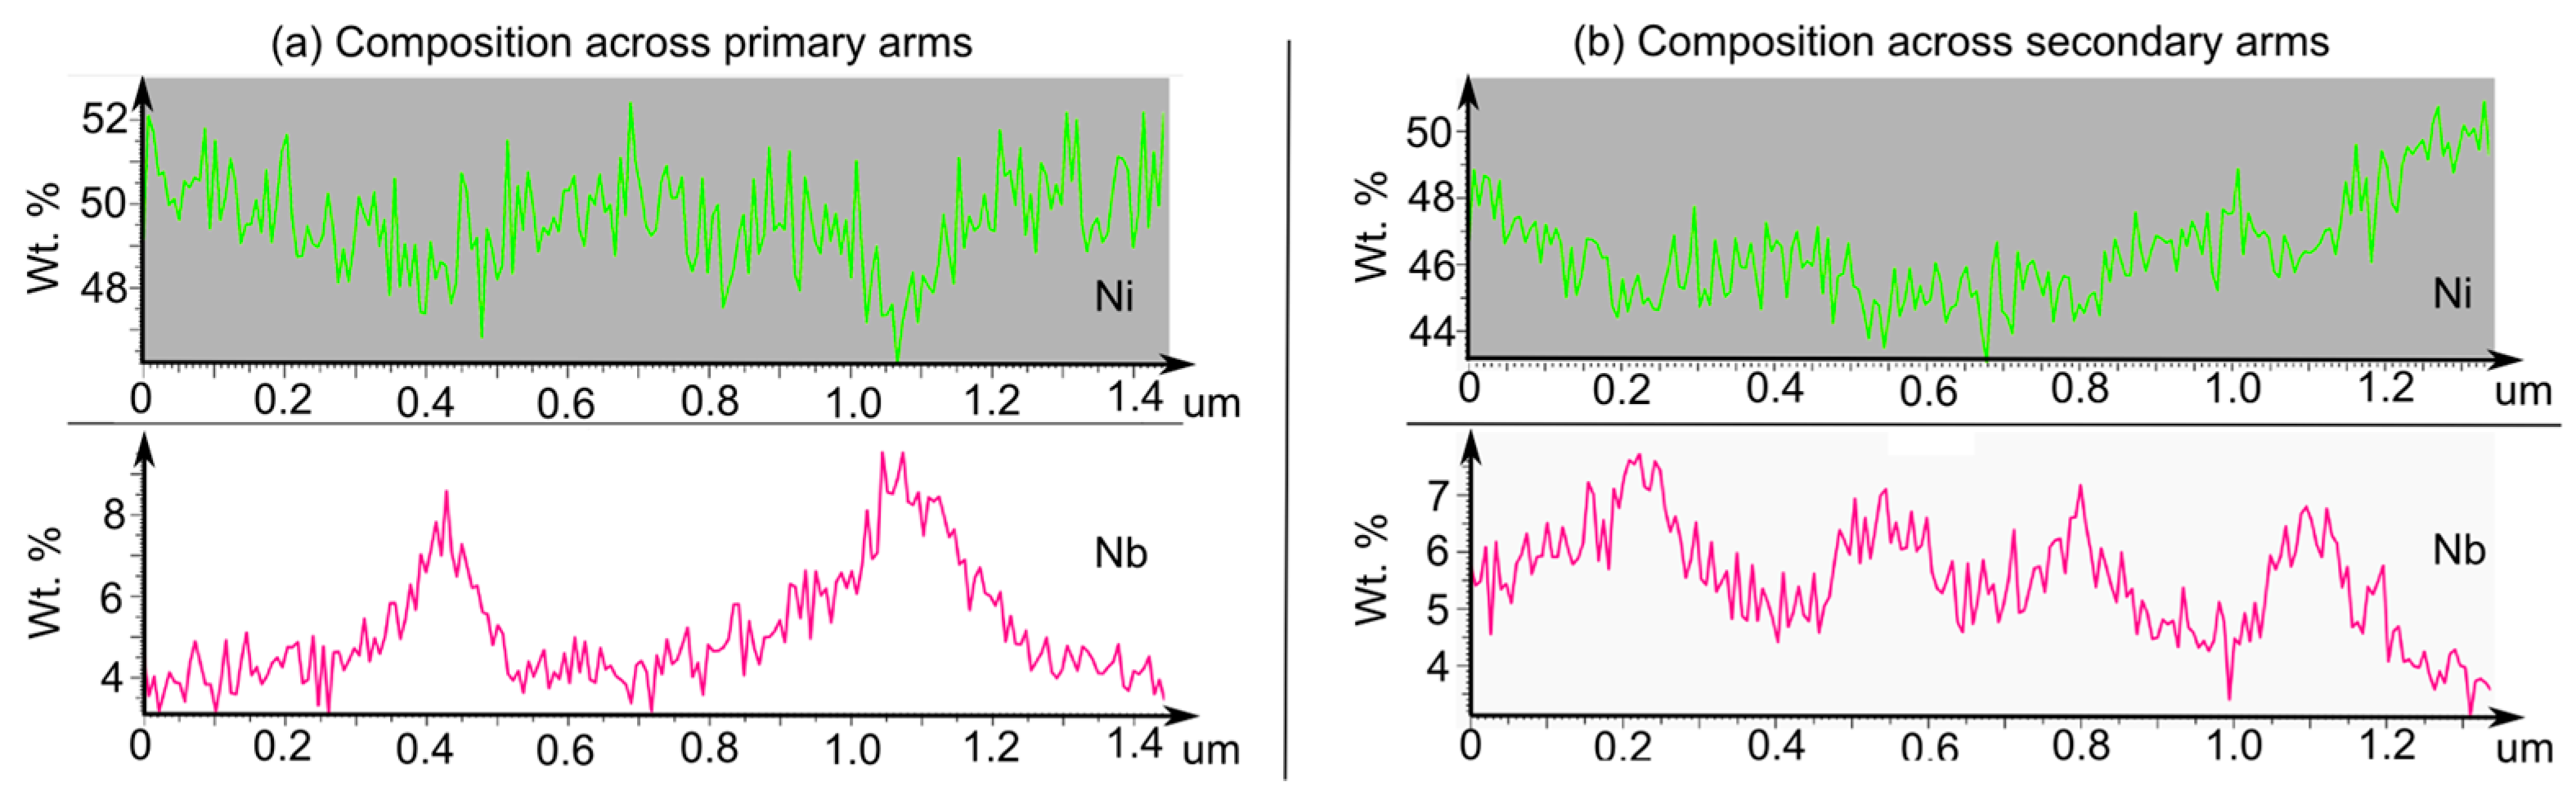
5.6. Nb Enrichment in the Interdendritic Regions

The Nb enrichment in the interdendritic regions depends on the maximum solid-solubility of Nb in the solid phase during solidification. Under rapid cooling conditions, the back-diffusion of Nb in the solid can be neglected, as is done in the phase field simulations. The Nb concentration at the s-l interface follows the metastable extension of the solidus line below the equilibrium solidus. Figure 18 shows the Scheil solidification diagram for Ni–0.60Fe–0.035Nb alloy, showing the Nb concentration in the solid phase (FCC_A1) as a function of the solidification temperature. The Nb content in the temperature range of 1516 K–1531 K (shown in Figure 6c) agrees with the Nb content for the solid phase shown in Figure 18. A similar plot is shown in Figure 19 for an alloy with a nominal composition of IN 718 (Ni–18wt.%Fe–19wt.%Cr–2.5wt.%Mo–5.5wt.%Nb). Note that a similar Nb enrichment of the solid phase is obtained as a function of temperature.

6. Conclusions

The evolution of solidification microstructure in the LPBF process deposited on top of a prior AM-deposit was investigated using phase field simulations and compared with experimentally obtained microstructure. The temperature gradient under AM conditions are on the order of 106 K/m, and the solidification speeds are on the order of 0.1 m/s. The simulations of solidification microstructure evolution were carried out using the steady-state temperature gradients and cooling rate obtained through thermal modeling of the process with the two sets of process variables shown in Table 1. CFD simulation used a coarser grid and the representative volume element chosen to derive phase field boundary condition is thus based on a smaller number of grid points. This apparent flaw can be improved in future by using integrated model for melting and solidification in a single framework or by using adaptive meshing within the CFD framework to obtain more accurate boundary conditions for phase field. However, this is not attempted in the present research.
The thermodynamics of IN718 was approximated by a Ni–Fe–Nb ternary alloy where the Nb concentration is the nominal Nb concentration in IN718 (5.5 wt.%) and the Fe content was varied in the model alloy until the solidification range of the ternary alloy matched the equilibrium solidification range of IN718. The solidification microstructures of IN718 under the process conditions used in LPBF processing shows a predominantly columnar dendritic morphology. The predicted and measured PDAS and SDAS are in close agreement. The model also accurately predicts the Nb segregation at the interdendritic space and agrees well with experimental EDS profile of Nb.
The simulations showed that superimposed noise on the order parameter was required to initial sidearm formation on the primary dendrite arm. The superimposed noise did not significantly alter the secondary arm spacing within the range investigated in this study. However, increasing the magnitude of the noise caused the sidearms to form at a lower distance behind the dendrite tip, supporting a noise amplification mechanism. The simulations also showed for the first time that a primary spacing larger than a critical value was required in order to support the formation of sidearms, a feature similar to CDT. The spacing between the primary arms was seen to depend on the initial undercooling, and the operating G, R, and D.

Author Contributions

Conceptualization, B.R, S.B.G, R.A. and A.S.; Methodology, B.R.; Software, B.R., S.B.G.; Validation, J.A.S.; Investigation, B.R., S.B.G., R.A., A.S.; Resources, J.A.T.; Writing-Original Draft Preparation, B.R.; Writing-Review & Editing, S.B.G., R.A.; Supervision, A.S.; Project Administration, T.E.-W, J.A.T.; Funding Acquisition, T.E.-W., B.R.

Funding

This research was partially supported by the High-Performance Computing for Manufacturing Project Program (HPC4Mfg) managed by the U.S. Department of Energy Advanced Manufacturing Office within the Energy Efficiency and Renewable Energy Office, and the Exascale Computing Project (17-SC-20-SC), a collaborative effort of the U.S. Department of Energy Office of Science and the National Nuclear Security Administration. It was performed under the auspices of the US Department of Energy by the Oak Ridge National Laboratory under contract DE-AC05-00OR22725. This research used resources of the Oak Ridge Leadership Computing Facility, which is a DOE Office of Science User Facility supported under Contract DE-AC05-00OR22725.

Acknowledgments

Authors appreciate discussions with J.L. Fattebert at Oak Ridge National Laboratory and T. Haximali at Lawrence Livermore National Laboratory.

Conflicts of Interest

The authors declare no conflict of interest.

Appendix A

CALPHAD free energy description of phases in Ni–Fe–Nb system
The total free energy of the liquid and solid phases are described by the Calphad approach described in [16]. The total Gibbs energy of a phase is given by
G ϕ = x a G a 0 + x b G b 0 + x c G c 0 + R T ( x a l n x a + x b l n x b + x c l n x c ) + G x s
where G x s is the excess free energy due to interaction between the components described by the Redlich-Kister polynomials. It is defined as
G x s = x a x b i = 0 2 L i a b ( x a x b ) i + x b x c i = 0 2 L i b c ( x b x c ) i + x c x a i = 0 2 L i c a ( x c x a ) i
where L i j k is the binary interaction parameters for the system. The binary interaction parameters used in the simulations for the liquid phase were as follows:
Table A1. Binary interaction parameter used for liquid phase
L 0 a b 56553.0 + 15.0 T
L 1 a b 13400.0 4.172 T
L 2 a b 2000
L 0 b c 105000.0 + 20.0 T
L 1 b c 55000.0 10.0 T
L 2 b c 5000.0
L 0 c a 16911.0 + 5.1622 T
L 1 c a 10180.0 4.14666 T
L 2 c a 0
For the solid phase the corresponding interaction parameters were as follows:
Table A2. Binary interaction parameter used for solid phase
L 0 a b 9000.0 8.0 T
L 1 a b 0.0
L 2 a b 0.0
L 0 b c 100700.0 + 22.0 T
L 1 b c 42815.0 5.0 T
L 2 b c 10000.0
L 0 c a 12054.35 + 3.27413 T
L 1 c a 12054.35 + 3.27413 T
L 2 c a 725.81

References

  1. DebRoy, T.; Wei, H.L.; Zuback, J.S.; Mukherjee, T.; Beese, A.M.; Wilson-Heid, A.; Elmer, J.W.; Milewski, J.O.; De, A.; Zhang, W. Additive manufacturing of metallic components—Process, structure and properties. Prog. Mater. Sci. 2018, 92, 112–224. [Google Scholar] [CrossRef]
  2. Raghavan, A.; Wei, H.L.; Palmer, T.A.; DebRoy, T. Heat Transfer and Fluid Flow in Additive Manufacturing. J. Laser Appl. 2013, 25, 052006. [Google Scholar] [CrossRef]
  3. Raghavan, N.; Dehoff, R.; Pannala, S.; Simunovic, S.; Kirka, M.; Turner, J.; Carlson, N.; Babu, S. Numerical modeling of heat transfer and the influence of process parameters on tailoring the grain morphology of IN718 in electron beam additive manufacturing. Acta Mater. 2016, 112, 303–314. [Google Scholar] [CrossRef]
  4. Keller, T.; Lindwall, G.; Ghosh, S.; Ma, L.; Lane, B.M.; Zhang, F.; Kattner, U.; Lass, E.; Heigel, J.; Idell, Y. Application of finite-element, phase-field, and CALPHAD-based methods to additive manufacturing of Ni-based superalloys. Acta Mater. 2017, 139, 244–253. [Google Scholar] [CrossRef] [PubMed]
  5. Acharya, R.; Sharon, J.A.; Staroselsky, A. Prediction of microstructure in laser powder bed fusion process. Acta Mater. 2017, 124, 360–371. [Google Scholar] [CrossRef]
  6. Dehoff, R.; Kirka, M.; Sames, W.; Bilheux, H.; Tremsin, A.; Lowe, L.; Babu, S. Site specific control of crystallographic grain orientation through electron beam additive manufacturing. Mater. Sci. Technol. 2015, 32, 931–938. [Google Scholar] [CrossRef]
  7. Wu, L.; Zhang, J. Phase Field Simulation of Dendritic Solidification of Ti-6Al-4V During Additive Manufacturing Process. JOM 2018, 70, 2392–2399. [Google Scholar] [CrossRef]
  8. Roehling, J.D.; Perron, A.; Fattebert, J.L.; Haxhimali, T.; Guss, G.; Li, T.T.; Bober, D.; Stokes, A.W.; Clarke, A.J.; Turchi, P.E.; et al. Rapid Solidification in Bulk Ti-Nb Alloys by Single-Track Laser Melting. JOM 2018, 70, 1589–1597. [Google Scholar] [CrossRef]
  9. Kim, S.G.; Kim, W.T.; Suzuki, T. Phase-field model for binary alloys. Phys. Rev. E 1999, 60, 7186–7197. [Google Scholar] [CrossRef]
  10. Bottger, B.; Apel, M.; Schaffnit, P.; Steinbach, I. Phase-Field Simulation of Solidification and Solid-State Transformations in Multicomponent Steels. Steel Res. Int. 2008, 79, 608–616. [Google Scholar] [CrossRef]
  11. Boettinger, W.J.; Warren, J.A.; Beckermann, C.; Karma, A. Phase-field simulation of solidification. Annu. Rev. Mater. Res. 2002, 32, 163–194. [Google Scholar] [CrossRef]
  12. Moelans, N.; Blanpain, B.; Wollants, P. An introduction to phase-field modeling of microstructure evolution. Comput. Coupling Phase Diagr. Thermochem. 2008, 32, 268–294. [Google Scholar] [CrossRef]
  13. Steinbach, I. Phase-field models in materials science. Model. Simul. Mater. Sci. Eng. 2009, 17, 073001. [Google Scholar] [CrossRef] [Green Version]
  14. Wang, X.C.; Kruth, J.P. Finite element analysis of thermal process in direct selective laser sintering. In Proceedings of the 1st International Seminar on Progress in Innovative Manufacturing Engineering, Genoa, Italy, 20–22 June 2001; pp. 205–210. [Google Scholar]
  15. Kim, S.G. A phase field model with antitrapping current for multicomponent alloys with arbitrary thermodynamic properties. Acta Mater. 2003, 55, 4391–4399. [Google Scholar] [CrossRef]
  16. Radhakrishnan, B.; Gorti, S.B.; Babu, S.S. Phase Field Simulations of Autocatalytic Formation of Alpha Lamellar Colonies in Ti-6Al-4V. Metall. Mater. Trans. A 2016, 47, 6577–6592. [Google Scholar] [CrossRef]
  17. Andersson, J.O.; Helander, T.; Höglund, L.; Shi, P.; Sundman, B. Thermo-Calc & DICTRA, computational tools for materials science. Calphad 2002, 26, 273–312. [Google Scholar] [CrossRef]
  18. Kattner, U.R. The CALPHAD method and its role in material and process development. Tecnol. Met. Mater. Mineracao 2016, 13, 3–15. [Google Scholar] [CrossRef] [PubMed]
  19. Kundin, J.; Mushongera, L.; Emmerich, H. Phase-field modeling of microstructure formation during rapid solidification in Inconel 718 superalloy. Acta Mater. 2015, 95, 343–356. [Google Scholar] [CrossRef]
  20. Aziz, M.A.; Kaplan, T. Continuous Growth Model for Interface Motion during Alloy Solidification. Acta Metall. 1988, 36, 2335–2347. [Google Scholar] [CrossRef]
  21. Karma, A.; Rappel, W.J. Phase-field model of dendritic sidebrancing with thermal noise. Phys. Rev. E 1999, 60, 3614–3625. [Google Scholar] [CrossRef]
  22. Tourret, D.; Karma, A. Growth competition of columnar dendrite grains: A phase-field study. Acta Mater. 2015, 82, 64–83. [Google Scholar] [CrossRef]
  23. Mullis, A.M. Spontaneous deterministic side-branching behavior in phase field simulations of equiaxed dendritic growth. J. Appl. Phys. 2015, 117, 114305. [Google Scholar] [CrossRef]
  24. Wu, J.; Guo, Z.; Luo, C. Development of a parallel adaptive multigrid algorithm for solving the multi-scale thermal-solute 3D phase-field problems. Comput. Mater. Sci. 2018, 142, 89–98. [Google Scholar] [CrossRef]
  25. Fattebert, J.L.; (Oak Ridge National Laboratory, Oak Ridge, TN, USA). Personal communication, 2018.
  26. Trivedi, R.; Shen, Y.; Liu, S. Cellular-to-dendritic transition during the directional solidification of binary alloys. Metall. Mater. Trans. A 2003, 34, 395–401. [Google Scholar] [CrossRef]
  27. Rocha, O.L.; Siqueira, C.A.; Garcia, A. Cellular/dendritic transition during unsteady-state unidirectional solidification of Sn–Pb alloys. Mater. Sci. Eng. A 2003, 347, 59–69. [Google Scholar] [CrossRef]
  28. Rosa, D.M.; Spinelli, J.E.; Ferreira, I.L.; Garcia, A. Cellular/dendritic transition and microstructure evolution during transient directional solidification of Pb-Sb alloys. Metall. Mater. Trans. A 2008, 39, 2161–2174. [Google Scholar] [CrossRef]
Figure 1. Equilibrium Fe and Nb concentration in the liquid and solid phases in the model Ni–Fe–Nb alloy as a function of temperature. Xm and Xp are the concentrations of Fe in liquid and solid respectively, and Ym and Yp are the corresponding values for Nb.
Metals 09 00014 g001
Figure 2. Scanning electron microscope (SEM) image of (a) transverse cross section of sample deposited at 285 W and 0.96 m/s, (b) region of analysis for PDAS and SDAS and (c) sample measurements for PDAS.
Metals 09 00014 g002
Figure 3. EDS map representing Ni and Nb segregation across (a) primary dendrite arm and (b) secondary dendrite arm. An overlay of representative dendrite arms (orange) has been placed on the backscatter electron image of the line scan to aid with visualization.
Metals 09 00014 g003
Figure 4. Effect of the magnitude of random noise on the isothermal solidification microstructure in 2D at 1617 K.
Metals 09 00014 g004
Figure 5. Effect of the magnitude of random noise on the isothermal solidification microstructure in 3D at 1617K.
Metals 09 00014 g005
Figure 6. Growth curves as a function of (a) height and (b) solidification time for steady-state solidification in 2D with a thermal gradient of 2.6 × 10⁶ K/m in the liquid and a steady-state s-l interface velocity of 0.1 m/s.
Metals 09 00014 g006
Figure 7. Dendrite morphologies obtained in 2D steady-state simulations with a temperature gradient of 2.6 × 10⁶ K/m and a s-l interface velocity of 0.1 m/s.
Metals 09 00014 g007
Figure 8. Growth curves for steady-state solidification in 3D as a function of (a) height and (b) solidification time with a thermal gradient of 2.6 × 10⁶ K/m in the liquid and different steady-state s-l interface velocities.
Metals 09 00014 g008
Figure 9. Dendrite morphologies in 3D obtained for (a) D=2 e-9 m2/s and s-l interface temperature=1630K, (b) D=2 e-9 m2/s and s-l interface temperature =1620K and (c) D=1 e-9 m2/s and s-l interface temperature =1620K and in the presence of a superimposed noise of sd = 1000 with a temperature gradient of 2.6 × 10⁶ K/m in the liquid.
Metals 09 00014 g009
Figure 10. (a) Effect of anti-trapping term on Nb partitioning and dendrite morphology during solidification in a temperature gradient of 2.6 × 10⁶ K/m and a s-l interface velocity of 0.1 m/s, (b) shows the segregation without anti trapping. The microstructure after cooling the domain below the equilibrium solidus of 1537K is shown in (c).
Metals 09 00014 g010
Figure 11. 2D simulations of solidification using random nucleation and a temperature gradient of 2.6 × 10⁶ K/m. Simulation volume 5 μm × 15 μm. Simulated s-l interface (a) position as function of time and velocity as function of time (b) distance (c) and as a function of interface temperature (d).
Metals 09 00014 g011
Figure 12. 2D simulations of solidification using random nucleation with an initial s-l interface temperature of 1630 K, G = of 2.6 × 10⁶ K/m, D = 1 × 10⁻⁹ m2/s and sd = 500. Simulation volume 5 μm × 15 μm. Contour plots showing the distribution of (a) temperature, (b) phase field mobility, (c) Nb concentration and (d) order parameter.
Metals 09 00014 g012
Figure 13. Effect of initial undercooling at the s-l interface and the temperature gradient in the liquid on the solidification morphology. D = 1 × 10⁻⁹ m2/s and sd = 500.
Metals 09 00014 g013
Figure 14. Effect of increasing the diffusion coefficient to 2 × 10⁻⁹ m2/s on the dendrite morphologies.
Metals 09 00014 g014
Figure 15. Dendrite growth kinetics for non-steady-state solidification with an imposed temperature gradient in the liquid an initial s-l interface temperature of 1630 K. Simulated s-l interface (a) position as function of time and velocity as function of time (b) distance (c) and as a function of interface temperature (d).
Metals 09 00014 g015
Figure 16. Simulation of non-steady state solidification in 3D with an imposed temperature gradient in the liquid of 2.6 × 10⁶ K/m, and an initial interface temperature of 1630 K at (a) t= 35 ms, (b)=70 ms and (c) 98 ms.
Metals 09 00014 g016
Figure 17. Simulation of non-steady state solidification in 3D with an imposed temperature gradient in the liquid of 4.6 × 10⁶ K/m, and an initial interface temperature of 1630 K.
Metals 09 00014 g017
Figure 18. Scheil solidification plot of Ni–0.6Fe–0.035Nb (at. fraction) model ternary alloy.
Metals 09 00014 g018
Figure 19. Scheil solidification plot for a Ni–Fe–Cr–Mo–Nb alloy with a nominal composition of IN 718.
Metals 09 00014 g019
Table 1. Laser track welding parameters used in the experiments.
Power (W)Scan Speed (m/s)G (K/m)Solidification period (sec)Cooling rate (K/s)Mean solidification velocity (m/s)
2850.962.6 × 1060.000542488160.096
1800.64.6 × 1060.000255360000.117
Table 2. List of AM parameters and microstructural data.
Sample numberPower, WSpeed, m/sPDAS, nm (stdev)SDAS, nm (stdev)
12850.96631.0 (197.7)216.5 (22.8)
21800.60486.3 (70.0)182.5 (11.0)
Table 3. Parameters used in the phase field simulations.
ParameterValue
Mesh resolution5 × 10−9 m
Alloy Composition (atom. fraction)Ni–0.60Fe–0.035Nb
Liquidus Temperature (K)1680.0 (calculated using Thermocalc)
Solidus Temperature (K)1537.0 (calculated using Thermocalc)
Grain Boundary Energy (J/m2)0.16 [17]
Energy Anisotropy factor0.05 [17]
Temperature gradient (K/m)2.6 ×106 or 4.6 ×10⁶
Diffusion coefficient of Nb and Fe in solid ( D i S m2/s)0.0
Diffusion coefficient of Nb and Fe in liquid ( D i L m2/s)1.0 × 10−9 or 2.0 × 10⁻⁹ [17]
Steady-state velocity (m/s)0.1
Phase field mobility (m3/Js)Calculated for each site during simulation using Kim model [15]

