Dissimilar Metals Laser Welding between DP1000 Steel and Aluminum Alloy 1050

 ,
, 
 ,
,  and
and 
Abstract
1. Introduction
2. Materials and Methods
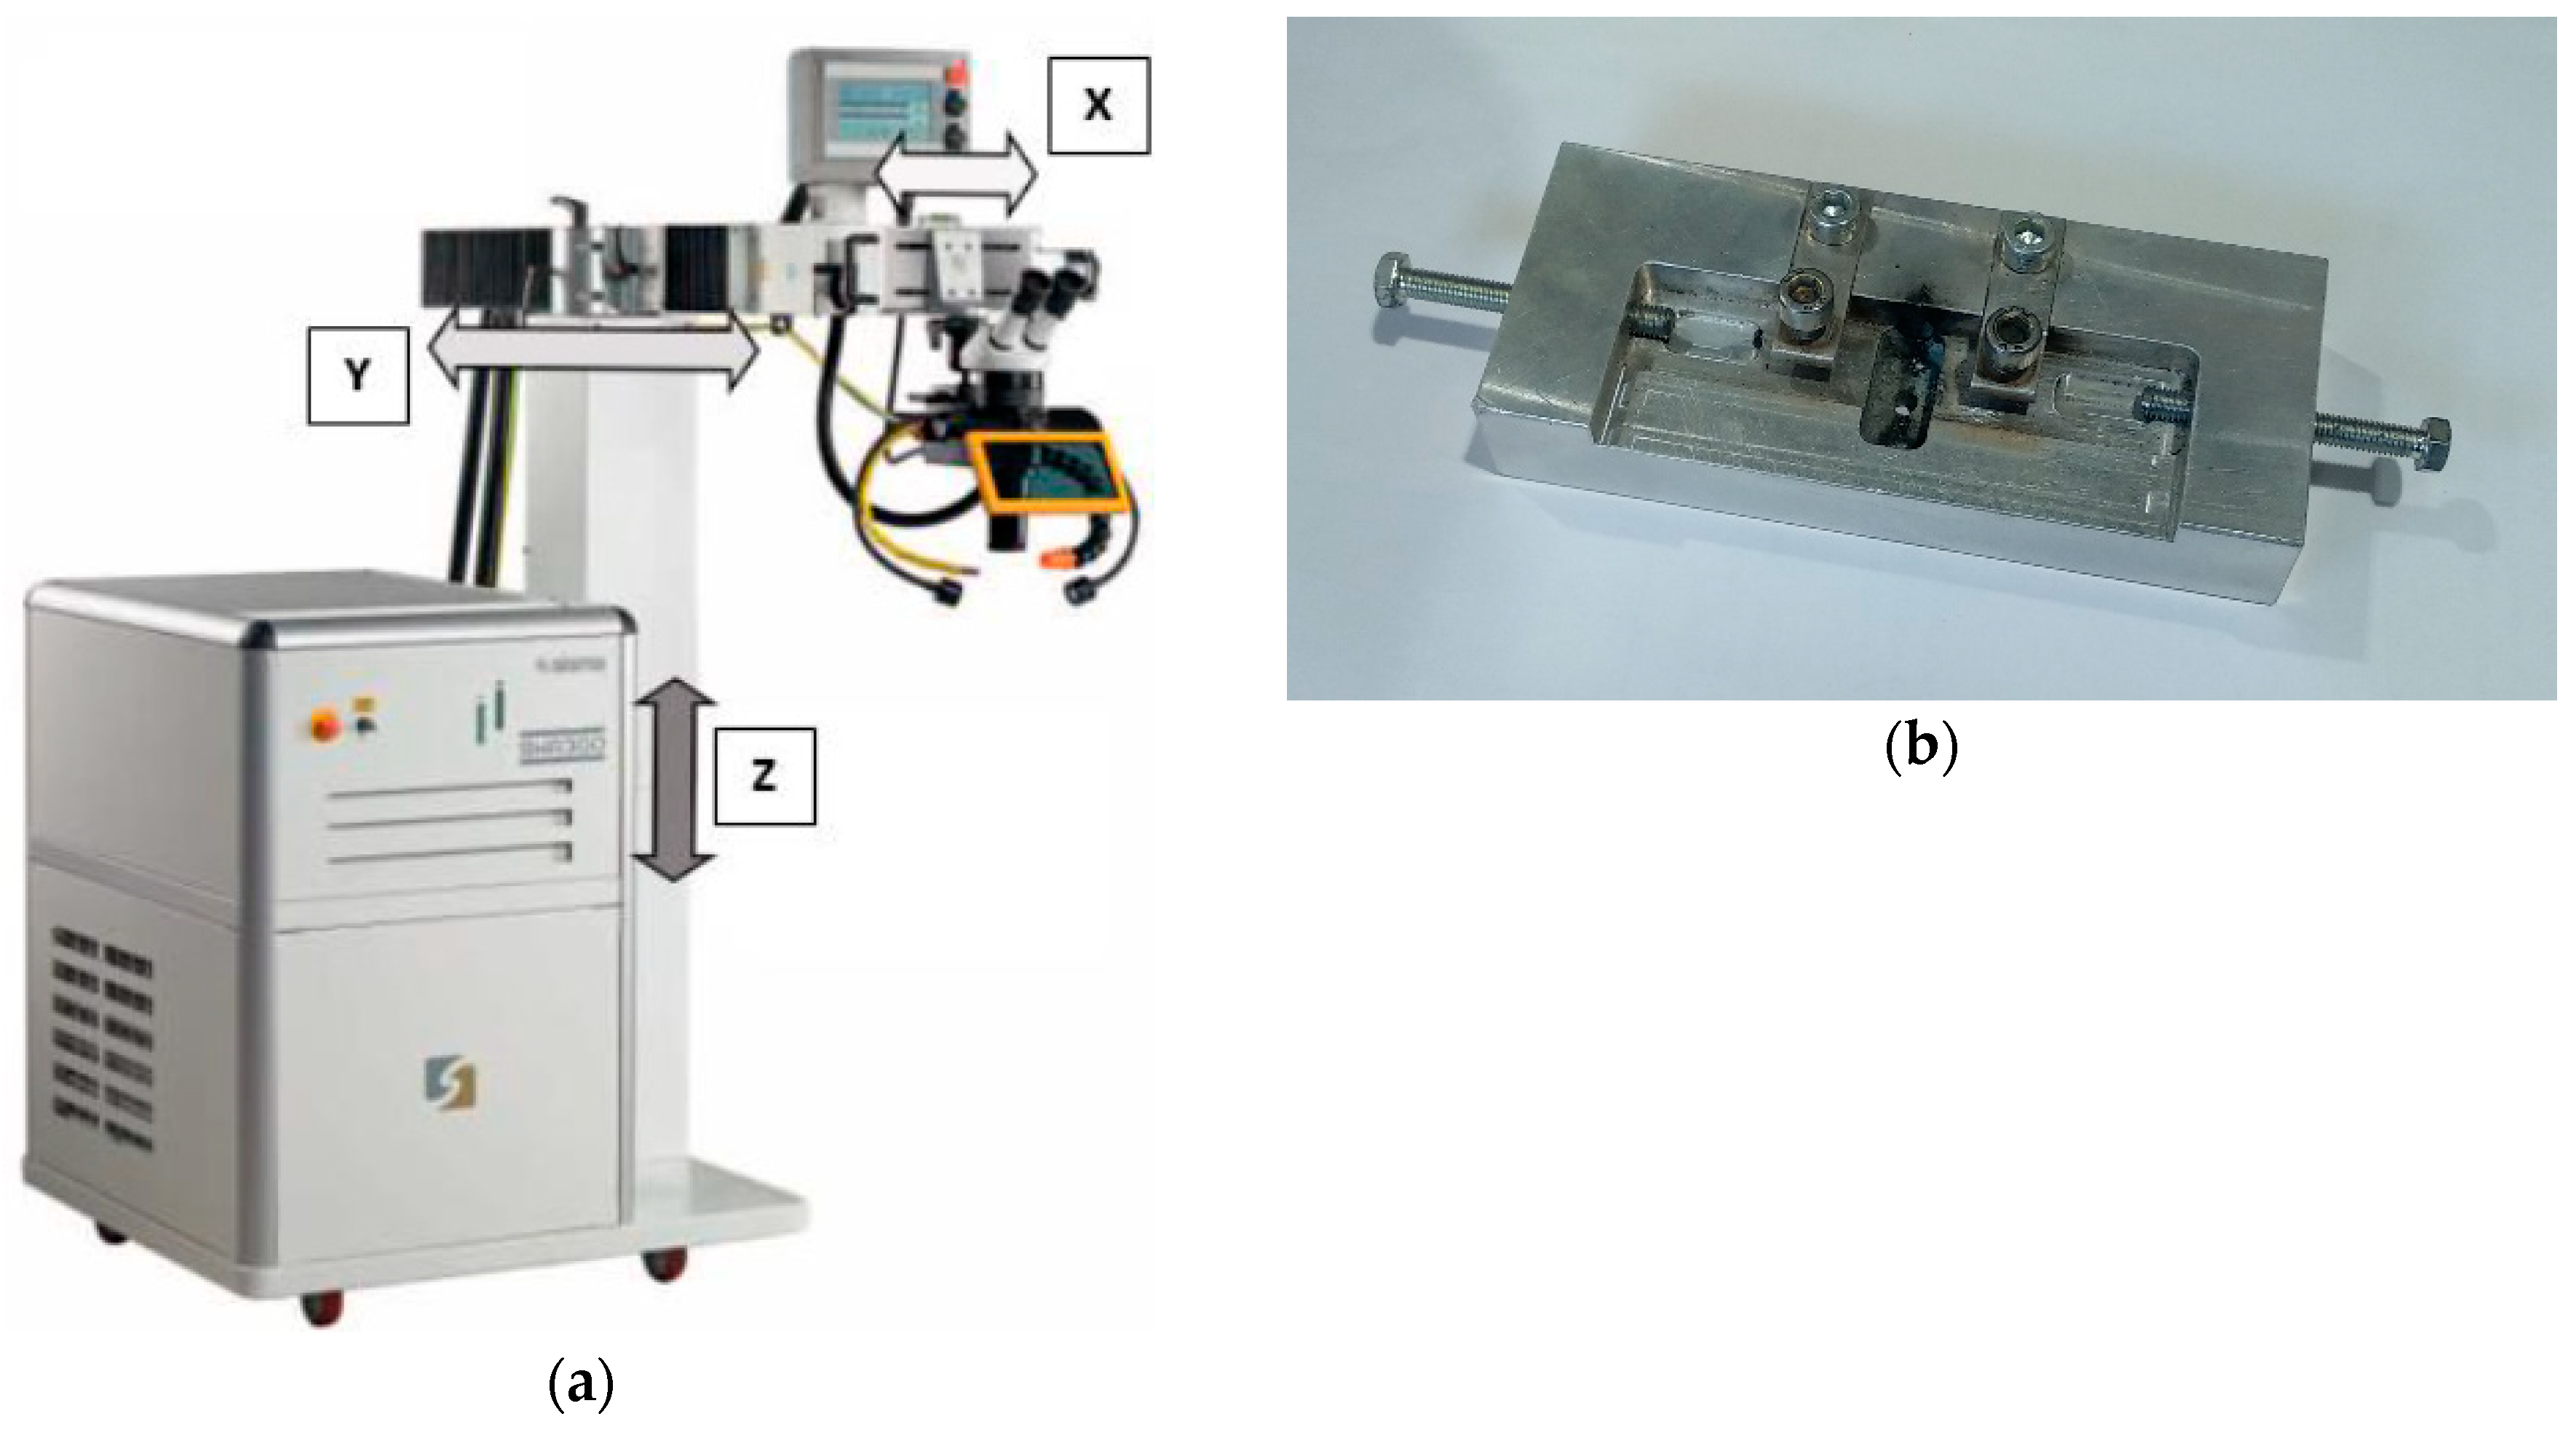
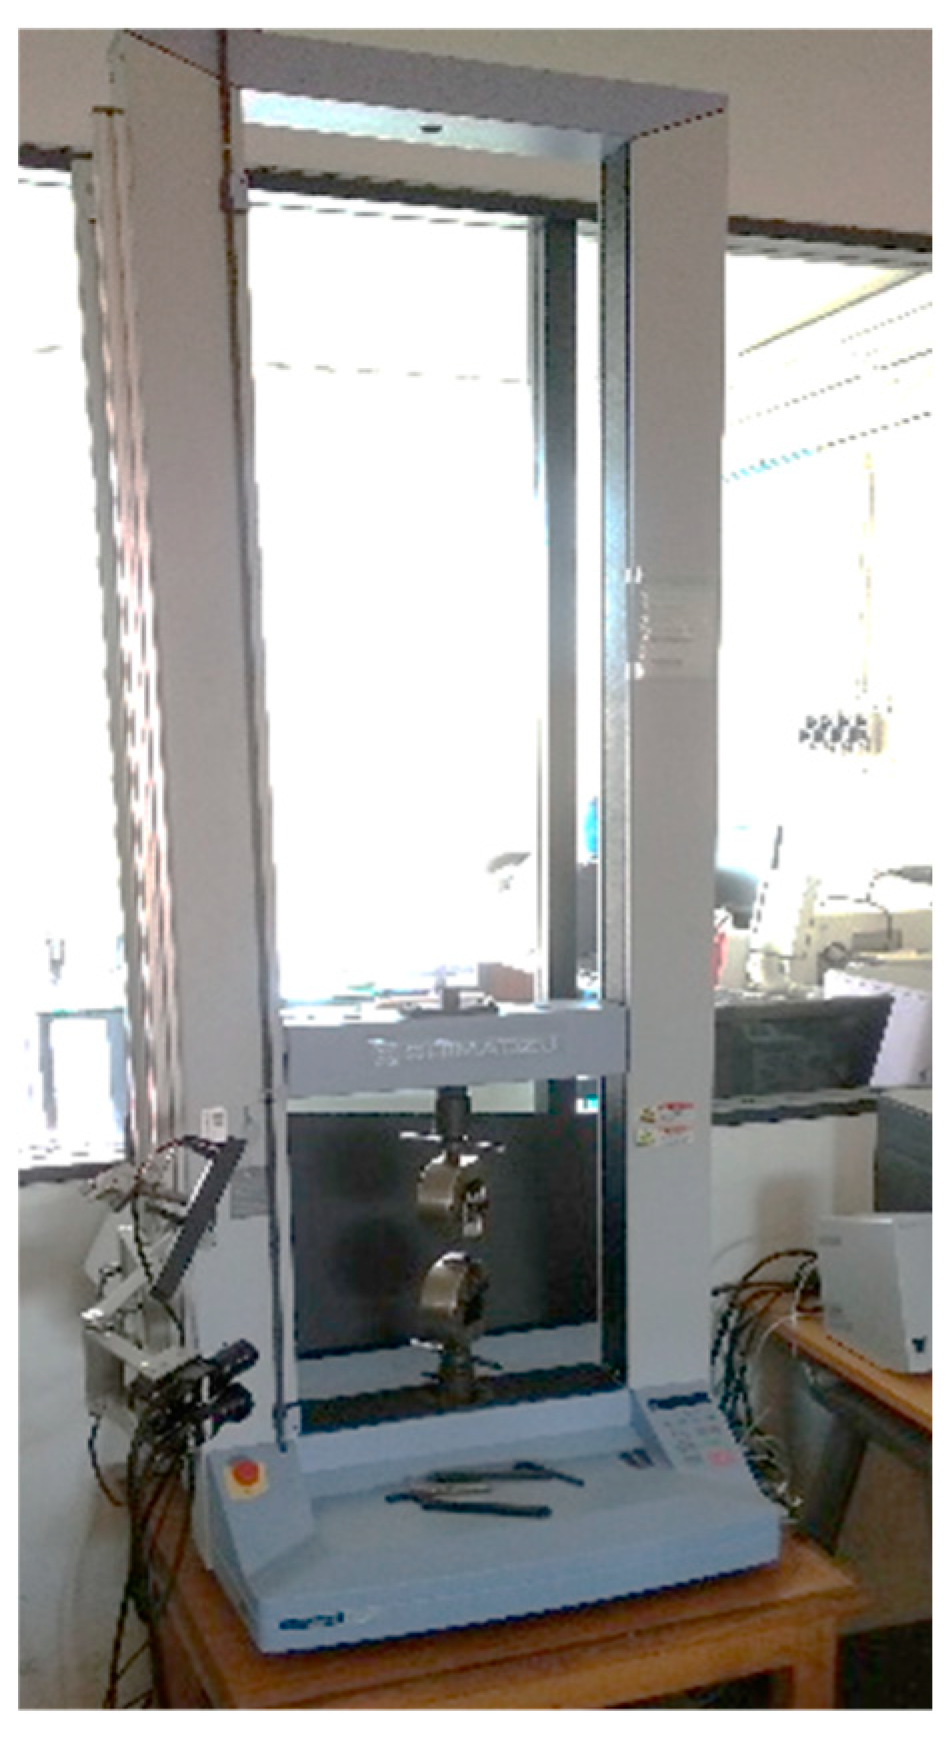
2.1. Laser Welding Machine
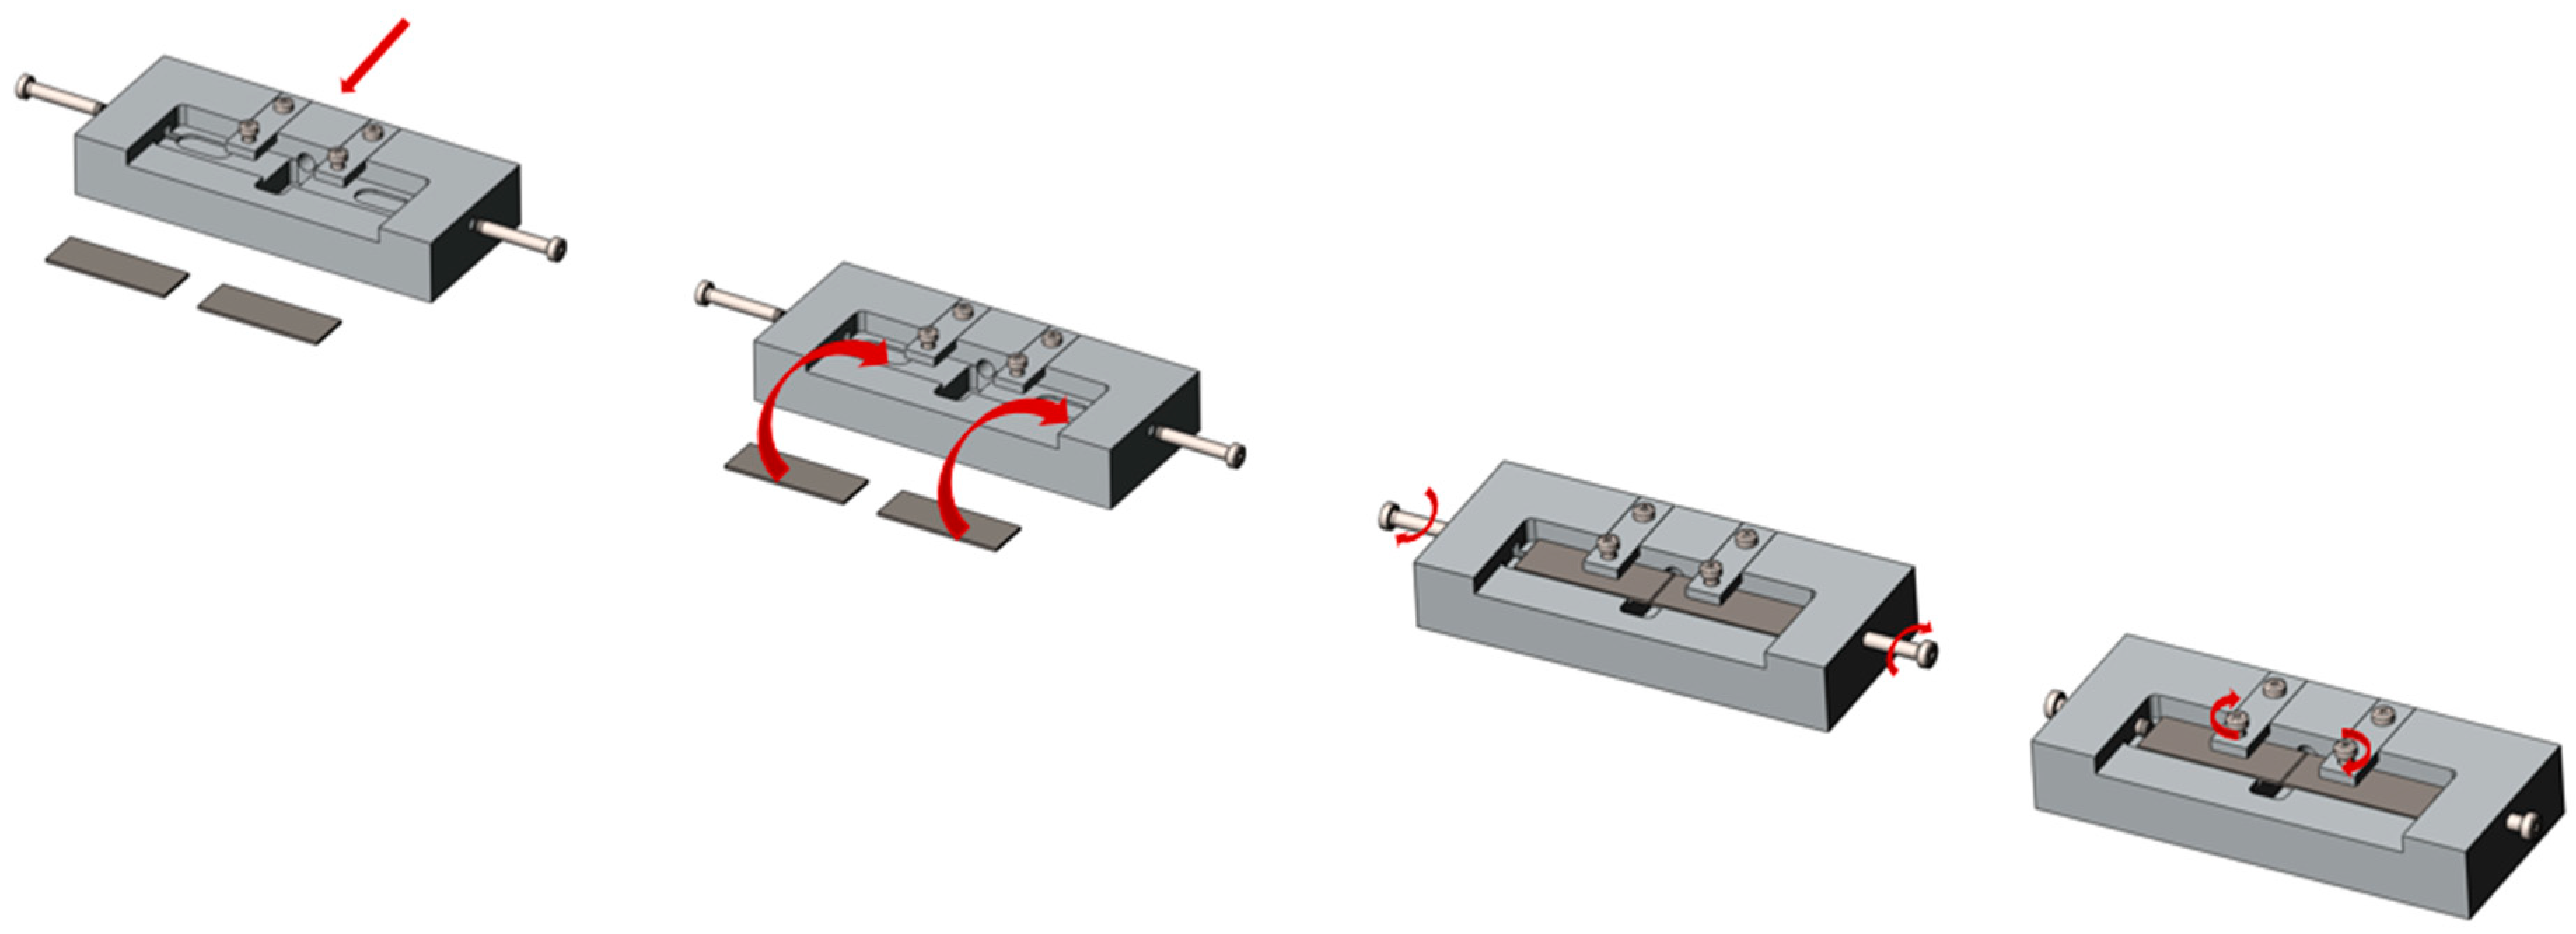
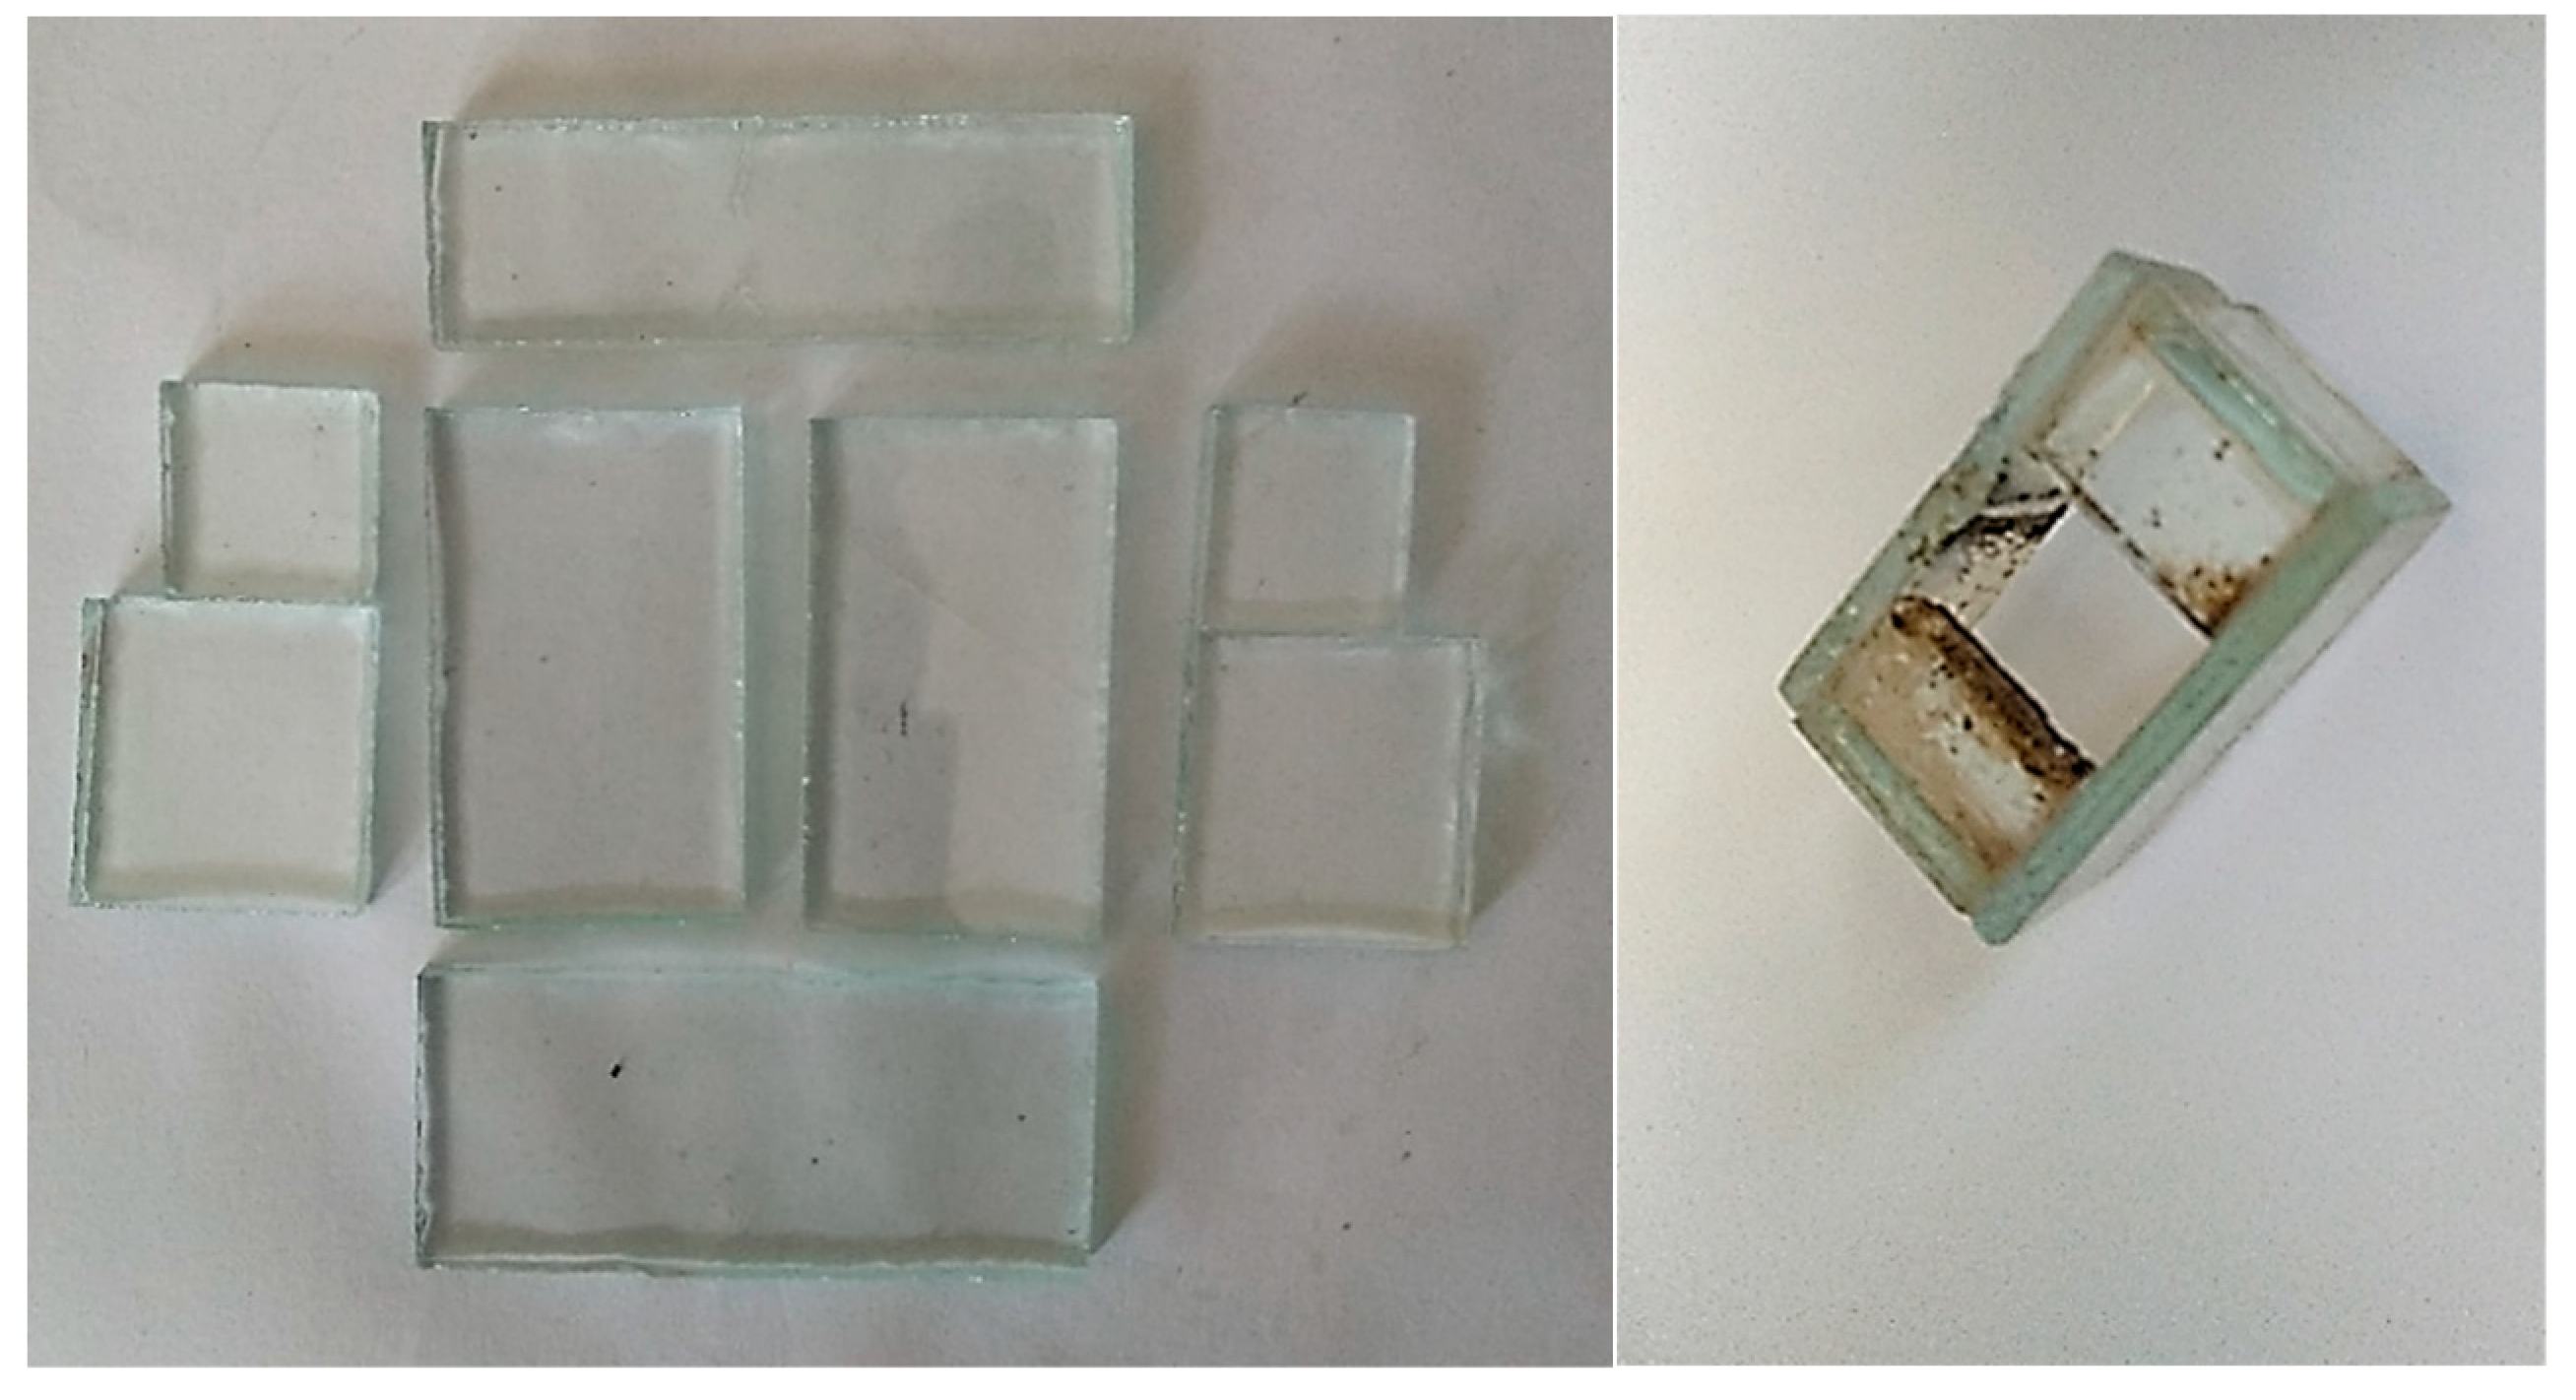
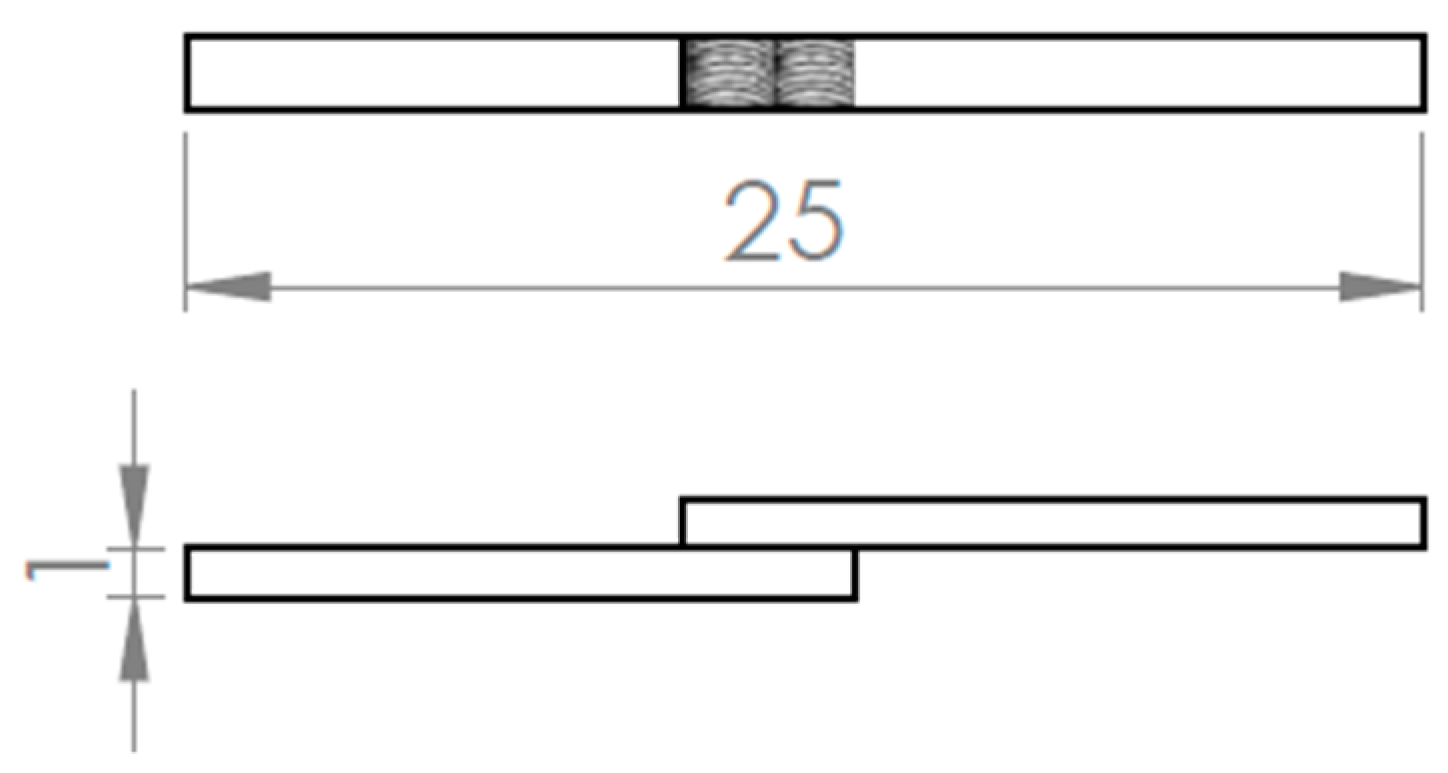
2.2. Materials and Samples
2.3. Laser Welding Parameters
- Laser beam power: the penetration was proportional to the laser beam power. The ideal values were situated between 6 kW and 7.20 kW of the maximum peak power of 12 kW.
- Pulse duration: the penetration was also proportional to higher pulse durations. Previous values were between 12–16 ms.
- Superposition: It did not influence penetration until values around 80%.
- Laser beam diameter: the penetration seemed to be inversely proportional to the welding spots diameter. A constant value of 1 mm was used.
- Welding speed: a high welding speed meant high penetration. The speed was then limited by the amount of power/energy and pulse duration used. For higher values of pulse duration and/or power (and thus energy), smaller values of speed were allowed for a proper welding process.
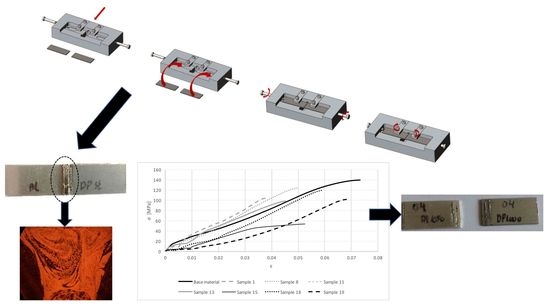
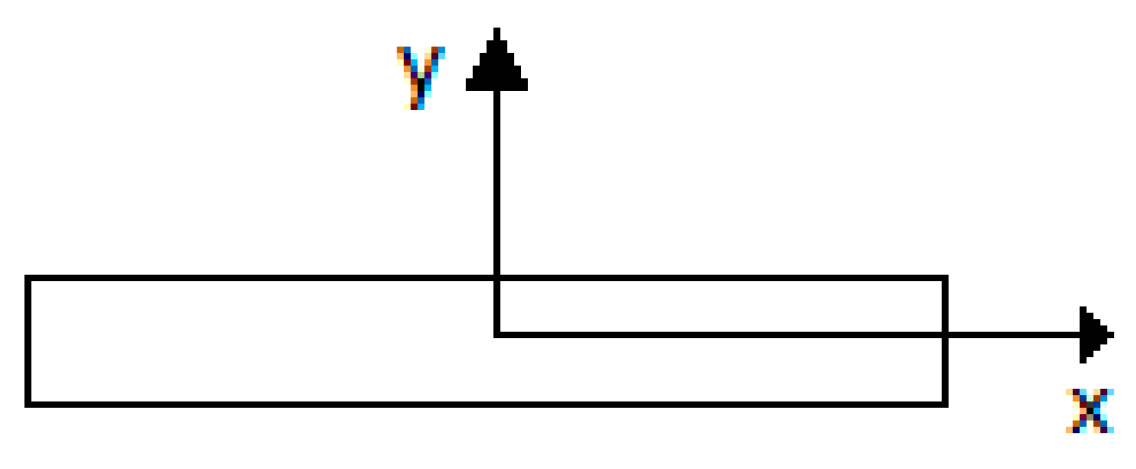
2.4. Tensile Testing
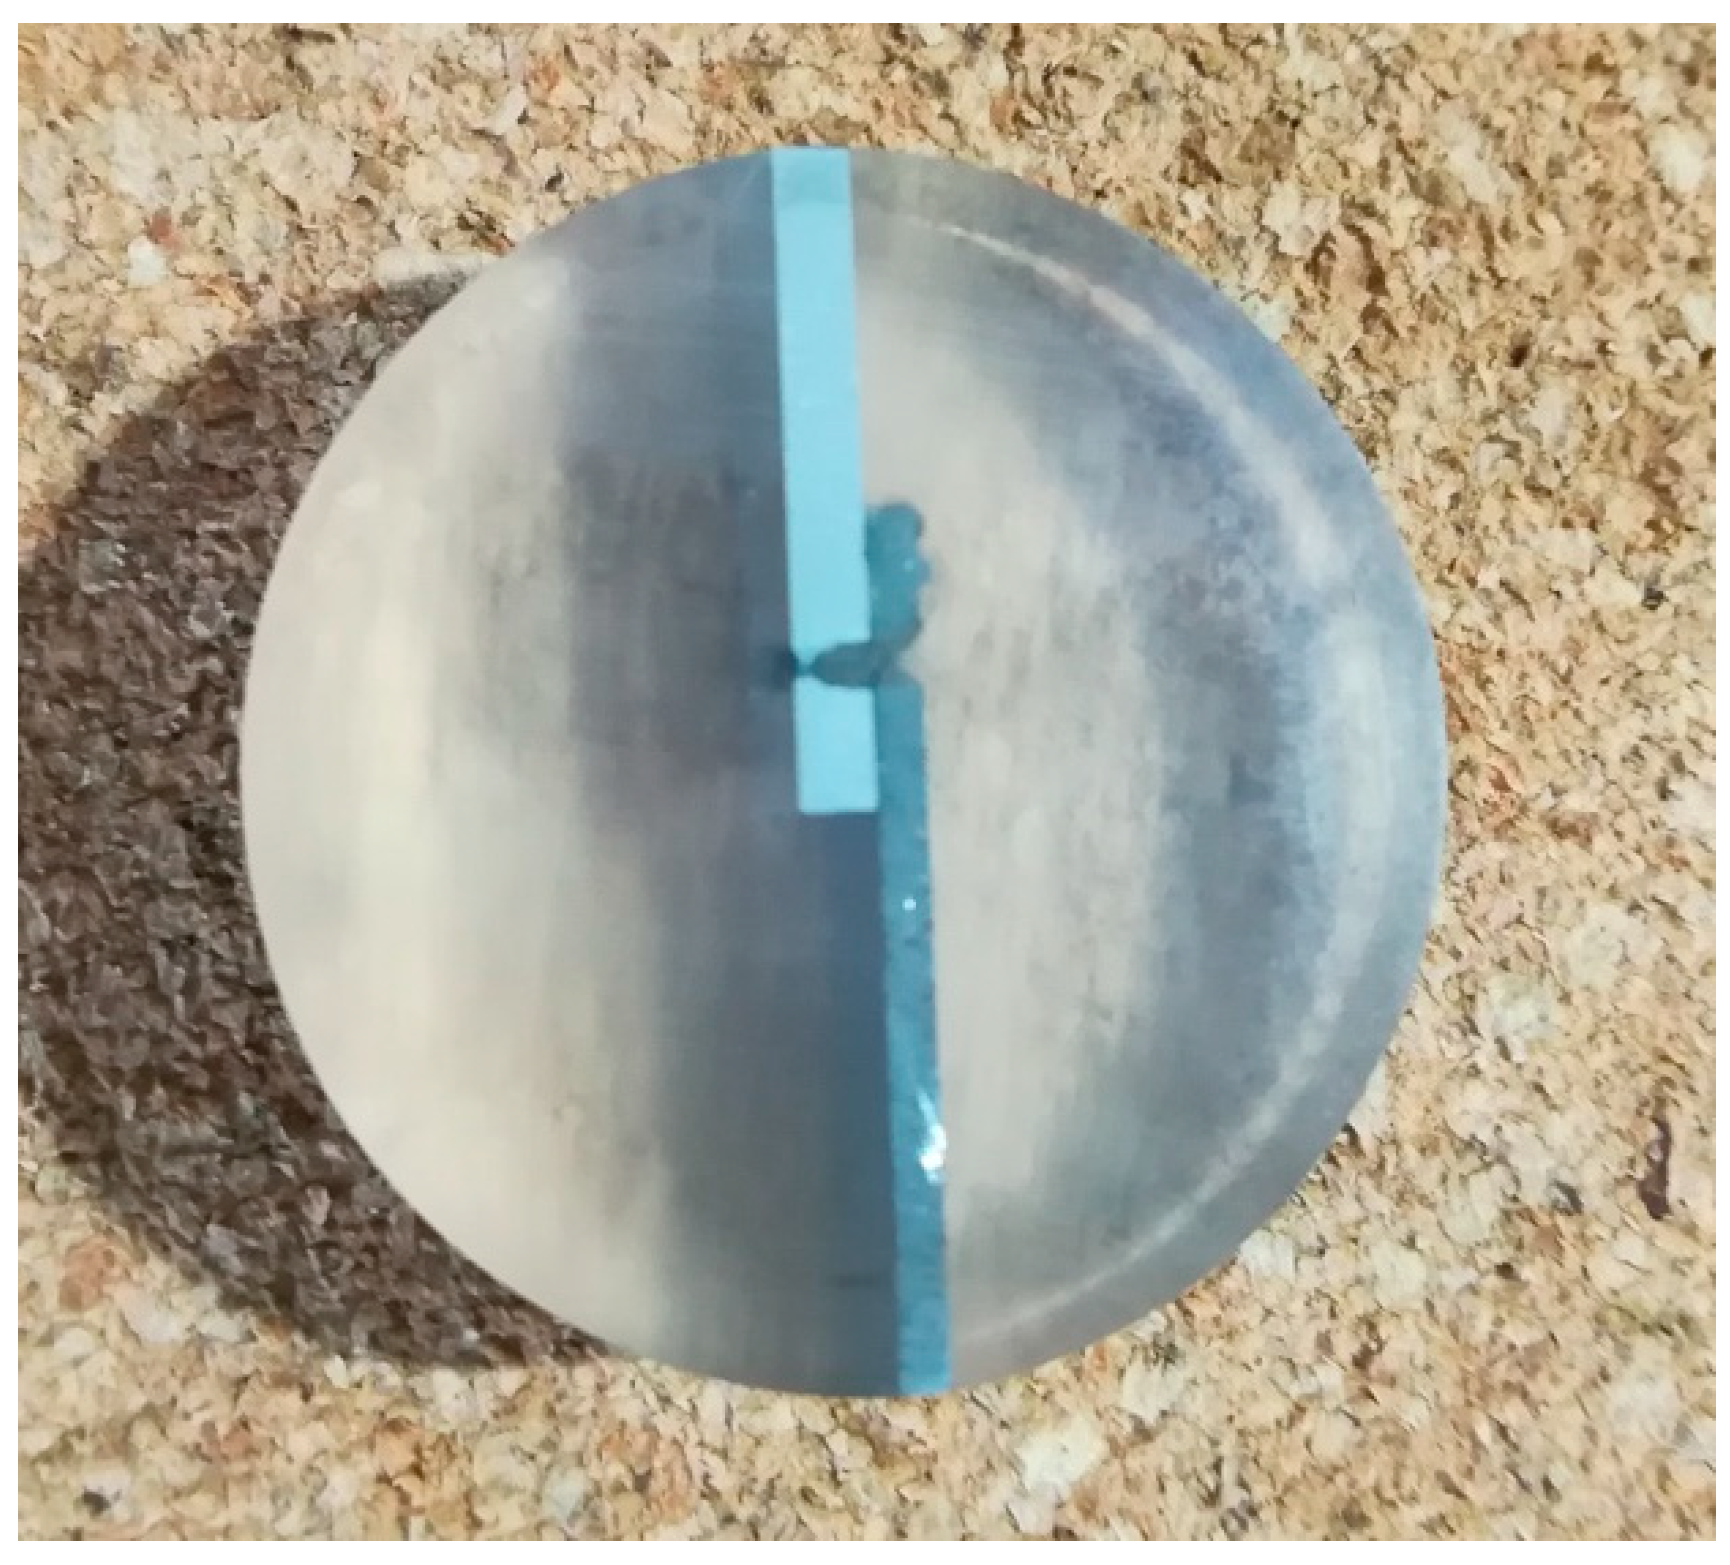
2.5. Microstructure
3. Results
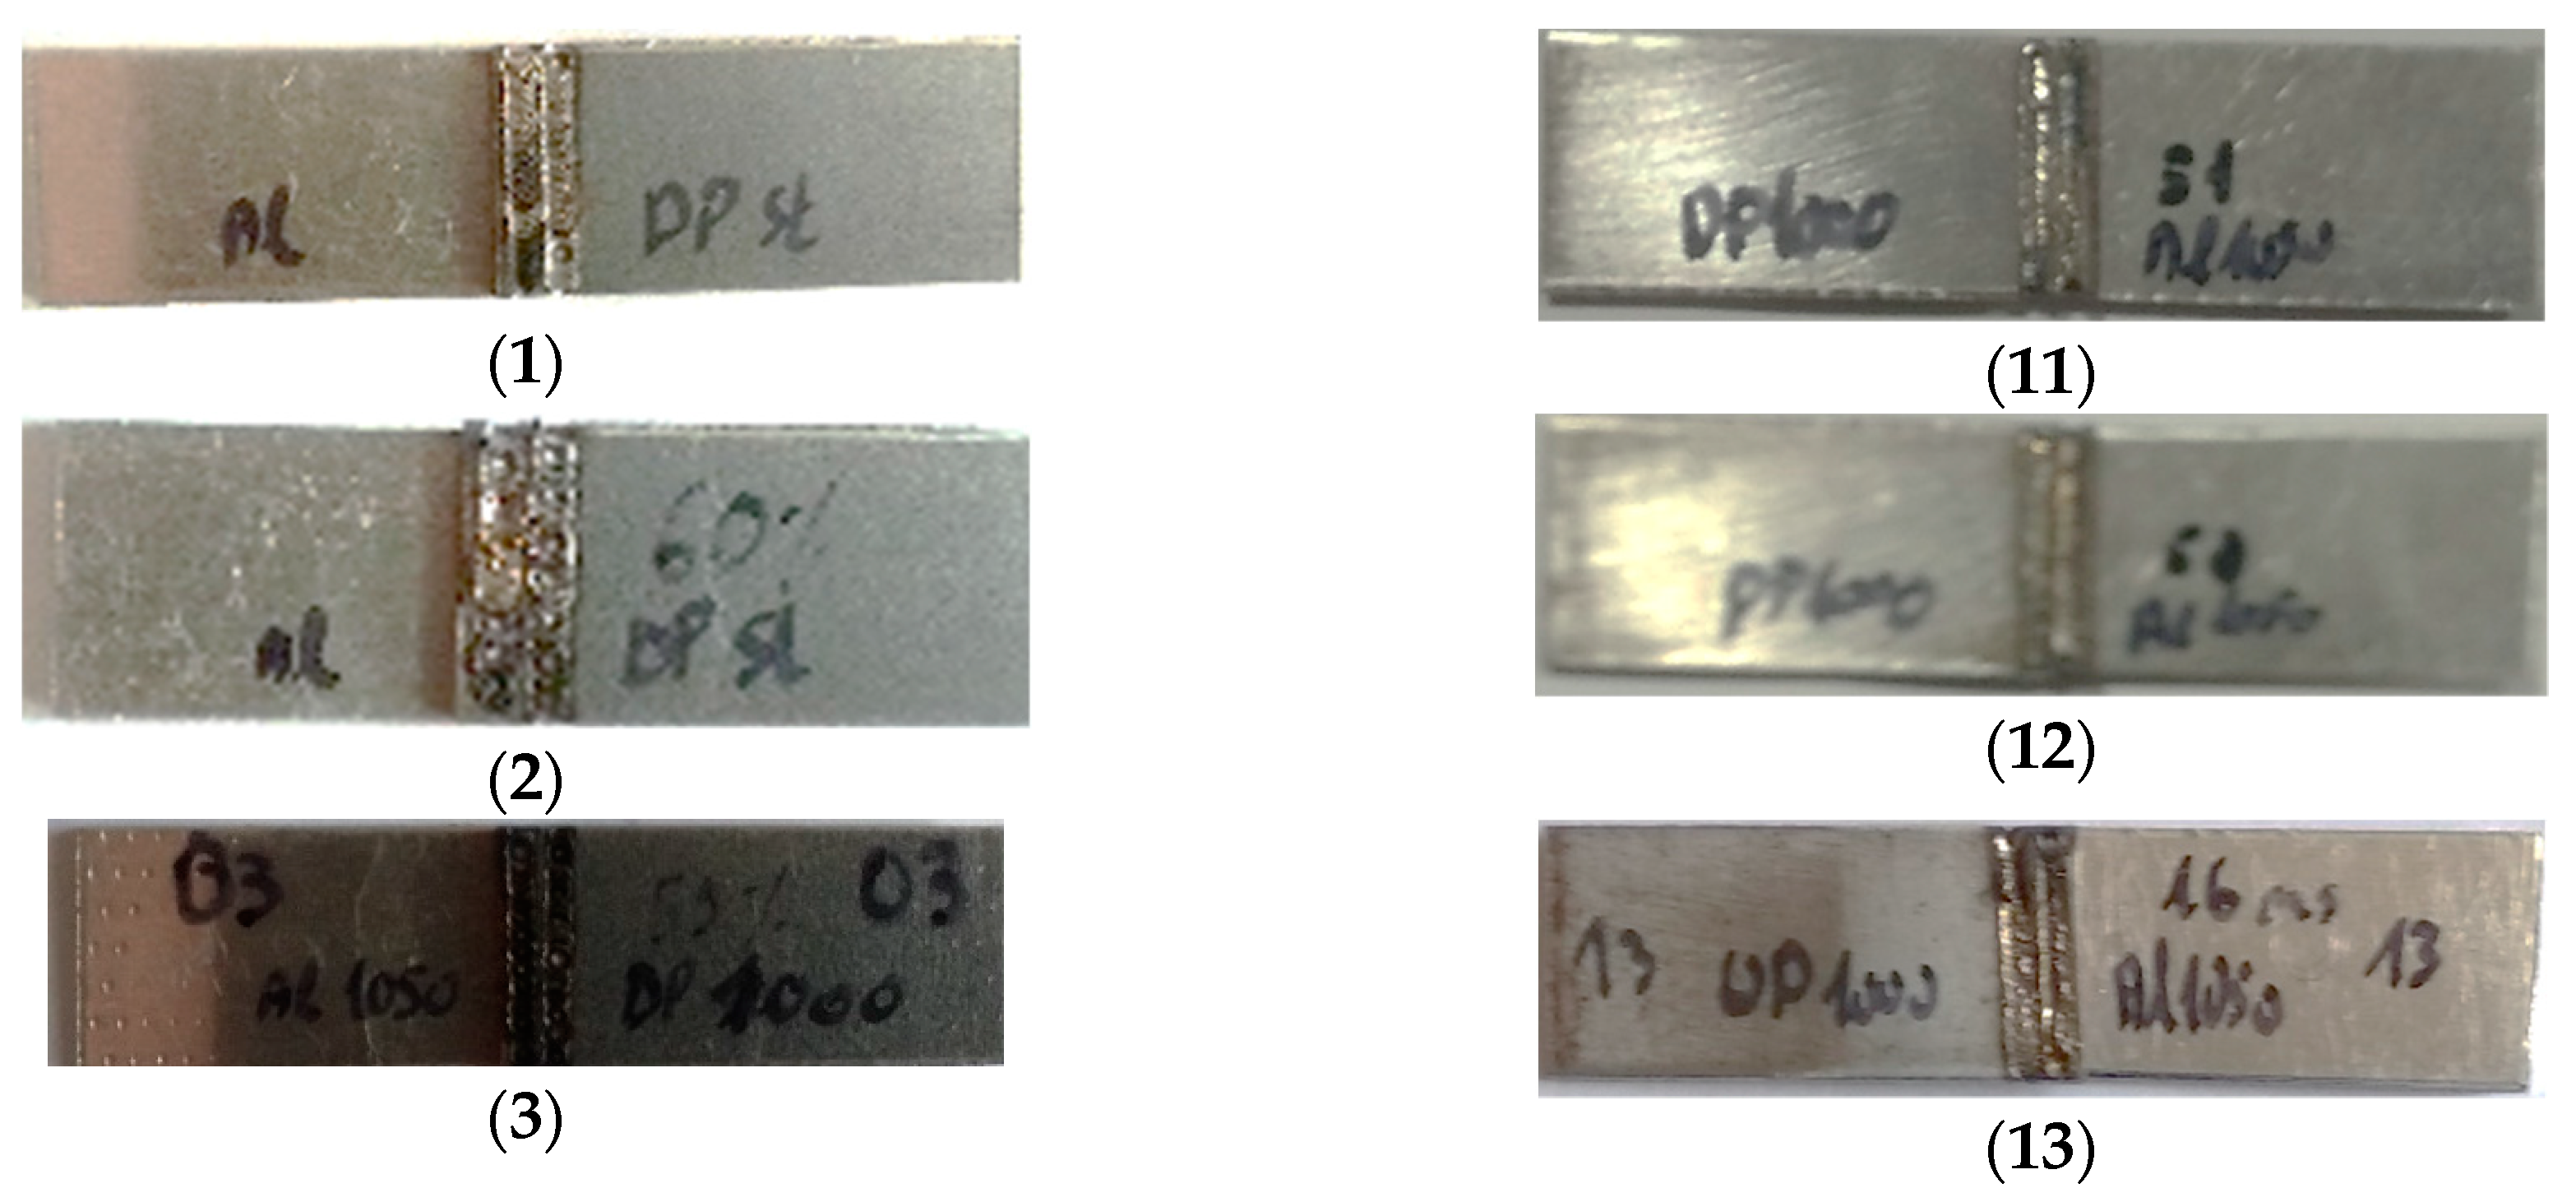
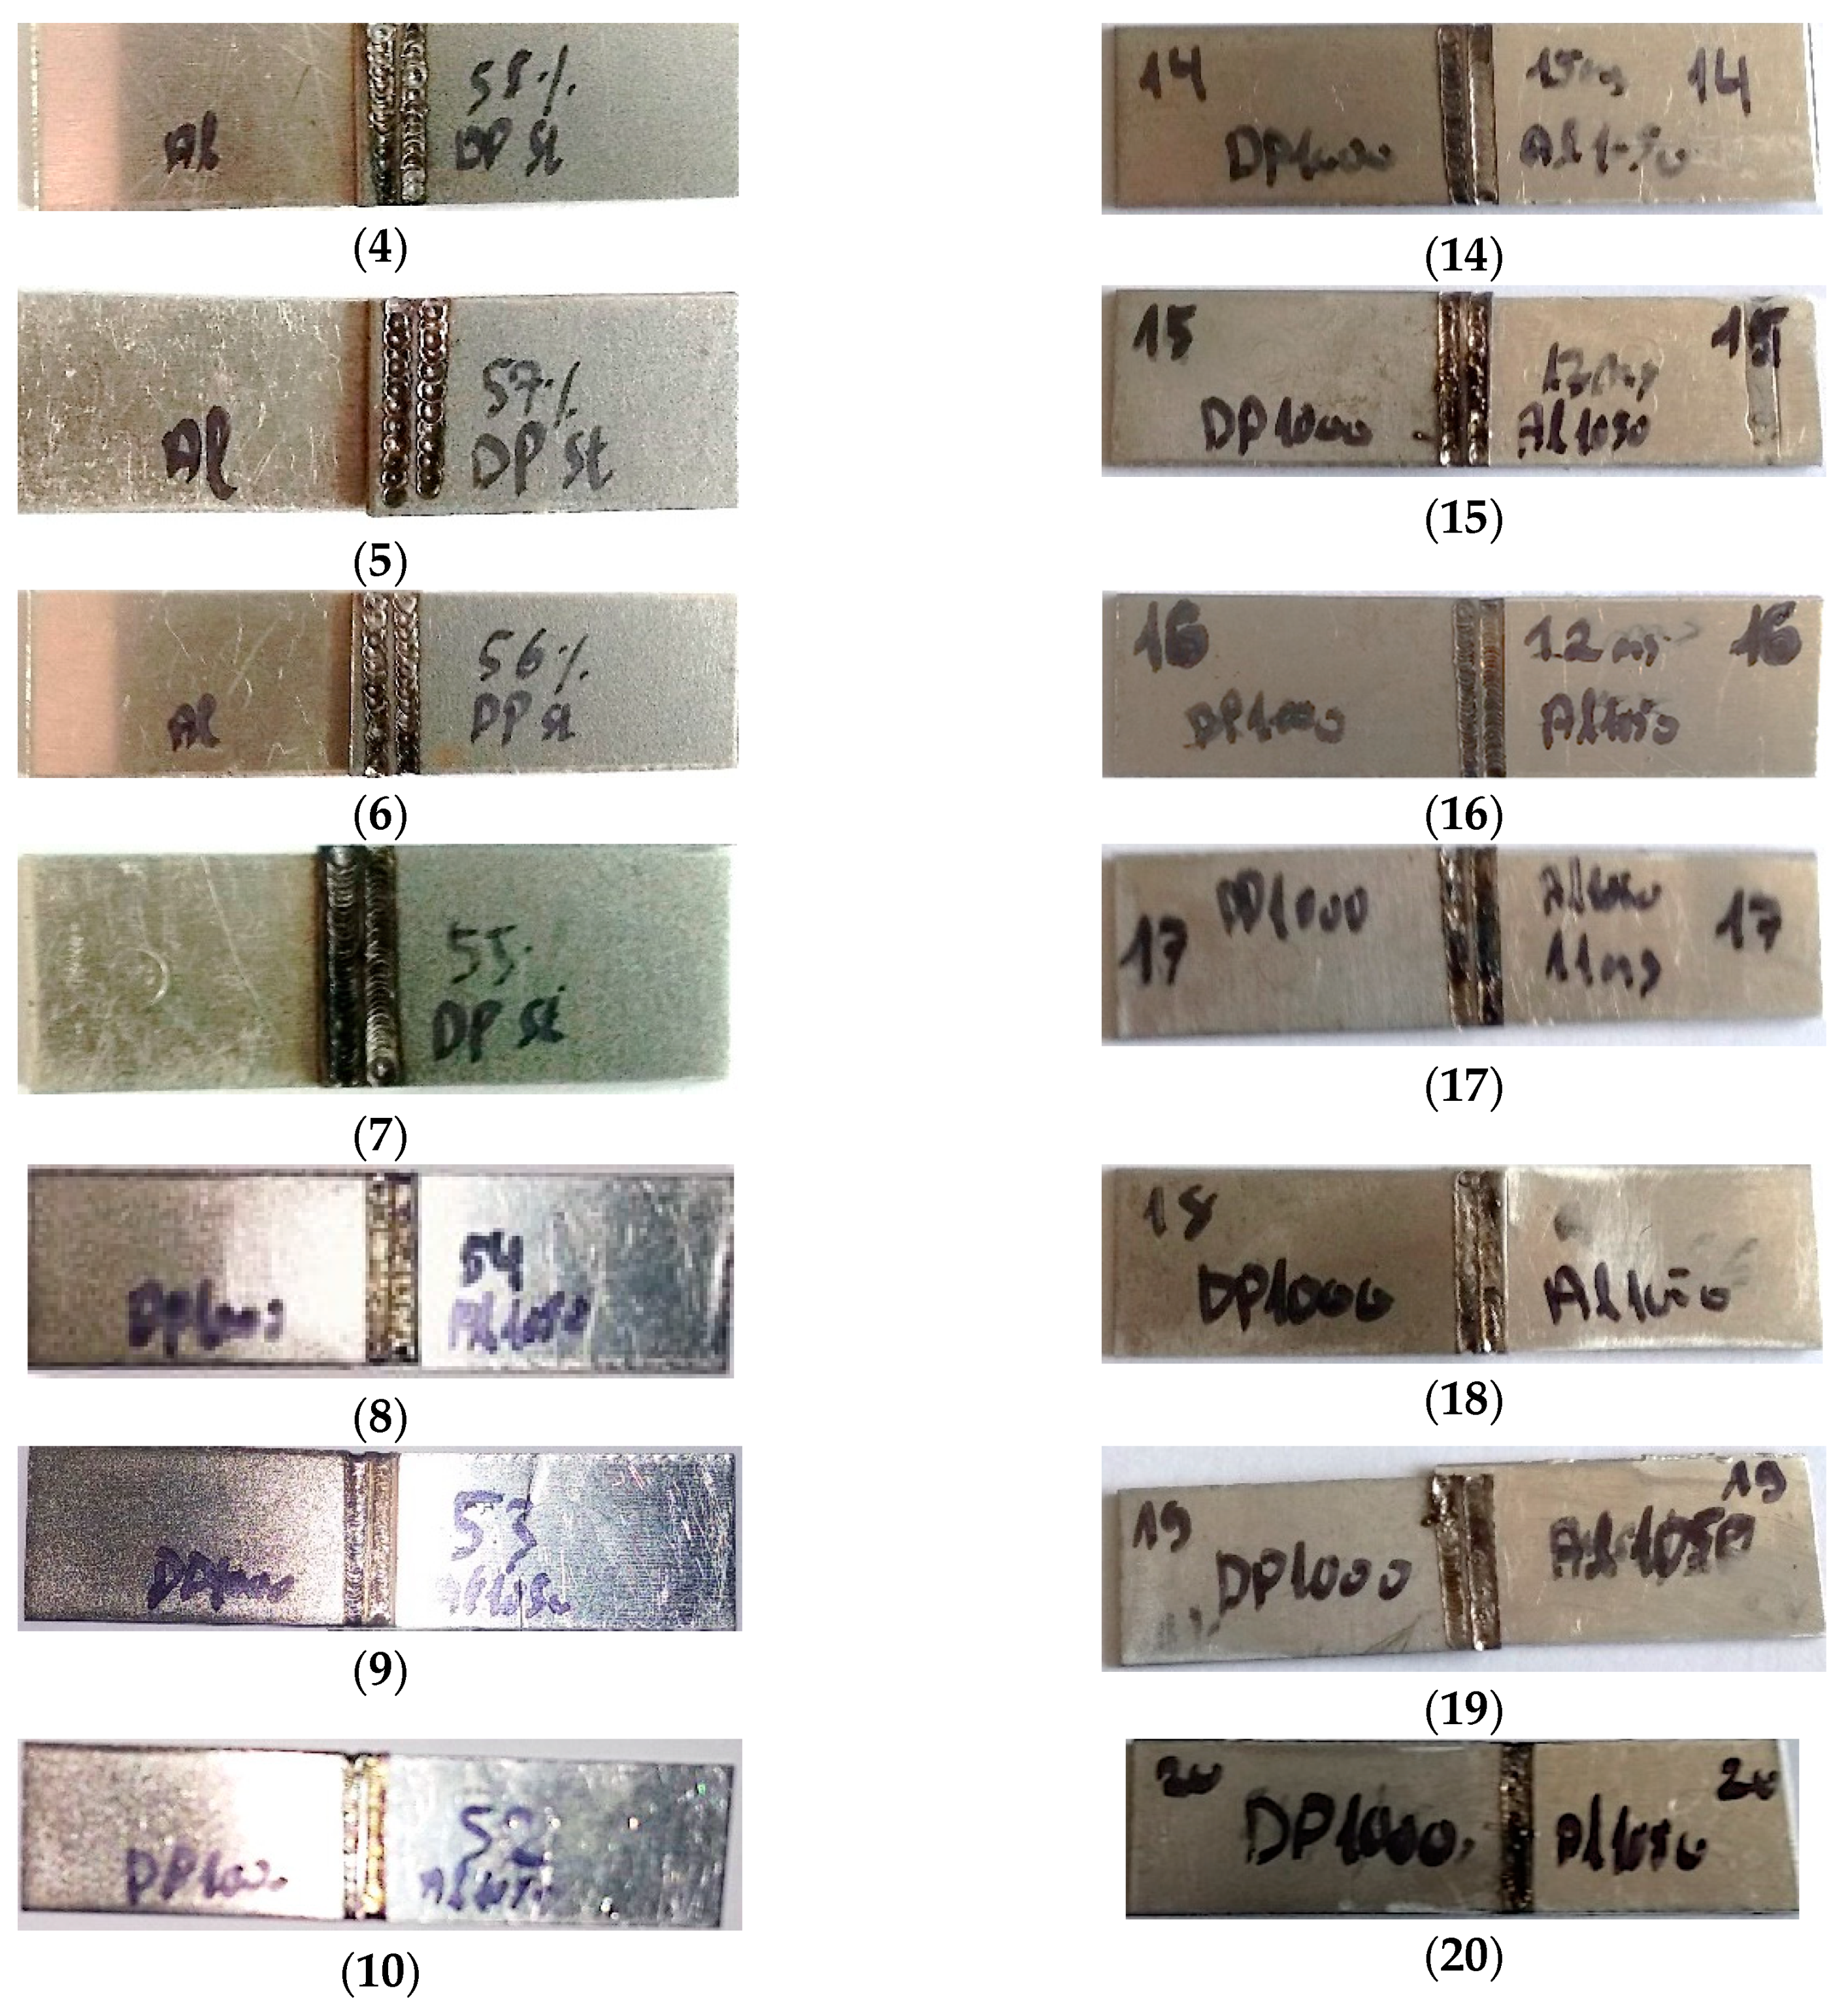
3.1. Laser Welding
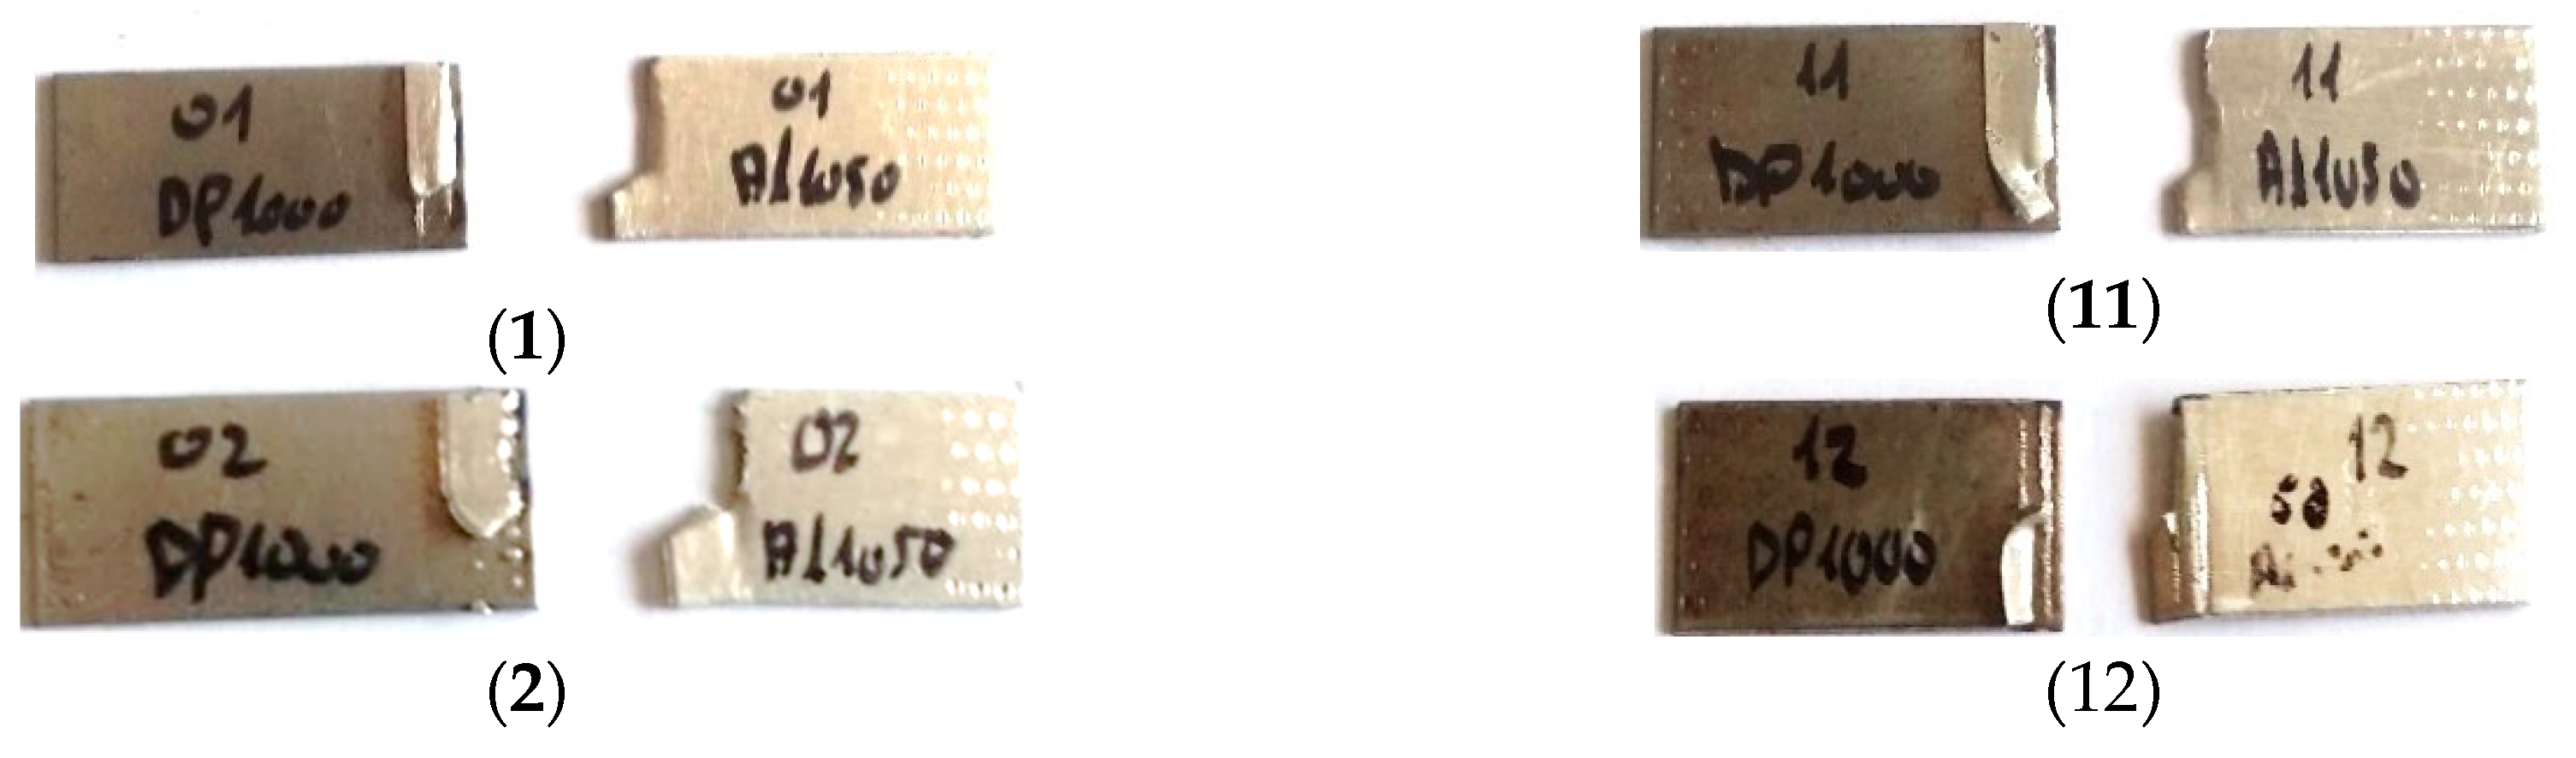
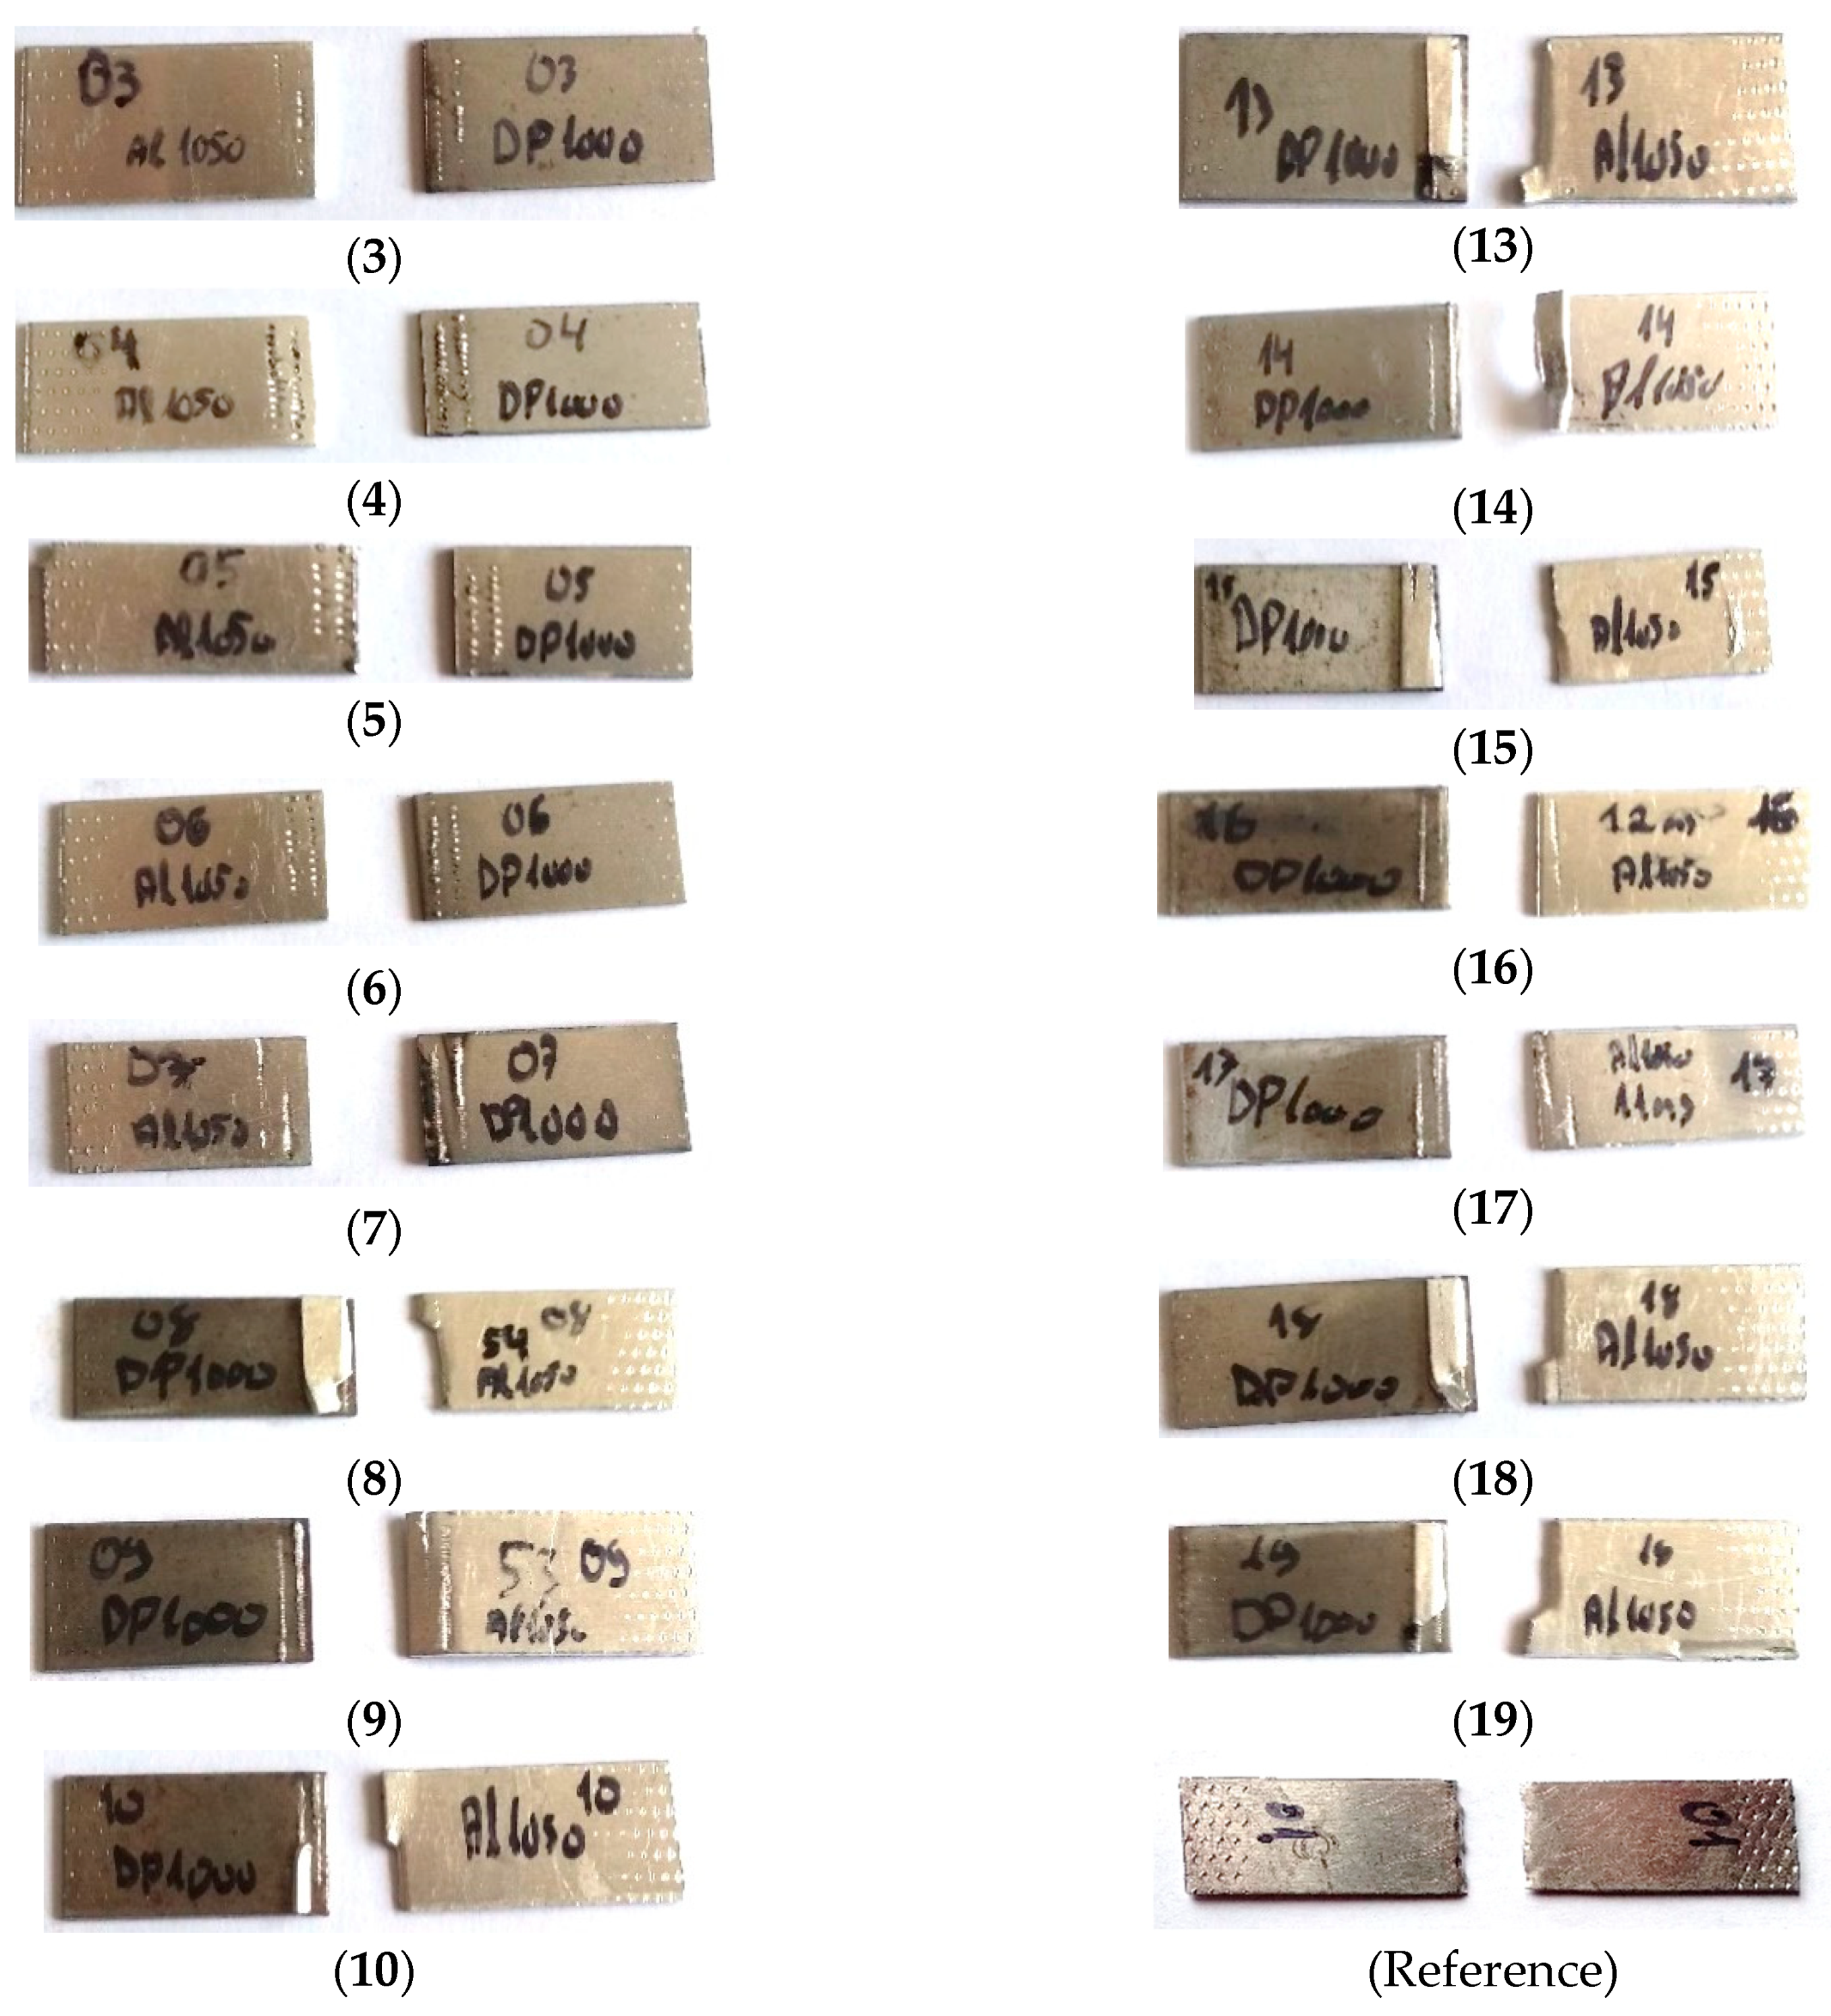
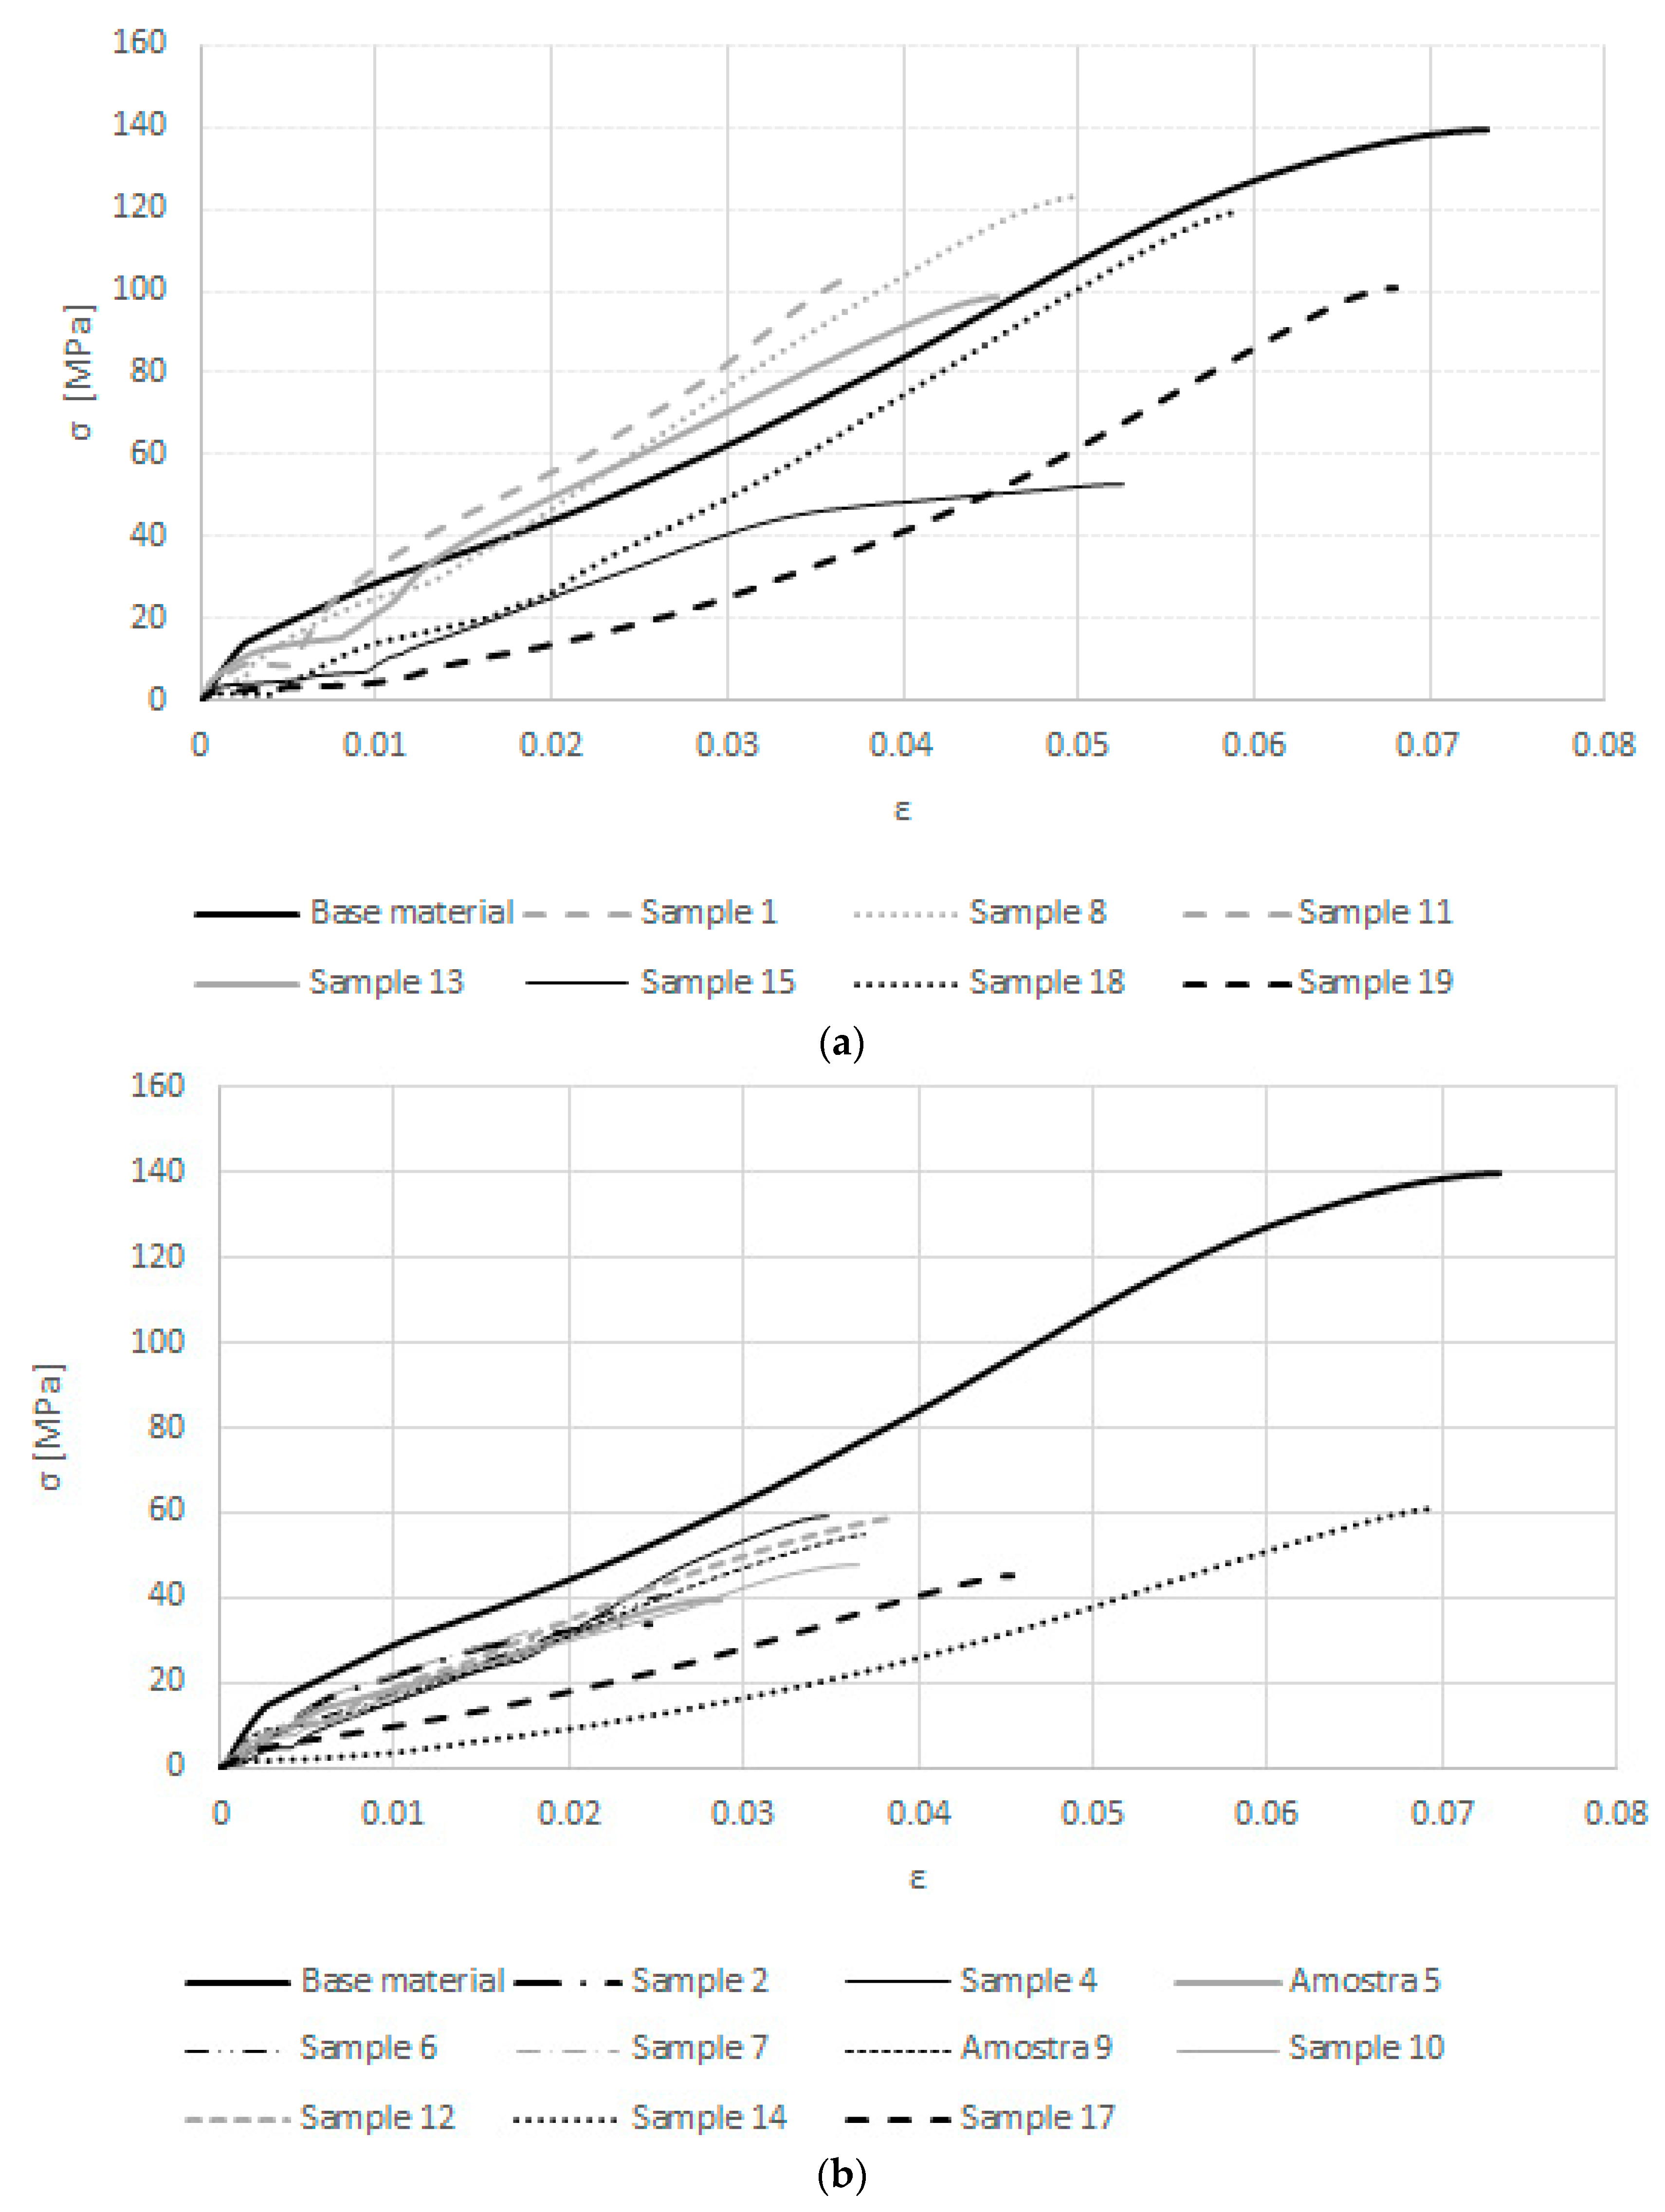
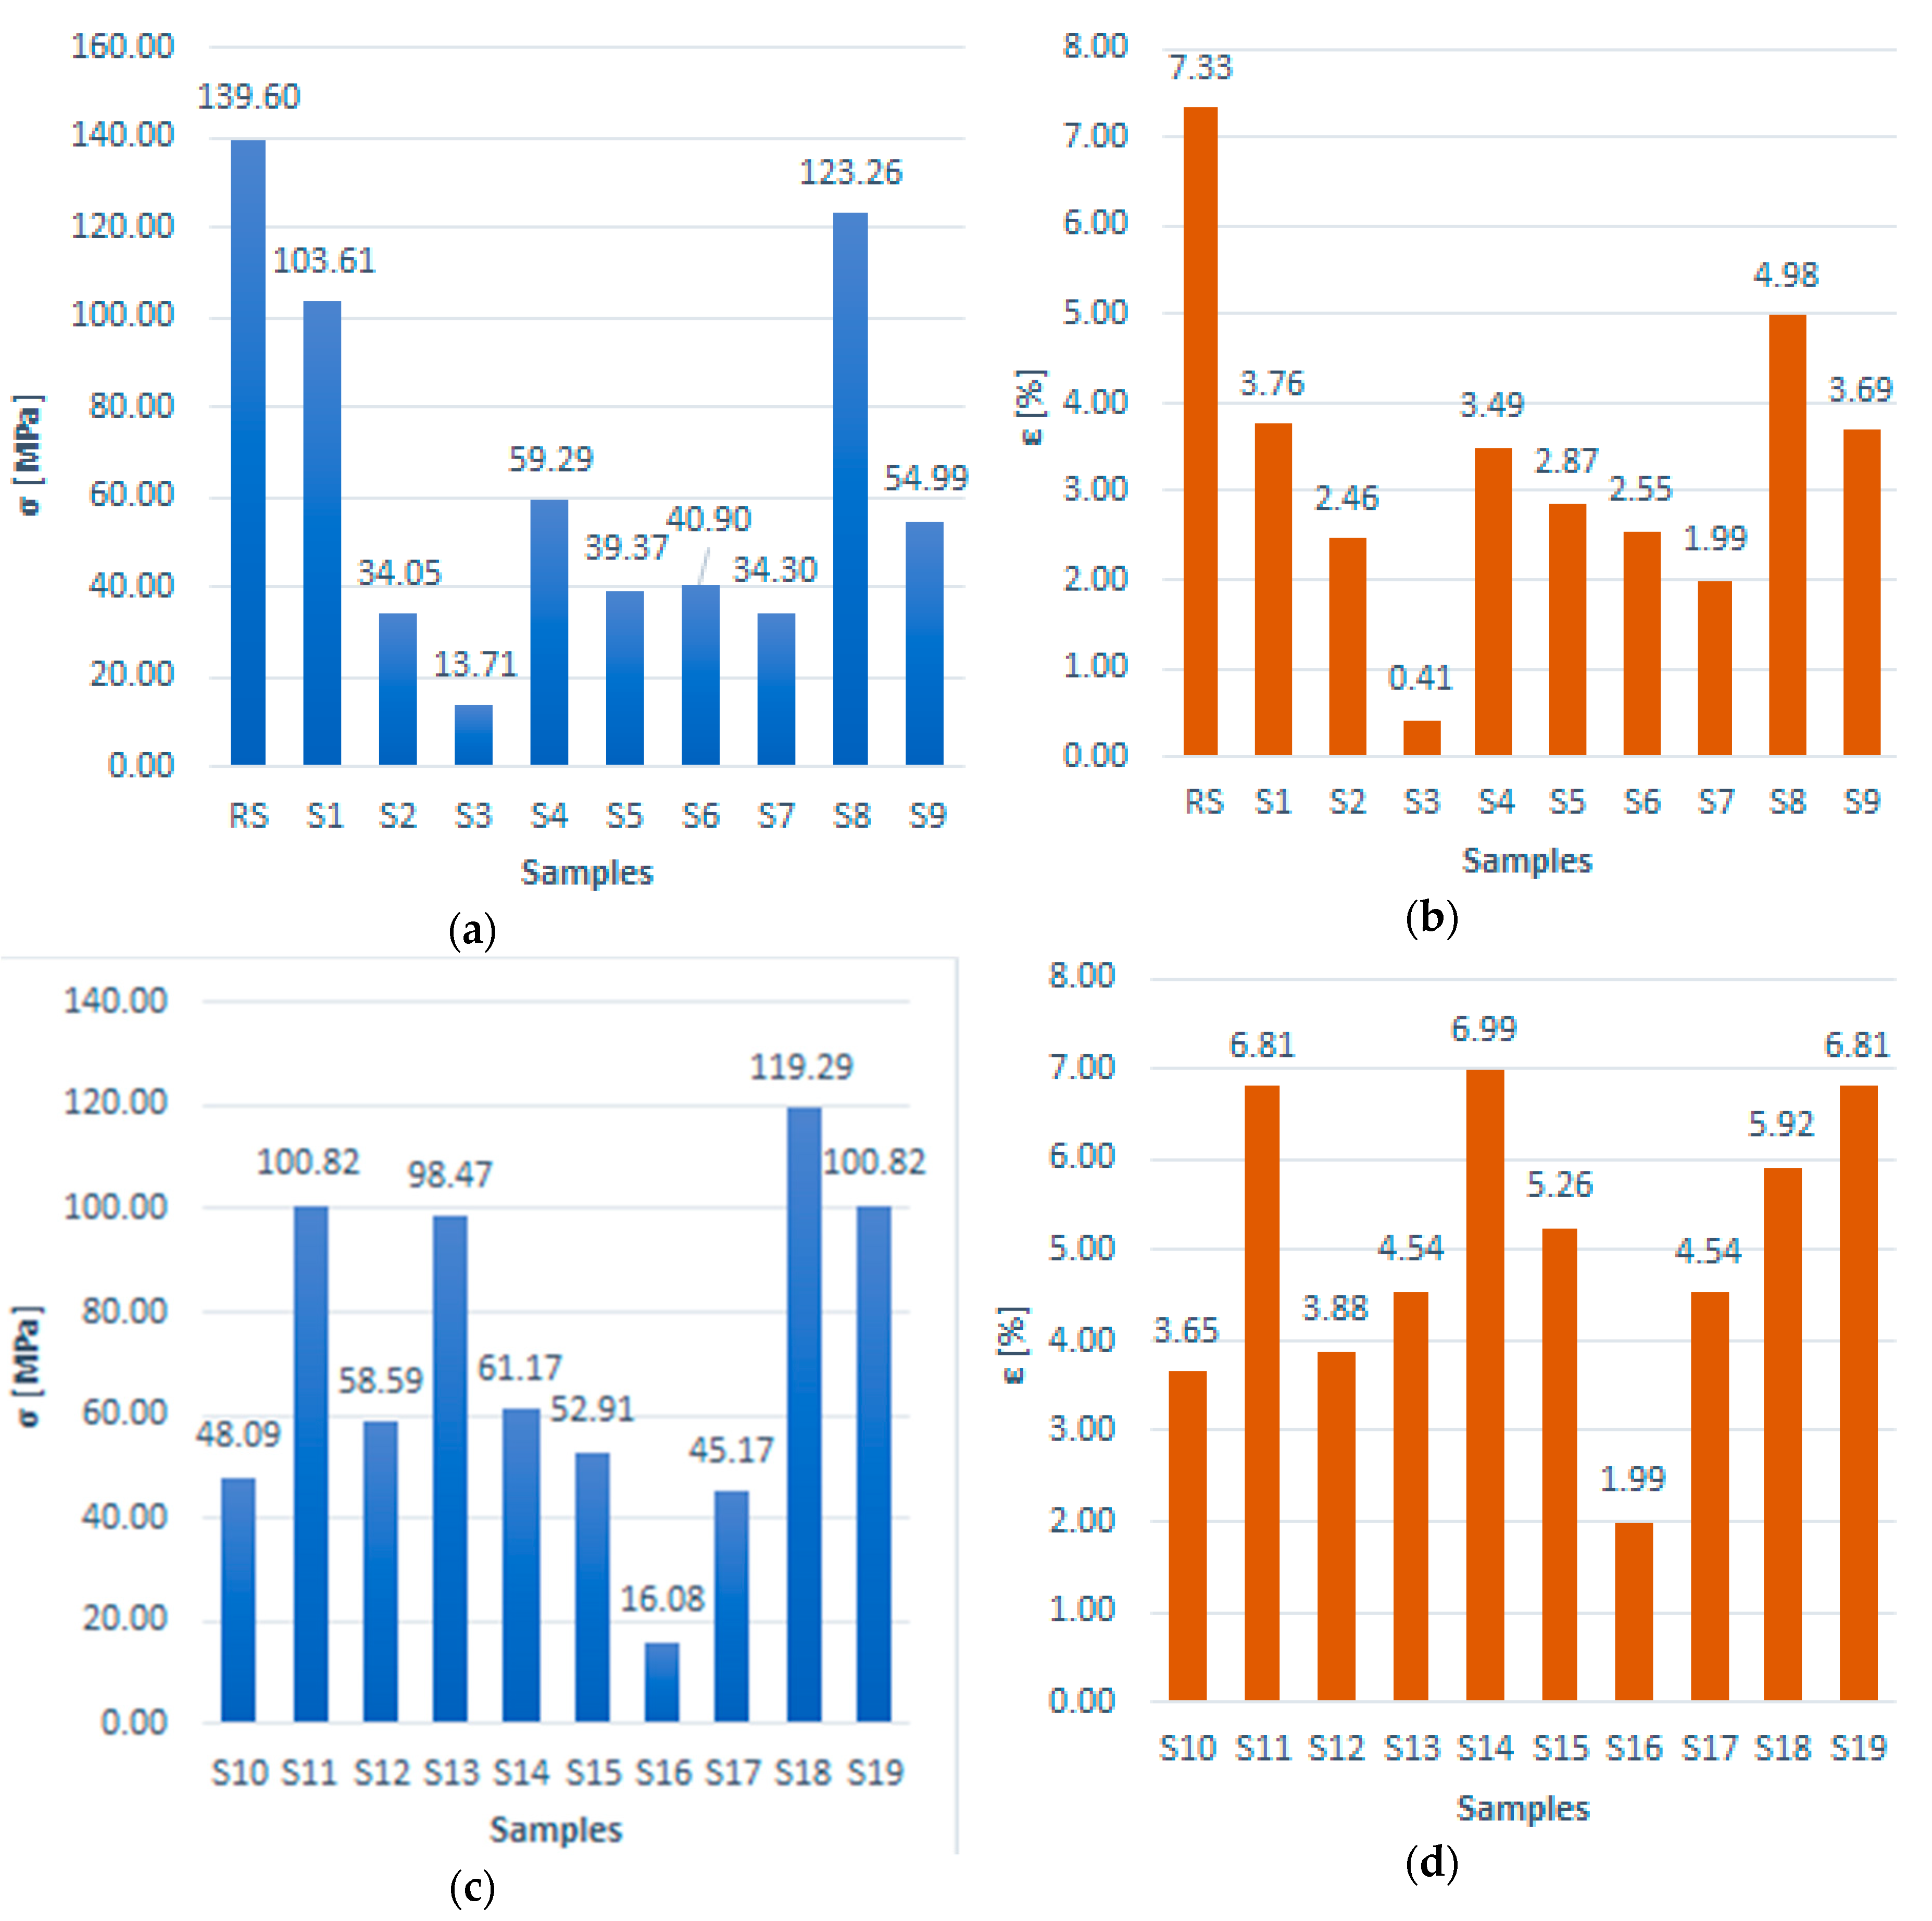
3.2. Tensile Testing
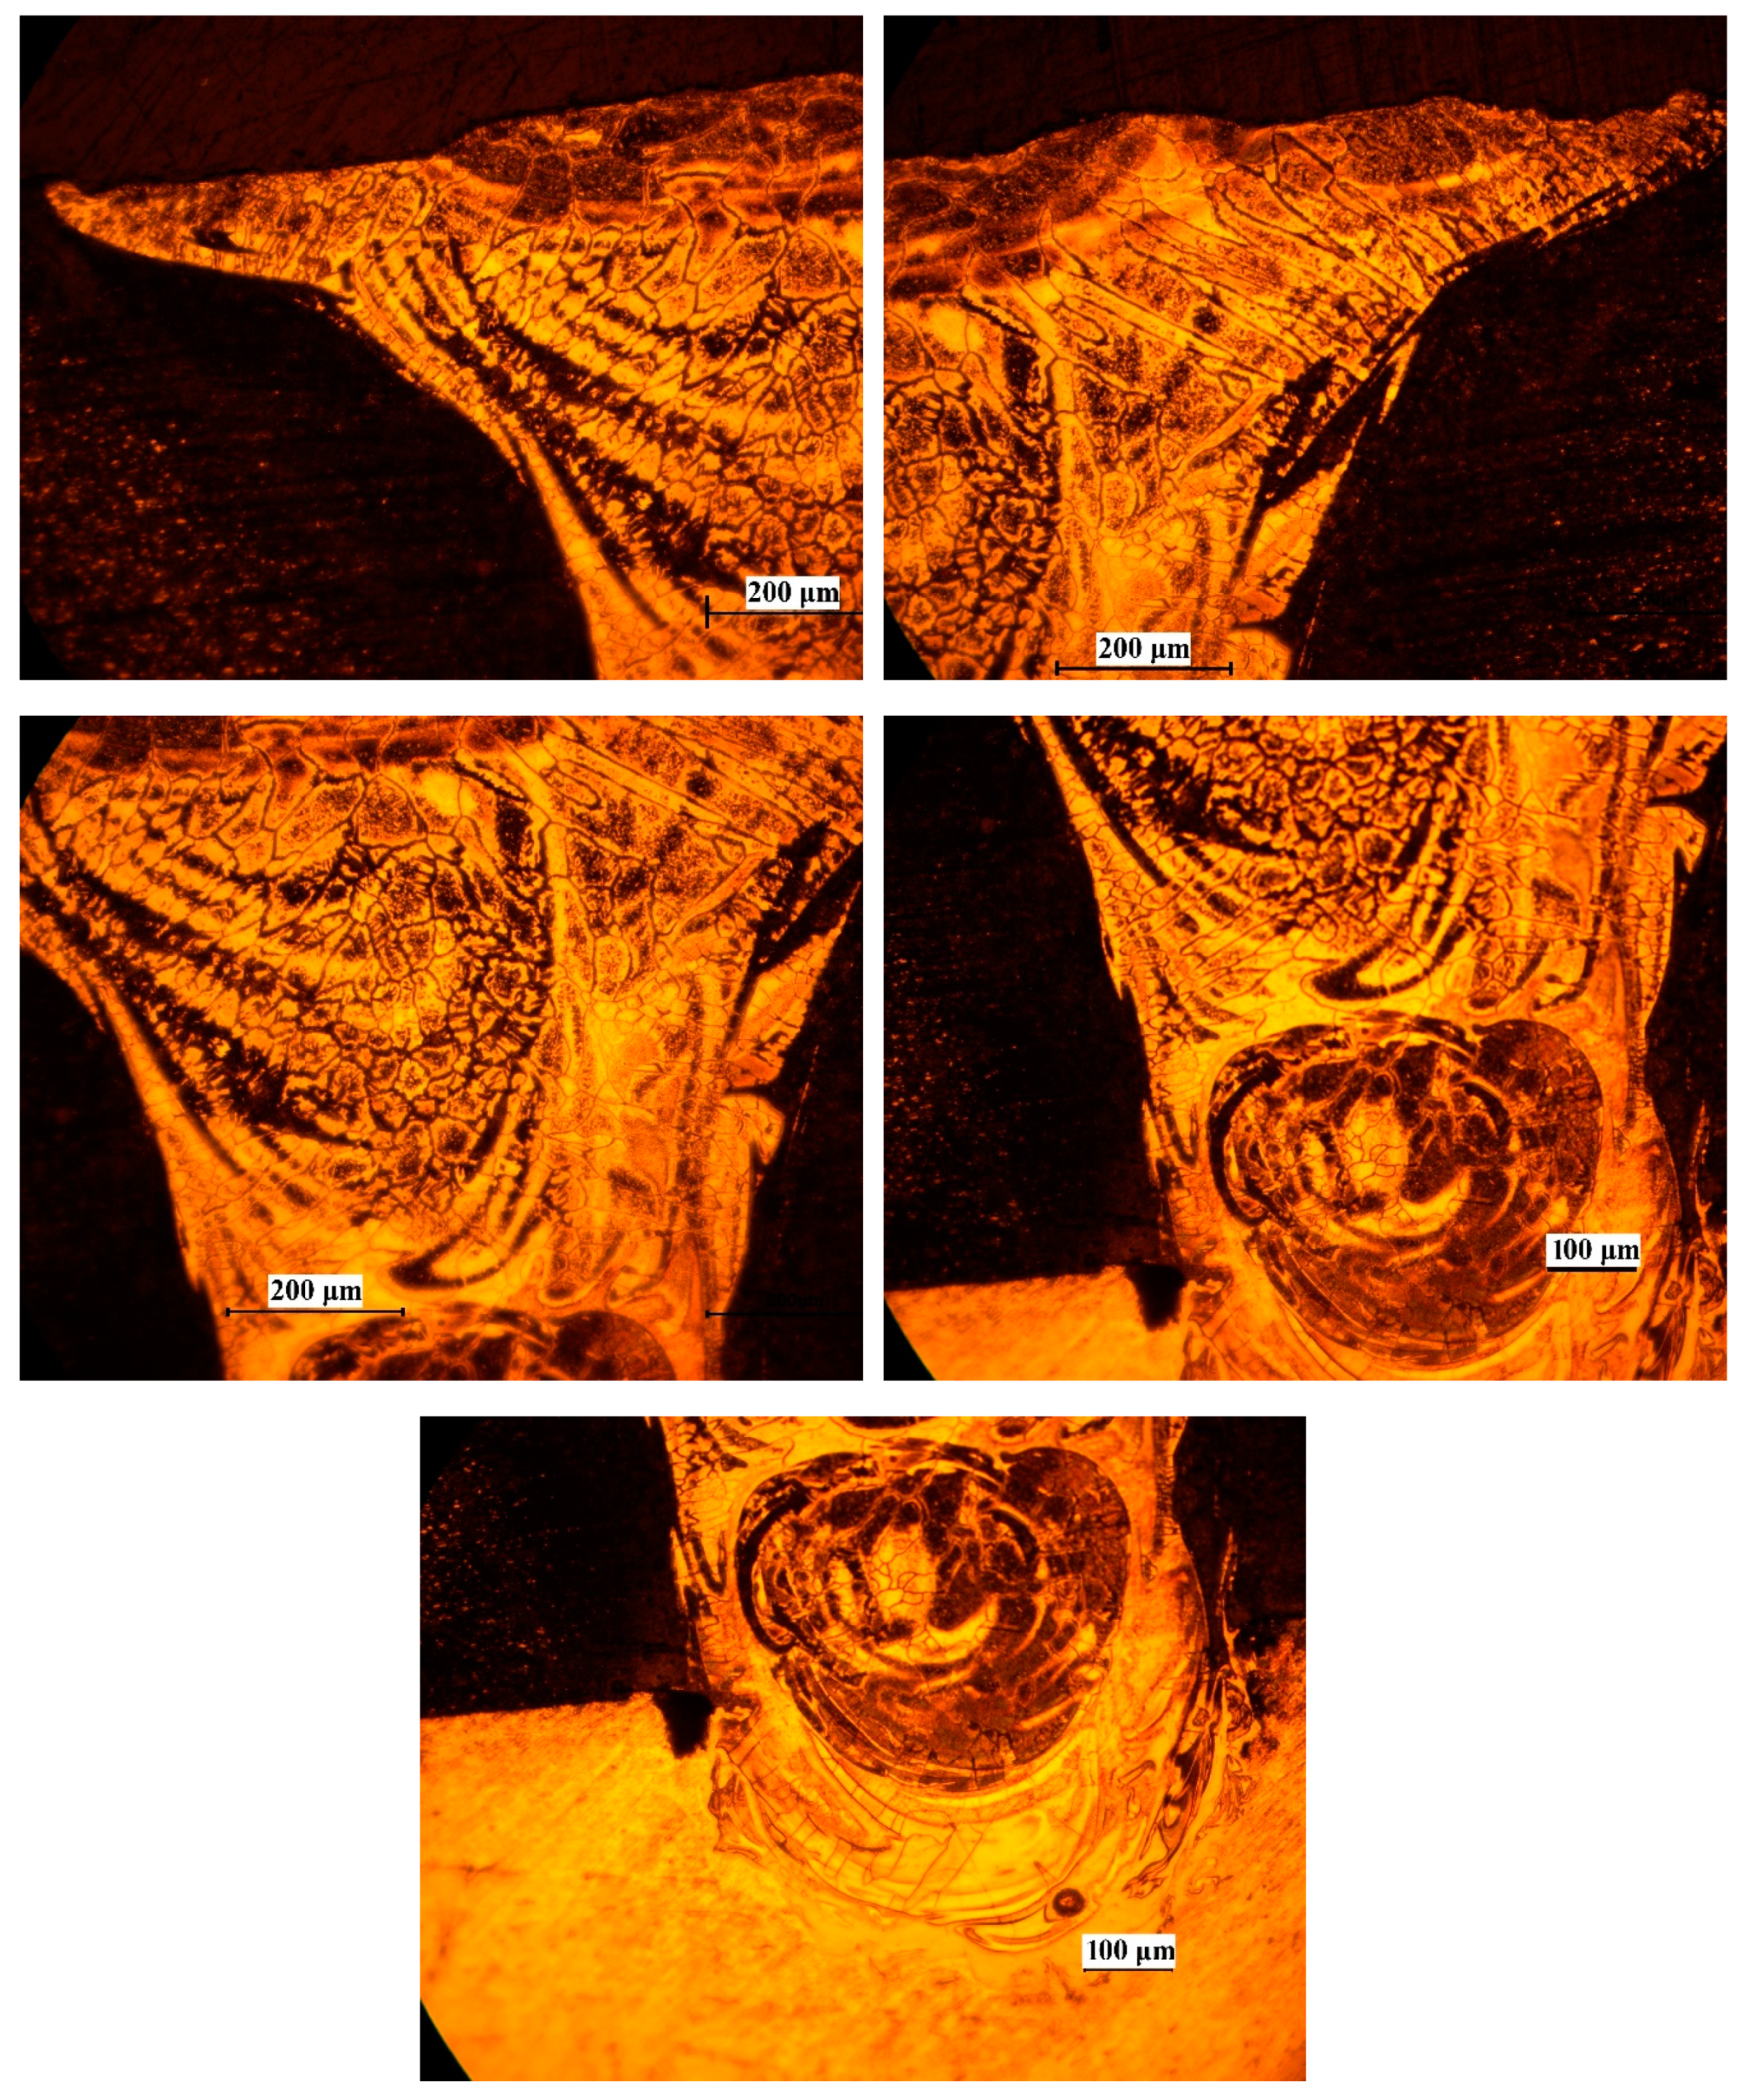
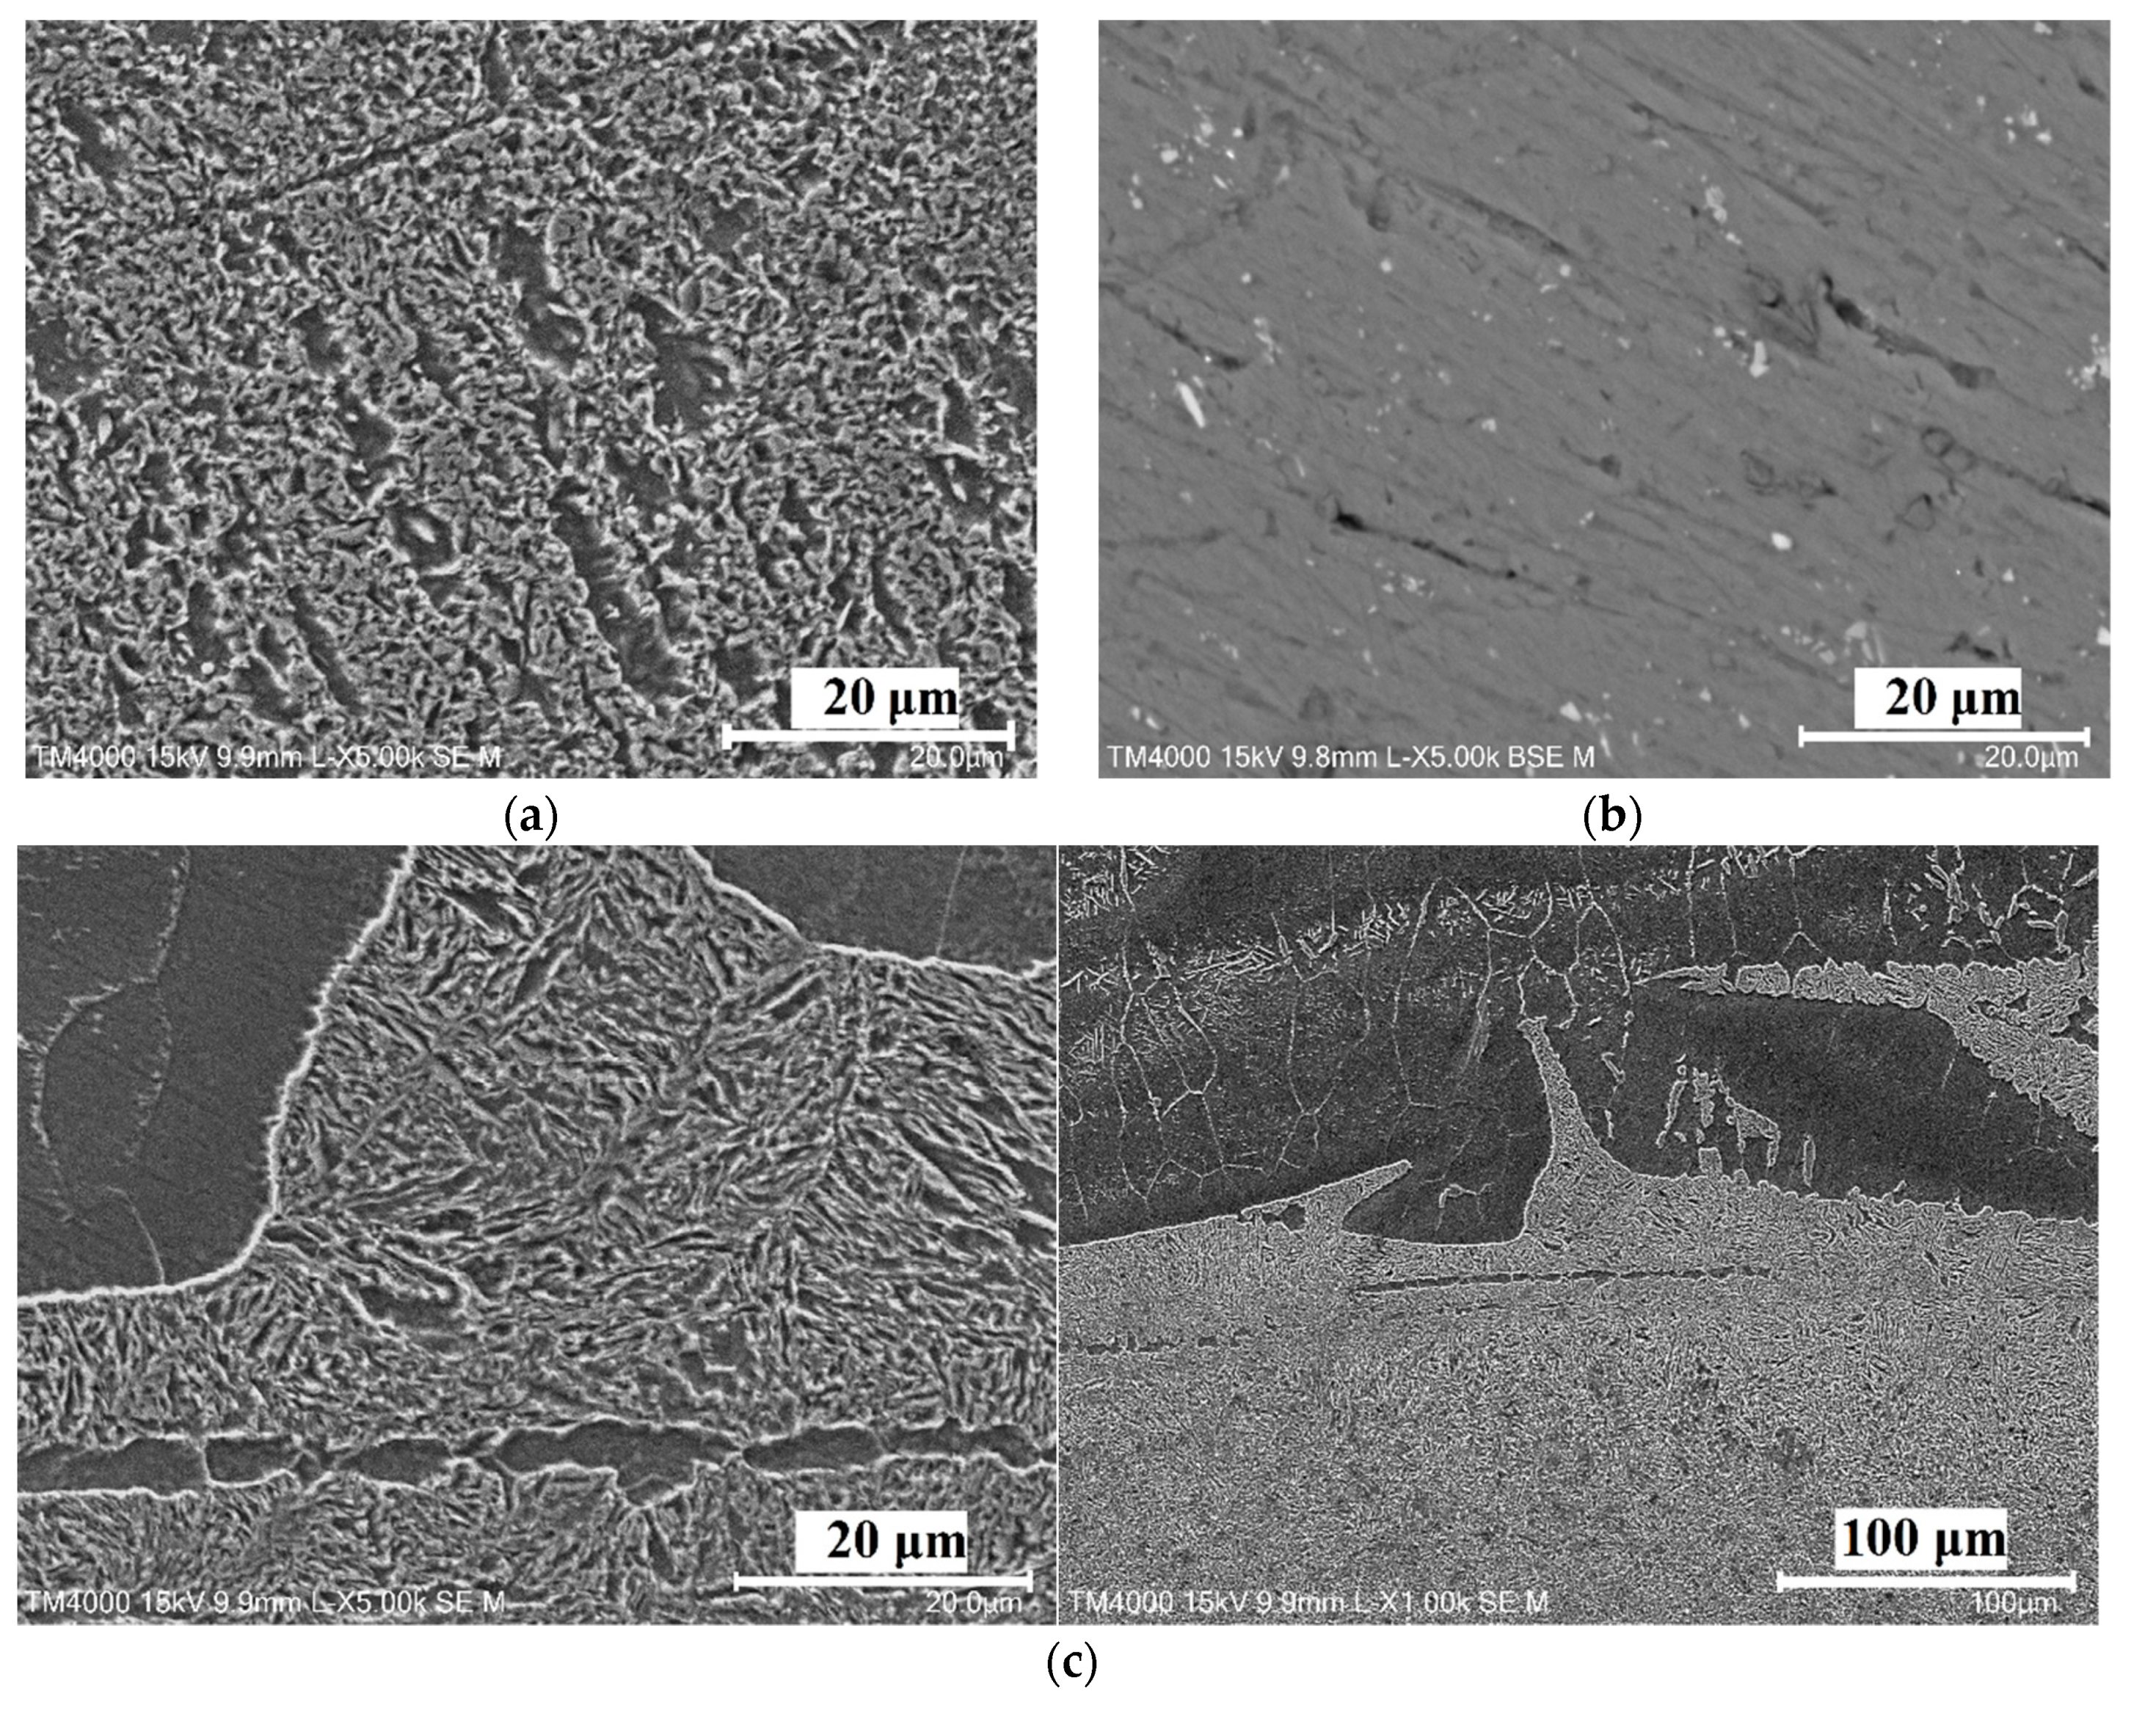
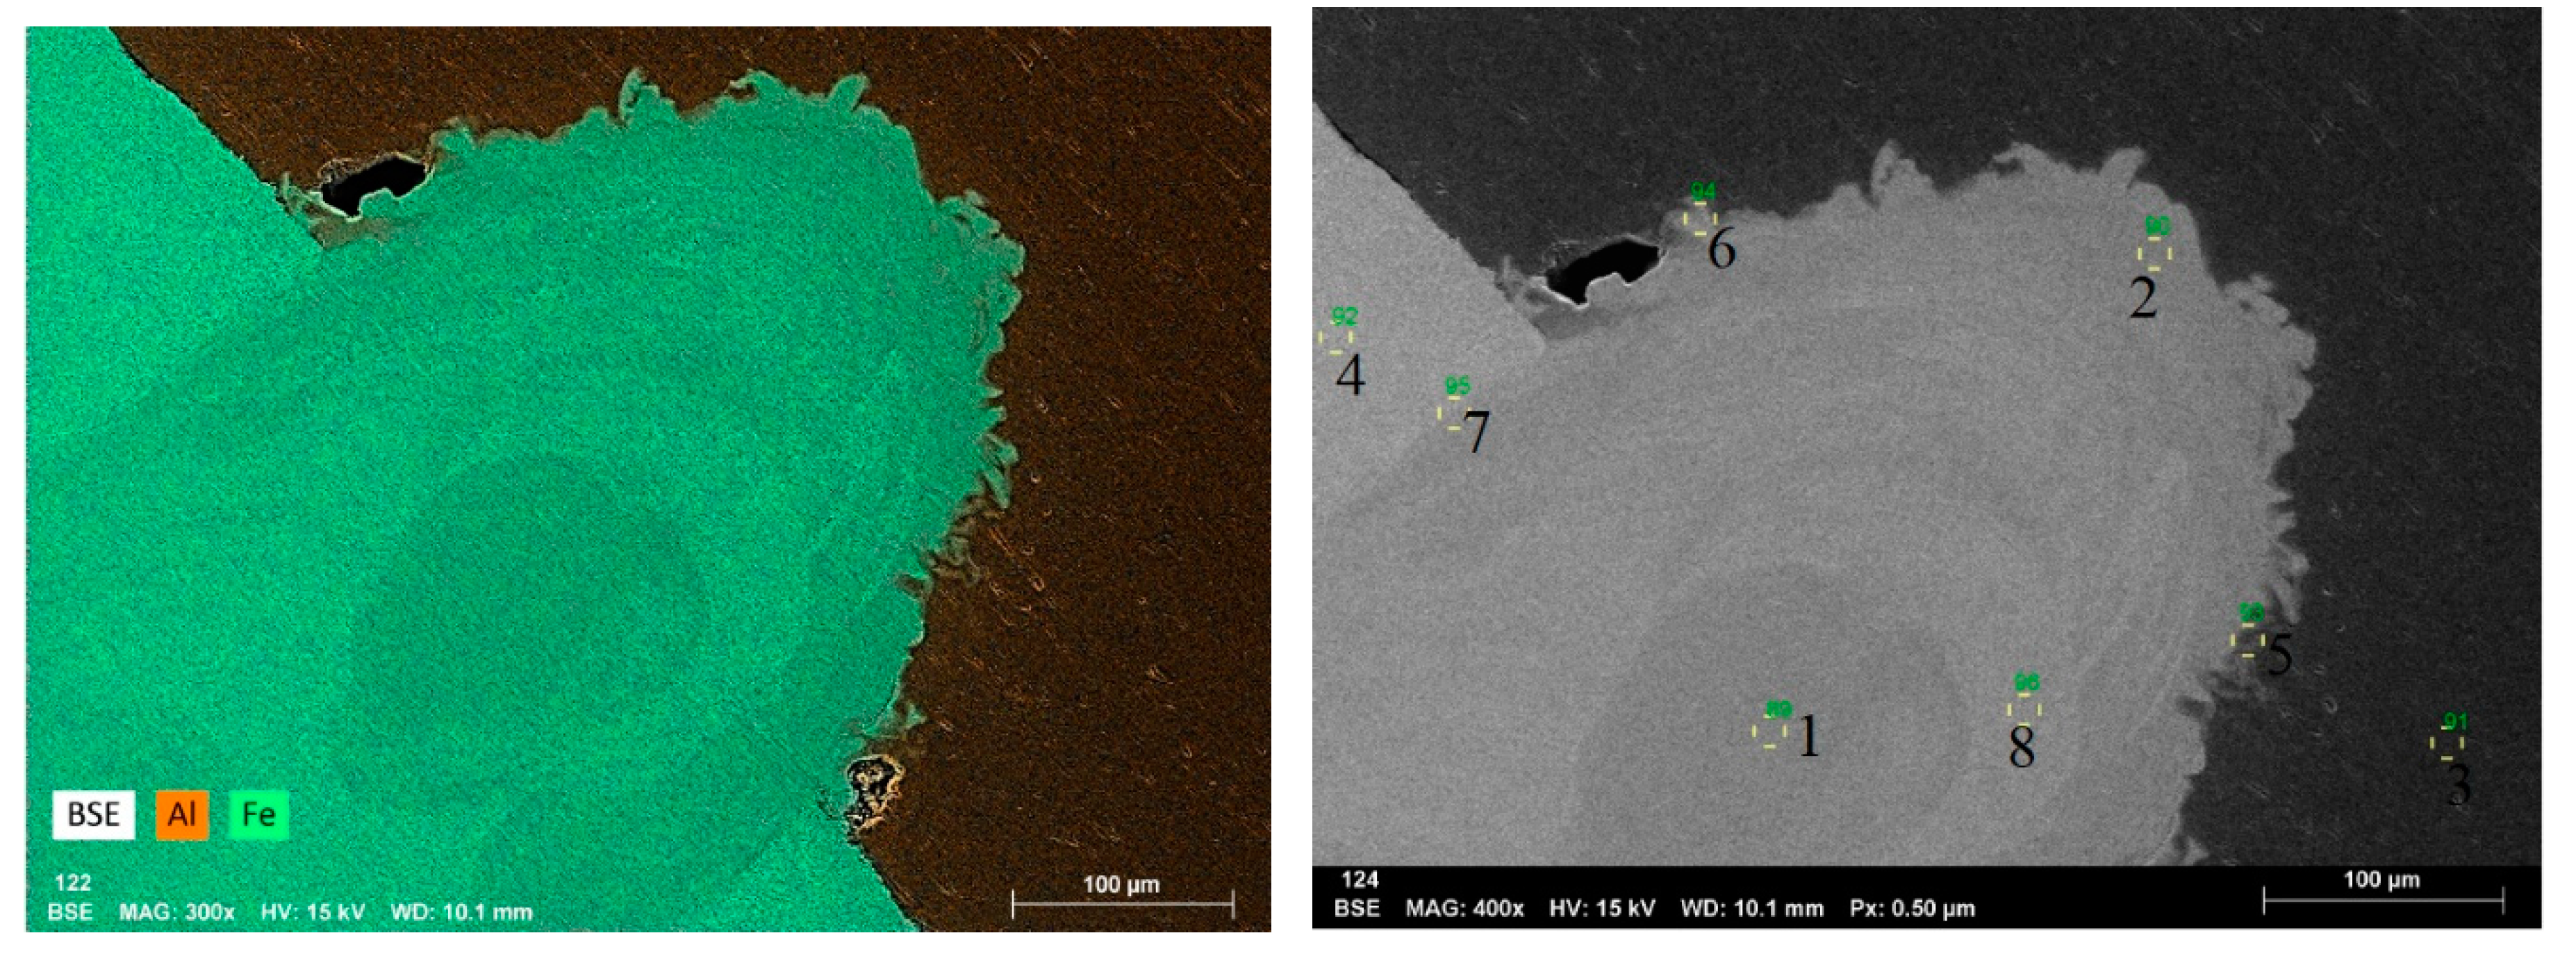
3.3. Microstructure
4. Conclusions
Author Contributions
Funding
Acknowledgments
Conflicts of Interest
References
- Sun, Z.; Ion, J.C. Laser welding of dissimilar metal combinations. J. Mater. Sci. 1995, 30, 4205–4214. [Google Scholar] [CrossRef]
- Wang, P.; Chen, X.; Pan, Q.; Madigan, B.; Long, J. Laser welding dissimilar materials of aluminum to steel: An overview. Int. J. Adv. Manuf. Technol. 2016, 87, 3081–3090. [Google Scholar] [CrossRef]
- Katayama, S. Laser welding of aluminium alloys and dissimilar metals. Weld. Int. 2004, 18, 618–625. [Google Scholar] [CrossRef]
- Shah, L.H.; Ishak, M. Review of research progress on aluminum-steel dissimilar welding. Mater. Manuf. Process. 2014, 29, 928–933. [Google Scholar] [CrossRef]
- Shao, L.; Shi, Y.; Huang, J.K.; Wu, S.J. Effect of joining parameters on microstructure of dissimilar metal joints between aluminum and galvanized steel. Mater. Des. 2015, 66, 453–458. [Google Scholar] [CrossRef]
- Song, J.L.; Lin, S.B.; Yang, C.L.; Ma, G.C.; Liu, H. Spreading behavior and microstructure characteristics of dissimilar metals TIG welding–brazing of aluminum alloy to stainless steel. Mater. Sci. Eng. A 2009, 509, 31–40. [Google Scholar] [CrossRef]
- Borrisutthekul, R.; Yachi, T.; Miyashita, Y.; Mutoh, Y. Suppression of intermetallic reaction layer formation by controlling heat flow in dissimilar joining of steel and aluminum alloy. Mater. Sci. Eng. A 2007, 467, 108–113. [Google Scholar] [CrossRef]
- Bouché, K.; Barbier, F.; Coulet, A. Intermetallic compound layer growth between solid iron and molten aluminium. Mater. Sci. Eng. A 1998, 249, 167–175. [Google Scholar] [CrossRef]
- Cui, L.; Chen, H.; Chen, B.; He, D. Welding of Dissimilar Steel/Al Joints Using Dual-Beam Lasers with Side-by-Side Configuration. Metals 2018, 8, 1017. [Google Scholar] [CrossRef]
- Torkamany, M.J.; Tahamtan, S.; Sabbaghzadeh, J. Dissimilar welding of carbon steel to 5754 aluminum alloy by Nd:YAG pulsed laser. Mater. Des. 2010, 31, 458–465. [Google Scholar] [CrossRef]
- Sun, J.; Yan, Q.; Gao, W.; Huang, J. Investigation of laser welding on butt joints of Al/steel dissimilar materials. Mater. Des. 2015, 83, 120–128. [Google Scholar] [CrossRef]
- Meco, S.; Pardal, G.; Ganguly, S.; Williams, S.; McPherson, N. Application of laser in seam welding of dissimilar steel to aluminium joints for thick structural components. Opt. Lasers Eng. 2015, 67, 22–30. [Google Scholar] [CrossRef]
- Corigliano, P.; Crupi, V.; Guglielmino, E. Non linear finite element simulation of explosive welded joints of dissimilar metals for shipbuilding applications. Ocean Eng. 2018, 160, 346–353. [Google Scholar] [CrossRef]
- Corigliano, P.; Crupi, V.; Guglielmino, E.; Mariano Sili, A. Full-field analysis of AL/FE explosive welded joints for shipbuilding applications. Mar. Struct. 2018, 57, 207–218. [Google Scholar] [CrossRef]
- Kaya, Y. Microstructural, Mechanical and Corrosion Investigations of Ship Steel-Aluminum Bimetal Composites Produced by Explosive Welding. Metals 2018, 8, 544. [Google Scholar] [CrossRef]
- Rana, R.S.; Chouksey, R.; Dhakad, K.; Paliwal, D. Optimization of process parameter of Laser beam machining of high strength steels: A review. Mater. Today Proc. 2018, 5, 19191–19199. [Google Scholar] [CrossRef]
- Patidar, D.; Rana, R.S. The effect of CO2 laser cutting parameter on Mechanical & Microstructural characteristics of high strength steel—A review. Mater. Today Proc. 2018, 5, 17753–17762. [Google Scholar] [CrossRef]
- Chen, S.; Huang, J.; Ma, K.; Zhao, X.; Vivek, A. Microstructures and Mechanical Properties of Laser Penetration Welding Joint With/Without Ni-Foil in an Overlap Steel-on-Aluminum Configuration. Metall. Mater. Trans. A 2014, 45, 3064–3073. [Google Scholar] [CrossRef]
- Zhan, Y.; Zhang, E.; Ge, Y.; Liu, C. Residual stress in laser welding of TC4 titanium alloy based on ultrasonic laser technology. Appl. Sci. 2018, 8, 1997. [Google Scholar] [CrossRef]
- Li, R.; Zhang, F.; Sun, T.; Liu, B.; Chen, S.; Tian, Y. Investigation of strengthening mechanism of commercially pure titanium joints fabricated by autogenously laser beam welding and laser-MIG hybrid welding processes. Int. J. Adv. Manuf. Technol. 2018. [Google Scholar] [CrossRef]
- Fernandes, F.A.O.; Oliveira, D.F.; Pereira, A.B. Optimal parameters for laser welding of advanced high-strength steels used in the automotive industry. Procedia Manuf. 2017, 13, 219–226. [Google Scholar] [CrossRef]
- Gale, W.F.; Totemeier, T.C. (Eds.) Smithells Metals Reference Book, 8th ed.; Elsevier Butterworth-Heinemann: Oxford, UK, 2004. [Google Scholar]
- Esmaeili, A.; Givi, M.K.B.; Rajani, H.R.Z. A metallurgical and mechanical study on dissimilar Friction Stir welding of aluminum 1050 to brass (CuZn30). Mater. Sci. Eng. A 2011, 528, 7093–7102. [Google Scholar] [CrossRef]
- Wang, J.; Yang, L.; Sun, M.; Liu, T.; Li, H. Effect of energy input on the microstructure and properties of butt joints in DP1000 steel laser welding. Mater. Des. 2016, 90, 642–649. [Google Scholar] [CrossRef]


| Metal | Melting Temperature [K] | Density [kg·m−3] | Thermal Conductivity [W·m−1·K−1] | Specific Heat Capacity [J·kg−1·K−1] | Thermal Expansion Coefficient [K−1] |
|---|---|---|---|---|---|
| Fe | 1809 | 7870 | 78 | 456 | 12.1 × 10⁶ |
| Al | 933 | 2700 | 238 | 917 | 23.5 × 10⁶ |
| Ti | Zn | Mn | Fe | Si | Mg | Cu |
|---|---|---|---|---|---|---|
| 0.05 | 0.07 | 0.05 | 0.4 | 0.25 | 0.05 | 0.05 |
| C | Si | Mn | Cu | Al | Cr | Ni | Nb | V |
|---|---|---|---|---|---|---|---|---|
| 0.141 | 0.49 | 1.47 | 0.02 | 0.041 | 0.03 | 0.04 | 0.016 | 0.01 |
| Sample | Power [kW] | Pulse Duration [ms] |
|---|---|---|
| 1 | 8.40 | 14 |
| 2 | 7.20 | 14 |
| 3 | 7.08 | 14 |
| 4 | 6.96 | 14 |
| 5 | 6.84 | 14 |
| 6 | 6.72 | 14 |
| 7 | 6.60 | 14 |
| 8 | 6.48 | 14 |
| 9 | 6.36 | 14 |
| 10 | 6.24 | 14 |
| 11 | 6.12 | 14 |
| 12 | 6.00 | 14 |
| 13 | 6.48 | 16 |
| 14 | 6.48 | 15 |
| 15 | 6.48 | 13 |
| 16 | 6.48 | 12 |
| 17 | 6.48 | 11 |
| 18 | 6.60 | 13 |
| 19 | 6.60 | 15 |
| 20 | 6.60 | 16 |
| Spectrum | C | O | Al | Si | Fe |
|---|---|---|---|---|---|
| 1 | 8.25 | 2.10 | 12.17 | - | 77.48 |
| 2 | 8.30 | 2.82 | 19.13 | 0.59 | 69.15 |
| 3 | 13.00 | 10.87 | 62.77 | 9.37 | 3.99 |
| 4 | 8.18 | 2.37 | 4.73 | - | 84.72 |
| 5 | 9.39 | 3.33 | 46.69 | - | 40.59 |
| 6 | 10.11 | 3.22 | 23.85 | - | 62.82 |
| 7 | 7.83 | 2.11 | 9.53 | - | 80.53 |
| 8 | 7.70 | 2.13 | 8.86 | - | 81.31 |
| Mean | 9.10 | 3.62 | 23.47 | 4.98 | 62.58 |
| Sigma | 1.77 | 2.97 | 20.66 | 6.21 | 27.63 |
| SigmaMean | 0.63 | 1.05 | 7.31 | 2.20 | 9.77 |
© 2019 by the authors. Licensee MDPI, Basel, Switzerland. This article is an open access article distributed under the terms and conditions of the Creative Commons Attribution (CC BY) license (http://creativecommons.org/licenses/by/4.0/).
Share and Cite
Pereira, A.B.; Cabrinha, A.; Rocha, F.; Marques, P.; Fernandes, F.A.O.; Alves de Sousa, R.J. Dissimilar Metals Laser Welding between DP1000 Steel and Aluminum Alloy 1050. Metals 2019, 9, 102. https://doi.org/10.3390/met9010102
Pereira AB, Cabrinha A, Rocha F, Marques P, Fernandes FAO, Alves de Sousa RJ. Dissimilar Metals Laser Welding between DP1000 Steel and Aluminum Alloy 1050. Metals. 2019; 9(1):102. https://doi.org/10.3390/met9010102
Chicago/Turabian StylePereira, António B., Ana Cabrinha, Fábio Rocha, Pedro Marques, Fábio A. O. Fernandes, and Ricardo J. Alves de Sousa. 2019. "Dissimilar Metals Laser Welding between DP1000 Steel and Aluminum Alloy 1050" Metals 9, no. 1: 102. https://doi.org/10.3390/met9010102
APA StylePereira, A. B., Cabrinha, A., Rocha, F., Marques, P., Fernandes, F. A. O., & Alves de Sousa, R. J. (2019). Dissimilar Metals Laser Welding between DP1000 Steel and Aluminum Alloy 1050. Metals, 9(1), 102. https://doi.org/10.3390/met9010102