Effect of Quenching Temperature on Microstructure and Rolling Contact Fatigue Behavior of 17Cr2Ni2MoVNb Steel
by
 ,
,
Yalong Zhang
1,2,3, 
Shengguan Qu
1,2,3,*,
Fuqiang Lai
1,2,3,
Haidi Qin
1,2,3,
Liman Huang
1,2,3 and
Xiaoqiang Li
1,2,3 1
Guangdong Key Laboratory for Advanced Metallic Materials Processing, South China University of Technology, Guangzhou 510640, China
2
National Engineering Research Center of Near-Net-Shape Forming for Metallic Materials, Guangzhou 510640, China
3
School of Mechanical and Automotive Engineering, South China University of Technology, Guangzhou 510640, China
*
Author to whom correspondence should be addressed.
Metals 2018, 8(9), 735; https://doi.org/10.3390/met8090735
Submission received: 28 August 2018
/
Revised: 15 September 2018
/
Accepted: 17 September 2018
/
Published: 19 September 2018
Abstract
:17Cr2Ni2MoVNb steel is a new type of gear steel in the automotive industry; the rolling contact fatigue behavior is not well documented. In this study, some microscopic analysis methods (optical microscope (OM), scanning electron microscope (SEM), transmission electron microscope (TEM), X-ray diffractometer (XRD), and energy dispersive X-ray analysis (EDS)) were used to characterize material microstructure and damage surface. In addition, rolling contact fatigue behavior was evaluated by Weibull curve. The results show that the size of austenite grain increased while the quenching temperature increased. Moreover, the samples with a quenching temperature of 1000 °C exhibited the maximum mean life of 7.33 × 10⁵ cycles. In addition, the failure mode of quenched at 900 °C and 1100 °C were delamination, and pitting was the main failure mode of 1000 °C.
1. Introduction
Rolling contact fatigue (RCF) is a typical failure mode in the application of gears. Surface damage is a very complex phenomenon and the contact fatigue plays a fundamental role in the damage process [1]. The fatigue damages are influenced by various factors, including the lubrication oil, surface roughness, and mechanical properties of materials [2,3,4,5]. Numerous studies have focused on different heat treatment processes to improve mechanical properties in Fe-based alloys [6,7]. Long [8] investigated the effect of quenching temperature on martensite multi-level microstructure and properties of strength and toughness in 20CrNi2Mo steel and found that the impact toughness and fracture toughness increase by 32.4% and 27.8% with increasing of the quenching temperature, respectively. The early work by Matlock [9] indicated that the grain size is the most important factor affecting fatigue behaviors. Ma [10] determined the fatigue resistance is affected by plastic deformation under different slip ratio conditions. Wang [11] explored a coupling relationship between fatigue cracks and wear in curve track. Gallo [12] studied the relationship between roughness and fatigue characteristics of 40CrMoV13.9 notched components, with the most evident improvement being registered for the value of Ra = 0.15 μm.
To estimate the fatigue life, RCF test data of materials should be analyzed by a probabilistic approach. Yu [13] used the Weibull distribution diagram to analyze the rolling contact fatigue life of the Fe-Cr coating. Glover [14] studied the Weibull curve of fatigue life conform to the test results by ball-on-rod tester. The main purpose of this study is to demonstrate the effect of quenching temperature on microstructure and RCF behavior while using a self-designed rolling contact fatigue testing device. In this paper, these properties, in addition to damage mechanism and RCF cracks, are discussed.
2. Experimental Procedure
The chemical compositions of 17Cr2Ni2MoVNb steel are presented in Table 1 and they were prepared by the sequential processes of melting in an electric furnace-ladle refining-vacuum degassing, then continuous rolling into a φ100 mm round bar. This was followed by quenching at different temperatures and tempering at 180 °C for 2 h, as shown in Table 2.
The platers (8 mm × 8 mm × 8 mm) were cut from the heat-treated samples at different temperatures, which were then polished and corroded with 4% alcohol nitric acid solution. Afterwards, the microstructure was observed using an optical microscope (OM, LEICA M165C, Barnack, Germany) and a transmission electron microscope (TEM, FEI Tecnai G20, Hillsboro, OR, USA) operating at 200 kV. An X-ray diffractometer (XRD, Cu Kα radiation, Amsterdam, Holland) was used to identify the metallographic phase of the materials. Damage surfaces were observed with a scanning electron microscope (SEM, NOVA NANOSEM 430, Eindhoven, Holland). While the axial surface roughness of the sample was evaluated using a portable surface roughness tester (Mar Surf, M300C, Esslingen, Germany).
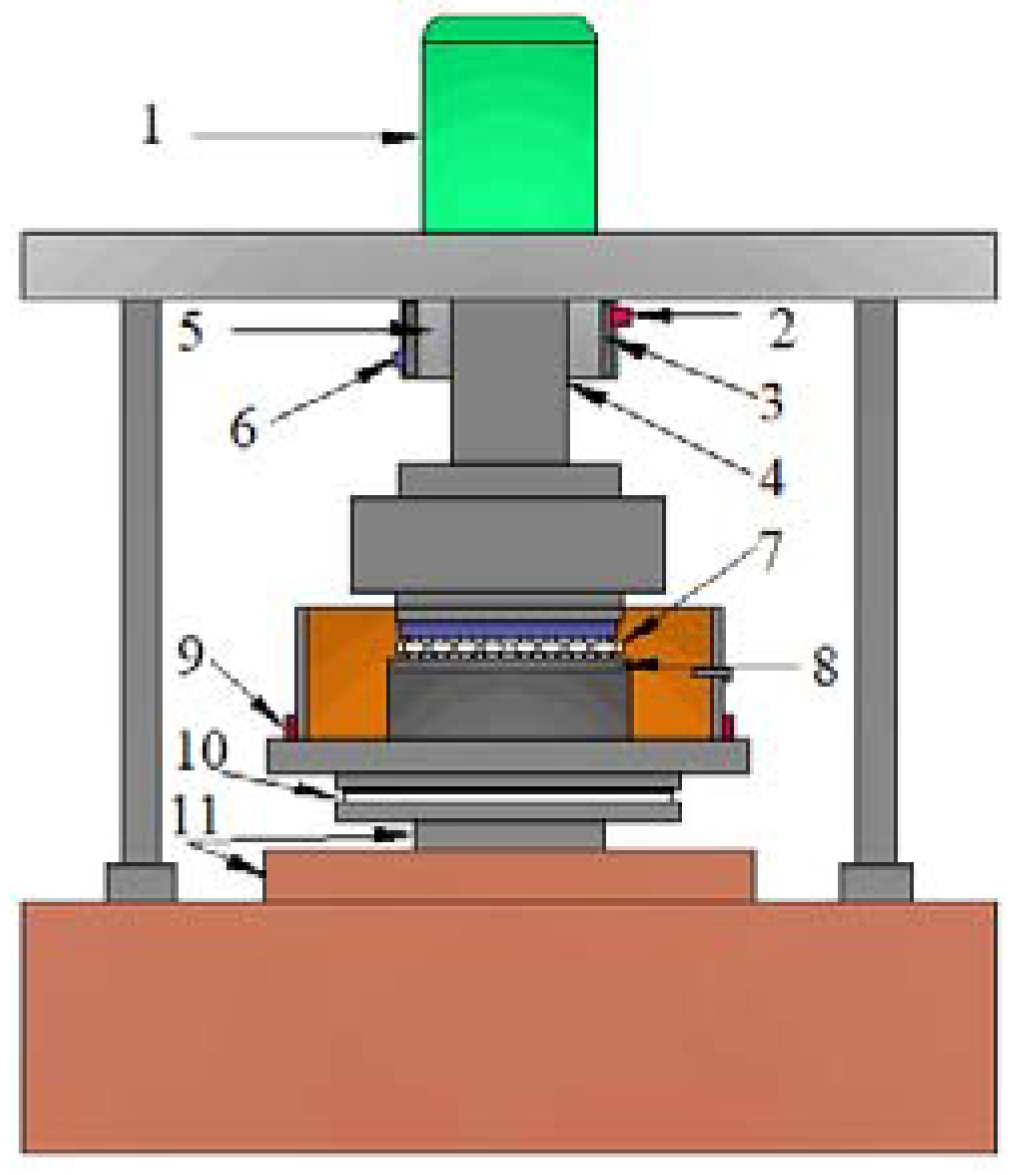
RCF tests were carried out by using a self-designed rolling contact fatigue testing device, the schematic of the machine is shown in Figure 1. The lower stationary sample was a disk of φ 48 × 6 mm, the surface roughness and morphology are depicted in Figure 2. The upper rotating bearing was made of AISI52100 steel with high hardness (60 HRC) [15]. The bearing with 13 uniformity distributed balls were treated as counterpart and balls of bearing with a diameter of 2.79 mm. The surface roughness, Ra, was found to be less than 1.2 μm [16]. The upper rotating bearing was driven by a DC motor at a speed of 1600 rpm, vertical force was applied by a hydraulic cylinder, it was measured and recorded on the computer while using a load sensor. The machine of RCF monitored the fatigue failure by the signals of vibration and torque when the vibration level exceeded the preset value, the machine would stop automatically. After each test, the bearings and lubricating oil should be replaced to ensure that the signals acquisition is not being distorted by the bearing failure or the impurities in the lubricating oil.
Each ball was applied 100 N, and contact stress between the bearing and specimen was calculated by the equation, as follows:
where is the contact stress; is the loading force of a single ball; is the radius of bearing ball, is the radius of the contact surface with the ball of lower stationary sample, and are the elastic modulus of bearing and specimen, respectively, ν1 and ν2 are the Poisson’s of bearing and specimen, respectively.
3. Results and Discussion
3.1. Effect of Quenching Temperature on Microstructure
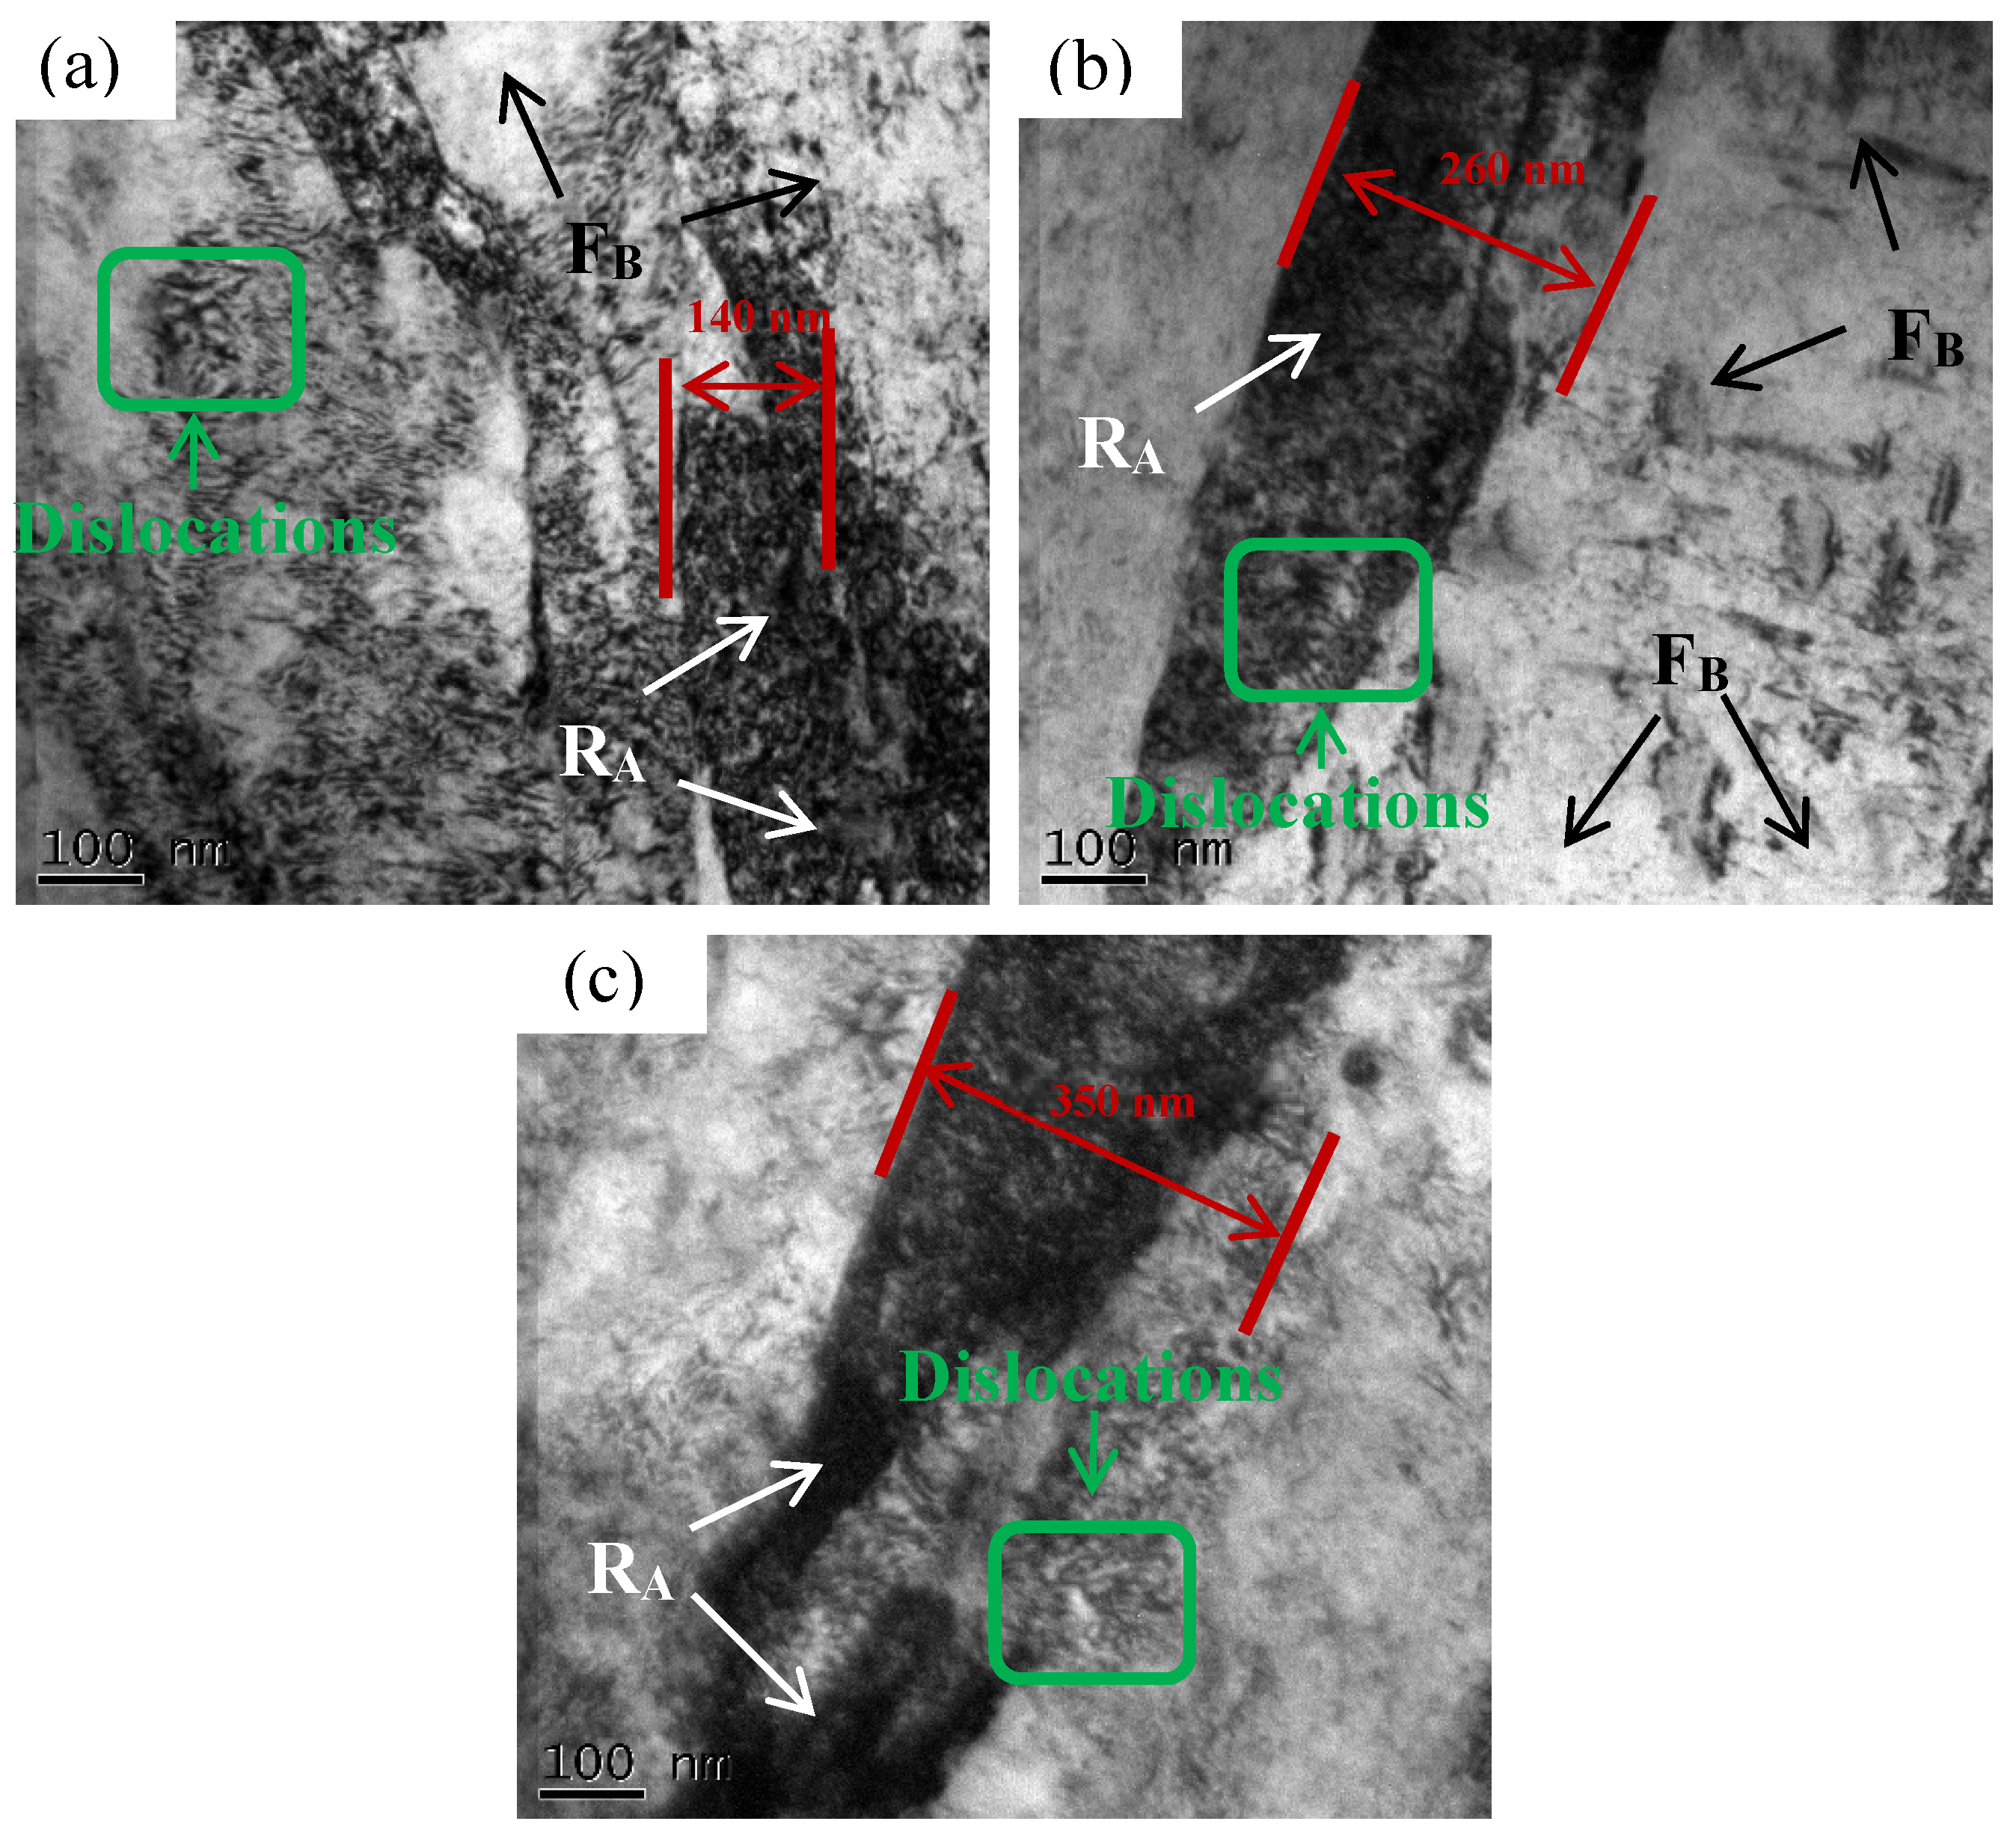
Figure 3 exhibits the OM micrograph of the 17Cr2Ni2MoVNb quenched at the temperature of 900, 1000, and 1100 °C, respectively. It can be concluded from the observations that the quenching temperature has a great influence on martensite shape. Sun performed on the martensite size was determined by the martendite start temperature (Ms), the low Ms may lead to obtaining the fine martensite size [17]. Figure 4 displays the TEM microstructural structures of long and slender ferrite and retained austenite at each quenching temperature. The results reveal that there were much more dislocations and the austenite size increased with an increasing of the quenching temperature.
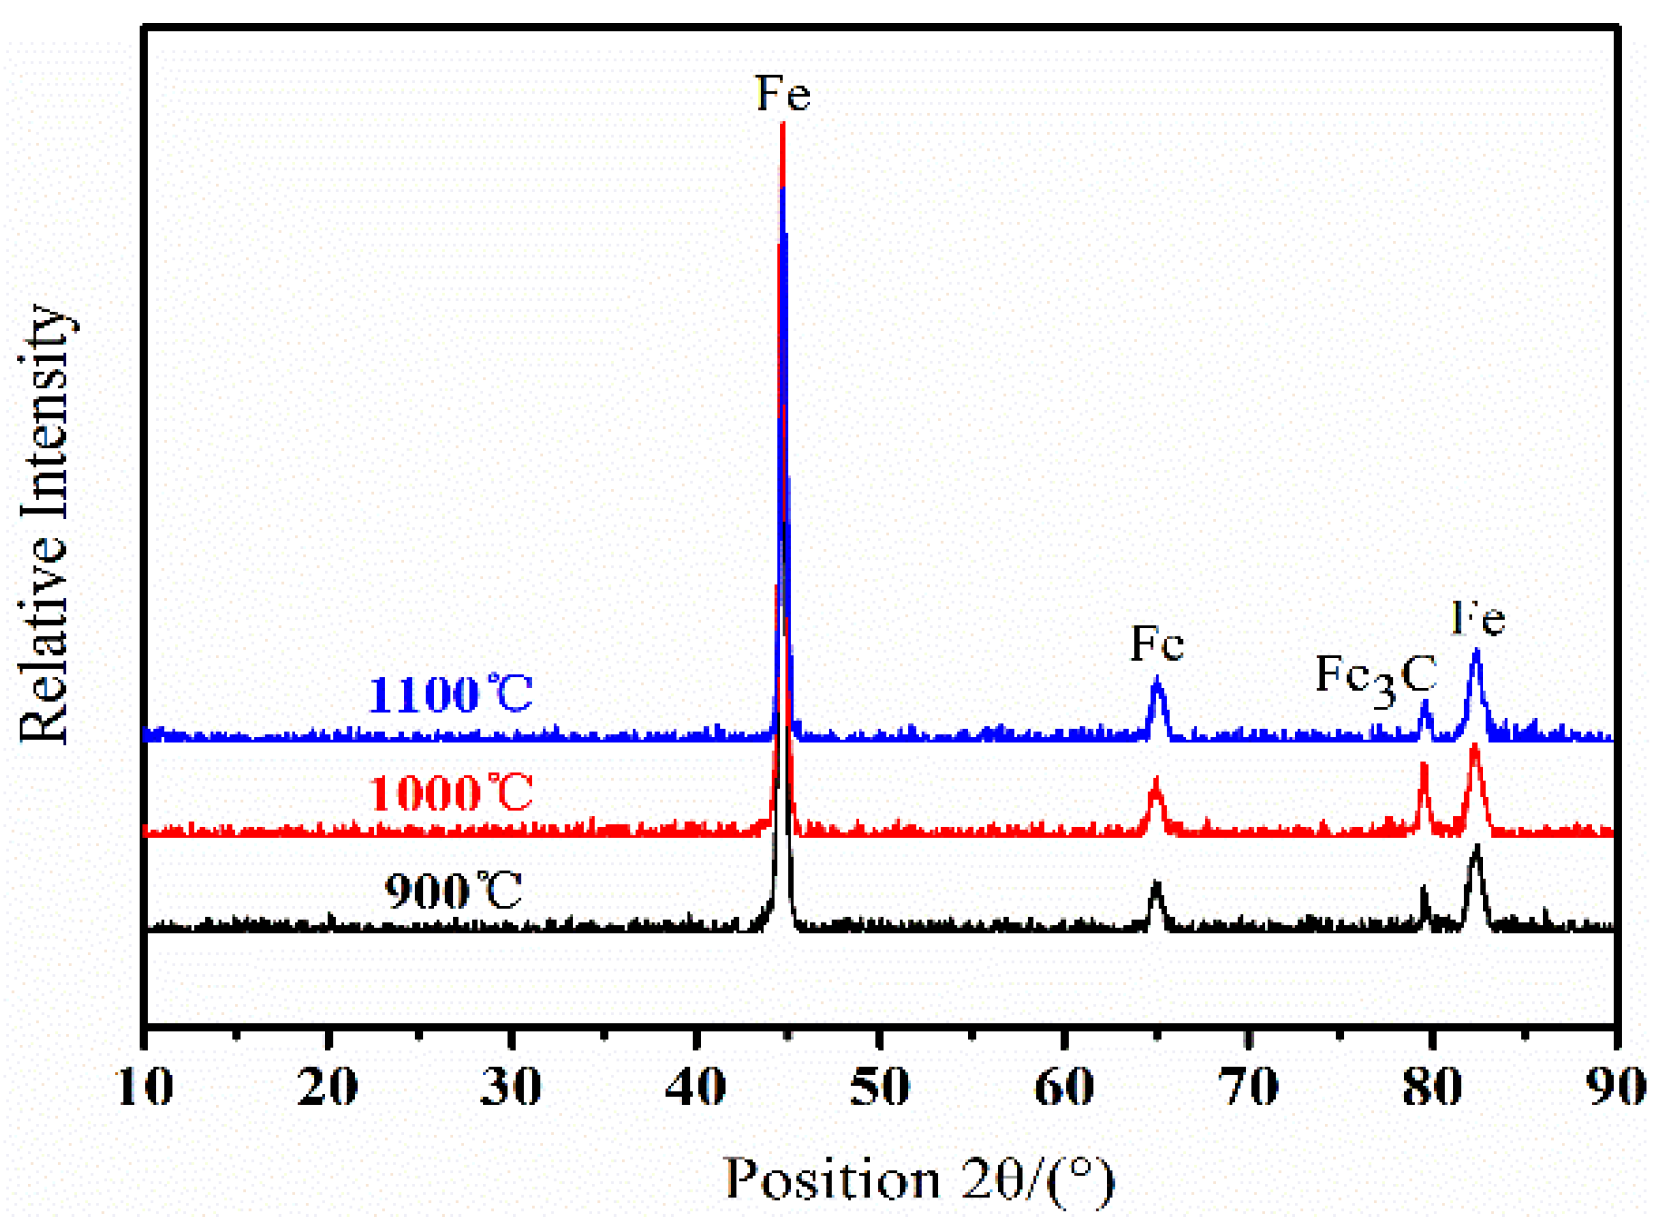
Figure 5 shows the X-ray diffraction (XRD) patterns. It has been reported in our previous study that the results of XRD patterns were similar and they indicate the test conditions were stable and the samples preparation was qualified [18]. It is well known that the effective methods to improve the strength in steel mainly include fine grain strengthening and precipitation strengthening [19]. Using the XRD method, the average grain size and dislocation density can be quantified. The grain size is investigated by the Scherrer equation, as follows:
where is the mean size of crystal, is the dimensionless shape factor, and is the X-ray wavelength, is the breadth at half the maximum peak intensity, and is the Bragg angle (in degrees).
Figure 6a indicates that a linear relationship with 0.002 slope existed between the mean gain size and the quenching temperature from 900 to 1100 °C. It also should be noted that the higher the quenching temperature, the larger the grain size. At quenching temperatures of 900, 1000, and 1100 °C, the mean grain sizes were approximately 19.63, 19.75, and 19.98 nm, respectively.
Using the XRD method, the dislocation density can be calculated from the XRD pattern by the following equation:
where is the dislocation density, is the microstrain, and is Bragg’ s vector of dislocation in .
Figure 6b shows that the dislocation density increased evidently with increasing of the quenching temperature from 900 °C to 1000 °C, and decreased from 1000 °C to 1100 °C. This was consistent with previous report on the effect of quenching temperature on dislocation density of bainitic steel [20]. The dislocation density of 22.97 × 10¹³, 26.48 × 10¹³, and 22.23 × 10¹³ m‒2 at quenching temperatures of 900, 1000, and 1100 °C, respectively.
3.2. Weibull Distribution
The Weibull distribution is widely used to assess the statistical behavior of the fatigue life [21,22]. In this work, two-parameter weibull distribution is used to characterize the RCF life of 17Cr2Ni2MoVNb steel. The cumulative distribution function is given as:
where is the probability of fatigue failure; is the RCF life; is the shape parameter of fatigue life; and, is the characterizes parameter of life.
Figure 7 shows the weibull curves of life and Table 3 shows the detail result of the fatigue life. The specified life, median life, and characteristic life of the specimen of quenched at 1000 °C were 2.11 × 10⁶, 2.28 × 10⁶, and 2.31 × 10⁶ under the contact stress of 3.2 GPa, respectively, which were larger than that of the samples quenched at 900 °C and 1100 °C. The mean life of the samples quenched at 1000 °C was 1.46 times and 1.89 times that of quenched at 900 °C and 1100 °C, respectively. It is clear that the slope of the Weibull curve of quenched at 1000 °C is obviously higher than that of the other two specimens, which that indicates the distribution of the specimen data and the failure time are stable. It can be observed that the dislocation density of the samples quenched at 1000 °C was more significant when compared to that of other samples, the improved dislocation density of the samples may be attributed to the fatigue life. The specified life, median life, characteristic life, and the Weibull slope are summarized in Table 4.
3.3. Surface Fatigue Damage
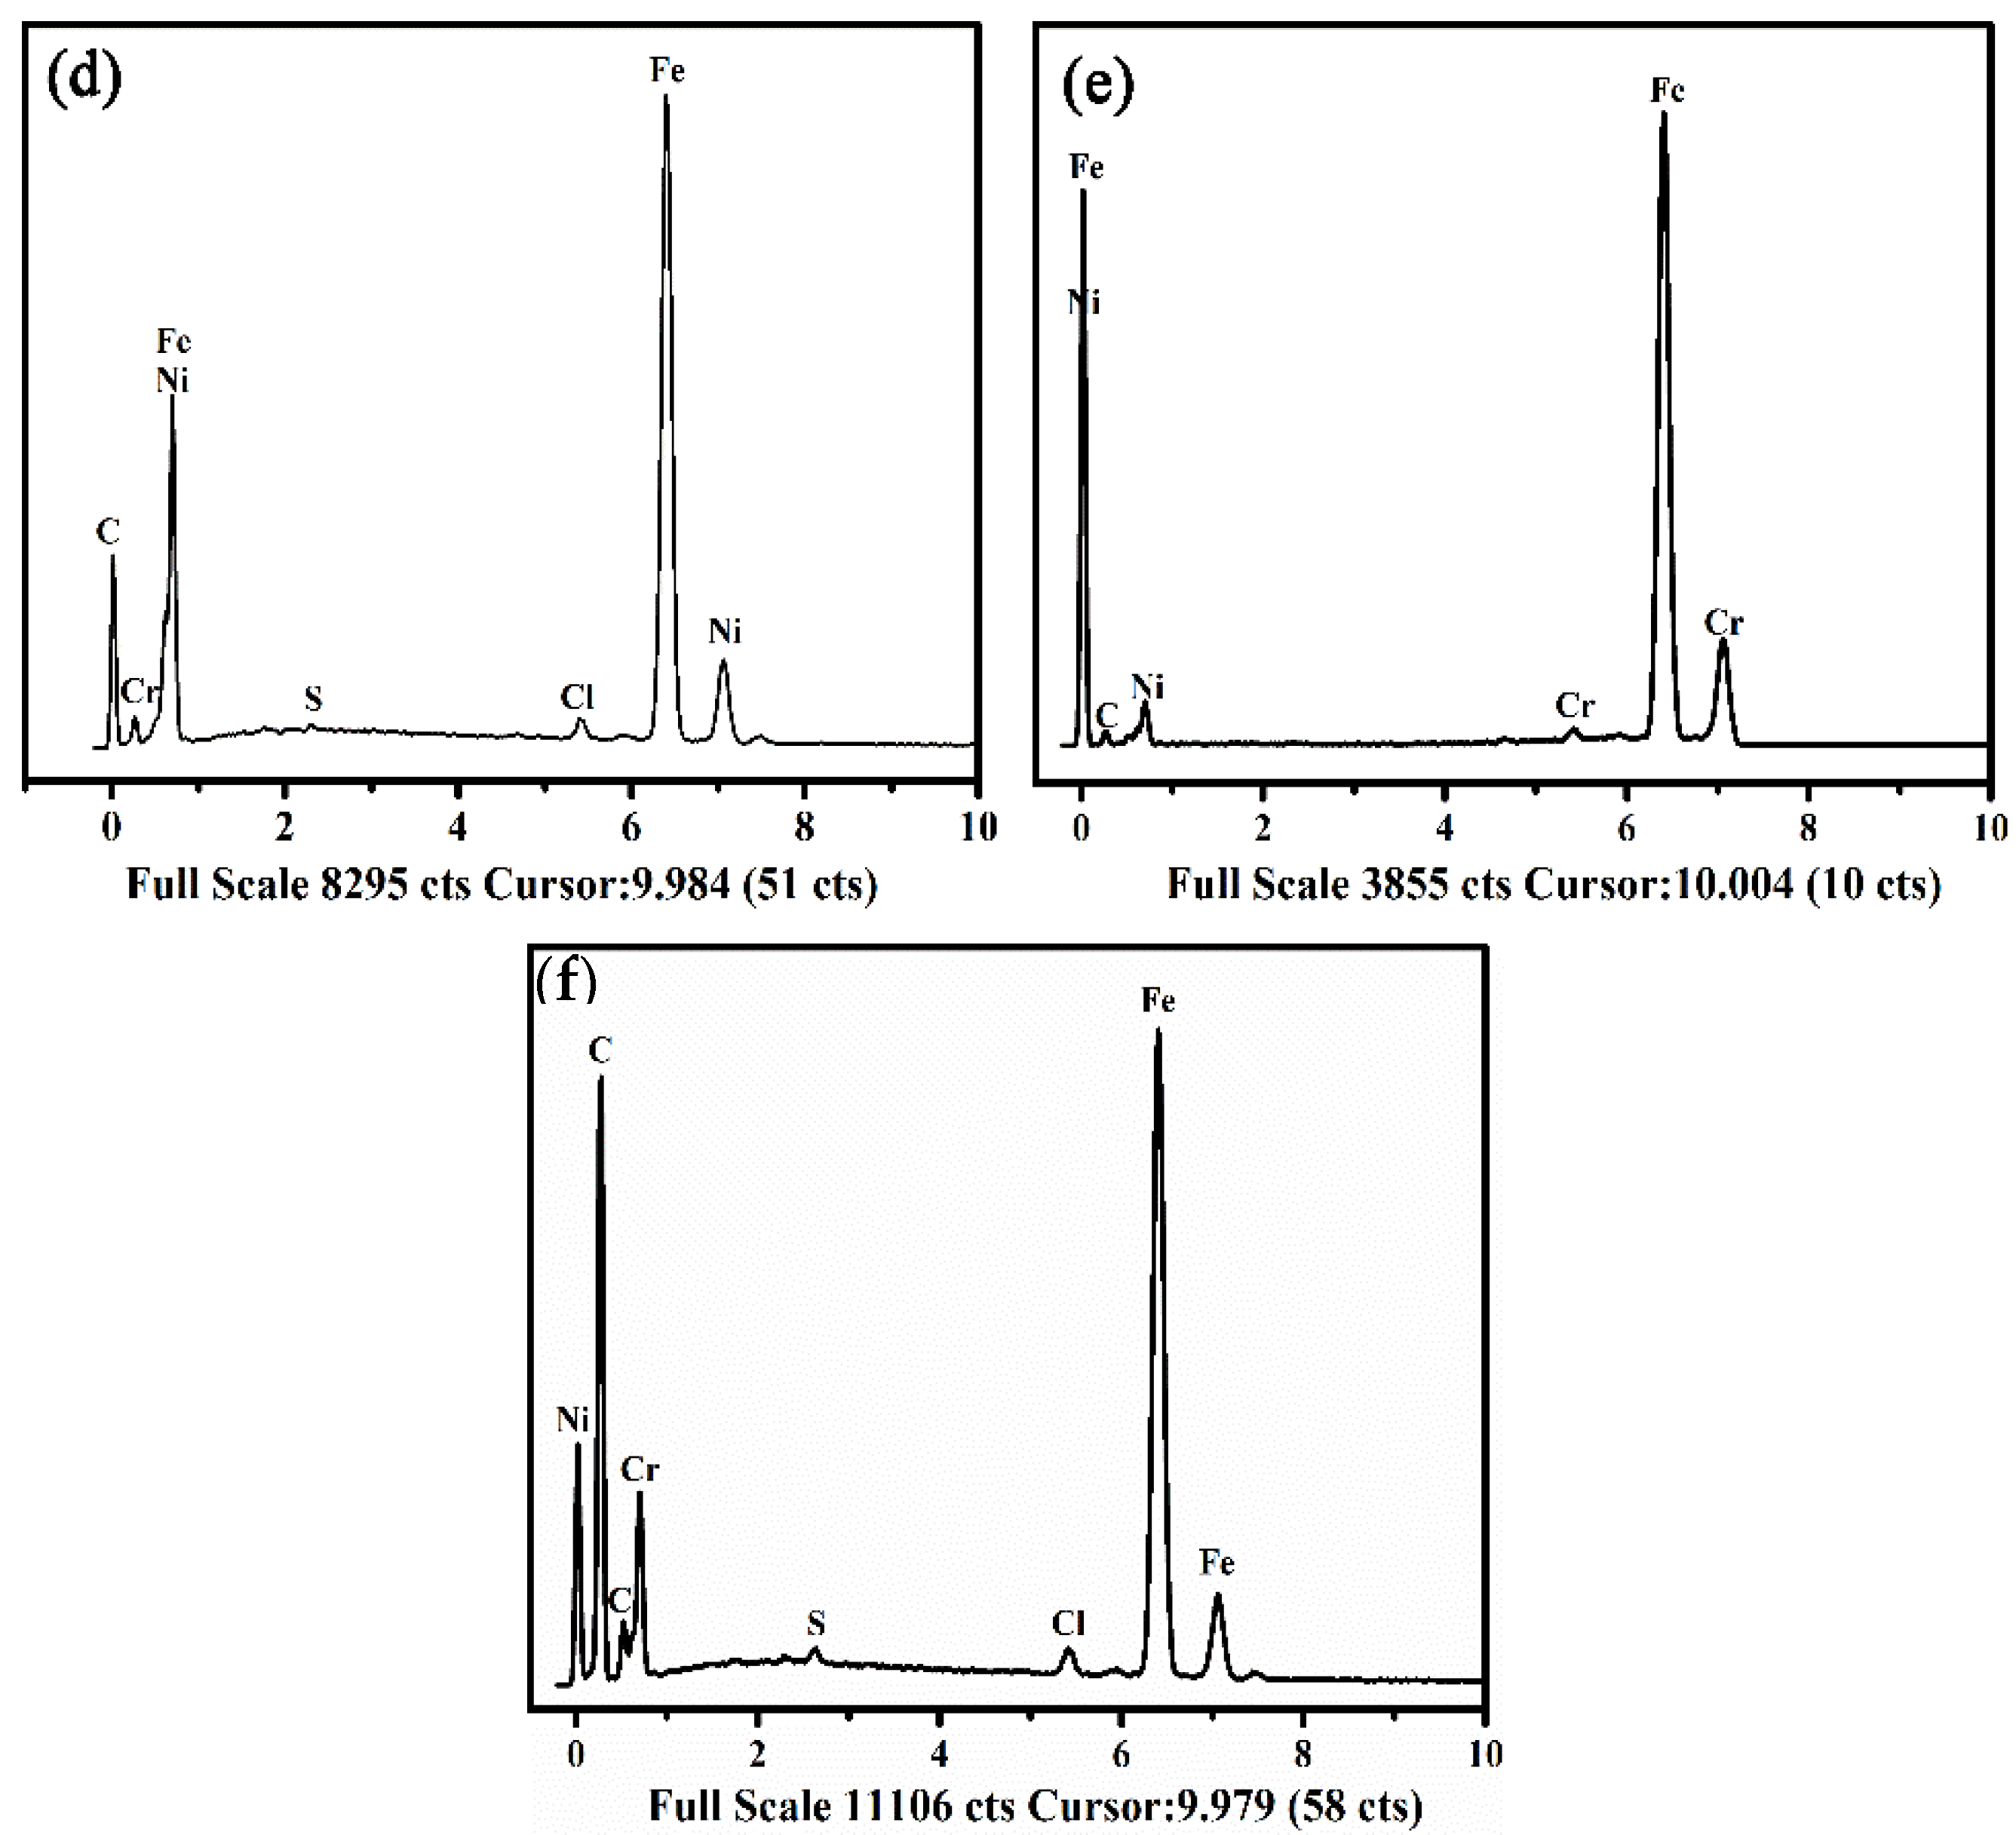
Figure 8 exhibits the micrographs of the damage after RCT tests. In order to compare failure mechanism at different quenching temperatures, three groups of tests with similar fatigue life were selected for observation. Figure 8a shows the worn surface morphology of the sample quenched at 900 °C with a fatigue life of 543,400 cycles. Delamination was the main damage mode of the sample quenched at 900 °C, and some spallings propagated to cracks under the influence of cyclic stress. With the increased of testing time, the local plastic strain accumulated gradually. It should be noted that the ball, contact surface of sample, and lubricating oil form a high-pressure oil chamber under the action of high-speed rotation. Those high pressure oils were squeezed into cracks and caused a great impact on the interior of the cracks.
Figure 8b shows the worn surface morphology of the sample quenching at 1000 °C with a fatigue life of 572,000 cycles. A large number of fatigue pits on the contact surface, marked as arrows, some of pits have gradually expanded to the larger ones on the surface of quenched at 1000 °C. It is believed that the fatigue pits can affect the roughness of the contact surface, which intensified the wear of the surface. Fatigue pits further expanded into cracks to impact on fatigue life of the specimens under stress concentration. Similar results have been reported by Fang, who concluded that micro-cracks preferentially initiate at the concave where the rough surface causes stress concentration [23].
Figure 8c shows the worn surface morphology of the sample quenched at 1100 °C with a fatigue life of 566,200 cycles. It indicates that the surface damage mechanism of quenched at 1100 °C is similar to that at 900 °C. However, there some sub-cracks on the subsurface in Figure 8c, and the sub-cracks propagated to the peeling and delamination. While, the debris agglomerated in the contact surface as a moving particle plowing the surface to generate the abrasive pits.
Figure 8d–f show the energy dispersive X-ray analysis (EDS) patterns of delamination and peeling. It is observed from Figure 8d,f that the S and Cl were found in the delamination, indicating that a bond was formed between the lubricant and the delamination under the influence of the cyclic impact of high pressure oil. However, the S and Cl were not found in the pitting in Figure 8f, indicating that the lubricating oil has good fluidity in this area.
3.4. Subsurface Fatigue Damage
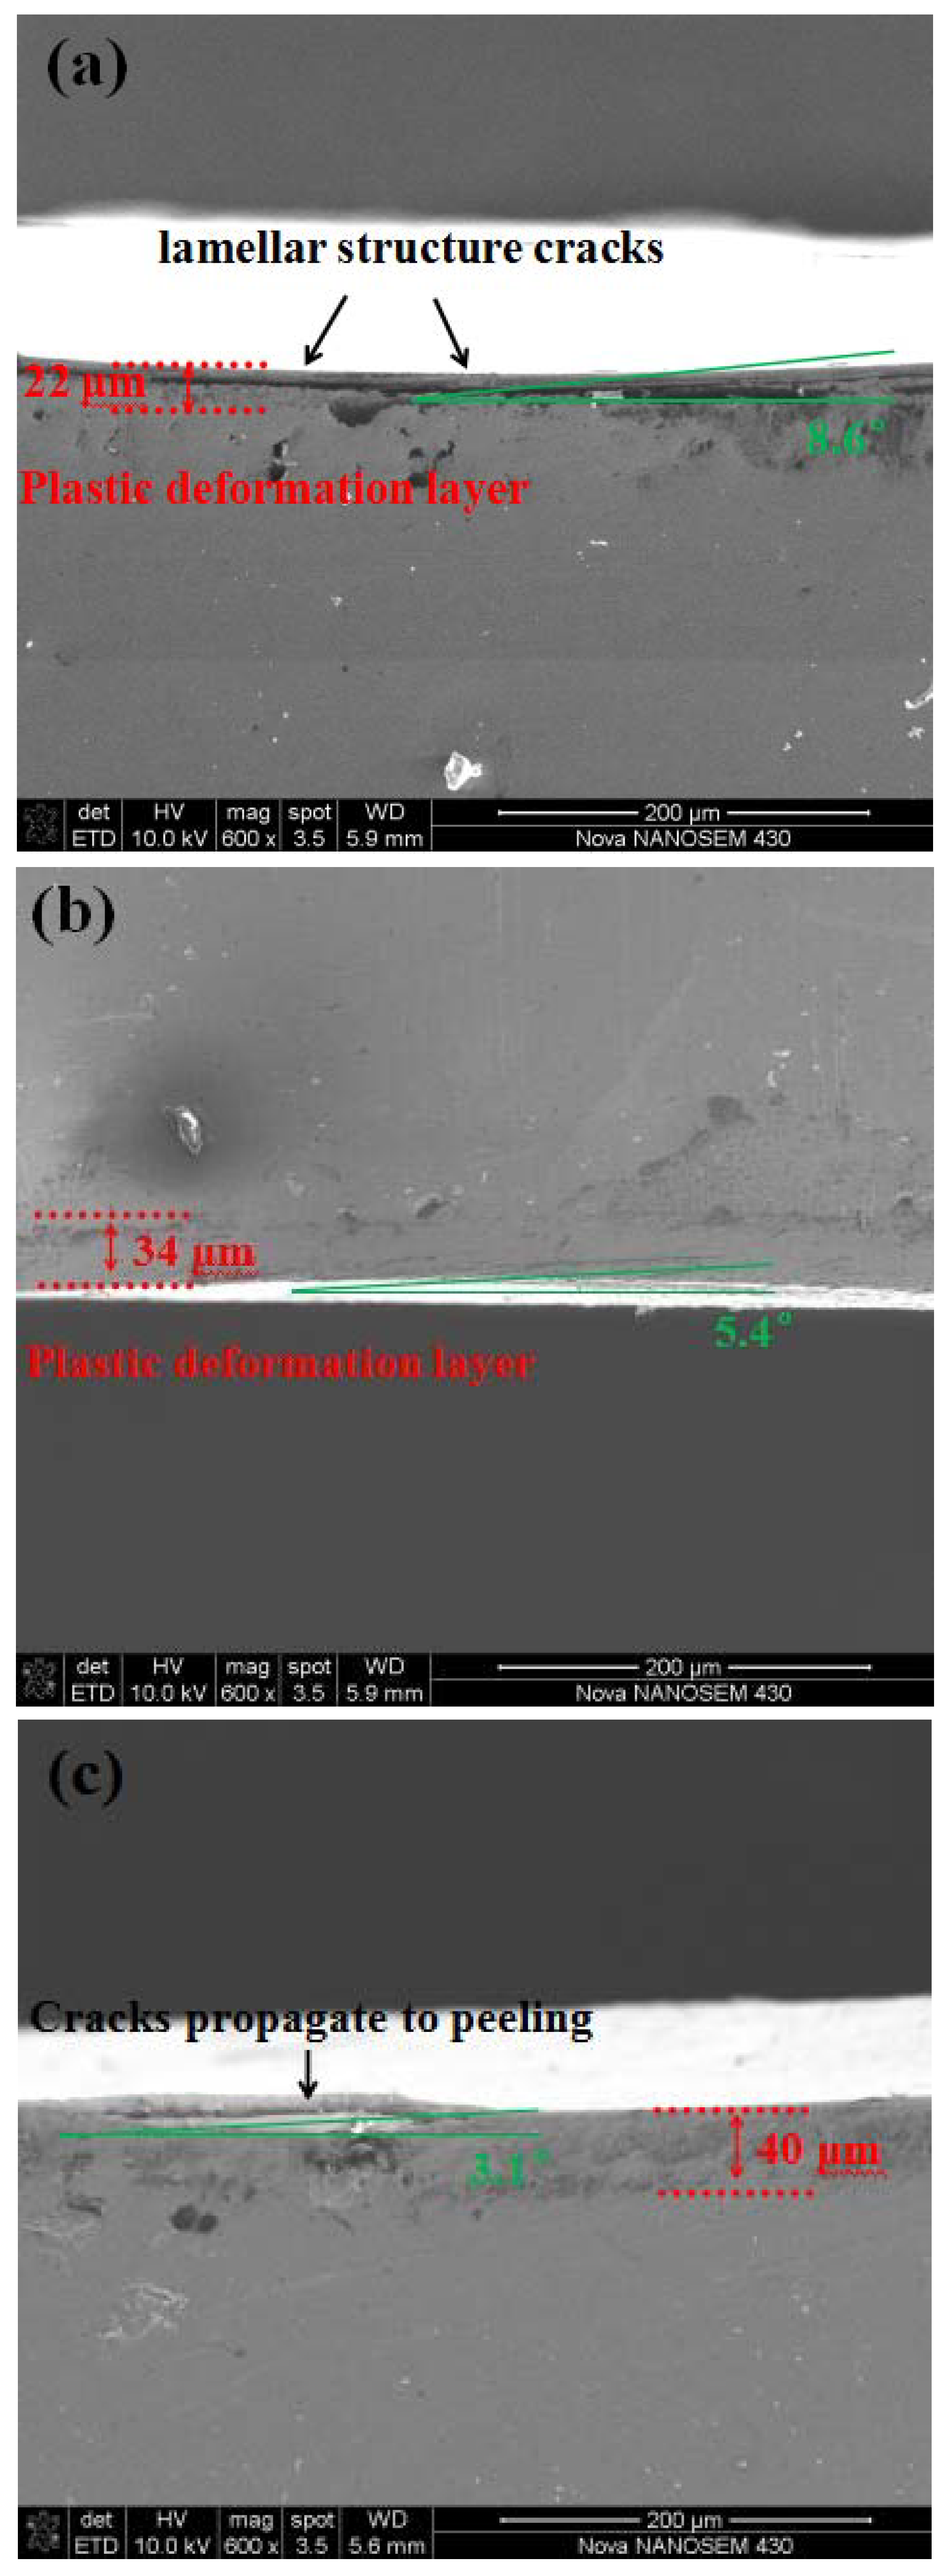
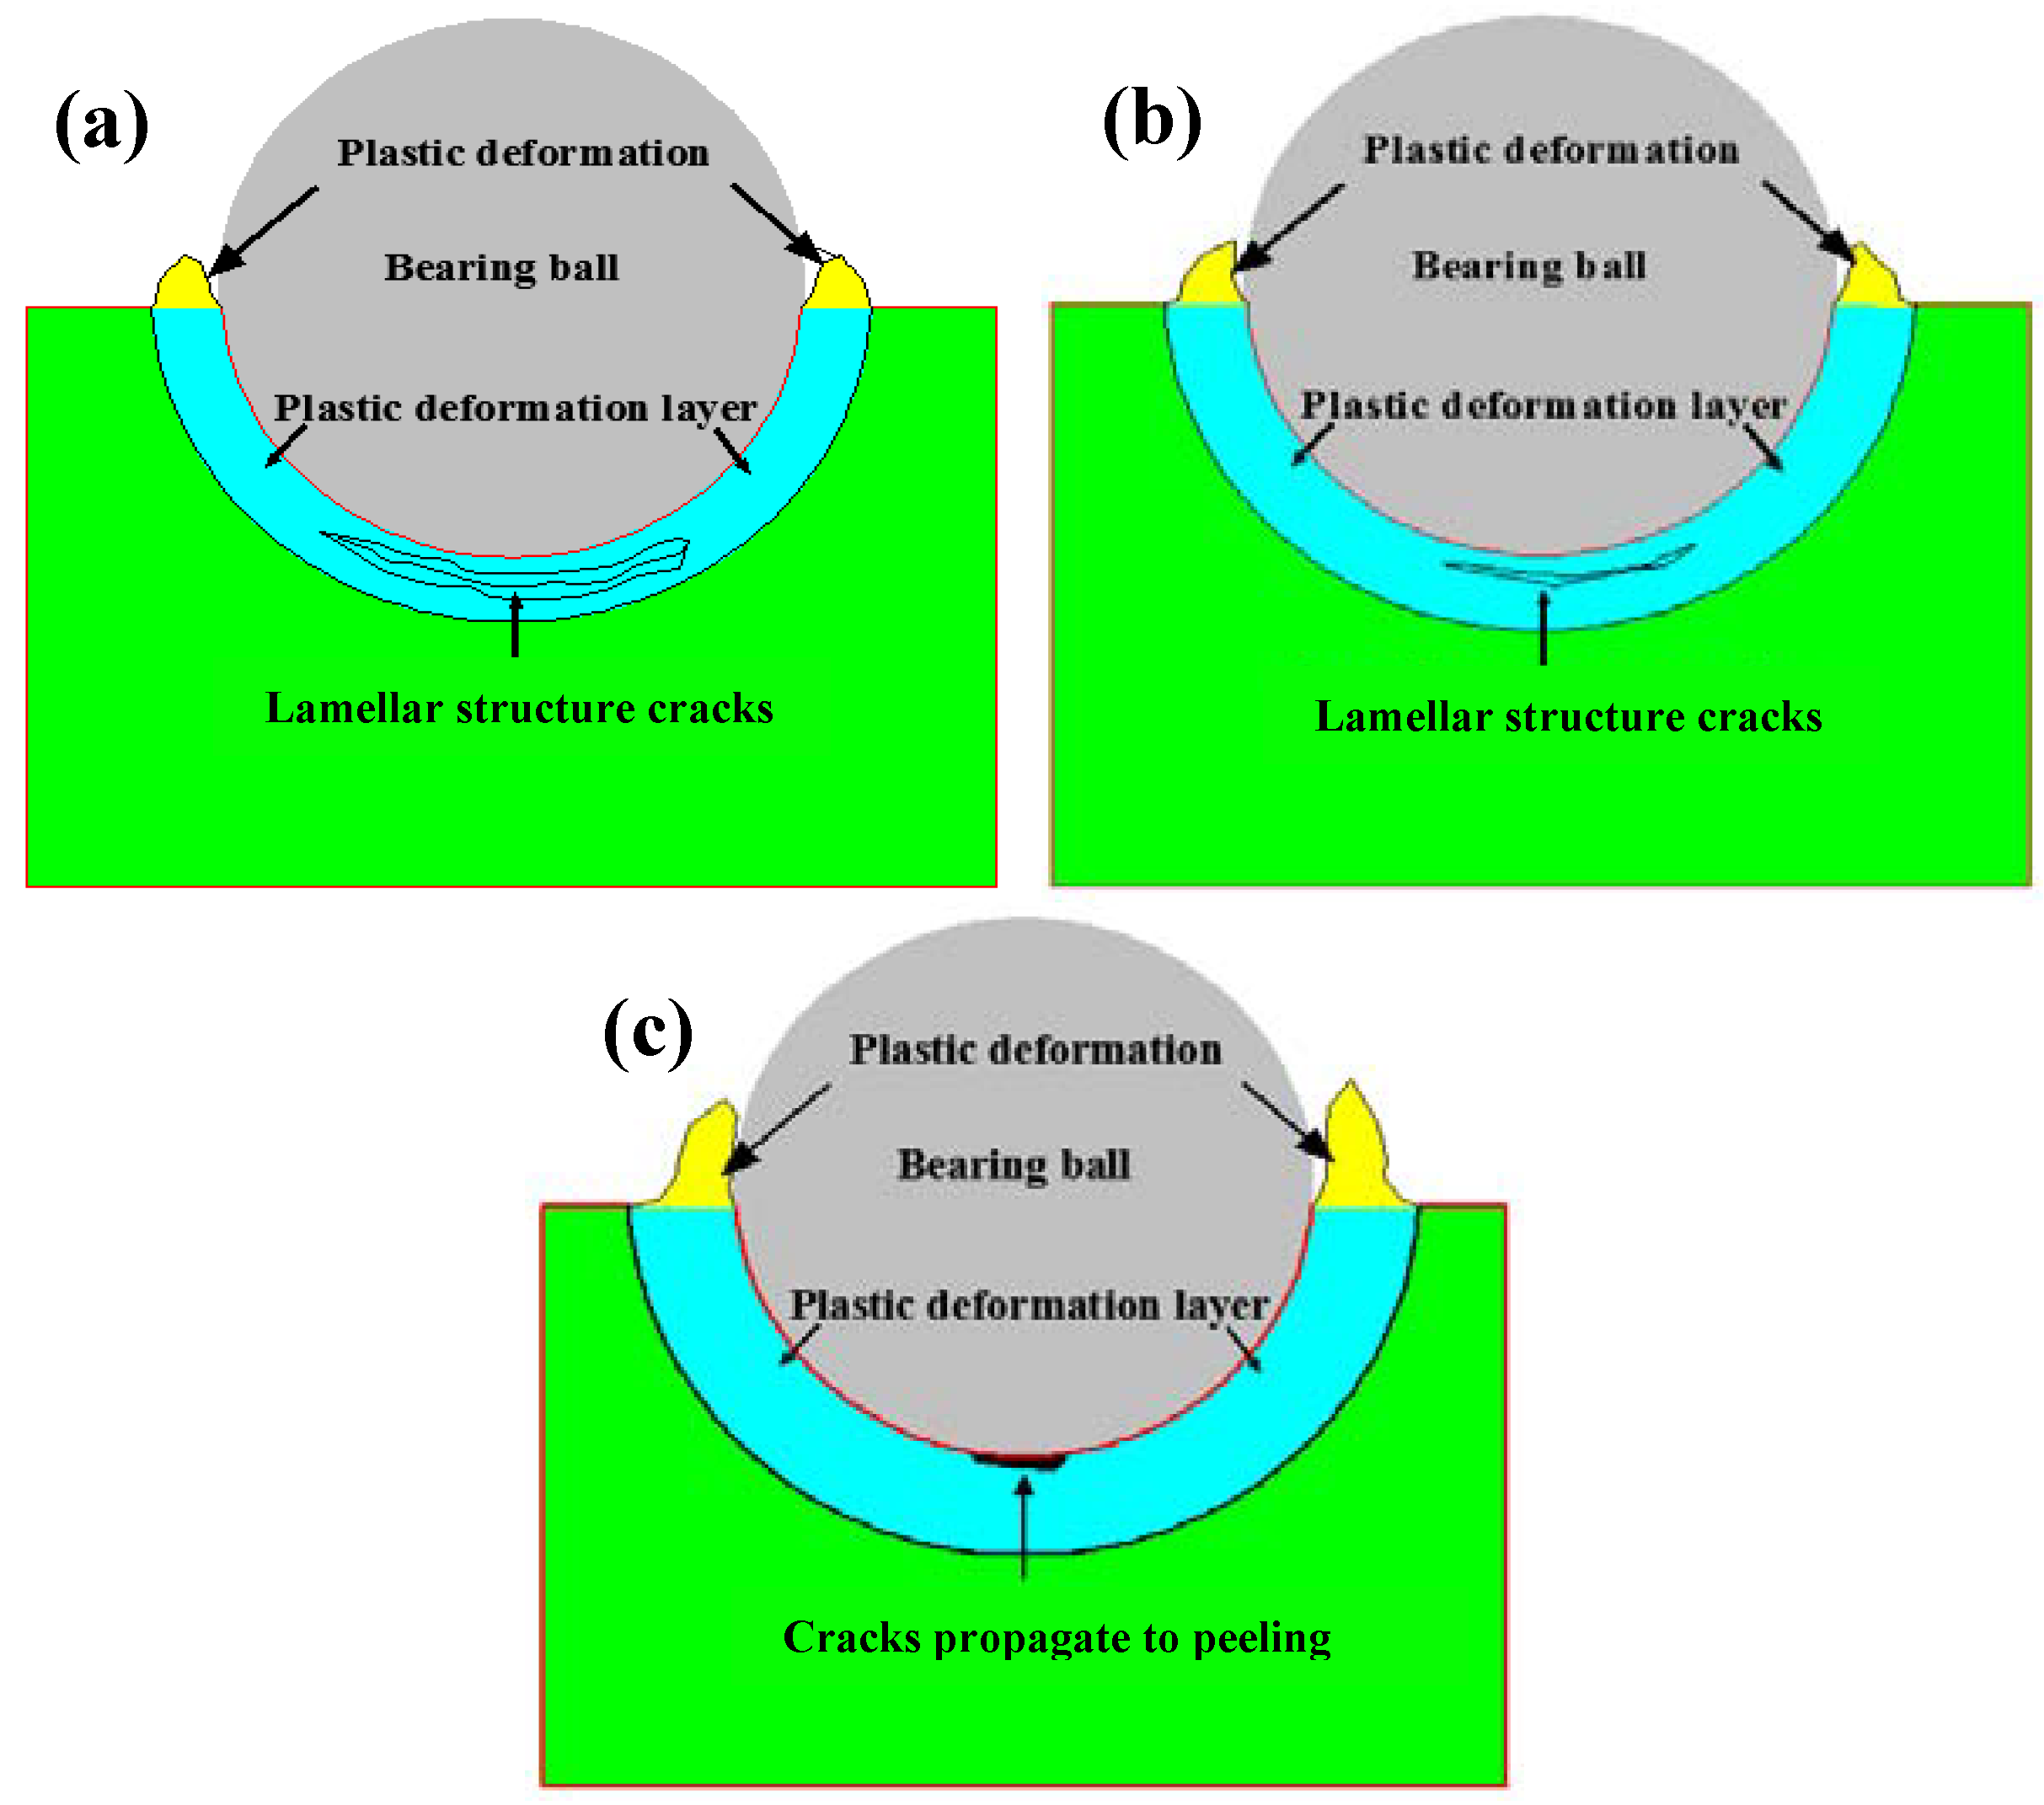
Figure 9 shows the cross-sectional subsurface damage of the samples at different quenching temperatures. It is obvious in Figure 9a that the cracks propagate parallel to the surface and the different propagation angles of cracks are growing to lamellar structure cracks. In addition, the surface and surface cracks join with each other meanwhile subsurface cracks develop to the surface of the sample quenched at 900 °C, and the depth of plastic deformation layer in the depth direction is about 22 μm. Figure 9b shows the SEM micrographs of the cracks of the sample quenching at 1100 °C. How cracks propagate on the sample quenched at 1000 °C is similar to the sample quenched at 900 °C under the contact stress of 3.2 GPa, The depth of plastic deformation layer in the depth direction is about 34 μm. Figure 9c exhibits the morphology of peeling on cross-sectional subsurface. It can be found that the subsurface cracks and lamellar structure cracks join with each other and the depth of plastic deformation layer is about 40 μm.
Moreover, the propagation angles of the sample at different quenching temperatures were about 8.6°, 5.4°, and 3.1°, respectively, it should be noted that there was a tread of convergence between surface and subsurface cracks, small extension angles were prone to peeling. This was consistent with Ma [24], who reported the wear and damage characteristics of rail material.
It is clear that the quenching temperatures make a difference in damage mechanism of RCF cracks. Some cracks propagate along with an increasing of the quenching temperature, while cracks grow upward to the surface, and the delamination emerges under the influence of cyclic stress (Figure 8a,c). Moreover, the subsurface reveals serious lamellar structure cracks at 1100 °C (Figure 10a), and some cracks initiate on the surface and form the peeling (Figure 10c). Quenched at 1000 °C, dislocation density enhances the resistance to damage, as a result, the cracks get hard to propagate. Therefore, the lamellar structure cracks in the depth direction are the least (Figure 10b).
4. Conclusions
In this work, the effect of quenching temperatures on microstructure and rolling contact fatigue behaviors of 17Cr2Ni2MoVNb steel are evaluated. In order to address this challenge, a set of tests were conducted on 17Cr2Ni2MoVNb. Based on the results, the main conclusions can be drawn, as follows:
(1). Using the XRD method, the average grain size increased while quenching temperature increased. The dislocation density increased first and then reduced.
(2). Under the contact stress of 3.2 GPa, samples at the quenching temperature of 1000 °C had the highest RCF life, the average life was 7.33 × 10⁶, which was 1.46 times and 1.89 times that of 900 °C and 1100 °C, respectively.
(3). The failure mechanism of the samples quenched at 1000 °C was pitting, and delamination was the main failure mode of 900 °C and 1100 °C. The effect of lubricating oil on the pitting was mainly lubrication, and the effect on delamination was impact damage.
(4). The thicknesses of the plastic deformation layer were 22 μm, 34 μm, and 40 μm with the quenching temperatures of 900, 1000, and 1100 °C, respectively. While cracks grew upward to the surface and joined with each other to form lamellar structure cracks. However, the peeling was easy to emerge when the samples quenched at 1100 °C.
Author Contributions
Both authors contributed equally to the work.
Funding
This research received no external funding.
Acknowledgments
The authors would like to thank the National Engineering Research Center of Near-Net-Shape Forming for Metallic Materials, State Key Laboratory of Smart Manufacturing for Special Vehicle as well as Transmission System and State Key Laboratory of Internal Combustion Engine Reliability for material preparation and mechanical properties testing.
Conflicts of Interest
The authors declare no conflict of interest.
References
- Sciammarella, C.A.; Chen, R.J.S.; Gallo, P.; Berto, F.; Lamberti, L. Experimental evaluation of rolling contact fatigue in railroad wheels. Int. J. Fatigue 2016, 91, 158–170. [Google Scholar] [CrossRef]
- Cheng, X.W.; Jiang, Z.Y.; Wei, D.B.; Hao, L.; Wu, H.; Xia, W.Z.; Zhang, X.; Luo, S.Z.; Jiang, L.Z. Effects of surface preparation on tribological behaviour of a ferritic stainless steel in hot rolling. Wear 2017, 376–377, 1804–1813. [Google Scholar] [CrossRef]
- Gao, Y. Influence of deep-nitriding and shot peening on rolling contact fatigue performance of 32Cr3MoVA steel. J. Mater. Eng. Perform. 2007, 17, 455–459. [Google Scholar] [CrossRef]
- Wang, X.B.; He, M.S.; Barber, G.C.; Schall, D.; Tao, C.L.; Sun, X.C. Rolling contact fatigue resistance of austempered ductile iron processed at various austempering holding times. Wear 2018, 398–399, 41–46. [Google Scholar] [CrossRef]
- Gurudas, M.; Tewary, N.K.; Ghosh, S.K. Enhancement of mechanical properties in bainitic steel processed from different austenitization temperatures. Steel Res. Int. 2017, 2, 87–92. [Google Scholar]
- Moravej, M.; Mantovani, D. Biodegradable metals for cardiovascular stent application: Interests and new opportunities. Int. J. Mol. Sci. 2011, 12, 4250–4270. [Google Scholar] [CrossRef] [PubMed]
- Schinhammer, M.; Hänzi, A.C.; Löffle, J.F.; Uggowitzer, P.J. Design strategy for biodegradable Fe-based alloys for medical applications. Acta Biomater. 2010, 6, 1705–1713. [Google Scholar] [CrossRef] [PubMed]
- Long, S.L.; Liang, Y.L.; Jiang, Y.; Liang, Y.; Yang, M. Effect of quenching temperature on martensite multi-level microstructures and properties of strength and toughness in 20CrNi2Mo steel. Mater. Sci. Eng. A 2016, 676, 38–47. [Google Scholar] [CrossRef]
- Matlock, D.K.; Alogab, K.A.; Richards, M.D. Surface processing to improve the fatigue resistance of advanced bar steel for automotive applications. Mater. Res. 2005, 4, 453–459. [Google Scholar] [CrossRef]
- Ma, L.; He, C.G.; Zhao, X.J.; Guo, J.; Zhu, Q.Y.; Wang, W.J.; Liu, Q.Y.; Jin, X.S. Study on wear and rolling contact fatigue behaviors of wheel/rail materials under different slip ratio condition. Wear 2016, 366–367, 13–26. [Google Scholar] [CrossRef]
- Wang, W.J.; Guo, J.; Liu, Q.Y.; Zhu, M.H.; Zhou, Z.R. Study on relationship between oblique fatigue crack and rail wear in curve track and prevention. Wear 2009, 267, 540–544. [Google Scholar] [CrossRef]
- Gallo, P.; Berto, F. Influence of the surface roughness on the high temperature fatigue strength and cracks initiation in 40CrMoV13.9 notched components. Theor. Appl. Fract. Mech. 2015, 80, 226–234. [Google Scholar] [CrossRef]
- Yu, P.Z.; Xu, B.S.; Wang, H.D. Investigation of rolling contact fatigue lives of Fe-Cr alloy coatings under different loading conditions. Surf. Coat. Technol. 2010, 204, 1405–1411. [Google Scholar]
- Glover, D. A ball-rod rolling contact fatigue tester. In Rolling Contact Fatigue Testing of Bearing Steels; Hoo, J.J.C., Ed.; ASTM SPECIAL TECHNICAL PUBLICATION: Baltimore, MD, USA, 1982; pp. 107–124. [Google Scholar]
- Qu, S.G.; Lai, F.Q.; Wang, G.H.; Yuan, Z.M.; Li, Q.X.; Guo, H. Friction and wear behavior of 30CrMnSiA steel at elevated temperatures. J. Mater. Eng. Perform. 2016, 25, 1407–1415. [Google Scholar] [CrossRef]
- Wang, G.H.; Qu, S.G.; Yin, L.M.; Li, X.Q.; Yue, W. Rolling contact fatigue property and failure mechanism of carburized 30CrSiMoVM steel at elevated temperature. Tribol. Int. 2016, 98, 144–154. [Google Scholar] [CrossRef]
- Sun, J.J.; Jiang, T.; Wang, Y.J. Effect of grain refinement on high-carbon martensite transformation and its mechanical properties. Mater. Sci. Eng. A 2018, 726, 342–349. [Google Scholar] [CrossRef]
- Chen, R.; Jiang, P.; Shao, X.Y.; Mi, G.Y.; Wang, C.M. Effect of magnetic field on crystallographic orientation for stainless steel 316L laser-MIG hybrid welds and its strengthening mechanism on fatigue resistance. Int. J. Fatigue 2018, 112, 308–317. [Google Scholar] [CrossRef]
- Wang, H.B.; Wang, F.L.; Gen, H. Effect of quenching temperature on microstructure and yield strength of Q-T-treated X100Q bainitic steel. Mater. Res. Express 2018, 5, 066509. [Google Scholar] [CrossRef] [Green Version]
- Zheng, C.L.; She, L.; Wang, Y.H.; Yang, Z.N.; Zhang, F.C. Rolling contact fatigue behaviors of high carbon bainitic bearing steel. J. Mech. Eng. 2017, 53, 110–117. (In Chinese) [Google Scholar] [CrossRef]
- Walvekar, A.A.; Farshid, S. Rolling contact fatigue of case carburized steels. Int. J. Fatigue 2017, 95, 264–281. [Google Scholar] [CrossRef]
- Zhao, Y.Q.; Liang, H.Q. Modeling of the probabilistic fatigue S-N curves using the two parameter Weibull distribution. J. Mech. Eng. 2015, 51, 208–212. (In Chinese) [Google Scholar] [CrossRef]
- Fang, X.; Yan, W.Z.; Gao, H.S. Finite element simulation of surface deformation of polycrystal with a rough surface under repeated load. Finite Elem. Anal. Des. 2012, 60, 64–71. [Google Scholar] [CrossRef]
- Ma, L.; Shi, L.B.; Guo, J.; Liu, Q.Y.; Wang, W.J. On the wear and damage characteristics of rail material under low temperature environment condition. Wear 2018, 394–395, 149–158. [Google Scholar] [CrossRef]
Figure 1.
Schematic of the rolling contact fatigue test device. 1-DC motor, 2-Coolant outlet, 3-Coolant inlet, 4-Spindle, 5-Spindle bearing, 6-Circulating coolant chamber, 7-Bearing, 8-Specimen, 9-Heating sheet, 10-Rolling bearing, and 11-Hydraulic cylinder.
Figure 1.
Schematic of the rolling contact fatigue test device. 1-DC motor, 2-Coolant outlet, 3-Coolant inlet, 4-Spindle, 5-Spindle bearing, 6-Circulating coolant chamber, 7-Bearing, 8-Specimen, 9-Heating sheet, 10-Rolling bearing, and 11-Hydraulic cylinder.

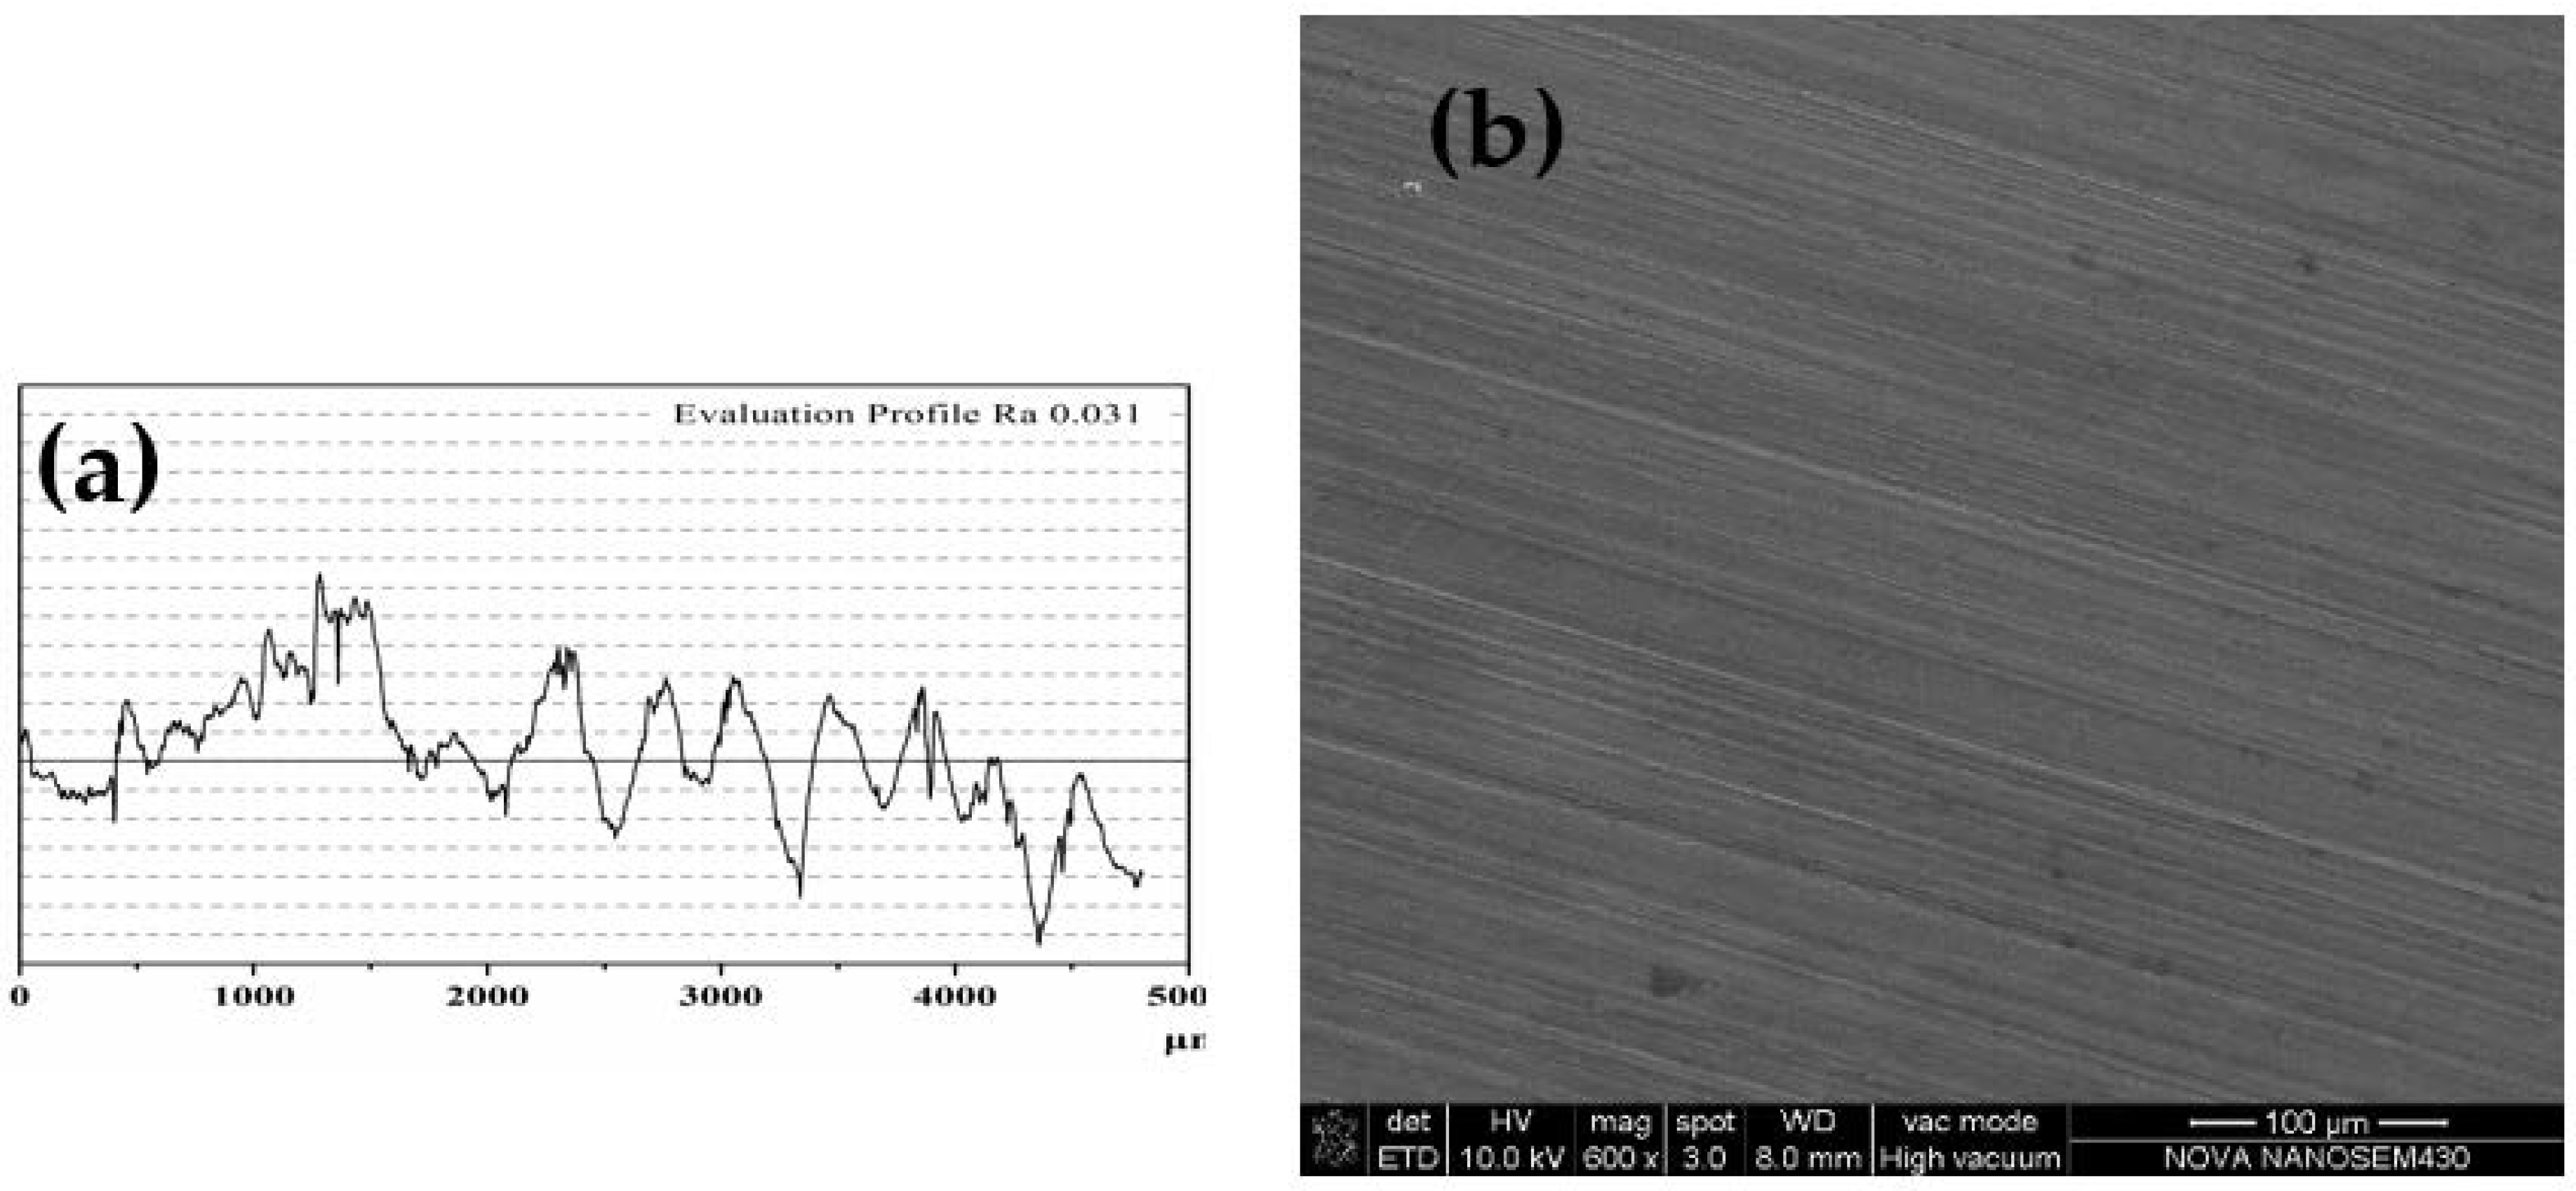
Figure 2.
(a) Surface roughness and (b) morphology.

Figure 3.
Optical microscopy (OM) micrographs of 17Cr2Ni2MoVNb steel quenched at different temperatures of (a) 900 °C, (b) 1000 °C, and (c) 1100 °C.
Figure 3.
Optical microscopy (OM) micrographs of 17Cr2Ni2MoVNb steel quenched at different temperatures of (a) 900 °C, (b) 1000 °C, and (c) 1100 °C.

Figure 4.
Transmission electron microscopy (TEM) micrographs of 17Cr2Ni2MoVNb steel quenched at different temperatures of (a) 900 °C, (b) 1000 °C, and (c) 1100 °C.
Figure 4.
Transmission electron microscopy (TEM) micrographs of 17Cr2Ni2MoVNb steel quenched at different temperatures of (a) 900 °C, (b) 1000 °C, and (c) 1100 °C.

Figure 5.
X-ray diffractometer (XRD) patterns of 17Cr2Ni2MoVNb steel quenched at different temperatures.
Figure 5.
X-ray diffractometer (XRD) patterns of 17Cr2Ni2MoVNb steel quenched at different temperatures.

Figure 6.
(a) the mean size of crystal and (b) dislocation density of samples at different quenching temperatures.
Figure 6.
(a) the mean size of crystal and (b) dislocation density of samples at different quenching temperatures.

Figure 7.
Weibull curves of fatigue life of 17Cr2Ni2MoVNb steel quenched at different temperatures.
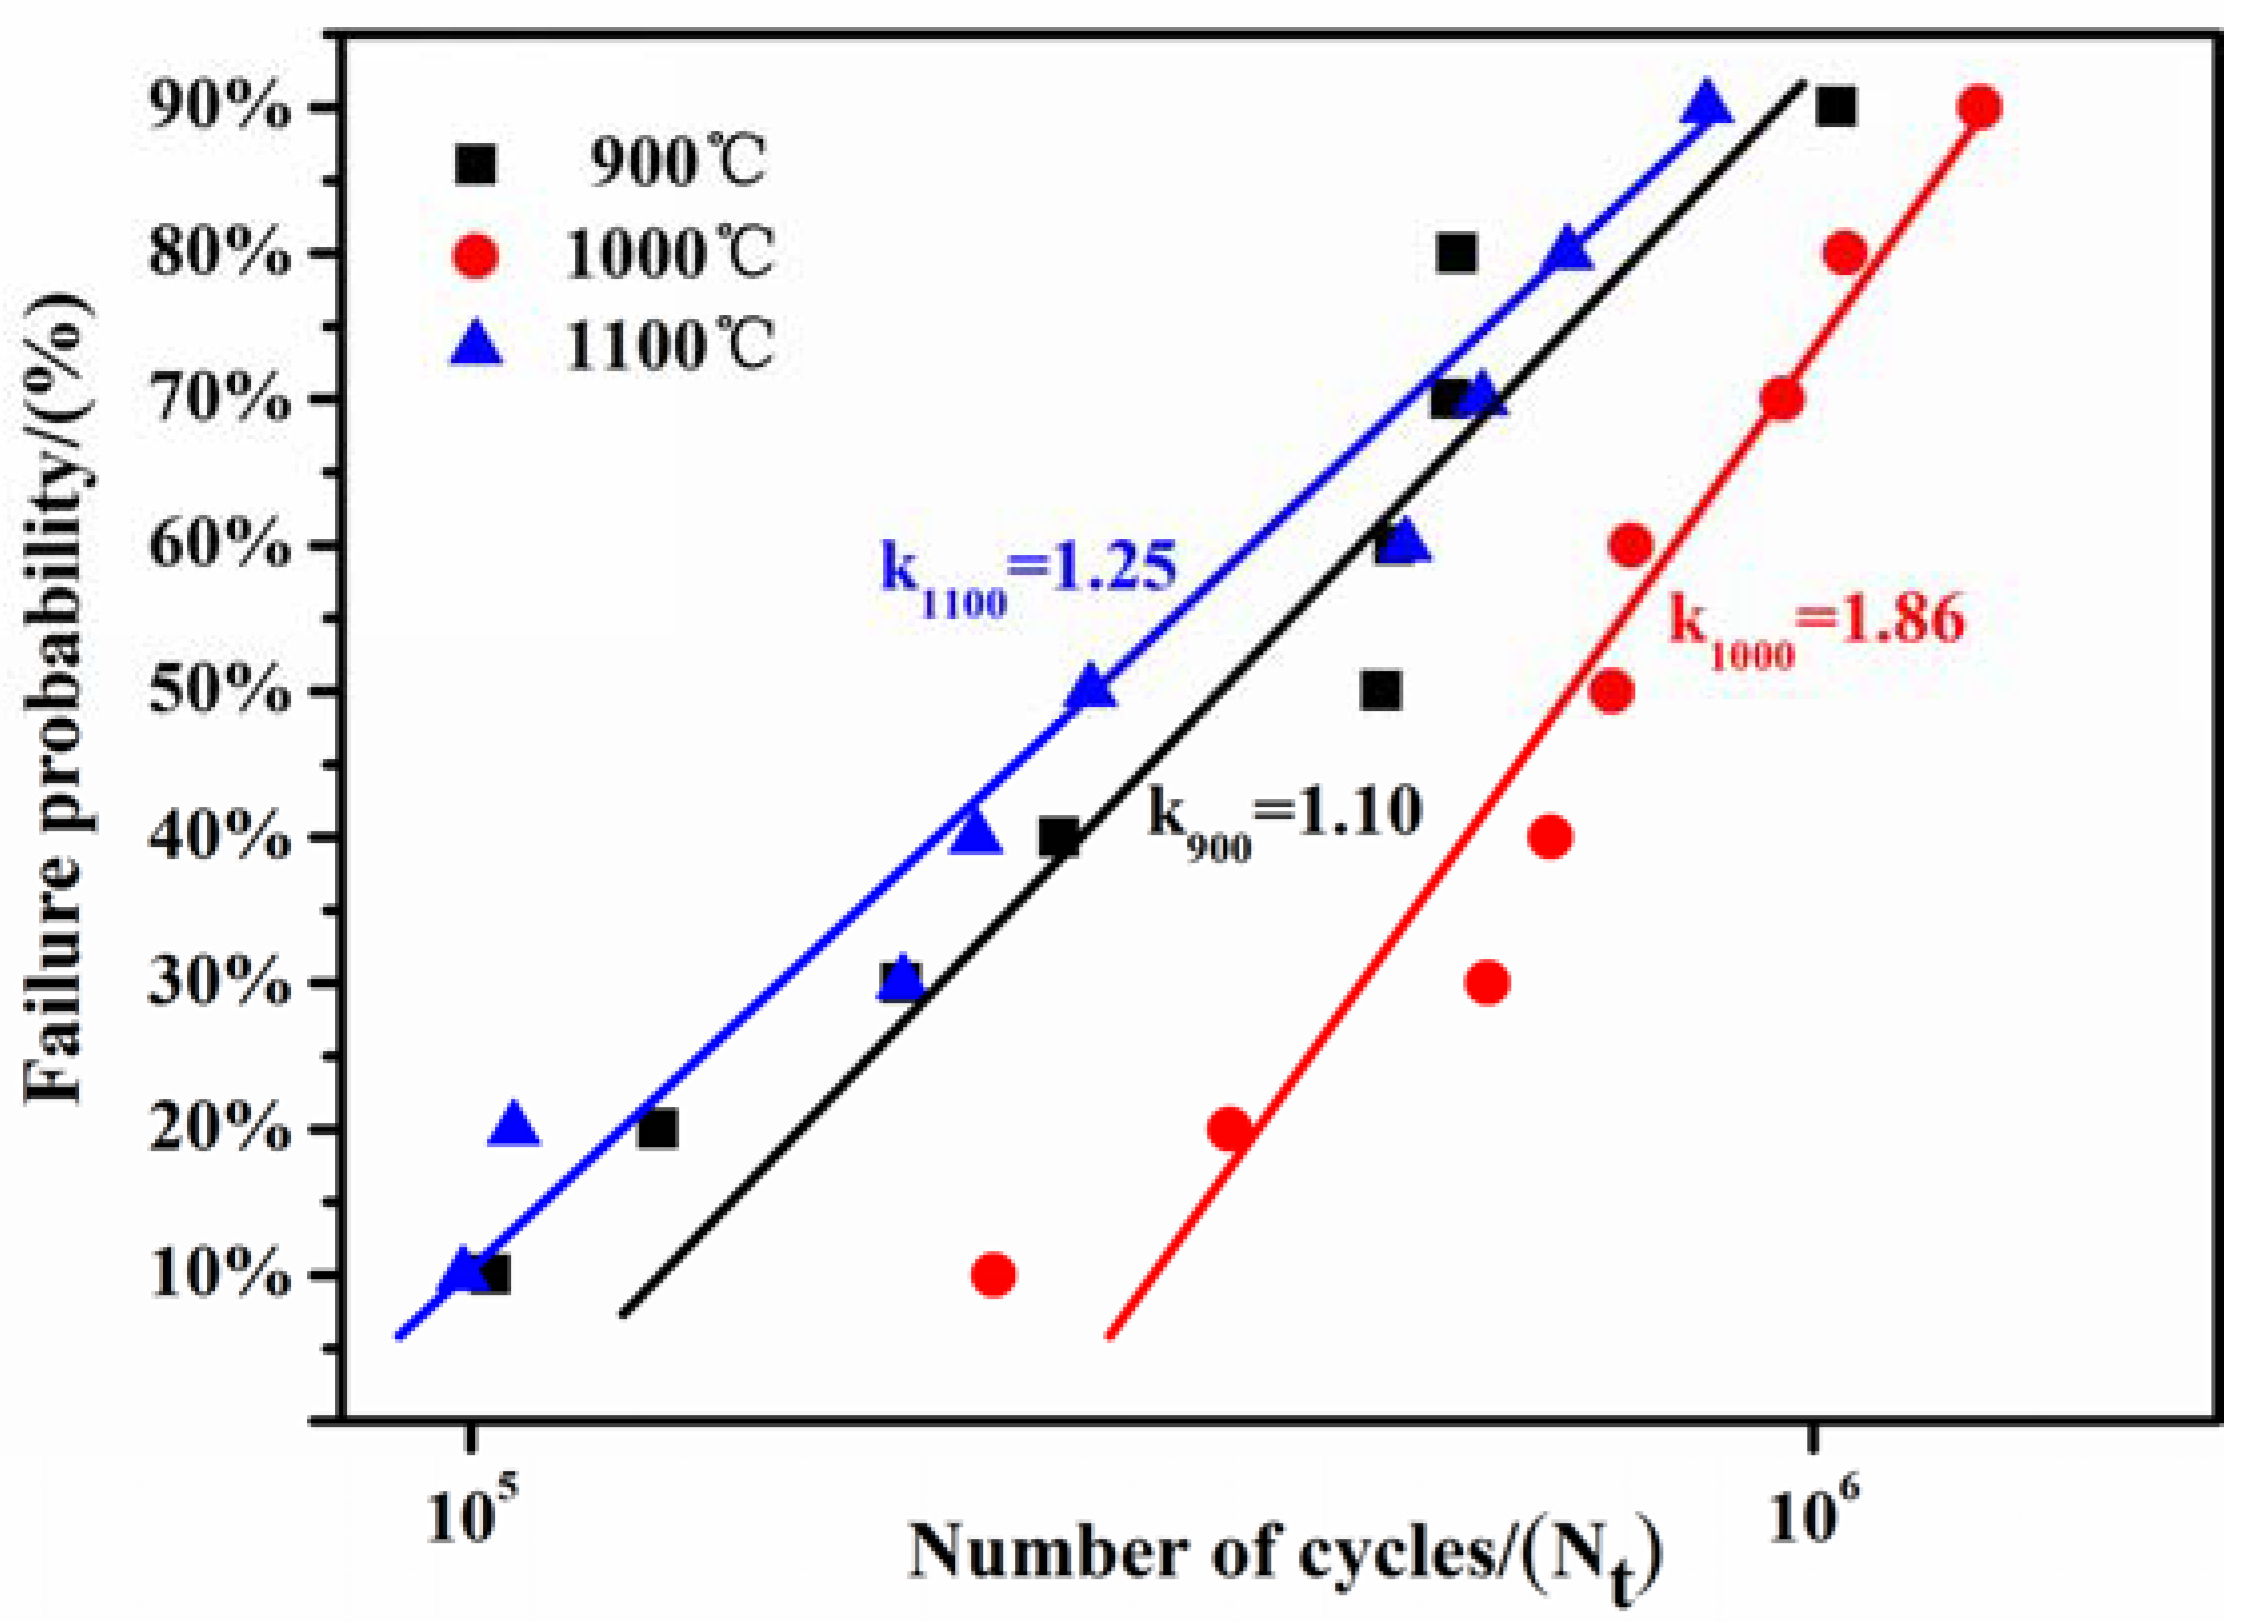
Figure 8.
Typical micrographs of the damage: (a) Quenched at 900 °C contact stress3.2 GPa and 543,400 cycles to failure; (b) Quenched at 1000 °C contact stress 3.2 GPa and 572,000 cycles to failure; (c) Quenched at 1100 °C contact stress 3.2 GPa and 566,000 cycles to failure and EDS graphs at different temperatures of (d) 900 °C, (e) 1000 °C, and (f) 1100 °C.
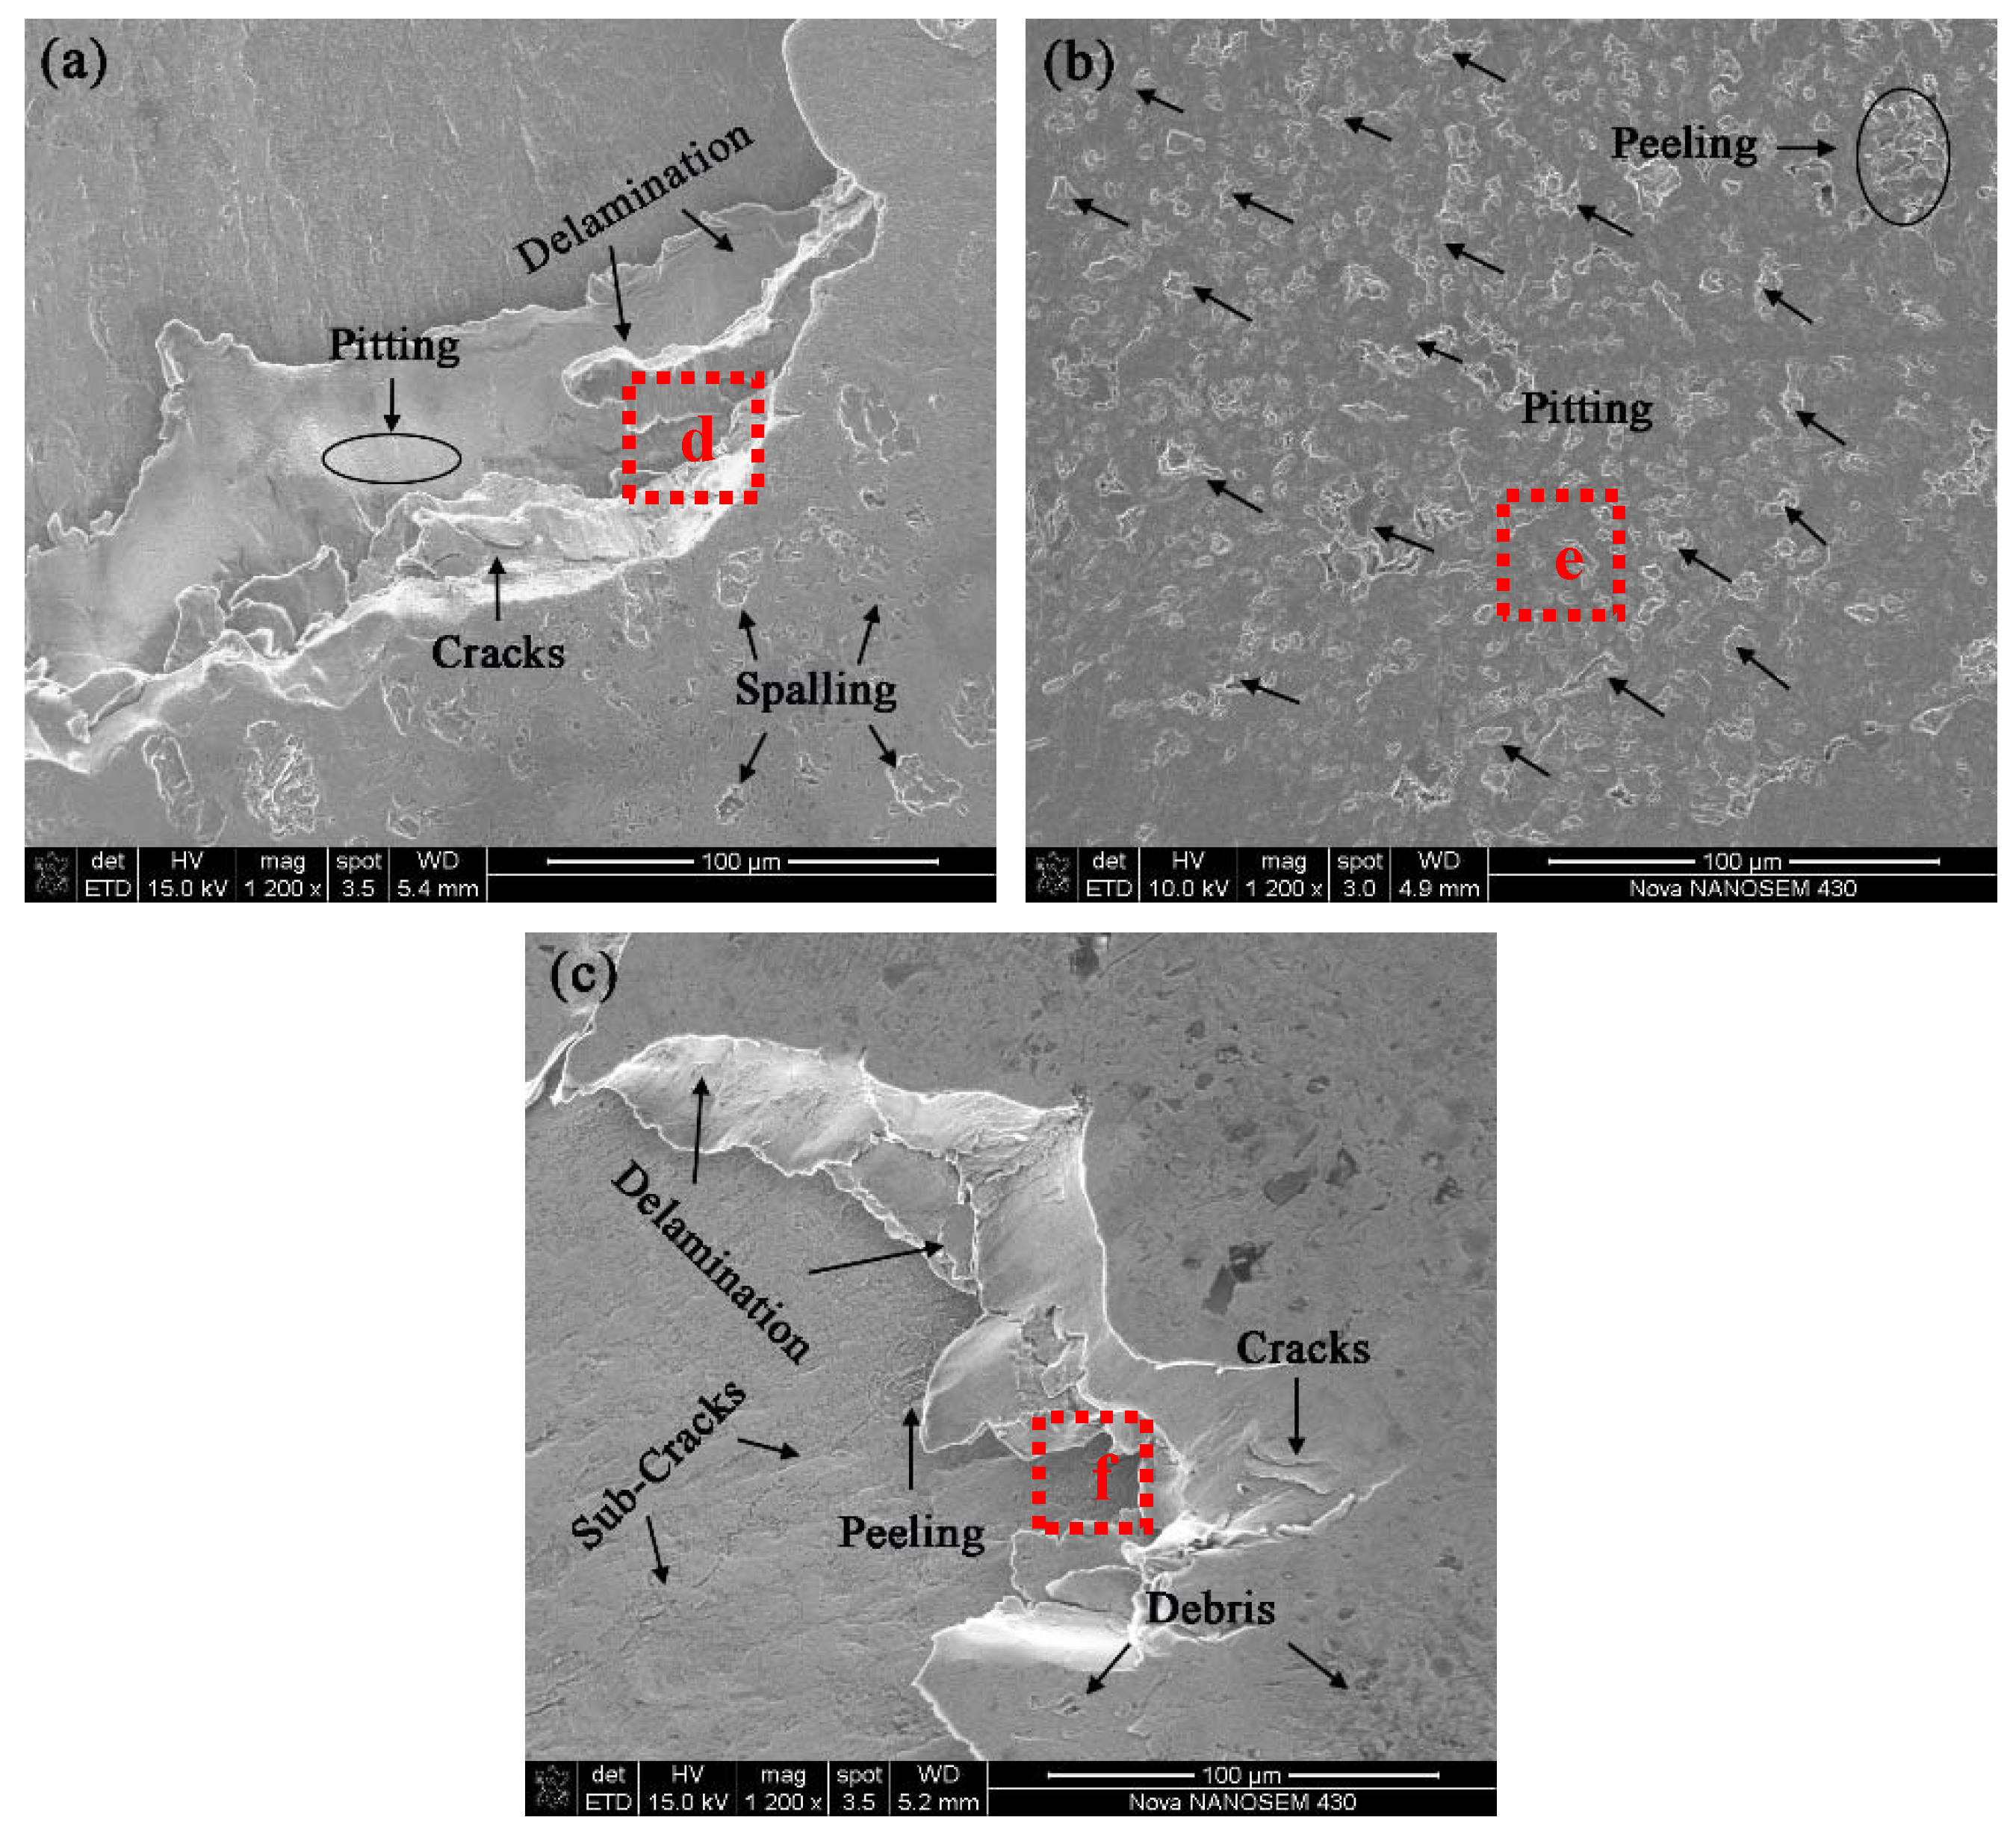

Figure 9.
Micrographs of subsurface damage: (a) Quenched at 900 °C contact stress 3.2 GPa and 543,400 cycles to failure; (b) Quenched at 1000 °C contact stress 3.2 GPa and 572,000 cycles to failure; and, (c) Quenched at 1100 °C contact stress 3.2 GPa and 566,000 cycles to failure.
Figure 9.
Micrographs of subsurface damage: (a) Quenched at 900 °C contact stress 3.2 GPa and 543,400 cycles to failure; (b) Quenched at 1000 °C contact stress 3.2 GPa and 572,000 cycles to failure; and, (c) Quenched at 1100 °C contact stress 3.2 GPa and 566,000 cycles to failure.

Figure 10.
Schematic of fatigue damages: (a) Quenched at 900 °C contact stress 3.2 GPa and 543,400 cycles to failure; (b) Quenched at 1000 °C contact stress 3.2 GPa and 572,000 cycles to failure; and, (c) Quenched at 1100 °C contact stress 3.2 GPa and 566,000 cycles to failure.
Figure 10.
Schematic of fatigue damages: (a) Quenched at 900 °C contact stress 3.2 GPa and 543,400 cycles to failure; (b) Quenched at 1000 °C contact stress 3.2 GPa and 572,000 cycles to failure; and, (c) Quenched at 1100 °C contact stress 3.2 GPa and 566,000 cycles to failure.


Table 1.
Chemical compositions of 17Cr2Ni2MoVNb steel (wt. %).
| C | Si | Mn | Cr | Ni | Al | Cu | Mo | V | Nb | Mg | S | P |
|---|---|---|---|---|---|---|---|---|---|---|---|---|
| 0.188 | 0.015 | 0.40 | 1.83 | 1.63 | 0.048 | 0.01 | 0.31 | 0.093 | 0.059 | 0.007 | 0.001 | 0.009 |
Table 2.
Heat treatment of 17Cr2Ni2MoVNb steel.
| Samples Label | Quenching Temperature | Quenching Method | Tempering Temperature | Tempering Method |
|---|---|---|---|---|
| 1 2 3 | 900 °C × 1 h 1000 °C × 1 h 1100 °C × 1 h | oil quenched oil quenched oil quenched | 180 °C × 2 h 180 °C × 2 h 180 °C × 2 h | water quenched water quenched water quenched |
Table 3.
Detail result of test date steel.
| Samples Label | 900 °C | 1000 °C | 1100 °C | ||
|---|---|---|---|---|---|
| 1 2 3 4 5 6 7 8 9 | 103,400 137,800 209,300 274,300 477,000 487,500 536,900 543,400 1,742,000 | 245,100 367,300 572,000 637,500 707,200 731,900 949,000 1,056,800 1,331,200 | 98,600 107,600 209,800 237,800 289,300 497,000 566,200 655,600 832,600 | 0.1 0.2 0.3 0.4 0.5 0.6 0.7 0.8 0.9 | ‒1.34 ‒1.014 ‒0.81 ‒0.654 ‒0.521 ‒0.4 ‒0.282 ‒0.156 0 |
Table 4.
Typical values of the rolling contact fatigue (RCF) life.
| Quenching Temperature | Mean Life/105 | Specified Life/105 | Median Life/105 | Characteristic Life/105 | Weibull Plot Slope |
|---|---|---|---|---|---|
| 900 °C 1000 °C 1100 °C | 5.01 7.33 3.88 | 1.96 2.11 1.90 | 2.26 2.28 2.16 | 2.32 2.31 2.21 | 1.10115 1.85714 1.24786 |
© 2018 by the authors. Licensee MDPI, Basel, Switzerland. This article is an open access article distributed under the terms and conditions of the Creative Commons Attribution (CC BY) license (http://creativecommons.org/licenses/by/4.0/).
Share and Cite
MDPI and ACS Style
Zhang, Y.; Qu, S.; Lai, F.; Qin, H.; Huang, L.; Li, X. Effect of Quenching Temperature on Microstructure and Rolling Contact Fatigue Behavior of 17Cr2Ni2MoVNb Steel. Metals 2018, 8, 735. https://doi.org/10.3390/met8090735
AMA Style
Zhang Y, Qu S, Lai F, Qin H, Huang L, Li X. Effect of Quenching Temperature on Microstructure and Rolling Contact Fatigue Behavior of 17Cr2Ni2MoVNb Steel. Metals. 2018; 8(9):735. https://doi.org/10.3390/met8090735
Chicago/Turabian StyleZhang, Yalong, Shengguan Qu, Fuqiang Lai, Haidi Qin, Liman Huang, and Xiaoqiang Li. 2018. "Effect of Quenching Temperature on Microstructure and Rolling Contact Fatigue Behavior of 17Cr2Ni2MoVNb Steel" Metals 8, no. 9: 735. https://doi.org/10.3390/met8090735
Note that from the first issue of 2016, this journal uses article numbers instead of page numbers. See further details here.