Influence of Short-Term Heat Treatment on the Mechanical Properties of Al–Mg–Si Profiles

Lehrstuhl für Neue Fertigungstechnologien und Werkstoffe, Bergische Univeristät Wuppertal, 42651 Solingen, Germany
*
Author to whom correspondence should be addressed.
Metals 2018, 8(9), 664; https://doi.org/10.3390/met8090664
Submission received: 16 August 2018
/
Revised: 21 August 2018
/
Accepted: 23 August 2018
/
Published: 24 August 2018
(This article belongs to the Special Issue Selected Papers from the 2nd International Conference on Light Materials LightMAT 2017)
Abstract
:Aluminum profiles—for instance, profiles made of precipitation-hardenable alloys—are increasingly used for decorative details in the automotive industry. Typically, after hot extrusion and at least two to three days of natural aging (NA), the aluminum profiles are artificially aged. A commercial EN AW-6060 alloy of high purity was used for this investigation. Tensile tests were used as the main measurement method. This article focuses on the effect of short-term heat treatment on the point in time at which a significant increase of the ultimate tensile strength (UTS) during NA can be measured. Short-term heat treatment is shown to delay this point in time by almost four days, but it increases the variation of UTS. A heterogeneous temperature profile during short-term heat treatment was identified as one reason for this result. Finally, a strategy for minimizing variations in mechanical properties of artificially-aged aluminum alloys was developed, based on the experimental results of this study.
1. Introduction
Due to their low density, aluminum alloys are often used in the automotive industry. For decorative details, the 5000 series and the 6000 series are suitable [1]. The production includes different steps. After continuous casting and homogenization (about 550 °C) the aluminum is extruded. Because of the temperature of hot extrusion, solution annealing can be carried out during hot extrusion [2]. At this point in the production process, the aluminum profiles have a relatively low strength. However, with precipitation hardening, the strength of Al alloys can be increased up to 700 MPa [1]. In the common method of production, after natural aging (NA) at room temperature, aluminum profiles are heat-treated. During artificial aging (AA), the mechanical properties are changed and stabilized [3]. This is important, as roof racks, for example, must provide a high strength and a brilliant surface without any scratches. However, variations in mechanical properties impair post-processing of the final geometry.
To stabilize the microstructure prior to AA, the point in time, at which a significant increase of UTS can be measured, should be delayed. Si clusters (concentrations of silicon atoms) are known to be formed immediately after hot extrusion [4], followed by the formation of Mg clusters (concentrations of magnesium atoms) [5]. Within a few days, the Mg clusters dissolve and Si clusters accumulate with Mg (co-clusters). In Al–Mg–Si alloys, vacancies are also responsible for the stability in the formation of co-clusters [4,5]. Up to their peak aged state during AA, there can be stable GP(II)-zones and a β′′-phase (Mg5Si6) [6]. If the needle-coherent β′′-phase converts into a semi coherent β′-phase (Mg9Si5), the strength decreases [7].
To stabilize the microstructure after hot extrusion, the formation of clusters should be delayed. This requires a temperature at which the formation of GP(II)-zones is possible—for example 150 °C for 5–30 min or 80 °C for several hours right after hot extrusion. The kinetics of formation of the β″-phase of the quenched aluminum then remain [6]. With short-term heat treatment, the curability can be improved [8]. In 1941, Haase [9] carried out a short-term heat treatment (250 °C for 2 min) to reverse NA. In 2018, Madanat [10] realized a short-term heat treatment (250 °C, for 1 s to 5 min) for Al–Mg–Si alloys after two weeks of NA. A subsequent NA was noticed comparable to the first NA after quenching [10]. In contrast to the investigation of Madanat [10], this article is focussed on the effect of short-term heat treatment after different duration of NA and AA.
The second option to delay NA is performing a step-quenching after hot extrusion [11]. For example, holding a temperature of 100 °C for some hours is effective for Al–Mg–Si alloys [12]. Pogatscher [13] realized an interrupting quenching (160 °C for 120 s) to suppress the NA. To minimize production time, in this investigation the first option—a short-term heat treatment—was realized. Usually, aluminum profiles are naturally aged at least one to three days—depending on the chemical composition—before AA. For the alloying system 6060, the minimum duration of NA is three days. During production, AA is carried out in a circulating air oven instead of a continuous furnace. Therefore, aluminum profiles were collected after hot extrusion and then artificially aged at the same time. The duration of NA varies up to several days. Nevertheless, the time of AA is independent of the fluctuating time of NA. The mechanical properties of the profiles have to be comparable to each other. The basic idea is to increase the flexibility during production. For this, the minimal time of NA should be decreased. In this case, AA could be carried out directly after hot extrusion or after a few days of NA without making a difference for the mechanical properties.
The aim of this investigation was to evaluate the influence of a number of parameters on the ultimate tensile strength and its mean variation. Therefore, parameters during heat treatment, such as duration of NA, short-term heat treatment, and AA, were varied. All of the tests were carried out under laboratory conditions.
2. Materials and Methods
The investigated alloying system is EN AW-6060. The permissible contents of the alloying elements are shown in Table 1. The chemical composition of a part of the continuously cast material was measured. Therefore, an optical emission spectrometer (Thermo Fisher Scientific, type ARL 4460, Waltham, MA, USA) was used. By using several measurement points distributed over the cross-section, the influence of segregation could be evaluated. The complete extruded profiles were used for the tensile tests. This experimental procedure is recommended up to a profile thickness of 4 mm [14]. A list of all experiments is shown in Table 2.
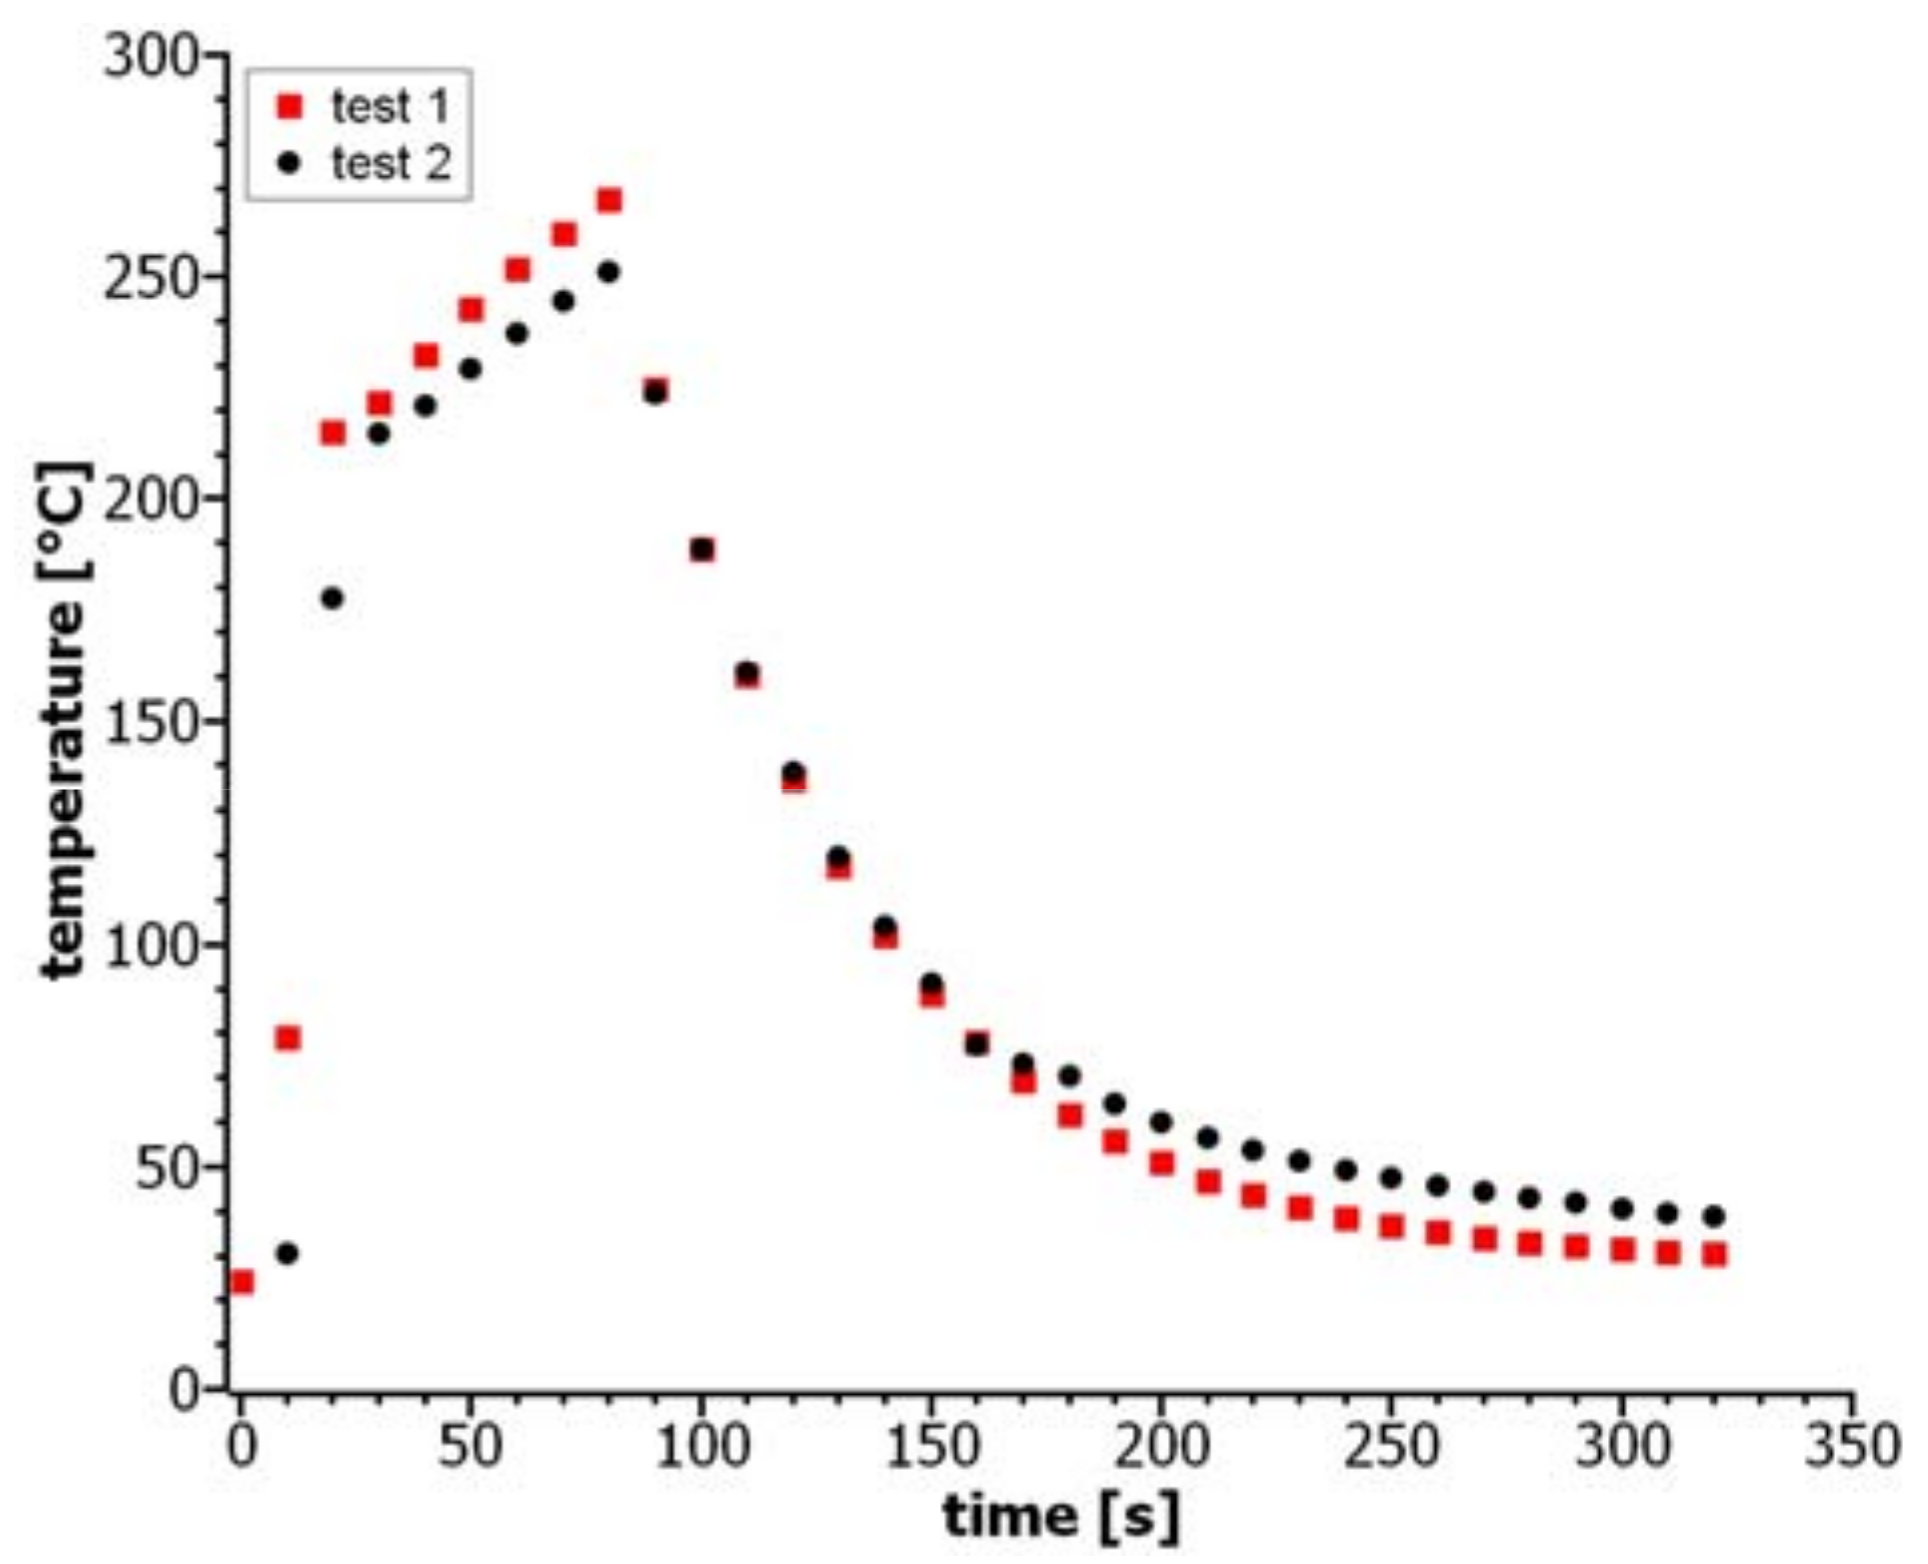
After NA lasting between 4 h and 8 h (22 °C–24 °C), one profile geometry was subjected to short-term heat treatment for nearly 60 s. The chosen time was too short to minimize coherent and incoherent phases that form during longer holding times [10]. For the short-term heat treatment, near-infrared emitters positioned above and below the profile were used. Each of them had a power of 4 kW and was made of quartz. In this study, the short-term heat treatment is called NIR treatment. The temperature during heat treatment was controlled by thermocouples and a data logger (Testo, type 176T4, Lenzkirch, Germany). The degree of accuracy is ±0.5% and the resolution is 0.1 °C. The temperature could be checked every second by visual inspection. A reading was stored in a 10-seconds cycle. Figure 1 illustrates the temperature profile during NIR treatment of two tests with identical boundary conditions. The average temperature of NIR treatment was nearly 230 °C (15 s–75 s). To realize the temperature profile, the power of the near-infrared emitters has been varied. Within the first 15 s, a power of nearly 2.4 kW was used to heat up the profiles. For the next 60 s the power was reduced (1 kW), before the emitters were turned off (Figure 1, 75 s). The cooling was carried out in air. After NIR treatment, the profiles were naturally aged at 20 °C–35 °C (temperature of ambient air). The different temperature during NA is based on temperature fluctuations between day and night in the storage hall. The NIR-treated samples were stored together with samples without NIR treatment for up to 25 days. Tensile tests were done at different points in time during NA (Table 2, No. 1,2). Some of the samples were artificially aged at 140 °C (Table 2, No. 3,4) or at 230 °C (Table 2, No. 5). AA was carried out in a circulating air oven (Nabertherm GmbH, Lilienthal, Germany). The cooling was realized in the oven, with the oven door left open.
After heat treatment, metallographic specimens were cut out of the samples. The embedding was performed at room temperature with epoxy resin (Kulzer GmbH, Hanau, Germany). For polishing, the samples were handled with diamond suspension (particle size: 1 μm, Microdiamant GmbH, Lengwil, Switzerland) and lubricant. Afterwards, a final polishing with a silica suspension (particle size: 0.25 μm, Microdiamant GmbH, Lengwil, Switzerland) was performed. An etching (10 vol % H2SO4, 5 vol % HF) and an optical microscope (DM 2000M, Leica Microsystems GmbH, Wetzlar, Germany) were used to visualize the microstructure. This etching makes secondary precipitates, grain surfaces, and crystal segregations visible [15]. To investigate the microstructure, the software ImageJ (Version 1.48v, Wayne Rasband, Bethesda, MD, USA) was used. After binarizing light microscopic pictures, the surface area of the holes the particles had left was measured.
The metallographic constituents of samples with different heat treatments (casted, extruded, and over-aged) were investigated. Therefore, the samples were polished with a silica suspension (particle size: 0.25 μm, Microdiamant GmbH, Lengwil, Switzerland). They were investigated by means of a scanning electron microscope (SEM) (Vega3SBH, Tescan GmbH, Dortmund, Germany) and an energy dispersive X-ray spectroscope (EDS) (XFlash 5030, Bruker; software Quantax, Billerica, MA, USA). The recommended distance between the pole shoe and the surface of the samples deviated from the used distance. Because of the geometry of the samples, the limit of the settings was reached. The acceleration voltage (10 kV for SEM, 15 kV for EDS) and the beam diameter (68 nm–204 nm) were customized.
To investigate the mechanical properties, tensile tests were done with a tensile test machine (Zwick/Roell, Ulm, Germany) at room temperature. For this, the complete profiles were used. This experimental procedure is recommended up to a profile thickness of 4 mm [14]. The positions of the samples were reproducible. A preload of 10 MPa and a test speed of 0.008 1/s were used.
3. Results
3.1. Variation of Mechanical Properties
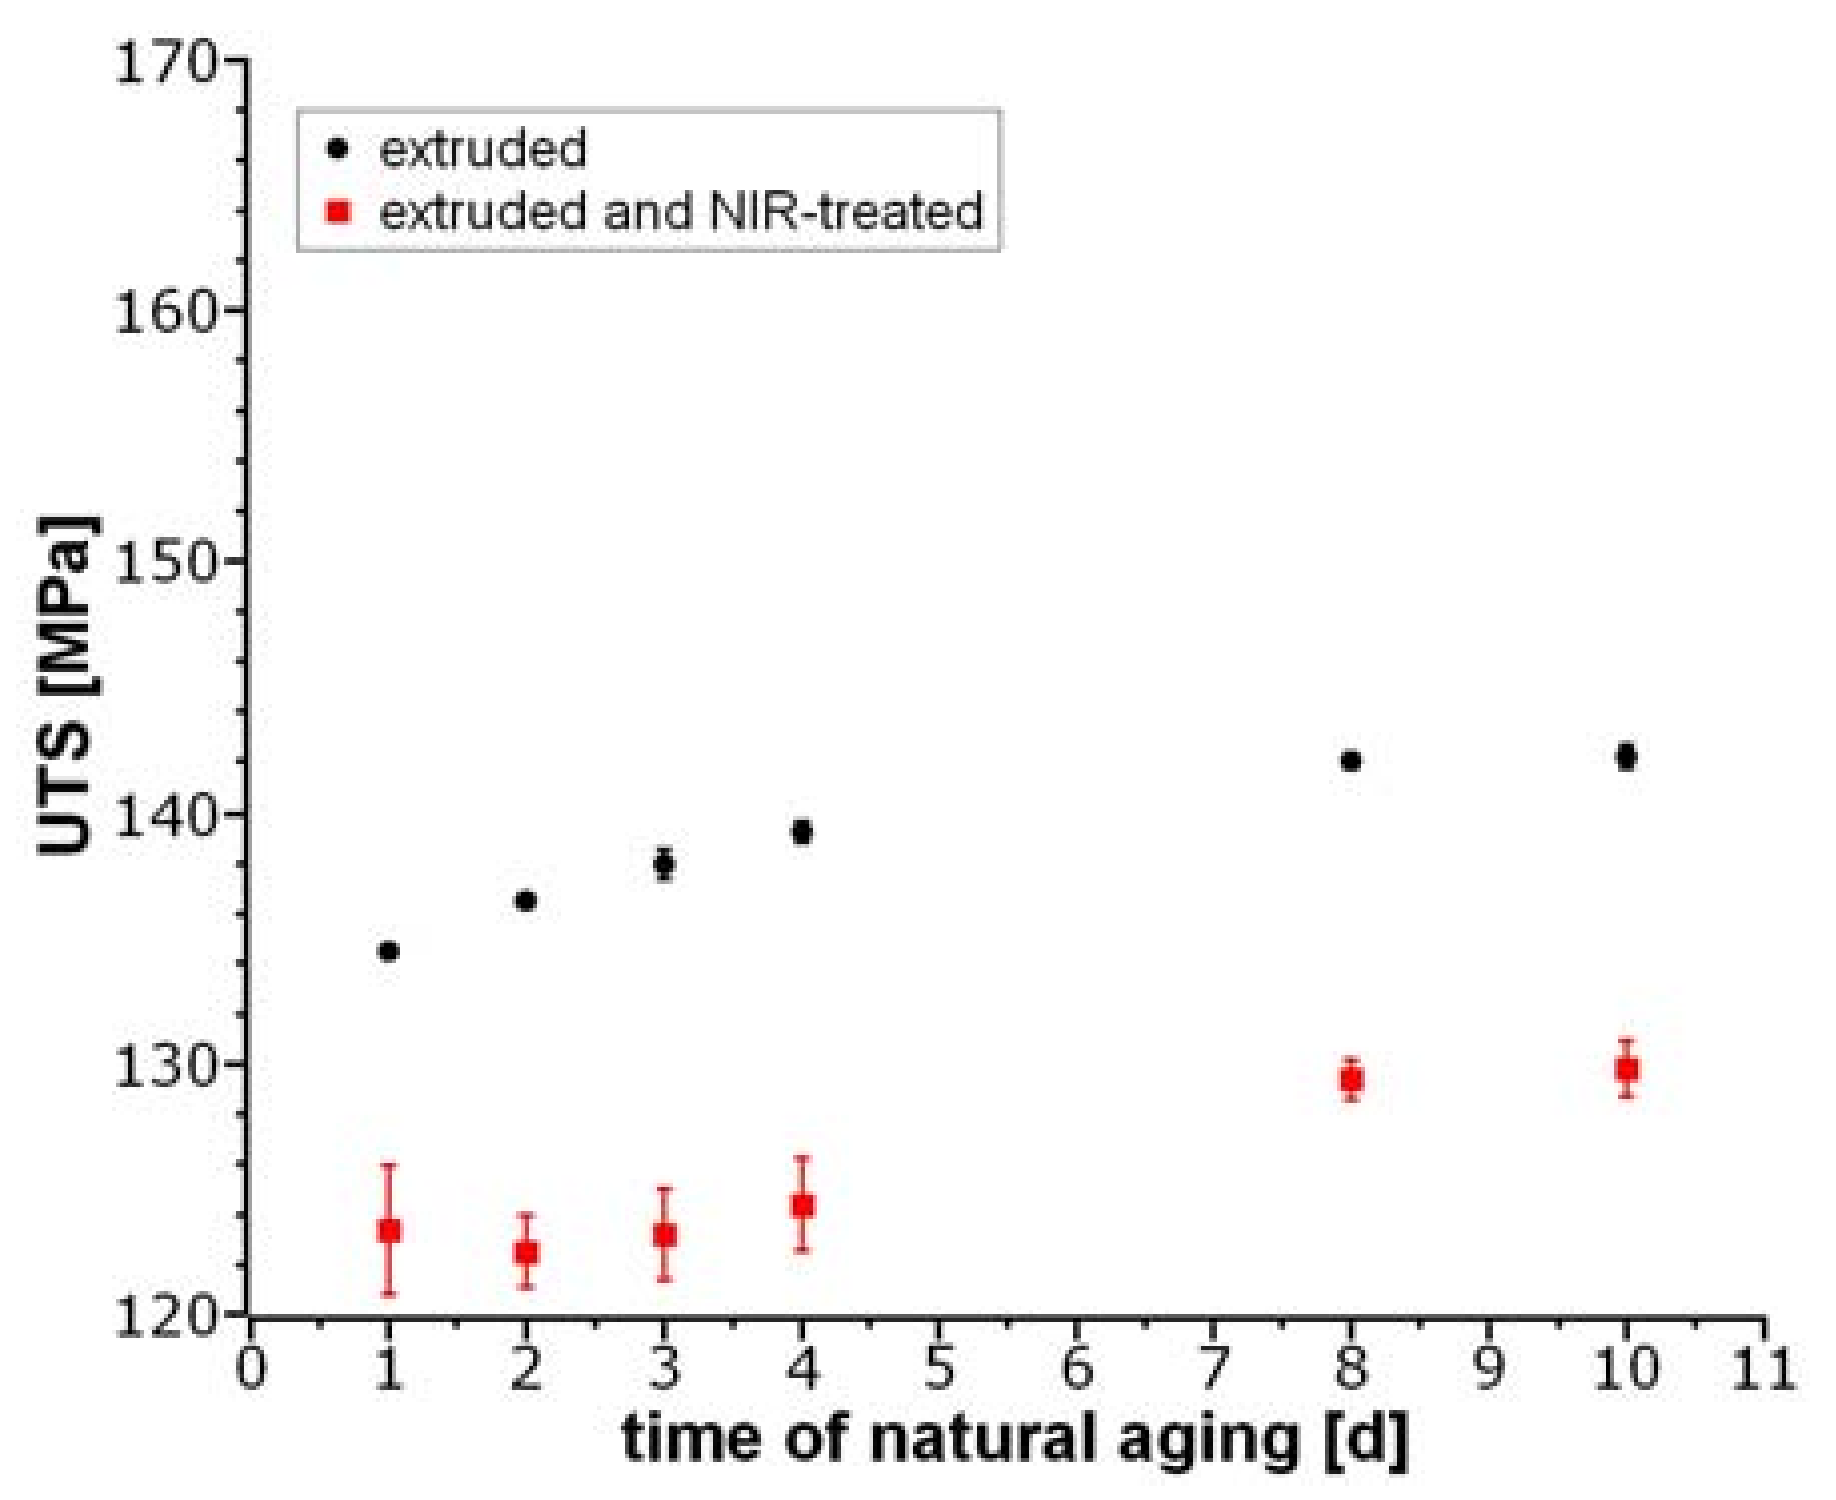
Experiments 1 and 2 (Table 2) amounted to an increasing UTS during NA (Figure 2). The UTS of the NIR-treated samples was at a lower level compared to the other samples (Figure 2). Within the first four days after hot extrusion, the values of UTS of the NIR samples (Table 2, No. 1) remained nearly constant. In the further course of NA, UTS increased. Due to the NIR treatment, the point in time at which the significant increase of UTS was detected shifted by four days [6]. In general, the standard deviation in UTS of the NIR-treated samples (±2.5 MPa) was higher than that of the other samples (±0.3 MPa).
During AA at 140 °C (Table 2, No. 3,4), UTS increases continuously (Figure 3). The under-aged state still exists for up to seven hours of AA. The UTS of the samples without NIR treatment (Table 2, No. 4) ascends by nearly 6 MPa/h. The difference between one day and three days of NA is nearly 3 MPa over the course of AA. In contrast, the UTS of the samples with NIR treatment (Table 2, No. 3) ascends with nearly 8 MPa/h. There was no significant difference between one day and three days of NA for the NIR-treated samples. In general, the UTS of the NIR samples was on a lower level than that of the other samples. The difference between the samples with and without NIR treatment decreased from 11 MPa (0 h AA) to 5 MPa (7 h AA). When AA was carried out at 230 °C (Table 2, No. 5), the whole annealing-curve was measured. The peak aged state was reached between one and three hours of aging.
3.2. Investigation of the Microstructure
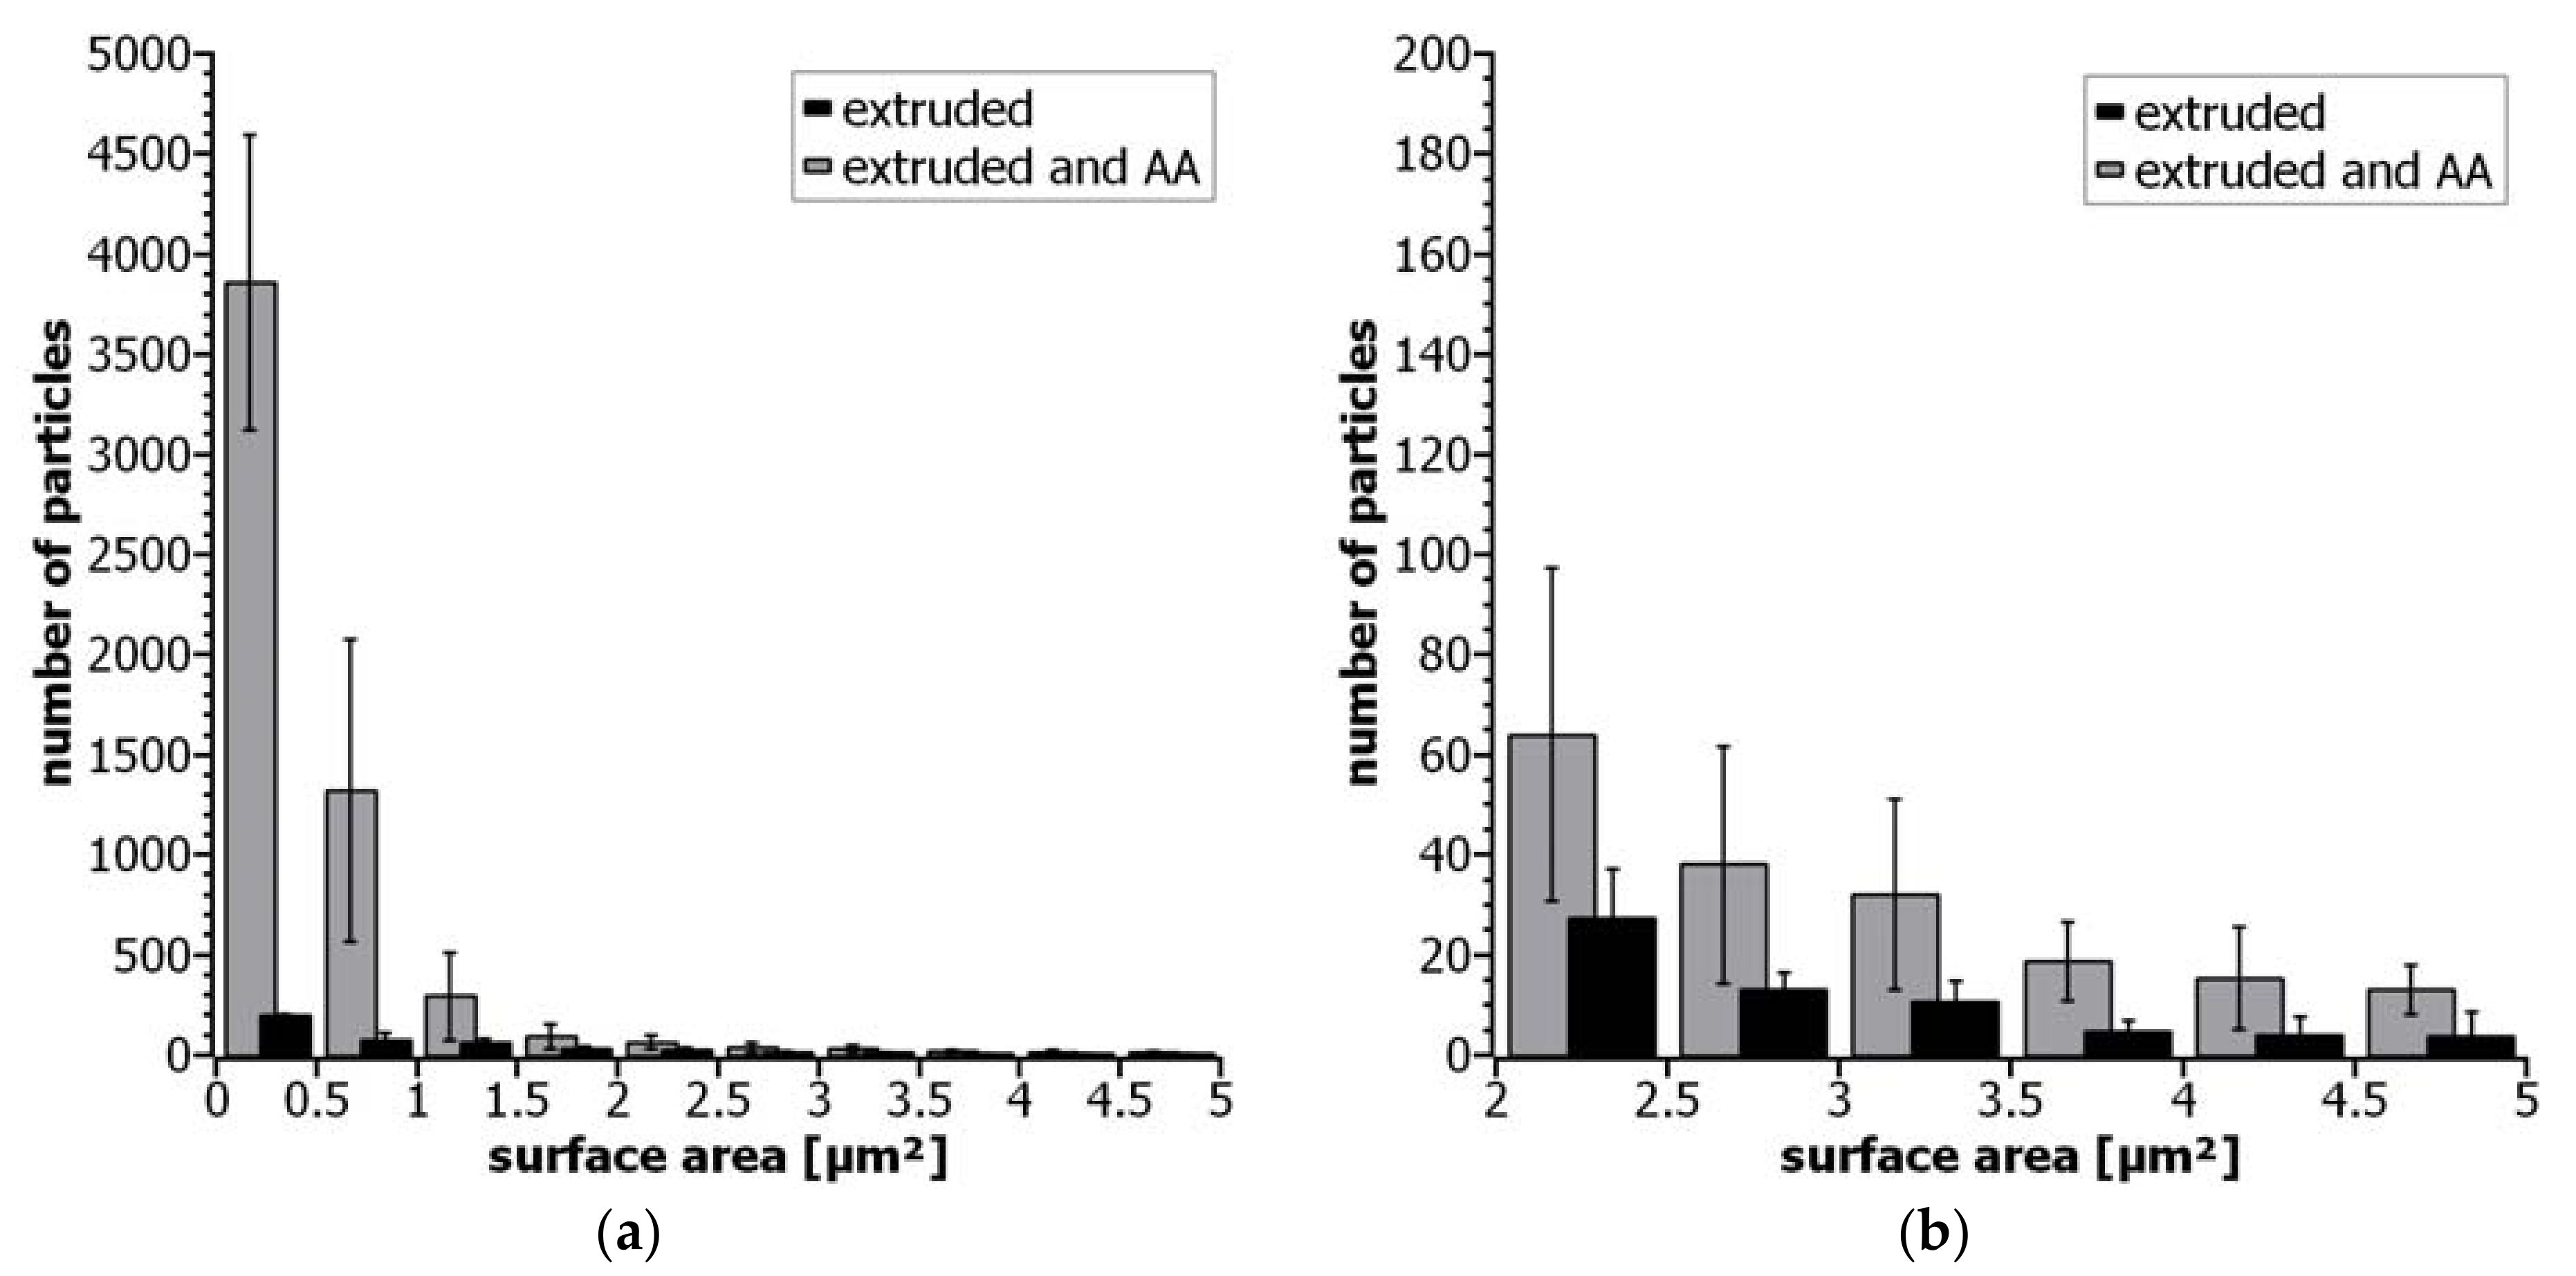
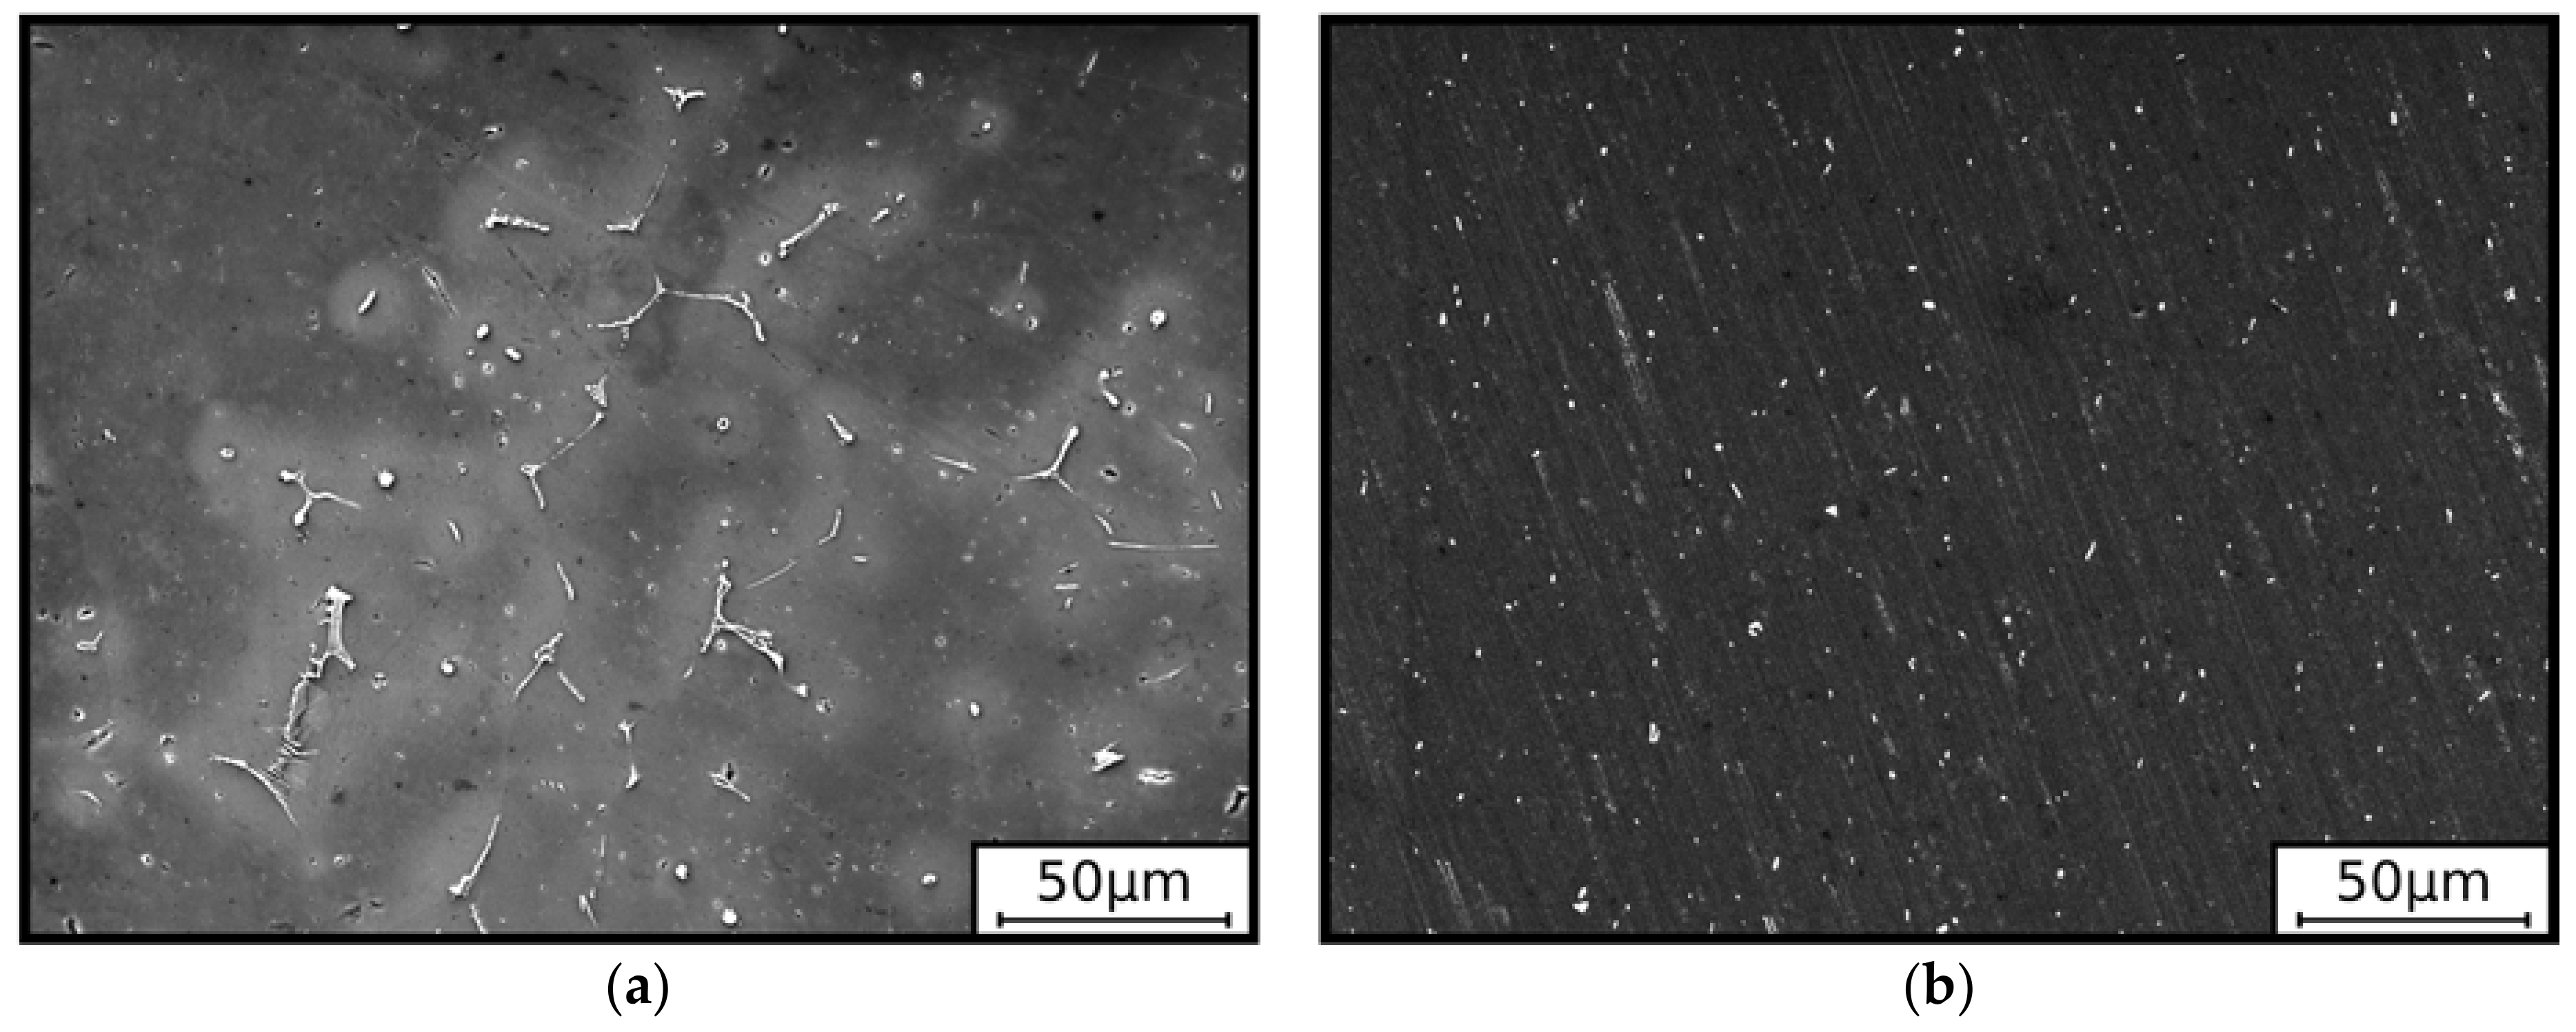
NIR treatment (230 °C, 60 s) probably has an influence on mechanical properties. Ostermann [6] suggests a short-term heat treatment for up to several hours. To compare the influence of a longer heat treatment at the same temperature, the situation after hot extrusion, the peak aged state (230 °C, 3 h), and the over-aged state (230 °C, 10 h) will be considered more closely. Figure 4 shows two light microscopic pictures of two heat treatment conditions (extruded and peak aged). By etching the samples, the appearance of the microstructure is influenced. The dark spots on Figure 4 are not precipitates—they represent the empty spaces that have left the precipitates. In addition to the situation after hot extrusion (Figure 4a), dispersed artefacts are present after AA (Figure 4b). The results of the analysis of the artefacts are shown in Figure 5. The number of small artefacts (surface area < 1.5 µm2) after AA is many times higher than after hot extrusion.
The metallographic constituents were investigated using EDS analysis. In Figure 6, an overview of the as-cast and over-aged states is visible. Figure 6a (as-cast state) shows a picture with netlike precipitates. The irregularly distributed precipitates have a size up to 50 µm. The lighter areas around the precipitates contain 0.3 wt % more Mg and Si than the matrix. EDS analysis was carried out at different positions—for example, at the marked points in Figure 7. The results are shown in Table 3. In the analyzed points, mainly Al, Fe, and Si are included. The Mg content of the artefacts was less than 1 wt %. The Si content (3.44–7.3 wt %) and the Fe content (19.4–19.8 wt %) fluctuate in the as-cast state. After AA for 10 h at 230 °C there are no more netlike precipitates (Figure 6b). In contrast to the as-cast state, there are globular and acicular artefacts with a size up to 1 µm. The Si content (5.3–6.8 wt %) and the Fe content (20.7–30.6 wt %) of the artefacts fluctuate in the over-aged state.
4. Discussion
During NA, the UTS increases continuously with time, reaching a plateau after about 10 days (Figure 2). The formed co-clusters and coherent GP(I) zones are responsible for the increase in strength during NA [6]. The reason for the lower level of the NIR-treated samples (Figure 2) is the reduction in the number of clusters during NIR treatment [6]. If the holding time of NIR treatment were extended, coherent and later incoherent precipitates will be formed, like Madanat noticed at 250 °C [10].
The mean variation of the UTS of the NIR-treated samples during NA (Figure 2) is higher than of the other samples. There can be various reasons for this. On the one hand, the time of NA before NIR treatment fluctuates between 4 h and 8 h. Consequently, the number of clusters and co-clusters differs before NIR treatment [4,5]. To prove this, investigations by means of transmission electron microscopy (TEM) are necessary. Furthermore, temperature fluctuations occur during NIR treatment (Figure 1). The thermal conductivity of a naturally aged 6060 alloy amounts to 183 W/m °C–191 W/m °C [1]. Hence, the temperature distribution in the profile is not 100% homogeneous.
In nearly peak aged state, dispersed particles are present (Figure 4b). The results of analyzing the light microscopic pictures are to be classified as a rough estimate. The reason for this is the deviation of the analyzed holes from the particles. By etching, the particles were taken out of the matrix. To analyze the particles instead of the holes, another etching is necessary. The particles should stay in the matrix. Therefore an etching containing potassium permanganate, according to Weck [17], is suitable. This etching does not affect precipitates and intermetallic phases [18].
In the as-cast state of Al–Fe–Si alloys, Al5FeSi is an angular primary crystal [19]. The geometry of Al–Fe–Si phases could be influenced by homogenization at high temperatures from netlike to globular, resulting in a globular appearance [20]. Therefore, after hot extrusion, an acicular geometry for Al5FeSi is possible [16]. The resulting phases after casting, like Al5FeSi, are well-known and investigated by several authors [21,22,23]. The process of precipitation and the hardening phases during NA and AA have been investigated by Mondolfo [24] and other authors [25,26,27,28,29]. To analyze the different phases in detail, using another etching and a TEM is irreplaceable for further investigations.
5. Conclusions
The standard deviation of the UTS of the laboratory tests for common heat treatment is very low. A delay in NA of about four days when using the short-term heat treatment was detected. Profiles of different times of NA (1 d and 3 d) could be artificially aged simultaneously without a significant variation in UTS. Therefore, the minimal duration of NA (3 d) could be decreased to one day. This result can be used to shorten storage and production times and to be more flexible. Profiles with NA between one and three days could be artificially aged at the same time without reaching a significant difference in UTS. Without short-term heat treatment, this was not possible without being out of tolerance. The influence of NIR treatment on other properties has not been investigated. After AA the profiles get their final geometry by bending. Hence, for further investigations the fracture toughness and the formability would be the most interesting mechanical properties. If the following production steps can be performed without problems, short-term heat treatment can be included into production. Therefore, the infrastructure after hot extrusion has to be adjusted.
In order to reduce the higher fluctuation of the mechanical properties, the following procedure is recommended: The duration of NA between hot extrusion and NIR treatment should be as short as possible and constant. Furthermore, it is recommended to realize a reproducible temperature and duration of the NIR treatment.
Author Contributions
S.K. designed and performed the experiments and wrote this manuscript. S.W. supervised the investigations, participated in the discussion of the results, and guided the writing of the article.
Funding
This research received no external funding.
Acknowledgments
The authors gratefully acknowledge the help of the supporting company for technical advice, and for providing the infrastructure for the mechanical tests.
Conflicts of Interest
The authors declare no conflict of interest.
References
- Granta Design. CES Selector 2017, version 17.2.0; Granta Design: Cambridge, UK, 2017. [Google Scholar]
- Bauser, M.; Sauer, G. Strangpressen, 2nd ed.; Aluminium-Verlag: Düsseldorf, Germany, 2001; ISBN 978-3-410-22181-4. [Google Scholar]
- Altenpohl, D.G. Aluminium und Aluminiumlegierungen; Springer: Düsseldorf, Germany, 1965; ISBN 978-3-662-30245-3. [Google Scholar]
- Banhart, J.; Chang, C.S.T.; Liang, Z.; Wanderka, N.; Lay, M.D.H.; Hill, A.J. Natural aging in Al–Mg–Si alloys—A process of unexpected complexity. Adv. Eng. Mater. 2010, 12, 559–571. [Google Scholar] [CrossRef]
- Buha, J.; Munroe, P.R.; Lumley, R.N.; Crosky, A.G.; Hill, A.J. Positron Studies of Precipitation in 6061 Aluminium Alloy. Mater. Sci. Forum. 2004, 28, 1028–1033. [Google Scholar]
- Ostermann, F. Anwendungstechnologie Aluminium, 3rd ed.; Springer: Berlin/Heidelberg, Germany, 2014; ISBN 978-3-662-43806-0. [Google Scholar]
- Vissers, R.; van Huis, M.A.; Jansen, J.; Zandbergen, H.W.; Marioara, C.D.; Andersen, S.J. The crystal structure of the β′phase in Al–Mg–Si alloys. Acta Mater. 2007, 55, 3815–3823. [Google Scholar] [CrossRef]
- Suzuki, H.; Kanno, M.; Itoh, G. A consideration of the two-step aging process in an Al–Mg–Si alloy. Aluminium 1981, 57, 628–629. [Google Scholar]
- Haase, C.; Wurst, H. Zur Frage der Kalt- und Warmaushärtung bei Aluminium-Magnesium-Silizium-Legierungen. Z. Metallkunde 1941, 33, 399–403. [Google Scholar]
- Madanat, M.; Liu, M.; Banhart, J. Reversion of natural ageing in Al–Mg–Si alloys. Acta. Mater. 2018. [Google Scholar] [CrossRef]
- Gupta, A.K.; Lloyd, D.J. Quench path sensitivity of super purity Al-0.8%Mg2Si alloys with and without excess silicon. ICAA 8. Mater. Sci. Forum. 2002, 396–402, 971–976. [Google Scholar] [CrossRef]
- Yamada, K.; Sato, T. Role of quenched-in excess vacancies in two-step aging behavior of Al–Mg–Si alloys. J. Jpn. Inst. Met. 2001, 65, 897–902. [Google Scholar] [CrossRef]
- Pogatscher, S.; Kozeschnik, E.; Antrekowitsch, H.; Werinos, M.; Gerstl, S.S.A.; Löffler, J.F.; Uggowitzer, P.J. Process-controlled suppression of natural aging in an Al–Mg–Si alloy. Scr. Mater. 2014, 89, 53–56. [Google Scholar] [CrossRef]
- DIN EN ISO 6892-1. Metallische Werkstoffe—Zugversuch—Teil 1: Prüfverfahren bei Raumtemperatur; Deutsches Institut für Normung: Berlin, Germany, 2009. [Google Scholar]
- Berglund, T.; Meyer, A. Handbuch der Metallographischen Schleif-, Polier- und Ätzverfahren; Springer: Berlin, Germany, 1940; ISBN 978-3-642-47370-8. [Google Scholar]
- Kernebeck, S. Analyse der Festigkeitsstreuung von Profilen aus AlMgSi-Legierungen. Master’s Thesis, Bergische Universität Wuppertal, Wuppertal, Germany, September 2017. [Google Scholar]
- Weck, E.; Leistner, E. Metallographische Anleitung zum Farbätzen nach dem Tauchverfahren; Teil III, Fachbuchreihe Schweißtechnik; DVS: Düsseldorf, Germany, 1986. [Google Scholar]
- Zwieg, T. Universelle Methodik für die randscharf mechanische Präparation und das Farbätzen von Aluminiumlegierungen. Praktische Metallographie 2001, 2, 3–6. [Google Scholar]
- Pratt, J.N.; Raynor, G.V. The Intermetallic Compounds in the Alloys of Aluminium and Silicon with Chromium, Manganese, Iron, Cobalt, and Nickel. J. Inst. Met. 1951, 79, 211–232. [Google Scholar]
- Donas, A.L.; Pedersen, K.; Lohne, O.; Pettersen, T.; Bigot, A. Particle breakup during extrusion. Aluminium 2004, 80, 640–642. [Google Scholar]
- Gao, T.; Hu, K.; Wang, L.; Zhang, B.; Liu, X. Morphological evolution and strengthening behavior of α-Al(Fe,Mn)Si in Al–6Si–2Fe–xMn alloys. Res. Phys. 2017, 7, 1051–1054. [Google Scholar] [CrossRef]
- Zhang, Z.; Tezuka, H.; Kobayashi, E.; Sato, T. Effects of the Mn/Fe Ratio and Cooling Rate on the Modification of Fe Intermetallic Compounds in Cast A356 Based Alloy with Different Fe Contents. Mater. Trans. 2013, 54, 1484–1490. [Google Scholar] [CrossRef] [Green Version]
- Ji, S.; Yang, W.; Gao, F.; Watson, D.; Fan, Z. Effect of iron on the microstructure and mechanical property of Al–Mg–Si–Mn and Al–Mg–Si diecast alloys. Mater. Sci. Eng. A 2013, 564, 130–139. [Google Scholar] [CrossRef]
- Mondolfo, L.F. Aluminium Alloys: Structure and Properties; Butterworth-Heinemann: London, UK, 1976; ISBN 0-408-70680-5. [Google Scholar]
- Sunde, J.K.; Marioara, C.D.; van Helvoort, A.T.; Holmestad, R. The evolution of precipitate crystal structures in an Al–Mg–Si(–Cu) alloy studied by a combined HAADF-STEM and SPED approach. Mater. Charact. 2018, 142, 458–469. [Google Scholar] [CrossRef]
- Ding, L.; Jia, Z.; Nie, J.; Weng, Y.; Cao, L.; Chen, H.; Wu, X.; Liu, Q. The structural and compositional evolution of precipitates in Al–Mg–Si–Cu alloy. Acta Mater. 2018, 145, 437–450. [Google Scholar] [CrossRef]
- Buchanan, K.; Colas, K.; Ribis, J.; Lopez, A.; Garnier, J. Analysis of the metastable precipitates in peak-hardness aged Al–Mg–Si(–Cu) alloys with differing Si contents. Acta Mater. 2017, 132, 209–221. [Google Scholar] [CrossRef]
- Fallah, V.; Langelier, B.; Ofori-Opoku, N.; Raeisinia, B.; Provatas, N.; Esmaeili, S. Cluster evolution mechanisms during aging in Al–Mg–Si alloys. Acta Mater. 2016, 103, 290–300. [Google Scholar] [CrossRef]
- Liu, C.H.; Lai, Y.X.; Chen, J.H.; Tao, G.H.; Liu, L.M.; Ma, P.P.; Wu, C.L. Natural-aging-induced reversal of the precipitation pathways in an Al–Mg–Si alloy. Scr. Mater. 2016, 115, 150–154. [Google Scholar] [CrossRef]
Figure 1.
Temperature profiles of NIR treatment for two tests with the same boundary conditions. Adapted from [16], with permission of Kernebeck, 2017.
Figure 1.
Temperature profiles of NIR treatment for two tests with the same boundary conditions. Adapted from [16], with permission of Kernebeck, 2017.

Figure 2.
Ultimate tensile strength (UTS) depending on the time of NA after hot extrusion (Table 2, No. 2) and after hot extrusion with additional NIR treatment (Table 2, No. 1). Adapted from [16], with permission of Kernebeck, 2017.

Figure 3.
Ultimate tensile strength (UTS) depending on the time of AA at 140 °C: (a) after 1 d NA, and (b) after 3 d NA. Adapted from [16], with permission of Kernebeck, 2017.
Figure 3.
Ultimate tensile strength (UTS) depending on the time of AA at 140 °C: (a) after 1 d NA, and (b) after 3 d NA. Adapted from [16], with permission of Kernebeck, 2017.

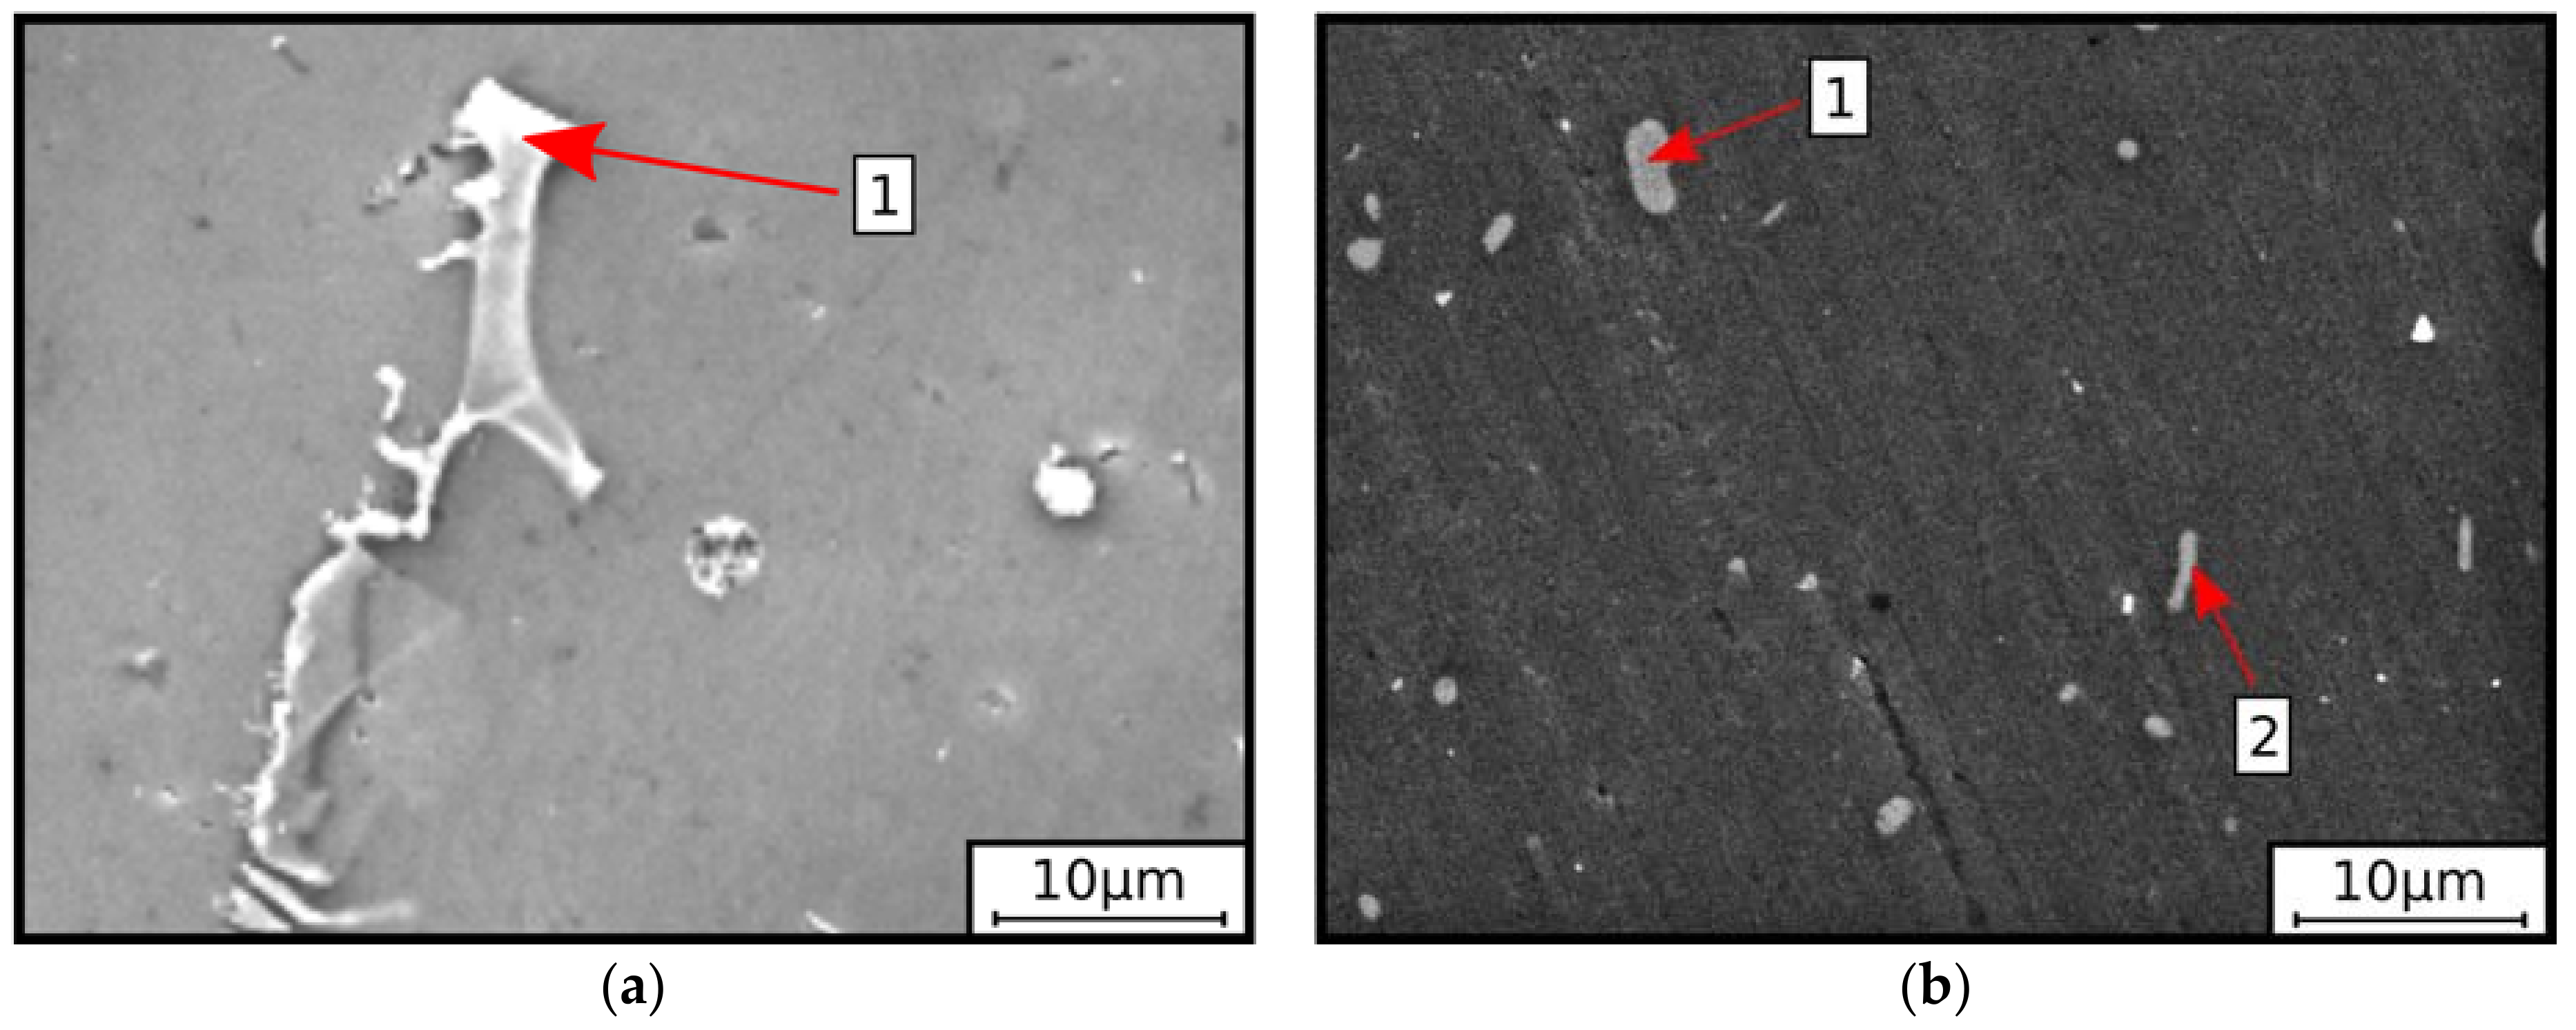
Figure 4.
Light microscopic pictures with (1) acicular artefacts, (2) globular artefacts, (3) grain boundaries, (4) and small artefacts: (a) after hot extrusion, and (b) after AA for 3 h at 230 °C. Reproduced from [16], with permission of Kernebeck, 2017.
Figure 4.
Light microscopic pictures with (1) acicular artefacts, (2) globular artefacts, (3) grain boundaries, (4) and small artefacts: (a) after hot extrusion, and (b) after AA for 3 h at 230 °C. Reproduced from [16], with permission of Kernebeck, 2017.

Figure 5.
Distribution of the surface area of artefacts. The number of particles refers to three different light microscopic pictures, as seen in Figure 4 after hot extrusion and after artificial aging for 3 h at 230 °C. Particles are the sum up to intervals of 0.5 µm2: (a) entire surface area, and (b) surface area between 2 and 5 µm2. Adapted from [16], with permission of Kernebeck, 2017.

Figure 6.
Pictures of SEM analysis (a) after casting, and (b) after casting and AA (230 °C for 10 h).
Figure 6.
Pictures of SEM analysis (a) after casting, and (b) after casting and AA (230 °C for 10 h).

Figure 7.
Pictures of EDS analysis with marked points of analyzed positions (a) after casting, and (b) after casting and AA (230 °C for 10 h). Adapted from [16], with permission of Kernebeck, 2017.
Figure 7.
Pictures of EDS analysis with marked points of analyzed positions (a) after casting, and (b) after casting and AA (230 °C for 10 h). Adapted from [16], with permission of Kernebeck, 2017.


Table 1.
Limits of EN AW-6060 in wt %. Adapted from [1], with permission from Granta Design, 2017.
Table 1.
Limits of EN AW-6060 in wt %. Adapted from [1], with permission from Granta Design, 2017.
| Alloying Element | Content |
|---|---|
| Si | 0.3–0.5 |
| Fe | 0.1–0.3 |
| Cu | Max. 0.1 |
| Mn | Max. 0.1 |
| Mg | 0.35–0.6 |
| Cr | Max. 0.05 |
| Zn | Max. 0.15 |
| Ti | Max. 0.1 |
| other | Max. 0.15 |
| Al | Bal. |
Table 2.
Set of experiments with short-term heat treatment (NIR), natural aging (NA), and artificial aging (AA).
Table 2.
Set of experiments with short-term heat treatment (NIR), natural aging (NA), and artificial aging (AA).
| No. | NIR | NA | AA |
|---|---|---|---|
| 1 | 60 s | up to 10 d | - |
| 2 | - | up to 10 d | - |
| 3 | 60 s | 1 d, 3 d | 140 °C, up to 7 h |
| 4 | - | 1 d, 3 d | 140 °C, up to 7 h |
| 5 | - | 4d, 25 d | 230 °C, up to 10 h |
Table 3.
Results of the EDS analysis with the main elements in wt %. Adapted from [16], with permission of Kernebeck, 2017.
© 2018 by the authors. Licensee MDPI, Basel, Switzerland. This article is an open access article distributed under the terms and conditions of the Creative Commons Attribution (CC BY) license (http://creativecommons.org/licenses/by/4.0/).
Share and Cite
MDPI and ACS Style
Kernebeck, S.; Weber, S. Influence of Short-Term Heat Treatment on the Mechanical Properties of Al–Mg–Si Profiles. Metals 2018, 8, 664. https://doi.org/10.3390/met8090664
AMA Style
Kernebeck S, Weber S. Influence of Short-Term Heat Treatment on the Mechanical Properties of Al–Mg–Si Profiles. Metals. 2018; 8(9):664. https://doi.org/10.3390/met8090664
Chicago/Turabian StyleKernebeck, Sandra, and Sebastian Weber. 2018. "Influence of Short-Term Heat Treatment on the Mechanical Properties of Al–Mg–Si Profiles" Metals 8, no. 9: 664. https://doi.org/10.3390/met8090664
Note that from the first issue of 2016, this journal uses article numbers instead of page numbers. See further details here.