Article

Interfacial Characterization and Bonding Properties of Copper/Aluminum Clad Sheets Processed by Horizontal Twin-Roll Casting, Multi-Pass Rolling, and Annealing

1
School of Physical Engineering, Zhengzhou University, Zhengzhou 450001, China
2
School of Material Science and Engineering, Henan University of Science and Technology, Luoyang 471003, China
3
Collaborative Innovation Center of Nonferrous Metals, Henan University of Science and Technology, Luoyang 471003, China
*
Author to whom correspondence should be addressed.
Metals 2018, 8(8), 645; https://doi.org/10.3390/met8080645
Submission received: 27 July 2018 / Revised: 9 August 2018 / Accepted: 14 August 2018 / Published: 16 August 2018

Abstract

:
The copper/aluminum (Cu/Al) clad sheets were produced on a horizontal twin-roll caster and then were multi-pass rolled and annealed. The thickness of the as-cast clad sheet was 8 mm. Rolling was performed with total reductions of 12.5%, 25%, 37.5%, 50%, and 62.5%, separately. The effects of the rolling and annealing processes on the interface and peel strength of the Cu/Al clad sheets were investigated. The evolution of the interface and crack propagation were studied. The interface thickness of the as-cast clad sheet reached 9 μm to 10 μm. The average peel strength (APS) was only 9 N/mm. After multi-pass rolling, the peel strength first slightly increased and then gradually decreased with the increase of the rolling pass number. After annealing, the peel strength remarkably improved. The APS reached 25 N/mm when the rolled thickness was 7 mm. The improvement in the peel strength was due to the following three factors: (1) mechanical locking formed in the Cu/Al direct contact region after rolling, (2) the region of the Al matrix fracture, and (3) mechanical biting from the Cu/Al direct contact region.

Graphical Abstract

1. Introduction

The copper/aluminum (Cu/Al) clad sheet can use a larger proportion of aluminum (Al) instead of copper (Cu), which not only reduces the total material cost but also has good electrical and thermal conductivity. It is more widely applied to the fields of building, electric-power, and chemical industries [1,2,3].
Many techniques have been developed to fabricate clad metals and they include rolling bonding [4], explosive cladding [5], cast cladding [6], friction-stir welding [7], and twin-roll casting (TRC). Compared with conventional techniques, TRC has the advantages of shorter production routines, lower capital investment, and low production cost [8]. TRC is becoming one of the most promising technologies to produce clad sheets. Many kinds of clad sheets have been fabricated by TRC including clad sheets made from magnesium/aluminum [9], steel/aluminum [10], and copper/aluminum [11]. TRC is based on the metallurgical bonding of the clad sheet. Its interface structure has many advantages such as simple structure, low impurity content, and strong bonding with metal. The interface of Cu/Al clad sheet produced by horizontal twin-roll casting (H-TRC) has an intermetallic compound (IMC) layer. The thickness and type of IMC layer have great influence on the bonding strength of the clad sheet [12,13]. At present, the Cu/Al clad sheet produced by H-TRC in our pilot-scale experiment has a thicker IMC layer and a lower bonding strength, which is unable to satisfy the application requirements. For the clad sheet, it has been reported that post-processing can improve the bond strength by changing the interfacial microstructure in which rolling and annealing are the most common. The rolling can lead to the crack of a hardened layer of the interface. The metal was extruded to the crack of the hardened layer to form a mechanical locking force, which improves the bonding strength [13]. Through multi-pass rolling, the local bonding and embedment between the two metals can be realized, which also can improve the bonding strength to a certain extent [14]. For the clad sheet produced by rolling bonding, two metals are extruded and embedded with each other. When the rolling reduction exceeded a threshold, the mechanical biting force can form. However, there are still many gaps and impurities at the interface. The form of this combination is not strong. The metallurgical bonding can be achieved through the relative low temperature and short time annealing treatment to improve the bonding strength [4,15,16]. The microcracks in the interface can be repaired by annealing in order to improve the bonding strength of the clad sheet [17]. For the clad sheet produced by TRC, some cracks and holes can form at the interface after the further rolling process. Therefore, annealing treatment is needed to improve the interfacial microstructure. Meanwhile annealing is an important process for the clad sheet, which can improve the processing performance and application performance of the products.
However, studies of the multi-pass rolling and annealing processes of Cu/Al clad sheets produced by TRC are rare. For Cu/Al clad sheets, the interfacial evolution and strengthening mechanism associated with rolling and annealing need to be systematically and comprehensively studied. In this paper, the Cu/Al clad sheets were produced on a horizontal twin-roll caster and then were multi-pass rolled and annealed. The interface and peel strength of the Cu/Al clad sheets were investigated. The evolution of the interface and crack propagation were studied. Through this study, we hope to find the best processing technology to improve the bonding strength of the Cu/Al clad sheet. Meanwhile, we expect to reveal the interfacial evolutionary patterns and strengthening mechanism of the clad sheet with a hard layer during rolling and annealing processes. This study plays a guiding role in further processes involving clad sheets.

2. Materials and Methods

Figure 1 is a schematic illustration of the fabrication process for Cu/Al clad sheets. The Cu/Al clad sheets were produced by H-TRC. The roll diameter of the horizontal twin-roll caster is 490 mm. The thicknesses of the cast sheets can vary between 6 mm and 20 mm and the width of the strip range is 200 mm to 800 mm. In this experiment, the liquid Al (1060) was poured into the sluice when the temperature decreased to 710 °C. Afterward, the liquid Al was fed through a nozzle to a region between rotating rolls. The Cu strip (T2) was inserted in between the melt stream and the roll. Heat was transferred from the molten metal to the clad/roll interface and the melt solidification occurred, which resulted in a Cu/Al clad sheets with a total thickness of 8 mm (Cu: 1 mm) at the exit of the TRC process. The casting speed was 0.8 m/min.
After the H-TRC process, an as-cast Cu/Al clad sheet was cut into pieces for multi-pass rolling and annealing. The multi-pass rolling was performed on a two-roll mill (Φ180 × 300, Wuxi Guanjie Metal Technology Co., Ltd., Wuxi, Jiangsu, China) with a roll diameter of 180 mm. The clad sheets were rolled to a thickness of 3 mm to 7 mm. The rolling pass number, reduction per pass, and clad sheet thickness are shown in Table 1. After rolling, the clad sheets were annealed in a resistance furnace (SRJX-4-9, Tianjin Xingshui Scientific Instrument Co., Ltd., Tianjin, China). The annealing temperature was 350 °C and the annealing time was 2 h.
A metallographic study was conducted using polished samples that were collected in the middle of the clad sheets along the rolling direction. The interface morphologies were observed using an optical microscope (ZEISS Axio Vert.A1, Carl ZEISS Inc., Jena, Thuringia, Germany) and a scanning electron microscope (JSM-5610LV SEM, JEOL Ltd., Tokyo, Japan). The chemical compositions of the intermetallic compounds were analyzed using an energy dispersive spectrometer (EDS EDAX Inc., Draper, UT, USA) and X-ray diffraction (D8 ADVANCE XRD, Bruker Inc., Massachusetts, MA, USA). To test the bonding strength, a T-type peeling test was performed on a universal testing machine (SHIMADZU AG-I250KN, Shimadzu Corp., Tokyo, Japan), according to ASTM D1876-08. The test specimens were cut in the middle of the clad sheet with the size of 310 × 25 × (3–8) (length × width × thickness, mm). The length of the specimen was parallel to the rolling direction. Then the specimens were separated by about 72 mm along the interfacial line using the wire cut electrical discharge machining. Then, two separated parts of Cu and Al were bent at an angle of 90° so that they would be parallel to each other. The size of the test specimen and method of peel testing are shown in Figure 2. The tensile speed was 10 mm/min. After the peel force curve was obtained, the invalid parts are removed, according to the standard. The average peel force was obtained using statistics. The peel strength was taken as the average peel force divided by the width (25 mm) of the test specimen. Five specimens were tested for each kind of clad sheet. The average peel strength (APS) was calculated from the average of the five results. After peel testing, the microscopic morphology of the peeling surface was studied with SEM.

3. Results and Discussion

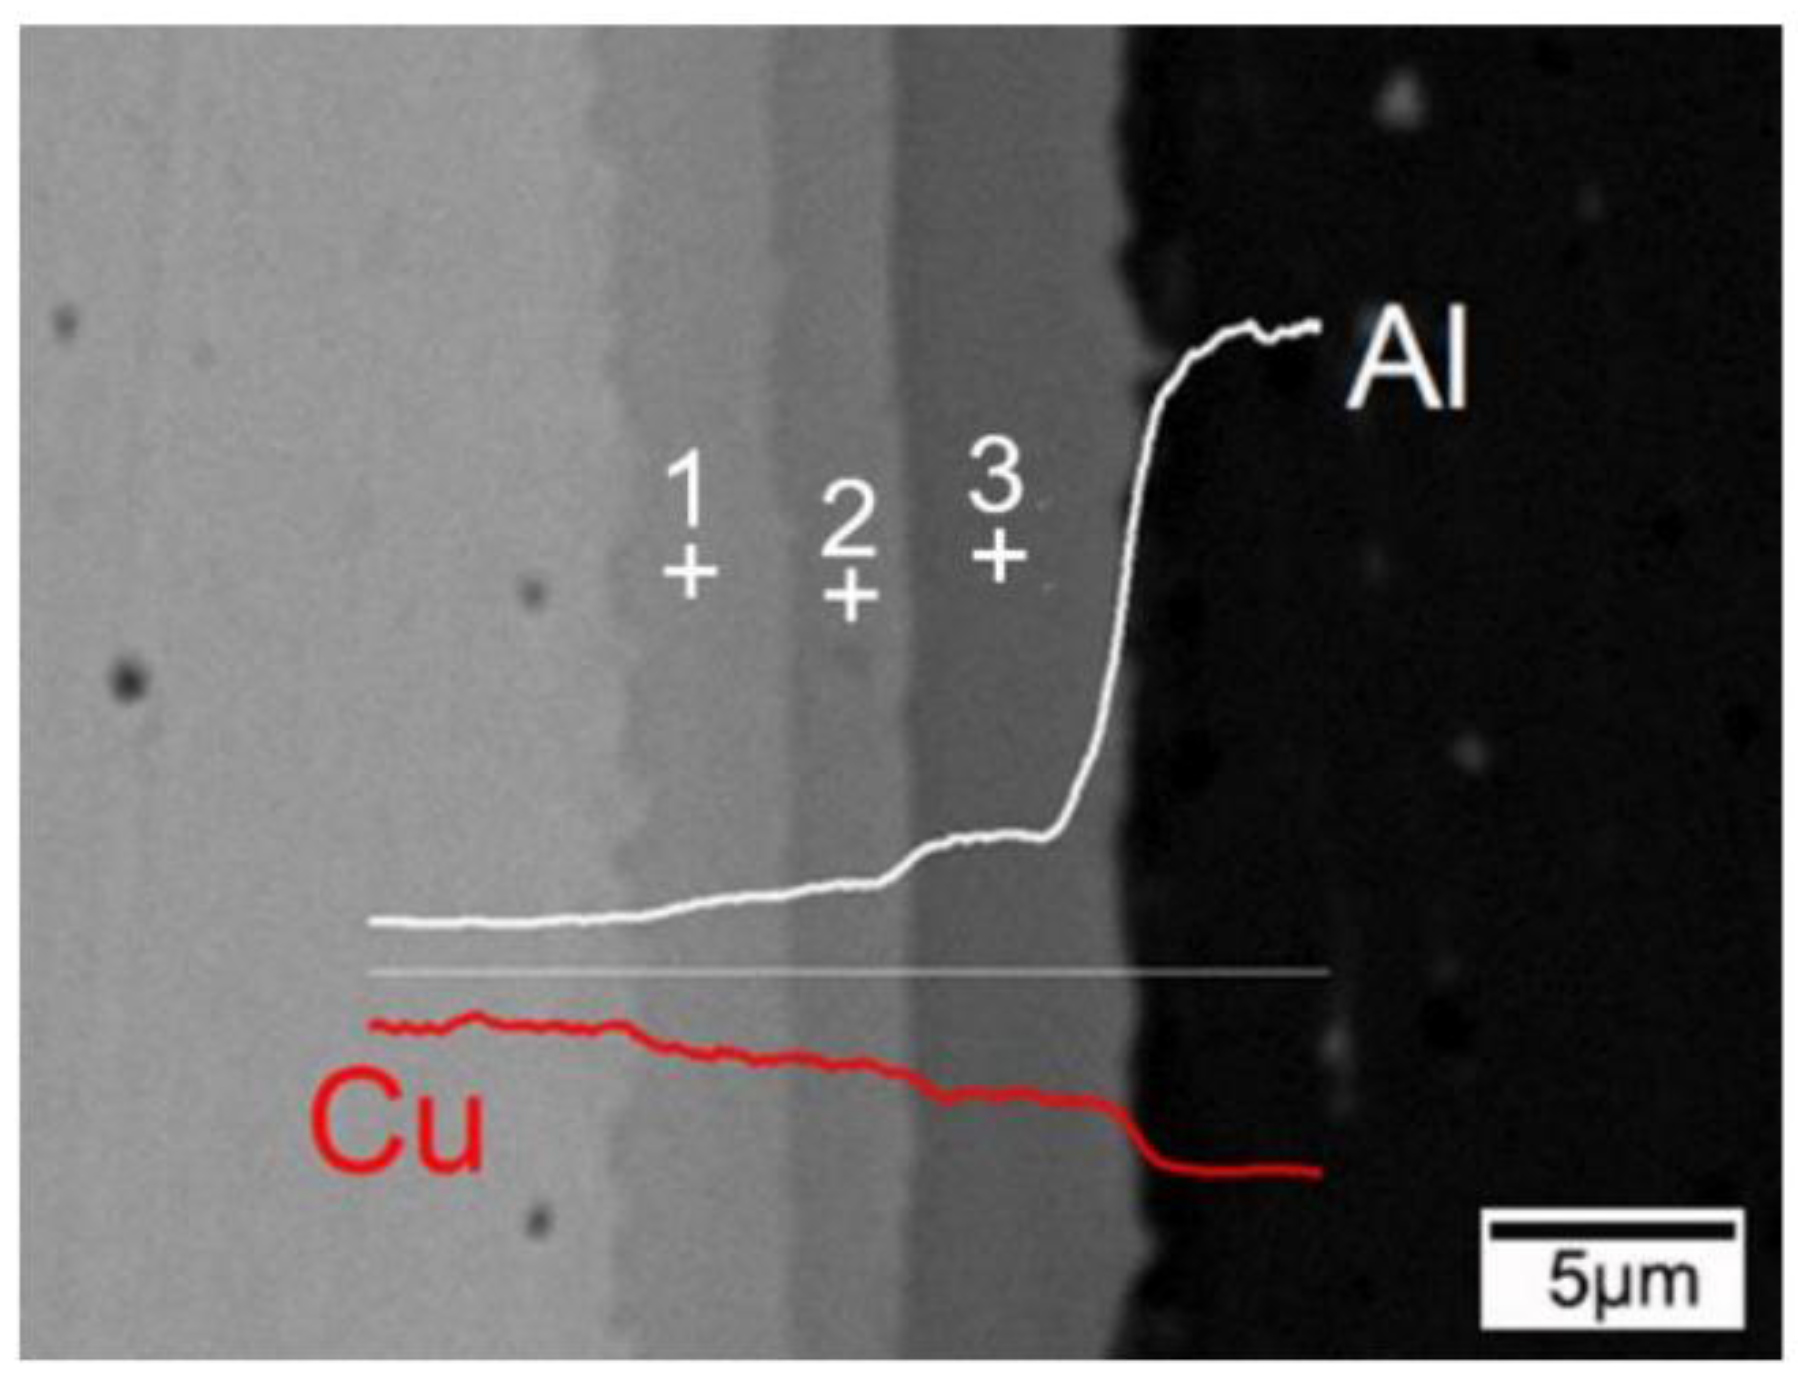
3.1. Analysis of the As-Cast Cu/Al Clad Sheet Interface

Figure 3 presents the backscattered electron (BSE) image of the as-cast Cu/Al clad sheet interface and EDS results. The brightest region on the left side is the Cu. The darkest region on the right side is the Al. The thickness of the clad sheet interface is approximately 9 μm to 10 μm. Studies have shown that several intermetallic compound (IMC) layers can form with Cu and Al on the contact surface under the effect of thermal diffusion [18,19,20]. The EDS results (Table 2) show that the compositions of the three layers, arranged in a sequence from Al to Cu, correspond to the probable Al2Cu, AlCu, and Al4Cu9 phases, respectively. To identify these three IMC layers, XRD was performed on the peeled surface of the Cu/Al clad sheet, which is shown in Figure 4. The results further verify that the interface of the as-cast Cu/Al clad sheet is composed of three IMC layers: Al2Cu, AlCu, and Al4Cu9.

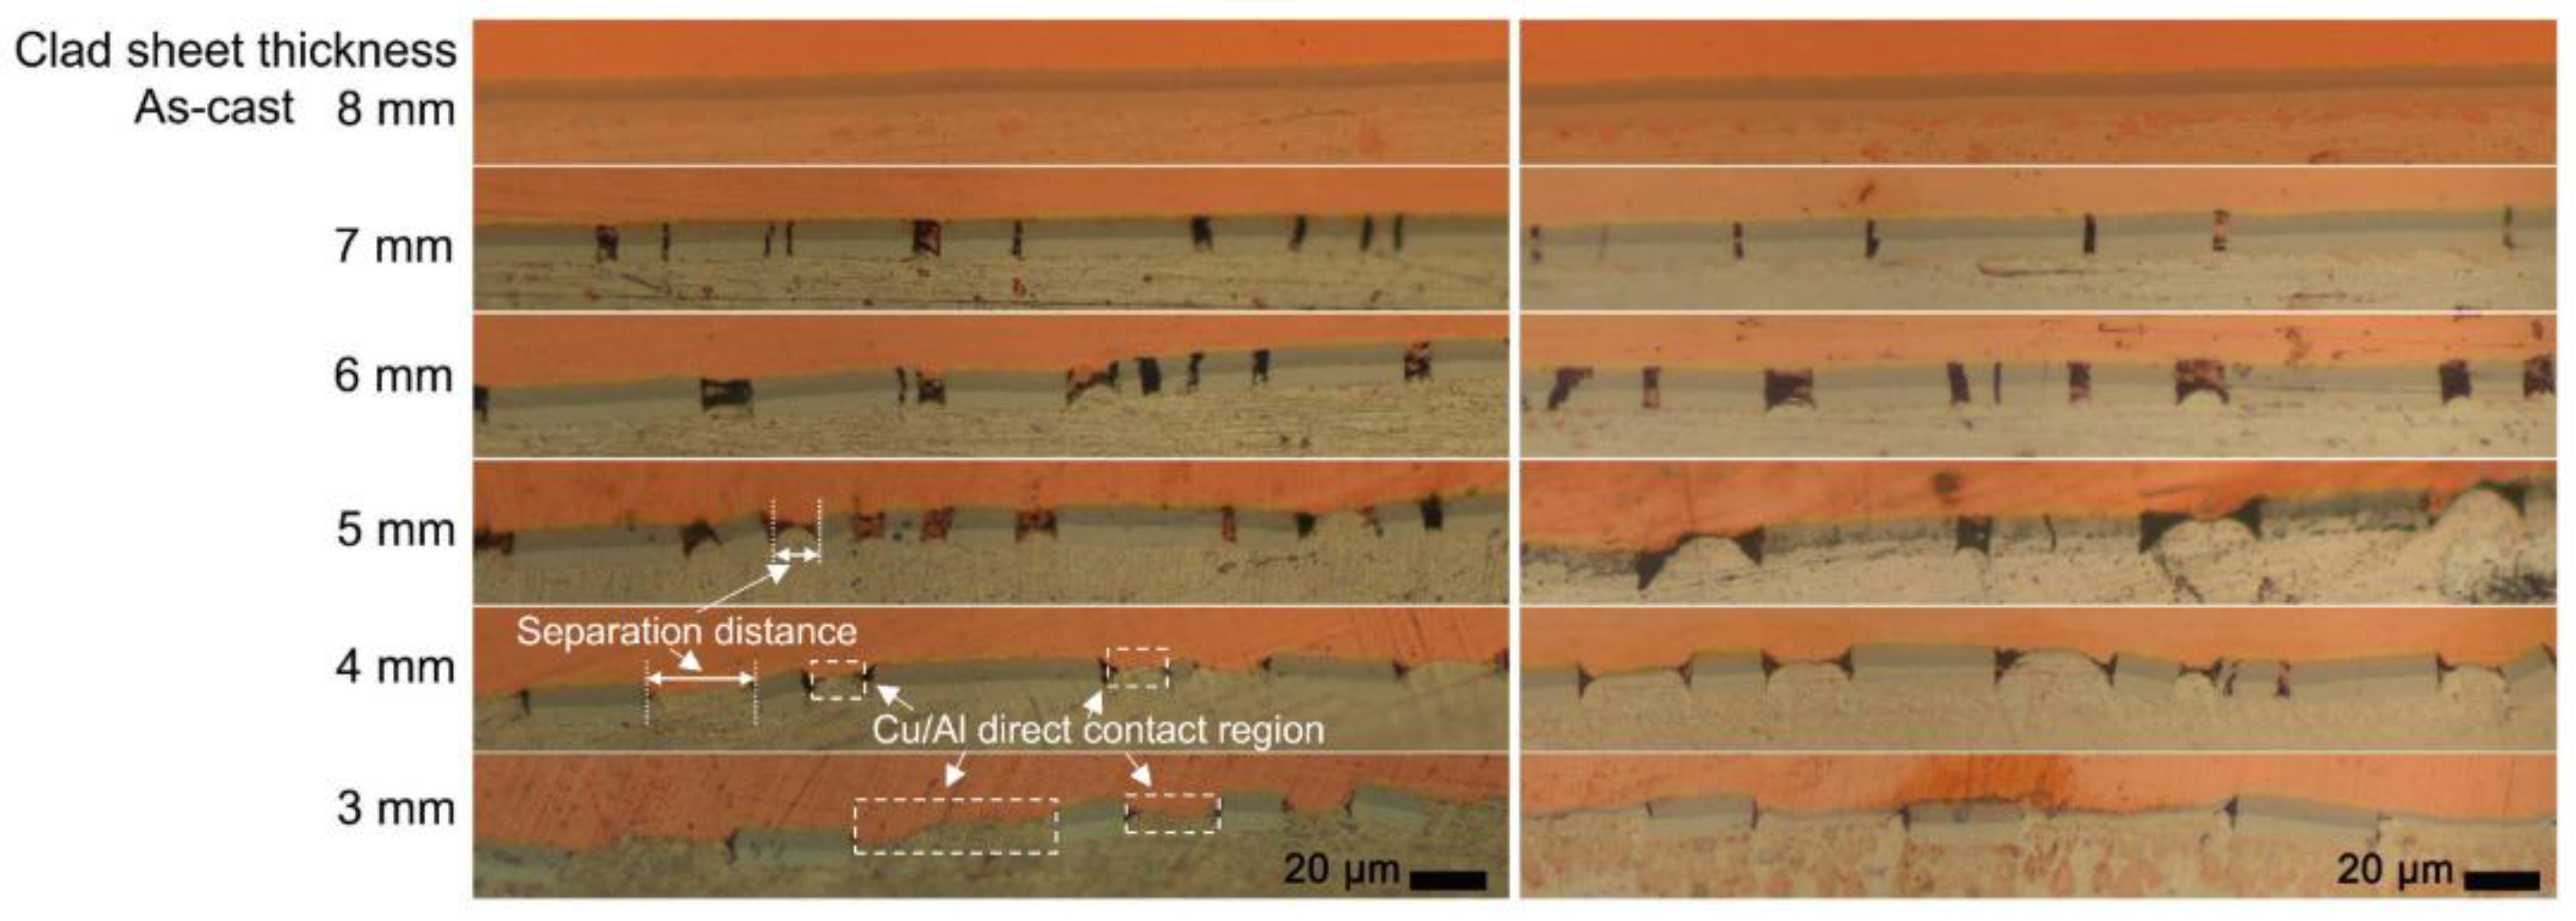
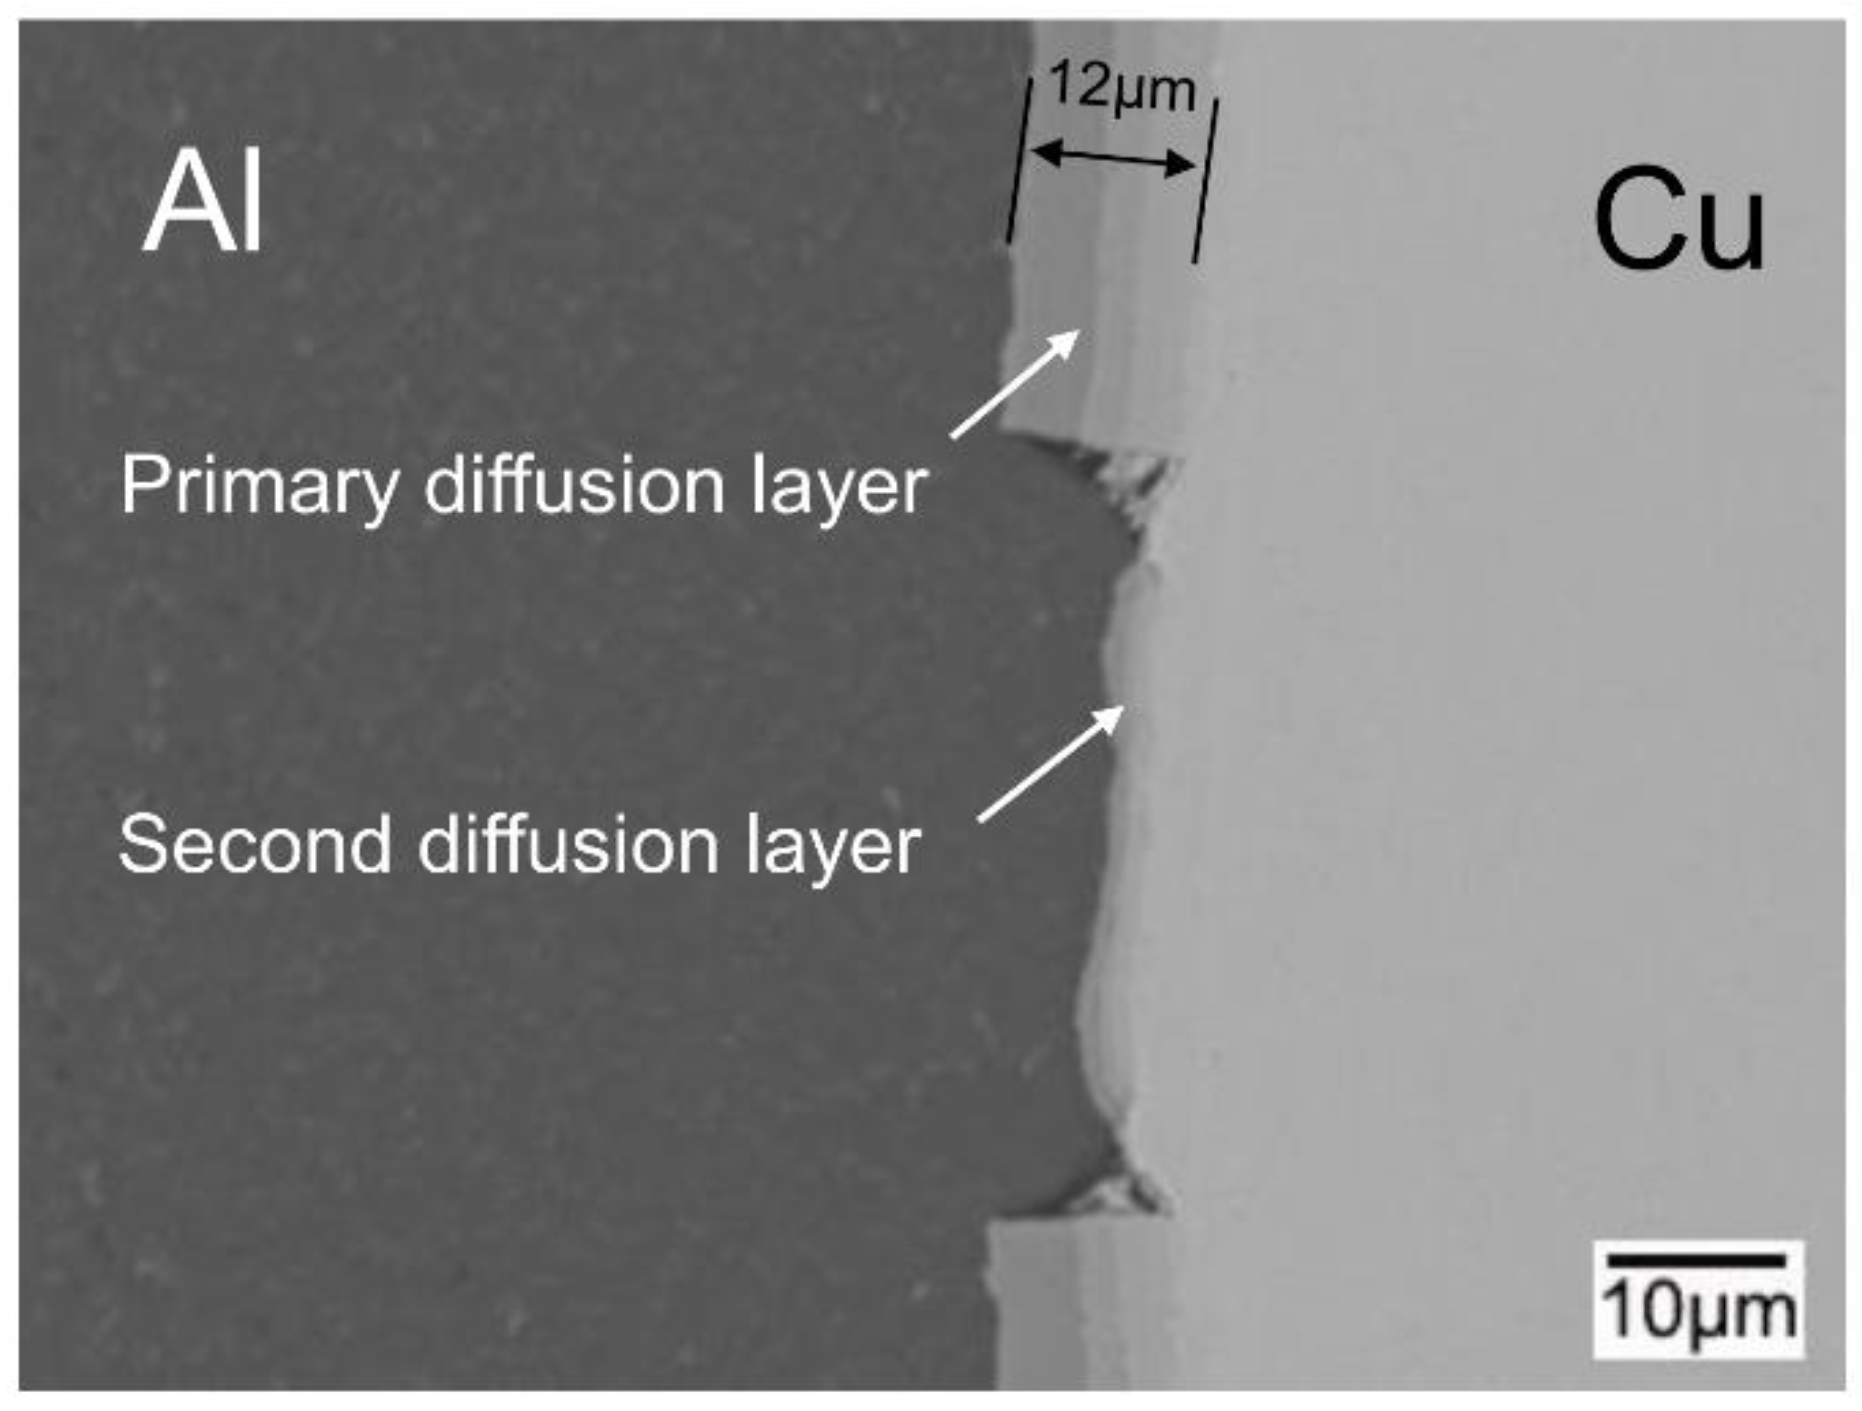
3.2. Interfacial Microstructure of the Clad Sheets after Multi-Pass Rolling and Annealing
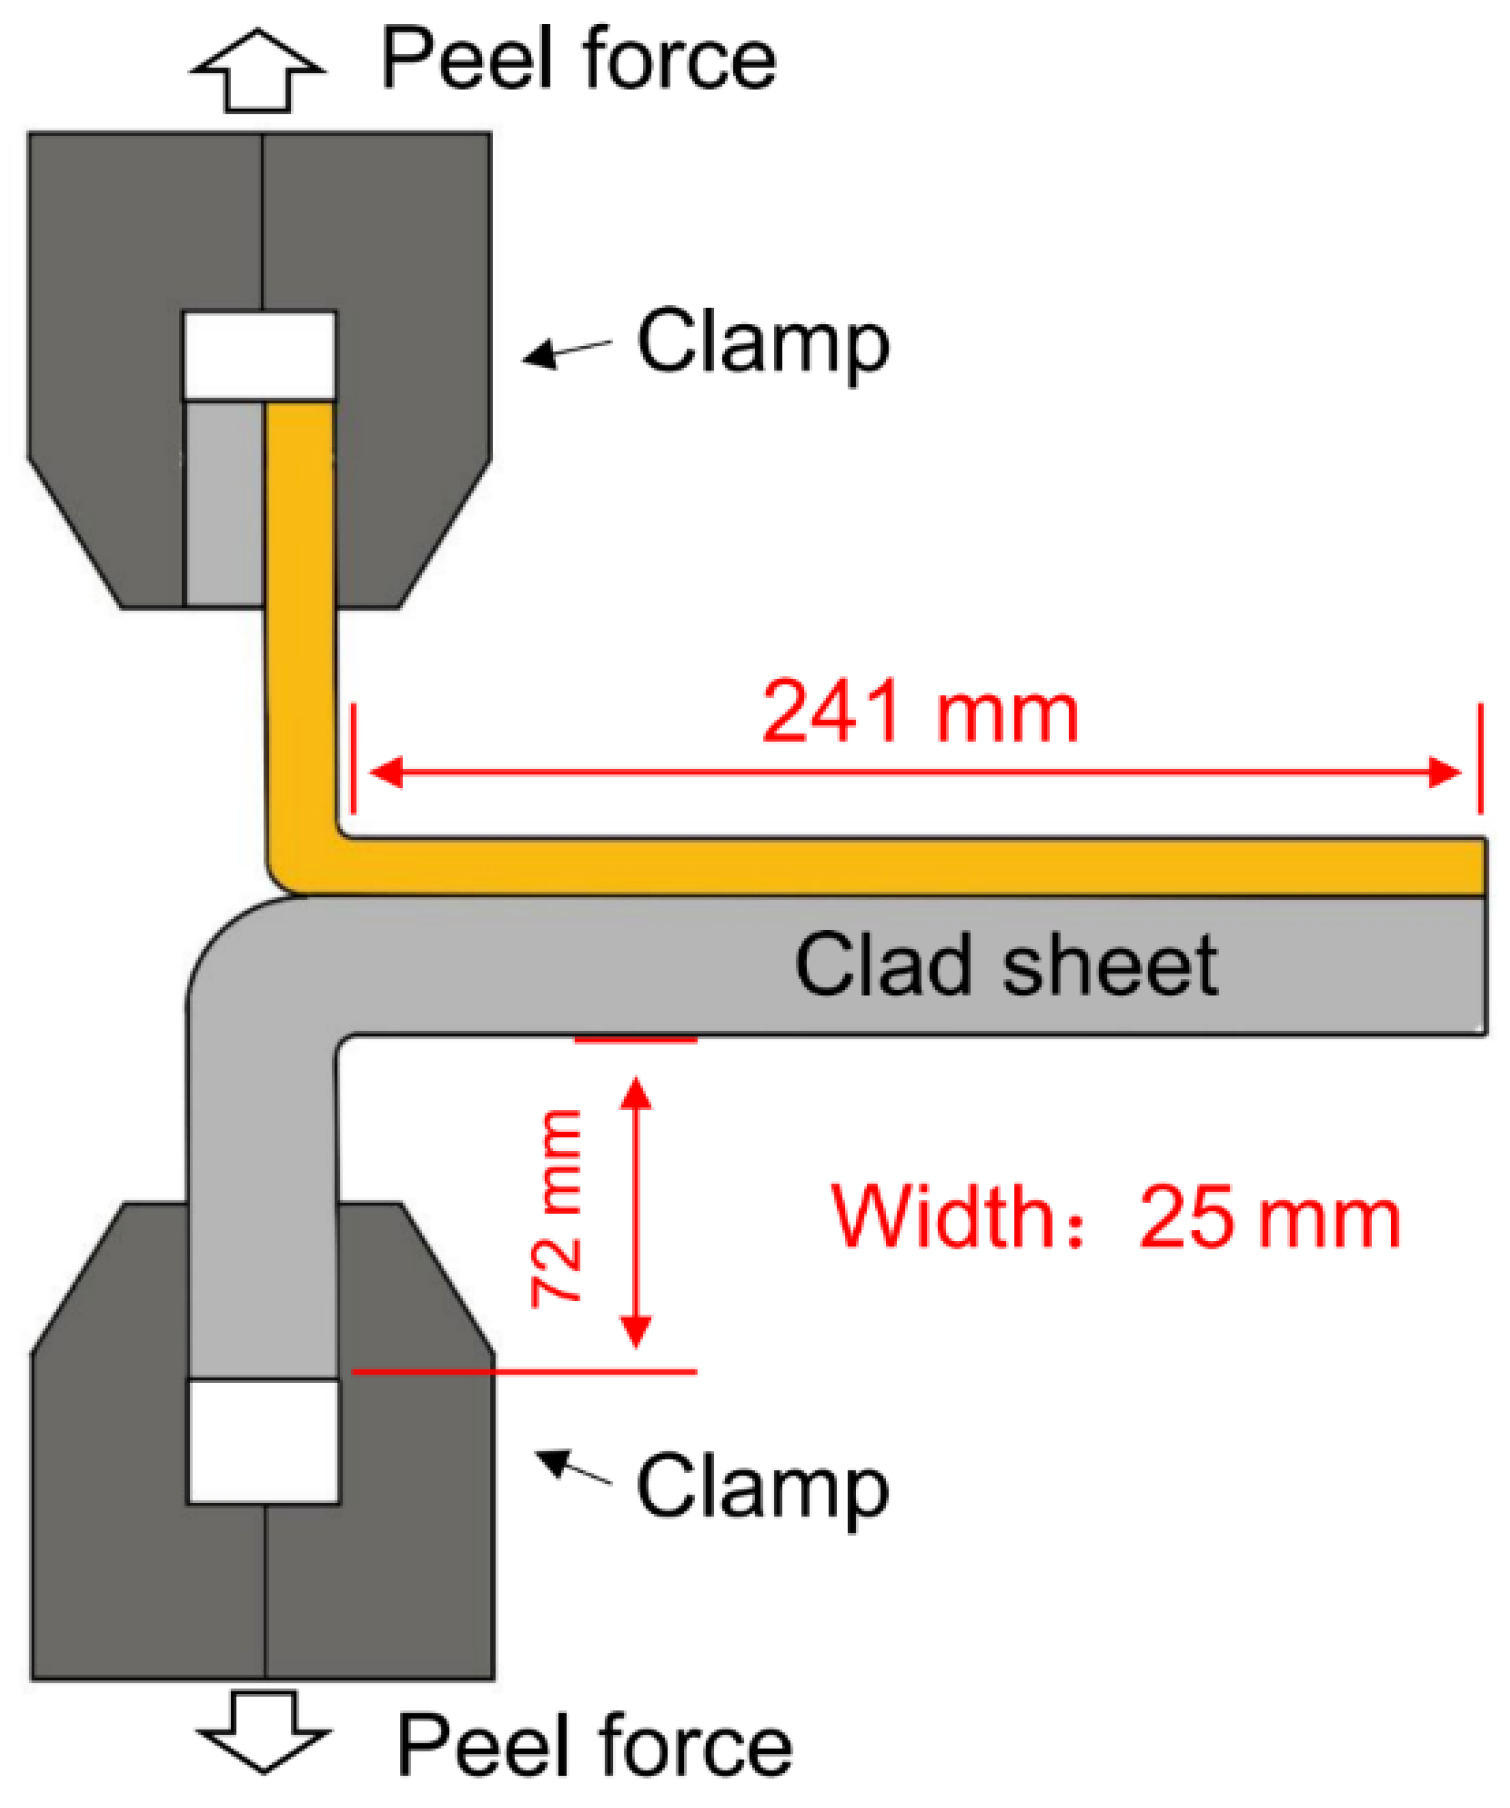
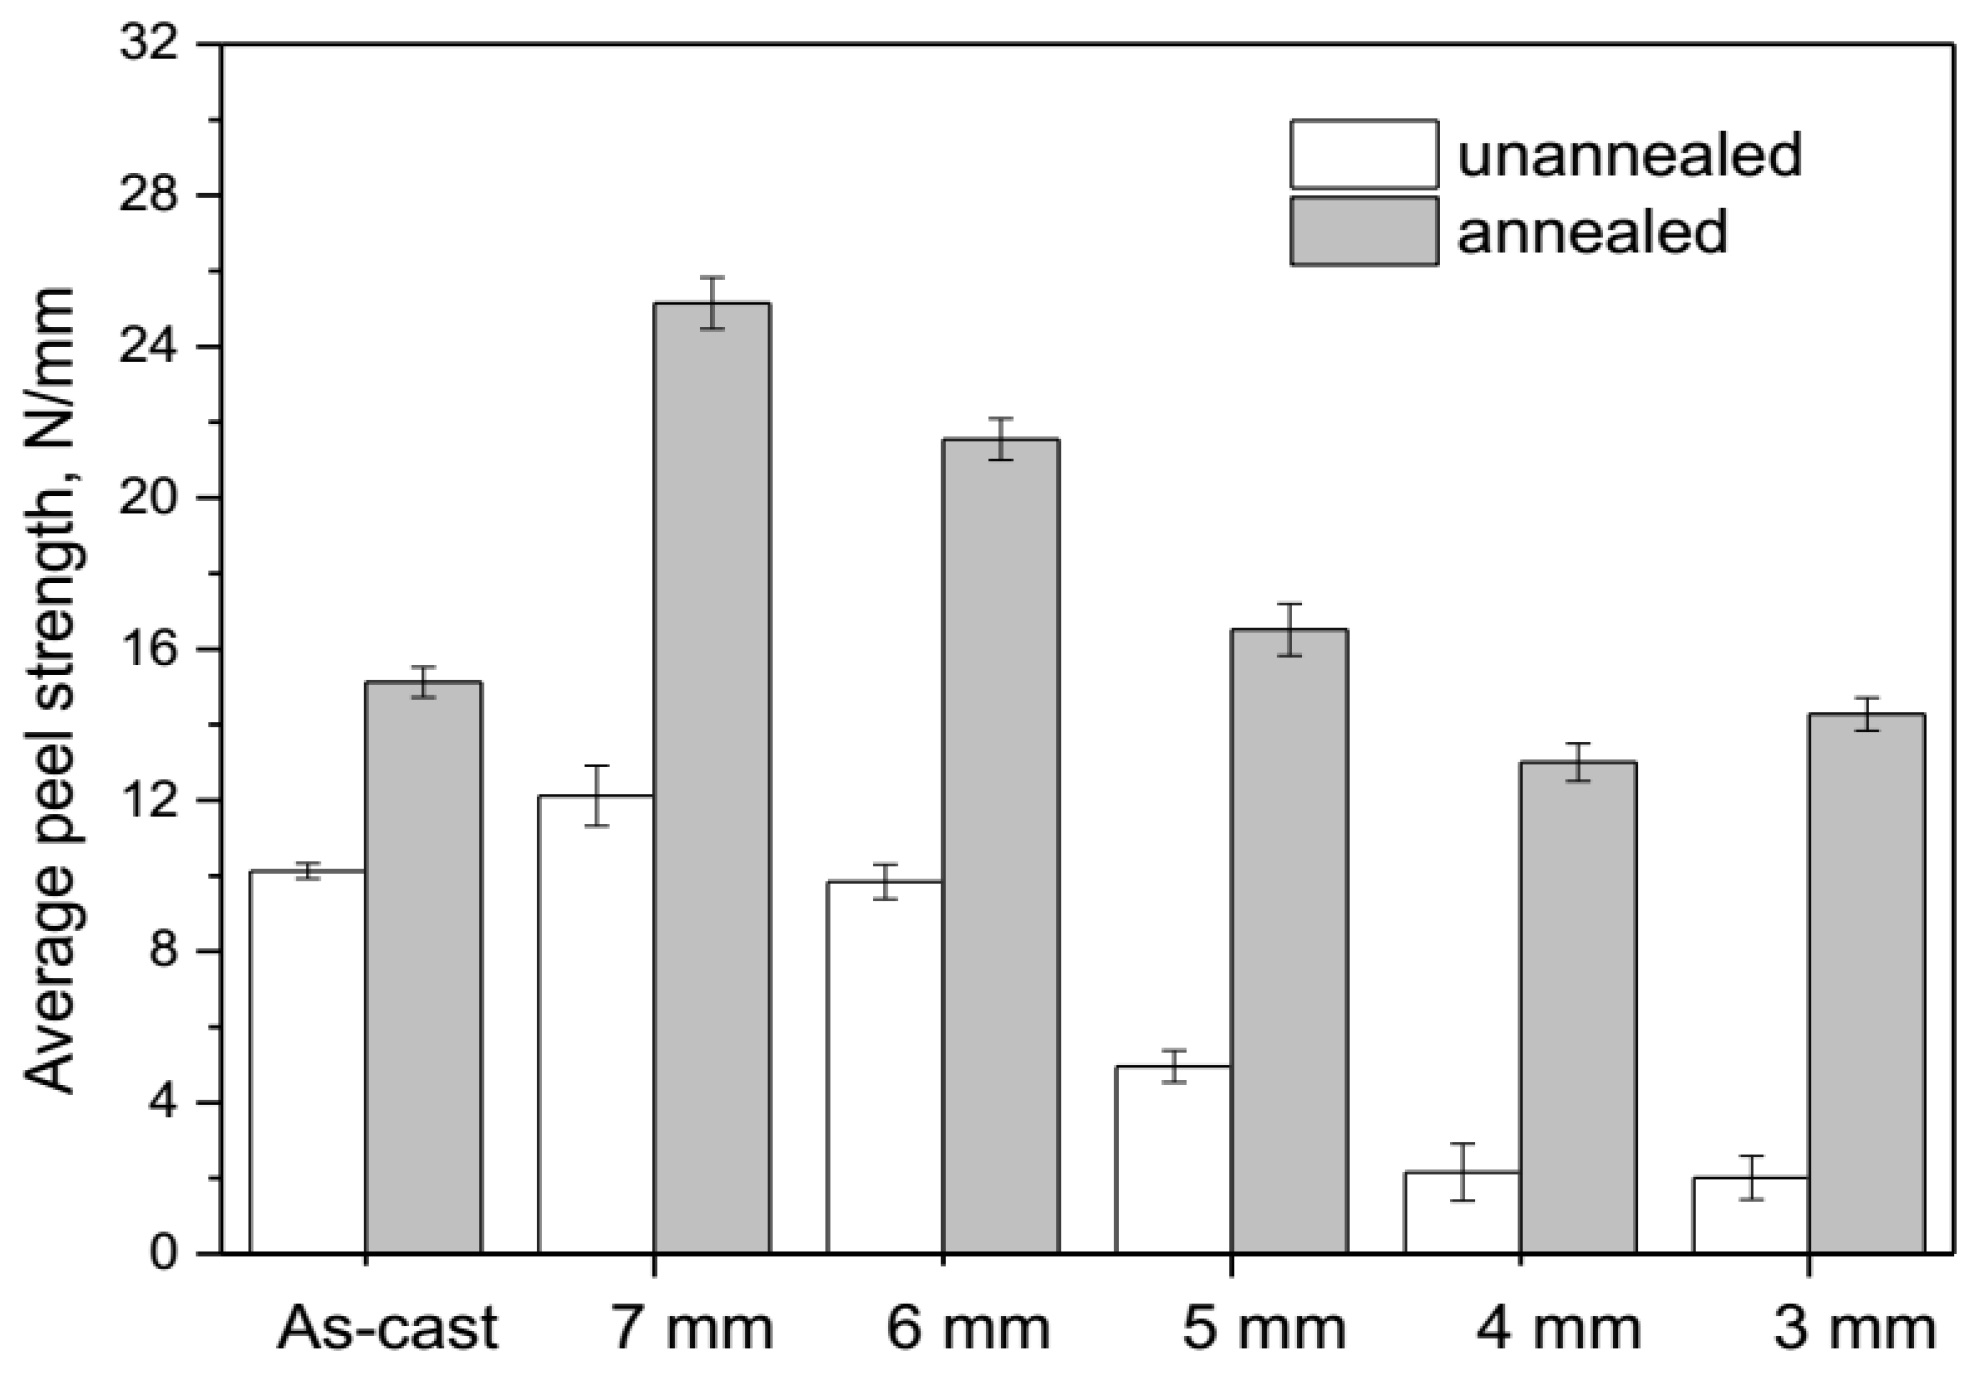
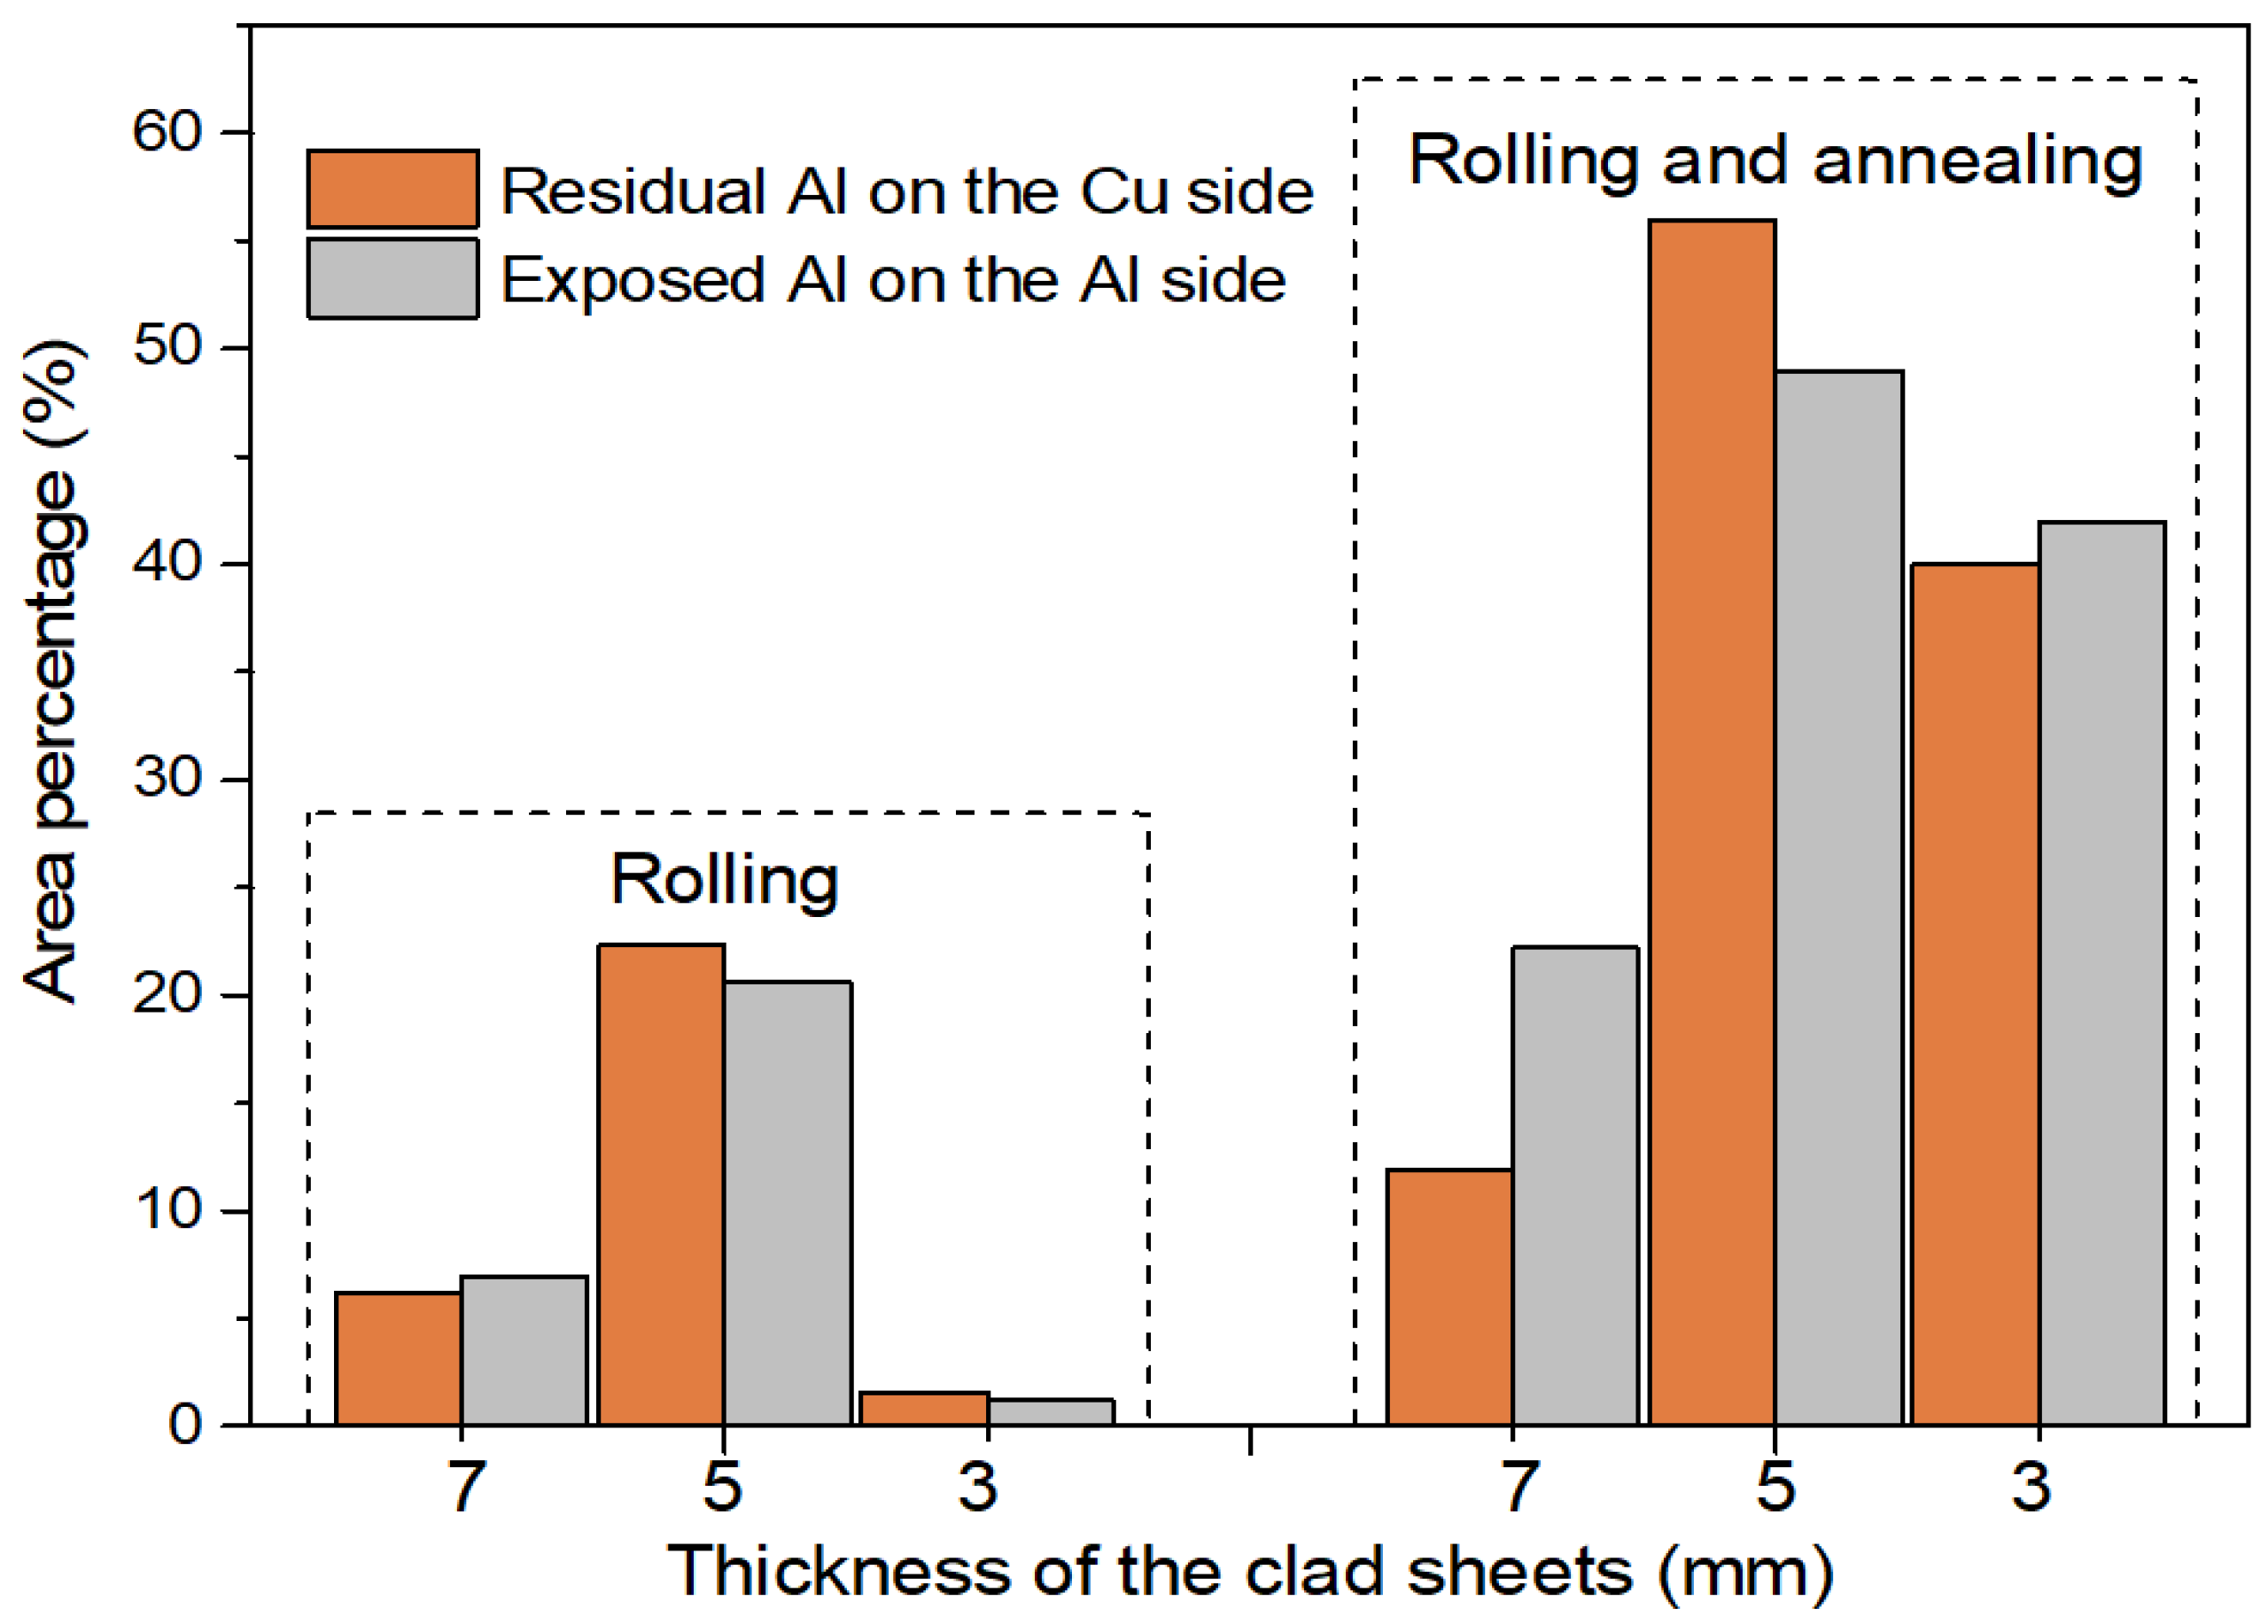
Figure 5 shows the interfacial microstructure of the Cu/Al clad sheets with different thicknesses after multi-pass rolling and annealing through optical microscope. As the rolling pass number increases, the IMC layer broke and gradually separated under the rolling force. The separation distance increased with the increase of the rolling pass number. Cu and Al directly contacted in the broken region of the IMC layer. The width of the Cu/Al direct contact region increased with the increase of the rolling pass number. In addition, the ratio of the Cu/Al direct contact region to the interface increased with the increase of the rolling pass number (shown in Table 3).
The right side of Figure 5 shows the interface microstructure with different clad sheet thicknesses after multi-pass rolling and annealing. The IMC layer thickness increased to 12 μm under the effect of thermal diffusion during the annealing process (shown in Figure 6). The interface was still composed of three types of IMC layers. After one to two rolling passes, the width of the Cu/Al direct contact region was small and there was no obvious diffusion layer. When the rolling pass number increased by three to five, a secondary diffusion layer (distinct from the primary diffusion layer that formed during the H-TRC process) formed during the annealing process in the Cu/Al direct contact region. The interface of the secondary diffusion layer is clearly visible. The thickness is about 2–3 μm and is not uniform. The second diffusion layer is mainly composed of Al2Cu and Al4Cu9. The thickness of its two ends is obviously smaller than that of the middle part. This is mainly due to the existence of cracks and voids near the fracture surface of the primary diffusion layer, which restricted the diffusion of Cu and Al atoms. These phenomena can explain why no obvious secondary diffusion layer is present when the width of the Cu/Al direct contact region is small.

3.3. Peel Strength

The average peel strength (APS) of the Cu/Al clad sheets after the H-TRC, multi-pass rolling, and annealing processes is shown in Figure 7. The APS of the as-cast clad sheet is approximately 10 N/mm. After the first pass rolling pass, the APS increased to 12 N/mm. However, the peel strength decreases with the increase of the rolling pass number. When the thickness of the clad sheet decreases to 3 mm, the peel strength does not continue to decline. After annealing, the APS of the as-cast clad sheet increases to approximately 15 N/mm. The peel strength of the clad sheet significantly increases after annealing. For the thickness of 7 mm, the APS can reach approximately 25 N/mm after annealing. The variations in the peel strength with thickness are similar to those observed for the unannealed clad sheet. When the thickness decreases to 3 mm, the APS exhibits a slight increase.

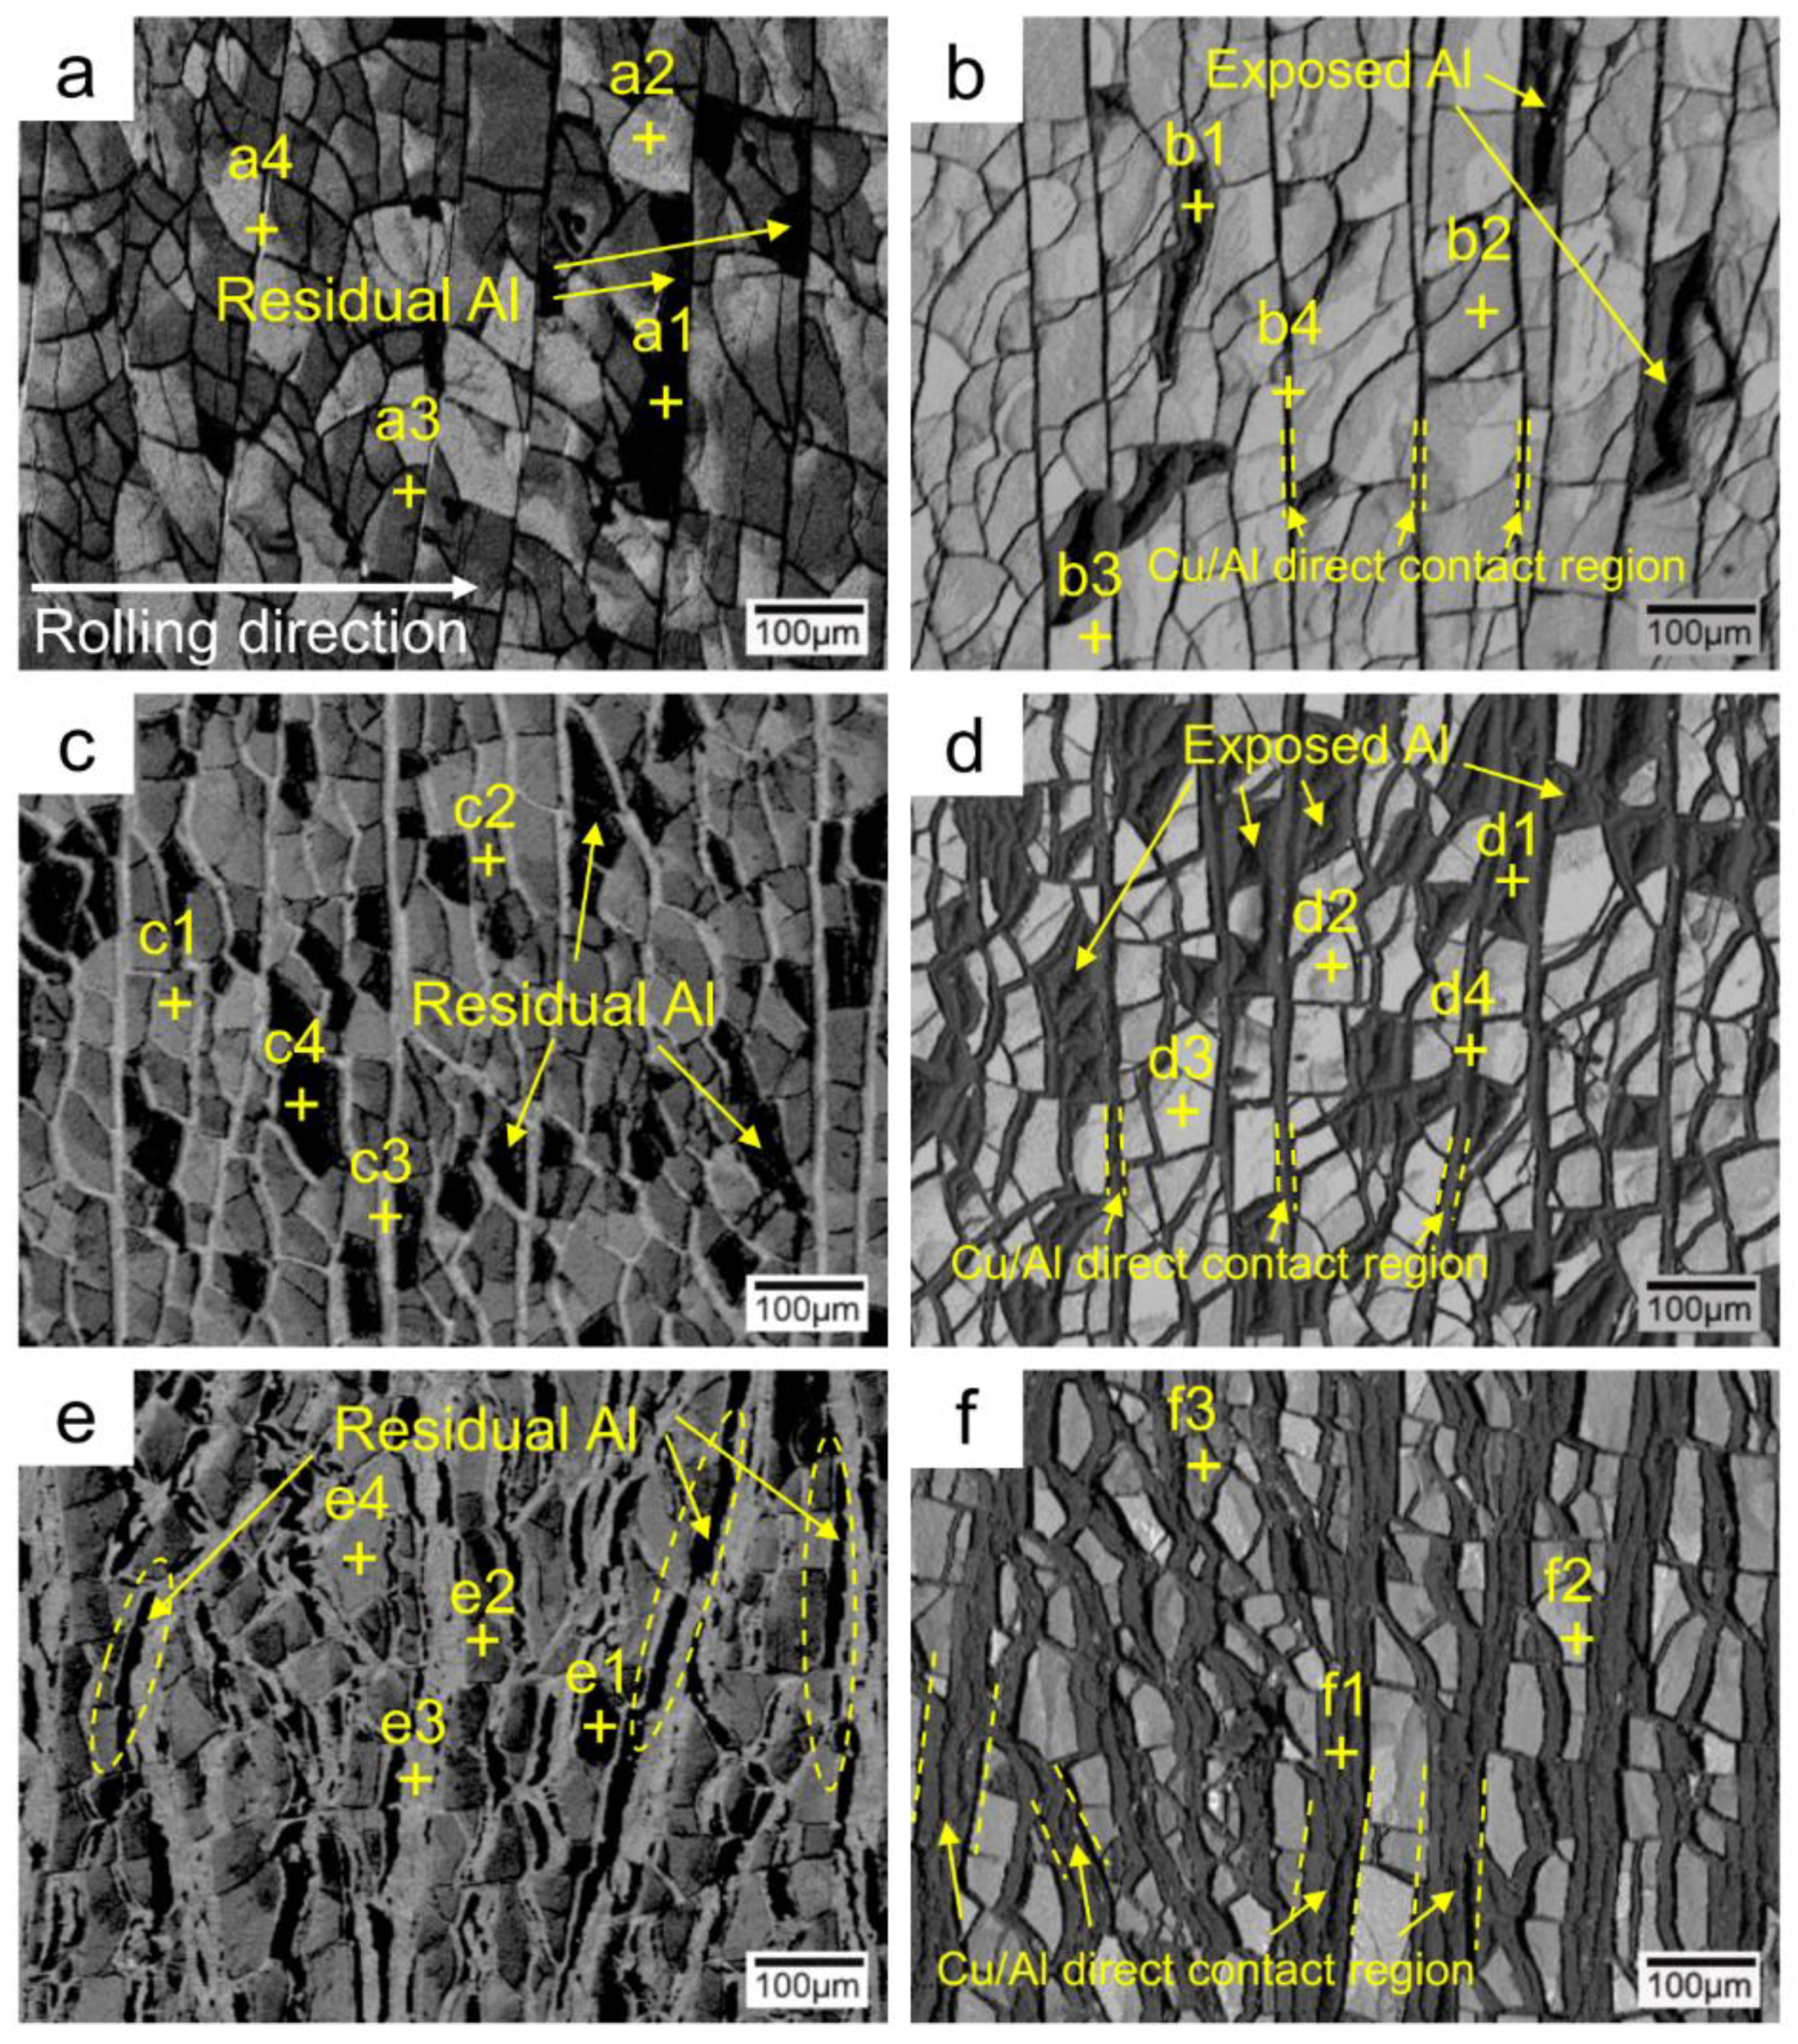
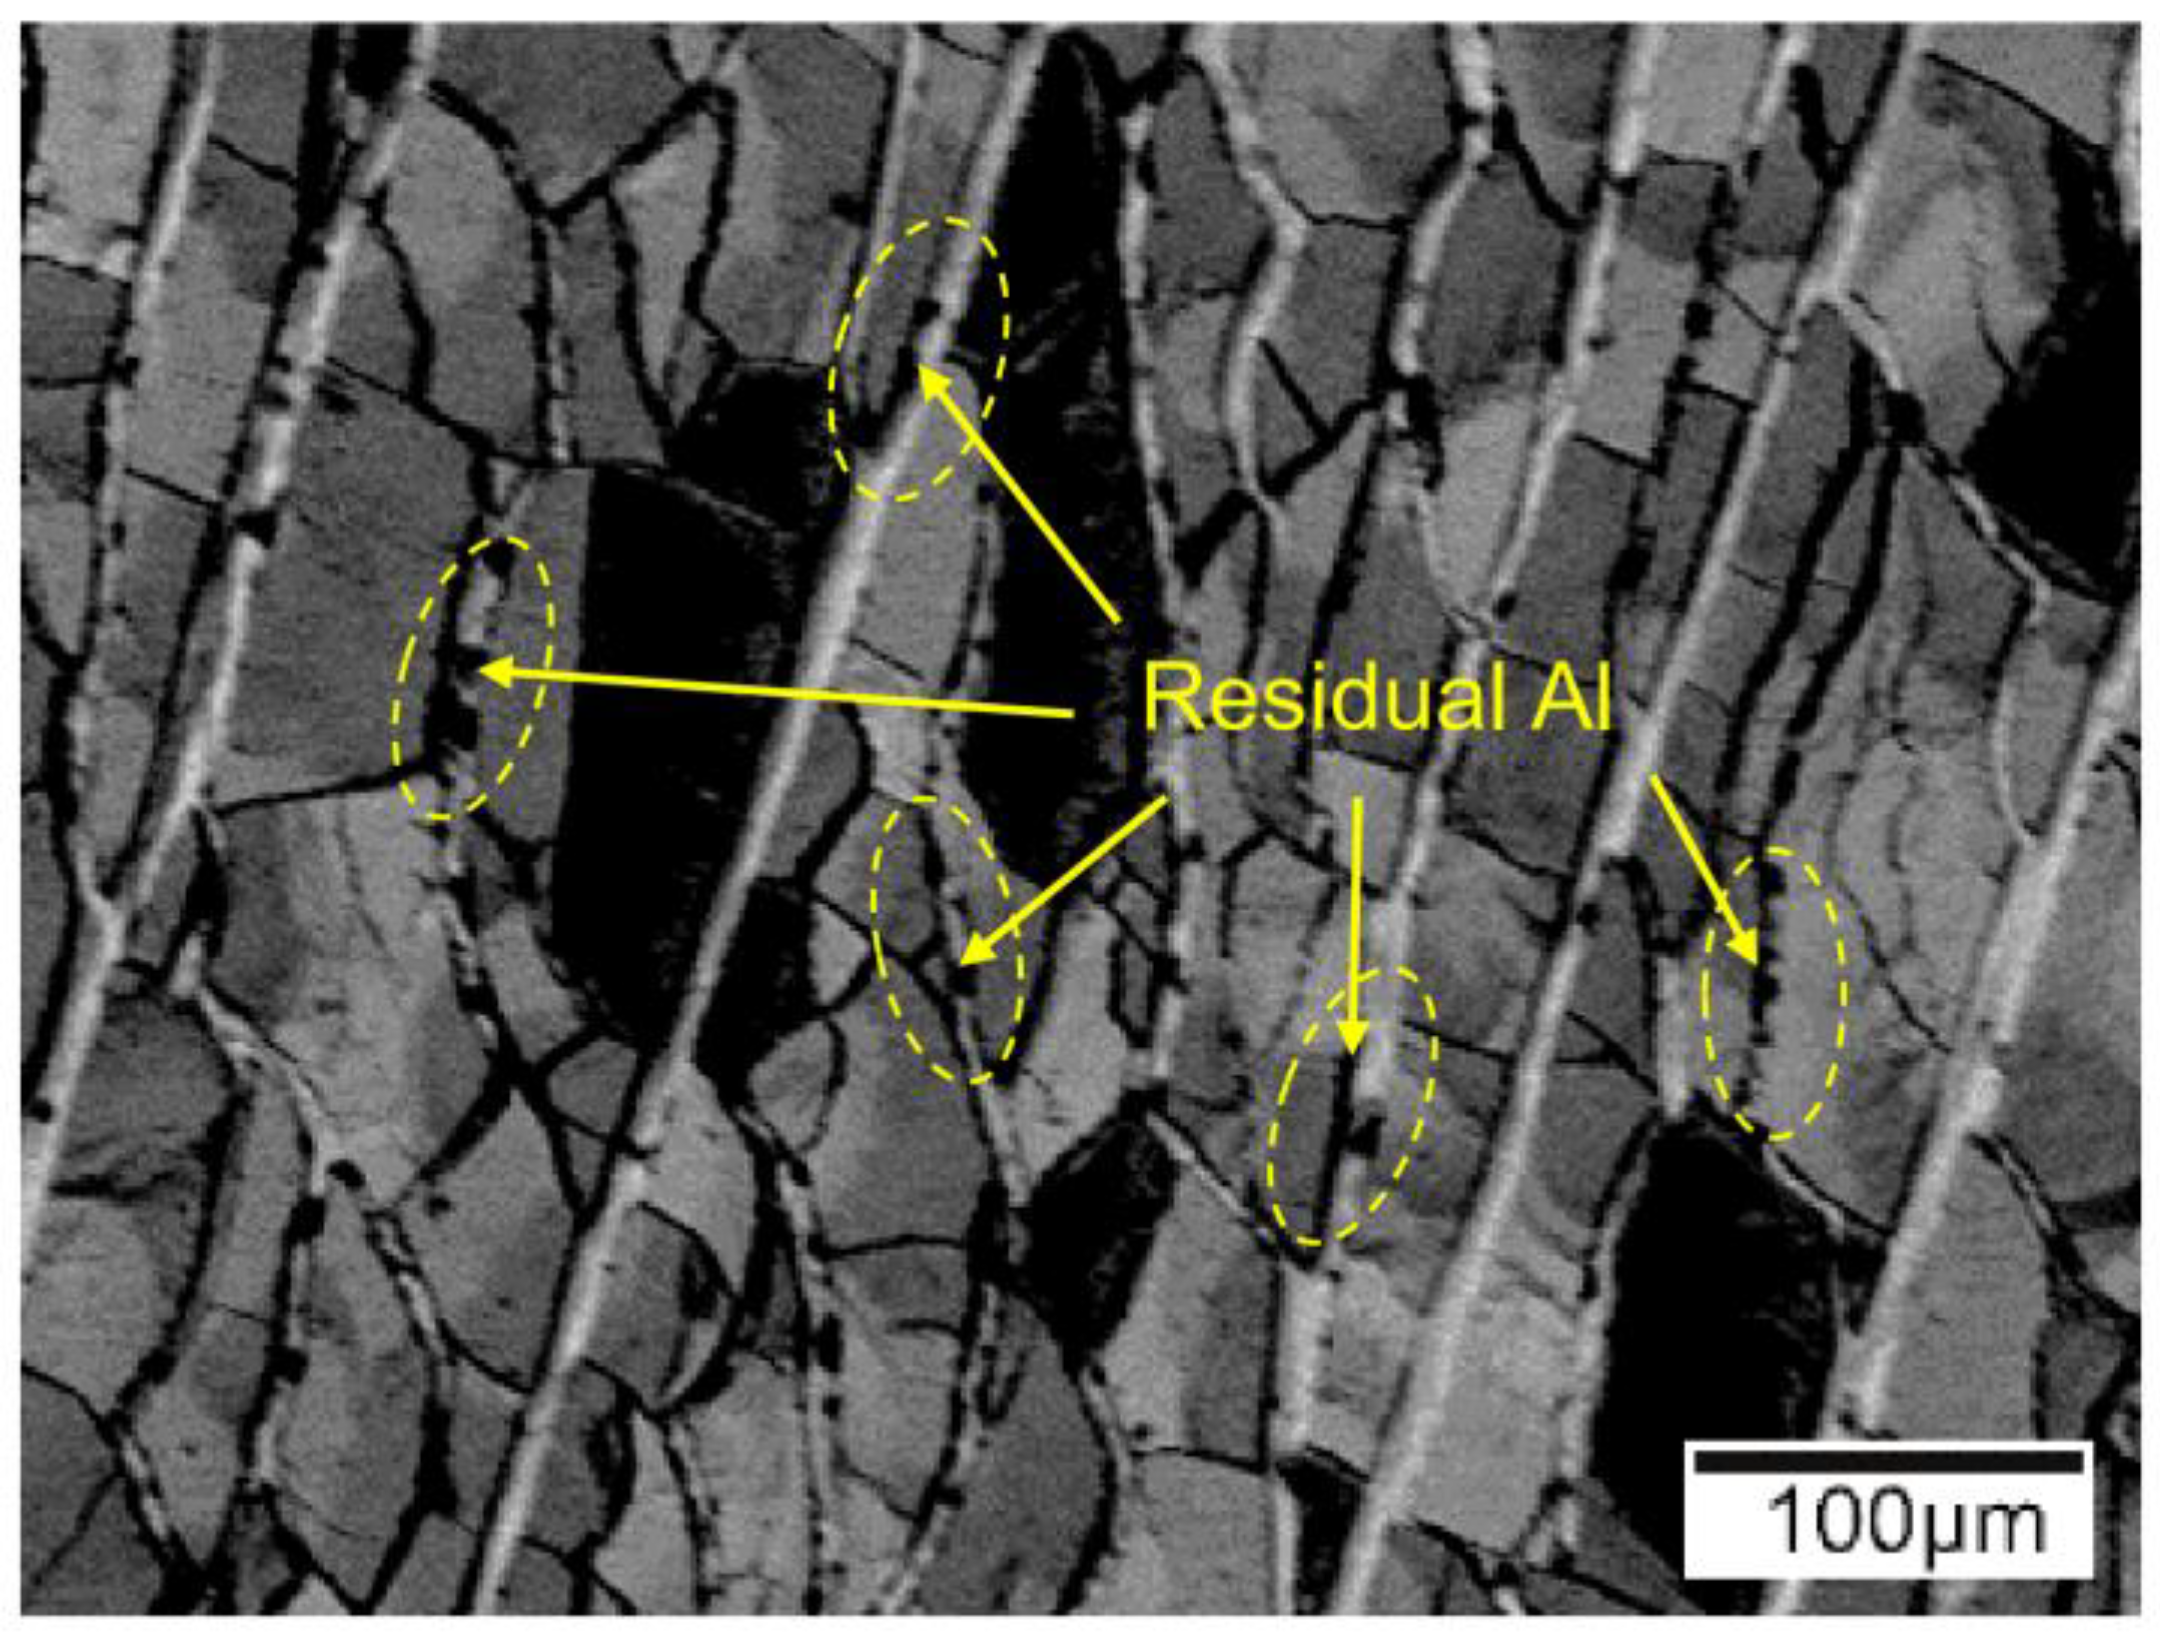
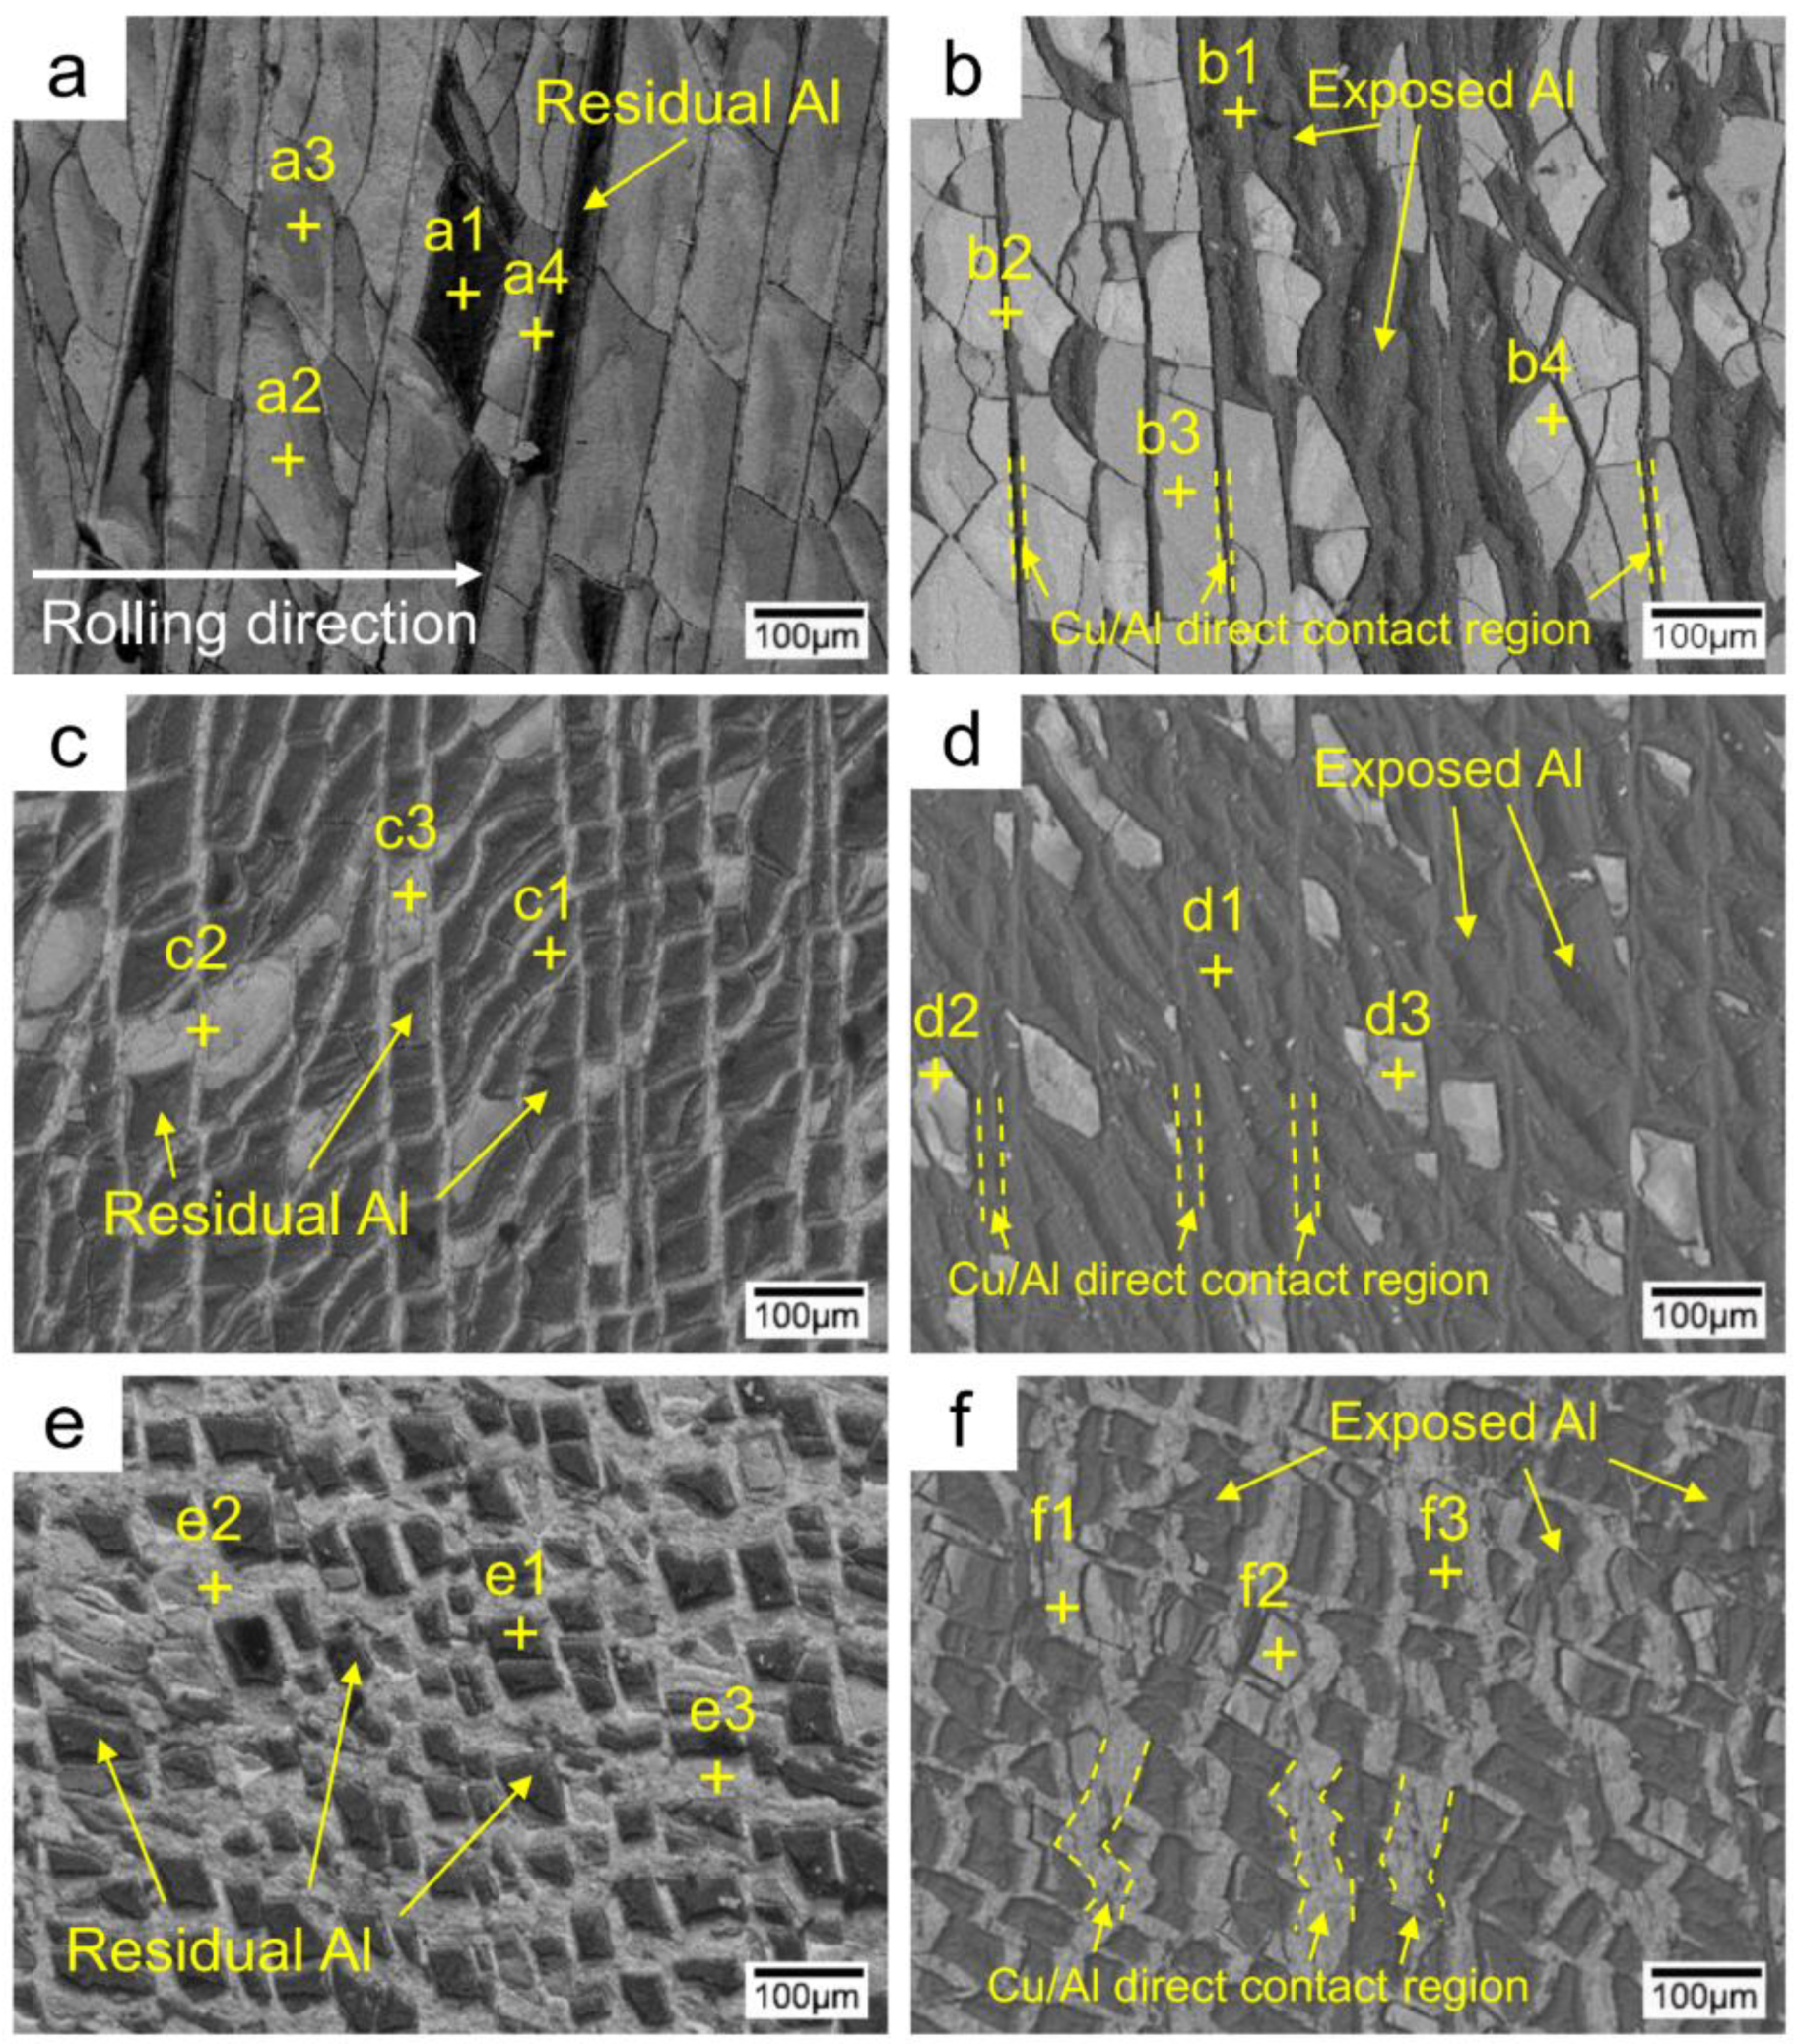
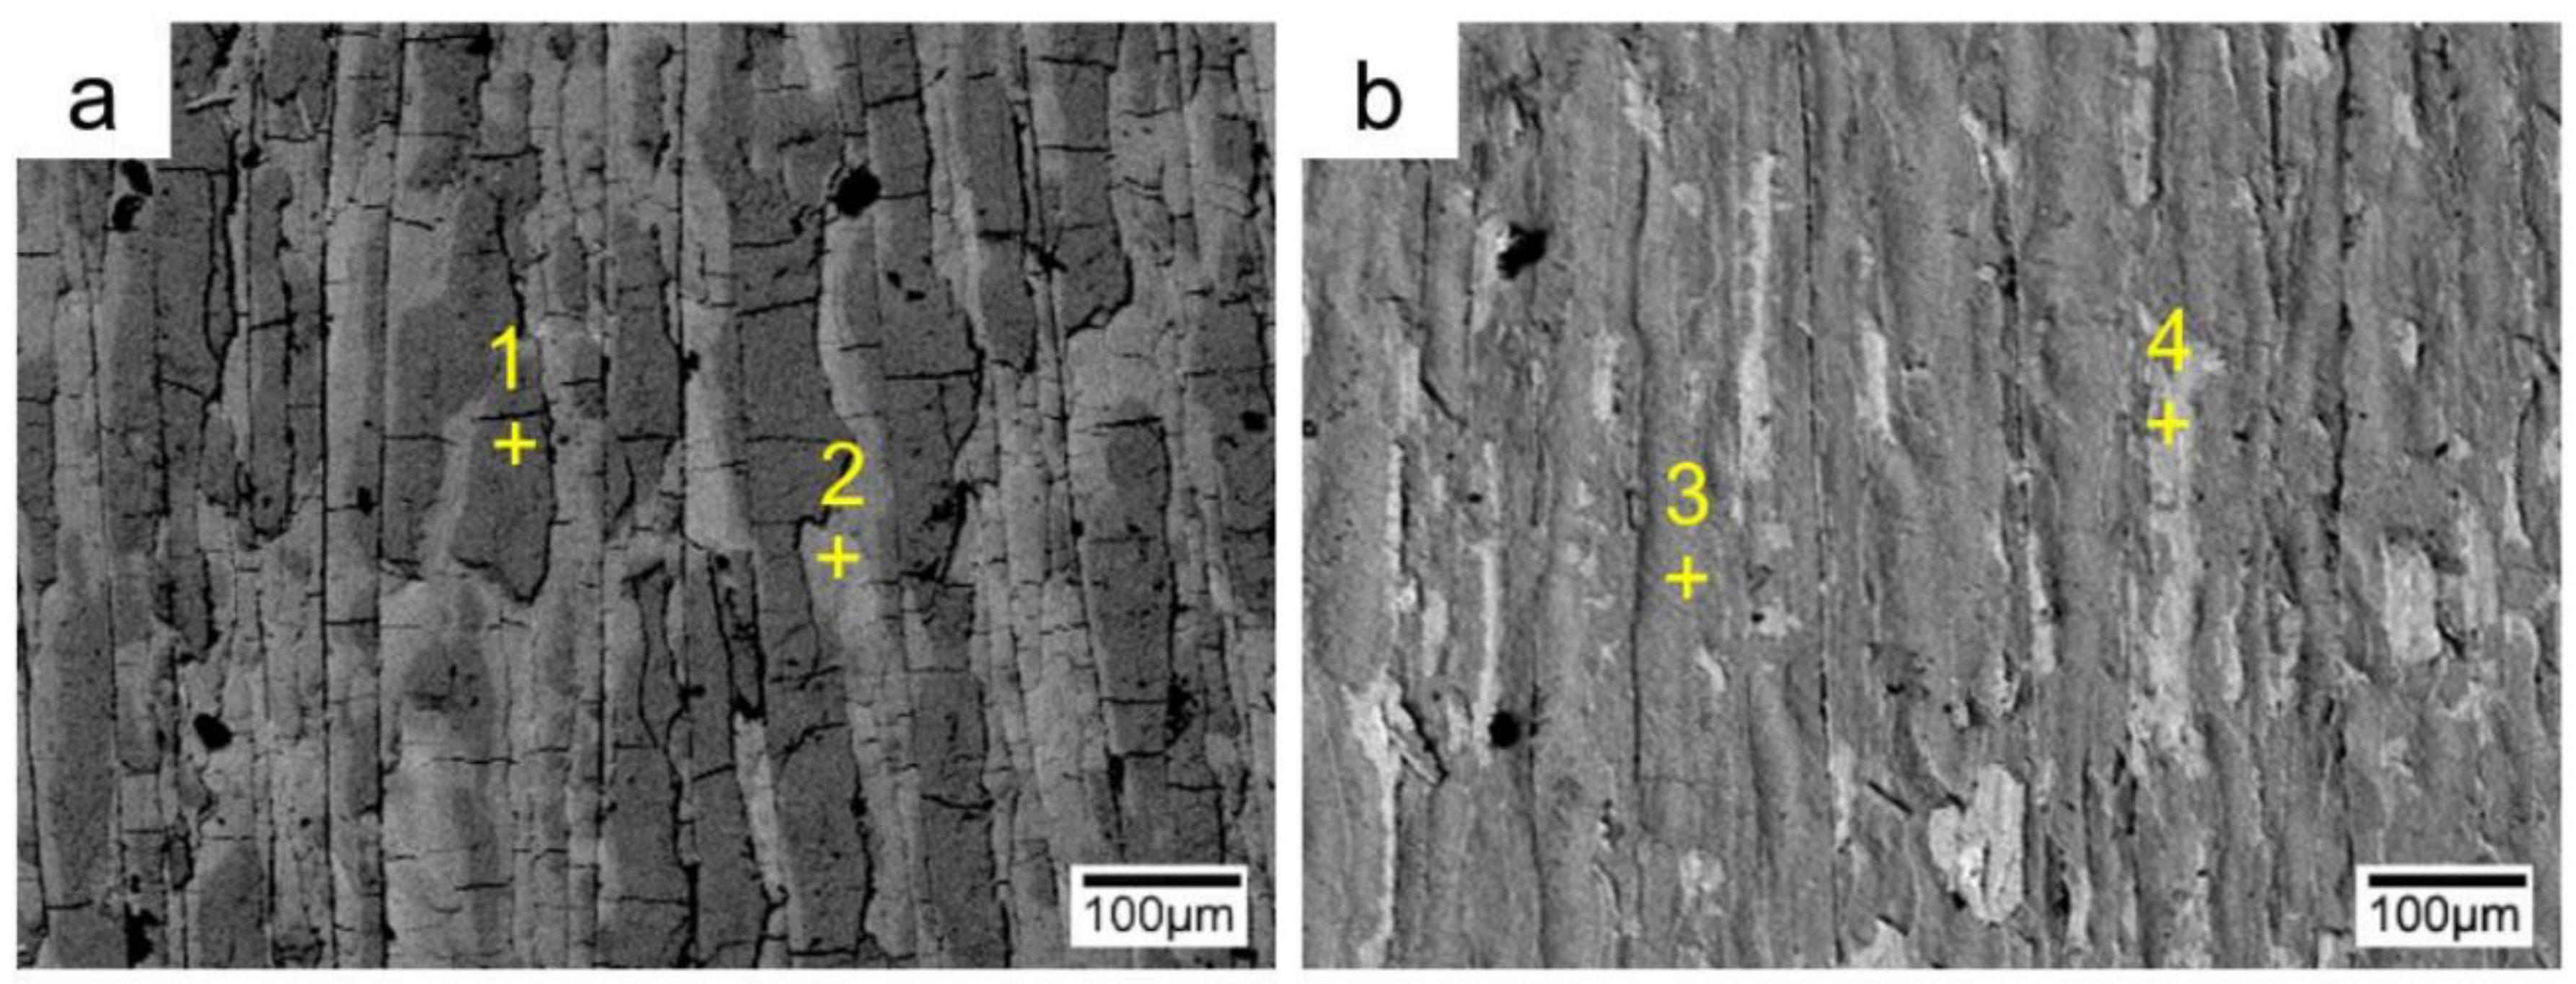
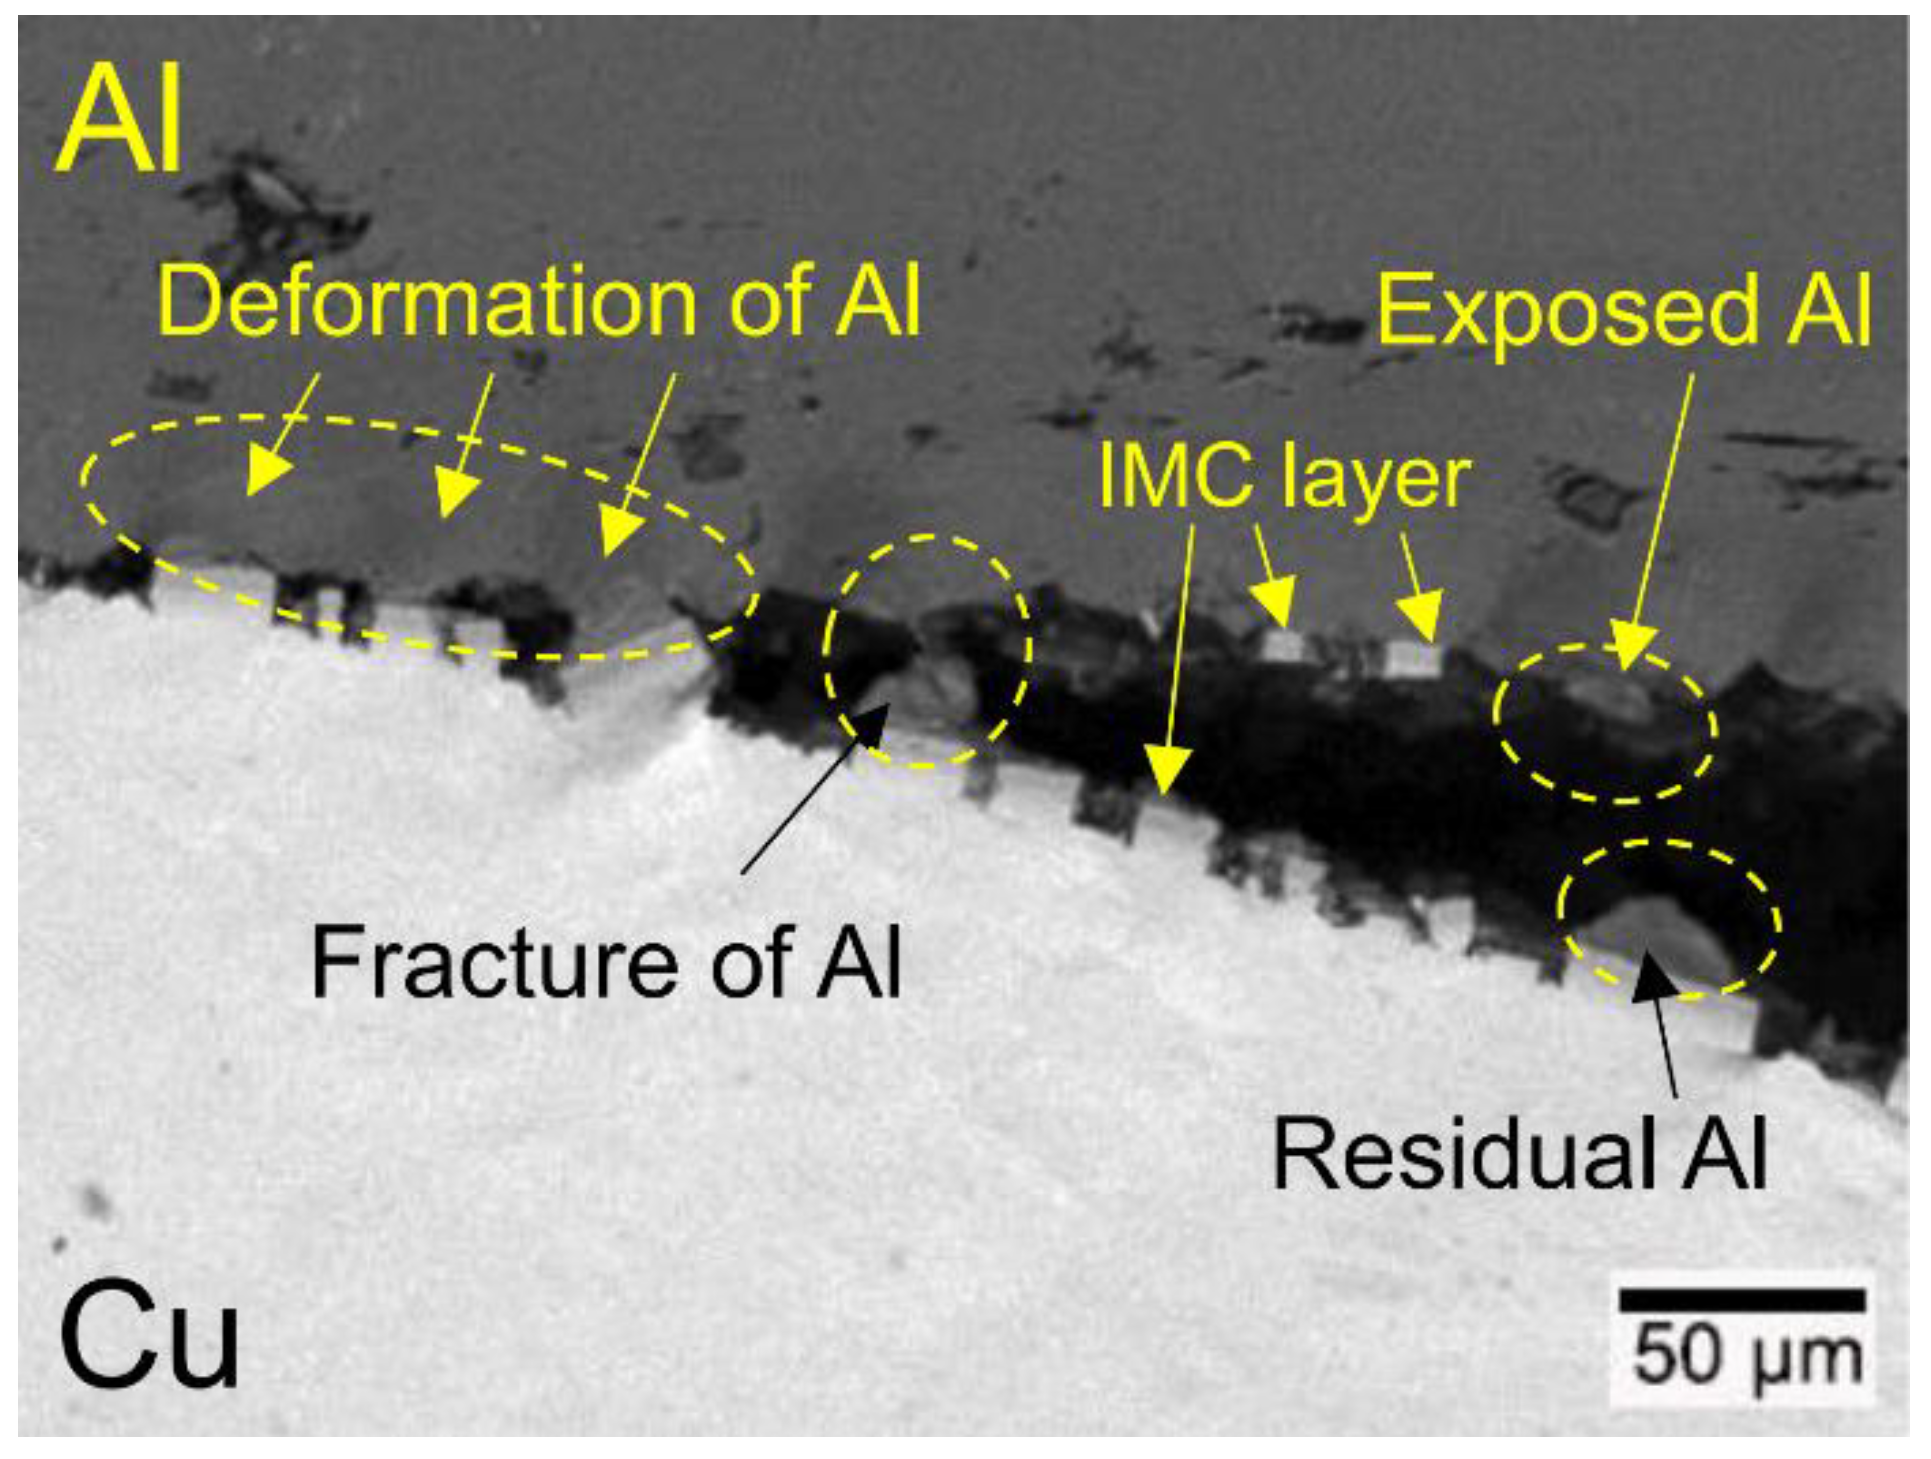
3.4. Peeled Surface Morphology

To study the effects of multi-pass rolling and annealing on the peel strength of Cu/Al clad sheets, the interfacial morphology of the peeled surface was examined using scanning electron microscopy. Figure 8 presents the peeled surface morphology (BSE images) and EDS results (Table 4) of the Cu/Al as-cast clad sheet.
The surfaces of the Cu and Al sides are covered with large gray and dark materials. These materials fractured during the peeling process. No obvious plastic deformation zone is found. The direction of the crack is perpendicular to the direction of peeling. The EDS results indicate that the dark zone on the Cu surface is Al2Cu and the gray zone is AlCu. The results for the Al side are similar to those for the Cu side. Most of the Al surface is covered with Al2Cu and a few areas are covered with AlCu. Based on the analysis of the peeled surface morphology, it can be concluded that both the Cu and Al surfaces are completely covered with the IMC layer. The peeling crack propagated along the IMC layer (mainly AlCu and Al2Cu). Compared to copper and aluminum, the hardness of Cu/Al IMC compounds are much higher. Their crystal structures are complex and the slip systems are less, which means the brittle fracture occurs easily under external force (Table 5). The formation and thickening of the AlCu layer can promote crack propagation and damage bonding strength [12]. Some studies have indicated that the non-equilibrium diffusivity between Al and Cu promotes the Kirkendall effect of void formation, which can weaken the bond strength of the clad sheet [21,22]. Therefore, when the interface layer was too thick, the peeling crack would propagate in the IMC layers, which led to the decrease of the bonding strength of the clad sheet.
To study the effect of multi-pass rolling on the peeling morphology of the Cu/Al clad sheet, the samples with thicknesses of 7 mm, 5 mm, and 3 mm after rolling were selected for analysis.
Figure 9 shows the peeled surface morphology of the Cu/Al clad sheets with three different thicknesses after multi-pass rolling. The EDS results (Table 6) show that the black zone is Al, the gray zone is AlCu, and the dark zone is Al2Cu. Compared with the as-cast clad sheet, there are many cracks perpendicular to the rolling direction. The width of the cracks increases with decreasing thickness of the clad sheets. Compared to the interfacial microstructure (Figure 5), it is not difficult to find that these cracks formed due to the separation of the primary diffusion layer in the rolling process. Afterward, copper and aluminum were extruded into these regions to form the Cu/Al direct contact region. Next, the Cu/Al direct contact region was used to express the crack region of the primary diffusion layer for the peeling surface.
After the first rolling pass, most of the fracture surfaces are still covered with an IMC layer. Some residual Al appears on the Cu side (Figure 9a) and some Al matrix is exposed outside on the Al side (Figure 9b). The proportion and shape of these two peeling morphologies are approximately the same. Therefore, we consider that these two peeling morphologies were caused by the fracture of the Al matrix. It indicates that the fracture strength of this region has reached the fracture strength of aluminum. The fracture region of exposed Al can be regarded as a fracture characteristic that can enhance the peel strength. The Cu matrix and Al matrix were extruded to the fracture area of the primary diffusion layer, but rolling reduction is only 12.5% after the first rolling pass. No effective bonding formed between the fresh Cu and Al. Therefore, at the Cu/Al direct contact region, the EDS results show that the Cu side is Cu and the Al side is Al.
When the clad sheet thickness was rolled to 5 mm (Figure 9c,d), the width of the Cu/Al direct contact region increases. Some residual Al can be found in this area (Figure 10, the black zone is Al). It indicates that the Cu matrix and the Al matrix were directly contacted and extruded to form a mechanical biting force by rolling. Moreover, the area of the exposed Al on the Al side increases.
When the clad sheet thickness was rolled to 3 mm (Figure 9e,f), the ratio of the Cu/Al direct contact region was over 50% of the peeling surface (Table 3). The mechanical biting force between copper and aluminum in this region was enhanced under further rolling of the clad sheet. Therefore, a large area of residual Al was found on the copper side (Figure 9e). For the primary diffusion layer, most cracks propagated through the IMC layers. This process decreased the peel strength of the clad sheet.
There are three fracture modes of the Cu/Al clad sheet after multi-pass rolling: fracture between IMC layers, fracture of the Al matrix, and fracture in the Cu/Al direct contact region. The fracture in the Al matrix and the mechanical biting force in the Cu/Al direct contact region can enhance the peel strength of the clad sheet.
Figure 11 shows the peeled surface morphology (BSE images) of the Cu/Al clad sheets with three different thicknesses after multi-pass rolling and annealing. For the clad sheet thickness of 7 mm (Figure 11a,b), the EDS results (Table 7) show that the black zone is Al, the gray zone is AlCu, and the dark zone is Al2Cu. There are still three fracture modes after the first rolling pass and annealing. Compared with the unannealed clad sheet, the fracture area of the exposed Al is larger and more concentrated (Figure 11b).
For the clad sheet thickness of 5 mm (Figure 11c,d), the fracture mode markedly changed. The fragmentation and separation of the primary diffusion layer are granular after multi pass rolling. Figure 11c shows that most of the particles of the primary diffusion layer adhere to the Cu side and the surface is covered with the residual Al while the corresponding Al side appears in a large area of exposed Al. This indicates that most of the peeling cracks are propagated in the Al matrix instead of the primary diffusion layer. In the Cu/Al direct contact region, the EDS results show that the Cu side includes the IMC layers and the Al side includes an Al matrix. It shows that a secondary diffusion layer formed in the Cu/Al direct contact region.
For the clad sheet thickness of 3 mm after annealing (Figure 11e,f), two main fracture modes can be observed. The first is the fractured area of the exposed Al on the Al side, which is similar to that observed for 5 mm for the Cu/Al direct contact region. The EDS results show that both sides of Cu and Al are the IMC layer, which indicates that peeling cracks are propagated in the secondary diffusion layer.

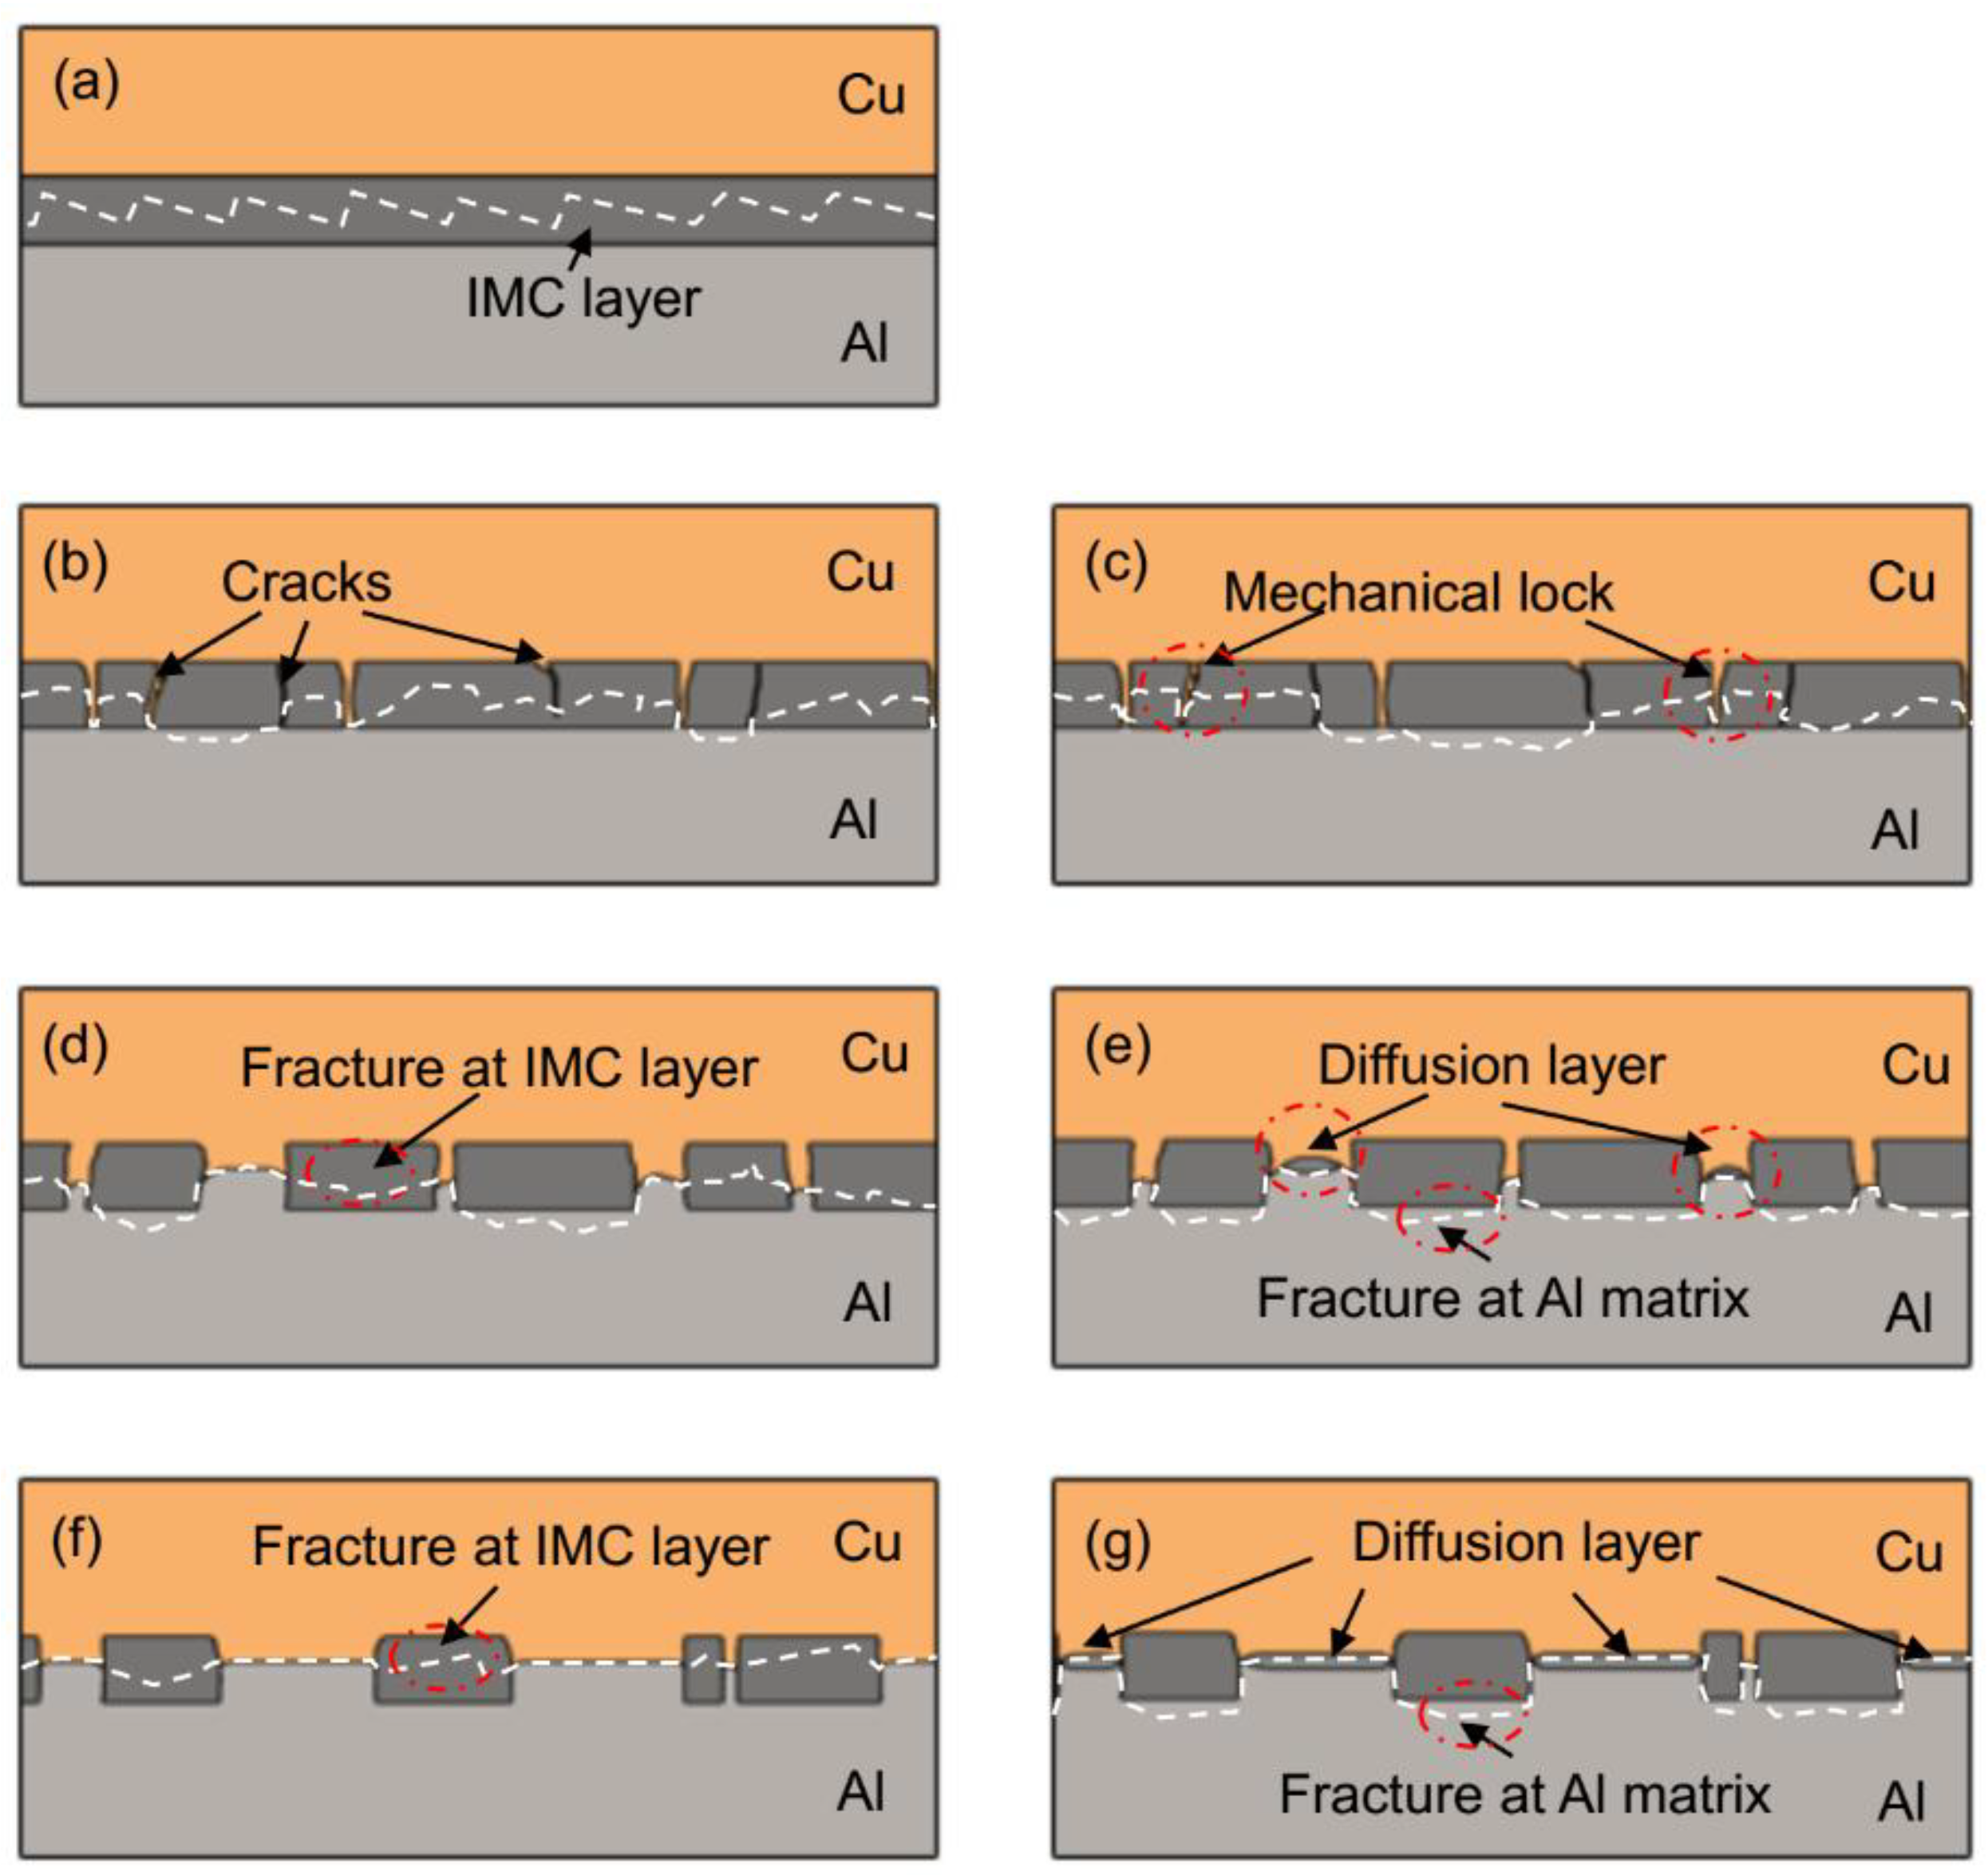
3.5. The Bonding Mechanism of the Cu/Al Clad Sheets

Figure 12 shows the statistical results of the areas’ percentage of the residual Al on the Cu side and exposed Al on the Al side with the clad sheet thickness reduction. These two area percentages are basically consistent except for the result of “7 mm with annealing”. This is mainly due to the accumulation of the characteristic area and the statistical peeled surface is too small. The results further indicate that both residual Al and exposed Al were caused by the fracture of Al matrix. Similarly, the fracture morphology of the IMC layer on the sides of Cu and Al were caused by the fracture of the primary diffusion layers.
The schematic diagram (Figure 13) of the bonding mechanism in the Cu/Al clad sheets subjected to rolling and annealing processes was used to further analyze the relationship between the fracture modes and peel strength. The white dashed lines represent peeling crack lines in the clad sheet that form during the peeling process. The IMC layers cracked and broke under the rolling force after the first rolling pass. Cu and Al were extruded into the broken region of the IMC layer. The extruded Cu and Al can change the propagation path of the peeling crack. On one hand, this structure led to the propagation path of the peeling crack. On the other hand, the cracking surface of the primary diffusion layer interacted with the extruded matrix metals and impeded their movement. Thus, the mechanical locking force formed. The strength of the mechanical locking force is directly related to the number and shape of cracks of the primary diffusion layer. The increasing of the crack number can enhance the mechanical locking force [13]. As the rolling pass number increases, the crack width of the IMC layer increased and the number of IMC particles per unit length decreased (Table 3). The mechanical locking strength diminished with the increase of the rolling pass number. The peel strength of the clad sheet was gradually reduced. For the clad sheet rolled to 3 mm, the total reduction was above the threshold, which can form the mechanical biting force. Then two metals extruded and nested each other under a rolling force, which can make them interact and hinder separation. It can be found that residual Al was observed on the Cu side of the Cu/Al direct contact region. The mechanical biting force can enhance the bond strength of the clad sheet [14]. However, it is still a mechanical bonding and there is no large area of bonding on an atomic scale. Therefore, this bonding form is not very strong with more interface defects.
For the clad sheet after multi-pass rolling, some peeling cracks are propagated in the Al matrix. During the peeling process, some Al matrix deformed and fractured (Figure 14). The deformation of the Al matrix increased the propagation path of the peeling crack. The fracture of the Al matrix needs to overcome the interaction force of Al atoms. Therefore, compared with the fracture characteristics in the IMC layer, the fracture morphology of the Al matrix can be regarded as the reinforcement for the bonding strength of the clad sheet.
The improvement in the clad sheet peel strength was due to the following three factors: (1) mechanical locking formed in the Cu/Al direct contact region after rolling (Figure 15), (2) fracture of the Al matrix (Figure 16), and (3) mechanical biting from the Cu/Al direct contact region (Figure 17).
After annealing, the thickness of the primary diffusion layer slightly increased. The interface was still composed of three types of IMC layers. Studies have shown that some micro cracks and holes in the interface can be repaired by diffusion during the annealing process [14]. In addition, the annealing process can reduce the residual stress at the interface [23], which improves the integrity of the IMC layer. The bonding force between the extruded metals and cracking surface of the primary diffusion layer can enhance by thermal diffusion, which further increases the mechanical locking force. When the clad sheet thickness was rolled to 5 mm and 3 mm, the peeling cracks tended to bypass the IMC layer and propagated in the Al matrix (Figure 13). Therefore, the peel strength increased when compared with that of unannealed clad sheets. A secondary diffusion layer can form in the Cu/Al direct contact region during the annealing process. The morphology of the secondary diffusion layer is directly related to the width of the Cu/Al direct contact region. After one or two rolling passes, it is difficult to find the secondary diffusion layer. The crack broke along the contact zone of Cu and Al. When the rolling pass number increased to three, some small diffusion layers formed at the center of the Cu/Al direct contact region. The length and thickness of the secondary diffusion layer increased with the increase of a rolling pass number. The crack propagated along the boundary between the diffusion layer and the Al matrix. When the rolling thickness was 3 mm, a diffusion layer of uniform thickness formed in the Cu/Al direct contact region. Afterward, the crack broke along the diffusion layer, which was similar to the fracture of the as-cast clad sheet. Thus, the annealing process influences the morphology of the primary diffusion layer and the secondary diffusion layer, which affects the bonding strength of the Cu/Al clad sheet.

4. Conclusions

In this study, the Cu/Al clad sheets were produced on a horizontal twin-roll caster and then were multi-pass rolled and annealed. The effects of the rolling and annealing process on the interface and peel strength of the Cu/Al clad sheets were investigated. The important conclusions of the study are below:
(1)
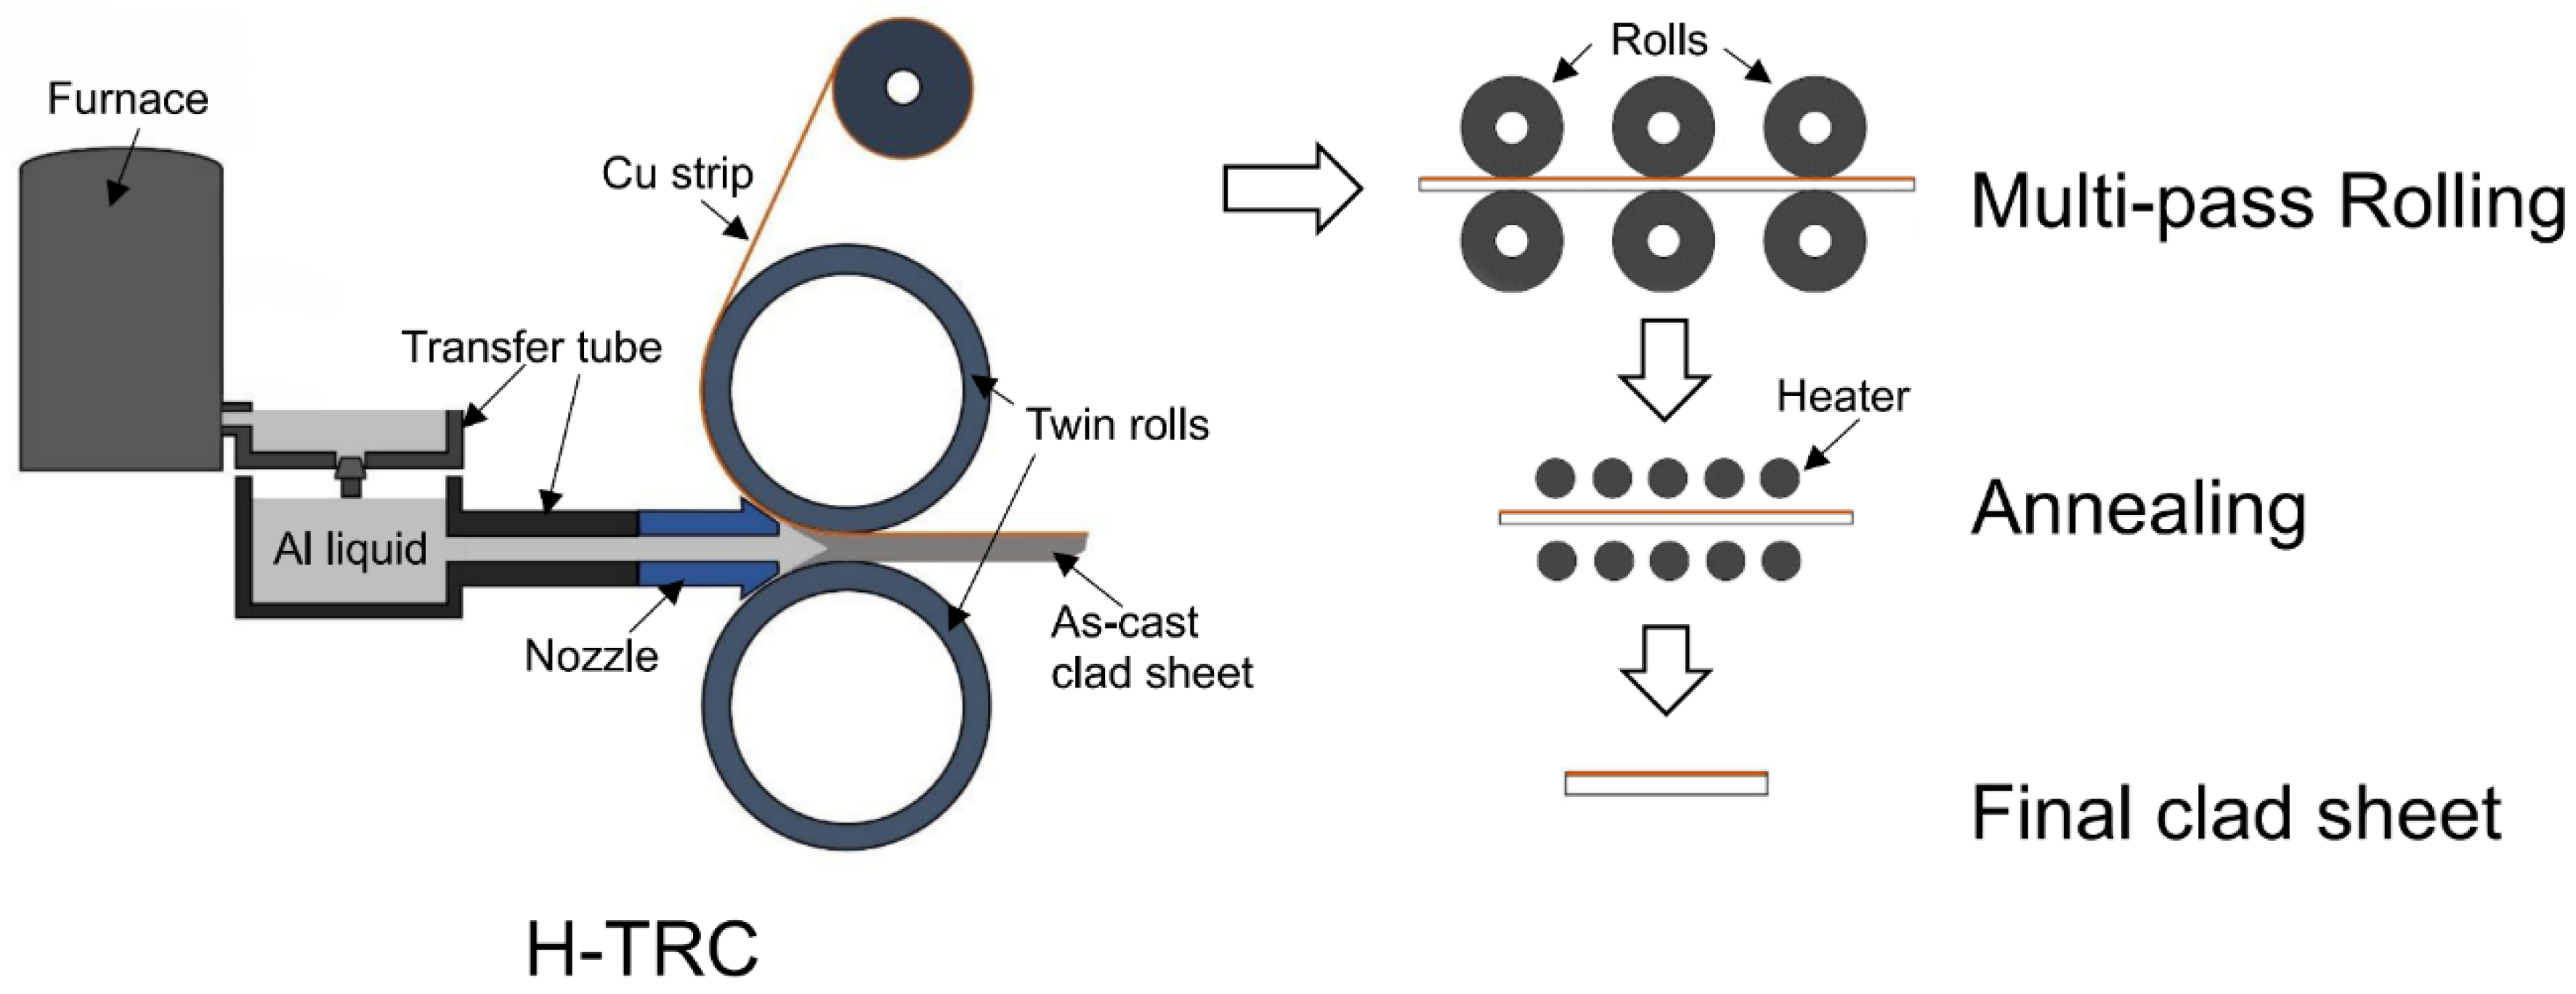
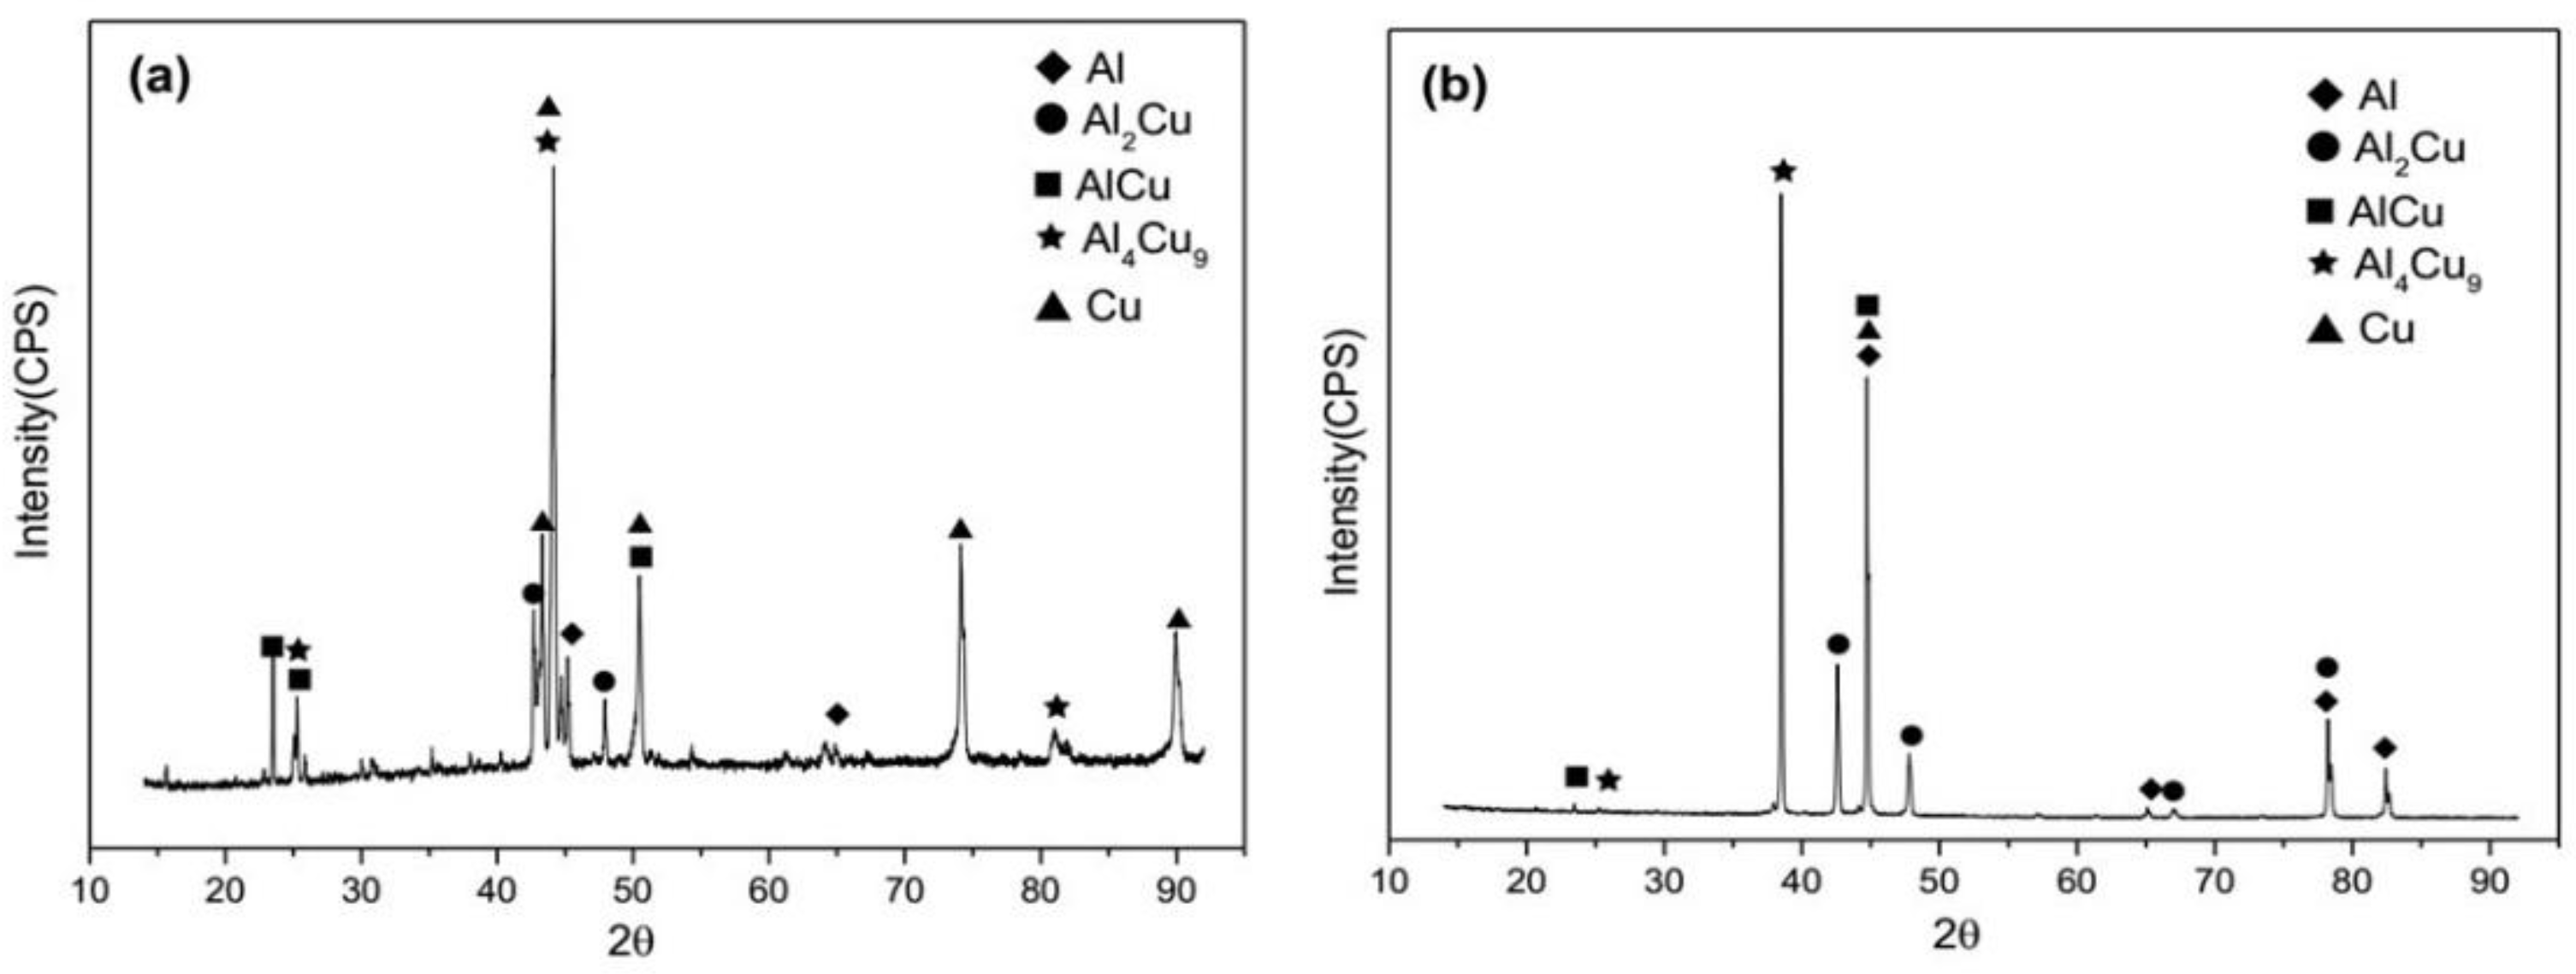
The Cu/Al clad sheets were produced with a horizontal twin-roll caster. The interface thickness of the as-cast Cu/Al clad sheet reached 9 μm to 10 μm and the interface was composed of three IMC layers including Al2Cu, AlCu, and Al4Cu9.
(2)
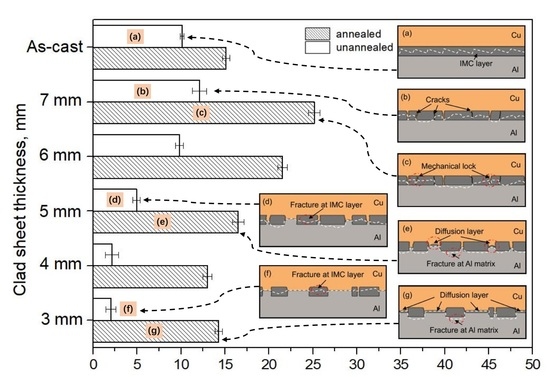
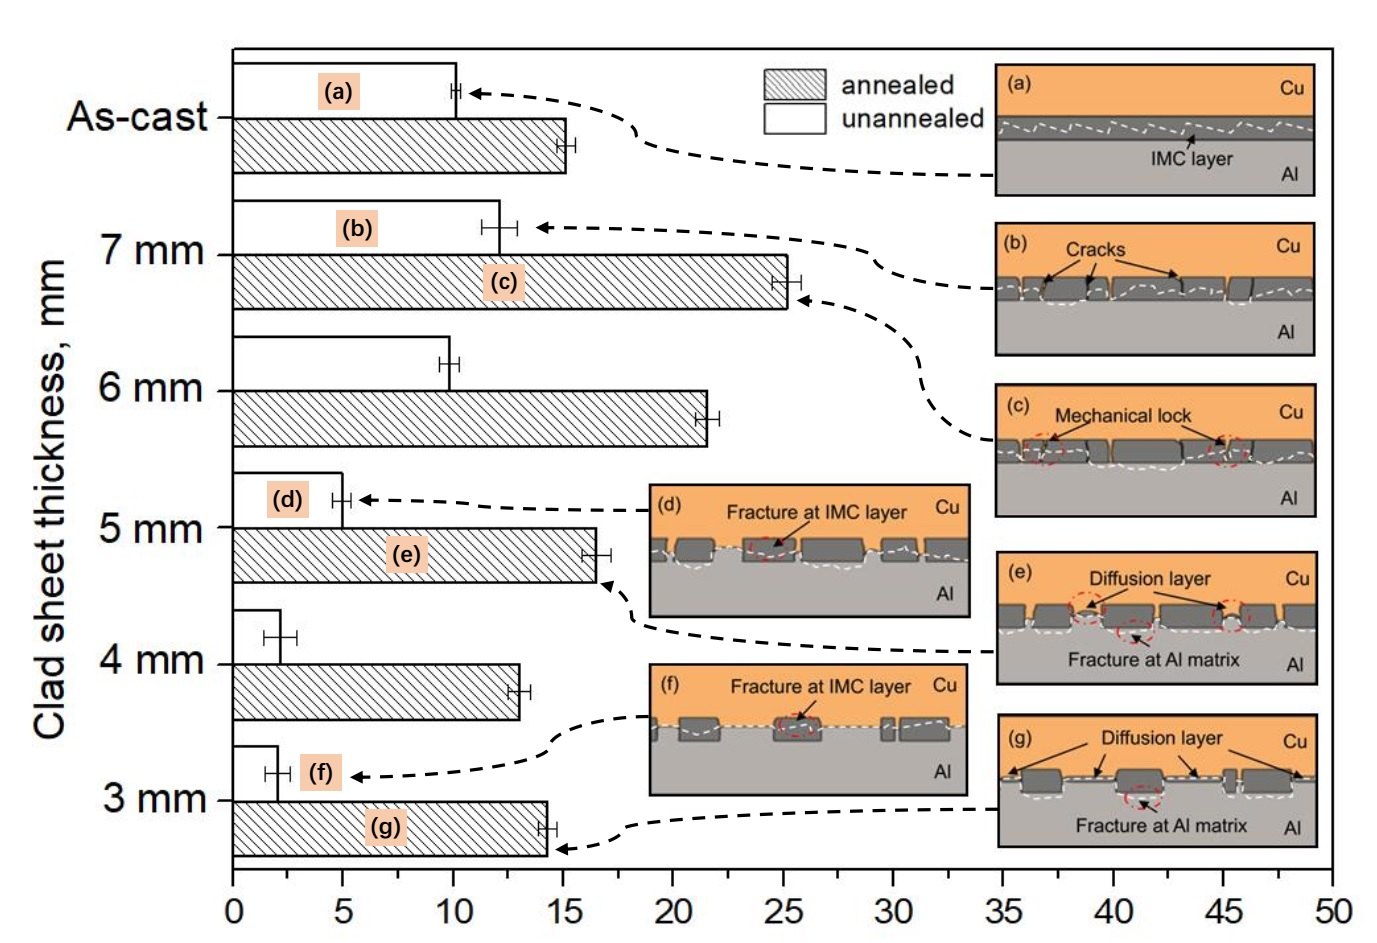
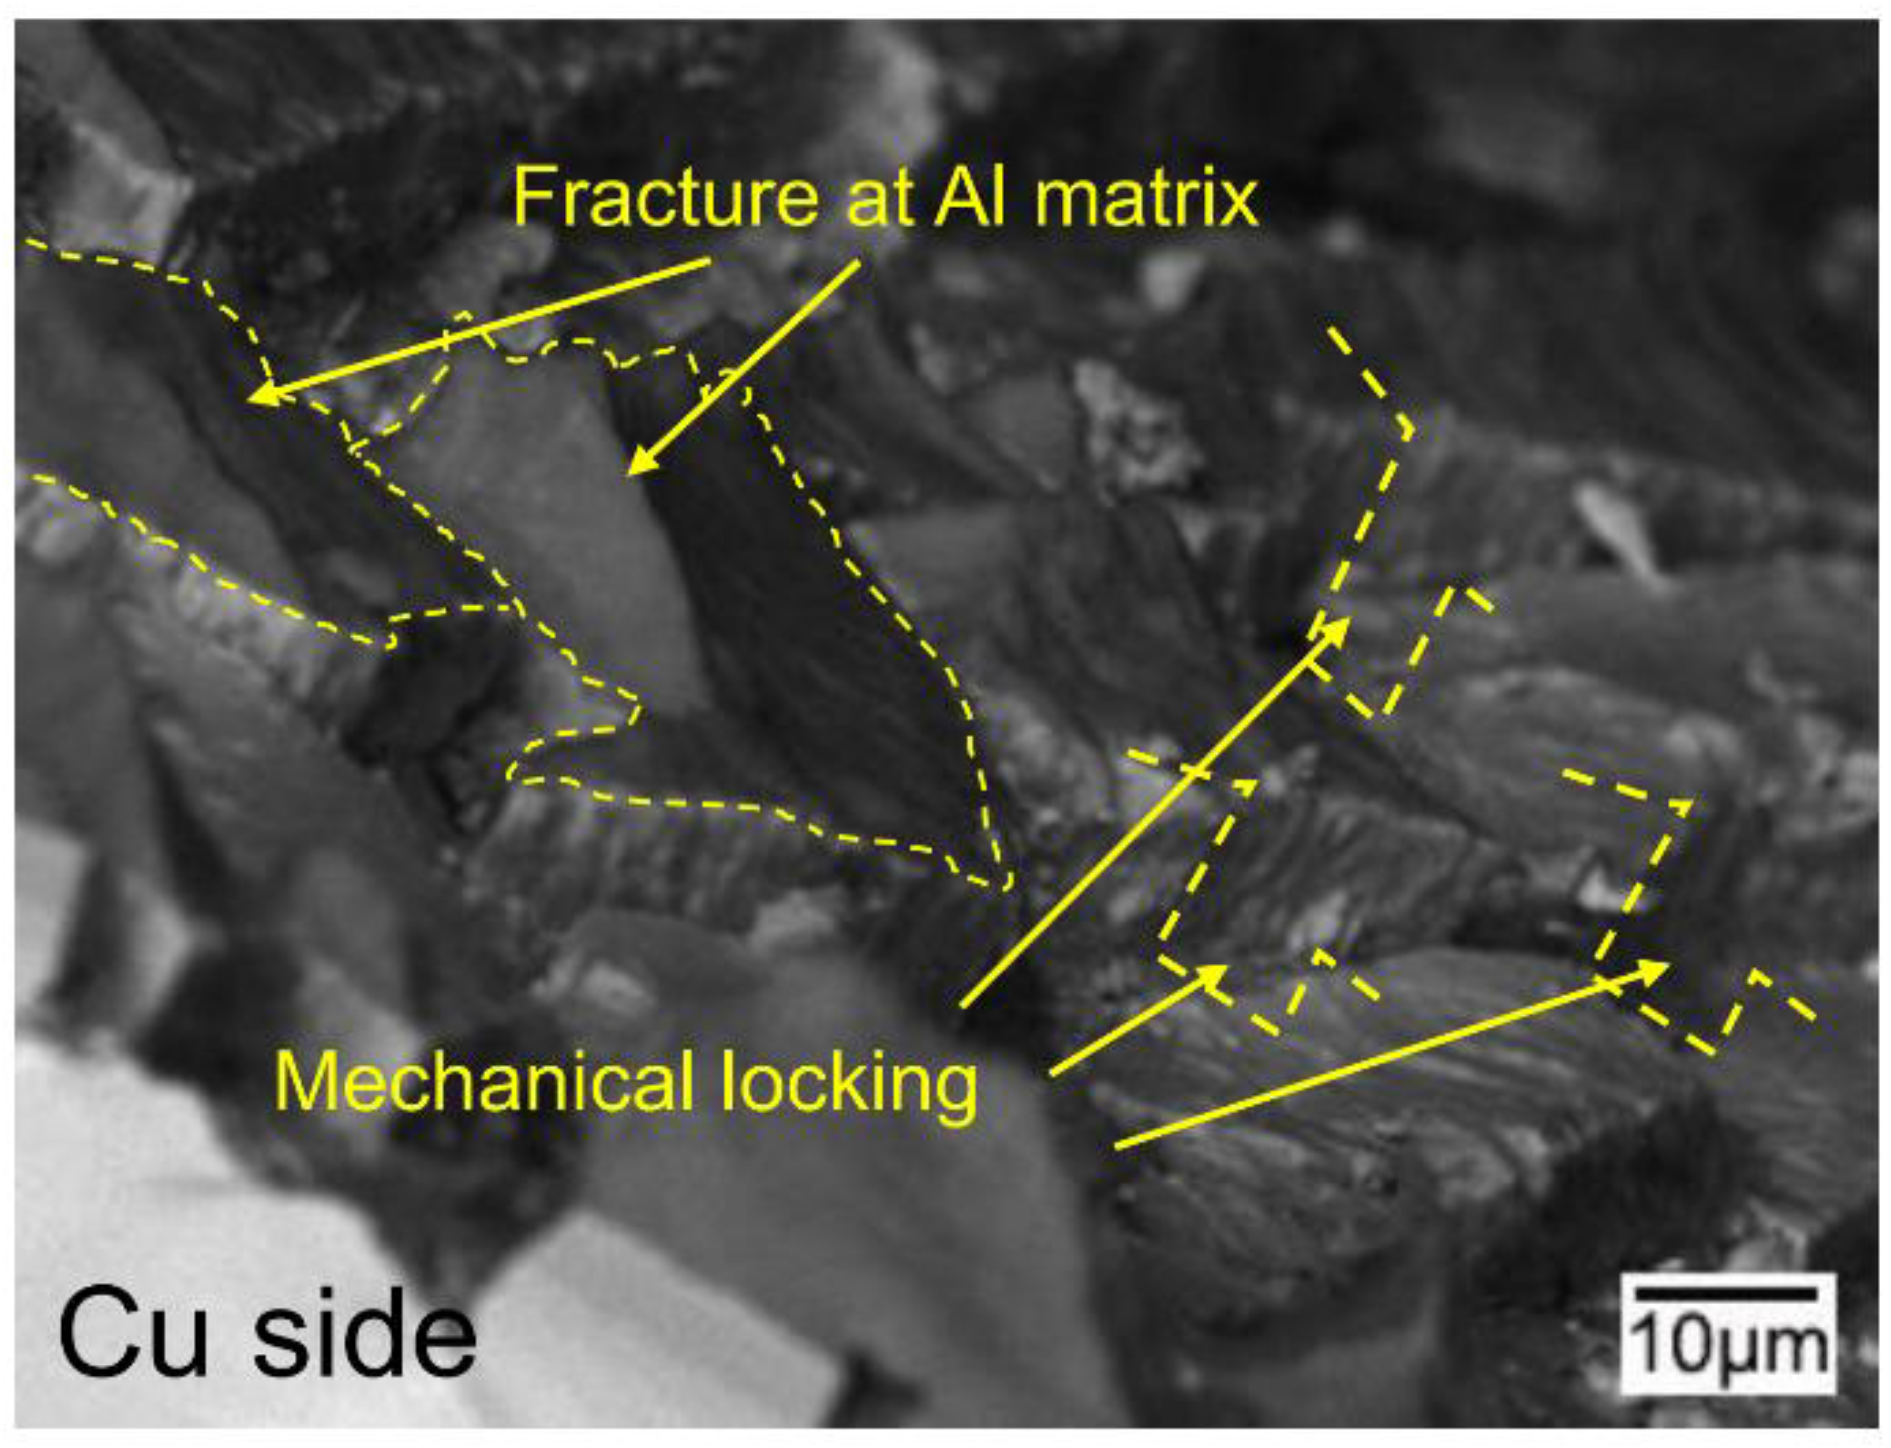
During multi-pass rolling, the peel strength first slightly increased and then gradually decreased with the increase of the rolling pass number. The IMC layer was broken and became increasingly separated with the increase of the rolling pass number. Mechanical locking formed in the broken region of the IMC layer. The mechanical locking resisted crack propagation and enhanced the peel strength, but the effect of this locking diminished with the increase of the rolling pass number.
(3)
During annealing, the bonding force between the extruded metals and cracking surface of the primary diffusion layer can enhance by thermal diffusion. Therefore, this leads to further increasing of the mechanical locking force. Meanwhile, the integrity of the IMC layer was improved, which propagates more peeling cracks in the Al matrix. The second diffusion layer can form at the Cu/Al direct contact region. All these effects of annealing improved the interfacial microstructure and enhanced the bonding strength of clad sheets. After rolling to 7 mm and annealing at 350 °C for 2 h, the clad sheet had the highest APS of 25 N/mm. This process can be used as the method to improve the peel strength of the Cu/Al clad sheets.
(4)
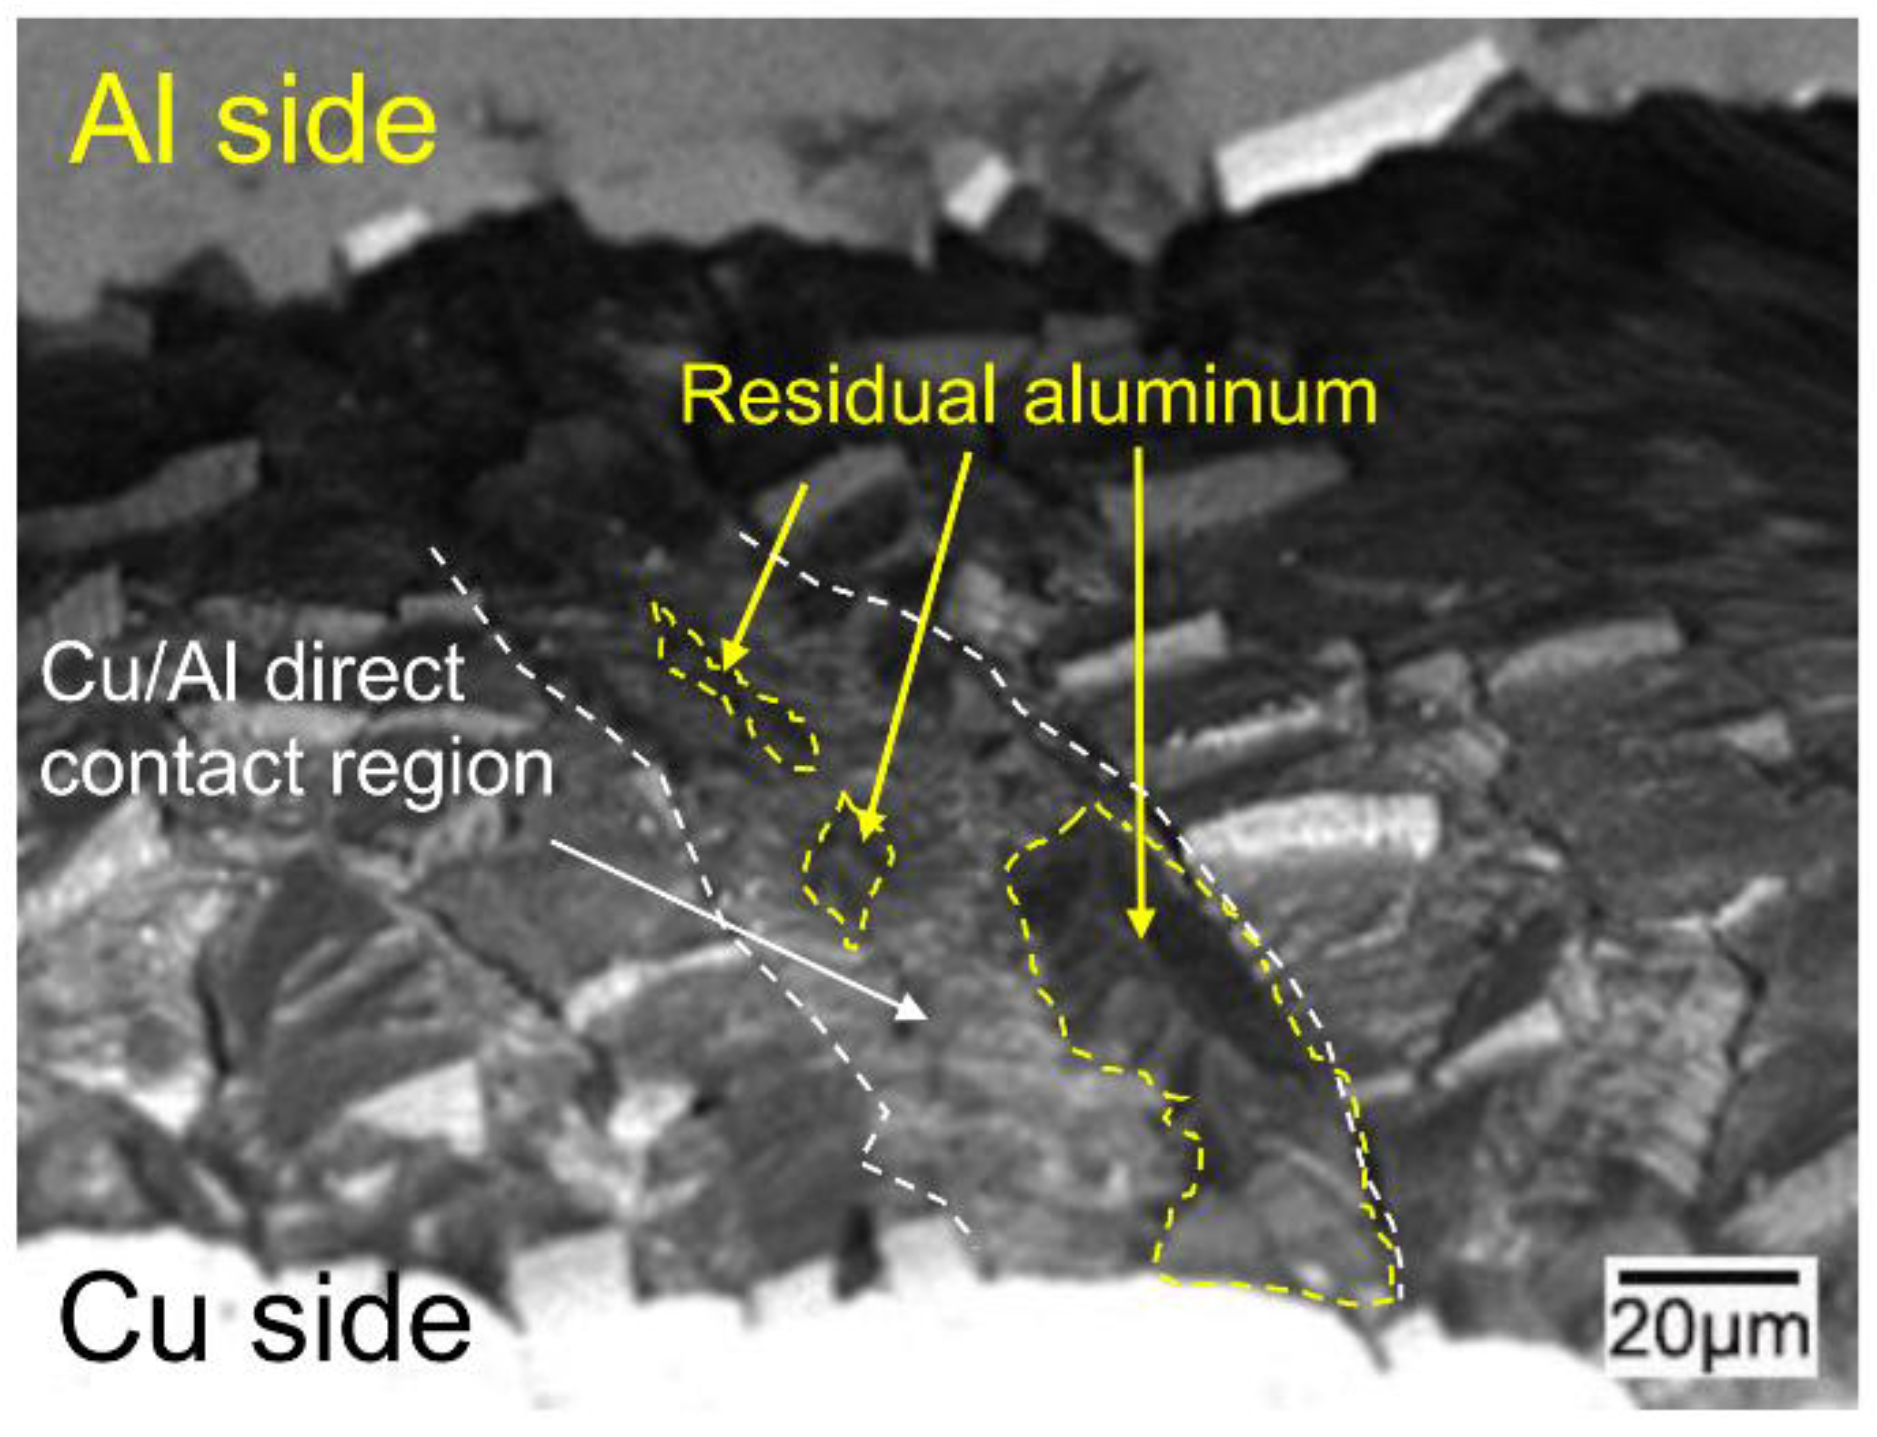
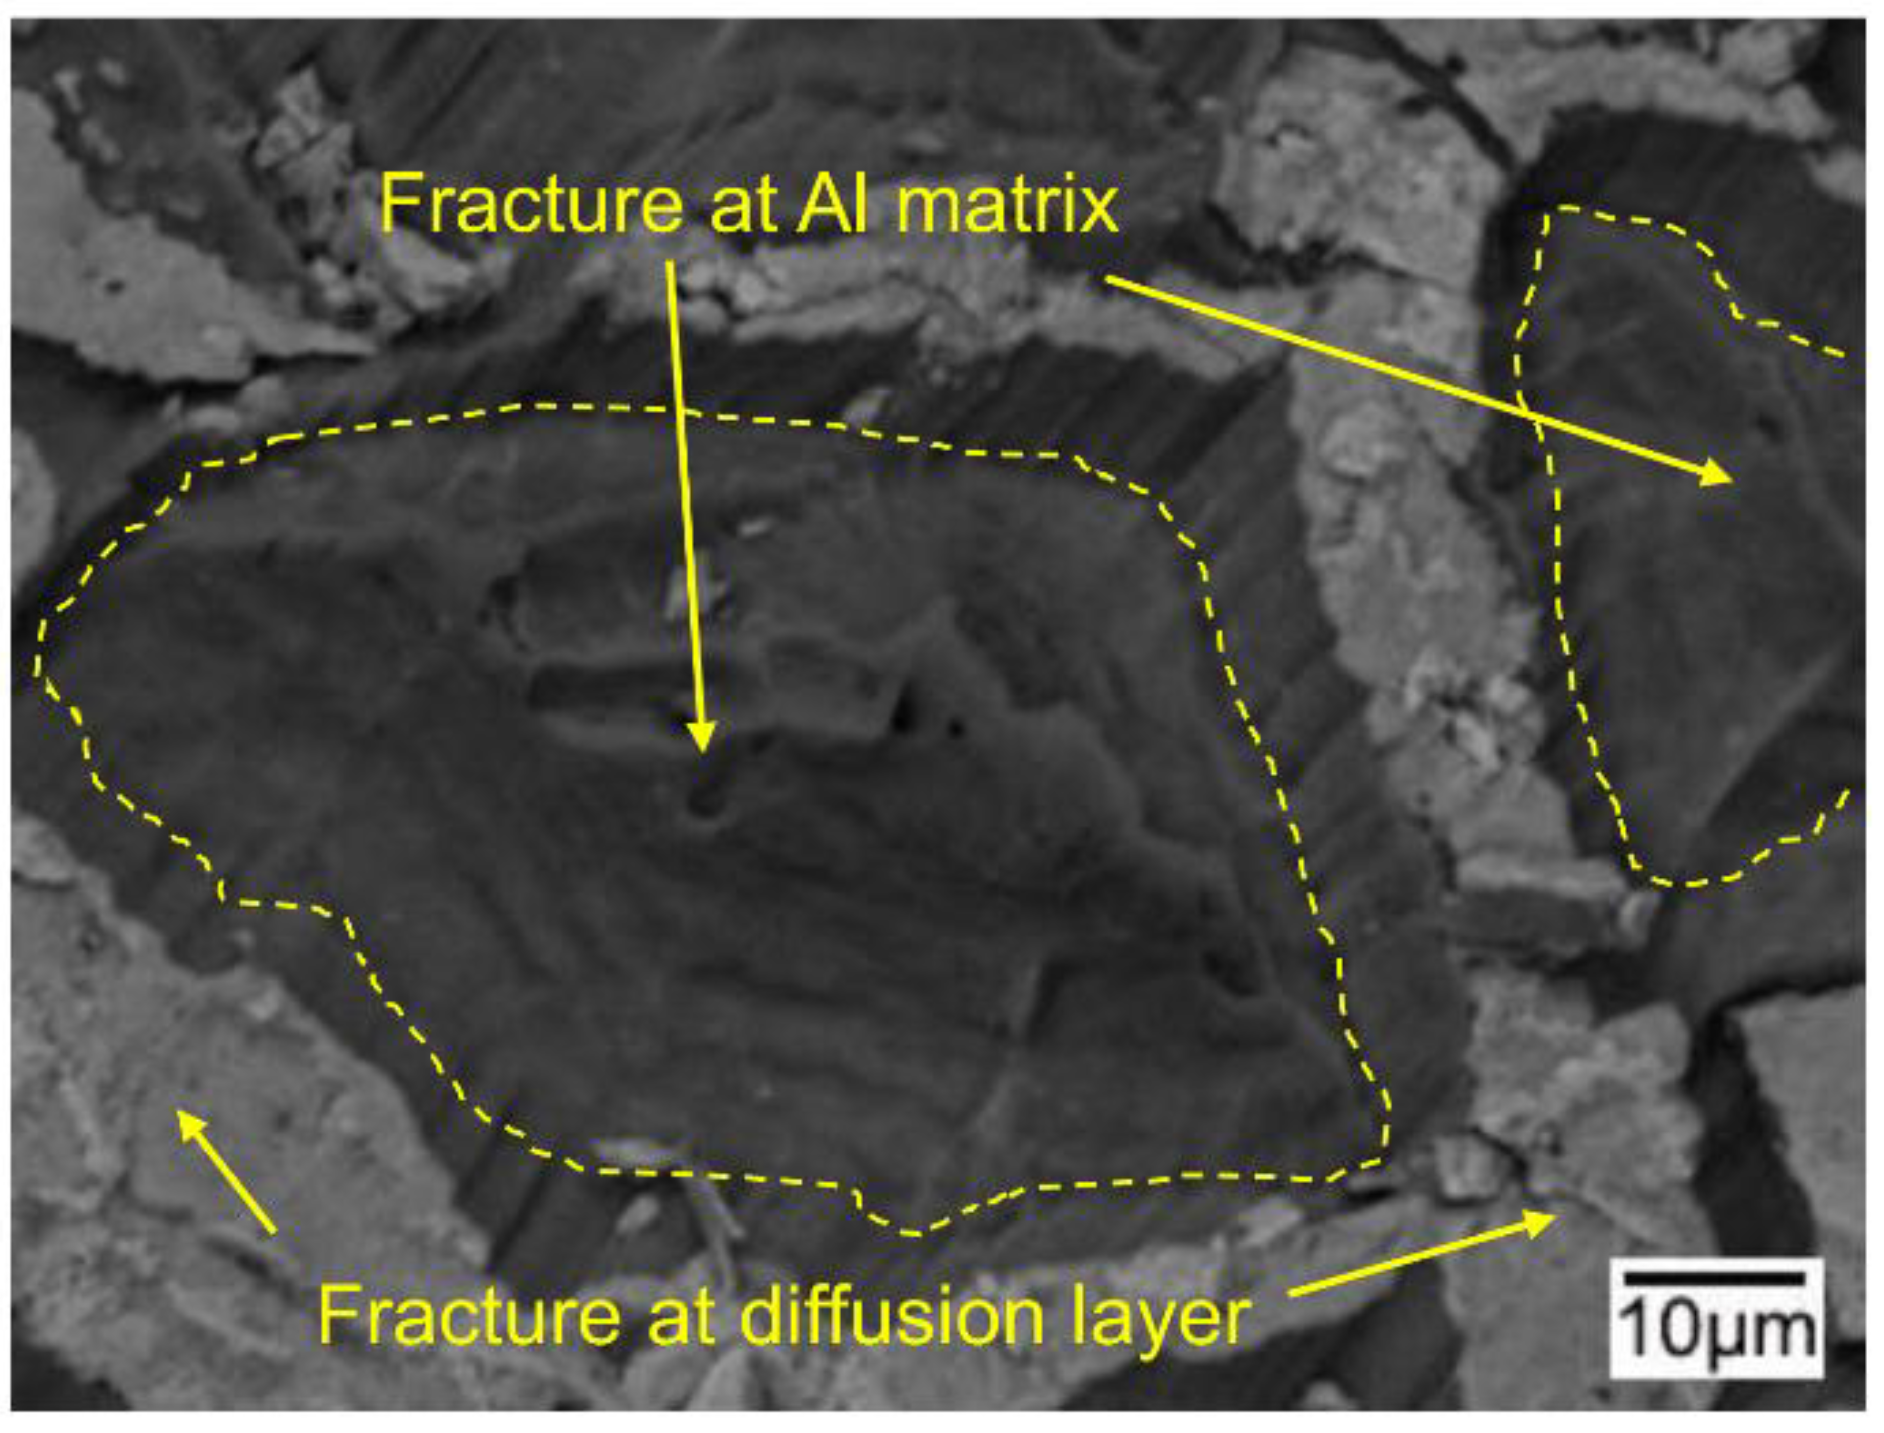
The improvement in the peel strength is mainly based on the following three factors: mechanical locking formed in the Cu/Al direct contact region after rolling, fracture occurred in the Al matrix, and a mechanical biting occurred from the Cu/Al direct contact region. These strengthening mechanisms of the clad sheets with a hard interface layer should be considered during the rolling and annealing processes in future applications.

Author Contributions

Conceptualization, Z.M. and J.X. Data curation, Z.M. Formal analysis, Z.M. Funding acquisition, J.X. Investigation, Z.M., J.X., A.W., W.W., and D.M. Methodology, W.W. Writing–original draft, Z.M. Writing–review & editing, J.X. and A.W.

Funding

This research was funded by the National Natural Science Foundation of China (grant No. U1604251).

Conflicts of Interest

The authors declare no conflict of interest.

References

  1. Mai, T.A.; Spowage, A.C. Characterization of dissimilar joints in laser welding of steel-kovar, copper–steel and copper–aluminum. Mater. Sci. Eng. A. 2004, 374, 224–233. [Google Scholar] [CrossRef]
  2. Tseng, H.C.; Hung, C.H.; Huang, C.C. An analysis of the formability of aluminum/copper clad metals with different thicknesses by the finite element method and experiment. Int. J. Adv. Manuf. Technol. 2010, 49, 1029–1036. [Google Scholar] [CrossRef]
  3. Eslami, P.; Karimi Taheri, A. An investigation on diffusion bonding of aluminum to copper using equal channel angular extrusion process. Mater. Lett. 2011, 65, 1862–1864. [Google Scholar] [CrossRef] [PubMed]
  4. Sheng, L.Y.; Yang, F.; Xi, T.F.; Lai, C.; Ye, H.Q. Influence of heat treatment on interface of Cu/Al bimetal composite fabricated by cold rolling. Compos. Part B Eng. 2011, 42, 1468–1473. [Google Scholar] [CrossRef]
  5. Xia, H.B.; Wang, S.G.; Ben, H.F. Microstructure and mechanical properties of Ti/Al explosive cladding. Mater. Des. 2014, 56, 1014–1019. [Google Scholar] [CrossRef]
  6. Liu, T.; Wang, Q.D.; Sui, Y.D.; Wang, Q.G. Microstructure and Mechanical Properties of Overcast 6101–6101 Wrought Al Alloy Joint by Squeeze Casting. J. Mater. Sci. Technol. 2015, 32, 298–304. [Google Scholar] [CrossRef]
  7. Loureiro, A.; Verdera, D.; Gesto, D.; Rodrigues, D.M. Influence of Tool Offsetting on the Structure and Morphology of Dissimilar Aluminum to Copper Friction-Stir Welds. Metall. Mater. Trans. A. 2012, 43, 5096–5105. [Google Scholar] [CrossRef]
  8. Barekar, N.S.; Dhindaw, B.K. Twin-roll casting of Aluminum alloys—An overview. Mater. Manuf. Process. 2014, 29, 651–661. [Google Scholar] [CrossRef]
  9. Bae, J.H.; Prasada Rao, A.K.; Kim, K.H.; Kim, N.J. Cladding of Mg alloy with Al by twin-roll casting. Scr. Mater. 2011, 64, 836–839. [Google Scholar] [CrossRef]
  10. Grydin, O.; Gerstein, G.; Nürnberger, F.; Schaper, M.; Danchenko, V. Twin-roll casting of aluminum–steel clad strips. J. Manuf. Process. 2013, 15, 501–507. [Google Scholar] [CrossRef]
  11. Huang, H.G.; Dong, Y.K.; Yang, M.; Du, F.S. Evolution of bonding interface in solid-liquid cast-rolling bonding of Cu/Al clad strip. Trans. Nonferrous Met. Soc. China 2017, 27, 1019–1025. [Google Scholar] [CrossRef]
  12. Chen, C.Y.; Chen, H.L.; Hwang, W.S. Influence of interfacial structure development on the fracture mechanism and bond strength of aluminum/copper bimetal plate. Mater. Trans. 2006, 47, 1232–1239. [Google Scholar] [CrossRef]
  13. Wu, B.; Li, L.; Xia, C.D.; Guo, X.F.; Zhou, D.J. Effect of surface nitridingtreatment in a steel plate on the interfacial bonding strength of the aluminum/steel clad sheets by the cold roll bonding process. Mater. Sci. Eng. A. 2017, 682, 270–278. [Google Scholar] [CrossRef]
  14. Jing, Y.A.; Qin, Y.; Zang, X.M.; Li, Y.H. The bonding properties and interfacial morphologies of clad plate prepared by multiple passes hot rolling in a protective atmosphere. J. Mater. Process. Technol. 2014, 214, 1686–1695. [Google Scholar] [CrossRef]
  15. Li, X.B.; Zu, G.Y.; Ding, M.M.; Mu, Y.L.; Wang, P. Interfacial microstructure and mechanical properties of Cu/Al clad sheet fabricated by asymmetrical roll bonding and annealing. Mater. Sci. Eng. A. 2011, 529, 485–491. [Google Scholar] [CrossRef]
  16. Macwan, A.; Jiang, X.Q.; Li, C.; Chen, D.L. Effect of annealing on interface microstructures and tensile properties of rolled Al/Mg/Al tri-layer clad sheets. Mater. Sci. Eng. A. 2013, 587, 344–351. [Google Scholar] [CrossRef]
  17. Chen, G.; Li, J.T.; Yu, H.L.; Su, L.H.; Xu, G.M.; Pan, J.S.; You, T.; Zhang, G.; Sun, K.M.; He, L.Z. Investigation on bonding strength of steel/aluminum clad sheet processed by horizontal twin-roll casting annealing and cold rolling. Mater. Des. 2016, 112, 263–274. [Google Scholar] [CrossRef]
  18. Chen, C.Y.; Hwang, W.S. Effect of annealing on the interfacial structure of Aluminum-Copper joints. Mater. Trans. 2007, 48, 1938–1947. [Google Scholar] [CrossRef]
  19. Pelzer, R.; Nelhiebel, M.; Zink, R.; Wöhlert, S.; Lassnig, A.; Khatibi, G. High temperature storage reliability investigation of the Al-Cu wire bond interface. Microelectron. Reliab. 2012, 52, 1966–1970. [Google Scholar] [CrossRef]
  20. Tanaka, Y.; Kajihara, M.; Watanabe, Y. Growth behavior of compound layers during reactive diffusion between solid Cu and liquid Al. Mater. Sci. Eng. A 2007, 445–446, 355–363. [Google Scholar] [CrossRef]
  21. Peng, X.K.; Wuhrer, R.; Heness, G.; Yeung, W.Y. Rolling strain effects on the interlaminar properties of roll bonded copper/aluminium metal laminates. J. Mater. Sci. 2000, 35, 4357–4363. [Google Scholar] [CrossRef]
  22. Hannech, E.B.; Lamoudi, N.; Benslim, N.; Makhloufi, B. Intermetallic formation in the aluminum–copper system. Surf. Rev. Lett. 2003, 10, 677–683. [Google Scholar] [CrossRef]
  23. Danesh Manesh, H.; Karimi Taheri, A. The effect of annealing treatment on mechanical properties of aluminum clad steel sheet. Mater. Des. 2003, 24, 617–622. [Google Scholar] [CrossRef]
Figure 1. Schematic illustration of the fabrication process for Cu/Al clad sheet.
Metals 08 00645 g001
Figure 2. Test specimen and method of peel testing the clad sheets.
Metals 08 00645 g002
Figure 3. Microstructure (BSE image) of the as-cast Cu/Al clad sheet interface.
Metals 08 00645 g003
Figure 4. XRD pattern of the peeled surface for the as-cast Cu/Al clad sheet: (a) Cu side and (b) Al side.
Metals 08 00645 g004
Figure 5. Interfacial microstructure of the Cu/Al clad sheets with different thicknesses after multi-pass rolling (left side) and annealing (right side).
Metals 08 00645 g005
Figure 6. Microstructure (BSE image) of the Cu/Al clad sheet interface after multi-pass rolling and annealing (clad sheet thickness: 4 mm).
Metals 08 00645 g006
Figure 7. The average peel strength of the Cu/Al clad sheets under different conditions: H-TRC, multi-pass rolling, and annealing.
Metals 08 00645 g007
Figure 8. Peeled surface morphology (BSE image) and EDS results of the as-cast Cu/Al clad sheet: (a) Cu side and (b) Al side.
Metals 08 00645 g008
Figure 9. Peeled surface morphology (BSE image) of the Cu/Al clad sheets after multi-pass rolling with thicknesses of 7 mm (a,b), 5 mm (c,d) and 3 mm (e,f). (a,c,e: Cu side; b,d,f: Al side).
Metals 08 00645 g009
Figure 10. Peeling surface morphology (BSE image) of the Cu/Al clad sheet with a thickness of 5 mm after multi-pass rolling (Cu side).
Metals 08 00645 g010
Figure 11. Peeled surface morphology (BSE image) of the Cu/Al clad sheets with thicknesses of 7 mm after multi-pass rolling and annealing (a,b), 5 mm (c,d) and 3 mm (e,f). (a,c,e: Cu side; b,d,f: Al side).
Metals 08 00645 g011
Figure 12. Areas percentage of the residual Al on the Cu side and exposed Al on the Al side with the clad sheet thickness reduction.
Metals 08 00645 g012
Figure 13. The schematic diagram of the bonding mechanism of Cu/Al clad sheets for rolling and annealing processes. (a) as-cast, (b) thickness of 7 mm after rolling, (c) thickness of 7 mm after rolling and annealing, (d) thickness of 5 mm after rolling, (e) thickness of 5 mm after rolling and annealing, (f) thickness of 3 mm after rolling, and (g) thickness of 3 mm after rolling and annealing.
Metals 08 00645 g013
Figure 14. The cross section image (BSE image) of the fractured clad sheet with the rolled thickness of 5 mm.
Metals 08 00645 g014
Figure 15. Peeled surface morphology (BSE image) of the Cu/Al clad sheet with a thickness of 7 mm after multi-pass rolling (Cu side).
Metals 08 00645 g015
Figure 16. Peeled surface morphology (BSE image) of the Cu/Al clad sheet with a thickness of 3 mm after multi-pass rolling (Cu side).
Metals 08 00645 g016
Figure 17. Peeled surface morphology (BSE image) of the Cu/Al clad sheet with a thickness of 3 mm after multi-pass rolling and annealing (Al side).
Metals 08 00645 g017
Table 1. The rolling pass number, the reduction per pass, and the clad sheet thickness in the multi-pass rolling process.
Rolling Pass NumberReduction Per Pass (%)Total Reduction (%)Clad Sheet Thickness (mm)
112.512.57
214.3256
316.737.55
420504
52562.53
Table 2. The EDS results of the BSE image in Figure 3.
Element1 (at.%)2 (at.%)3 (at.%)
Cu62.5043.2931.67
Al37.5056.7168.33
Probable PhaseAl4Cu9AlCuAl2Cu
Table 3. Ratio of Cu/Al direct contact region to the interface layer, average width of Cu/Al direct contact region, and the number of Cu/Al direct contact region per millimeter with different thicknesses of the clad sheets.
Thickness of the Clad Sheets (mm)Ratio of Cu/Al Direct Contact Region to the Interface Layer (%)Average Width of Cu/Al Direct Contact Region (μm)The Number of Cu/Al Direct Contact Region Per Millimeter
719.127.233826
627.1210.86525
537.6815.1025
451.2526.8619
356.1827.5020
Table 4. The EDS results for the peeled surfaces in Figure 8.
Element1 (at.%)2 (at.%)3 (at.%)4 (at.%)
Cu29.4945.9229.7052.36
Al70.5154.0870.3047.64
PhaseAl2CuAlCuAl2CuAlCu
Table 5. Some characteristics of Cu, Al, Al4Cu9, AlCu, and Al2Cu.
PhaseCrystal StructureHardness/HV0.025
CuCubic (Fm3m, FCC)85–92
AlCubic (Fm3m, FCC)45–48
Al4Cu9Cubic (P43m)156
AlCuMonoclinic (C2/m)411
Al2CuTetragonal (I4/mcm)318
Table 6. The EDS results for the peeled surfaces in Figure 9 (at.%).
Elementa1a2a3a4b1b2b3b4
Cu01.5841.0527.9892.4701.2829.3352.4101.58
Al98.4258.9572.0207.5398.7270.6747.5998.42
PhaseAlAlCuAl2CuCuAlAl2CuAlCuAl
c1c2c3c4d1d2d3d4
Cu54.1330.3389.3901.2502.2429.4546.0101.18
Al45.8769.6710.6198.7597.7670.5553.9998.82
PhaseAlCuAl2CuCuAlAlAl2CuAlCuAl
e1e2e3e4f1f2f3
Cu02.2028.5193.7601.7700.6844.5928.43
Al97.8071.4906.2498.2399.3255.4171.57
PhaseAlAl2CuCuAlAlAlCuAl2Cu
Table 7. The EDS results of the peeled surfaces in Figure 11 (at.%).
Elementa1a2a3a4b1b2b3b4
Cu00.2051.4130.5890.7200.2707.9226.7952.37
Al99.8048.5969.4209.2899.7392.0873.2147.63
PhaseAlAlCuAl2CuCuAlAlAl2CuAlCu
c1c2c3d1d2d3
Cu01.4891.7528.3403.1252.6928.72
Al98.5208.2571.6696.8847.3171.28
PhaseAlCuAl2CuAlAlCuAl2Cu
e1e2e3f1f2f3
Cu00.7429.4923.5930.3729.5700.91
Al99.2670.5176.4169.6370.4399.09
PhaseAlAl2CuAl2CuAl2CuAl2CuAl

