Pattern Deep Region Learning for Crack Detection in Thermography Diagnosis System
by
 ,
,
Jue Hu
1,†, 
Weiping Xu
1,†,
Bin Gao
1,*,
Gui Yun Tian
1,2,
Yizhe Wang
1,3,
Yingchun Wu
1,
Ying Yin
4 and
Juan Chen
4 1
School of Automation, University of Electronic Science and Technology of China, Chengdu 611731, China
2
School of Electrical and Electronic Engineering, Newcastle University, Newcastle NE1 7RU, UK
3
Department of Electrical and Computer Engineering, Laval University, Quebec City, QC G1V 0A6, Canada
4
Sichuan Special Equipment Inspection Institute, Chengdu 611731, China
*
Author to whom correspondence should be addressed.
†
Jue Hu and Weiping Xu contributed equally to this work.
Metals 2018, 8(8), 612; https://doi.org/10.3390/met8080612
Submission received: 25 June 2018
/
Revised: 1 August 2018
/
Accepted: 1 August 2018
/
Published: 6 August 2018
(This article belongs to the Special Issue Thermal Methods for Damage Evaluation of Metallic Materials)
Abstract
:Eddy Current Pulsed Thermography is a crucial non-destructive testing technology which has a rapidly increasing range of applications for crack detection on metals. Although the unsupervised learning method has been widely adopted in thermal sequences processing, the research on supervised learning in crack detection remains unexplored. In this paper, we propose an end-to-end pattern, deep region learning structure to achieve precise crack detection and localization. The proposed structure integrates both time and spatial pattern mining for crack information with a deep region convolution neural network. Experiments on both artificial and natural cracks have shown attractive performance and verified the efficacy of the proposed structure.
1. Introduction
Non-destructive testing (NDT) plays an essential role in civil industry structures. It has the ability to evaluate the properties of a material, component or system without causing damage [1,2,3]. Stress concentration and surface cracks inevitably exist in mechanical infrastructure during the manufacturing and in-service processes. This leads to considerable hazards in industrial activities. Therefore, crack detection acts a pivotal part in NDT research field. Traditional techniques of crack detection include: Magnetic Particle Testing (MT), Penetrant Testing (PT) and electromagnetic methods [4]. MT is effective for crack detection on the surface and subsurface while its primary shortcomings are a complicated detecting procedure and pollution [2]. For a MT experiment, the surface of the sample requires pretreatment and the detection time is relatively long. Moreover, waste magnetic suspending liquid remains on the surface after the experiment, which causes chronic pollution. PT can detect open surface cracks [3,5]. Unfortunately, cladding material covering the surface of the sample adversely affects the detection rate. This leads to ineffective inspection of micro-cracks. Furthermore, the electromagnetic method has been widely used for the inspection of surface and subsurface flaws. Eddy Current Testing (ECT) is sensitive to surface cracks on ferromagnetic steel in a large range of frequency [6]. Alternating Current Field Measurement (ACFM) shows good performance in detecting surface breaking geometrical defects in any direction under the stimulation study [7]. In recent years, the infrared thermography (IT) based method has been widely used for composite crack detection and defect identification due to the rapid development of thermal imaging device. It has numerous promising merits [8,9,10,11] such as: Contactless, high sensitivity and rapid inspection over a large region.
Eddy Current Pulsed Thermography (ECPT) is a multi-physics coupling method. The combination of eddy currents heating up and thermal diffusion is conducive to detecting turbulence in conductive materials by analyzing the thermal patterns [12,13,14]. ECPT combines the advantages of pulsed eddy current (transient analysis and eddy current interpretation) and the merits of thermography (fast and high resolution), which has been widely used for damage detection in metallic alloys [15]. Recently, ECPT has been used in many defects detection applications such as crack detection of carbon fiber reinforced plastic materials, compressor blades, and fatigue cracks [16]. In addition, the relevant signal processing methods have been proposed in ECPT. The time to peak feature has been adopted for wall thinning assessment and inner defects characterization in ferromagnetic materials [15,17]. However, the transient response features are always susceptible to noise. To enhance the contrast between the defects and the noise, patterns-based processing methods have been proposed. These include: Principal Component Analysis (PCA), Independent Component Analysis (ICA) and sparse decomposition. PCA was used to extract orthogonal thermography features by compressing the initial video sequences instead of analyzing each image [18]. A method, based on ICA, was proposed to highlight the anomalous patterns of ECPT for cracks identification in metallic specimen [19]. To achieve automatic crack detection and identification for the experimental data from the ECPT system, a blind source separation algorithm was reported [20]. Methods based on sparse decomposition exhibited their robustness for both man-made specimens and samples with natural defects [21,22,23,24]. These methods assume that regions with defects are areas with the highest sparsity, while the low-rank matrix, which is considered as background, is separated to extract sparse components. Anomaly detection algorithms, developed for hyperspectral data, have been proven to detect both surface and subsurface cracks [25]. Meanwhile, methods inspired by the physical mechanism that cracks pixels own the strongest intensity are presented. The work puts forward a novel image segmentation algorithm based on the threshold calculated by first order statistical properties [26].
Since an unsupervised learning method has been widely adopted in thermal sequences processing, research on a task-driven structure, such as a supervised learning-based method, still remains unexplored due to insufficient training data. Recent works from object detection have shown that better performance can be obtained when supervised learning is associated with deep architecture for detection [27,28,29]. In addition, there exists works on data augment proposed solution to the lack of training data [30]. These works showed us that deep architecture is a potential candidate for crack detection in thermography NDT. In this study, a task-driven pattern deep region learning structure for crack detection and localization is proposed. In connecting to the characteristic of the electromagnetic thermography for defects, both time and spatial pattern maps are deep mined through principle component analysis and a deep convolution neural network with ROI determination. The proposed method enhances the accuracy of detectability and achieves precise crack localization. In contrast to the unsupervised method, which has been widely exploited, the proposed method has shown an exceptional capability on micro-cracks detection. It provides a potential capability to achieve automatic micro-cracks detection.
2. Materials and Methods
2.1. Introduction of ECPT System
Figure 1 shows the diagram of the ECPT NDT&E system. According to the theory of the electromagnetic induction, the induced eddy current is excited in the conductor by an alternating current, which is driven into the induction coil. When the eddy current encounters a defect, it is forced to bypass the defect, which results in the eddy current density increasing or decreasing on the defect region. Thus, the heat generated in the conductor will appear in a heterogeneous distribution, and the distribution of the surface temperature is recorded by infrared camera.
This diagram contains the system integration and data flowing between different modules.
Using Joule’s law to couple the eddy current field and the temperature field [4], the heating power (internal heat source density or intensity) generated by the induced eddy current in the specimen is denoted as , namely:
Current density is proportional to the electric field intensity vector . is dependent on temperature. is the conductivity at the reference temperature . refers to the temperature coefficient of resistivity, which describes how resistivity varies with temperature. In general, by taking account of heat diffusion and Joule heating, the heat conduction equation of a specimen can be expressed as:
where is the temperature distribution; (W/m K) denotes the thermal conductivity of the material (which is dependent on temperature); is the density (kg/m3); is specific heat (J/kg K); and denotes the internal heat generation function per unit volume, which is the result of the eddy current excitation. From the above analysis, it is apparent that the variation of temperature in the spatial domain and its transient response, recorded from the IR camera, directly reveals the intrinsic properties variation of the conductive material.
The pulse generator transmits synchronous control signals to the induction heater and the IR camera simultaneously. The induction heater generates an electromagnetic and thermal field on the conductive specimen. With instruction from the trigger signal, the IR camera records the thermal video, termed as , where: , denote the length and the width of each image frame in the thermal video, respectively and denotes the total number of frames for the obtained thermal sequence.
2.2. Proposed Strategy for Detection
The specific procedure of the proposed detection strategy is shown in Figure 2. Firstly, thermal video sequences are obtained by the ECPT system. Secondly, thermal sequences are compressed by the spatial-transient pattern separation of using principle component. Finally, crack areas are identified through the deep region convolution neural network and visualized with the bounding box. In particular, the deep region convolution neural network needs to be trained by data labeled with the crack locations. Frames collected in previous experiments are augmented by data augmentation methods and then labeled in a VOC2012 format. More training details will be discussed in this section.
This strategy includes a thermal spatial-transient pattern extraction and region convolutional crack detector.
2.2.1. Thermal Spatial-Transient Patterns
In Figure 1, the current in the coil subsequently induces eddy currents and generate resistive heat in the conductive material [31]. The heat will diffuse over time until it reaches an equilibrium state in the material. If a defect (e.g., a crack) is present in the conductive material, the eddy current distribution or the heat diffusion process will vary (as be interpreted in Figure 1 bottom panel). Consequently, the spatial distribution of temperature on the surface of the material and the temperature transient response will show the variation. This is captured by an infrared camera as it records both the spatial and the transient response of the temperature variation on the specimen. Mathematically, this can be represented as a spatial-transient tensor which has dimensions . To avoid the influences of arbitrary selection of the image frame from the transient thermal videos, the task of the pattern mining is to blindly separate the observed into different characteristic patterns, and , and automatically identify the one which relates to the defect.
Principle Component Analysis (PCA) [19] is a multivariate analysis technique that uses an orthogonal transformation to convert measured data into new, uncorrelated variables, termed as Principal Components (PC). PCA has the capability to automatically extract valuable spatial and time patterns in accordance with the whole transient response behavior. Here, the principle component of the thermal sequences is separated from original data by PCA.
To facilitate the calculation of PCA, three-dimensional tensors will be transformed into a two-dimensional matrix. The whole thermal video is processed by a vectorization operation, frame by frame. The result of vectorization is denoted as , where: ; is regarded as a mixing observation; And is considered as a thermal pattern, which has the regions of features with different spatial and time distributions, namely the principle components. The term stands for the feature serial number separated by PCA while refers to the mixing parameter. can be considered as a linear instantaneous mixing model given by:
where . The PCA learning algorithm is aimed at searching for the linear transformation that makes the components as statistically uncorrelated as possible. This can be performed by using singular value decomposition, the specific steps of approach for thermal pattern separation by using PCA can be found in Reference [12].
2.2.2. Faster-RCNN for Cracks Identification
Faster-Region Convolution Neural Network (Faster-RCNN) is a real-time object detection structure which achieved excellent detection accuracy when used on Pascal VOC datasets [28]. Furthermore, computational cost was drastically reduced due to a novel strategy of region proposal. Using the Region Proposal Network (RPN), instead of conventional selective search method, for region proposal led to real-time performance. RPN is a neural network which takes a feature map as an input and outputs a set of rectangular object proposals. Because the principle component of the time domain has been extracted from thermal sequences, it is necessary to extract spatial features which contain the most defected information. Thus, Faster-RCNN is exploited for features extraction and defect localization. This is shown in Figure 3.
The final goal is to precisely detect and localize the crack area. To achieve this, it is required to highlight possible regions and make the decision whether cracks exist. To avoid redundant computation on feature extraction for each region, Faster-RCNN conducts feature map extraction at the beginning. Regions of interest (ROI) are obtained through RPN from the feature map. Spatial features after ROI pooling are put into a fully connected network to get the location of the bounding box and feed data into the softmax unit to calculate the confidence probability.
A core tenet of the proposed detection strategy is to extract the special crack patterns from the principle components of thermal sequences. Because significant distinction exists in patterns from different regions, the final softmax unit calculates decision vectors from these patterns. The convolution network, especially with deep architecture, has been chosen to enforce this task due to its powerful pattern extraction ability. Deep architecture [32,33] makes it possible to distinguish crack regions from regions on edges or other easily confused areas by thermal patterns extracted from principle component of thermal sequences.
Table 1 shows the specific hyper-parameters from Faster-RCNN after fine tuning. These hyper-parameters can be exploited directly to reproduce the results. Besides, it has a high reference value for retrain a network based on other datasets as the size of samples in the training-sets is similar to ours. When the size of samples in the training-sets is an order of magnitude greater, hyper-parameters of the model, especially the batch size and learning rate, need to be finely tuned to achieve optimal performance. To avoid the overfitting problem caused by few-shot learning, data augmentation techniques such as stretch, rotation and adding-noise are considered for expansion of training-sets.
3. Results and Discussion
3.1. Sample Preparation and Experiments Setup
To evaluate the robustness of the proposed method, a large number of experimental tests were conducted. The experiments contain a variety of test samples including ferromagnetic material (45# steel) samples with artificial cracks, non-ferromagnetic material (316# stainless steel) samples with artificial cracks, non-ferromagnetic material (316# stainless steel) samples with natural cracks and non-ferromagnetic material (welding line) samples with natural cracks. Table 2 gives a comprehensive description of the samples. These samples are all metal specimens with different types of cracks. In thermal sequences, different kinds of cracks have different pixel sizes. For example, the artificial cracks such as samples (a)–(c) have a 30-pixel length and a 5-pixel width. However natural cracks, especially micro natural cracks, have fifteen pixels length with only a single pixel width.
The experimental set-up is shown in Figure 4. An Easyheat 224 from the Cheltenham Induction Heating (Sheffield, UK) is used for coil excitation. The Easyheat has a maximum excitation power of 2.4 kW, a maximum current of 400 , and an excitation frequency range of 150–400 kHz (380 and 256 kHz are used in this study). Water cooling of the coil was implemented to construct direct heating of the coil. The IR camera, A655SC (FLIR, Wilsonville, OR, USA), is a Stirling un-cooled camera with InSb detectors of 640 × 480 array, which has a sensitivity of ≤50 mK. In the experiment, only one edge of the rectangular coil was used to stimulate the eddy current for the underneath sample and it was placed in the middle of the crack. In addition, the frame rate of 100 Hz was chosen, and thermal videos, including the 200-millisecond heating process and the 1800-millisecond cooling process are recorded in the experiments.
3.2. Results Analysis
In this section, the significance of the proposed detection method needed to be verified. The main significance of the proposed method over the unsupervised method can be drawn as follows:
- (1)
- Boundary information of experiment component impacts the output of the unsupervised method, owing to the similarity of the thermal pattern during the process of thermal diffusion;
- (2)
- The unsupervised method pays more attention on data with specific properties such as non-negativity or sparsity, in order to denoise or separate the distinctive data from the original data sequence, which shows an unsatisfied performance on data localization when multi-properties exists in crack information;
- (3)
- Projecting data into a high dimension space by a deep convolution neural network, in order to extract special feature structure from the spatial domain, has been proven to be essential to differentiate crack area from other, easily confused, areas.
Taking sample (a) as an example, both the classical thermal based methods and the latest unsupervised detection algorithms were chosen to compare with the proposed detection strategy. Classical, thermal based, defect feature extraction methods include thermal signal reconstruction (TSR) [34] and pulsed phase thermography (PPT) [35]. TSR is a thermal processing technique used to enhance the spatial and temporal resolution of a thermography sequence. The PPT algorithm, based on the Fourier Transform (FT), provides both phase and amplitude information which can enhance defect detectability and reduce noise. On the other hand, ARDVB [23], EVBTF [24] and SVD-RARX [25] have been selected from the state-of-the-art unsupervised detection algorithms. It can be seen from Figure 5, EVBTF and the proposed method shows reasonable results by processing original thermal sequences. In Figure 5a,b, crack information is extracted while thermal noises are as distinct as cracks. Crack information is submerged by thermal noise induced near the coil which leads to difficulty in locating the crack precisely. In Figure 5c, coil information and boundary information has been extracted as the strongest information from original data because the ARDVB model focuses more on sparsity of input data. It would achieve optimal performance when data from cracks region is sparse in theory. However, information collected from coil region and other origins of noise contains sparse characteristics in real industrial practice. This may result in a disastrous effect on decision making. In Figure 5d, the output of EVBTF model contains all the crack information as the proposed method, whereas a little bit boundary information has been contained in the final output. The cracks location can be simply found by person with experience of detection. Nonetheless, the boundary information contained in final output may cause little confusion on non-professionals. In Figure 5e, effective pixels can be observed on cracks region, but noise pixels from boundary areas especially highlighted points on the right-hand edge of the sample are also extracted by SVD-RARX model. SVD-RARX model adapts anomaly detection algorithm originally developed for hyperspectral data on thermal sequences after dimensionality reduction. Nevertheless, the detection algorithm fails when input thermal spatial information has noise pixels like pixels from boundary and other noise hot-spots which have similarities with crack pixels in physical properties. In Figure 5f, the proposed method detects all the cracks precisely as well as locates them with bounding box so as to simplify the decision-making process to a remarkable extent.
To verify the robustness of the proposed strategy, defects on complicate shape sample of welding line are used for validation. In this study, the welding line samples are fabricated by two pieces of stainless steel through welding procedure. The defects existing on the welding line generate during the welding process or grow with natural fatigue damage mechanism. There is an enormous challenge on detecting the flaws on welding line as the flaws lurk beneath the complex surface conditions. The penetration testing (PT) result of micro-defect on the welding line from sample (e) is shown in Figure 6 to indicate the specific location of the target. The principle component of the thermal sequences obtained by experiment based on ECPT system is shown in Figure 7. It can be obviously found in Figure 7 that numerous origins of noise lie in the principle component extracted from thermal sequences. The sources of noise can be concluded as coil influence, boundary information, narrow chutes on the welding line and inhomogeneous heat distribution on the rough stainless steel surface. These disgusting noise factors lead to failure provided by state-of-the-art micro-defects detection method.
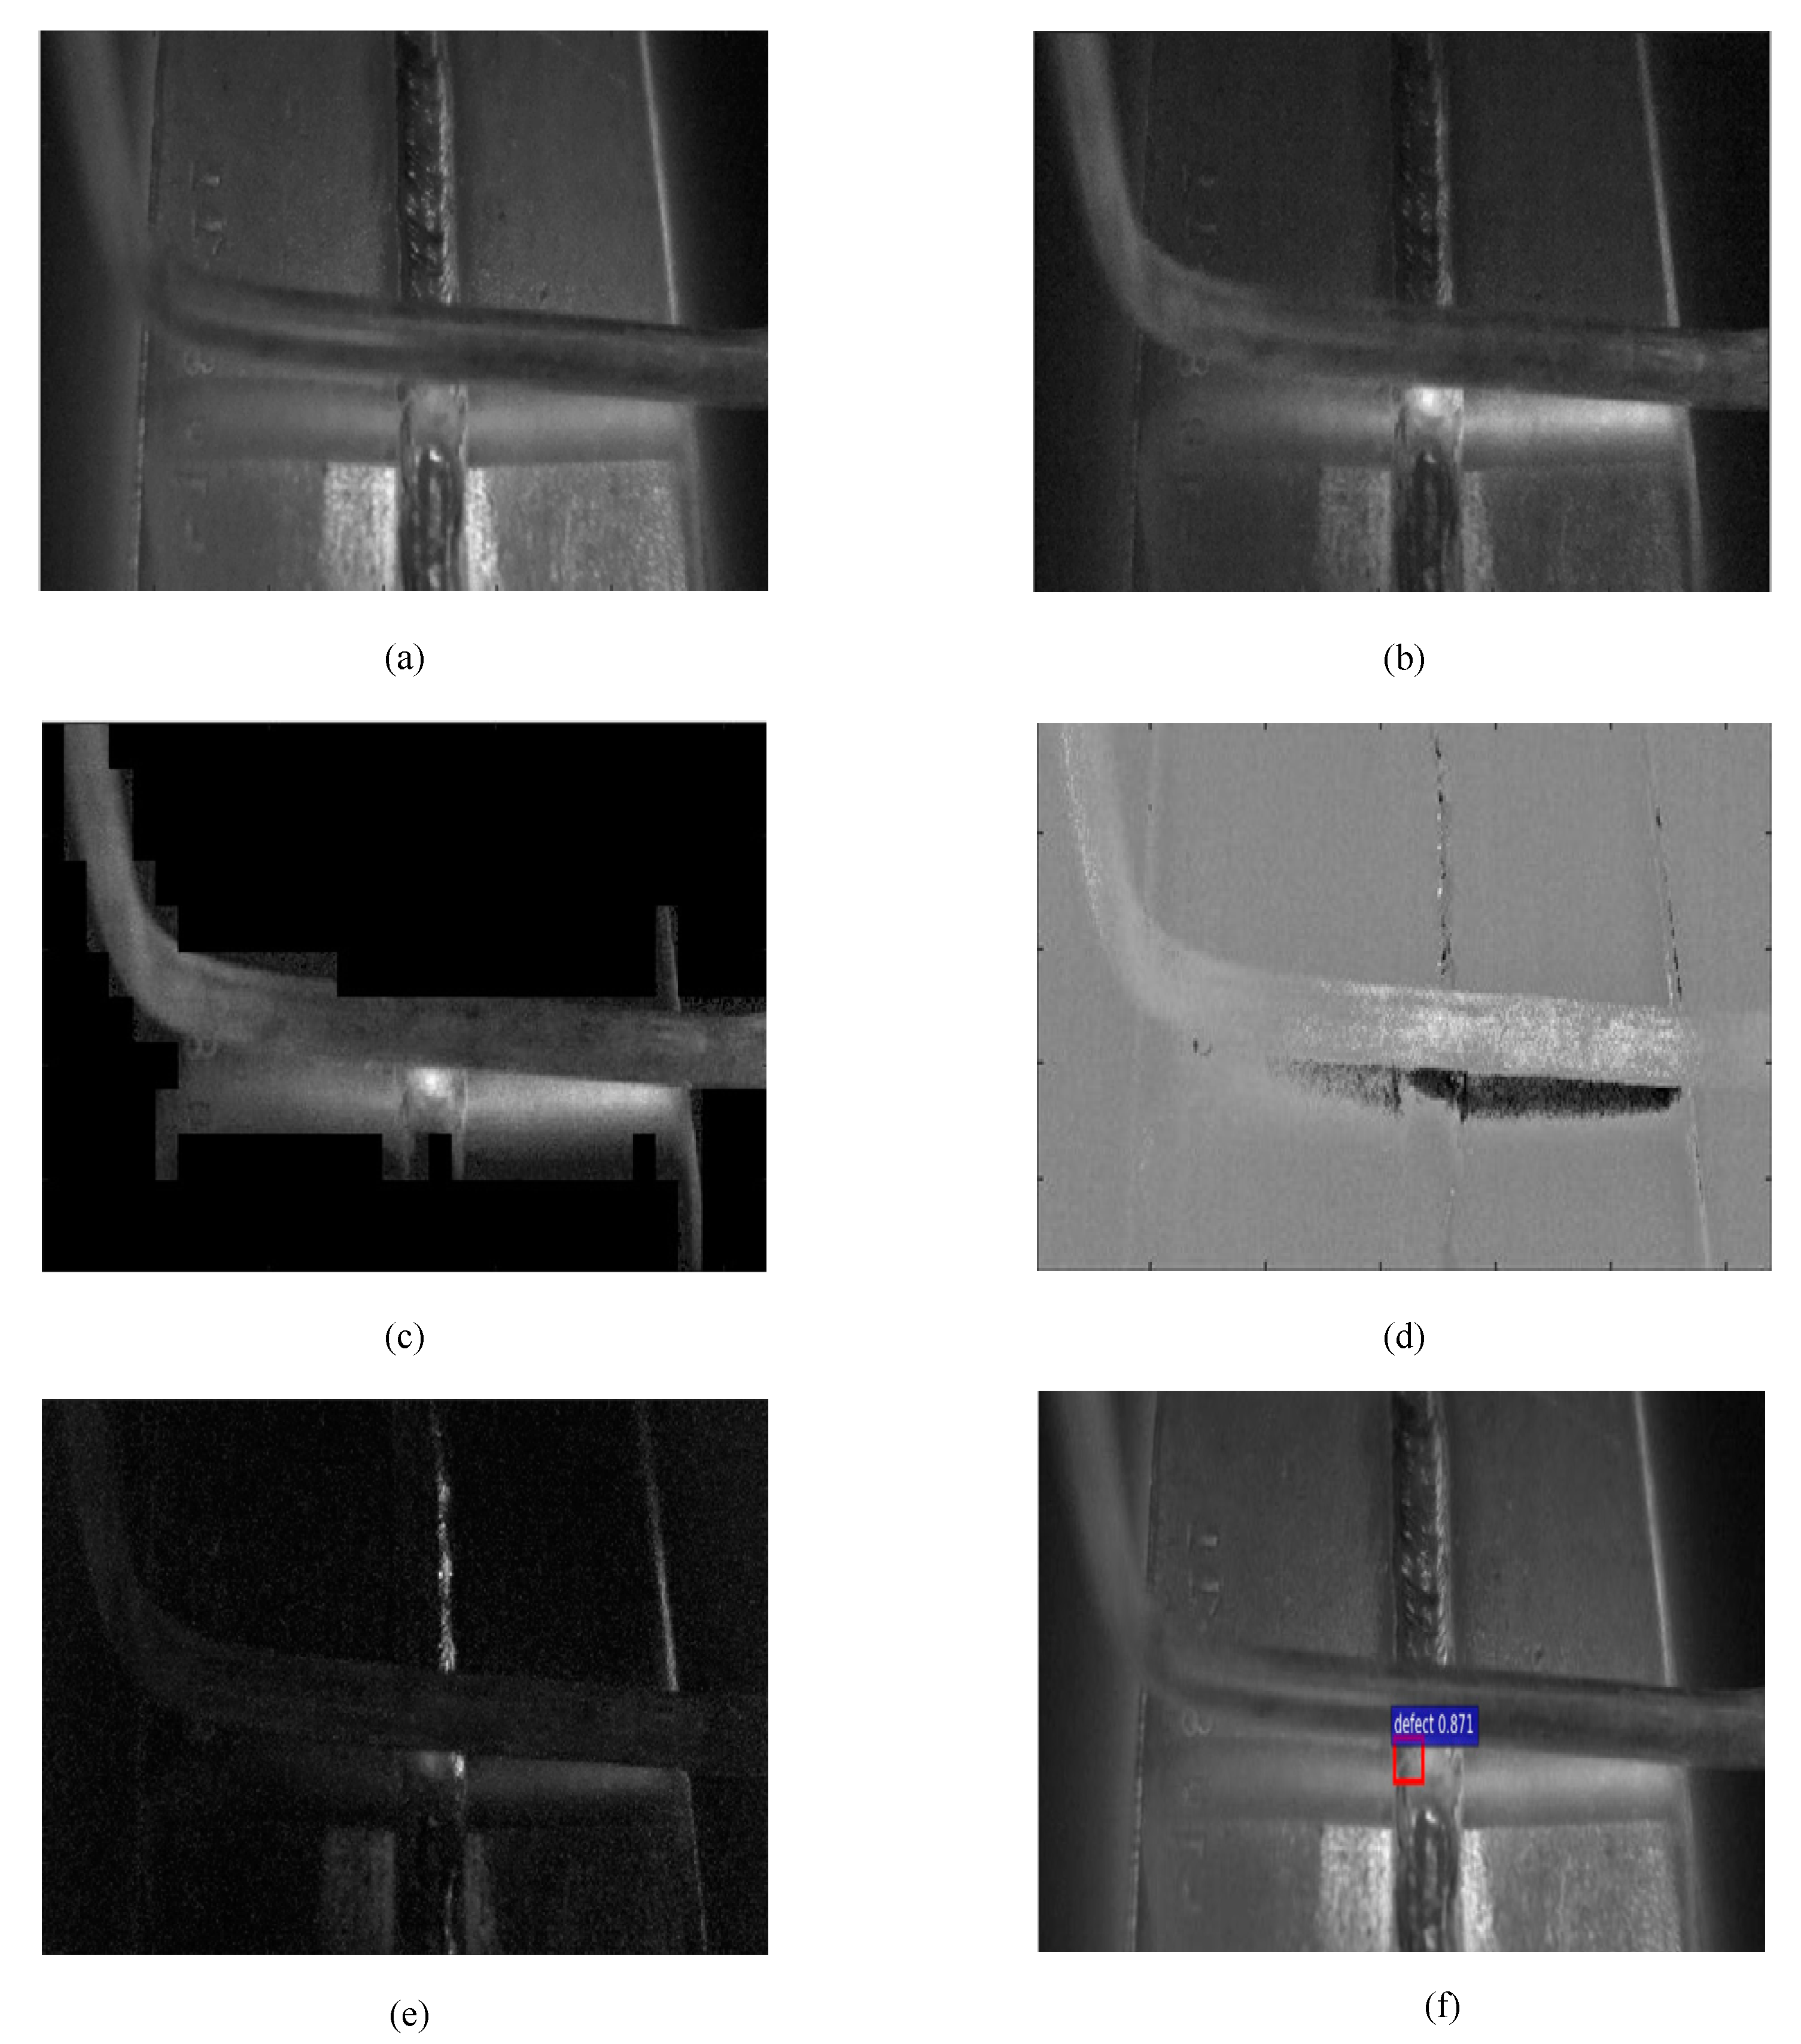
As illustrated in Figure 8, the proposed method gives a particularly satisfactory performance for the data from the welding line sample (e). The region including defect information has been successfully annotated out by the proposed method. In Figure 8a,b, little information can be observed on the crack area while TSR extracts hot-spots caused by rough surface and PPT highlights the region on the whole eddy current excited part. In Figure 8c, the perturbation of the rough surface of stainless steel, caused by thermal diffusion process and the thermal pattern variation of the coil, are extracted by the ARDVB model. The ARDVB model makes the hypothesis that hot spots have the strongest sparse characteristics, which benefits the quantitative detection for small defects. The model is based on robust-PCA which decomposes the input matrix into sparse pattern (hot spots), low-rank pattern (background) and noise (thermal noise). Nevertheless, the noise information described above was the component with the highest sparsity in thermal sequences obtained by welding line. In Figure 8d, components extracted by hierarchical structure contained most features from the boundary information of the whole specimen and slopes information of welding line, whereas micro defect information is drowned out by highly intensive noise. In Figure 8e, pixels on the welding line and right-hand edge of sample were evaluated as flaws, by mistake, through the SVD-RARX model. The model is based on the assumption that defect pixels can be evaluated as anomalies using a hyperspectral anomaly detection algorithm and that hyperspectral data sequences are generated by dimensionality reduction. However, hot spots caused by narrow chutes on the welding line and right-hand edge of the sample, rather than defects on the welding line, are the most typical anomalies of the compressed sequences. This directly leads to the failure of SVD-RARX method. The reasonable explanation for why the proposed method outperforms the state-of-the-art algorithms is given as follow:
- (1)
- Task-driven model with deep architecture gets prior knowledge through the training process and fuses the prior knowledge into parameters of the network in order to extract specific features through the convolution process to obtain the feature map;
- (2)
- The model with deep architecture obtains feature from multi-properties while unsupervised method based on limited properties assumed to be contained in defect information. The flaw detection on the welding line sample faced the primary problem that the flaw regions showed similar physical properties with some origins of the noise discussed above. The performance provided by the unsupervised method, based on limited properties or features, is more likely to be restricted, owing to feature extraction only from low-dimension space.
The Probability of Detection (POD) [13] of defect is defined as:
where: TP refers to a true positive, which represents the situation where the sample contains a defect and the method indicates a defect is present; and FN refers to false negative, which represents the situation where the sample does not contain a defect and the method does not indicate a defect is present.
The results from different samples supported by the POD evaluation are shown in Table 3. The performance is compared through thermal sequences collected from experiments on every sample. It is obvious that on samples (a)–(d), the EVBTF and SVD-RARX model show comparable results with the proposed method, while the other three methods give mediocre performance. Because of the hierarchical structure which is similar to the deep architecture in the proposed method, the EVBTF model has a strong ability to separate low-rank background information from thermal sequences and remain in defects information. It is worth mentioning that the EVBTF and SVD-RARX model fails when it encounters a complex surface situation, just like sample (e), while the proposed method still keeps high performance in POD evaluation.
The results evaluated in the whole dataset can be seen in Table 4. The POD study is the comparison result between the referenced annotation and the cracks regions extracted out by methods discussed above. With the task-driven model based on deep architecture, the proposed model achieves the highest result over the state-of-the-art detection methods. The inspiring performance is closely related to the ability, owned by deep architecture, to extract the feature from multi hierarchy.
4. Conclusions and Future Work
In this paper, a task-driven method, based on deep architecture, has been proposed to deal with the problem of accurate crack detection and localization. Both the ECPT system and algorithm have been validated. Through PCA for spatial-transient pattern extraction, as well as Faster-RCNN, the defects locations as well as the confidence probability can be precisely calculated. Finally, the location of the defects is automatically visualized through a bounding box in order to simplify decision making process even to a person without professional knowledge. The POD is introduced to verify the robustness of the results. The proposed method has been tested on both artificial and natural cracks from industry. Future work will focus on combining information extracted from the time domain with a decision made by the proposed method in order to conceive a time-spatial fusion system to achieve precise crack detection and defect pixels segmentation.
Author Contributions
J.H. and W.X. designed the experiments, analyzed the data and wrote the whole manuscript; Y.W. (Yizhe Wang) and Y.W. (Yingchun Wu) performed the experiments; B.G. and G.Y.T. provided guidance, paper revision and funding. Y.Y. and J.C. provides test samples and guidance.
Funding
This research was funded by National Natural Science Foundation of China (No. 61401071, No. 61527803).
Acknowledgments
The work was supported by Science and Technology Department of Sichuan, China (Grant No. 2018JY0655and EPSRC IAA Phase 2 funded project: “3D super-fast and portable eddy current pulsed thermography for railway inspection” (EP/K503885/1).
Conflicts of Interest
The authors declare no conflict of interest.
References
- Halmshaw, R. Non-Destructive Testing; Edward Arnold: London, UK, 1991. [Google Scholar]
- Hellier, C. Handbook of Nondestructive Evaluation; McGraw-Hill: New York, YN, USA, 2001. [Google Scholar]
- Bray, D.E.; McBride, D. Nondestructive Testing Techniques; NASA STI/Recon Technical Report A; NASA: Washington, DC, USA, 1992; Volume 93.
- Li, X.; Gao, B.; Woo, W.L.; Tian, G.Y.; Qiu, X.; Gu, L. Quantitative surface crack evaluation based on eddy current pulsed thermography. IEEE Sens. J. 2017, 17, 412–421. [Google Scholar] [CrossRef]
- Kalinichenko, N.P.; Kalinichenko, A.N.; Konareva, I.S. Reference specimens of nonmetallic materials for penetrant nondestructive testing. Russ. J. Nondestruct. Test. 2011, 47, 663–666. [Google Scholar] [CrossRef]
- Helifa, B.; Oulhadj, A.; Benbelghit, A.; Lefkaier, I.K.; Boubenider, F.; Boutassouna, D. Detection and measurement of surface cracks in ferromagnetic materials using eddy current testing. NDT E Int. 2006, 39, 384–390. [Google Scholar] [CrossRef]
- Ravan, M.; Sadeghi, S.H.H.; Moini, R. Neural network approach for determination of fatigue crack depth profile in a metal, using alternating current field measurement data. IET Sci. Meas. Technol. 2008, 2, 32–38. [Google Scholar] [CrossRef]
- Palumbo, D.; Galietti, U. Characterisation of steel welded joints by infrared thermographic methods. Quant. InfraRed Thermogr. J. 2014, 11, 29–42. [Google Scholar] [CrossRef]
- Palumbo, D.; Ancona, F.; Galietti, U. Quantitative damage evaluation of composite materials with microwave thermographic technique: Feasibility and new data analysis. Meccanica 2015, 50, 443–459. [Google Scholar] [CrossRef]
- Sophian, A.; Tian, G.Y.; Taylor, D.; Rudlin, J. A feature extraction technique based on principal component analysis for pulsed eddy current NDT. NDT E Int. 2003, 36, 37–41. [Google Scholar] [CrossRef]
- Zhu, Y.K.; Tian, G.Y.; Lu, R.S.; Zhang, H. A review of optical NDT technologies. Sensors 2011, 11, 7773–7798. [Google Scholar] [CrossRef] [PubMed]
- Gao, B.; Woo, W.L.; He, Y.; Tian, G.Y. Unsupervised sparse pattern diagnostic of defects with inductive thermography imaging system. IEEE Trans. Ind. Inform. 2016, 12, 371–383. [Google Scholar] [CrossRef]
- Gao, B.; Woo, W.L.; Tian, G.Y.; Zhang, H. Unsupervised diagnostic and monitoring of defects using waveguide imaging with adaptive sparse representation. IEEE Trans. Ind. Inform. 2016, 12, 405–416. [Google Scholar] [CrossRef]
- Wang, Y.; Gao, B.; Woo, W.L.; Tian, G.Y.; Maldague, X. Thermal Pattern Contrast Diagnostic of Micro Cracks with Induction Thermography for Aircraft Braking Components. IEEE Trans. Ind. Inform. 2018. [Google Scholar] [CrossRef]
- Pan, M.; He, Y.; Tian, G.Y.; Chen, D.; Luo, F. Defect characterisation using pulsed eddy current thermography under transmission mode and NDT applications. NDT E Int. 2012, 52, 28–36. [Google Scholar] [CrossRef]
- Avdelidis, N.P.; Hawtin, B.C.; Almond, D.P. Transient thermography in the assessment of defects of aircraft composites. NDT E Int. 2003, 36, 433–439. [Google Scholar] [CrossRef]
- Xu, Z.; Wu, X.; Li, J.; Kang, Y. Assessment of wall thinning in insulated ferromagnetic pipes using the time-to-peak of differential pulsed eddy-current testing signals. NDT E Int. 2012, 51, 24–29. [Google Scholar] [CrossRef]
- Cheng, L.; Gao, B.; Tian, G.Y.; Woo, W.L.; Berthiau, G. Impact damage detection and identification using eddy current pulsed thermography through integration of PCA and ICA. IEEE Sens. J. 2014, 14, 1655–1663. [Google Scholar] [CrossRef]
- Cvejic, N.; Bull, D.; Canagarajah, N. Region-based multimodal image fusion using ICA bases. IEEE Sens. J. 2007, 7, 743–751. [Google Scholar] [CrossRef] [Green Version]
- Bai, L.; Gao, B.; Tian, G.Y.; Woo, W.L.; Cheng, Y. Spatial and time patterns extraction of eddy current pulsed thermography using blind source separation. IEEE Sens. J. 2013, 13, 2094–2101. [Google Scholar] [CrossRef]
- Gao, B.; Bai, L.; Woo, W.L.; Tian, G.Y.; Cheng, Y. Automatic defect identification of eddy current pulsed thermography using single channel blind source separation. IEEE Trans. Instrum. Meas. 2014, 63, 913–922. [Google Scholar] [CrossRef]
- Gao, B.; Lu, P.; Woo, W.L.; Tian, G.Y.; Zhu, Y.; Johnston, M. Variational Bayesian Sub-group Adaptive Sparse Component Extraction for Diagnostic Imaging System. IEEE Trans. Ind. Electron. 2018, 65, 8142–8152. [Google Scholar] [CrossRef]
- Lu, P.; Gao, B.; Woo, W.L.; Li, X.; Tian, G.Y. Automatic Relevance Determination of Adaptive Variational Bayes Sparse Decomposition for Micro-Cracks Detection in Thermal Sensing. IEEE Sens. J. 2017, 17, 5220–5230. [Google Scholar] [CrossRef]
- Lu, P.; Gao, B.; Feng, Q.; Yang, Y.; Woo, W.L.; Tian, G.Y. Ensemble variational Bayes tensor factorization for super resolution of CFRP debond detection. Infrared Phys. Technol. 2017, 85, 335–346. [Google Scholar] [CrossRef]
- Benmoussat, M.S.; Guillaume, M.; Caulier, Y.; Spinnler, K. Automatic metal parts inspection: Use of thermographic images and anomaly detection algorithms. Infrared Phys. Technol. 2013, 61, 68–80. [Google Scholar] [CrossRef]
- Gao, B.; Li, X.; Woo, W.L.; Tian, G.Y. Physics-based image segmentation using first order statistical properties and genetic algorithm for inductive thermography imaging. IEEE Trans. Image Proc. 2018, 27, 2160–2175. [Google Scholar] [CrossRef] [PubMed]
- Girshick, R.; Donahue, J.; Darrell, T.; Malik, J. Rich feature hierarchies for accurate object detection and semantic segmentation. In Proceedings of the IEEE Conference on Computer Vision and Pattern Recognition, Columbus, OH, USA, 23–28 June 2014. [Google Scholar]
- Ren, S.; He, K.; Girshick, R.; Sun, J. Faster r-cnn: Towards real-time object detection with region proposal networks. In Proceedings of the 28th International Conference on Neural Information Processing Systems, Montreal, QC, Canada, 7–12 December 2015. [Google Scholar]
- Redmon, J.; Divvala, S.; Girshick, R.; Farhadi, A. You only look once: Unified, real-time object detection. In Proceedings of the IEEE Conference on Computer Vision and Pattern Recognition, Las Vegas, NV, USA, 27–30 June 2016. [Google Scholar]
- Salamon, J.; Bello, J.P. Deep convolutional neural networks and data augmentation for environmental sound classification. IEEE Signal Proc. Lett. 2017, 24, 279–283. [Google Scholar] [CrossRef]
- Wang, Y.; Gao, B.; Tian, G.; Woo, W.L.; Miao, Y. Diffusion and separation mechanism of transient electromagnetic and thermal fields. Int. J. Therm. Sci. 2016, 102, 308–318. [Google Scholar] [CrossRef]
- Schmidhuber, J. Deep learning in neural networks: An overview. Neural Netw. 2015, 61, 85–117. [Google Scholar] [CrossRef] [PubMed] [Green Version]
- LeCun, Y.; Bengio, Y.; Hinton, G. Deep learning. Nature 2015, 521, 436–444. [Google Scholar] [CrossRef] [PubMed]
- Sripragash, L.; Sundaresan, M.J. A normalization procedure for pulse thermographic nondestructive evaluation. NDT E Int. 2016, 83, 14–23. [Google Scholar] [CrossRef]
- Maldague, X.; Marinetti, S. Pulse phase infrared thermography. J. Appl. Phys. 1996, 79, 2694–2698. [Google Scholar] [CrossRef] [Green Version]
Figure 1.
ECPT schematic diagram.
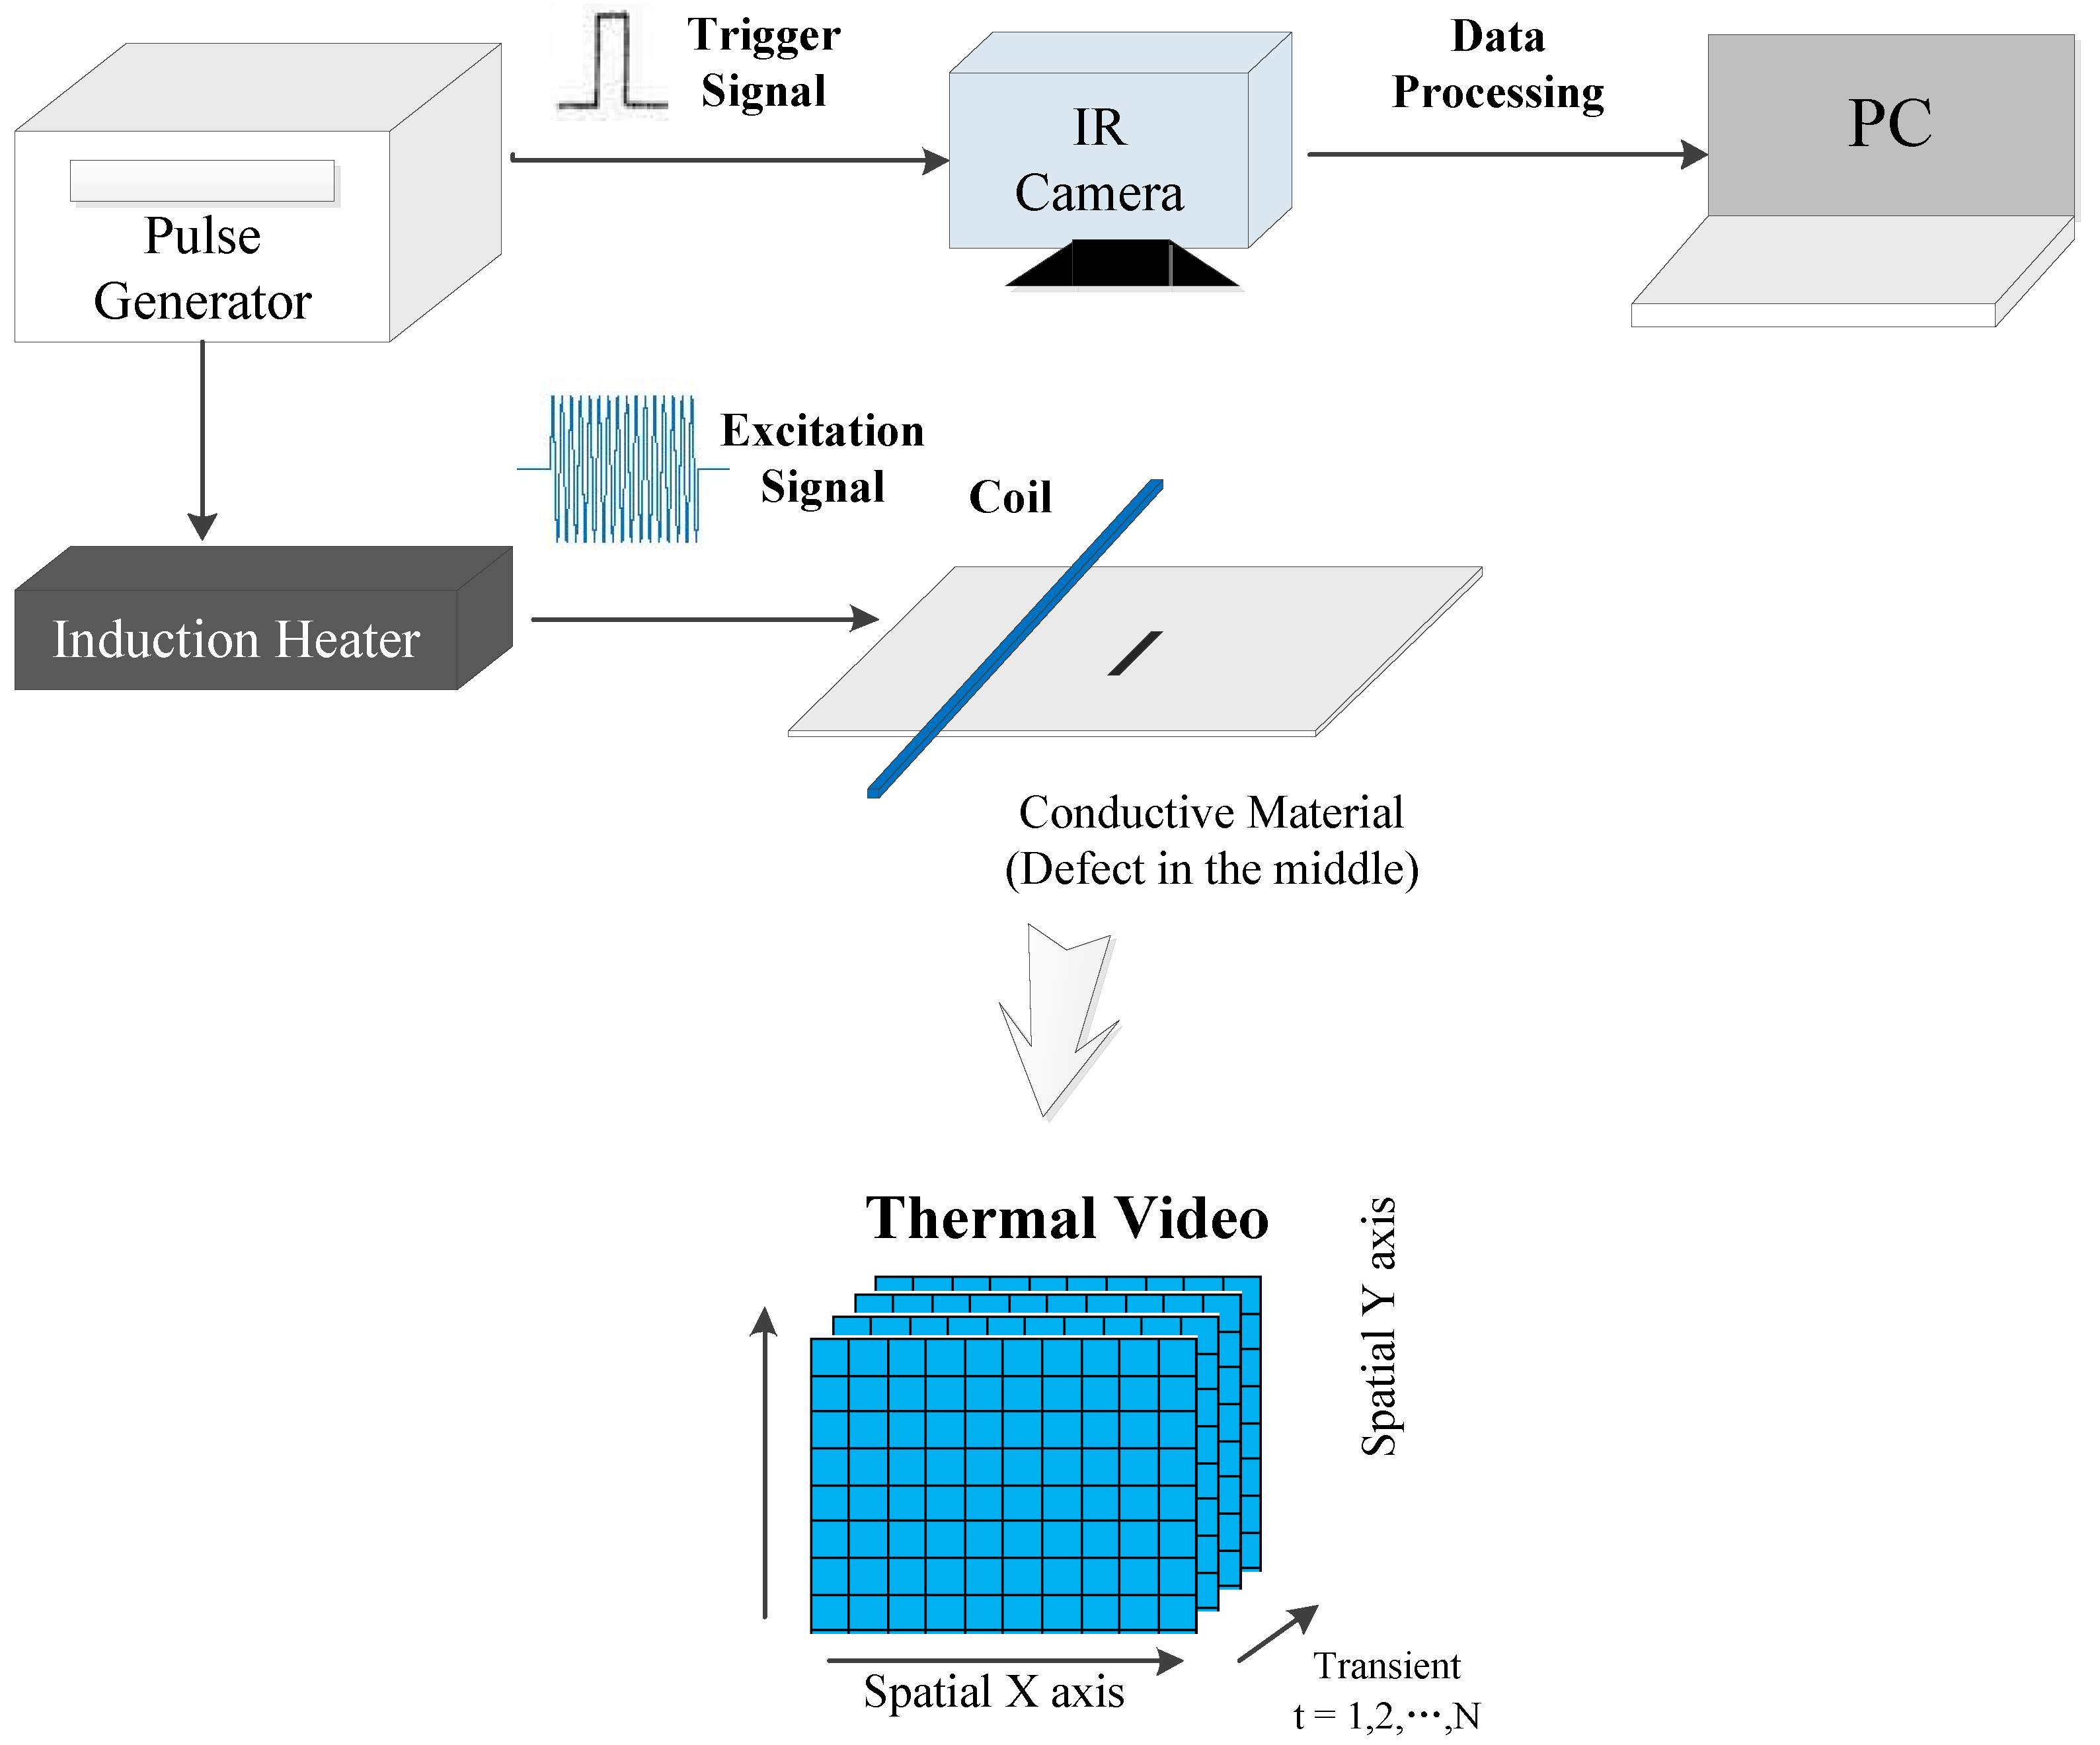
Figure 2.
Proposed detection strategy.
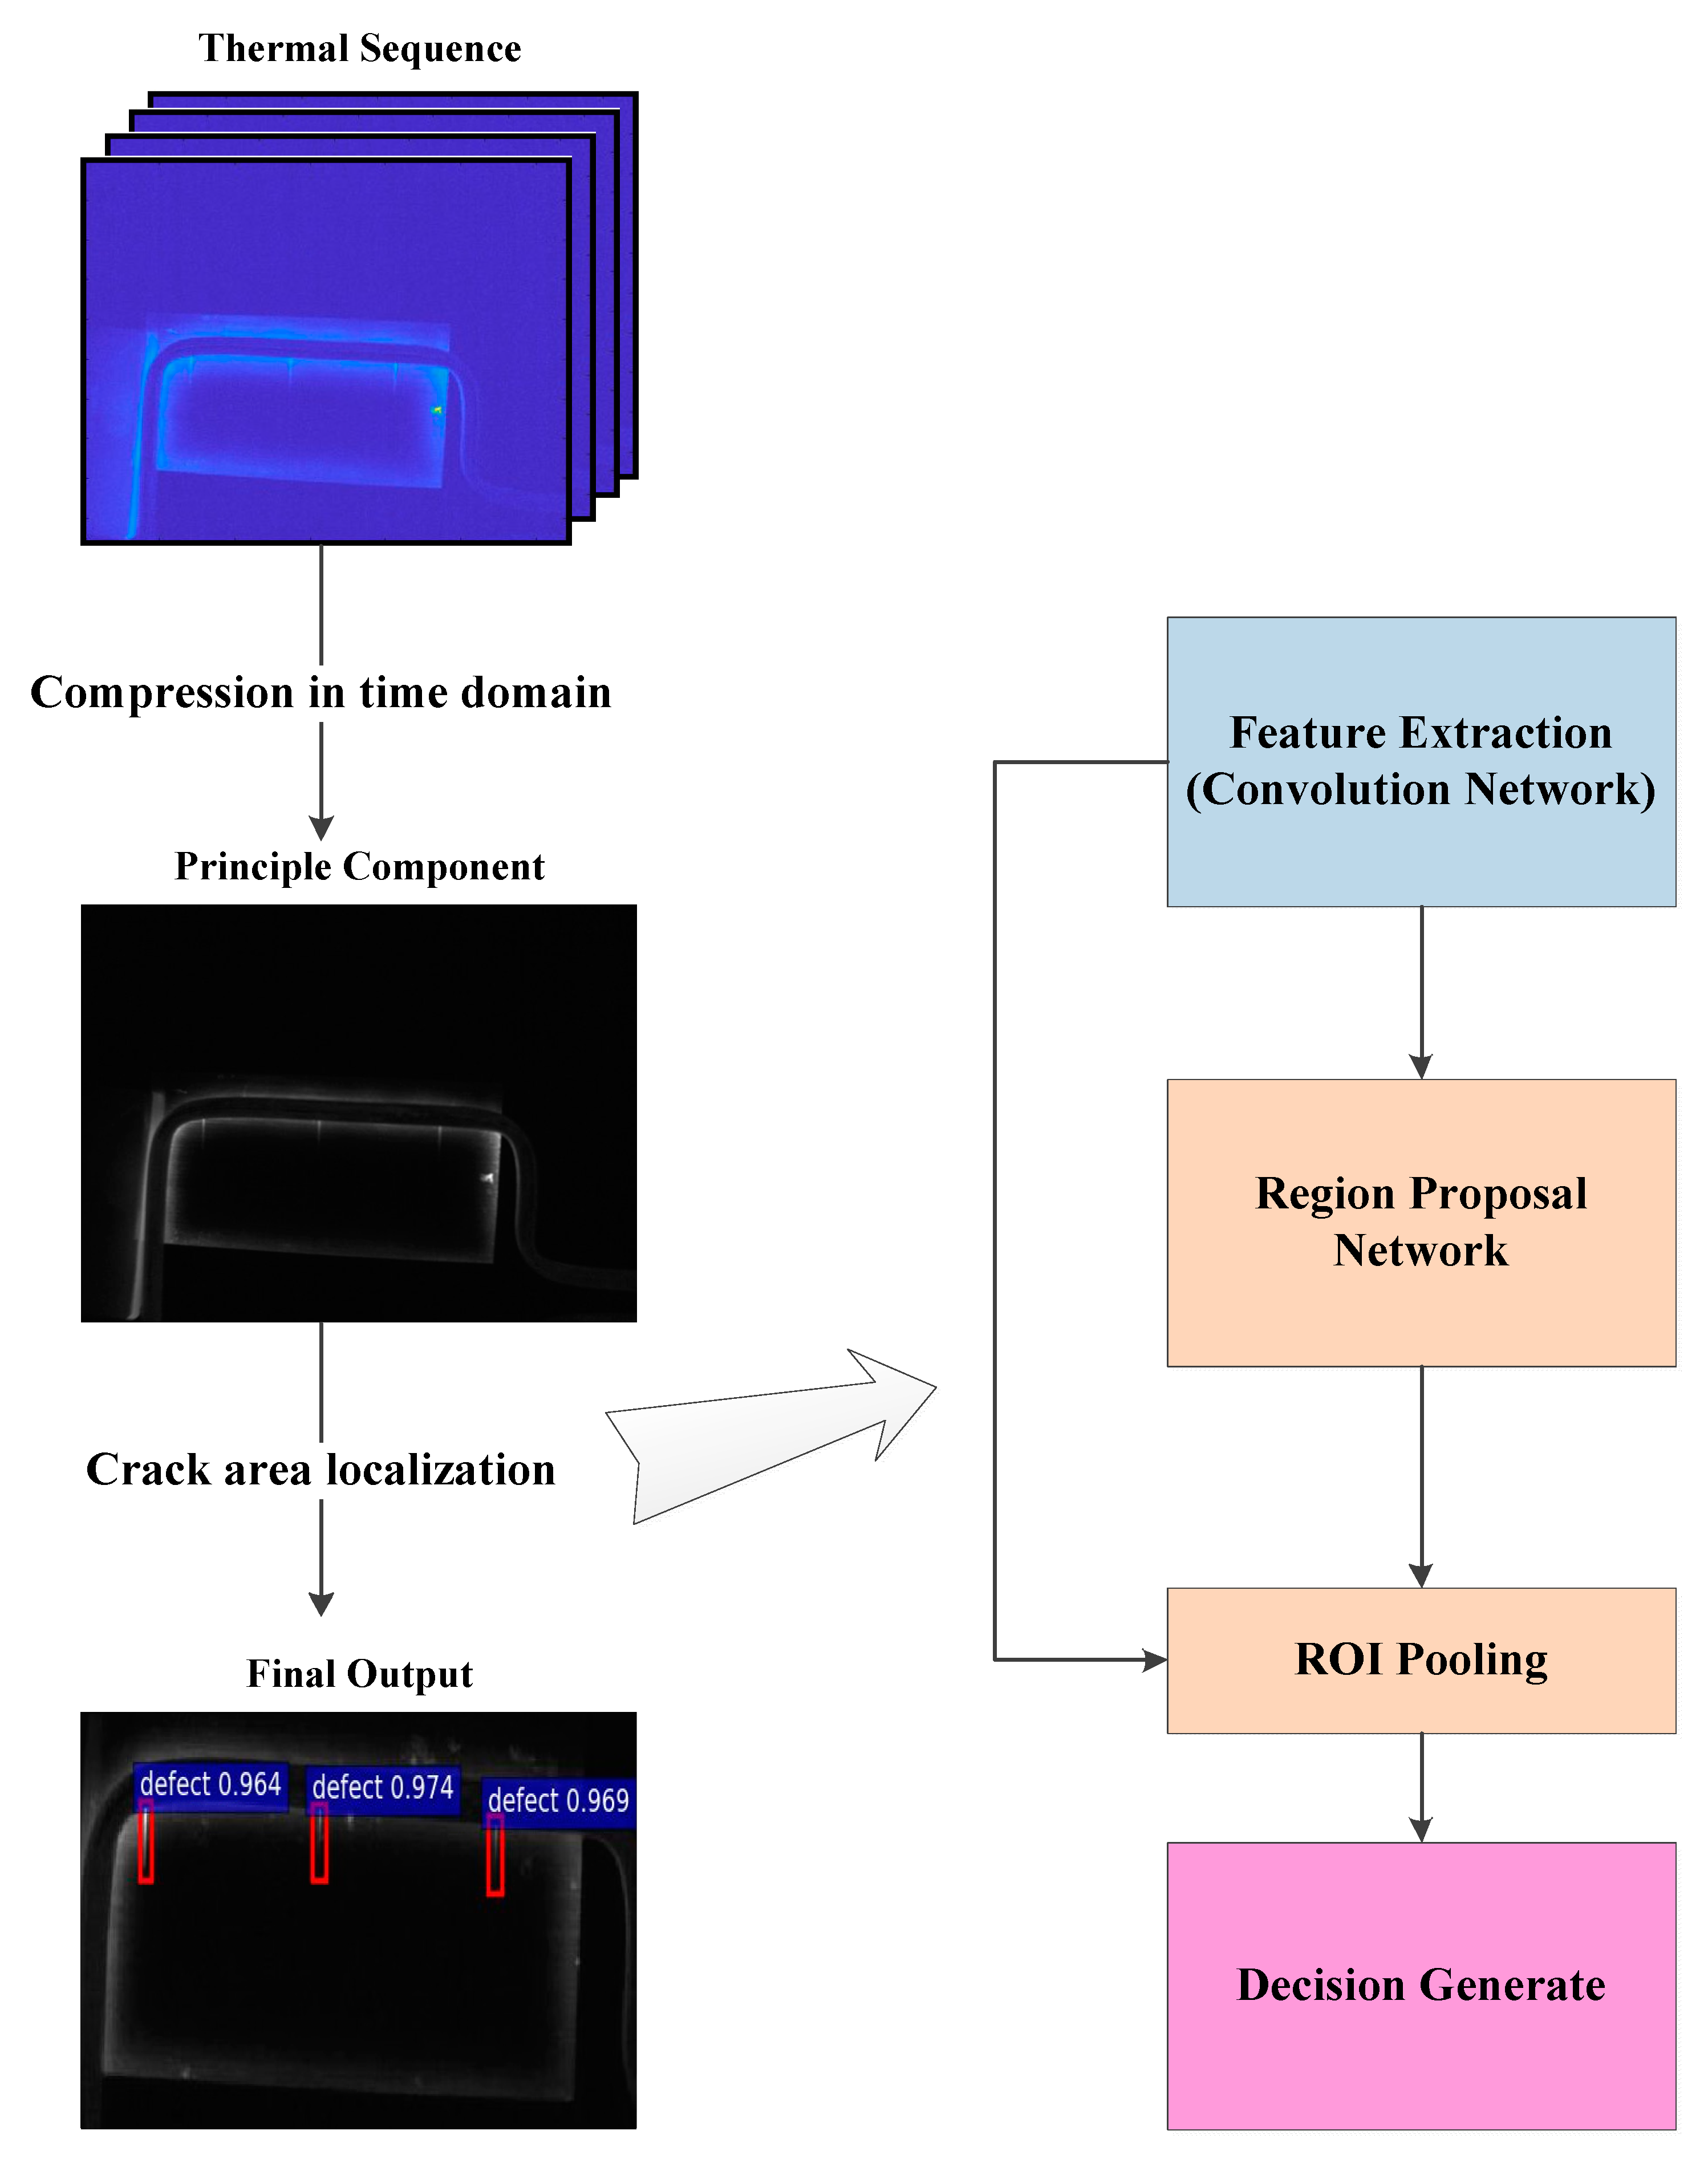
Figure 3.
Structure of Faster-RCNN.
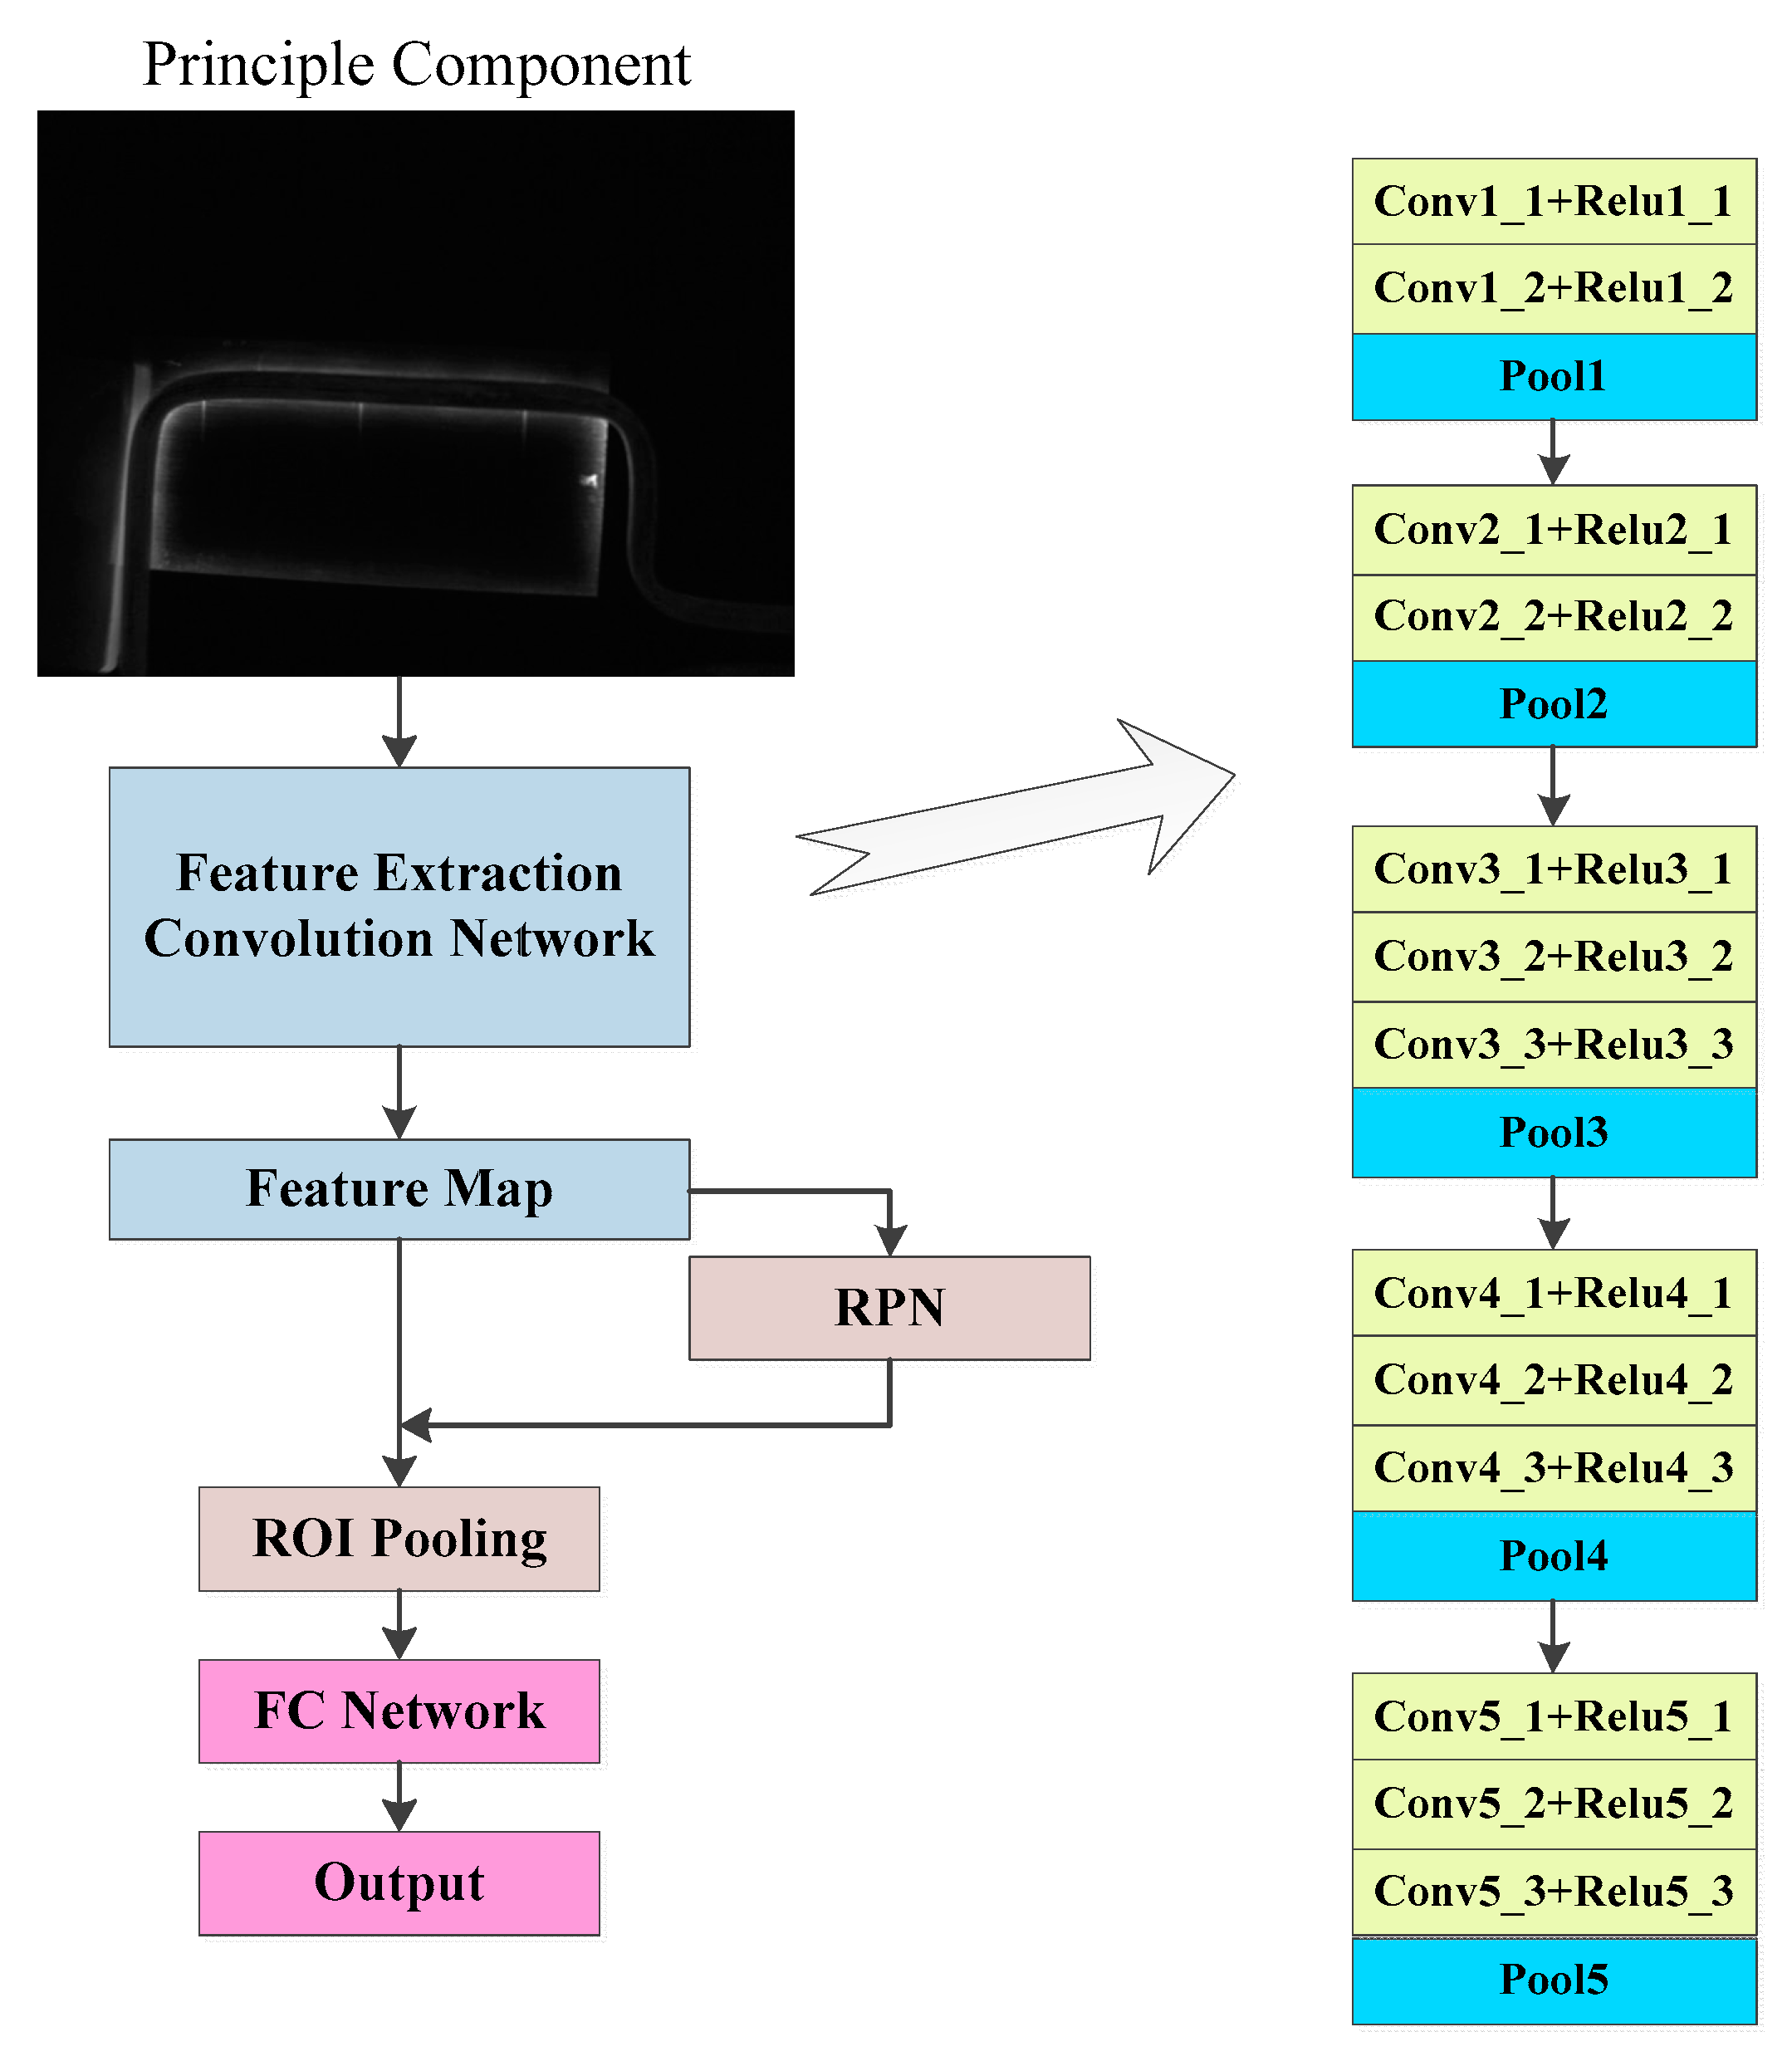
Figure 4.
Experiment setup.
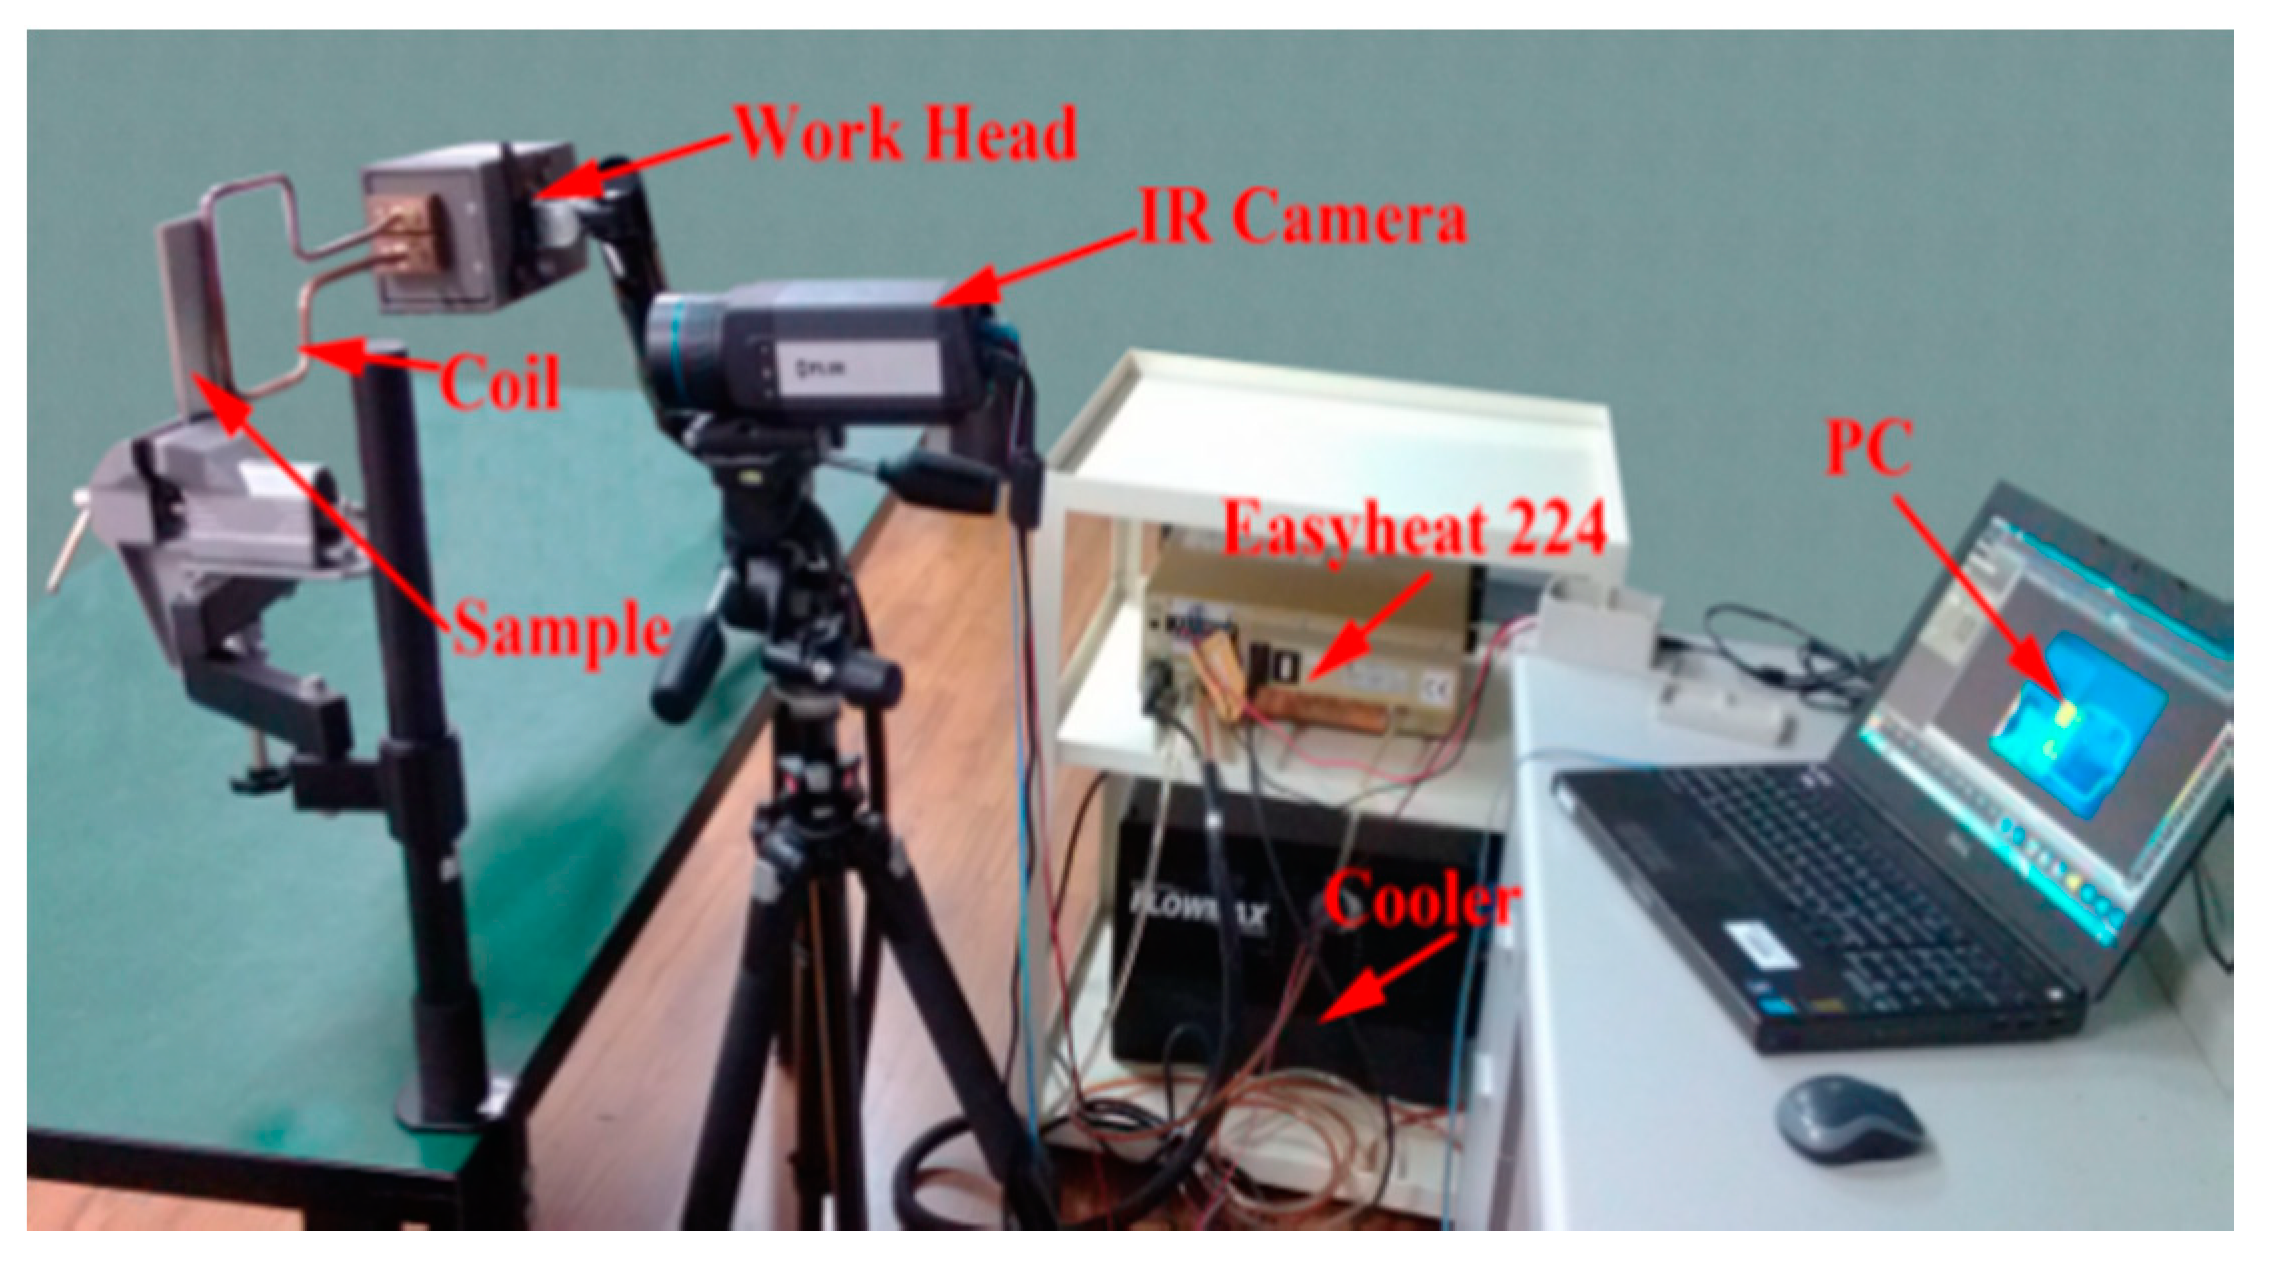
Figure 5.
Detection results provided by different algorithms on sample (a): (a) TSR; (b) PPT; (c) ARDVB; (d) EVBTF; (e) SVD-RARX; (f) proposed method.
Figure 5.
Detection results provided by different algorithms on sample (a): (a) TSR; (b) PPT; (c) ARDVB; (d) EVBTF; (e) SVD-RARX; (f) proposed method.
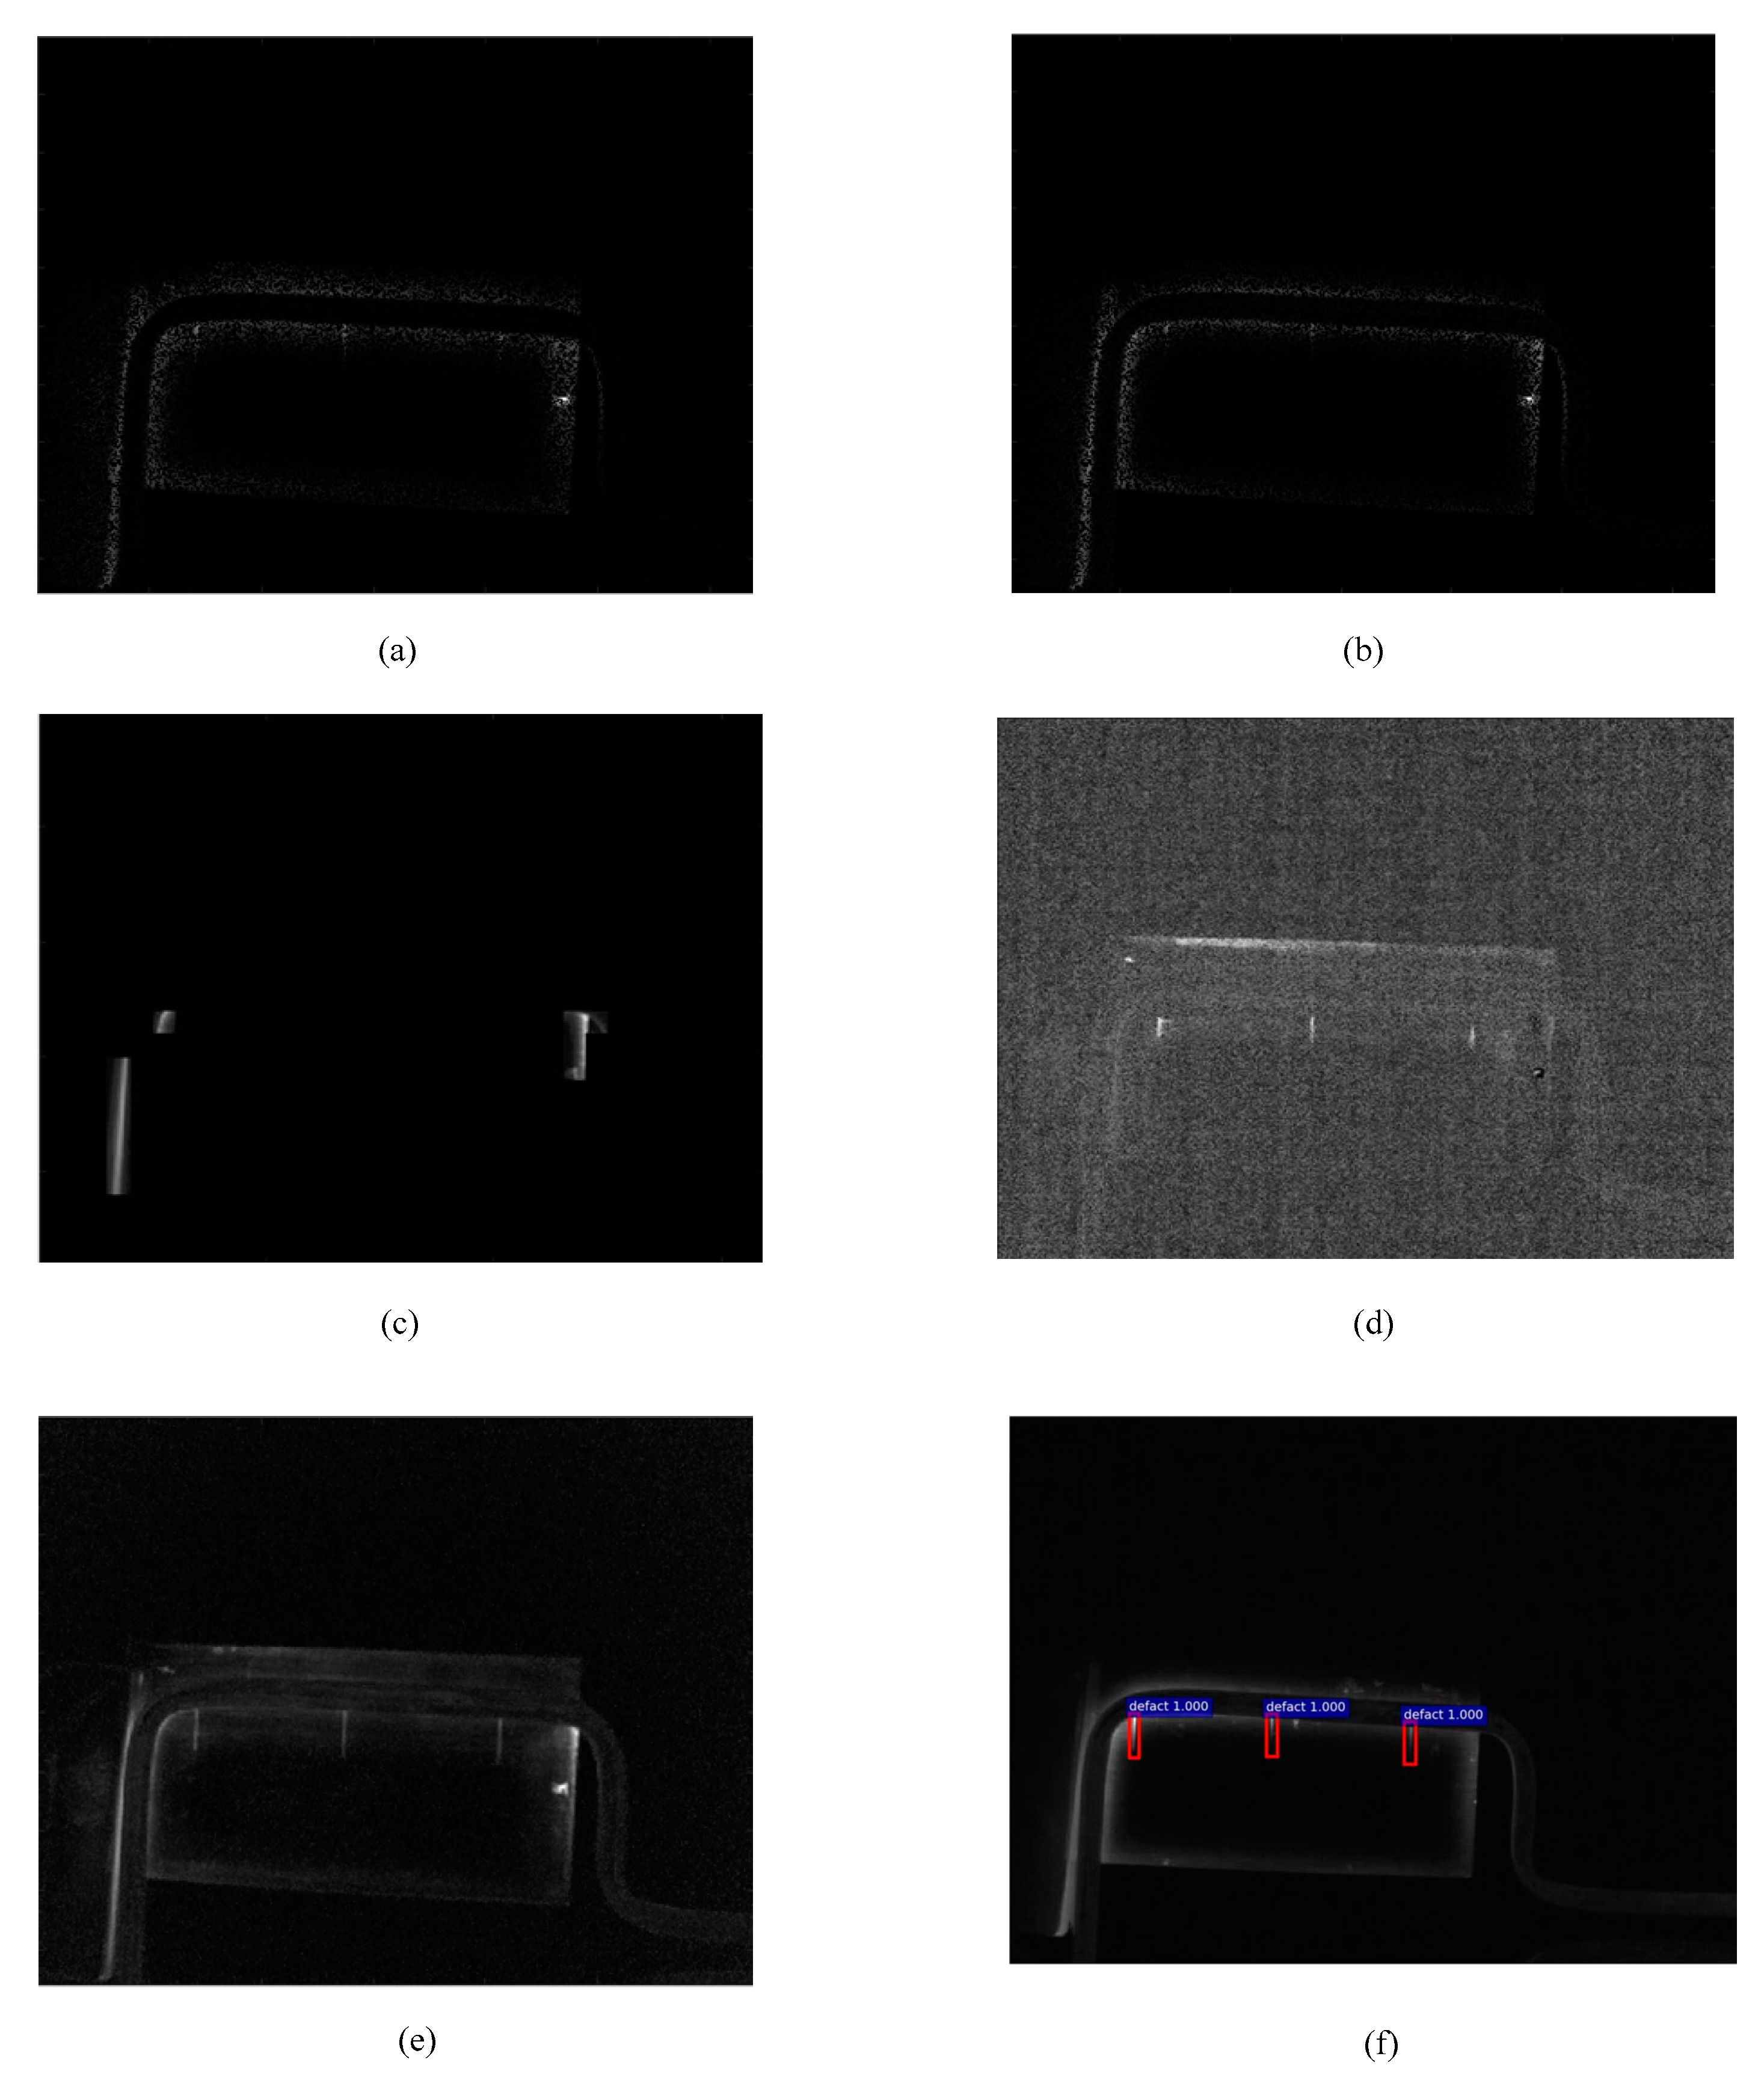
Figure 6.
Penetration testing result on welding line sample (e).
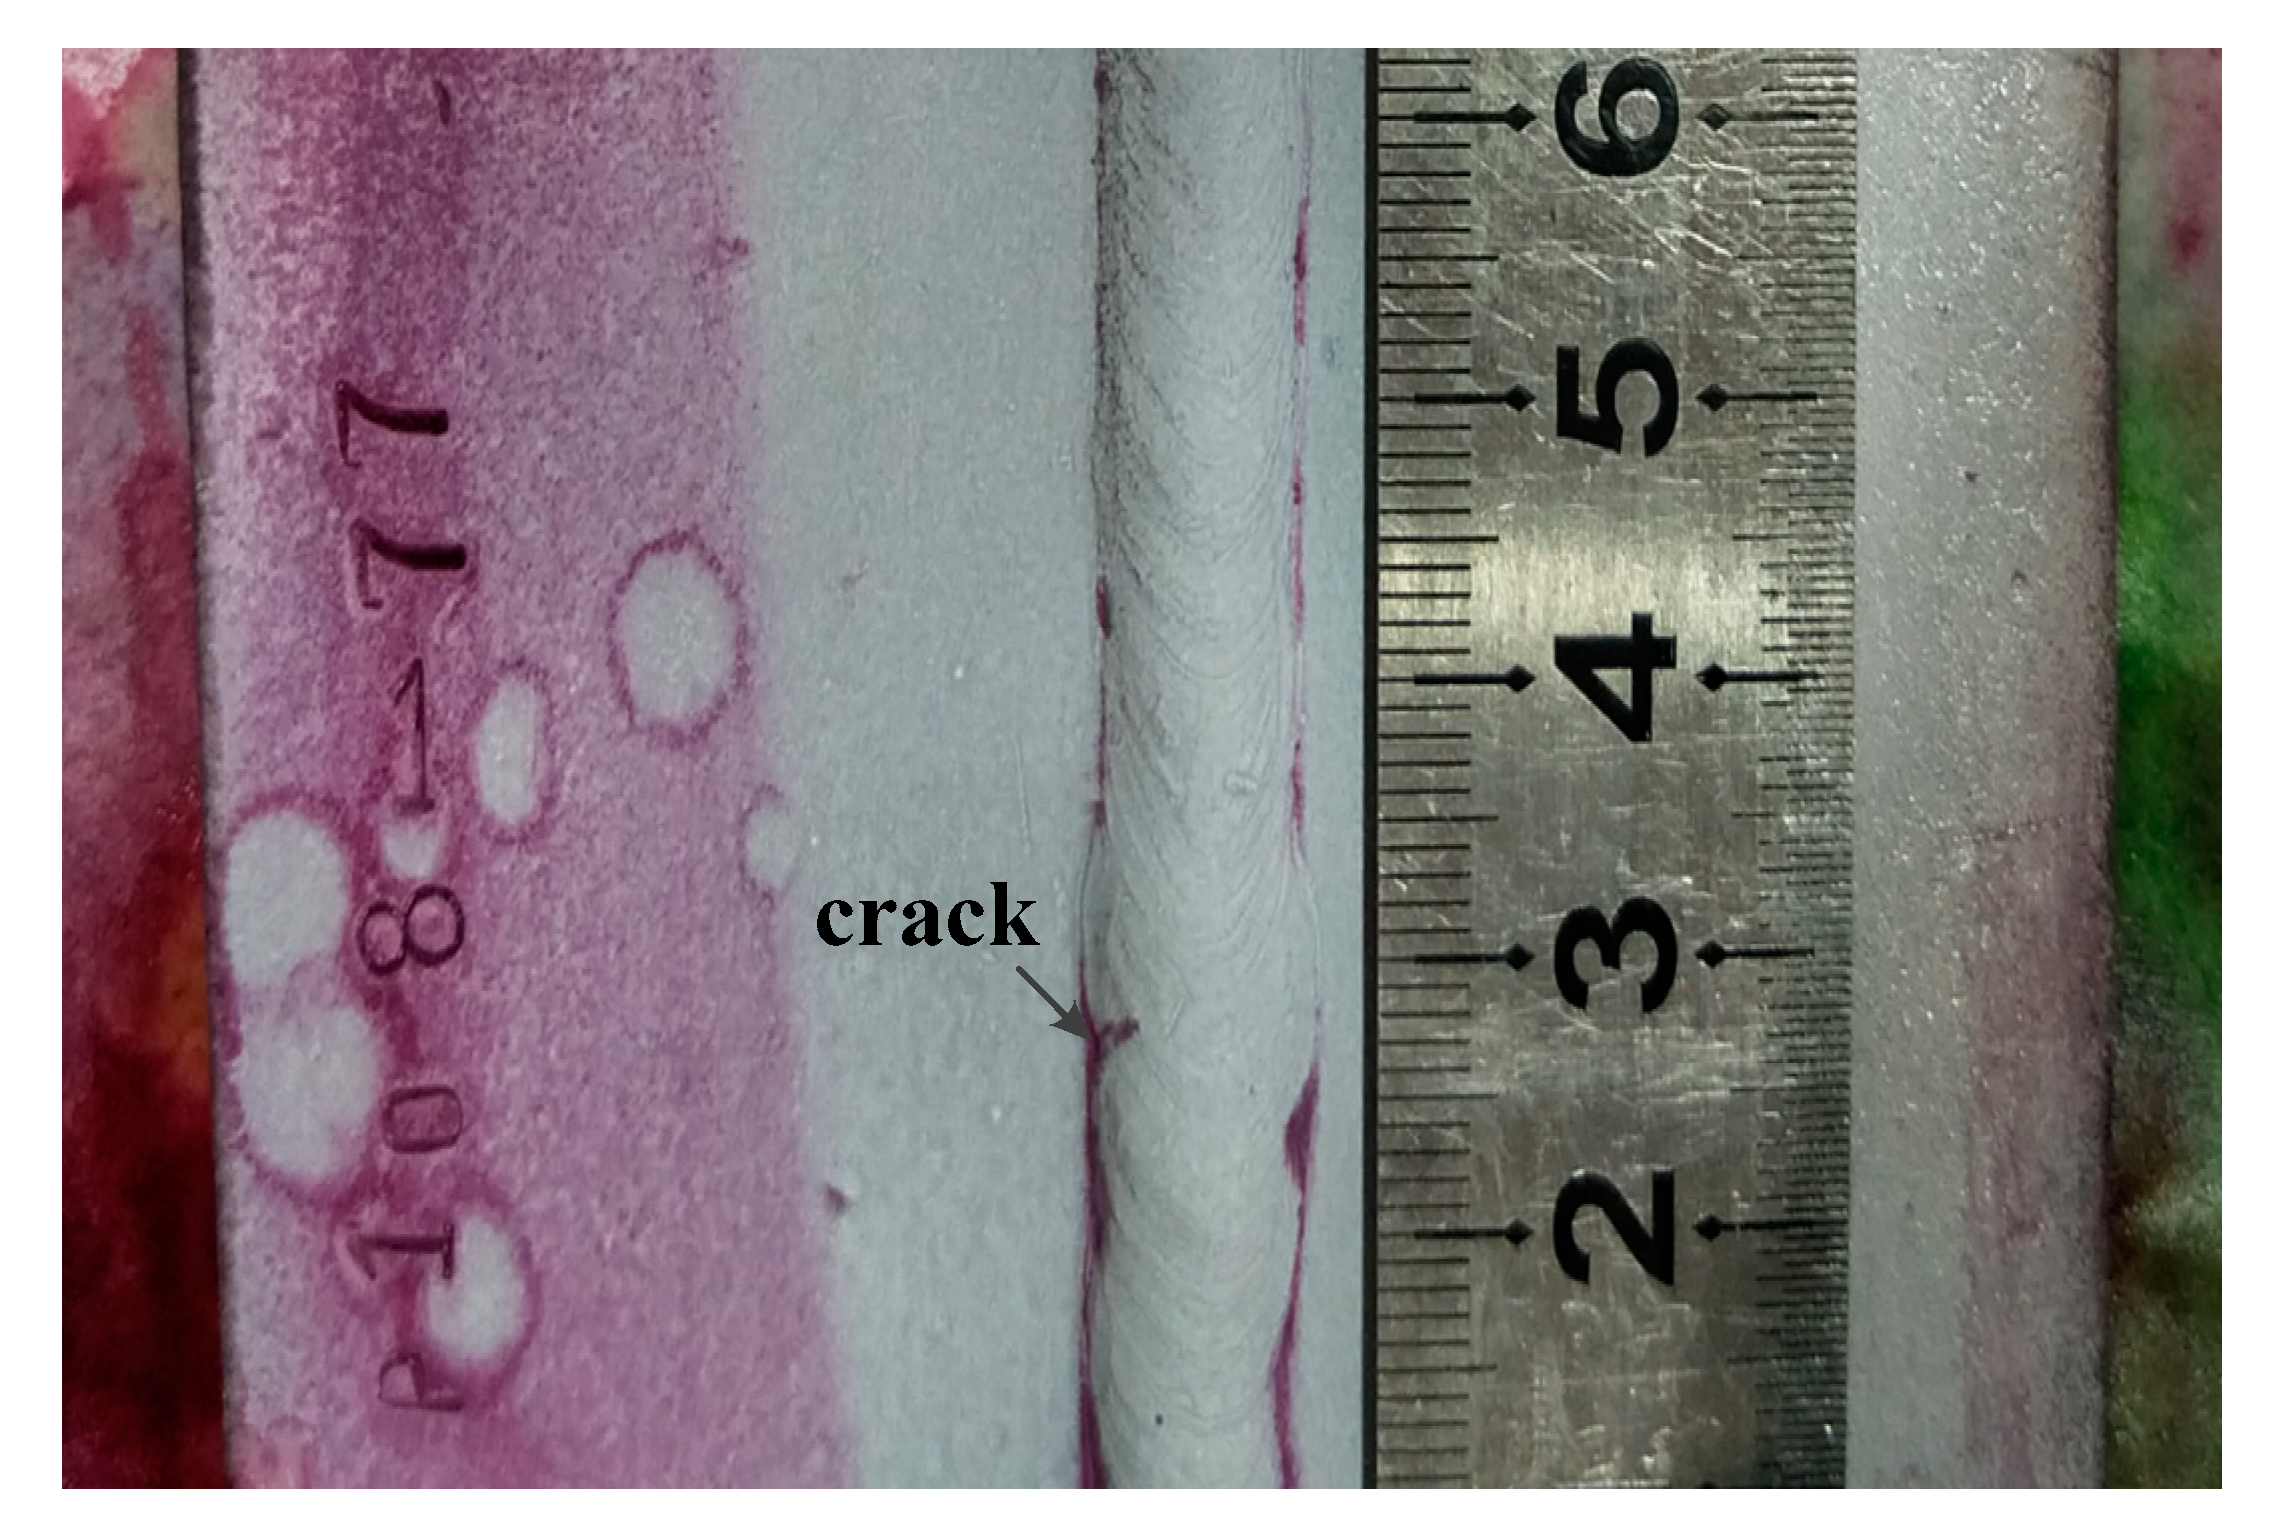
Figure 7.
Principle components calculated from thermal sequences of welding line sample (e).

Figure 8.
Flaws detection results provided by different algorithms on welding line sample (e): (a) TSR; (b) PPT; (c) ARDVB; (d) EVBTF; (e) SVD-RARX; (f) proposed method.
Figure 8.
Flaws detection results provided by different algorithms on welding line sample (e): (a) TSR; (b) PPT; (c) ARDVB; (d) EVBTF; (e) SVD-RARX; (f) proposed method.

Table 1.
The hyper-parameters from Faster-RCNN.
| Hyper-Parameters | Value |
|---|---|
| Batch size | 256 |
| Overlap threshold for ROI | 0.5 |
| Learning Rate | 0.001 |
| Momentum for SGD | 0.9 |
| Weight decay for regularization | 0.0001 |
Table 2.
The description of different samples.
| Sample | Indication | Dimension | Defect Information | Picture |
|---|---|---|---|---|
| Sample (a) 316# stainless steel |  | 120 × 60 × 6 (mm) | 3 types of cracks with different depth (8 × 0.5 × 1.5, 8 × 0.5 × 1.7, 8 × 0.5 × 2 (mm)) notches are manufactured | 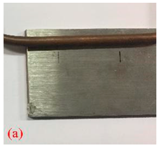 |
| Sample (b) 316# stainless steel |  | 130 × 130 × 10 (mm) | Five 45°-angle man-made cracks (8 × 0.1 × 1 (mm)) | 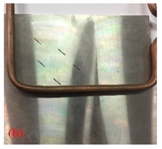 |
| Sample (c) 45# steel |  | 130 × 130 × 10 (mm) | Different angle cracks (0°, 15°, 30°, 45°, 60°, 75°, 90°), the cracks size are all 8 × 0.1 × 1 (mm) | 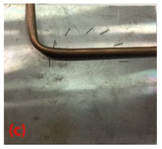 |
| Sample (d) 316# stainless steel |  | 200 × 100 × 18 (mm) | A long natural crack | 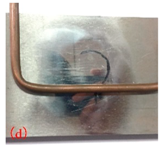 |
| Sample (e) welding line |  | 150 × 106 × 65 (mm) | Micro natural cracks |  |
Table 3.
Results of different detection methods evaluated by different samples.
| Methods | POD of Different Samples | ||||
|---|---|---|---|---|---|
| Sample (a) | Sample (b) | Sample (c) | Sample (d) | Sample (e) | |
| TSR | 0.42 | 0.40 | 0.29 | 0.10 | 0.00 |
| PPT | 0.33 | 0.30 | 0.43 | 0.10 | 0.00 |
| ARDVB | 0.17 | 0.40 | 0.43 | 0.05 | 0.00 |
| EVBTF | 1.00 | 0.60 | 0.71 | 0.80 | 0.00 |
| SVD-RARX | 1.00 | 1.00 | 0.90 | 0.60 | 0.00 |
| Proposed Method | 1.00 | 1.00 | 1.00 | 0.95 | 0.92 |
Table 4.
Results of different detection methods evaluated in the whole dataset.
| Methods | Evaluation Index | ||
|---|---|---|---|
| TP | FN | POD | |
| TSR | 17 | 58 | 0.23 |
| PPT | 18 | 57 | 0.24 |
| ARDVB | 16 | 59 | 0.21 |
| EVBTF | 49 | 26 | 0.65 |
| SVD-RARX | 53 | 22 | 0.71 |
| Proposed Method | 73 | 2 | 0.97 |
© 2018 by the authors. Licensee MDPI, Basel, Switzerland. This article is an open access article distributed under the terms and conditions of the Creative Commons Attribution (CC BY) license (http://creativecommons.org/licenses/by/4.0/).
Share and Cite
MDPI and ACS Style
Hu, J.; Xu, W.; Gao, B.; Tian, G.Y.; Wang, Y.; Wu, Y.; Yin, Y.; Chen, J. Pattern Deep Region Learning for Crack Detection in Thermography Diagnosis System. Metals 2018, 8, 612. https://doi.org/10.3390/met8080612
AMA Style
Hu J, Xu W, Gao B, Tian GY, Wang Y, Wu Y, Yin Y, Chen J. Pattern Deep Region Learning for Crack Detection in Thermography Diagnosis System. Metals. 2018; 8(8):612. https://doi.org/10.3390/met8080612
Chicago/Turabian StyleHu, Jue, Weiping Xu, Bin Gao, Gui Yun Tian, Yizhe Wang, Yingchun Wu, Ying Yin, and Juan Chen. 2018. "Pattern Deep Region Learning for Crack Detection in Thermography Diagnosis System" Metals 8, no. 8: 612. https://doi.org/10.3390/met8080612
Note that from the first issue of 2016, this journal uses article numbers instead of page numbers. See further details here.