Carbon Redistribution in Martensite in High-C Steel: Atomic-Scale Characterization and Modelling


1
Steel Institute (IEHK), RWTH Aachen University, Intzestraße 1, 52072 Aachen, Germany
2
Department of Materials Science and Metallurgy, University of Cambridge, 27 Charles Babbage Rd, Cambridge CB3 0FS, UK
*
Author to whom correspondence should be addressed.
Metals 2018, 8(8), 577; https://doi.org/10.3390/met8080577
Submission received: 19 June 2018
/
Revised: 15 July 2018
/
Accepted: 23 July 2018
/
Published: 25 July 2018
Abstract
:The microstructure of the as-quenched plate martensite in a high-C steel 100Cr6 was characterized by means of electron microscopy and atom probe tomography. The carbon redistribution behavior was investigated at the atomic scale, which revealed the nature of the transformation dynamics influenced by carbon and other substitutional alloying elements. A model was proposed to predict the carbon redistribution at twins and dislocations in martensite, which was based on their spatial arrangements.
1. Introduction
As one of the most widely used bearing steel in the manufacturing, transportation and construction industry, 100Cr6 has been extensively investigated in the last few decades. Martensitic and/or bainitic microstructures are frequently employed during its application. Bearing steels are exposed to extreme conditions throughout their lifetime and suffer from rolling contact fatigue. As a result, damage builds up below the contact surface and results in detrimental microstructural changes, such as dark etching regions, white etching regions or white etching areas. Understanding the microstructure of the as-quenched martensite in high-C steels is crucial for optimizing the behavior of high-performance components, such as bearings, as it constitutes the initial conditions for proceeding elemental partitioning and precipitation during tempering. However, most research has been focused either on the microstructure during applications or on the engineering problem itself. The importance of research on the as-quenched martensite has been neglected in the last few decades and our understanding of fundamental mechanisms of the as-quenched microstructure remains unclear.
The carbon concentration in steels at the martensite transformation temperature is essential in determining the final morphology of martensite. It is well-known that low-C steels tend to form lath-structured martensite, whereas a high carbon content leads to heavily twinned areas within the plate-shaped martensite [1]. Such morphology changes have been reported to have a great impact on the nucleation sites and rate as well as subsequent growth of precipitates during tempering [2]. The local redistribution of carbon is likely related to the martensite morphology that is formed upon quenching. Clarke et al. [3] reported the ultra-fine carbon clustering in both water- and oil-quenched martensitic microstructure of a 4340 steel (42NiCr 7-3). The atom probe tomography investigations of the lath-structured martensite revealed localized carbon concentrations of 12–14 at%. Clustering was attributed to the segregation of carbon to dislocations and the formation of Cottrell atmospheres despite significant higher carbon concentrations in comparison to the reported values of 6–8 at% [4,5]. Li et al. [6] studied the influence of rolling contact loading on the plate-like martensitic microstructure and the resulting distributions of the major alloying elements C and Cr using atom probe tomography. They found that the microstructure in the as-received state was characterized by a plate-like martensitic structure, which consists of alternating C-depleted and C-enriched regions spaced about 20 nm apart. Upon rolling contact loading, the original plate-like martensitic structure evolved into a nanosized equiaxed grain structure with C segregation of up to 5 at% at the grain boundaries. However, no information on the influence of the initial (as-quenched) structure was reported yet.
The present work aims to investigate the as-quenched carbon redistribution in the high-C bearing steel 100Cr6 using transmission electron microscopy (TEM) and atom probe tomography (APT). A model is proposed to quantify and predict the carbon segregation at twins and dislocations. The implications of local carbon enrichment in morphology transition from laths to plate martensite in steels are explored using the model.
2. Experimental
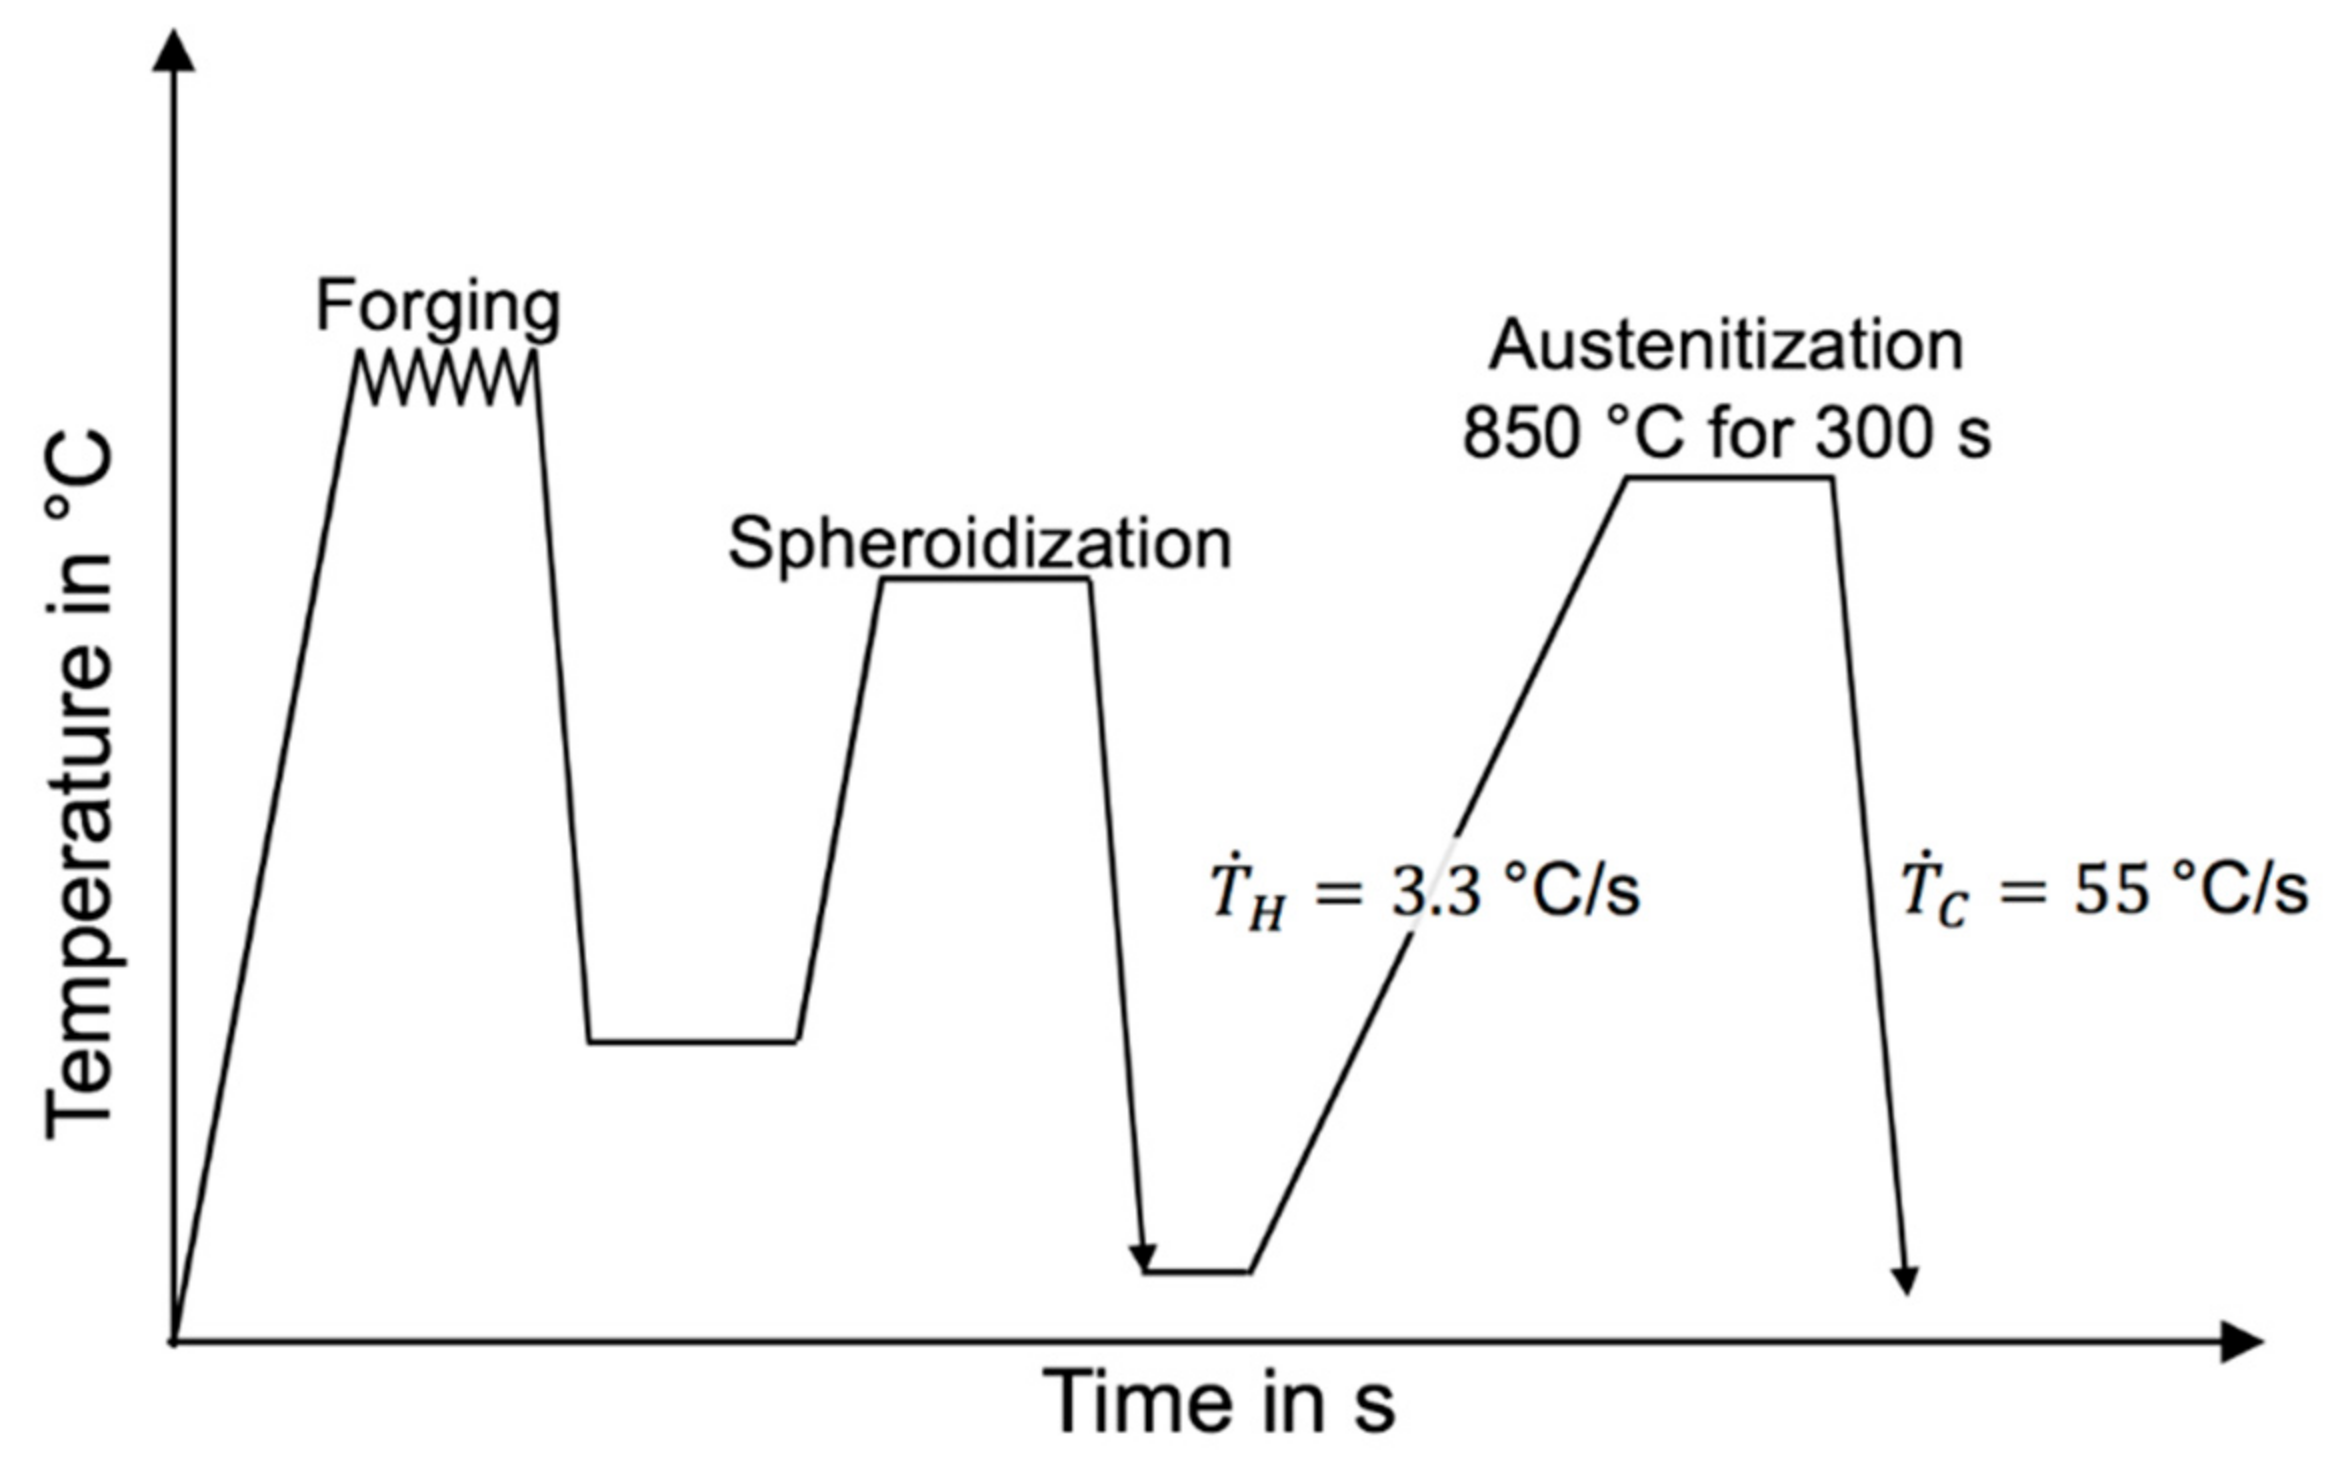
The chemical composition of the 100Cr6 steel studied here is given in Table 1. The steel is mainly alloyed with Cr and microalloyed with Mo. Si and Mn contents are at low levels. The N content in the steel is approximately 75 ppm. The heat treatment cycle is illustrated in Figure 1.
The 100Cr6 steel, Fe-0.967C-0.3Si-0.23Mn-1.38Cr (wt%), was hot-forged and soft-annealed at 800 °C for 7200 s, before being cooled down to form a spheroidized microstructure. Subsequently, the samples were heated up at a rate of 3.3 °C/s and austenitized at 850 °C for 300 s, which was followed by quenching to room temperature in Ar. The heat treatment was performed in a Bähr 805A dilatometer with cylindrical samples of Ø3 mm × 10 mm. SEM studies were carried out on a Zeiss Sigma field-emission scanning electron microscope (Carl Zeiss Microscopy GmbH, Jena, Germany). TEM studies were performed on a Tecnai F20G2(France-Biolmaging, Montpellier, France). TEM foils were prepared with a twin-jet electro polishing device, using an electrolyte composed of 10 vol% perchloric acid and 90 vol% acetic acids and applying a voltage of 58 V. APT specimens were cut from the heat-treated bulk material with a size of 0.2 × 0.2 × 10 mm3, which was electro-polished with the standard micro-polishing methods. After electro-polishing, the focus ion beam (FIB) was applied for sharpening the sample tip to a final radius (24.6 nm) for measurement. APT measurements were conducted on a Local Electrode Atom Probe (LEAP 3000X HR, Cameca Instruments, Inc., Madison, WI, USA) system equipped with a reflectron for improved mass resolving power. Measurements were obtained in the voltage pulsing mode at a specimen temperature of approximately 60 K and a pulse fraction of 15%. The collected raw data were reconstructed into three-dimensional (3D) atomic maps and a precise decomposition process was conducted using the integrated visualization and analysis software (IVAS).
3. Results
3.1. Metallography and Microstructure
The microstructure during processing is shown in Figure 2. Figure 2a reveals the spheroidized microstructure prior to the austenitization of 100Cr6. It consists of a ferritic matrix with spheroidized carbides, which was indicated by their bright contrast in the additional scanning electron microscope (SEM) image. After quenching, the microstructure exhibits a martensitic matrix with partially dissolved spheroidized carbides (Figure 2b). By using metallographic methods (i.e., grinding, polishing, Klemm etching and analysis of the following image by contrast), the volume fraction of carbides is estimated from the area fraction in the SEM images by the measuring of 2000 particles. This yielded 14 vol% and 3 vol% before and after austenitization, respectively [4]. During austenitization, the average carbide size decreases from 0.63 ± 0.02 µm to 0.49 ± 0.02 µm. After austenitization at 850 °C for 300 s, most of the spheroidized carbides are dissolved and only 3 vol% remain with an average size of 0.49 ± 0.02 µm. After quenching, the microstructure exhibits a martensitic matrix with partially dissolved spheroidized carbides (Figure 2c,d). As shown in Figure 2b,d, the spheroidized particles become smaller and more spherical after quenching.
The partially dissolved spheroidized carbides have been identified in a previous study [4] to be (Fe, Cr)3C by employing TEM for crystallographic analysis with the zone direction of [011] using the method of SAD (Selected Area Diffraction) and APT for the identification of chemical composition.
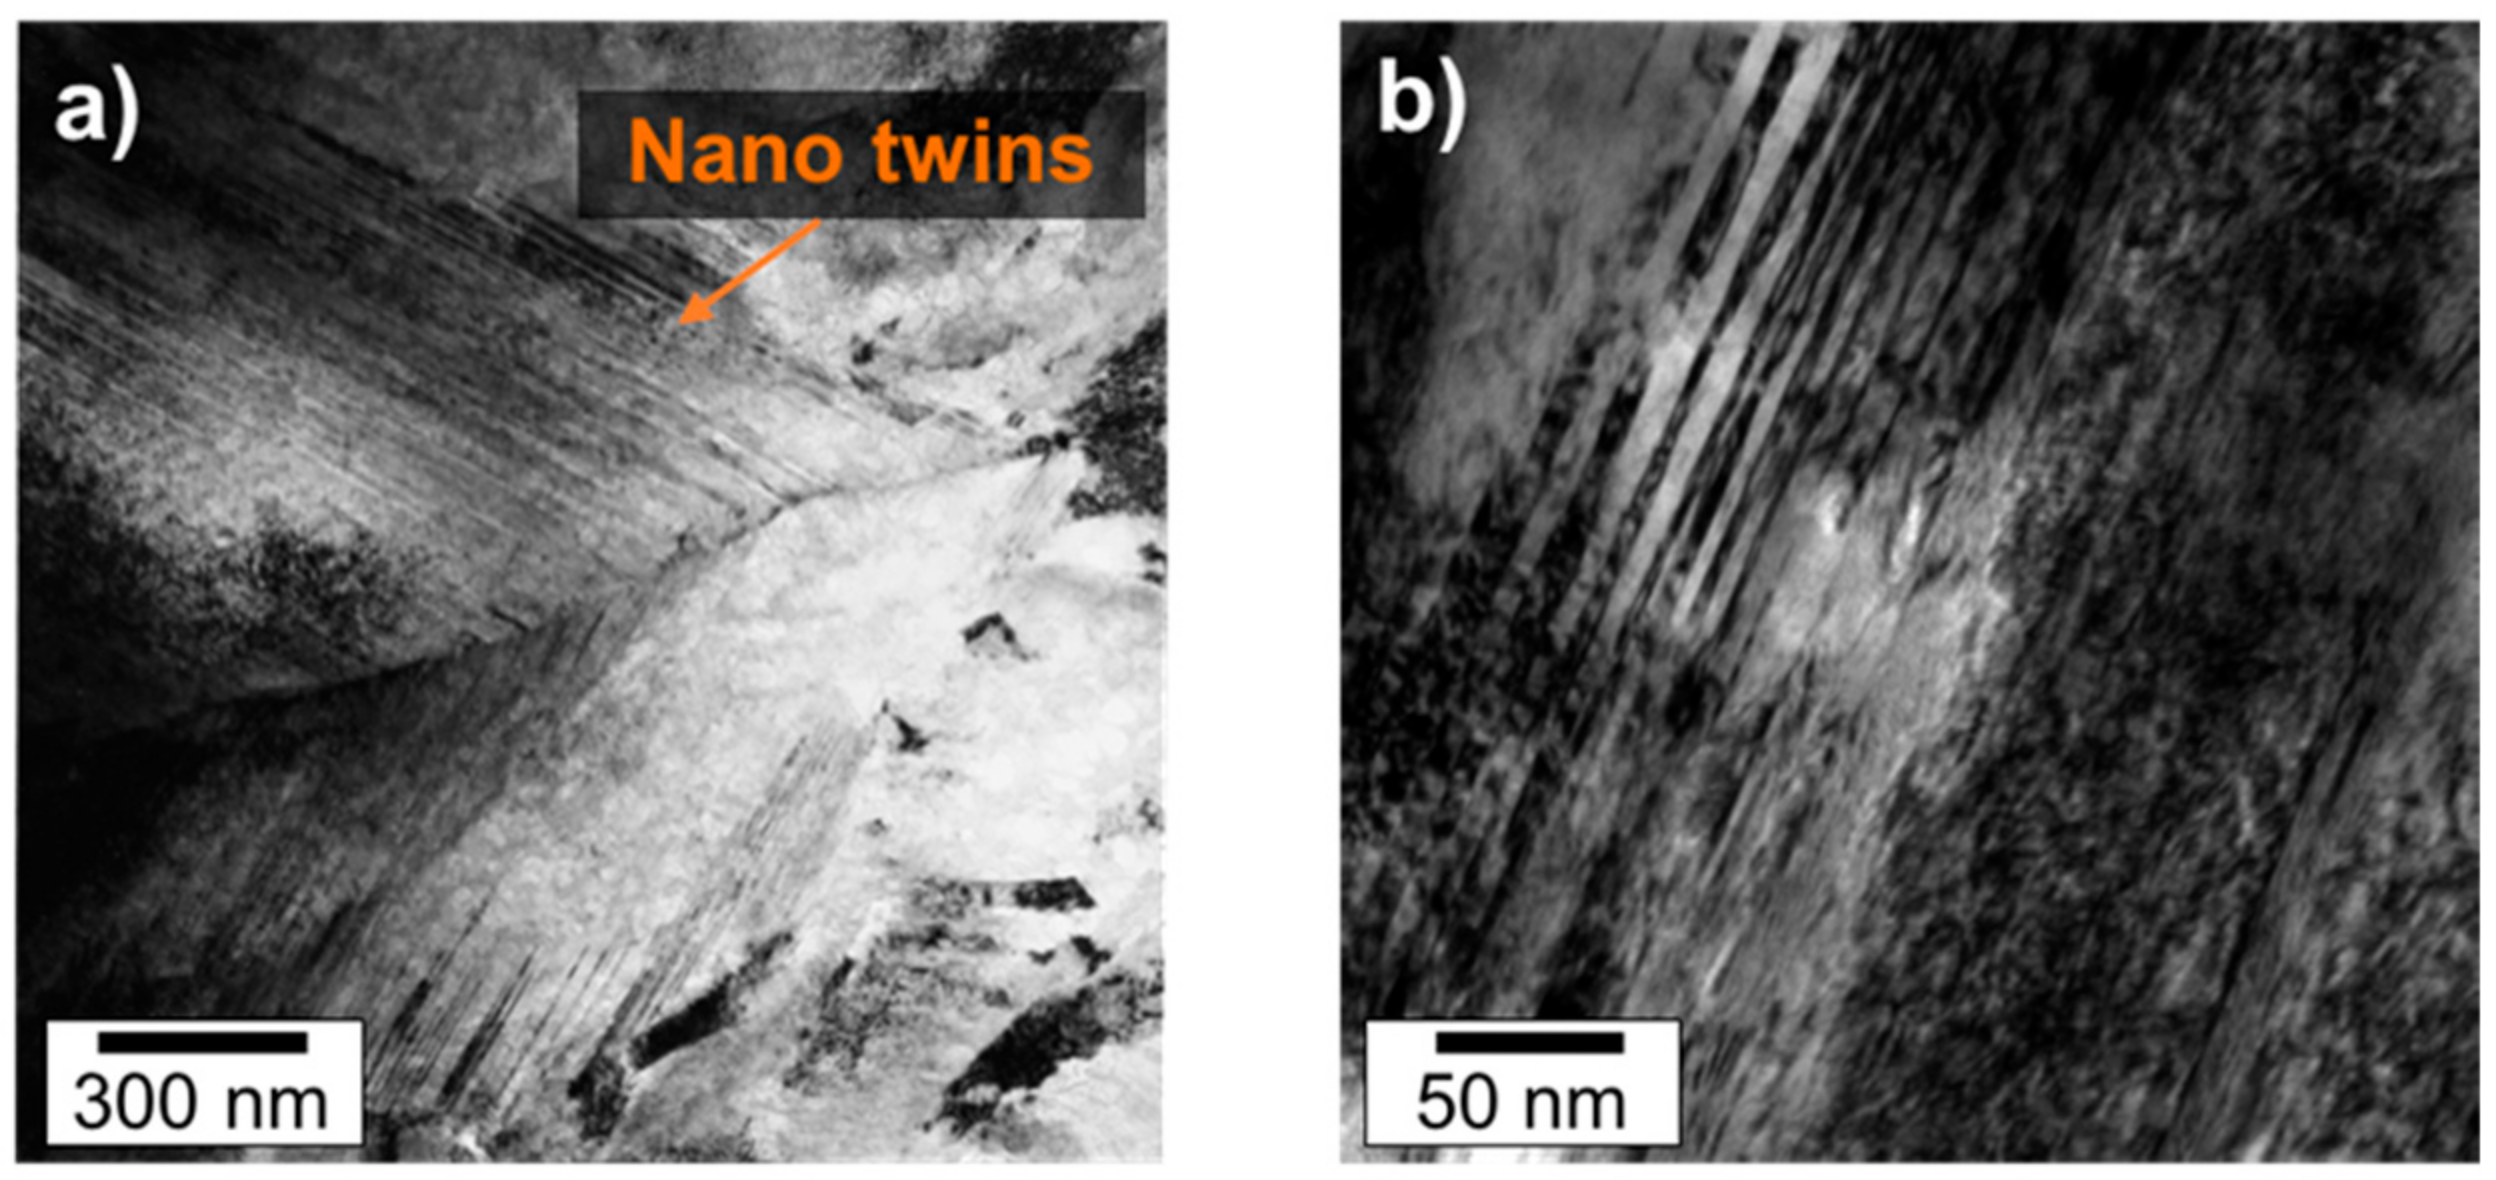
The Cr concentration exhibits a maximum value (16 at%) at the surface of the spheroidized carbides, which gradually decreases from surface to the core down to a level of about 2 at% [7]. Bright field transmission electron microscope (TEM) images in Figure 3 display a martensitic microstructure in the as-quenched state. The plate-like martensitic microstructure is characterized by {112}α nano-sized twins. Figure 3a illustrates the two adjacent domains of the parallel-aligned twins separated by its midrib. The TEM micrograph with a higher magnification in Figure 3b enables the determination of the twin length and thickness, which was found to be in the range of 100–500 nm and 5–10 nm, respectively.
3.2. Atom Probe Tomograpy
Figure 4a shows the 3D atom map of carbons with carbon iso-concentration surfaces of 7.0 at% in the as-quenched state. A total of 52.6 million ions was acquired from APT measurements. It is clear that the distribution of carbon atoms in the analysis volume was not uniform. The enrichment and depletion zones of carbon can be recognized in the elemental map. The carbon evidently accumulates at the depicted grain boundary (GB) and at twin boundaries within the martensite plate. In addition, the formation of carbon solute clusters (8–15 at% carbon) was visible. The carbon enrichment at the GBs yields an average concentration of about 6.5 at%.
Inside the martensite plates, the carbon becomes segregated in a layered manner, indicating the twinning pattern in martensite. A region of interest (ROI) that was aligned perpendicular to the twin boundaries is highlighted in yellow. The atomic representation of the carbon distribution along the z-axis of the marked ROI in Figure 4b illustrates the periodic segregation of carbon at twin boundaries. The corresponding 1D-concentration profile in Figure 4c facilitates the identification of twin boundaries by the spikes in the carbon concentration. The C-content at the twin boundaries ranges from 3.5–5.5 at% with an approximate average of 4.5 at%. On this basis, an average twin thickness of 5.7 ± 1.2 nm is determined, which is consistent with TEM observations. The substitutional elements, such as Si, Mn and Cr, display no evidence of segregation at twin boundary interfaces, which was indicated by the 1D-concentration profile. The calculated 2D concentration map in Figure 4d confirms the carbon segregation to the twin boundaries in addition to the local C enrichment within the twin boundaries of maximal 6 at%. The substitutional elements, such as Si, Mn and Cr, display no evidence of segregation at the twin boundary interfaces, which was indicated by the 1D-concentration profile in Figure 4b.
A detailed investigation of the distribution of interstitial and substitutional elements within the ROI of Figure 4 is provided in Figure 5. A 2D-atomic map (Figure 5a) is separated into the atomic distribution of interstitial carbon atoms (Figure 5b,c) and the substitutional elements of silicon and manganese (Figure 5d,e). As above-mentioned, carbon exhibits a periodic segregation, which coincides well with the experimentally determined spacing of twin boundaries. As a precaution and validation of previous observations, a 2D concentration distribution of carbon atoms within the ROI was calculated (Figure 5c). The 2D concentration map confirms the segregation of carbon to the twin boundaries and a steep carbon gradient at the twin boundary interface. In addition, the distribution of carbon within a single twin boundary reveals local enrichment. The maximum carbon concentration within the enriched areas of twin boundaries locally achieves 6 at%. On the other hand, the substitutional elements in 100Cr6, such as Si and Mn, have a homogeneous distribution of atoms across the ROI (Figure 5d,e). These results indicate that carbon atoms dictate the extent of the twinned structure as they promote high lattice distortions during the martensite formation process.
3.3. Modelling Carbon Redistribution in A Martensite Plate
A model for C redistribution at twins and dislocations is proposed. The carbon in martensite is distributed between the microstructural features present in the steel, including martensite plates (Cα'), retained austenite (Cγ) and carbides (Cθ): C = Cα' fα' + Cγ fγ + Cθ fθ, where C is the total carbon content in the steel and fi is the volume fraction of the respective feature (fα' + fγ + fθ = 1). Cα' dictates the effective strength of the matrix by controlling the formation rate of dislocations and twins [1]. The effects of carbon partitioning into austenite and spheroidized carbides were not considered in order to simplify the analysis and due to their low volume fraction measured (Figure 2d).
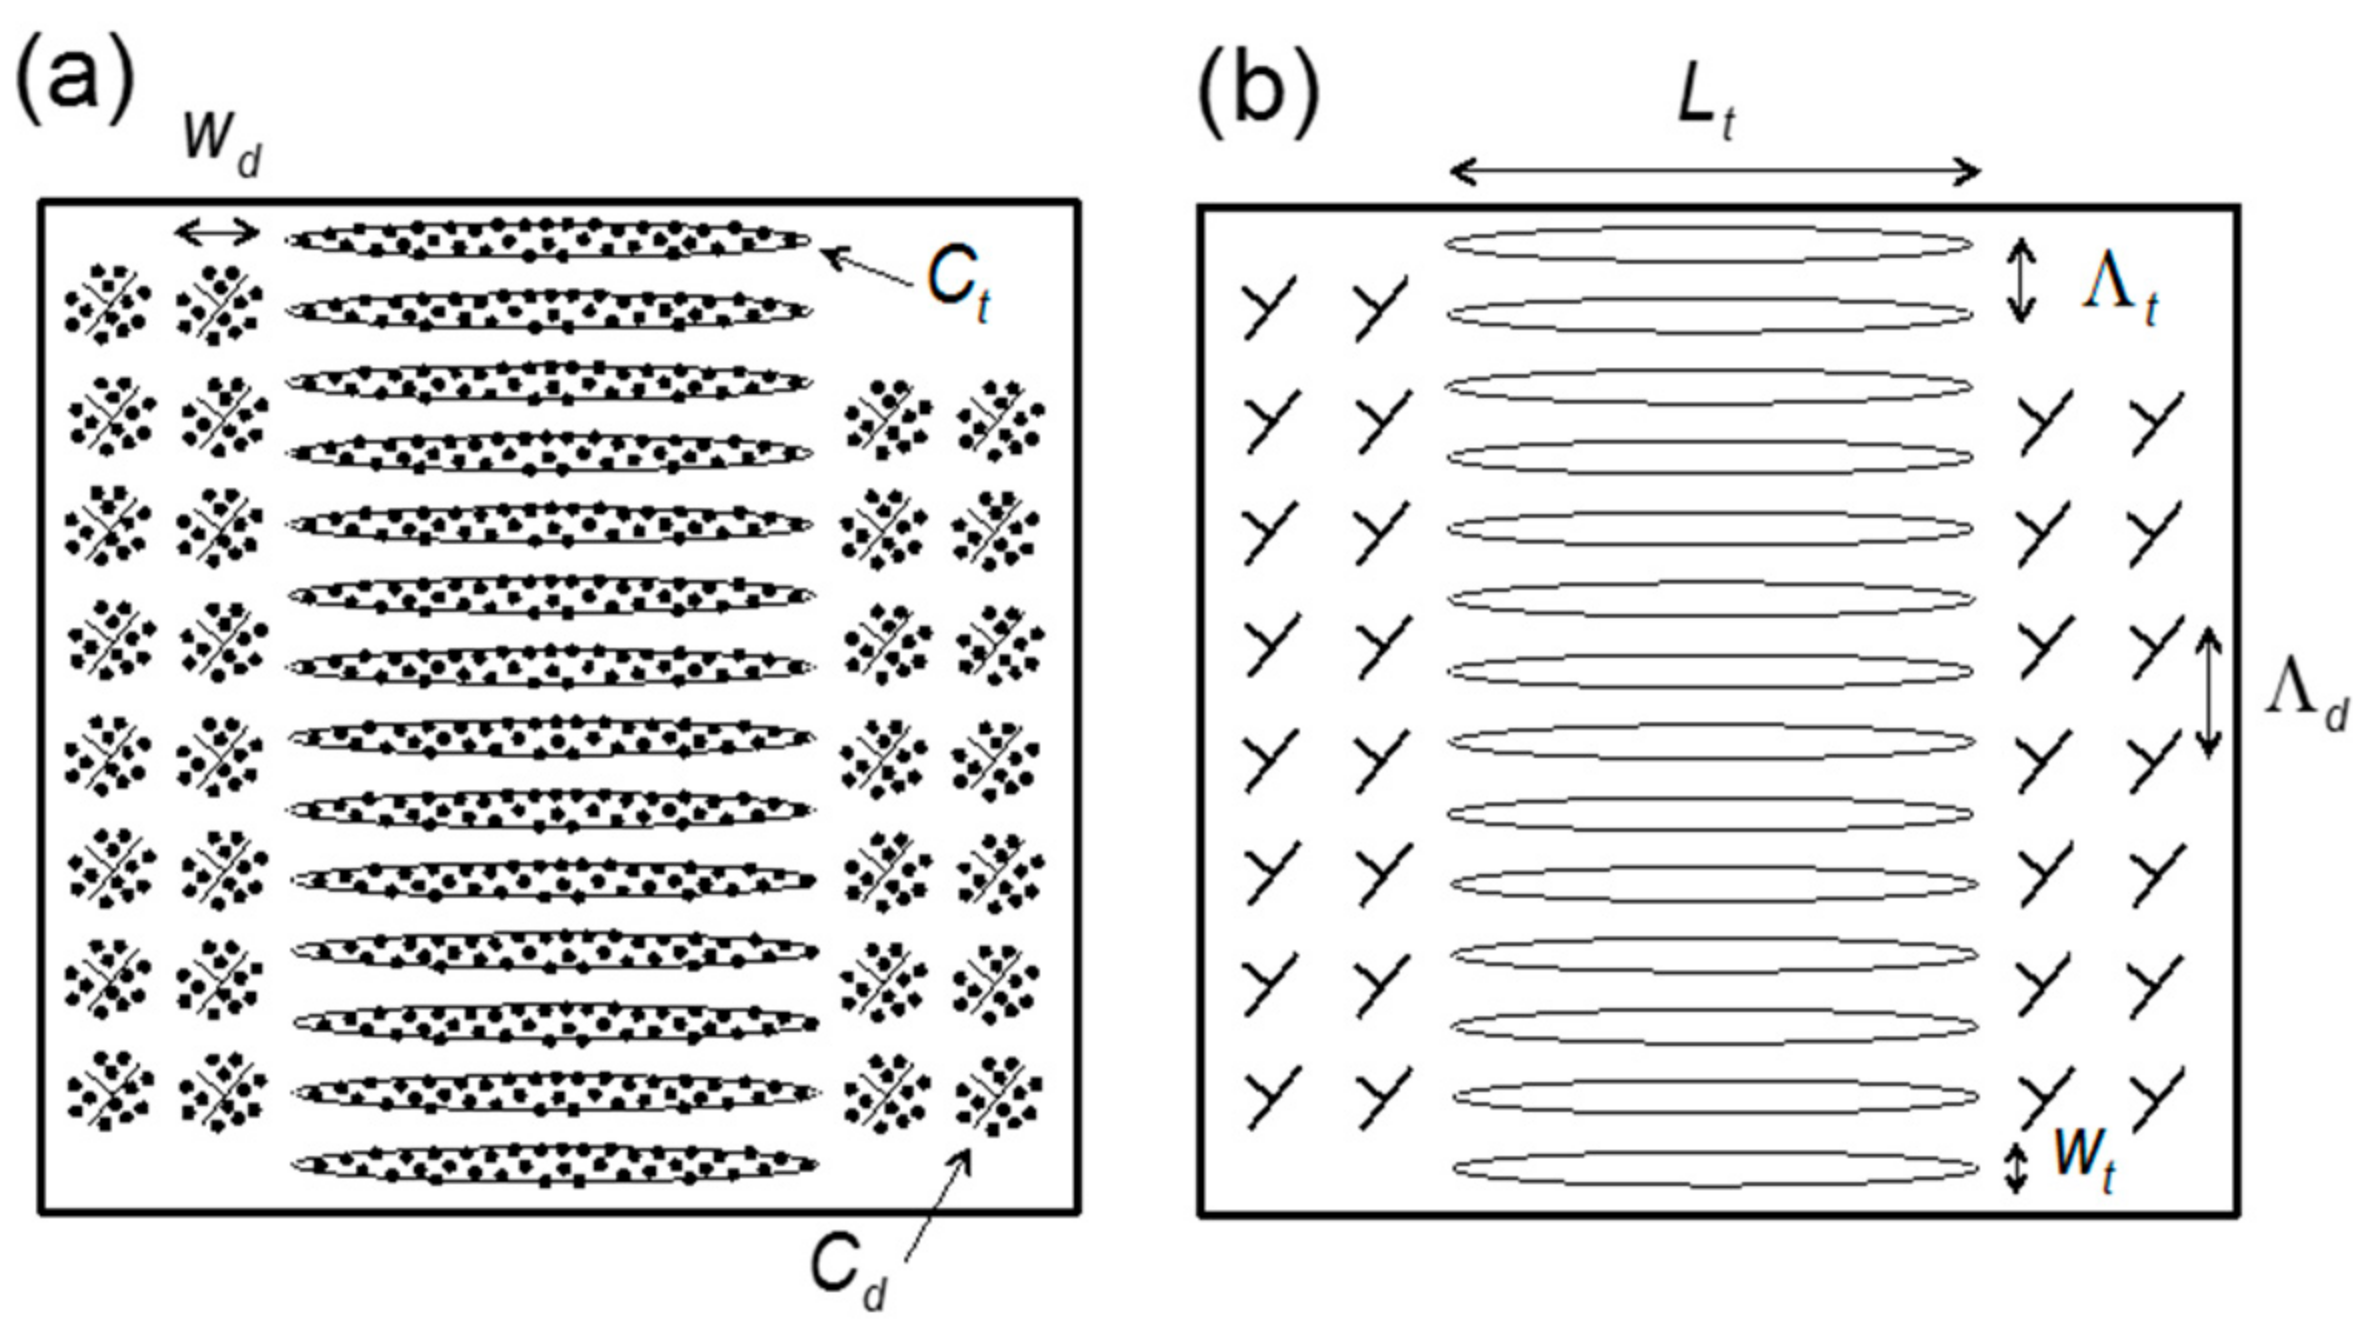
The carbon atoms in a plate mostly redistribute to twins (midribs) and dislocations to accommodate local lattice distortions during the transformation [5]. Shibata et al. [8] studied the mechanisms of martensite plate formation during cooling. The midribs mark the starting point of the transformation where the mechanical twins form. Twins are able to be allocated with a great amount of carbon atoms and can accommodate a high fraction of lattice distortion [5,9,10]. As the plate develops, the remaining carbon atoms are allocated at the dislocations in the form of Cottrell atmospheres [11]. The resulting carbon redistribution in a two-dimensional plate is schematically shown in Figure 6a, which is consistent with the carbon enrichment maps illustrated in Figure 4 and Figure 5. The resulting microstructure containing twins and dislocations is also shown in Figure 6b. The total carbon content in a plate martensite is defined as:
where Ctwin and Cdis are the contents of carbon segregating to twins and dislocations, respectively; and ftwin and fdis are the area fractions of carbon atoms segregating to twins and dislocations, respectively.
The experimental observations reported in the previous section showed that the twins have an average allocation of Ctwin = 4.5 at%. Similarly, it has been found experimentally that up to Cdis ≈ 6 at% can be allocated by dislocations [3,11]. These values dictate the number of twins and dislocations that are necessary to fully accommodate Cα'.
In a martensite plate (Figure 6), the fraction of carbon allocated by {112}α twins equals the total twinned area: ftwin = ntwin Atwin, where ntwin is the number density of twins per plate and Atwin is the area of a twin. The area of ellipsoidal twins is: Atwin = π/4 Lt wt, where Lt and wt are the twin length and thickness, respectively (Figure 6). Experimental results have shown that the twin dimensions remain practically constant and only their number density (ntwin) changes with composition [8]. Thus, Atwin is considered constant with Lt = 200 nm and wt = 5 nm, which was based on Figure 4.
Since twins are only present at the martensite midribs (of size Lt), their number density per unit area in a plate is the inverse product of the mean twin spacing (Λt) and the size of the midrib: ntwin = 1/(Λt Lt). In previous works, it was proposed that the mean twin spacing should be such that all carbon atoms initially redistribute to the twins in the midrib to release the transformation strain energy [5,10,11], which leads to: Λt = ()/b = 2b/(), where lC = b/() is the average spacing of carbon atoms available for segregation and b = 0.286 nm is the Burgers vector. The predicted twin spacing in the as-quenched 100Cr6 (Cα′ ≈ 4.3 at%) is 4.5 nm, which is consistent with observations in Figure 3b. The fraction of carbon redistributing to the twins results in:
The fraction of carbon allocated at dislocations is obtained by combining Equations (1) and (2):
It is interesting to note that Equations (2) and (3) illustrate that the microstructure is refined when the effective carbon content in the steel increases: Λt decreases (hence ftwin increases) when increasing Cα′ and fdis increases with Cα′.
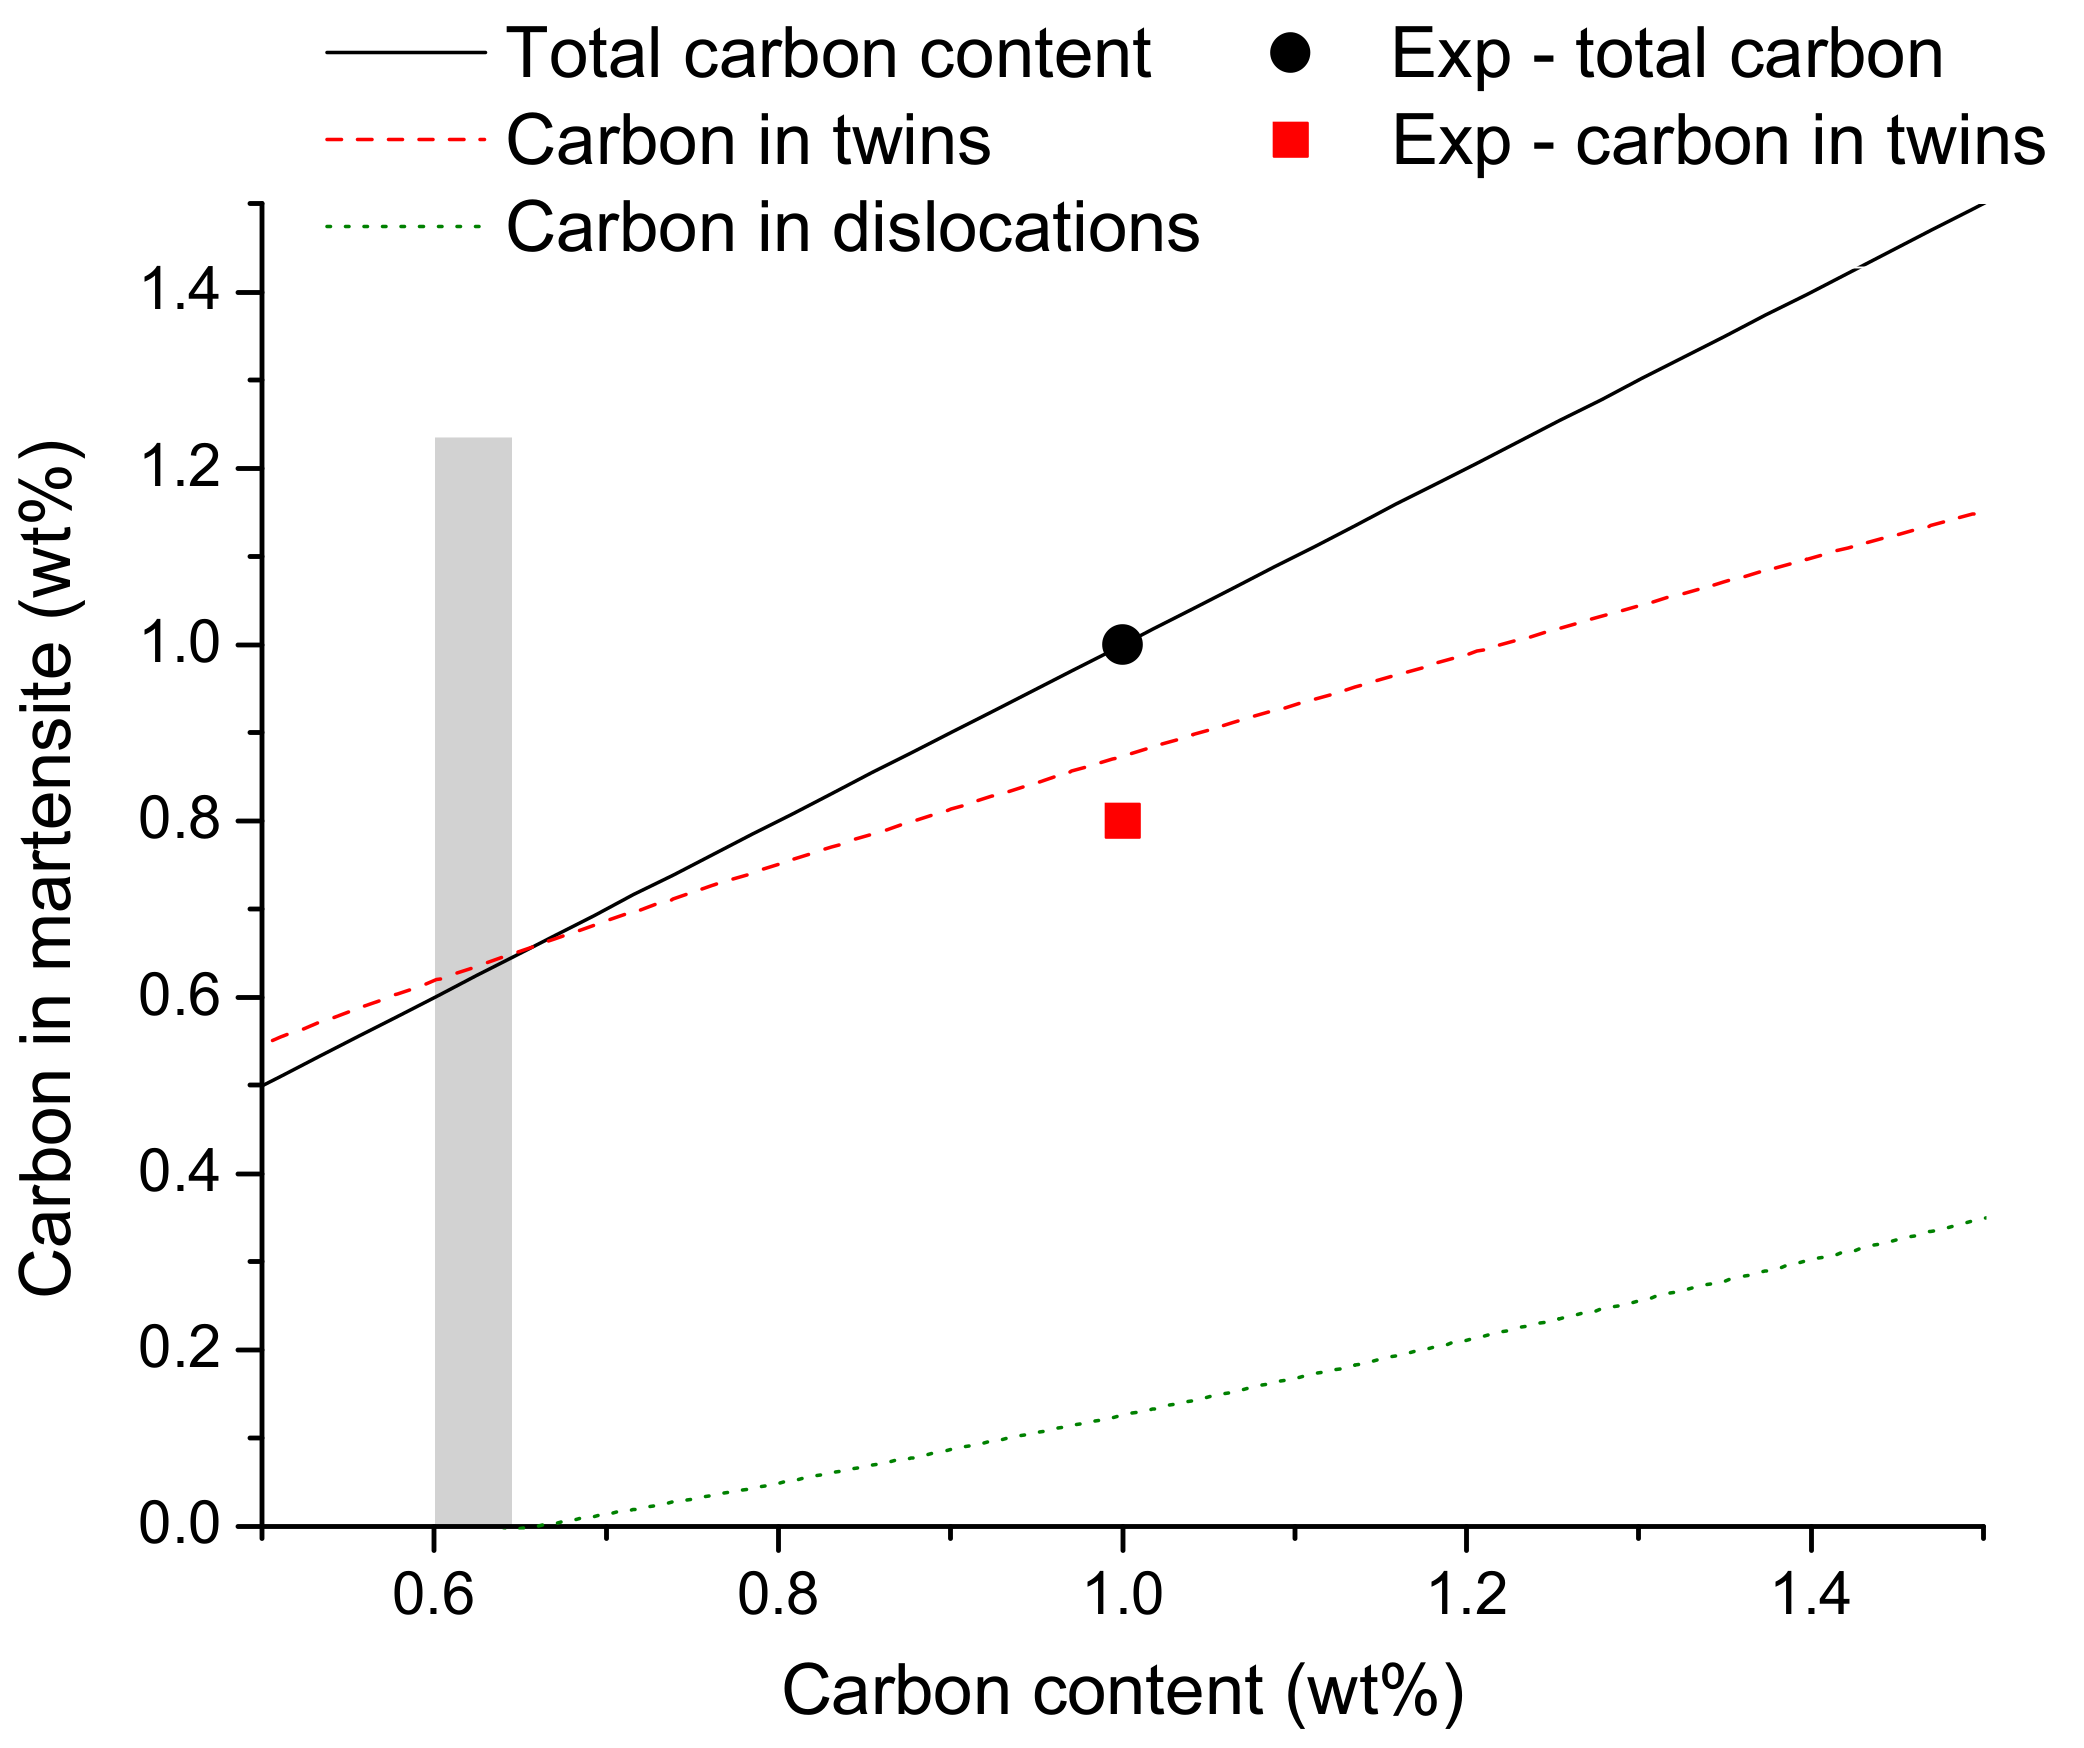
Figure 7 shows the predicted carbon content (in wt%) at the twins (Ctwin ftwin) and dislocations (Cdis fdis) as a function of the total content in a plate.
Most of the carbon redistributes within the twins (approximately 0.85 wt%), while only a fraction (approximately 0.15 wt%) is located at dislocations. It is interesting to note that a very low number of carbon atoms are predicted to enrich dislocations in steels with medium carbon content (0.6–1 wt%) when the plates consist mostly of midribs (twins). This is consistent with experiments showing that martensite units with lower alloying content contain only twins [5,12]. The predictions also show that martensite plates can fully allocate carbon atoms only above Cα′ ≈ 0.65 wt% (gray area in Figure 7). This range corresponds to the transition point between the plate and lath martensite structures [13], where the latter displays a hierarchical structure of dislocation-based laths [14]. The result suggests that the plates form at this critical range to allocate higher strains (hence more carbon content) under this spatial configuration and the distortion energy accommodated by lath-dislocations is no longer sufficient.
4. Discussion
4.1. Carbon Enrichment at Twin Boundary Interfaces in Plate Martensite
As above-mentioned, the plate martensite in high-C 100Cr6 steel contains a large number of nano-sized twins (about 100–500 nm in length and 5–10 nm in thickness) and carbon atoms are enriched at the twin boundary interfaces (approximately 4.5 at% in average). In early studies, the twinning structure in the plate martensite in similar steel systems was reported but this is the first time that the twinned structure and its carbon enrichment behavior have been assessed simultaneously in the as-quenched state. The first study on the carbon redistribution in a high-C steel containing 0.78 wt% C by Miller et al. [15] first observed the carbon segregation at the coherent twin interfaces in the plate martensite (quenched and aged for about 24 h at room temperature) using atom probe field ion microscopy. Stormvinter et al. [5] found the formation of transformation twins in martensite substructures in both 1.2 wt% C and 1.67 wt% C steels by TEM characterization. The twinned plate martensite was observed by Beswick [16] in 100Cr6 steel in the as-quenched state after austenitization at 850 °C for 15 min. Recently, Li et al. [6] observed the C segregation at the nanosized twin boundaries in white etching areas (after a rolling test for 2 h with 2.7 × 10⁷ rolling cycles) in a martensitic 100Cr6 bearing steel by APT characterization. It is believed that the C-enriched twin boundaries act as carbide nucleation sites and promote carbide precipitation during the following tempering process. The study of high-C martensite in an early tempering stage found that the C atoms segregate to the region of twin boundaries, while the width of the carbon-enriched region increases during the tempering process [17]. The carbide precipitation was implied to occur in the plane of twin boundaries during the early stage of tempering [17]. Further, lateral studies proposed that the {112} twin boundaries in plate martensite are favorable nucleation sites of transition carbides (ε-phase) in the high-C steel during the early stages of tempering [2,7,9,17]. It was observed that the precipitation of carbides at the twin boundaries in plate martensite is more pronounced than that within the twins [7].
However, it is interesting to note that the C segregation at {112} twin boundaries (Σ3 boundaries) in austenite is rarely observed [18]. The Σ3 boundary is considered as a high coherent boundary that is associated with much lower energy than the high angle grain boundary (HAGB) [19]. Consequently, the possibility of segregation of alloying elements at twin boundaries in austenite is very low [19]. However, the defects at twin boundaries, such as partial dislocations and elastic strain fields, may facilitate the segregation and result in an increase in the carbon segregation at the Σ3 boundary [19,20].
A model is proposed in the present study to support the experimental findings on the carbon redistribution in martensite when segregating at twins and dislocations. The model is based on estimating the fraction of carbon allocated at twin boundaries, which is determined by the spatial arrangement of twins (plate midribs) forming during the initial steps of the phase transformation. The remaining carbon atoms are allocated at dislocations (plate interiors) and they constitute a low fraction of the total C content in a plate. The models for carbon redistribution in plate martensite, along with previous results in lath-martensite, are employed to understand the role of carbon in the transition of martensite structures.
4.2. Strain Energy Accommodated by Martensite Laths and Plates in Fe-C Steels
It is well established that a transition in martensite morphology from lath- to plate-like structures occurs when the carbon content increases above 0.6–0.65 wt% [1]. Lath martensite consists of fine hierarchically arranged laths with a thickness of 100–300 nm. Laths are characterized by containing a high dislocation density with carbon enrichment at the dislocations via Cottrell atmospheres [4]. The dislocation density as a function of carbon content has been predicted in a previous study and it will be used to estimate the strain energy accommodated by laths [14]. These results will be applied. The models obtained for the carbon redistribution in plate martensite in this work and the previous results in lath-martensite were employed to understand the role of carbon in the transition of martensite structures.to compare the variations in the strain energy accommodated in both lath and plate martensite with carbon content. This will aid in providing evidence on the role of carbon in the transition of martensite structures.
The strain energy per unit volume accommodated by a dislocation in a lath is given by the Stibitz equation: Edis = ()/2() [21], where E = 211 GPa is the Young’s modulus, εdis ≈ 0.26 is the transformation (Bain) strain [14] and v = 0.31 is Poisson's ratio. The strain energy (per unit volume) accommodated by all dislocations in lath martensite equals: = where is the lath dislocation density and Alath is the area of a dislocation where it can allocate C atoms. Alath is the product of the perimeter of a Cottrell atmosphere and the mean dislocation spacing Λlath : Alath = π dCottrell Λlath, where dCottrell = 7 nm is the length of an atmosphere [14]. The mean dislocation spacing is given by Λlath = 1/ and the lath dislocation density is: = (()/2()μ) × ((4dCottrell)/()) [14], where μ = 80 GPa is the shear modulus and dlath = dCottrell/() nm is the lath thickness. Combining these results, the strain energy accommodated by lath martensite is = .
The total strain energy accommodated by the twins in a plate, , is obtained following the same procedure as lath dislocations. The strain energy per unit volume allocated by a single twin equals [21]: Etwin = ()/2(), where εtwin = ≈ 0.70 [22]; εtwin > εdis. Hence, higher strains are accommodated by twins but the twins lie parallel to each other only at the midribs (Figure 2) and an additional factor accounting for their spatial arrangement has to be considered [14]. This can be done by estimating the effective twin dispersion along the midrib, which is essentially the ratio between the twin thickness and spacing wt/(2Λt) (similar to Equation (2)), where the two factors account for shared effects between adjacent twins. Finally, is given by the total strain energy accommodated by ntwin twins: = Atwin ntwin Etwin wt/(2Λt).
Figure 8 shows the variation in the calculated strain energies by lath dislocations and twins for different carbon concentrations. At a higher carbon content (>0.65 wt%), the plates (twins) accommodate more strain energy than laths (dislocations). This is due to εtwin > εdis and to the higher carbon fraction allocated at the twins (Figure 4c), hence increasing the magnitude and frequency of the strain accommodation events during the initial steps of the transformation. Moreover, it is predicted that both structures allocate the same strain energy at the transition concentration when the carbon content is 0.6–0.65 wt% (gray area in Figure 8), while laths accommodate a higher strain energy at lower carbon concentrations.
The results show that the transition in martensite structures from laths to plates can occur as a result of the higher strain energy accommodated by twins, making them more effective in allocating higher carbon additions. In addition, it is well known that the martensite start temperature (Ms) is an important factor determining the transition from lath to twinned martensite. However, the quantitative links between Ms, the forming microstructure and solute additions have not been established yet. In previous studies, it was shown that the critical driving force for martensite start in metals is proportional to the lattice transformation strain between the parent and product phases. The solute (carbon) atoms contribute to increasing the net driving force by increasing the net lattice distortions and decreasing the Ms [8]. The results of this work suggest that the strain accommodated by twins (εtwin) dictate the Ms for twinned martensite as accommodation for higher strain (than εdis) is required when the carbon content increases. Hence, the critical driving force for twinned martensite is only reached at a temperature similar to that for lath martensite if the carbon content is high enough. This is also consistent with the increase in martensite tetragonality when C > 0.6 wt%, which has been argued to occur by the formation of a C-rich phase [11].
5. Conclusions
The microstructure of the as-quenched plate martensite in a high-C steel was characterized by means of SEM, TEM and APT. The carbon redistribution behavior was investigated at the atomic scale. By using the APT technique, we gained deeper insights into the nature of transformation dynamics of carbon and other substitutional alloying elements in the as-quenched martensite. The C content at twin boundaries was approximately 4.5 at%, while Si, Mn and Cr displayed no evidence of segregation. A model was proposed to predict the amount of carbon segregation at twins and dislocations in martensite, while the role of carbon content in determining martensite morphology was explored. The results can be summarized as follows:
- After quenching, the microstructure exhibits a martensitic matrix with partially dissolved spheroidized carbides with an average size of 0.49 ± 0.02 µm in 100Cr6 bearing steel. The austenitization and the subsequent quenching facilitate the spheroidized particles to become more spherical and smaller.
- The length and thickness of the nano-sized twins in plate martensite in 100Cr6 is in the range of 100–500 nm and 5–10 nm, respectively.
- The C-content at twin boundaries has an approximate average of 4.5 at%, while the substitutional elements, such as Si, Mn and Cr, display no evidence of segregation at the twin boundary.
- It was predicted and validated that most of the carbon atoms segregate to the twins located at the midribs and a low fraction of carbon was located at dislocations in the interior of the plate. It was also shown that the mean spacing of nano-sized twins is dictated by the carbon additions in the steel as twins are able to accommodate the lattice distortions during the transformation.
Author Contributions
W.S. and E.G.-N. designed the experiments and modeling; W.S. performed the experiments; E.G.-N. performed the modeling; C.D. analyzed the APT data; all co-authors contributed to writing the manuscript.
Funding
The research work was financially supported from the Collaborative Research Center SFB 761 “Steel-ab initio”, funded by the Deutsche Forschungsgemeinschaft (DFG).
Acknowledgments
The authors gratefully acknowledge the helpful discussion with Prof. Wolfgang Bleck at RWTH Aachen University and George Smith at Oxford University, the experimental and equipment support of atom probe from Max-Planck-Institut für Eisenforschung GmbH in Düsseldorf and TEM from C. Herwartz at Central Facility for Electron Microscopy (GFE) at RWTH Aachen University. E.I. Galindo-Nava would like to acknowledge the Royal Academy of Engineering (UK) for his research fellowship funding and to Mark Blamire for the provision of laboratory facilities.
Conflicts of Interest
The authors declare no conflict of interest.
References
- Krauss, G. Steels: Processing, Structure, and Performance, 2nd ed.; ASM International: Phoenix, AZ, USA, 1915; ISBN 978-1-62708-083-5. [Google Scholar]
- Barrow, A.T.W.; Rivera-Díaz-del-Castillo, P.E.J. Nanoprecipitation in bearing steels. Acta Mater. 2011, 59, 7155–7167. [Google Scholar] [CrossRef]
- Clarke, A.J.; Miller, M.K.; Field, R.D.; Coughlin, D.R.; Gibbs, P.J.; Clarke, K.D.; Alexander, D.J.; Powers, K.A.; Papin, P.A.; Krauss, G. Atomic and nanoscale chemical and structural changes in quenched and tempered 4340 steel. Acta Mater. 2014, 77, 17–27. [Google Scholar] [CrossRef]
- Song, W.; Choi, P.P.; Inden, G.; Prahl, U.; Raabe, D.; Bleck, W. On the Spheroidized Carbide Dissolution and Elemental Partitioning in High Carbon Bearing Steel 100Cr6. Metall. Mater. Trans. A 2014, 45, 595–606. [Google Scholar] [CrossRef]
- Stormvinter, A.; Hedström, P.; Borgenstam, A. A Transmission Electron Microscopy Study of Plate Martensite Formation in High-carbon Low Alloy Steels. J. Mater. Sci. Technol. 2013, 29, 373–379. [Google Scholar] [CrossRef]
- Li, Y.J.; Herbig, M.; Goto, S.; Raabe, D. Atomic scale characterization of white etching area and its adjacent matrix in a martensitic 100Cr6 bearing steel. Mater. Charact. 2017, 123, 349–353. [Google Scholar] [CrossRef]
- Barrow, A.T.W.; Kang, J.H.; Rivera-Díaz-del-Castillo, P.E.J. The ϵ→η→θ transition in 100Cr6 and effect on mechanical properties. Acta Mater. 2012, 60, 2805–2815. [Google Scholar] [CrossRef]
- Shibata, A.; Murakami, T.; Morito, S.; Furuhara, T.; Maki, T. The Origin of Midrib in Lenticular Martensite. Mater. Trans. 2008, 49, 1242–1248. [Google Scholar] [CrossRef] [Green Version]
- Yang, J.R.; Lee, H.Y.; Yen, H.W.; Chang, H.T. Martensite Midrib in an Fe-1C-17Cr Stainless Steel. Solid State Phenom. 2011, 172–174, 67–72. [Google Scholar] [CrossRef]
- Toji, Y.; Miyamoto, G.; Raabe, D. Carbon partitioning during quenching and partitioning heat treatment accompanied by carbide precipitation. Acta Mater. 2015, 86, 137–147. [Google Scholar] [CrossRef]
- Galindo-Nava, E.I.; Rivera-Díaz-del-Castillo, P.E.J. Understanding the factors controlling the hardness in martensitic steels. Scr. Mater. 2016, 110, 96–100. [Google Scholar] [CrossRef]
- Visvesvaran, P. A study on morphology and plate mean dimensions in Fe-Ni and Fe-Ni-Cr alloys. Metall. Mater. Trans. A 1996, 27, 973–980. [Google Scholar] [CrossRef]
- Sherby, O.D.; Wadsworth, J.; Lesuer, D.R.; Syn, C.K. Revisiting the Structure of Martensite in Iron-Carbon Steels. Mater. Trans. 2008, 49, 2016–2027. [Google Scholar] [CrossRef] [Green Version]
- Galindo-Nava, E.I.; Rivera-Díaz-del-Castillo, P.E.J. A model for the microstructure behaviour and strength evolution in lath martensite. Acta Mater. 2015, 98, 81–93. [Google Scholar] [CrossRef]
- Miller, M.K.; Beaven, P.A.; Smith, G.D.W. A study of the early stages of tempering of iron-carbon martensites by atom probe field ion microscopy. Metall. Trans. A 1981, 12, 1197–1204. [Google Scholar] [CrossRef]
- Beswick, J.M. The effect of chromium in high carbon bearing steels. Metall. Trans. A 1987, 18, 1897–1906. [Google Scholar] [CrossRef]
- Taylor, K.A.; Olson, G.B.; Cohen, M.; Sande, J.B.V. Carbide precipitation during stage I tempering of Fe-Ni-C martensites. Metall. Trans. A 1989, 20, 2749–2765. [Google Scholar] [CrossRef]
- Marceau, R.K.W.; Gutierrez-Urrutia, I.; Herbig, M.; Moore, K.L.; Lozano-Perez, S.; Raabe, D. Multi-scale correlative microscopy investigation of both structure and chemistry of deformation twin bundles in Fe-Mn-C steel. Microsc. Microanal. 2013, 19, 1581–1585. [Google Scholar] [CrossRef] [PubMed]
- Herbig, M.; Raabe, D.; Li, Y.J.; Choi, P.; Zaefferer, S.; Goto, S. Atomic-scale quantification of grain boundary segregation in nanocrystalline material. Phys. Rev. Lett. 2014, 112, 126103. [Google Scholar] [CrossRef] [PubMed]
- Raabe, D.; Herbig, M.; Sandlöbes, S.; Li, Y.; Tytko, D.; Kuzmina, M.; Ponge, D.; Choi, P.P. Grain boundary segregation engineering in metallic alloys: A pathway to the design of interfaces. Curr. Opin. Solid State Mater. Sci. 2014, 18, 253–261. [Google Scholar] [CrossRef]
- Stibitz, G.R. Energy of lattice distortion. Phys. Rev. 1936, 49, 859. [Google Scholar]
- Kumosa, M. Strain energy of a mechanical twin in alpha -iron. J. Phys. Appl. Phys. 1991, 24, 1816. [Google Scholar] [CrossRef]
Figure 1.
Heat treatment cycle of the investigated steel 100Cr6.

Figure 2.
Metallography and microstructure of 100Cr6 bearing steel under different conditions: (a) LOM; ferritic matrix with spheroidized carbides after spheroidization at 800 °C for 7200 s; (b) SEM; ferritic matrix with spheroidized carbides at 800 °C for 7200 s; (c) LOM; martensitic matrix with partially dissolved spheroidized carbides after austenitization at 850 °C for 300 s and the subsequent quenching in Ar; and (d) SEM; martensitic matrix with partially dissolved spheroidized carbides at 850 °C for 300 s and the subsequent quenching in Ar.

Figure 3.
(a) Bright-field micrographs of the intersection of two martensitic twin domains separated by a twin midrib in 100Cr6 steel in the as-quenched state; and (b) nano twins in 100Cr6.
Figure 3.
(a) Bright-field micrographs of the intersection of two martensitic twin domains separated by a twin midrib in 100Cr6 steel in the as-quenched state; and (b) nano twins in 100Cr6.

Figure 4.
(a) 3D carbon atomic map, 7 at% iso-concentration surfaces and marked ROI in 100Cr6 in the as-quenched condition subsequent to austenitization; (b) the atomic illustration of carbon along the z-axis of ROI; (c) the corresponding 1D-concentration profile; and (d) the corresponding 2D-concentration map; GB represents grain boundary.

Figure 5.
(a) Overview of the alloying elements C, Si, Mn and Cr within the ROI in form of a 2D-atomic map; (b) C atoms distribution; (c) 2D concentration map of C; (d) Si atoms distribution; and (e) Mn atoms distribution.
Figure 5.
(a) Overview of the alloying elements C, Si, Mn and Cr within the ROI in form of a 2D-atomic map; (b) C atoms distribution; (c) 2D concentration map of C; (d) Si atoms distribution; and (e) Mn atoms distribution.

Figure 6.
Schematic representation of (a) inhomogeneous carbon distribution in a martensite plate in as-quenched conditions and (b) its resulting microstructural arrangements.
Figure 6.
Schematic representation of (a) inhomogeneous carbon distribution in a martensite plate in as-quenched conditions and (b) its resulting microstructural arrangements.

Figure 7.
Variation in carbon fraction at twins and dislocations with different C contents in a plate. The grey area shows the transition range from plate to lath martensite structures.
Figure 7.
Variation in carbon fraction at twins and dislocations with different C contents in a plate. The grey area shows the transition range from plate to lath martensite structures.

Figure 8.
Strain energy per unit volume accommodated by lath dislocations and twins as a function of the total carbon content.
Figure 8.
Strain energy per unit volume accommodated by lath dislocations and twins as a function of the total carbon content.


Table 1.
Chemical composition of the investigated steel 100Cr6.
| Element | C | Si | Mn | P | S | Cr | Mo | Ni | Cu | Al |
|---|---|---|---|---|---|---|---|---|---|---|
| wt% | 0.967 | 0.30 | 0.23 | 0.003 | <0.001 | 1.38 | 0.02 | 0.07 | 0.05 | 0.026 |
| at% | 4.325 | 0.58 | 0.23 | 0.005 | <0.002 | 1.43 | 0.01 | 0.07 | 0.04 | 0.052 |
© 2018 by the authors. Licensee MDPI, Basel, Switzerland. This article is an open access article distributed under the terms and conditions of the Creative Commons Attribution (CC BY) license (http://creativecommons.org/licenses/by/4.0/).
Share and Cite
MDPI and ACS Style
Song, W.; Drouven, C.; Galindo-Nava, E. Carbon Redistribution in Martensite in High-C Steel: Atomic-Scale Characterization and Modelling. Metals 2018, 8, 577. https://doi.org/10.3390/met8080577
AMA Style
Song W, Drouven C, Galindo-Nava E. Carbon Redistribution in Martensite in High-C Steel: Atomic-Scale Characterization and Modelling. Metals. 2018; 8(8):577. https://doi.org/10.3390/met8080577
Chicago/Turabian StyleSong, Wenwen, Carsten Drouven, and Enrique Galindo-Nava. 2018. "Carbon Redistribution in Martensite in High-C Steel: Atomic-Scale Characterization and Modelling" Metals 8, no. 8: 577. https://doi.org/10.3390/met8080577
Note that from the first issue of 2016, this journal uses article numbers instead of page numbers. See further details here.