Article

Tuning Low Cycle Fatigue Properties of Cu-Be-Co-Ni Alloy by Precipitation Design

1
School of Materials Science and Engineering, East China Jiaotong University, Nanchang 330013, China
2
School of Materials Science and Engineering, University of Science and Technology Beijing, Beijing 100083, China
*
Authors to whom correspondence should be addressed.
Metals 2018, 8(6), 444; https://doi.org/10.3390/met8060444
Submission received: 17 May 2018 / Revised: 31 May 2018 / Accepted: 8 June 2018 / Published: 11 June 2018

Abstract

:
As material for key parts applied in the aerospace field, the Cu-Be-Co-Ni alloy sustains cyclic plastic deformation in service, resulting in the low cycle fatigue (LCF) failure. The LCF behaviors are closely related to the precipitation states of the alloy, but the specific relevance is still unknown. To provide reasonable regulation of the LCF properties for various service conditions, the effect of precipitation states on the LCF behaviors of the alloy was investigated. It is found that the alloy composed fully of non-shearable γ′ precipitates has higher fatigue crack initiation resistance, resulting in a longer fatigue life under LCF process with low total strain amplitude. The alloy with fine shearable γ′I precipitates presents higher fatigue crack propagation resistance, leading to a longer fatigue life under LCF process with high total strain amplitude. The cyclic stress response behavior of the alloy depends on the competition between the kinematic hardening and isotropic softening. The fine shearable γ′I precipitates retard the decrease of effective stress during cyclic loading, causing cyclic hardening of the alloy. The present work would help to design reasonable precipitation states of the alloy for various cyclic loading conditions to guarantee its safety in service.

Graphical Abstract

1. Introduction

The Cu-Be-Co-Ni alloy possesses a strength similar to ultra high strength steel and superior elastic properties benefited from the significant precipitation strengthening effect [1]. Besides, it possesses high fatigue strength, thermal conductivity and wear resistance [2]. Owing to these remarkable properties, Cu-Be-Co-Ni alloy is widely applied in the mechanical components of aviation, aerospace, military industry and other fields, such as the axle sleeves and pivots on the landing gear of large aircraft [3]. The stress sustained by these components exceeds the elastic limit when the aircraft takes off and lands, indicating that the plastic deformation appears during the cyclic loading process and finally leads to the low cycle fatigue (LCF) failure [4]. The cyclic plastic deformation would cause cyclic hardening or cyclic softening of the alloy, which has great influence on the LCF life. Cyclic softening would cause excessive plastic deformation and finally lead to the failure. Therefore, the components suffering to large strain amplitude cyclic deformation must select the alloy presenting cyclic hardening or stability during LCF process [5]. Consequently, the LCF behaviors, especially the cyclic hardening and softening behaviors, of the Cu-Be-Co-Ni alloy need to be further investigated for the safety and reliability requirements.
The LCF behaviors of the precipitation strengthening alloy are closely related to the states of precipitation. Delbove et al. [6] investigated the role of the microstructure on the LCF behavior of Cu-Ni-Si alloy and reported that dislocation sheared the δ-Ni2Si precipitates, causing the dissolution of precipitates and local plastic deformation. According to the research of Hockauf et al. [7] on aluminum alloys, the precipitates which were coherent with the parent phase contributed to slip localization, resulting in early failure during LCF loading. However, Wang et al. [8] found that dislocations can shear the fine and coherent precipitates and glide more-or-less reversibly during cyclic loading, resulting in fostering fatigue crack growth (FCG) resistance. Therefore, it is essential to reveal the relationship between the precipitation states and the fatigue life.
Another important factor that affects the safety in LCF process is the cyclic response behavior. The cyclic hardening and cyclic softening behaviors are directly relevant to the isotropic hardening and kinematic hardening of the alloy during LCF process, which can be described by the effective stress and internal stress, respectively. Generally, the effective stress reflected the stress from the short-range motion under cyclic loading, whereas the internal stress reflected the stress from the long-range motion of dislocations [9]. The effective stress is the stress required locally for a dislocation to move, i.e., the short range interactions of forest dislocations [10]. The level of effective stress depends on the density of forest dislocations during the deformation. For the precipitation strengthening alloy, the density of forest dislocations depends on two contradictory effects from the precipitates [11,12]. On the one hand, the precipitates can act as the trapping sites for mobile dislocations, accelerating the storage of dislocations. On the other hand, the Orowan loops generated from the mobile dislocations bypassing the precipitates would also accelerate the annihilation of dislocations. The competition between the accumulation and annihilation decides whether the alloy exhibits strain hardening or softening. Chen et al. [9] found that severe dislocations accumulation occurred in during the LCF process of the pre-hardening Hadfield steel because the dislocation motion was blocked by twin boundaries, resulting in the effective stress hardening. However, the effective stress softening was found in the Ti-6Al-4V alloy [13], which was mainly related to the dislocations annihilation and precipitates shearing mechanism. The plastic strain incompatibilities and heterogeneity of the spatial dislocation distribution cause the long-range internal stress [14]. According to Xu et al. [13], the heterogeneity of microstructure in the materials caused the pile-ups of dislocations and led to the internal stress hardening, while the uniform plastic deformation brought about the reduction of internal stress. Thus, it is important to figure out the revolution of effective stress and internal stress during the LCF process.
The two separated parts of the cyclic stress, effective stress and internal stress, can be directly obtained from the cyclic stress–strain hysteresis loops [15]. Based on Cottrell’s [16] framework, Kuhlmann-Wilsdorf et al. [17] proposed a method to evaluate the effective and internal stress, referred as the KWLC technique. In this method, the hysteresis loop was only composed of elastic portion and plastic portion and the whole cyclic loading process was taken into consideration. Another method proposed by Handfield and Dickson [18] was called the HD technique, which have taken the quasi-elastic portion after elastic portion into account. It is more suitable to use the HD technique when the elastic portion is relatively short during the reverse loading.
In the present study, we design two different precipitation states and investigate their effect on the LCF behaviors of the Cu-Be-Co-Ni alloy. Theories about isotropic hardening (contributed by effective stress) and kinematic hardening (contributed by internal stress) were applied to explain the cyclic hardening and cyclic softening behaviors of the alloy.

2. Experimental Details

2.1. Materials and Sample Preparation

The Cu-Be-Co-Ni alloy ingots (in the shape of 120 mm × 100 mm × 70 mm) were first homogenized at 800 °C for 180 min. The composition of the alloy is listed in Table 1. Then, the ingots were hot-rolled to 9 mm (87% rolling reduction) at 650–740 °C, followed by quenching in water immediately. The hot-rolled sheets were solution treated at 780 °C for 30 min, followed by water quenching to room temperature (RT). Finally, the sheets were subjected to two different aging treatments to obtain different precipitation states: (1) normal aging (NA) at 320 °C for 180 min; and (2) double aging (DA) consisting of aging at 370 °C for 5 min followed by water quenching to RT and then aging at 280 °C for 360 min.
The precipitates of the alloy were characterized employing an H-8100 transmission electron microscope (TEM) (HITACHI, Tokyo, Japan) and an FEI Tecnai G2 F20 high-resolution (HR) TEM (FEI, Hillsboro, OR, USA), operating at 200 kV. Thin foils for TEM observations were prepared via twin-jet electro-polishing, using a solution of 70 vol % methanol and 30 vol % nitric acid as the electrolyte under the temperature of −25 to −30 °C. The employed voltage and current were 9.5 V and 20 mA, respectively.

2.2. Tensile and Low Cycle Fatigue Test

Samples for mechanical properties tests were cut from the sheets after aging treatments, parallel to the rolling direction. The monotonic tensile tests (INSTRON, Boston, MA, USA) were carried out at a strain rate of ~10−3 s−1. For each aging condition, three samples were tested.
Low cycle fatigue (LCF) tests were conducted according to ASTM E606 standard. Cylindrical samples were machined with a parallel gauge section 13.8 mm long and 6 mm in diameter (as shown in Figure 1). The LCF tests were performed on an INSTRON 8801 electro-hydraulic servo fatigue testing machine (INSTRON, Boston, MA, USA) at different total strain amplitudes of 1.2%, 1.4%, 1.6%, 1.8% and 2%. Sinusoidal waveform loading with a zero mean strain (R = −1) and a constant total strain rate of 8 × 10⁻⁴ s−1 was applied during the LCF tests. The strain was measured by an extensometer with the gauge length of 12.5 mm. At least two samples were tested at each set of testing parameters.
The Cu-Be-Co-Ni alloy after NA and DA treatments presented an excellent linear relationship during the elastic loading and reloading process. Besides, there were large differences between the tension and compression curves [19]. Hence, the KWLC technique [17] was used to calculate the effective and internal stress of the alloy during LCF tests in the present study. As shown in Figure 2, the effective stress (σf) and internal stress (σb) can be directly obtained from the hysteresis loop, where σf is determined at a reversed plastic strain offset of 1.0 × 10⁻⁴ as suggested in the literature [14,15,20] and σb can be calculated by σb = σaσf.

3. Results

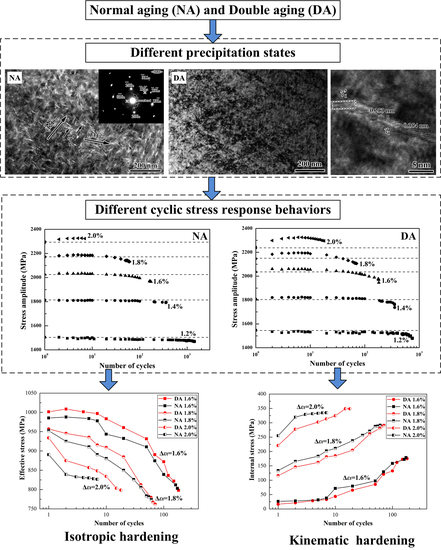
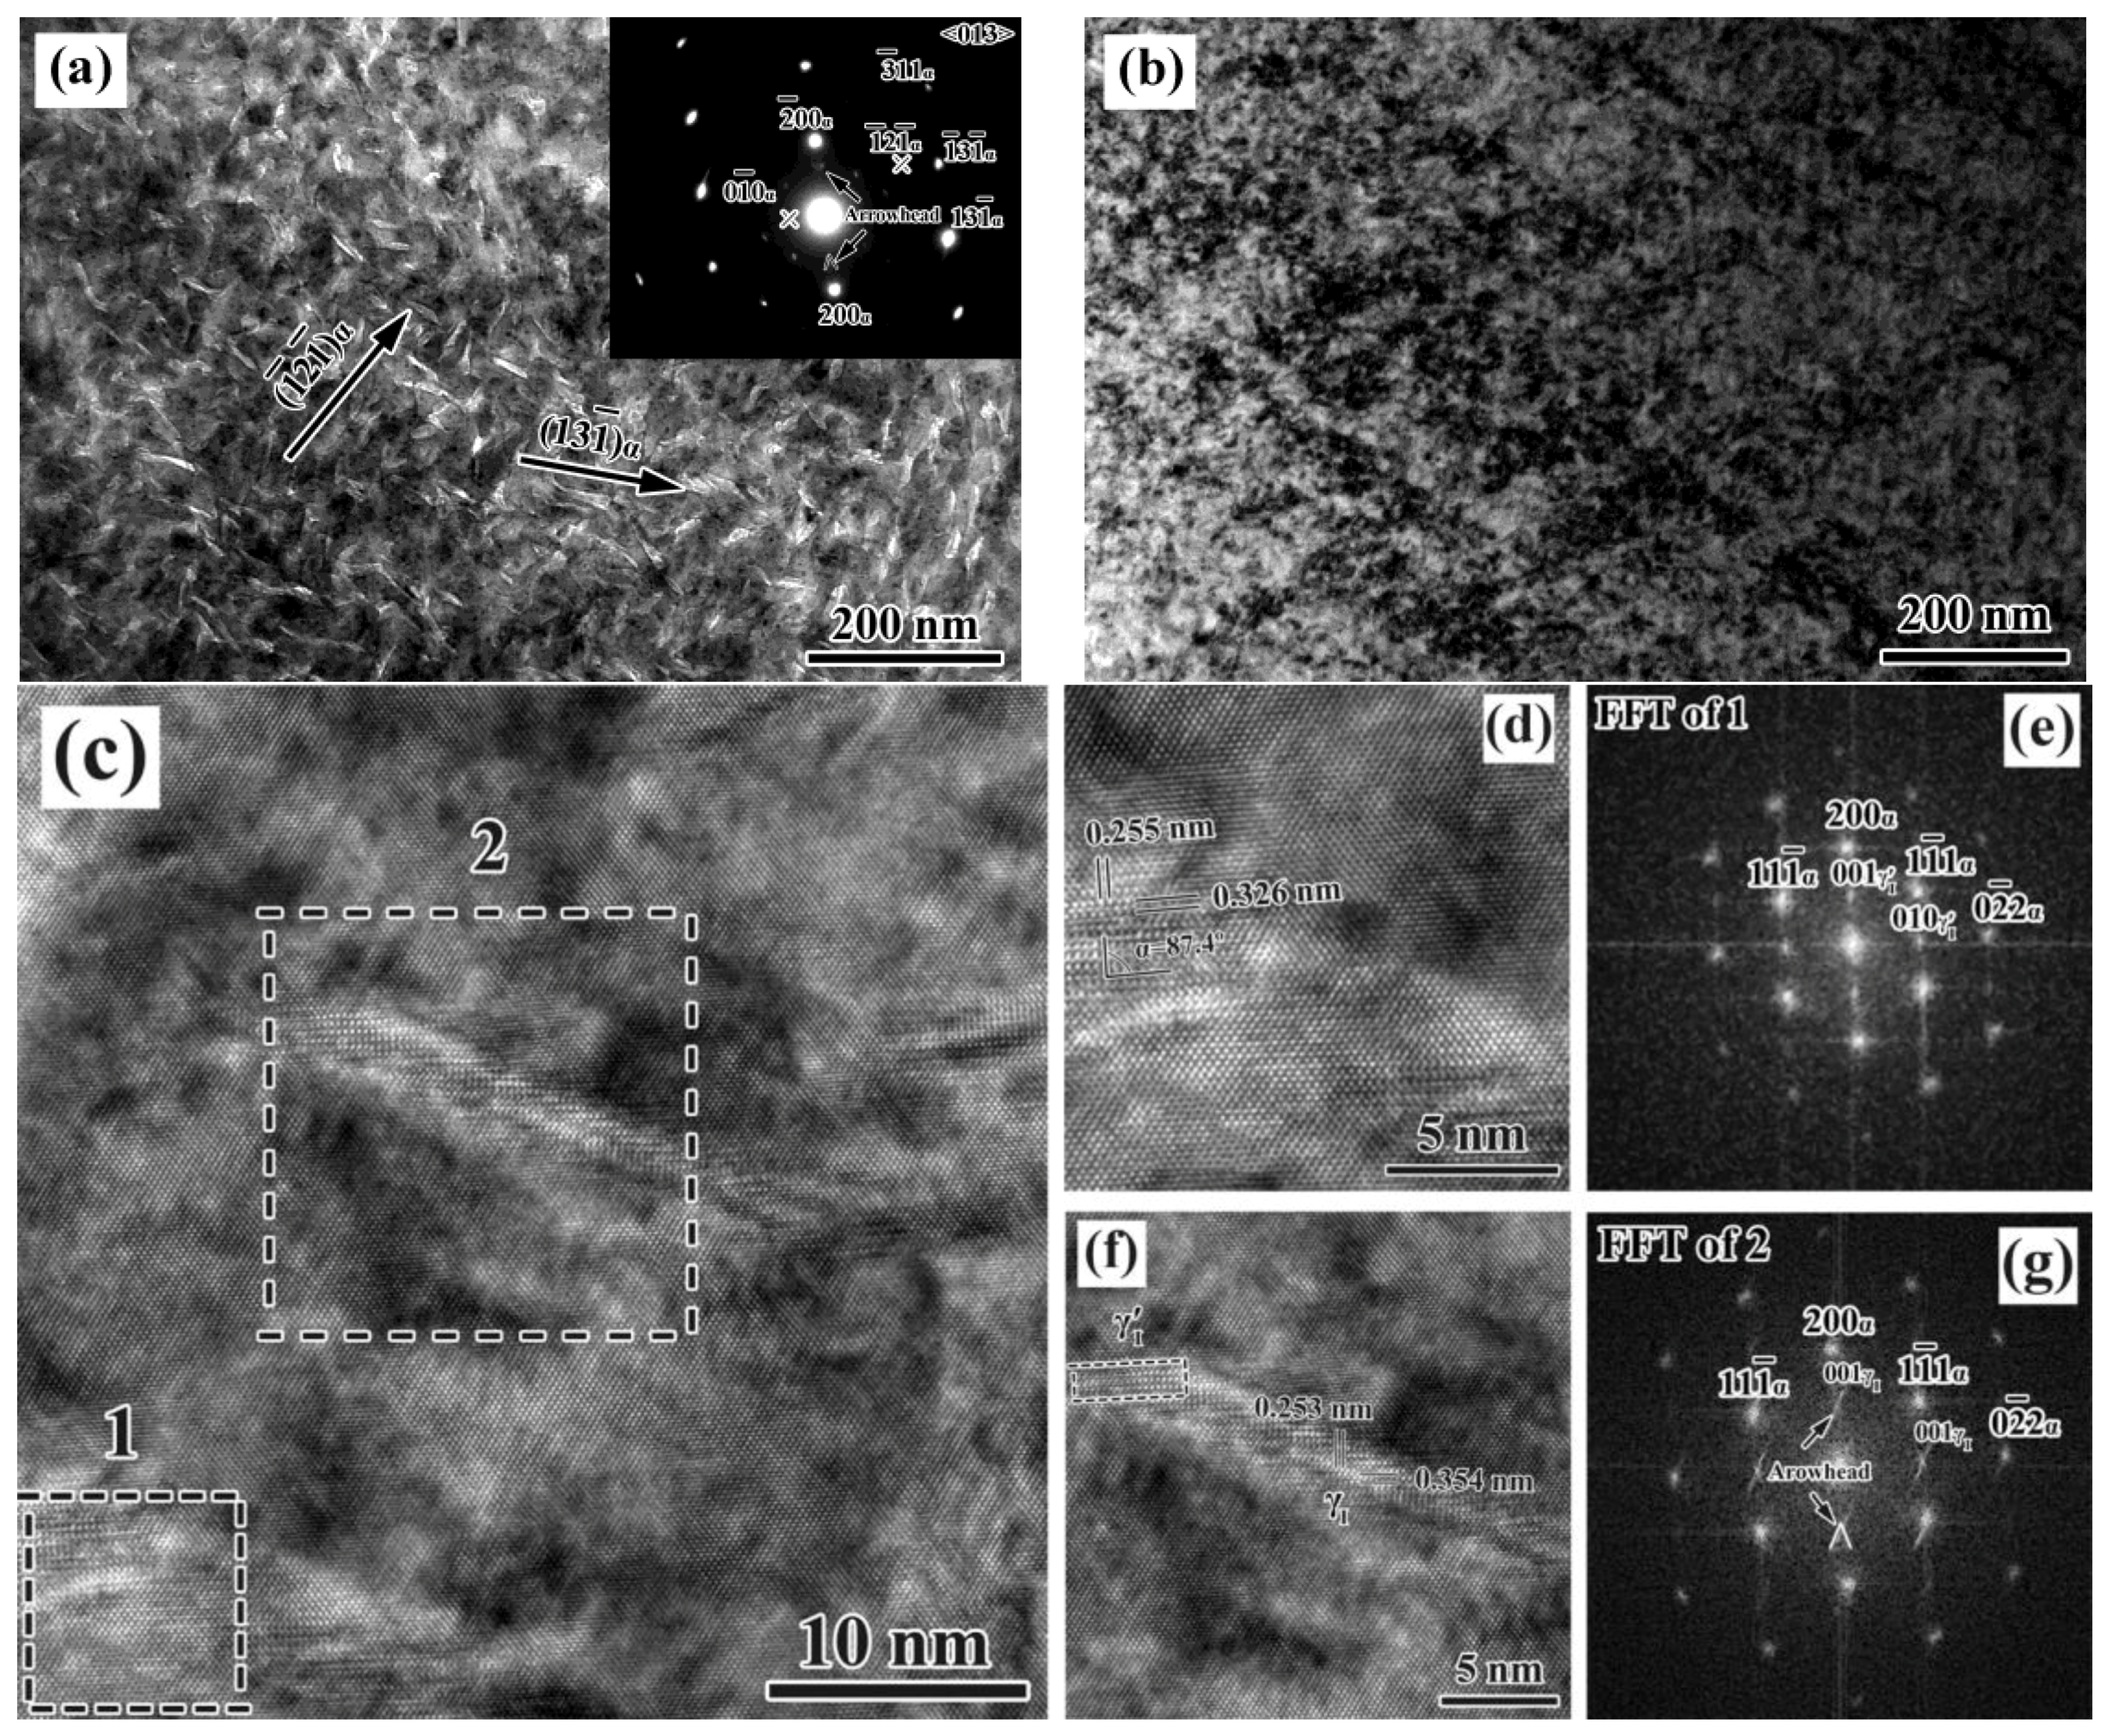
3.1. Precipitation Microstructure

As shown in Figure 3a, the NA alloy mainly contains slender strips of γ′ precipitates. The “arrowheads” could be observed in the corresponding selected area diffraction pattern (SADP), which was considered as the sign of a change in habit planes from the former metastable phase [21]. The slender strips of γ′ precipitates were parallel to ( 13 1 ¯ ) α and ( 1 ¯ 2 1 ¯ ) α . Unlike slender strips, a striated microstructure was observed in the DA alloy (Figure 3b). From the HRTEM images (Figure 3d,f), the lattice parameters of the precipitates could be measured and then compared with the results from Monzen et al. [22]. The corresponding digital fast Fourier transform (DFFT) patterns of Area 1 (Figure 3e) and Area 2 (Figure 3g) were utilized to further confirm the results from HRTEM images. Consequently, it could be inferred that the precipitates in the DA alloy were composed by γ′I and γI phase.

3.2. Monotonic Tensile Properties

The tensile properties of the Cu-Be-Co-Ni alloys under different aging conditions are listed in Table 2. Despite sharing nearly the same values for Young’s modulus (E) and ultimate tensile strength (UTS), the yield strength (YS) of the DA alloy was about 80 MPa lower than the NA alloy, while the uniform elongation (εu) of the DA alloy was 34% higher.
The differences in tensile properties are also reflected in the strain hardening behavior. As shown in Figure 4, the strain hardening behavior is described by the plot of the flow stress (σflow) and instantaneous strain hardening rate (Θ = dσflow/dεp) vs. the true plastic strain (εp). All the strain hardening curves showed an initially very rapid decrease, which was associated with the elastic/plastic transition [23]. After the elastic/plastic transition, the decreasing of strain hardening rate (Θ) slowed down and then followed a linear reduction, which was coincidence with the work hardening behavior of polycrystalline fcc metals described by the Kocks–Mecking–Estrin (KME) model [24,25]. While the Θ decreased with the increase of εp, the σf kept increasing. The necking occurred when these two dependent variables were equal [26]. As shown in Figure 4, the decreasing rate of Θ in the transition section on the strain hardening curve under DA condition was far slower than that under NA condition, leading to a considerable increase of uniform elongation.

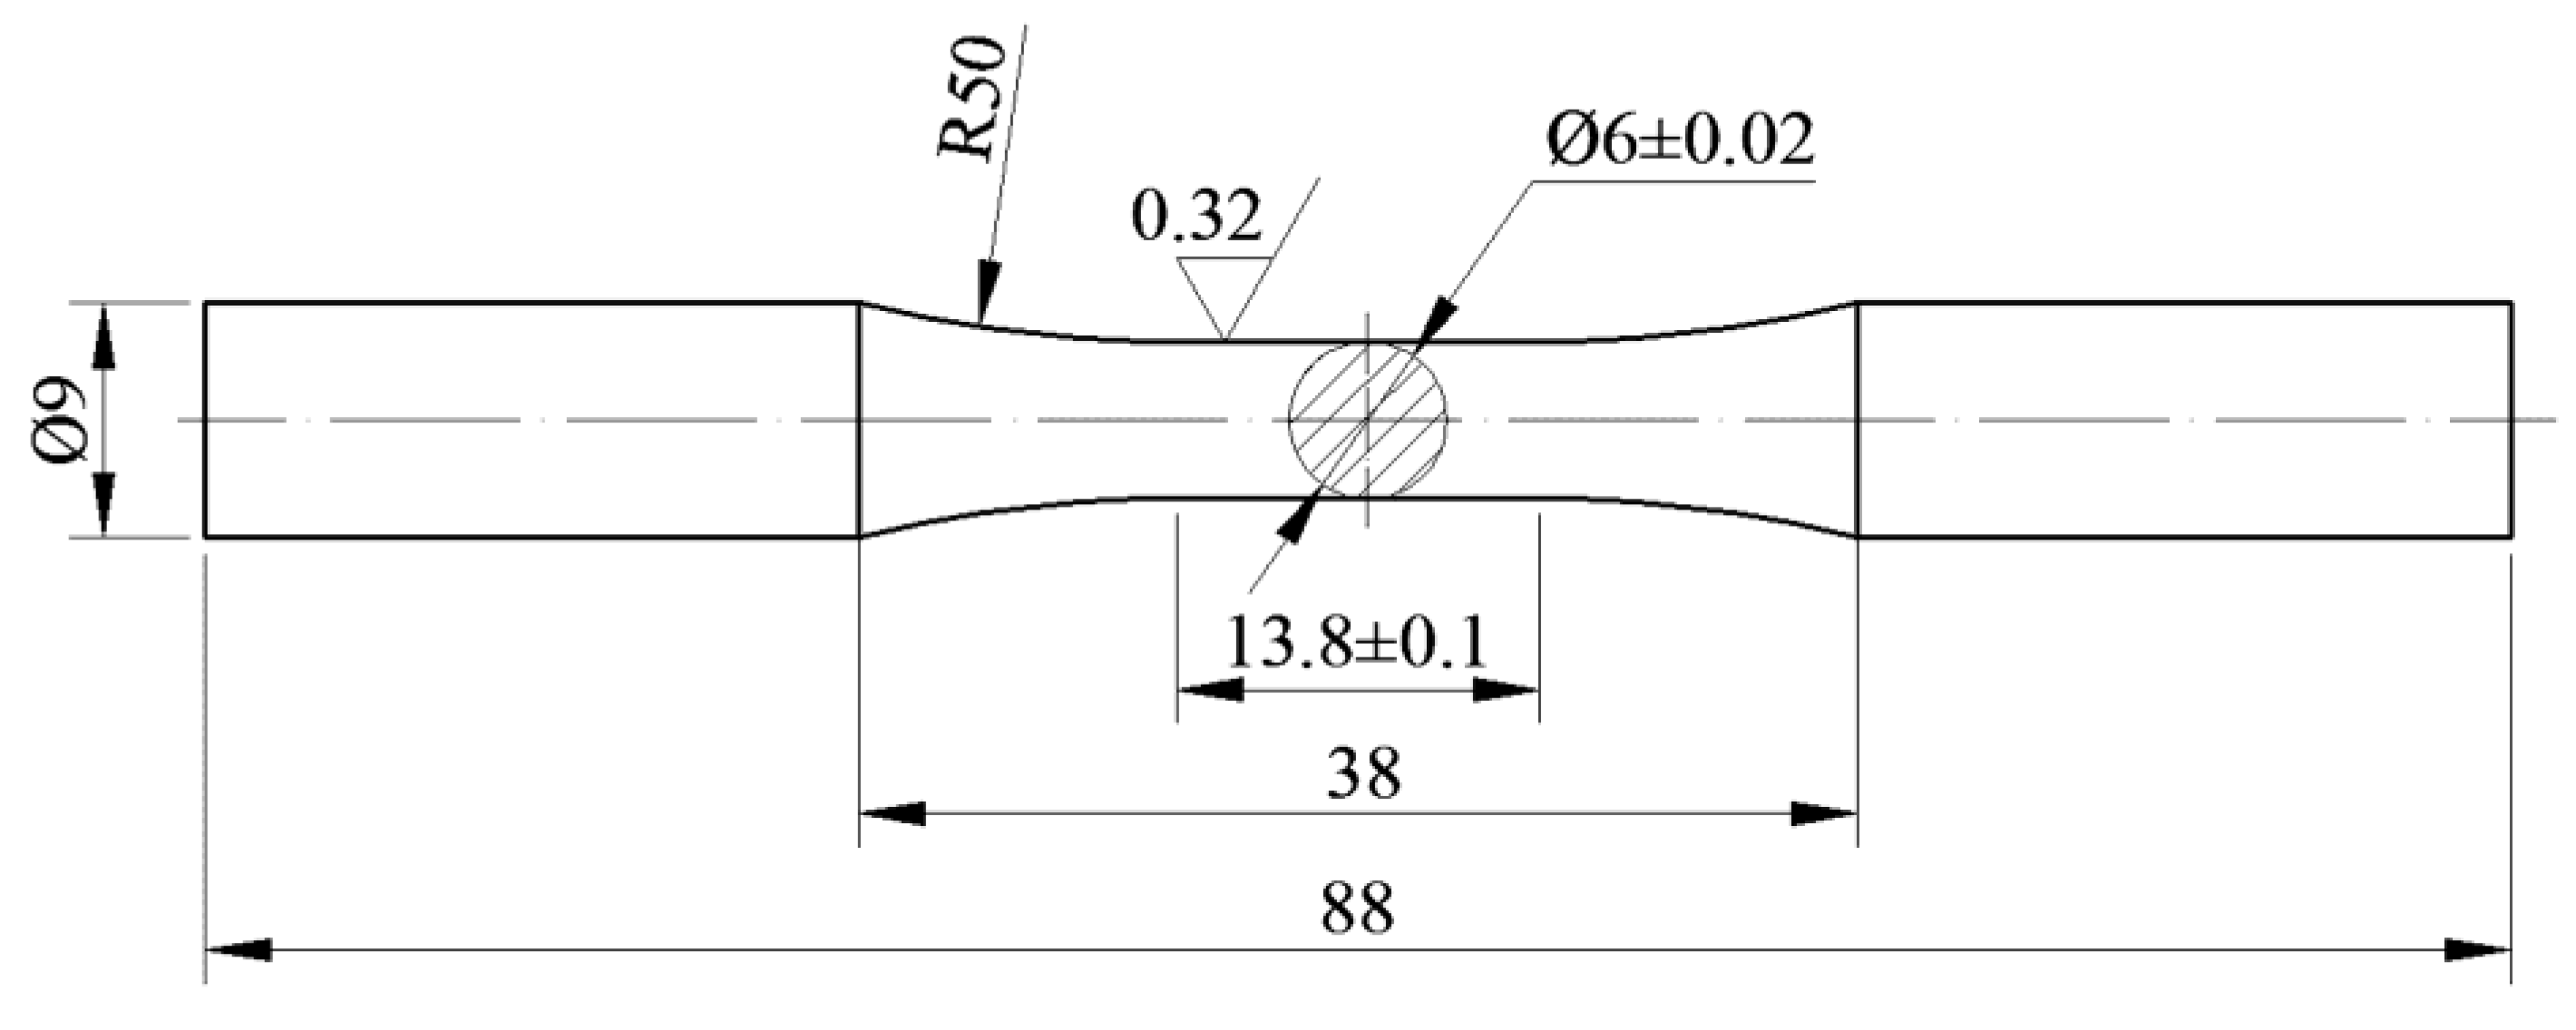
3.3. Low Cycle Fatigue Behaviors

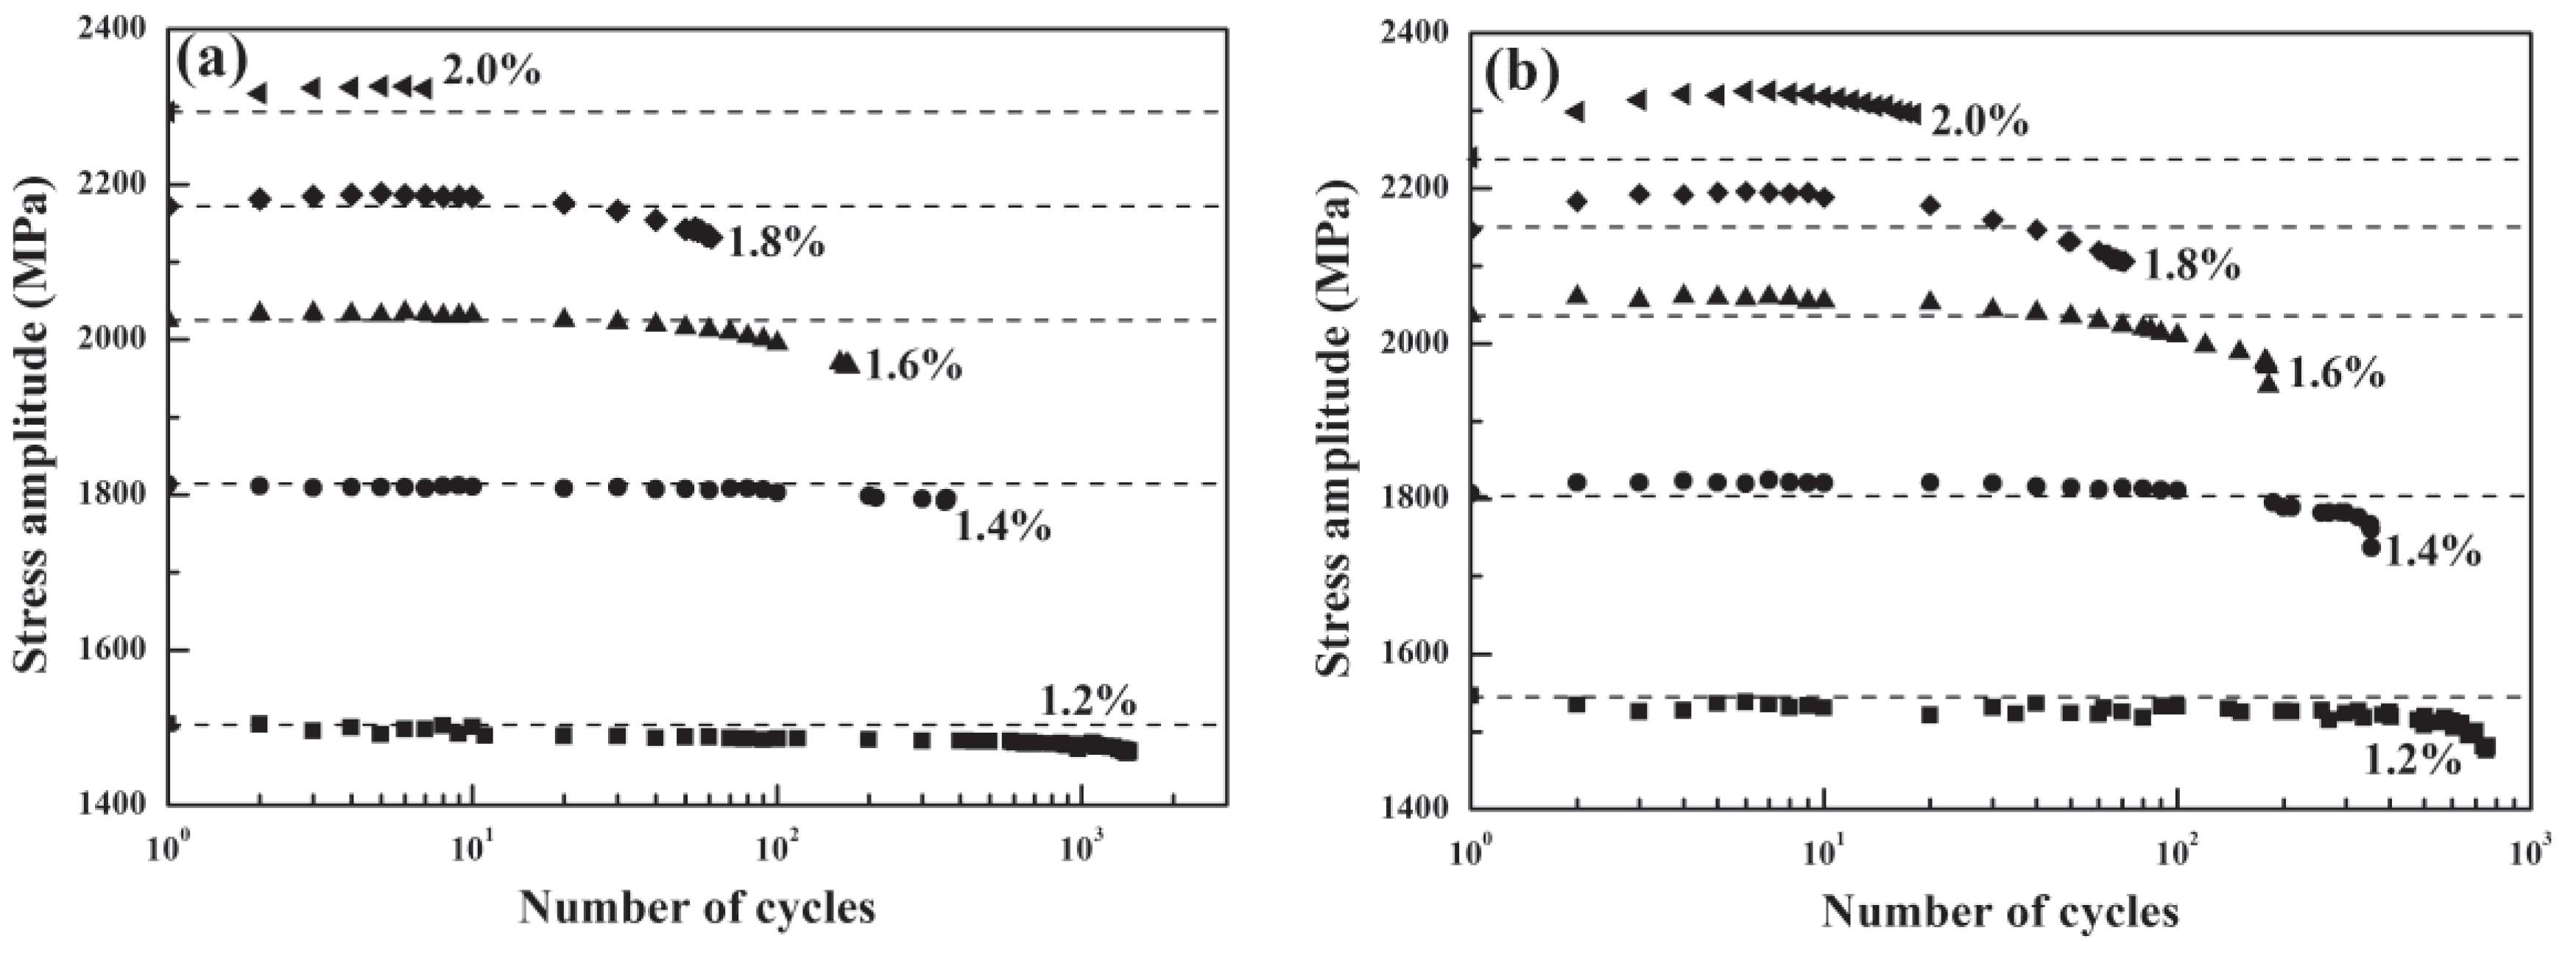
3.3.1. Cyclic Stress Response Behaviors
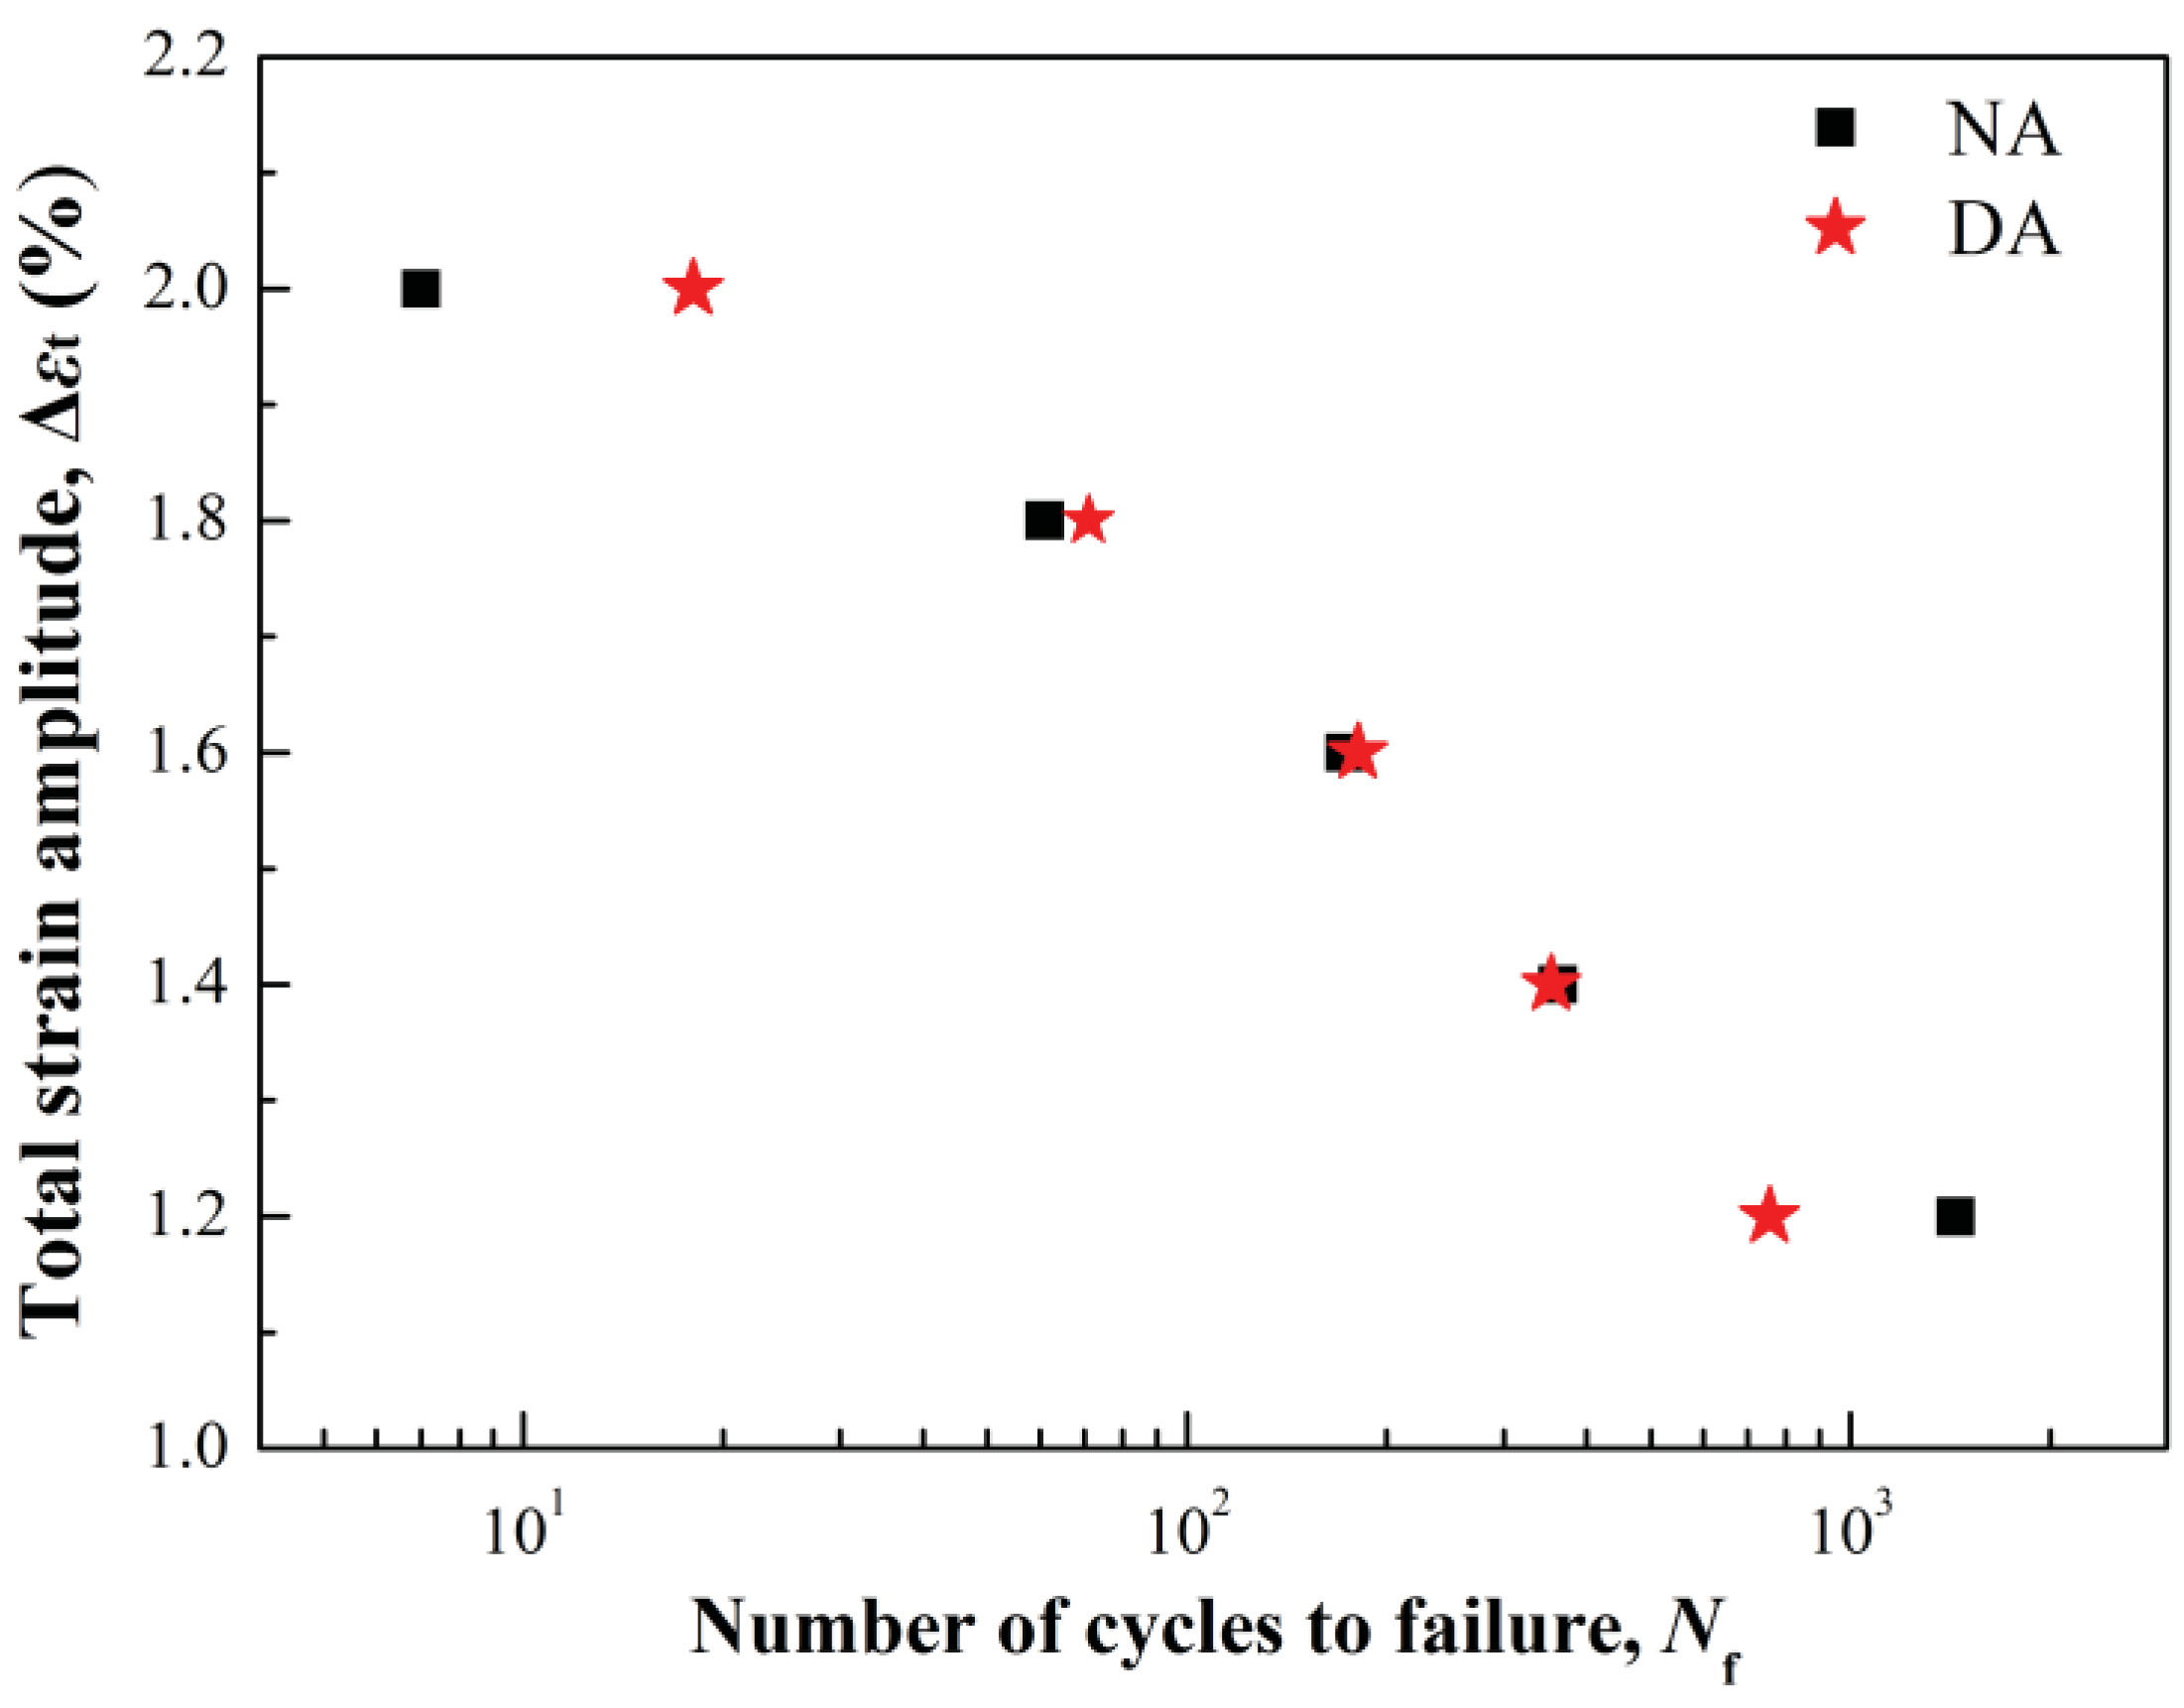
Figure 5 shows the variation of cyclic stress amplitudes with the number of cycles under different strain amplitudes during LCF tests for the alloy under two different aging conditions. As the increase of applied total strain amplitude, the stress amplitude of the alloy under both aging conditions increased and the fatigue life decreased. When the total strain amplitude was less than or equal to 1.4%, the stress amplitude kept almost steady at the first 100 cycles followed by cyclic softening until fracture. As the total strain amplitude became greater than or equal to 1.6%, differences of the LCF behaviors between the NA and DA alloy began to appear. The NA alloy still presented cyclic stability followed by cyclic softening, and the slight cyclic hardening behavior was occurred only when the total strain amplitude was 2%. Rather than cyclic stability at the beginning, the DA alloy showed considerable cyclic hardening at the first 10 cycles followed by cyclic softening until fracture when the total strain amplitude was greater than 1.6%.
Cyclic hardening ratio (CHR) and cyclic softening ratio (CSR) were frequently utilized to characterize cyclic deformation behaviors of metallic materials. CHR and CSR were determined using CHR = (σmaxσ1)/σ1 and CSR = (σmaxσmid)/σmax, where σ1, σmax and σmid represented the stress amplitude at the first cycle, the maximum stress amplitude and the stress amplitude at the mid-life, respectively [9]. The CHR and CSR results of NA and DA alloys during LCF tests are shown in Figure 6. With the increase of total strain amplitude, the CHR increased while the CSR decreased slowly with a slight change. Under the same total strain amplitude, both the CHR and CSR of the DA alloy were greater than the corresponding value of the NA alloy, which indicated that the stress amplitude of DA alloy varied more apparently during the LCF tests. When the total strain amplitude was greater than 1.6%, the CHR was higher than the CSR under the DA condition. As for the NA condition, the CHR was higher than the CSR only when the total stain amplitude was 2%. Furthermore, the CSR under both aging conditions was almost zero at the total strain amplitude of 2%, indicating that the stress amplitude reached the maximum value at the mid-life.
The cyclic stress–strain scatters and the corresponding monotonic stress–strain curves are shown in Figure 7. The cyclic stress and strain correspond to the maximum tensile stress and strain of the hysteresis loops at mid-life. It is seen that the cyclic stress–strain curve is positioned slightly lower than the monotonic one of the NA alloy, while the cyclic curve is higher than the monotonic curve for the DA condition. Therefore, it can be deduced that the cyclic deformation causes cyclic softening for the NA alloy and cyclic hardening for the DA alloy.

3.3.2. Fatigue Life

Figure 8 shows the plot of the total strain amplitude and the number of cycles to failure (generally known as εN curves) for the NA and DA alloy. It can be found that the fatigue life goes straight down with the increasing of total strain amplitude under both aging conditions. However, the fatigue life of the NA and DA alloy under the same total strain amplitude was different. The fatigue life of the NA alloy was significantly longer than the DA alloy at the relatively low strain amplitude (Δεt = 1.2%), while it reversed at the higher strain amplitude (Δεt = 2.0%).
The total strain amplitude (∆εt/2) could be expressed as elastic strain amplitude (∆εe/2) and plastic strain amplitude (∆εp/2). The elastic part could be represented by the Basquin equation and the plastic part could be described by the Coffin–Manson equation [27]:
Δ ε t 2 = Δ ε e 2 + Δ ε p 2
Δ ε e 2 = σ f E ( 2 N f ) b
Δ ε p 2 = ε f ( 2 N f ) c
where E is Young’s modulus, Nf is the number of cycles to failure, σ f is the fatigue strength coefficient, b is the fatigue strength exponent, ε f is the fatigue ductility coefficient and c is the fatigue ductility exponent. For metals, high |b| value represents the high strength and high |c| value indicates the good plasticity [28].
In the present study, the value of elastic or plastic strain amplitudes are taken at mid-life from the hysteresis loops since the cyclic stress response behavior tended to be stable at this moment. As shown in Figure 9, the LCF parameters can be obtained through linear regression analysis of the LCF data. The specific value of these parameters is presented in Table 3. It could be seen that all the LCF parameters value of the DA alloy were higher than the corresponding value of the NA alloy, especially for the fatigue ductility coefficient, ε f . The ε f value of the DA alloy was approximately five times higher than that of the NA alloy, suggesting a higher fatigue resistance.

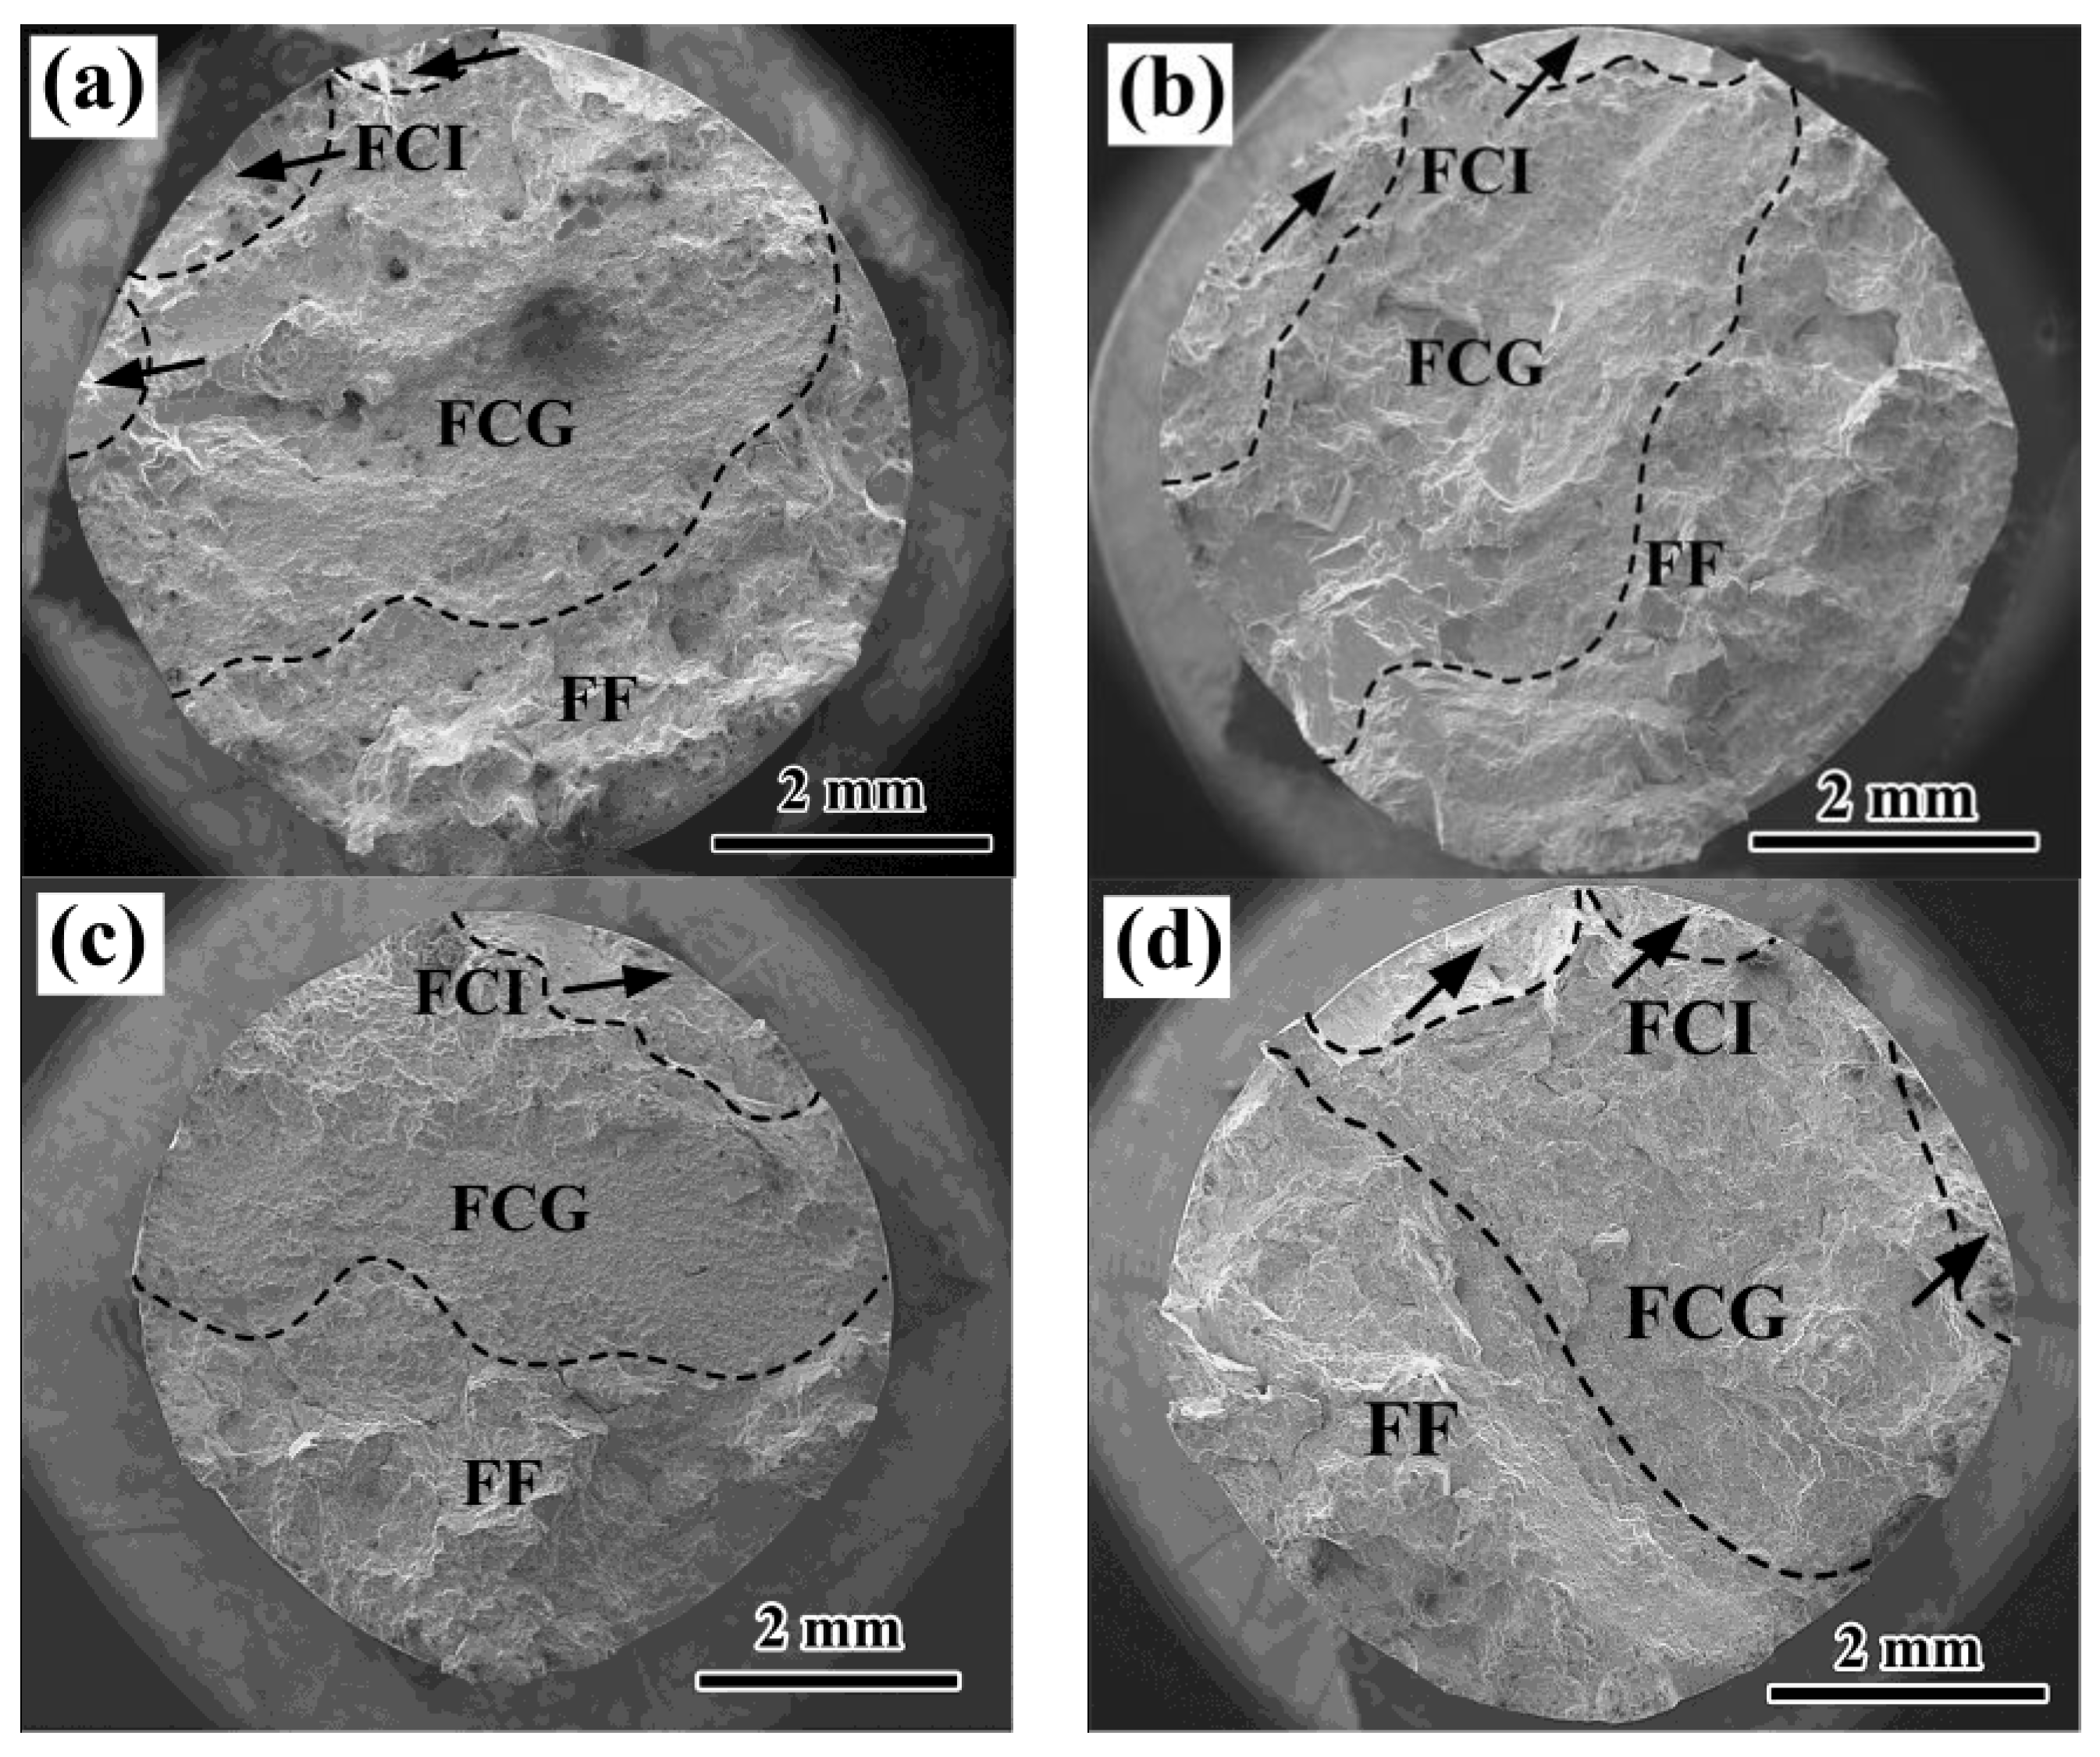
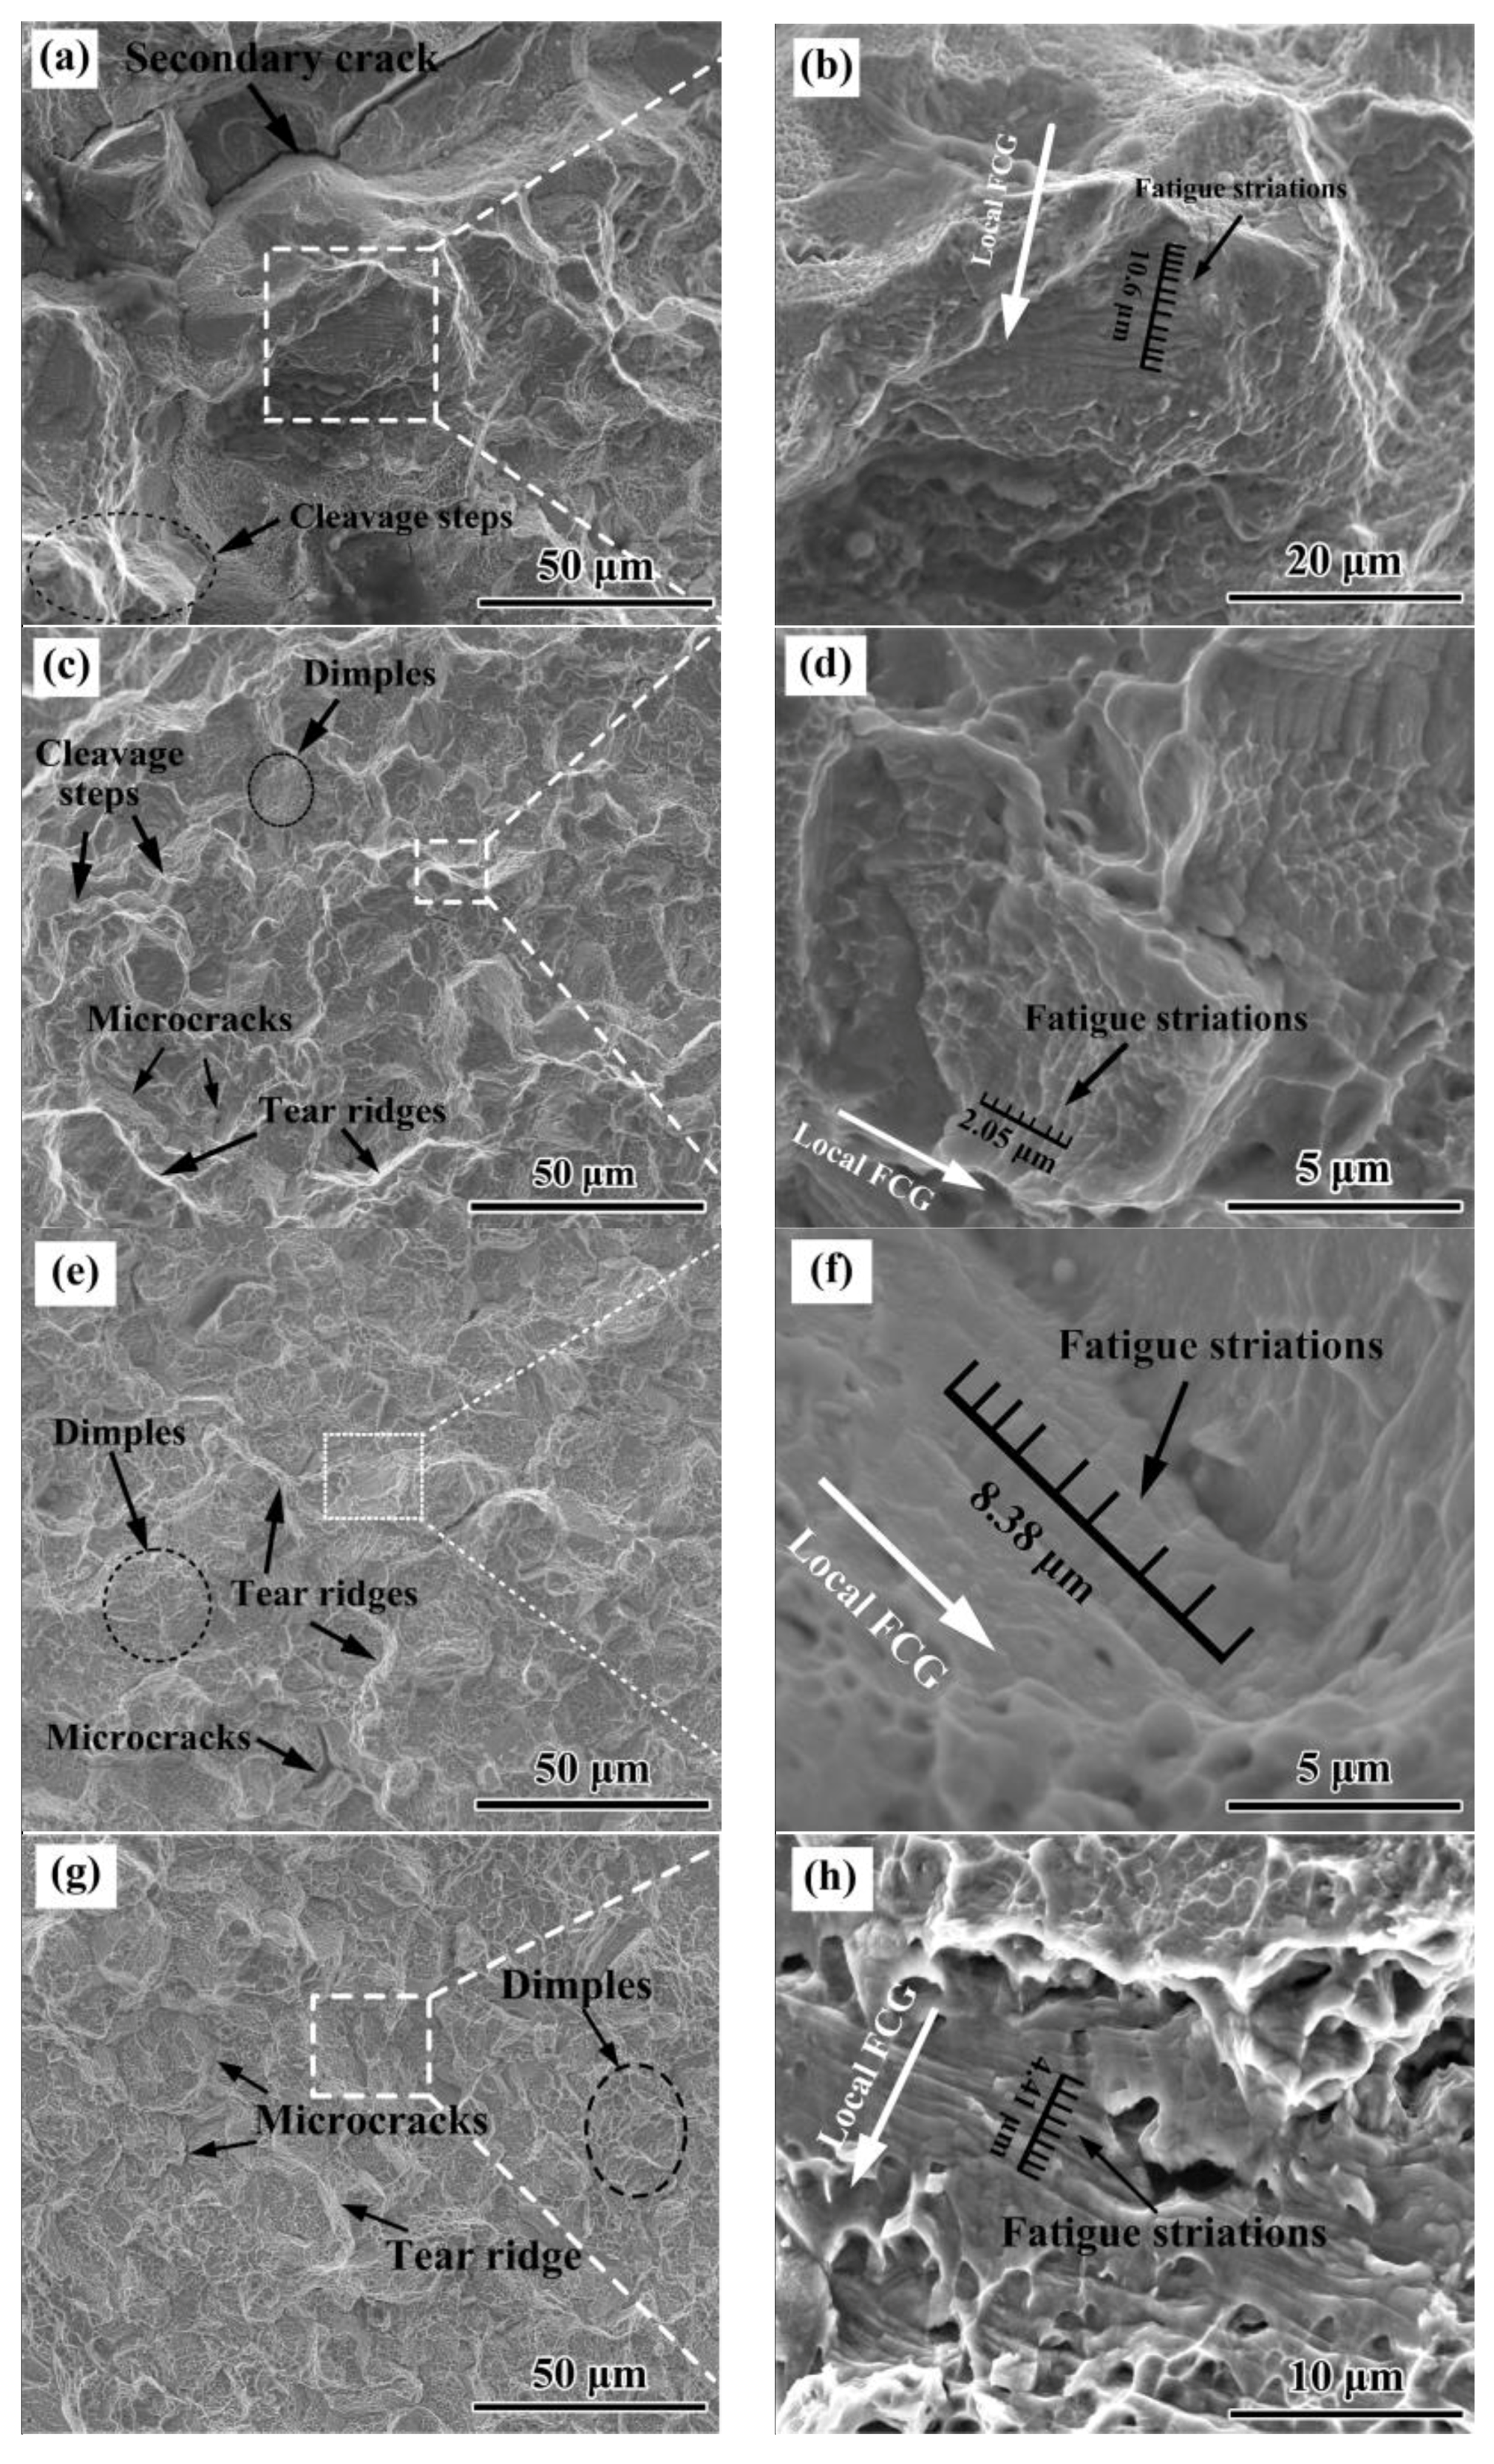
3.4. Fractography of Low Cycle Fatigue

As shown in Figure 10, the overall fracture surfaces can be separated into three stages: (i) fatigue crack initiation (FCI) zone; (ii) fatigue crack growth (FCG) zone; and (iii) final fracture (FF) zone. As indicated by the black arrows, the fatigue cracks initiated basically from the sample surface and multiple FCI sites were observed in all the LCF samples, which was due to the high level of applied stress amplitude. The FF zones were separated from the FCG zones by black dash lines. With the increasing of total strain amplitude, the size of the FF zone on the fracture surface increased. Furthermore, the NA alloy possessed larger size of the propagation zone (area including the FCI and FCG zone) at relatively low total strain amplitude (1.2%), while the propagation zone of the DA alloy was larger at higher total strain amplitude (1.8%). Since the size of the propagation zone on the fracture surface is positively correlated to the cycles required for fatigue crack initiation and propagation, it can be found that the feature of the fatigue fracture surfaces is agreed with the fatigue life results from LCF tests.
Figure 11 shows the details of the fatigue fracture surface in the FCG zones of the alloy at different total strain amplitudes. At low strain amplitude (1.2%), relatively smooth facets and cleavage steps could be observed on the fracture surface of both the NA and DA alloys. The fracture surface of the NA alloy was mainly composed of relatively smooth facets, surrounded by secondary cracks. However, extensive tear ridges along with a few microcracks and dimples were founded on the fracture surface of the DA alloy, suggesting larger plastic deformation was taken place in the DA alloy. When it came to high strain amplitude (1.8%), the fracture surface was constituted by larger numbers of tear ridges and dimples instead of the relatively smooth facets, indicating its similarity to the tensile fracture. Some microcracks propagated along the grain boundary could also be observed. The area in the white box on the fracture surface in Figure 11a,c,e,g is further magnified and illustrated in Figure 11b,d,f,h, respectively. The fatigue striations could be observed under higher magnifications. The spacing of fatigue striations could be utilized to estimate the FCG rate and the local FCG direction was perpendicular to the fatigue striations. The spacing of fatigue striations increased with the increasing of total strain amplitude for the both alloys. However, the fatigue striations spacing of the NA alloy was larger than that of the DA alloy under the same total strain amplitude, suggesting a higher resistance to the fatigue crack propagation for the DA alloy.

4. Discussion

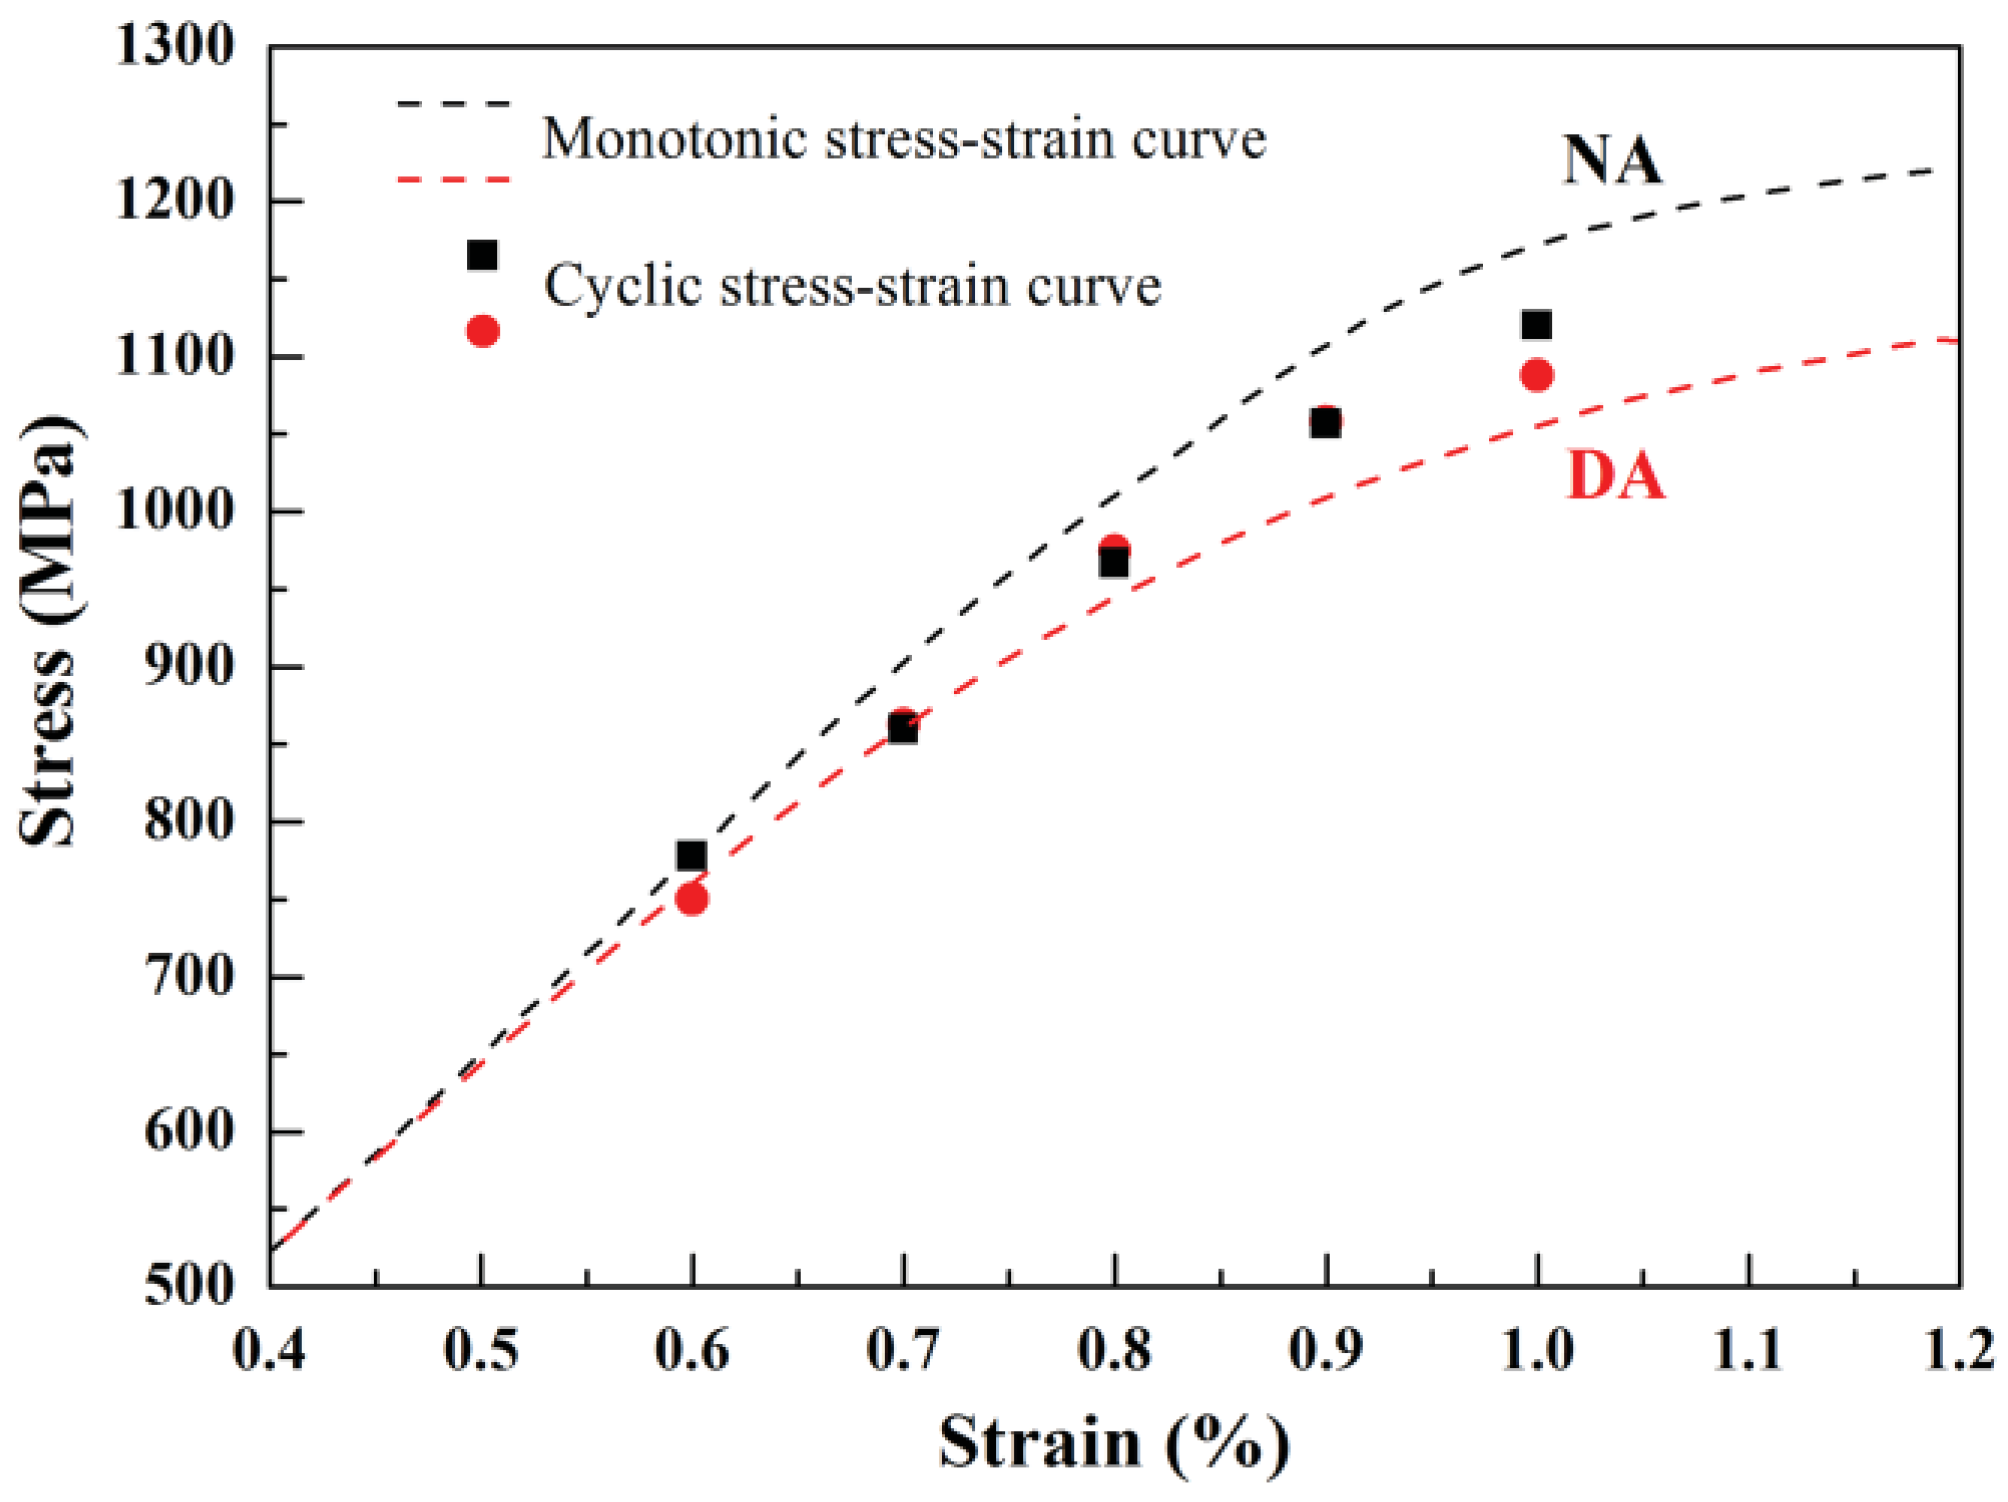
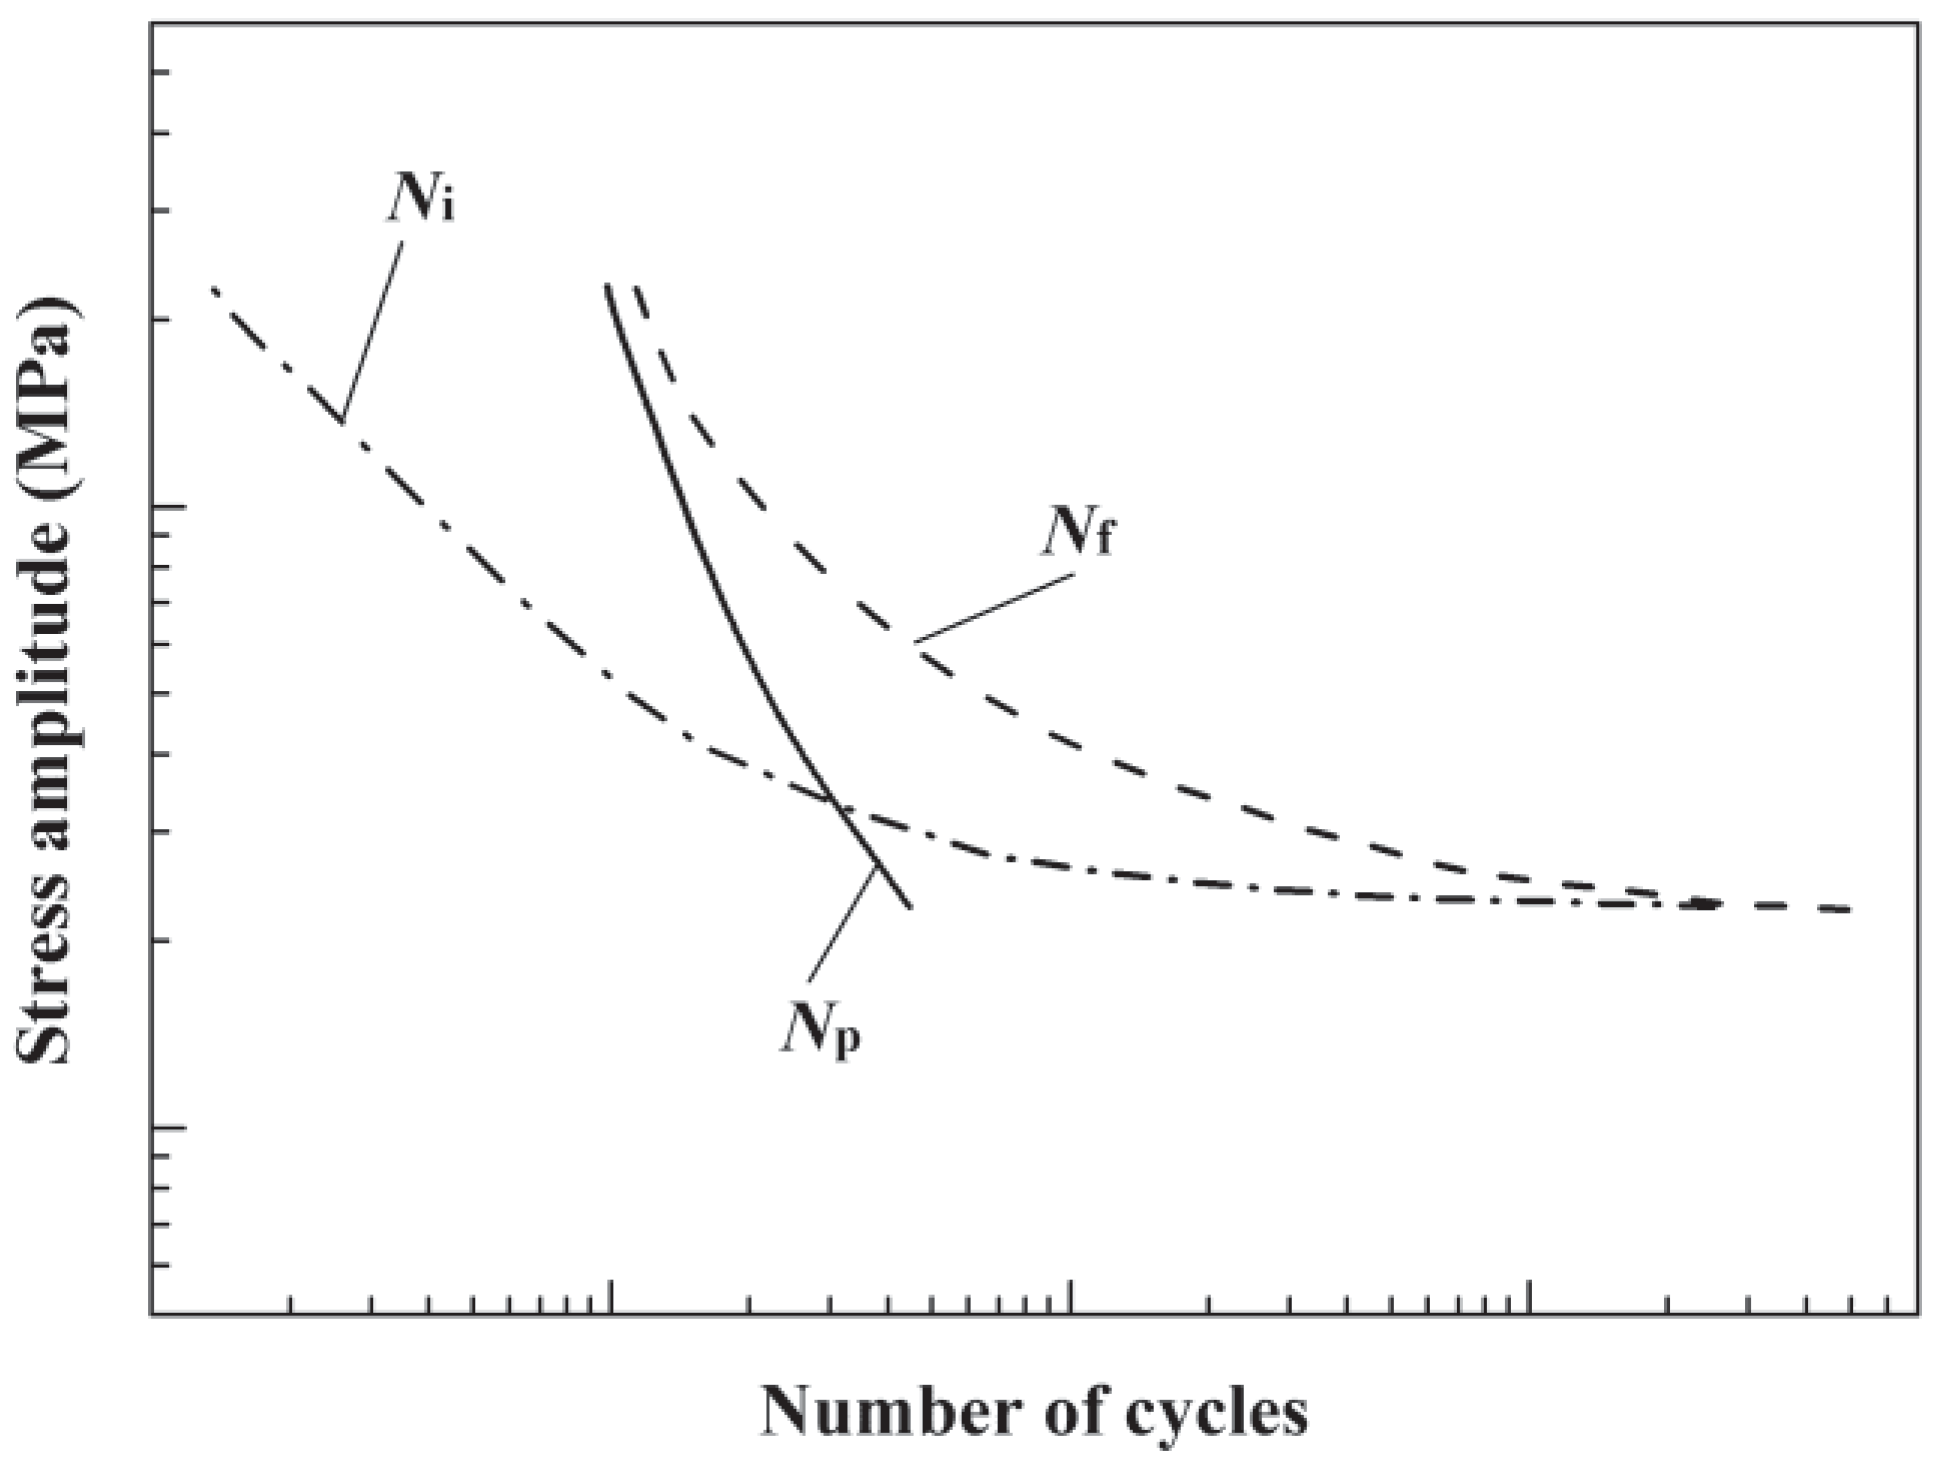
4.1. Effect of Precipitation States on the Fatigue Life

According to Figure 8, the fatigue life of the two aging states alloy increases alternately under various total strain amplitudes. The NA alloy presented a longer fatigue life under relatively low strain amplitudes while DA alloy showed a longer fatigue life when it came to higher strain amplitudes. As shown in Figure 12, the fatigue life (Nf) can be divided into initiation life (Ni) and propagation life (Np), while the proportion of Ni decreases with the increase of stress amplitude [29]. According to Figure 5, the stress amplitude of the alloy increases with the raise of total strain amplitude. Hence, it can be deduced that the proportion of Ni increases with the decreasing of total strain amplitude for both NA and DA alloys.
Under low total strain amplitude, the fatigue crack initiation (FCI) life covers most of the total fatigue life. The FCI life increases with the increase of deformation uniformity of the material [30]. For the aging hardening alloy, the interaction between the precipitates and dislocations is the essential reason that influences the uniformity of deformation [31]. While the microstructure with non-shearable precipitates trends to deform uniformly, the presence of shearable precipitates frequently leads to local plastic deformation [32]. According to the previous study [19,33], the γ′ precipitates and γI precipitates could only be bypassed by the dislocations while a considerable part of the γ′I precipitates could be sheared by the dislocations. Therefore, the NA alloy fully composed of non-shearable γ′ precipitates presented more uniform deformation than the DA alloy with shearable γ′I precipitates during the FCI stage, indicating a longer FCI life of the NA alloy. As a result, the NA alloy presented a longer total fatigue life under low total strain amplitude.
As for the high total strain amplitude, the fatigue crack quickly enters the propagation stage after very short initiation stage, and the fatigue crack growth (FCG) life accounts for the most of the fatigue life. According to the overall fracture surfaces (Figure 10), the DA alloy showed a longer critical crack length (larger size of the propagation zone) under the high total strain amplitude. Furthermore, the DA alloy presented a smaller spacing of fatigue striations (Figure 11), implying a lower FCG rate. Both long critical crack length and low FCG rate can be attributed to the high fatigue crack propagation resistance, which is closely related to the precipitation states. Owing to the larger number of shearable precipitates in the DA alloy [19], the dislocations slip is partially reversible during the cyclic loading process [7]. These “reversible” dislocations will not contribute to damage accumulation in the plastic zone, resulting in the increase of FCG resistance [34]. Consequently, the DA alloy possessed a longer FCG life under high total strain amplitude, as well as the total fatigue life.

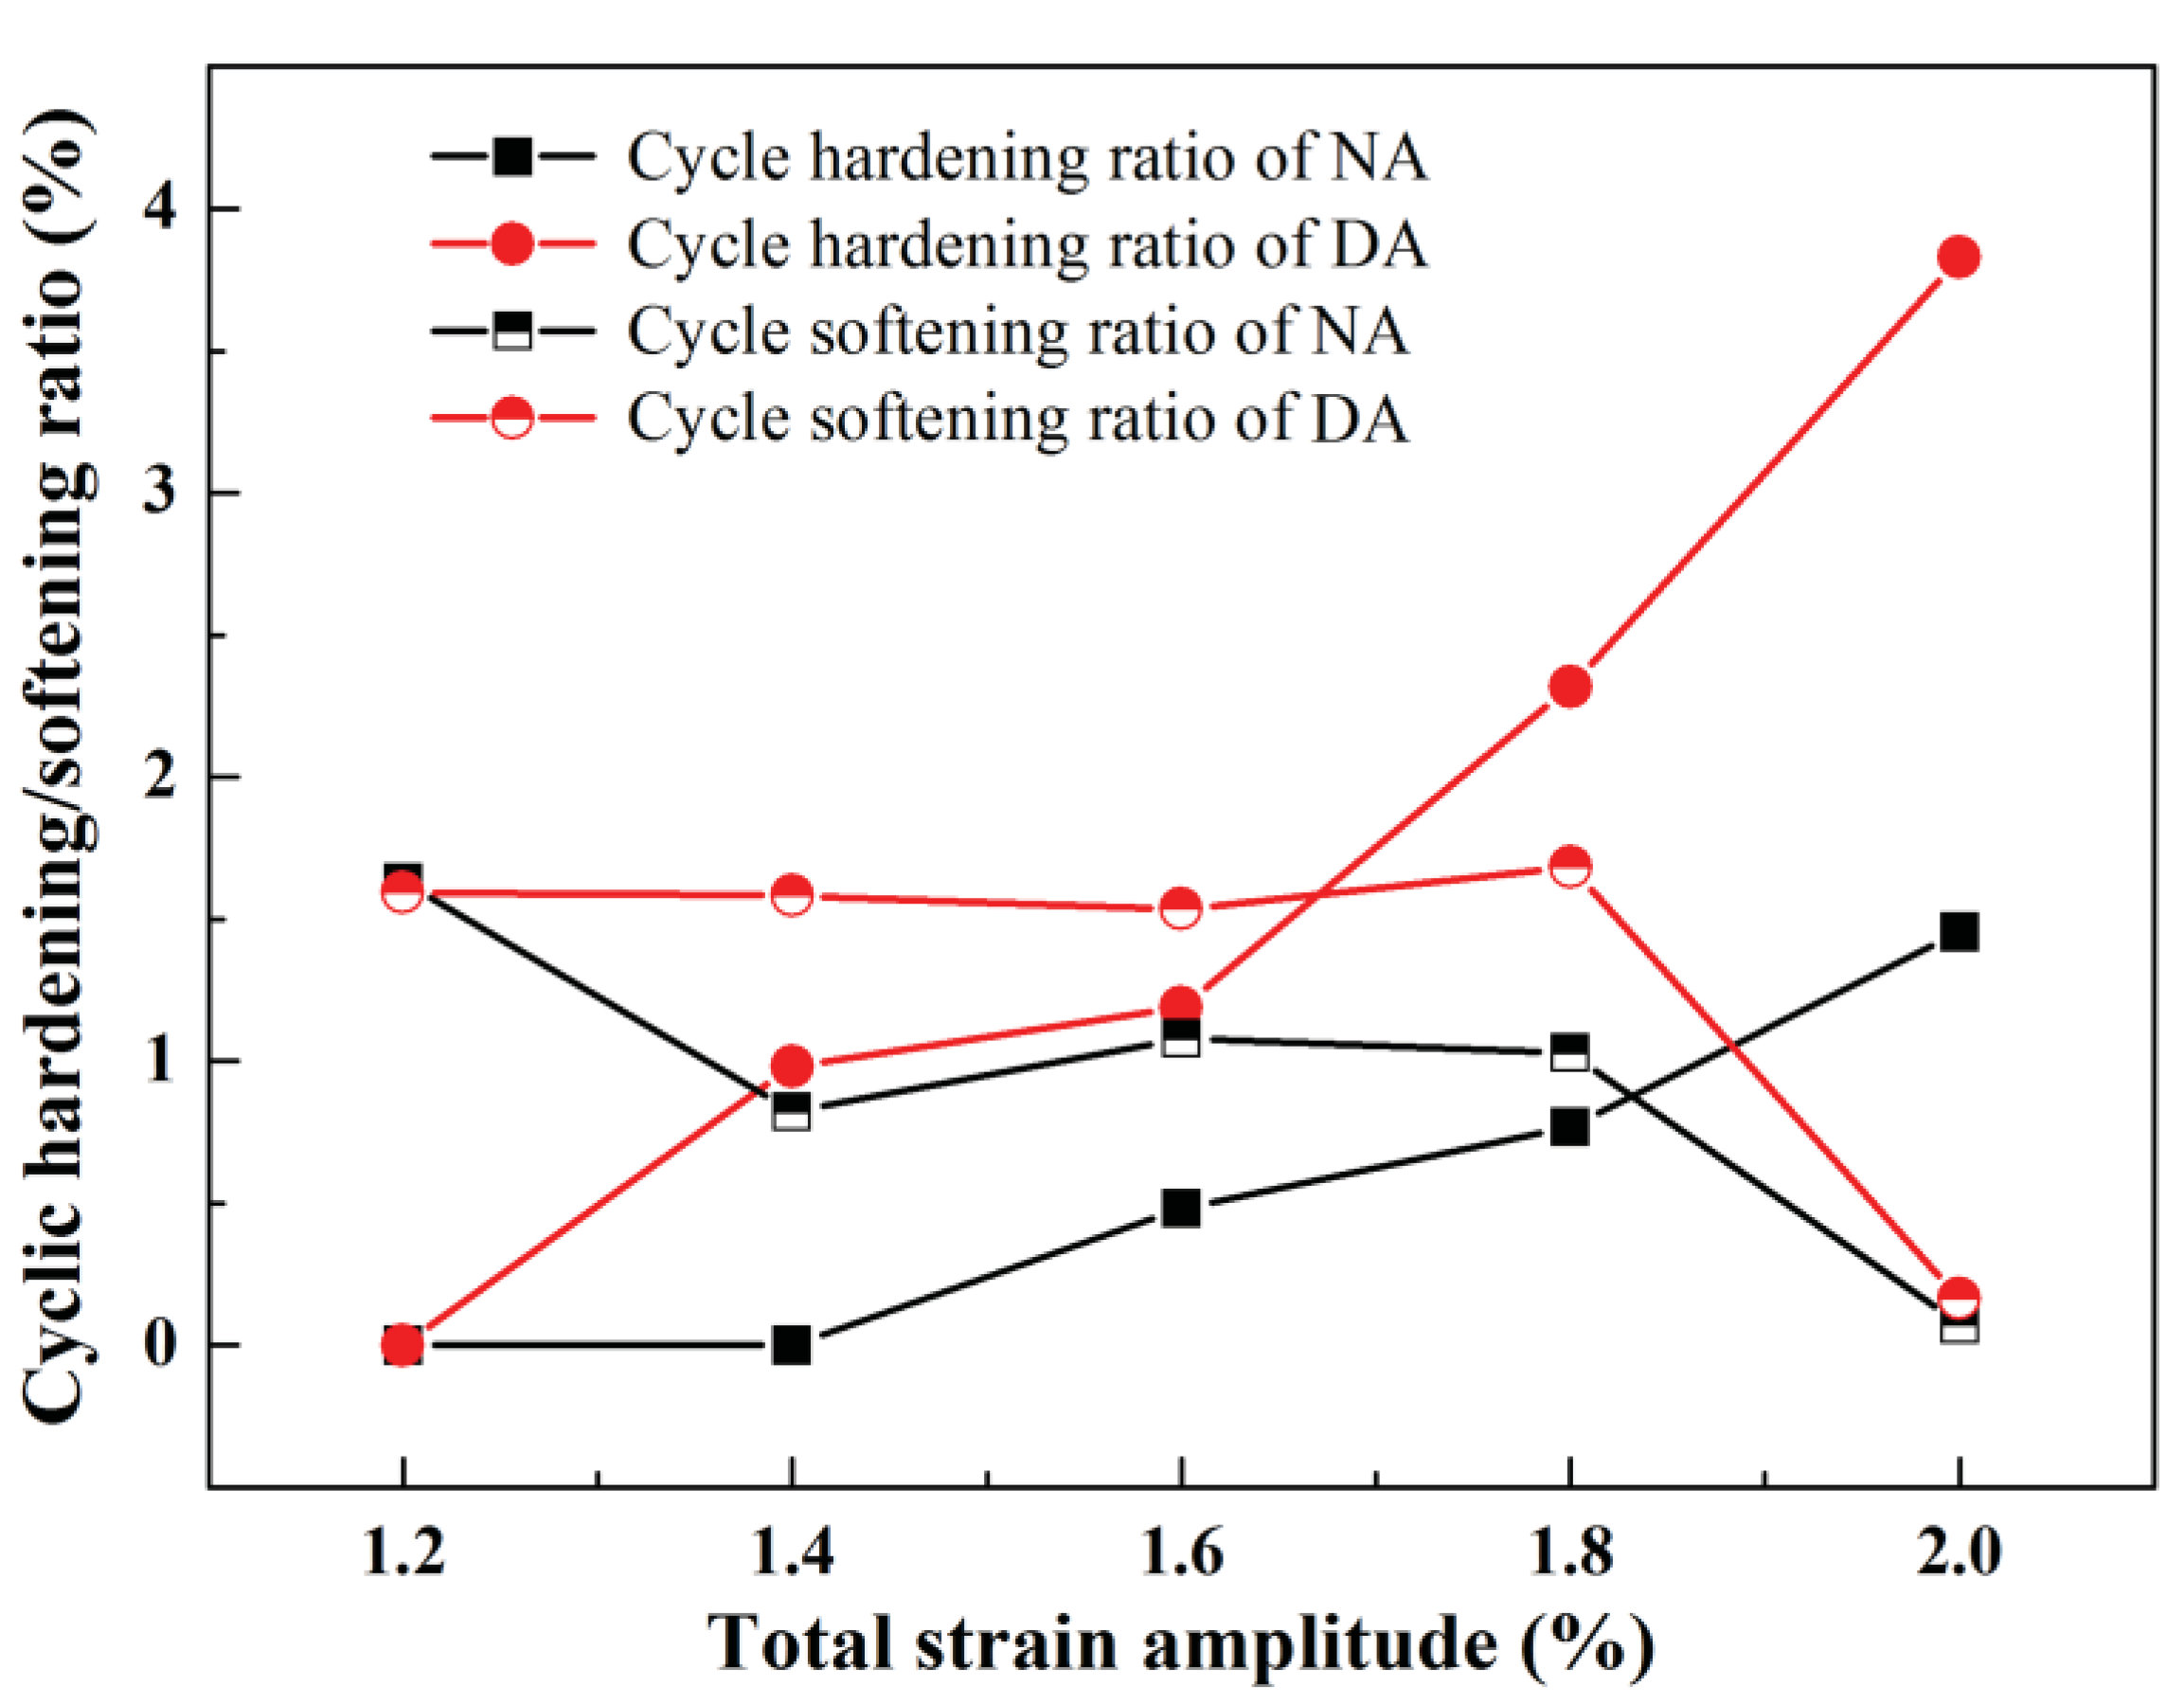
4.2. Effect of Precipitation States on the Cyclic Hardening/Softening Behaviors

The obtained cyclic stress response behavior results revealed that the NA and DA alloy displayed different cyclic hardening and cyclic softening behaviors, especially under high total strain amplitude (higher than 1.4%). The NA alloy presented cyclic stability followed by cyclic softening, while the DA alloy firstly showed cyclic hardening and then cyclic softening. The cyclic stress during LCF tests can be separated into effective and internal stress [15], which are two important parameters in characterizing LCF behaviors [35,36].
Figure 13a,b shows the evolution of the effective stress and internal stress of the alloy with the number of cycles (N) at different total strain amplitudes. As seen in this figure, the effective stress makes more contribution to the cyclic stress than the internal stress. During the LCF tests, the effective stress of both alloys decreased with the increase of N, while the internal stress increased at first and then became saturated. Despite the similar variation tendency of effective stress and internal stress, the DA alloy presented a higher level of effective stress while the NA alloy possessed larger internal stress under the same total strain amplitude.
As shown in Figure 13c,d, the kinematic hardening effect (internal stress) can be calculated by subtracting the isotropic hardening effect (effective stress) from the total stress amplitude, i.e., the area indicated by shading. Consequently, the cyclic hardening/softening behaviors of the alloy can be attributed to the competition of kinematic hardening (shading area) and isotropic softening (gray area). As for the NA alloy, the fast decrease of the effective stress causes a greater degree of isotropic softening, which offsets the kinematic hardening effect at first 30 cycles. As a result, the NA alloy presented cyclic stability at first. By contrast, the gentle decrease of the effective stress leads to a smaller isotropic softening, which is less than the kinematic hardening at first 30 cycles. Hence, the DA alloy showed a considerable cyclic hardening during the early stage of LCF tests.
The effective stress is contributed to the isotropic hardening, which depends on the accumulation and annihilation of forest dislocations [11]. The effective stress softening is mainly related to the dislocation annihilation causing by dynamic recovery [37]. The fine shearable precipitates in the DA alloy help to maintain a low dislocation dynamic recovery rate during the deformation [19], so the effective stress decreases more gently with the increase of N. Large non-shearable precipitates in the NA alloy can provide higher dislocations accumulation rate, but the dislocations dynamic recovery rate is far more quickly than that of the shearable precipitates [19], leading to faster decrease of the effective stress. Therefore, the decrease rate of the effective stress of the DA alloy was much slower than that of the NA alloy during LCF process.
The internal stress is contributed to the kinematic hardening, which is caused by the elastic loading of the non-shearable precipitates [38]. The internal stress hardening is due to the storage of Orowan loops around the non-shearable precipitates bypassed by the mobile dislocations [23]. Naturally, the NA alloy with higher volume fraction of non-shearable precipitates possesses larger internal stress. Furthermore, plastic relaxation occurs around the precipitates with the increase of plastic strain, resulting in the stabilization of internal stress [38].

5. Conclusions

In this work, the effect of precipitation states on LCF behaviors of Cu-Be-Co-Ni was investigated. The cyclic hardening and cyclic softening behaviors of the alloy were well explained by the evolution of effective stress and internal stress during the LCF process. The main conclusions are summarized below.
(1)
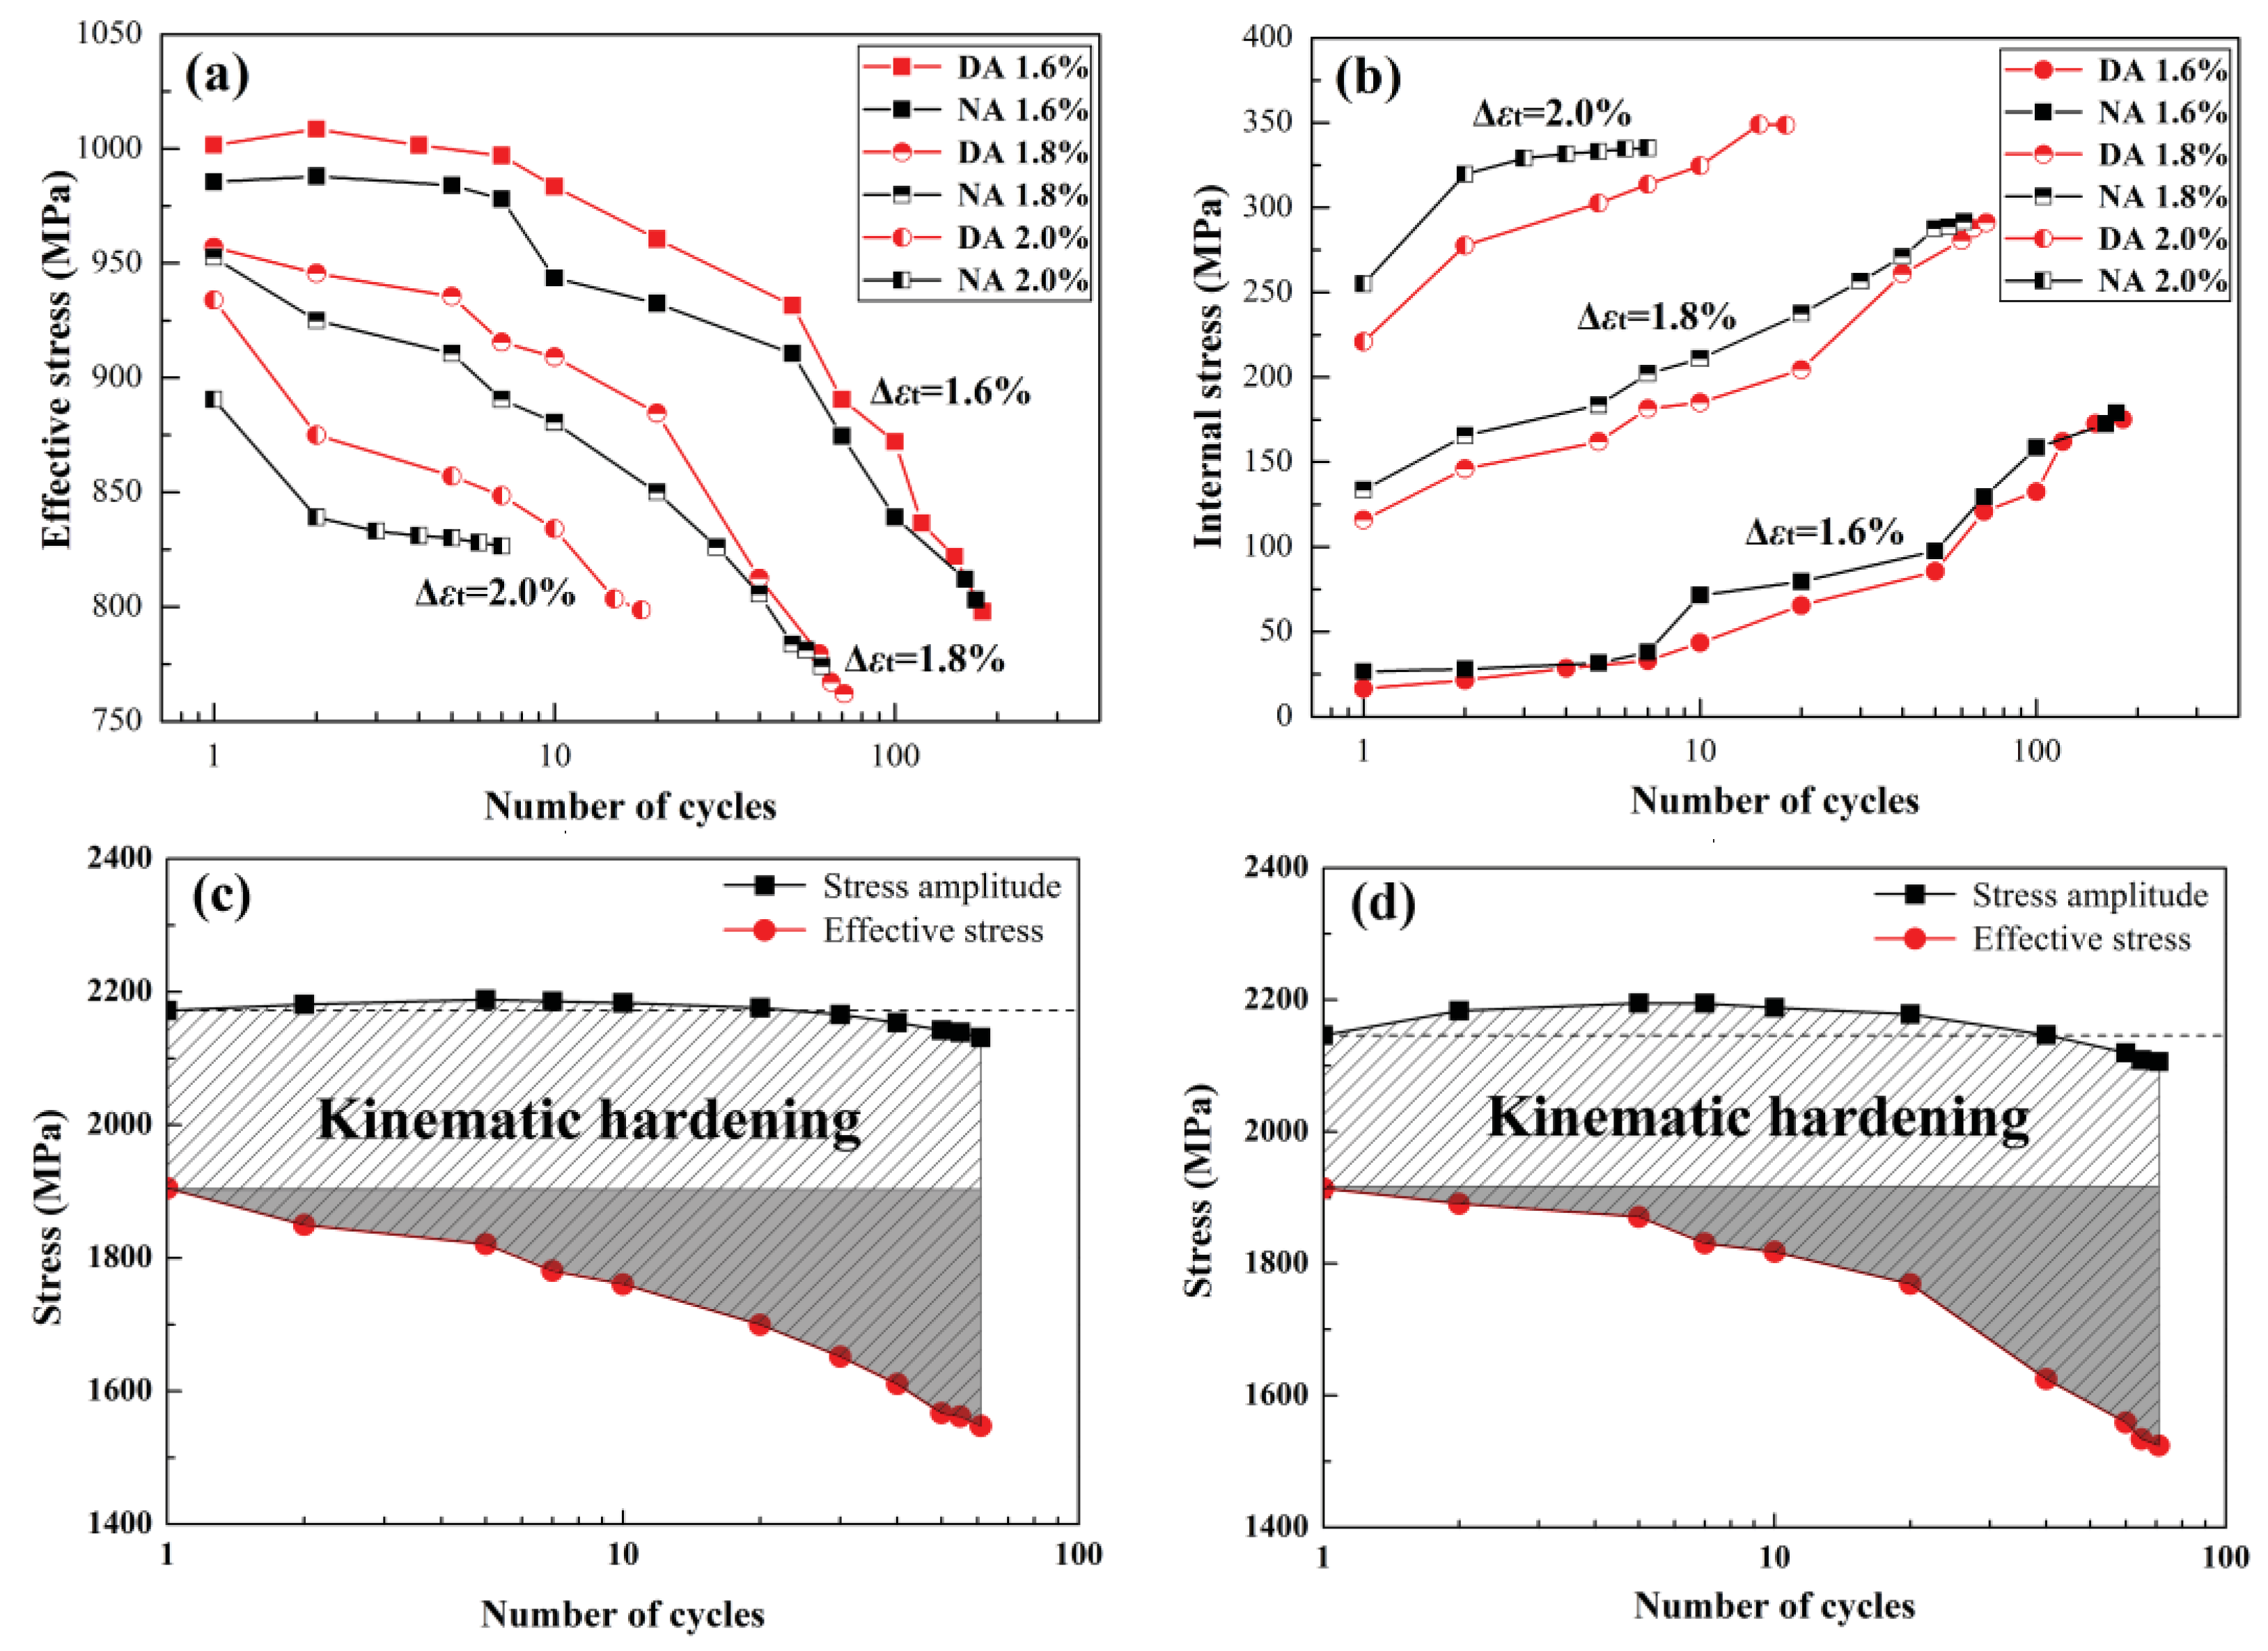
During the cyclic loading, the effective stress of the Cu-Be-Co-Ni alloy decreased with the increase of the number of cycles (N), while the internal stress increased at first and then became saturated. The competition between the kinematic hardening and isotropic softening decided whether the alloy exhibited cyclic hardening or softening. The fine shearable precipitates in the DA alloy helped to maintain a low dislocation dynamic recovery rate during the deformation, resulting in retarding of the decrease of effective stress, which caused the cyclic hardening in the early stage of the cyclic loading.
(2)
The precipitation state of fully non-shearable γ′ precipitates in the NA alloy fostered the uniform deformation and promoted the fatigue crack initiation resistance, resulting in a longer fatigue life under low total strain amplitude. The fine shearable precipitates in the DA alloy contributed to the decrease of the damage accumulation in the crack tip plastic zone and promoted the fatigue crack propagation resistance, leading to a longer fatigue life under high total strain amplitude.
(3)
Under the cyclic loading with high stress, the fatigue cracks of the Cu-Be-Co-Ni alloy initiated basically from the sample surface with multiple initiation sites. The macroscopic morphology of the fracture surface presented good agreement with the fatigue life results from LCF tests data. The greater the proportion of propagation zone (area including the FCI and FCG zone) on the fracture surface is, the longer the fatigue life is. Furthermore, the smaller fatigue striations spacing of the DA alloy suggested a higher fatigue crack propagation resistance compared to the NA alloy.

Author Contributions

Y.T. and Y.K. conceived and designed the experiments; D.L. and M.S. performed the experiments; L.Z. and Y.T. analyzed the data; Y.H. provided helpful discussions on fractography of low cycle fatigue; and Y.T. wrote the paper.

Acknowledgments

The authors are grateful for financial supports received from the National Natural Science Foundation of China (Grant Nos. 51701074 and 51465019), Natural Science Foundation of Jiangxi Province (Grant No. 20171BAB216031), Young Scientists Funded Projects in Jiangxi Province (Grant No. 20153BCB23005) and Natural Science Foundation of Zhejiang Province (Grant No. LY17E050020).

Conflicts of Interest

The authors declare no conflict of interest.

References

  1. Davis, J.R. (Ed.) Copper and Copper Alloys; ASM International: Geauga County, OH, USA, 2001; pp. 153–168. [Google Scholar]
  2. Behjati, P.; Vahid Dastjerdi, H.; Mahdavi, R. Influence of ageing process on sound velocity in C17200 copper–beryllium alloy. J. Alloys Compd. 2010, 505, 739–742. [Google Scholar] [CrossRef]
  3. Liu, P.; Ren, F.Z.; Jia, S.G. Copper Alloy and Its Application, 1st ed.; Chemistry Industry Press: Beijing, China, 2007; pp. 110–122. [Google Scholar]
  4. Tavares, S.M.O.; de Castro, P.M.S.T. An overview of fatigue in aircraft structures. Fatigue Fract. Eng. Mater. Struct. 2017, 40, 1510–1529. [Google Scholar] [CrossRef]
  5. Hormozi, R.; Biglari, F.; Nikbin, K. Experimental study of type 316 stainless steel failure under LCF/TMF loading conditions. Int. J. Fatigue 2015, 75, 153–169. [Google Scholar] [CrossRef]
  6. Delbove, M.; Vogt, J.B.; Bouquerel, J.; Soreau, T.; Primaux, F. Low cycle fatigue behaviour of a precipitation hardened Cu-Ni-Si alloy. Int. J. Fatigue 2016, 92, 313–320. [Google Scholar] [CrossRef]
  7. Hockauf, K.; Wagner, M.F.-X.; Halle, T.; Niendorf, T.; Hockauf, M.; Lampke, T. Influence of precipitates on low-cycle fatigue and crack growth behavior in an ultrafine-grained aluminum alloy. Acta Mater. 2014, 80, 250–263. [Google Scholar] [CrossRef]
  8. Wang, Y.L.; Pan, Q.L.; Wei, L.L.; Li, B.; Wang, Y. Effect of retrogression and reaging treatment on the microstructure and fatigue crack growth behavior of 7050 aluminum alloy thick plate. Mater. Des. 2014, 55, 857–863. [Google Scholar] [CrossRef]
  9. Chen, C.; Lv, B.; Wang, F.; Zhang, F.C. Low-cycle fatigue behaviors of pre-hardening Hadfield steel. Mater. Sci. Eng. A 2017, 695, 144–153. [Google Scholar] [CrossRef]
  10. Ovono Ovono, D.; Guillot, I.; Massinon, D. Study on low-cycle fatigue behaviours of the aluminium cast alloys. J. Alloys Compd. 2008, 452, 425–431. [Google Scholar] [CrossRef]
  11. Ashby, M.F. The deformation of plastically non-homogeneous materials. Philos. Mag. 1970, 21, 399–424. [Google Scholar] [CrossRef]
  12. Dubost, B.; Sainfort, P. Precipitation hardening of aluminium alloys. Technol. Eng. Metall. Mater. 1991, MB3, 1–24. [Google Scholar]
  13. Xu, H.F.; Ye, D.Y.; Mei, L.B. A study of the back stress and the friction stress behaviors of Ti-6Al-4V alloy during low cycle fatigue at room temperature. Mater. Sci. Eng. A 2017, 700, 530–539. [Google Scholar] [CrossRef]
  14. Feaugas, X. On the origin of the tensile flow stress in the stainless steel AISI 316 L at 300 K: Back stress and effective stress. Acta Mater. 1999, 13, 3617–3632. [Google Scholar] [CrossRef]
  15. Dickson, J.I.; Boutin, J.; Handfield, L. A comparison of two simple methods for measuring cyclic internal and effective stresses. Mater. Sci. Eng. 1984, 64, 7–11. [Google Scholar] [CrossRef]
  16. Cottrell, A.H. Dislocations and Plastic Flow in Crystals; Oxford University Press: London, UK, 1953; pp. 111–116. [Google Scholar]
  17. Kuhlmann-Wilsdorf, D.; Laird, C. Dislocation behavior in fatigue II. Friction stress and back stress as inferred from an analysis of hysteresis loops. Mater. Sci. Eng. 1979, 37, 111–120. [Google Scholar] [CrossRef]
  18. Dickson, J.I.; Handfield, L.; L’Esperance, G. Cyclic softening and thermally activated deformation of titanium and zirconium. Mater. Sci. Eng. 1983, 60, 3–7. [Google Scholar] [CrossRef]
  19. Tang, Y.C.; Kang, Y.L.; Yue, L.J.; Jiao, X.L. Mechanical properties optimization of a Cu–Be–Co–Ni alloy by precipitation design. J. Alloys Compd. 2017, 695, 613–625. [Google Scholar] [CrossRef]
  20. Fournier, B.; Sauzay, M.; Caes, C.; Noblecourt, M.; Mottot, M. Analysis of the hysteresis loops of a martensitic steel–Part I: Study of the influence of strain amplitude and temperature under pure fatigue loadings using an enhanced stress partitioning method. Mater. Sci. Eng. A 2006, 437, 183–196. [Google Scholar] [CrossRef]
  21. Rioja, R.J.; Laughlin, D.E. The sequence of precipitation in Cu-2w/0 Be alloys. Acta Metall. 1980, 28, 1301–1313. [Google Scholar] [CrossRef]
  22. Monzen, R.; Seo, T.; Sakai, T.; Watanabe, C. Precipitation Processes in a Cu–0.9mass% Be Single Crystal. Mater. Trans. 2006, 47, 2925–2934. [Google Scholar] [CrossRef]
  23. Cheng, L.M.; Poole, W.J.; Embury, J.D.; Lloyd, D.J. The influence of precipitation on the work-hardening behavior of the aluminum alloys AA6111 and AA7030. Metall. Mater. Trans. A 2003, 34, 2473–2481. [Google Scholar] [CrossRef]
  24. Kocks, U.F.; Mecking, H. Physics and phenomenology of strain hardening: The FCC case. Prog. Mater. Sci. 2003, 48, 171–273. [Google Scholar] [CrossRef]
  25. Shaha, S.K.; Czerwinski, F.; Kasprzak, W.; Chen, D.L. Work hardening and texture during compression deformation of the Al-Si-Cu-Mg alloy modified with V, Zr and Ti. J. Alloys Compd. 2014, 593, 290–299. [Google Scholar] [CrossRef]
  26. Da Costa Teixeira, J.; Bourgeois, L.; Sinclair, C.W.; Hutchinson, C.R. The effect of shear-resistant, plate-shaped precipitates on the work hardening of Al alloys: Towards a prediction of the strength–elongation correlation. Acta Mater. 2009, 57, 6075–6089. [Google Scholar] [CrossRef]
  27. Ma, E.M.; Chawla, K.K. Mechanical Behavior of Materials; Cambridge University Press: Cambridge, UK, 2008; pp. 1298–1305. [Google Scholar]
  28. Li, H.; Lv, F.; Xiao, Z.; Liang, X.; Sang, F.; Li, P. Low-cycle fatigue behavior of a cast Mg–Y–Nd–Zr alloy by T6 heat treatment. Mater. Sci. Eng. A 2016, 676, 377–384. [Google Scholar] [CrossRef]
  29. Bathias, C.; Pineau, A. Fatigue of Materials and Structures; John Wiley & Sons: Hoboken, NJ, USA, 2013; pp. 70–71. [Google Scholar]
  30. Forsyth, P.J. Fatigue damage and crack growth in aluminum alloys. Acta Metall. 1963, 11, 703–717. [Google Scholar] [CrossRef]
  31. Watanabe, C.; Monzen, R.; Tazaki, K. Effects of Al3Sc particle size and precipitate-free zones on fatigue behavior and dislocation structure of an aged Al-Mg-Sc alloy. Int. J. Fatigue 2008, 30, 635–641. [Google Scholar] [CrossRef]
  32. Deschamps, A.; Decreus, B.; De Geuser, F.; Dorin, T.; Weyland, M. The influence of precipitation on plastic deformation of Al–Cu–Li alloys. Acta Mater. 2013, 61, 4010–4021. [Google Scholar] [CrossRef]
  33. Tang, Y.C.; Kang, Y.L.; Yue, L.J.; Jiao, X.L. The effect of aging process on the microstructure and mechanical properties of a Cu-Be-Co-Ni alloy. Mater. Des. 2015, 85, 332–341. [Google Scholar] [CrossRef]
  34. Desmukh, M.N.; Pandey, R.K.; Mukhopadhyay, A.K. Effect of aging treatments on the kinetics of fatigue crack growth in 7010 aluminum alloy. Mater. Sci. Eng. A 2006, 435–436, 318–326. [Google Scholar] [CrossRef]
  35. Li, J.; Zhang, J.Y.; Liu, G.; Sun, J. New insight into the stable grain size of nanotwinned Ni in steady-state creep: Effect of the ratio of effective-to-internal stress. Int. J. Plast. 2016, 85, 172–189. [Google Scholar] [CrossRef]
  36. Vucko, F.; Bosch, C.; Delafosse, D. Experimental investigations of internal and effective stresses during fatigue loading of high-strength steel. Mater. Sci. Eng. A 2014, 597, 381–386. [Google Scholar] [CrossRef] [Green Version]
  37. Püschl, W. Models for dislocation cross-slip in close-packed crystal structures: A critical review. Prog. Mater. Sci. 2002, 47, 415–461. [Google Scholar] [CrossRef]
  38. Brown, L.M.; Stobbs, W.M. The work-hardening of copper-silica. Philos. Mag. 1971, 23, 1185–1199. [Google Scholar] [CrossRef]
Figure 1. Geometry of the LCF test sample, all dimensions are in mm.
Metals 08 00444 g001
Figure 2. Determination of the effective stress and the internal stress from fatigue hysteresis loops by KWLC technique. The hysteresis loop data are taken from the fifth cycle of the DA samples under the total strain amplitude of 2%.
Metals 08 00444 g002
Figure 3. Transmission electron microscope (TEM) images of the alloy under different aging conditions: (a) normal aging (NA); (b) double aging (DA); (c) high-resolution transmission electron microscope (HRTEM) images of the precipitates in (b); (d) higher magnification and (e) fast Fourier transform (FFT) of Area 1 in (c), respectively; and (f) higher magnification and (g) FFT of Area 2 in (c), respectively. HRTEM images are obtained with an incident beam parallel to the [110]α direction.
Metals 08 00444 g003
Figure 4. The flow stress and strain hardening curves of the alloy under different aging conditions.
Metals 08 00444 g004
Figure 5. Stress amplitude vs. the number of cycles of the alloy under different aging conditions: (a) NA; and (b) DA.
Metals 08 00444 g005
Figure 6. Cyclic hardening ratio and cyclic softening ratio of the alloy under different aging conditions.
Metals 08 00444 g006
Figure 7. Cyclic stress–strain scatters and the corresponding monotonic stress–strain curves for NA and DA alloy.
Metals 08 00444 g007
Figure 8. Fatigue life of the alloy under different aging conditions.
Metals 08 00444 g008
Figure 9. Evaluation of fatigue parameters for the alloy: (a) Coffin–Manson plot; and (b) Basquin plot.
Metals 08 00444 g009
Figure 10. Scanning electron microscope (SEM) images of overall fracture surfaces of the alloy: NA alloy fatigued at the total strain amplitude of: (a) 1.2%; and (c) 1.8%. DA alloy fatigued at the total strain amplitude of: (b) 1.2%; and (d) 1.8%.
Metals 08 00444 g010
Figure 11. SEM images of the fracture surface of the samples tested at total strain amplitude of: 1.2% (ad); and 1.8% (eh), showing the morphology in the FCG zone for: the NA alloy (a,b,e,f); and the DA alloy (c,d,g,h).
Metals 08 00444 g011
Figure 12. Number of cycles for fatigue crack initiation, fatigue crack propagation and total fatigue life as a function of the applied stress amplitude.
Metals 08 00444 g012
Figure 13. Effective stress (a); and internal stress (b) of NA alloy and DA alloy as a function of number of cycles at different total strain. Evolution of kinematic hardening effect with number of cycles of NA (c) and DA (d) alloy at total strain amplitude of 1.8%. The kinematic hardening is indicated by shading while the isotropic softening is displayed by the gray area.
Metals 08 00444 g013
Table 1. The composition of Cu-Be-Ni-Co alloy (wt %).
ElementBeNiCoCu
Content1.90.2–0.30.1–0.2Bal.
Table 2. Tensile properties of the Cu-Be-Co-Ni alloys under different aging conditions.
Aging ConditionYoung’s Modulus (GPa)YS (MPa)UTS (MPa)Uniform Elongation (%)
DA134.2113113087.1
NA135.7121313005.3
Table 3. Low cycle fatigue parameters obtained for estimating the fatigue life of the alloy in this study.
Aging ConditionFatigue Strength Coefficient, σ f (MPa)Fatigue Strength Exponent, bFatigue Ductility Coefficient, ε f (%)Fatigue Ductility Exponent, c
NA2135−0.1275.757−0.925
DA2455−0.15430.577−1.209

