Enhancement of Strength and Hot Workability of AZX312 Magnesium Alloy by Disintegrated Melt Deposition (DMD) Processing in Contrast to Permanent Mold Casting

 ,
,
Abstract
:1. Introduction
2. Materials and Experimental Procedure
3. Results and Discussion
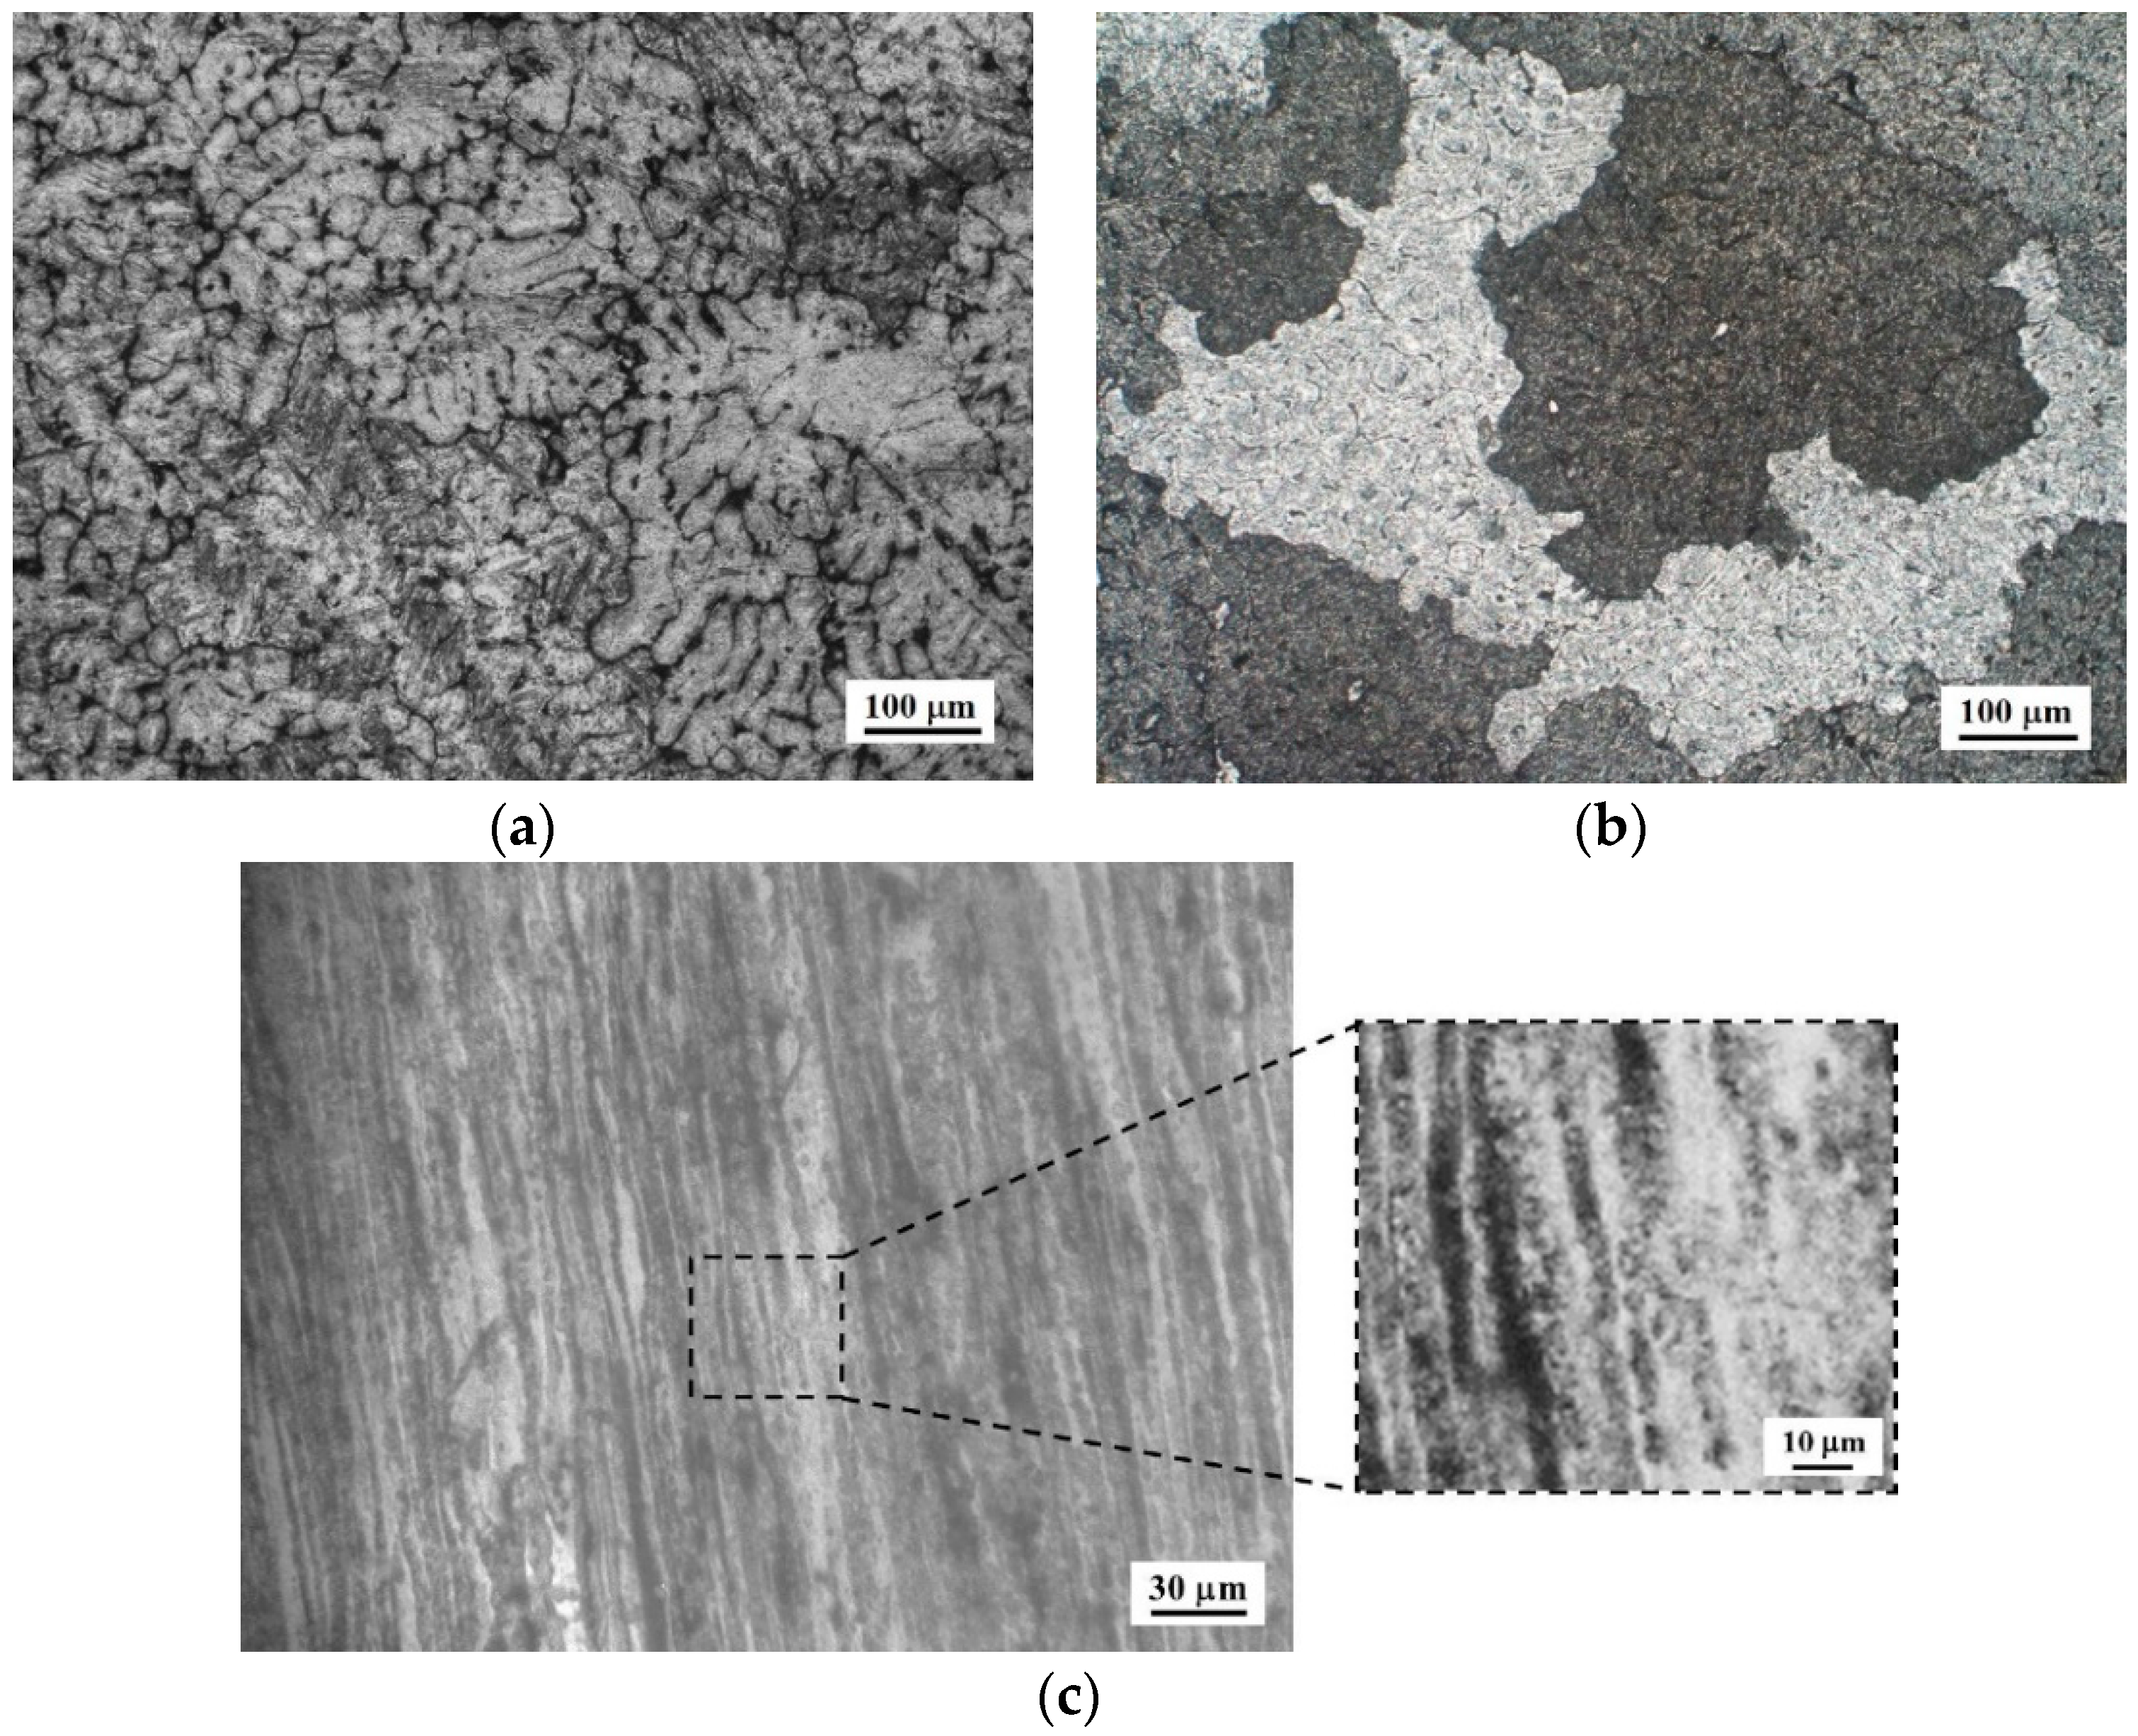
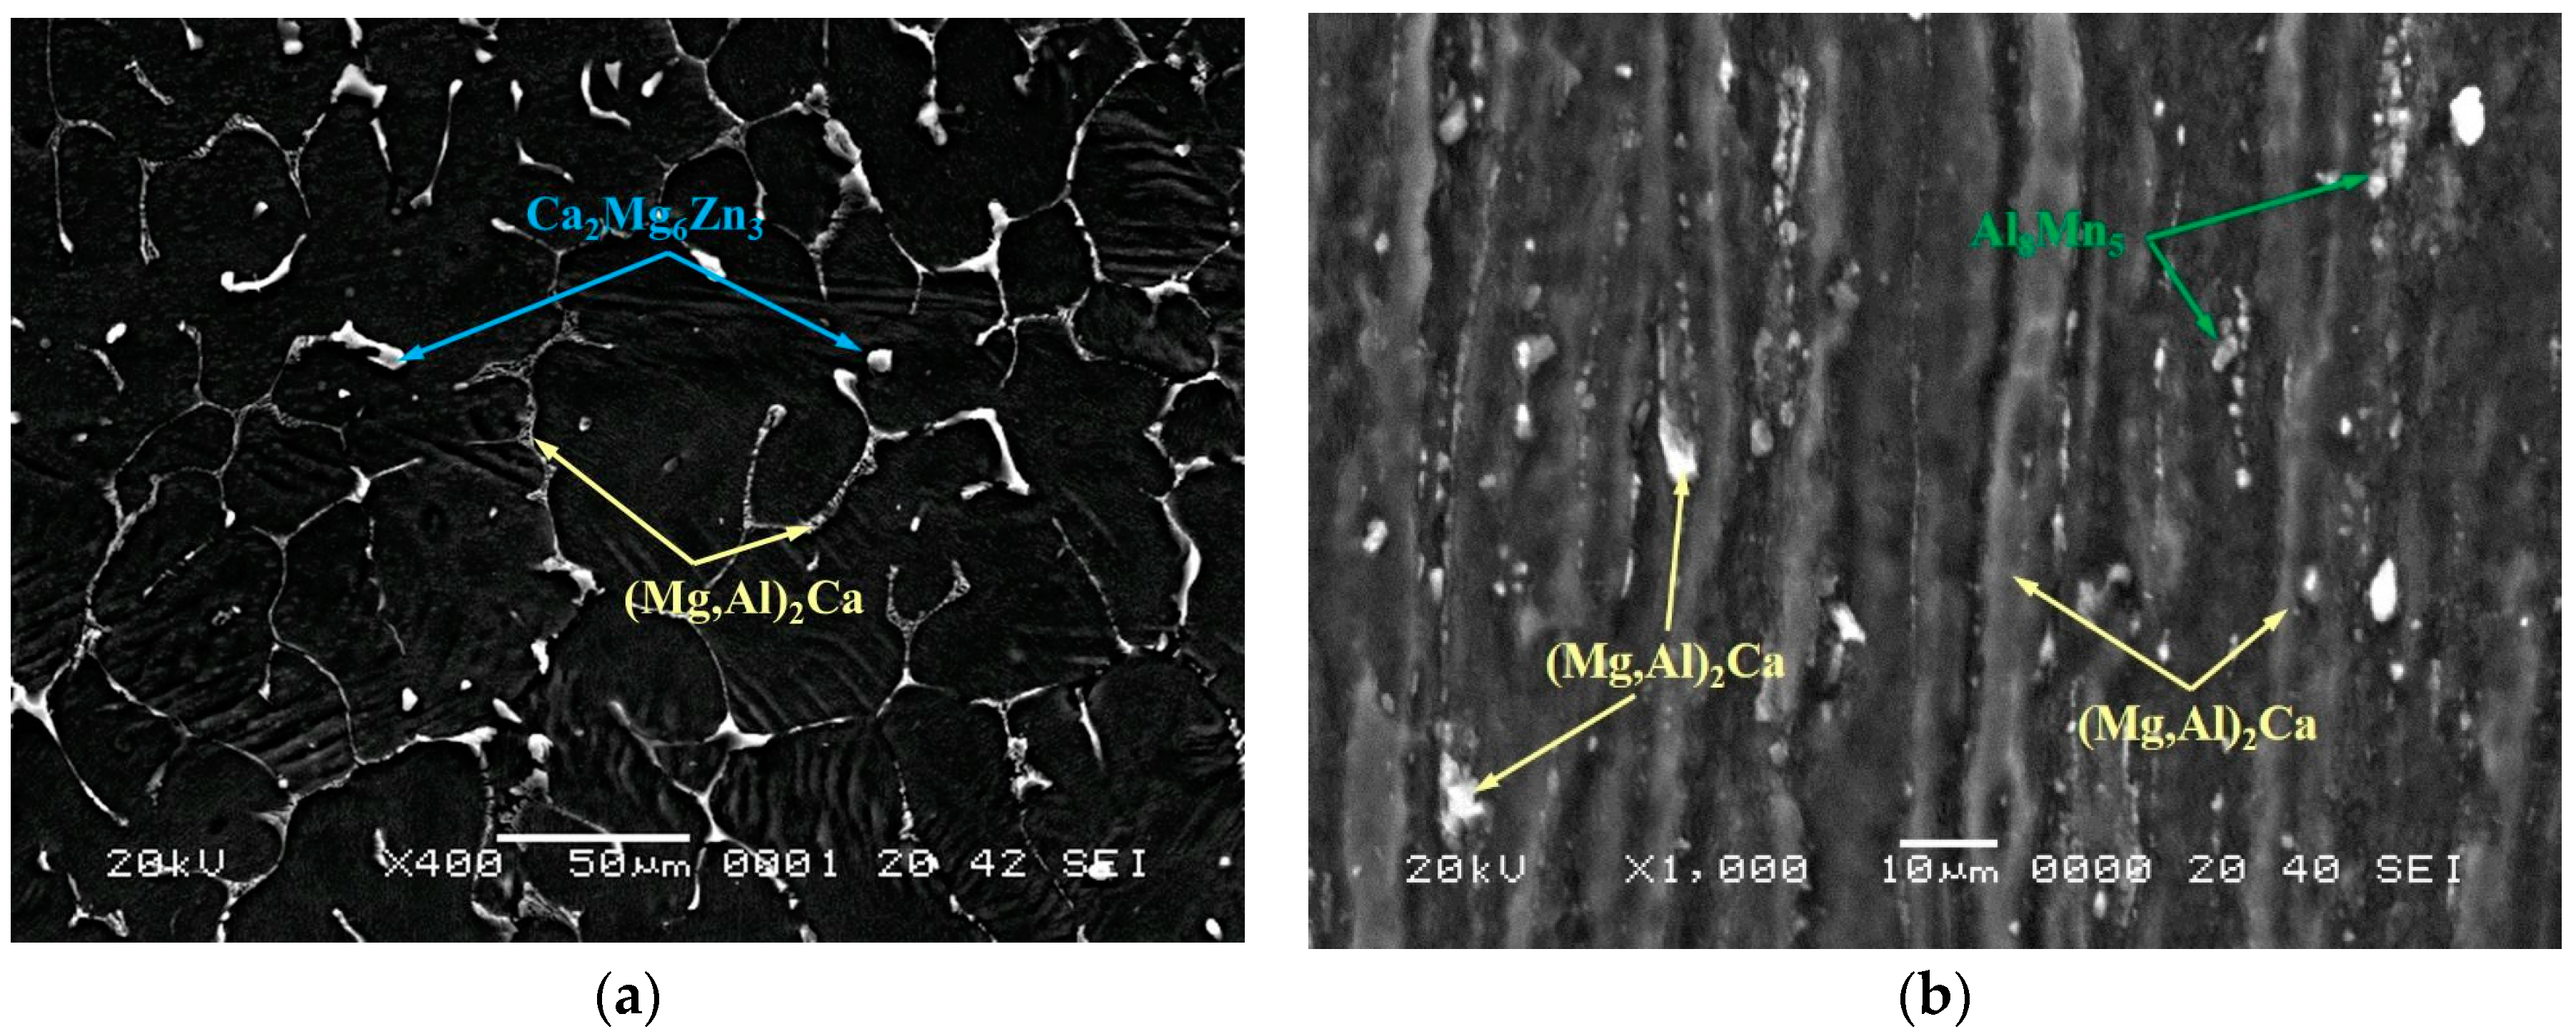
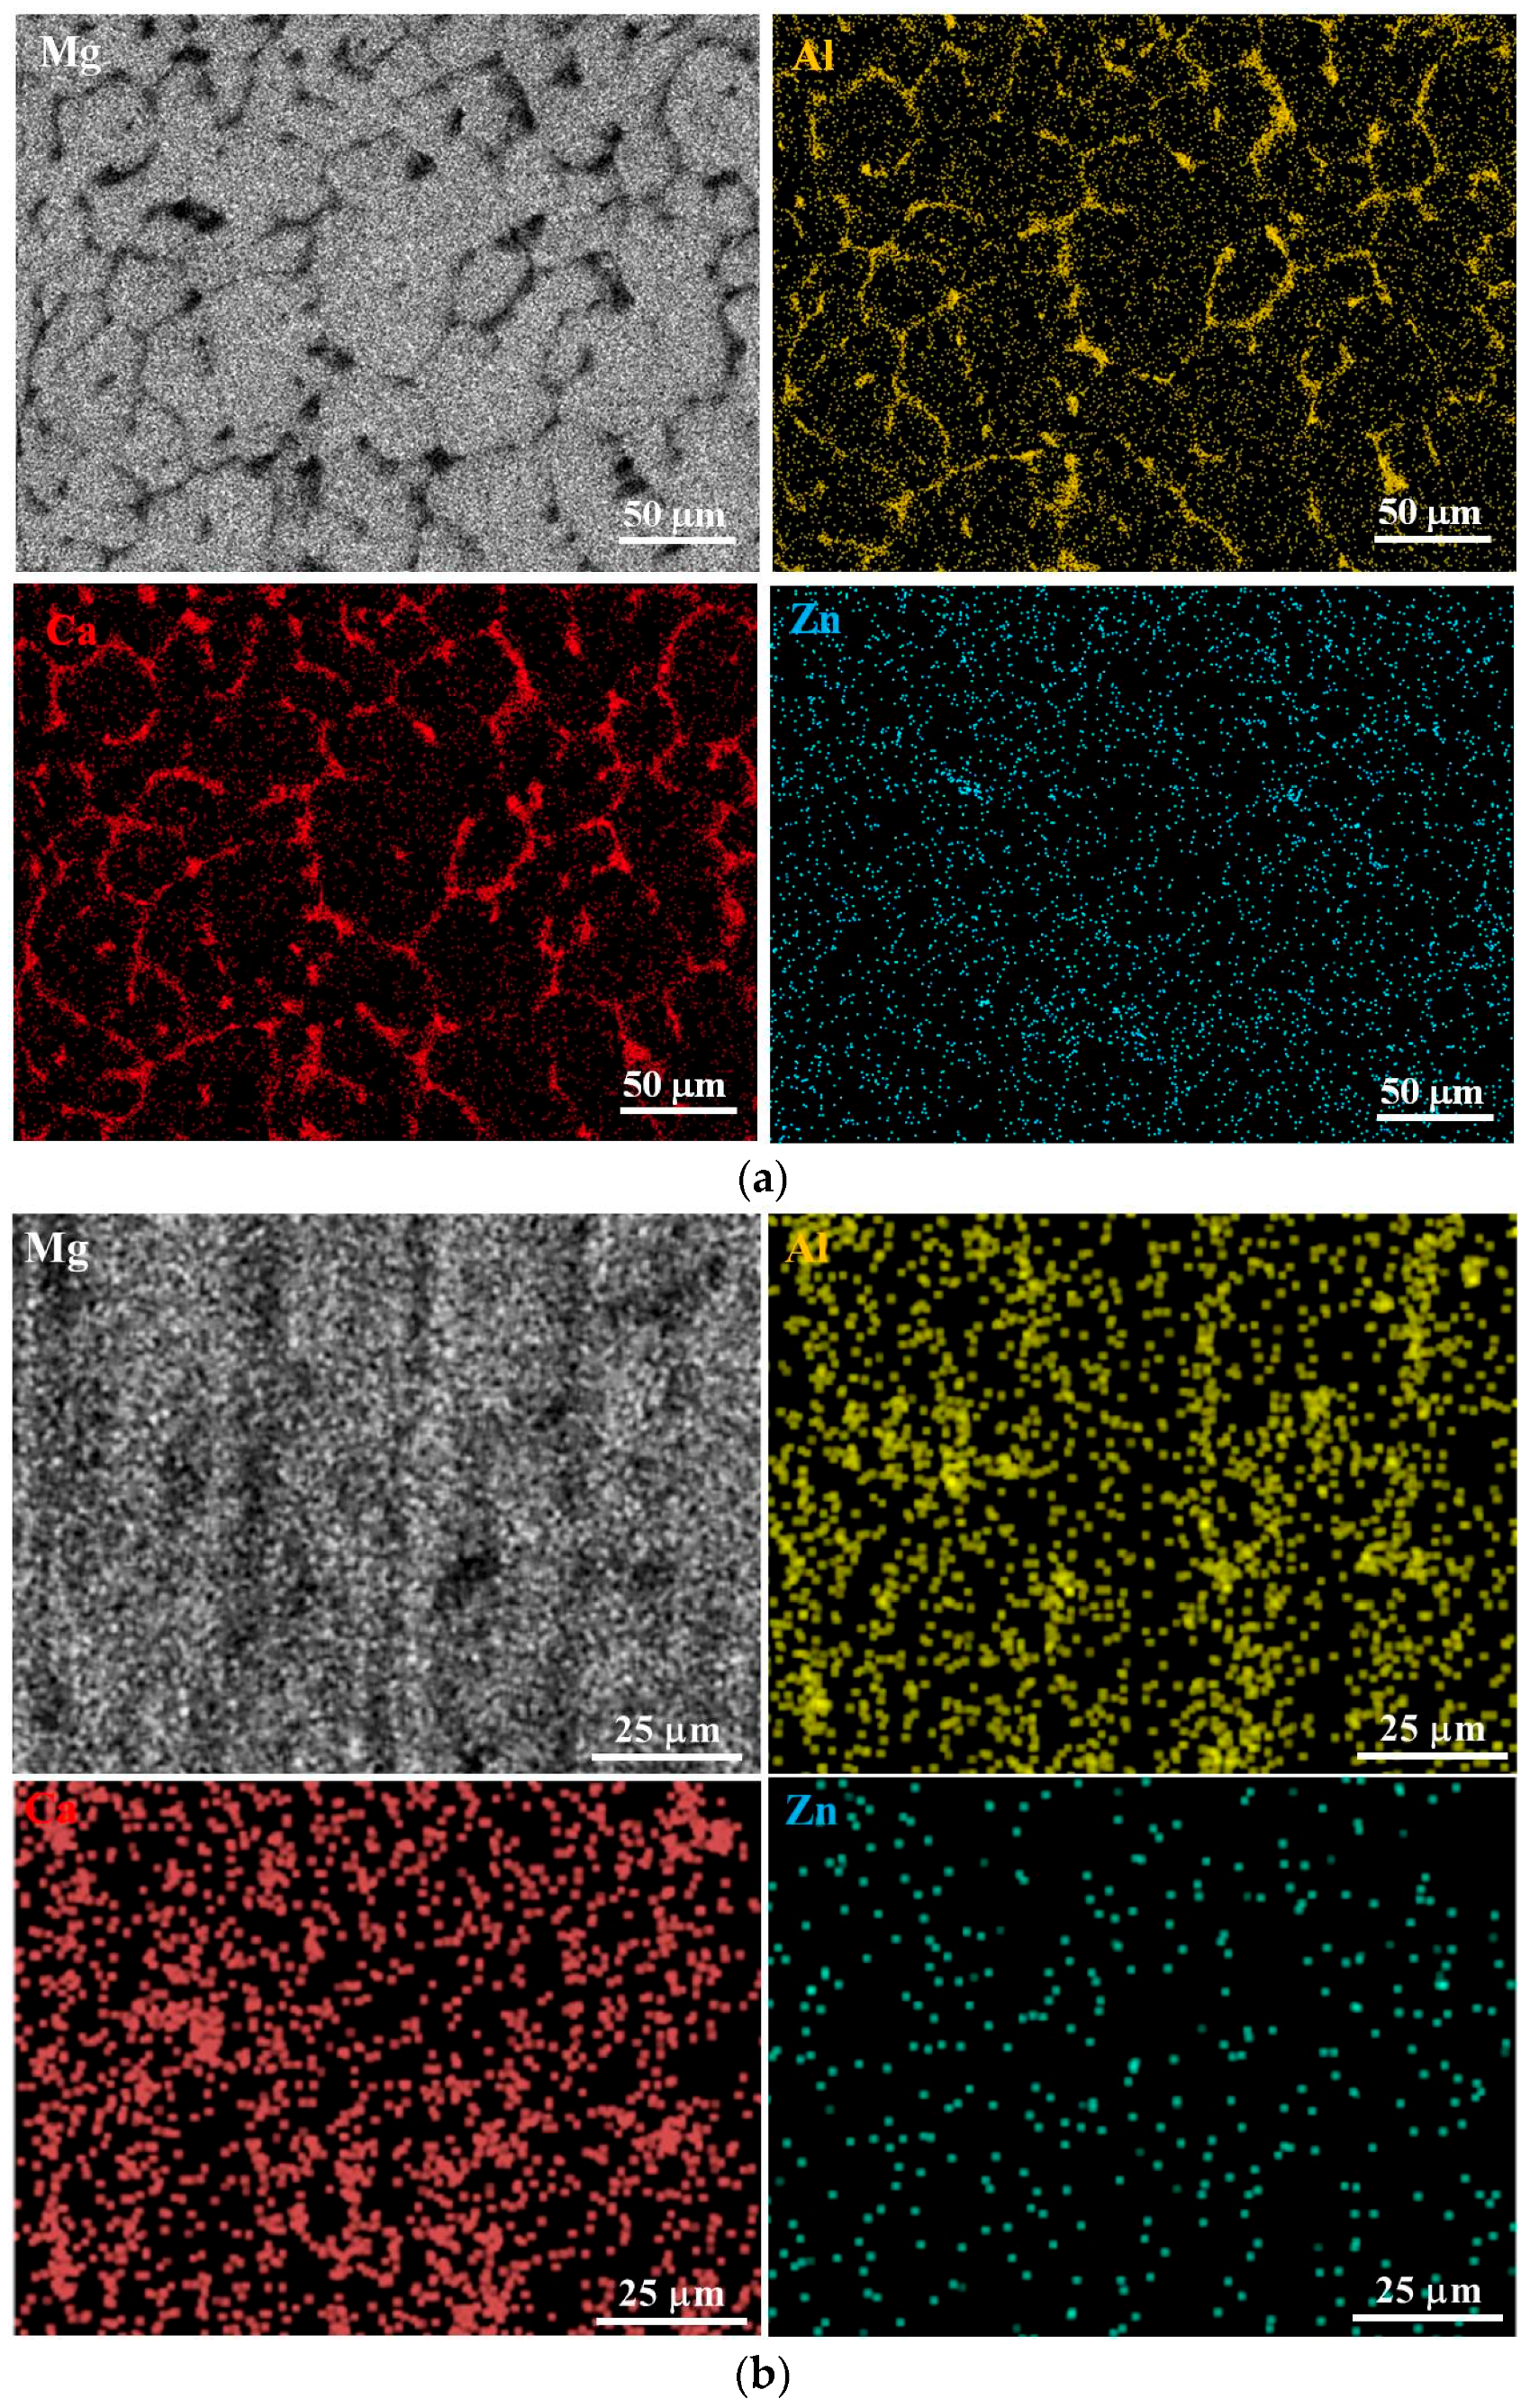
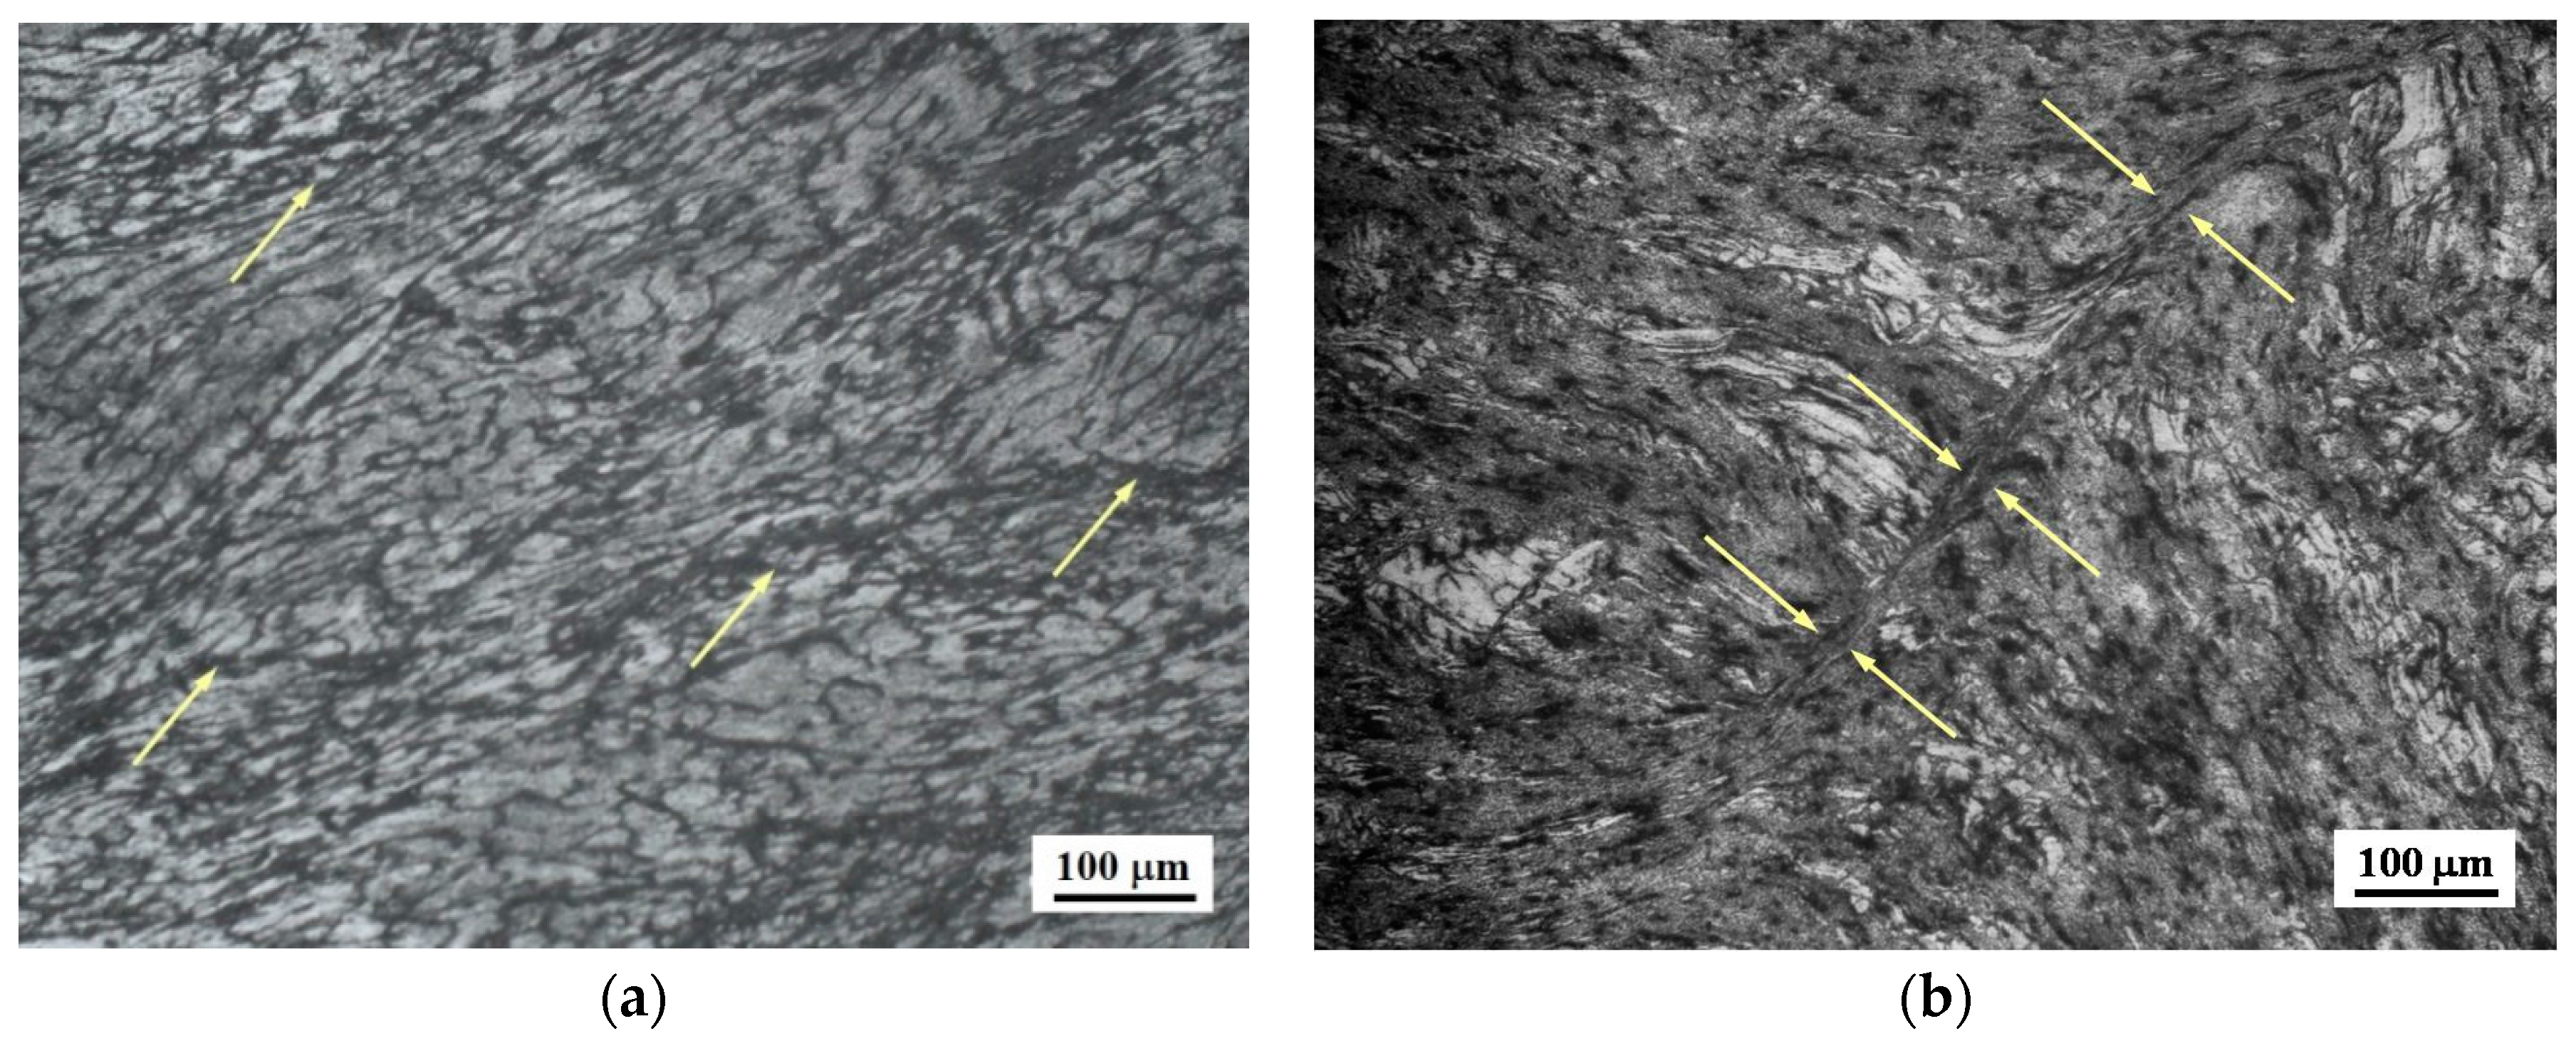
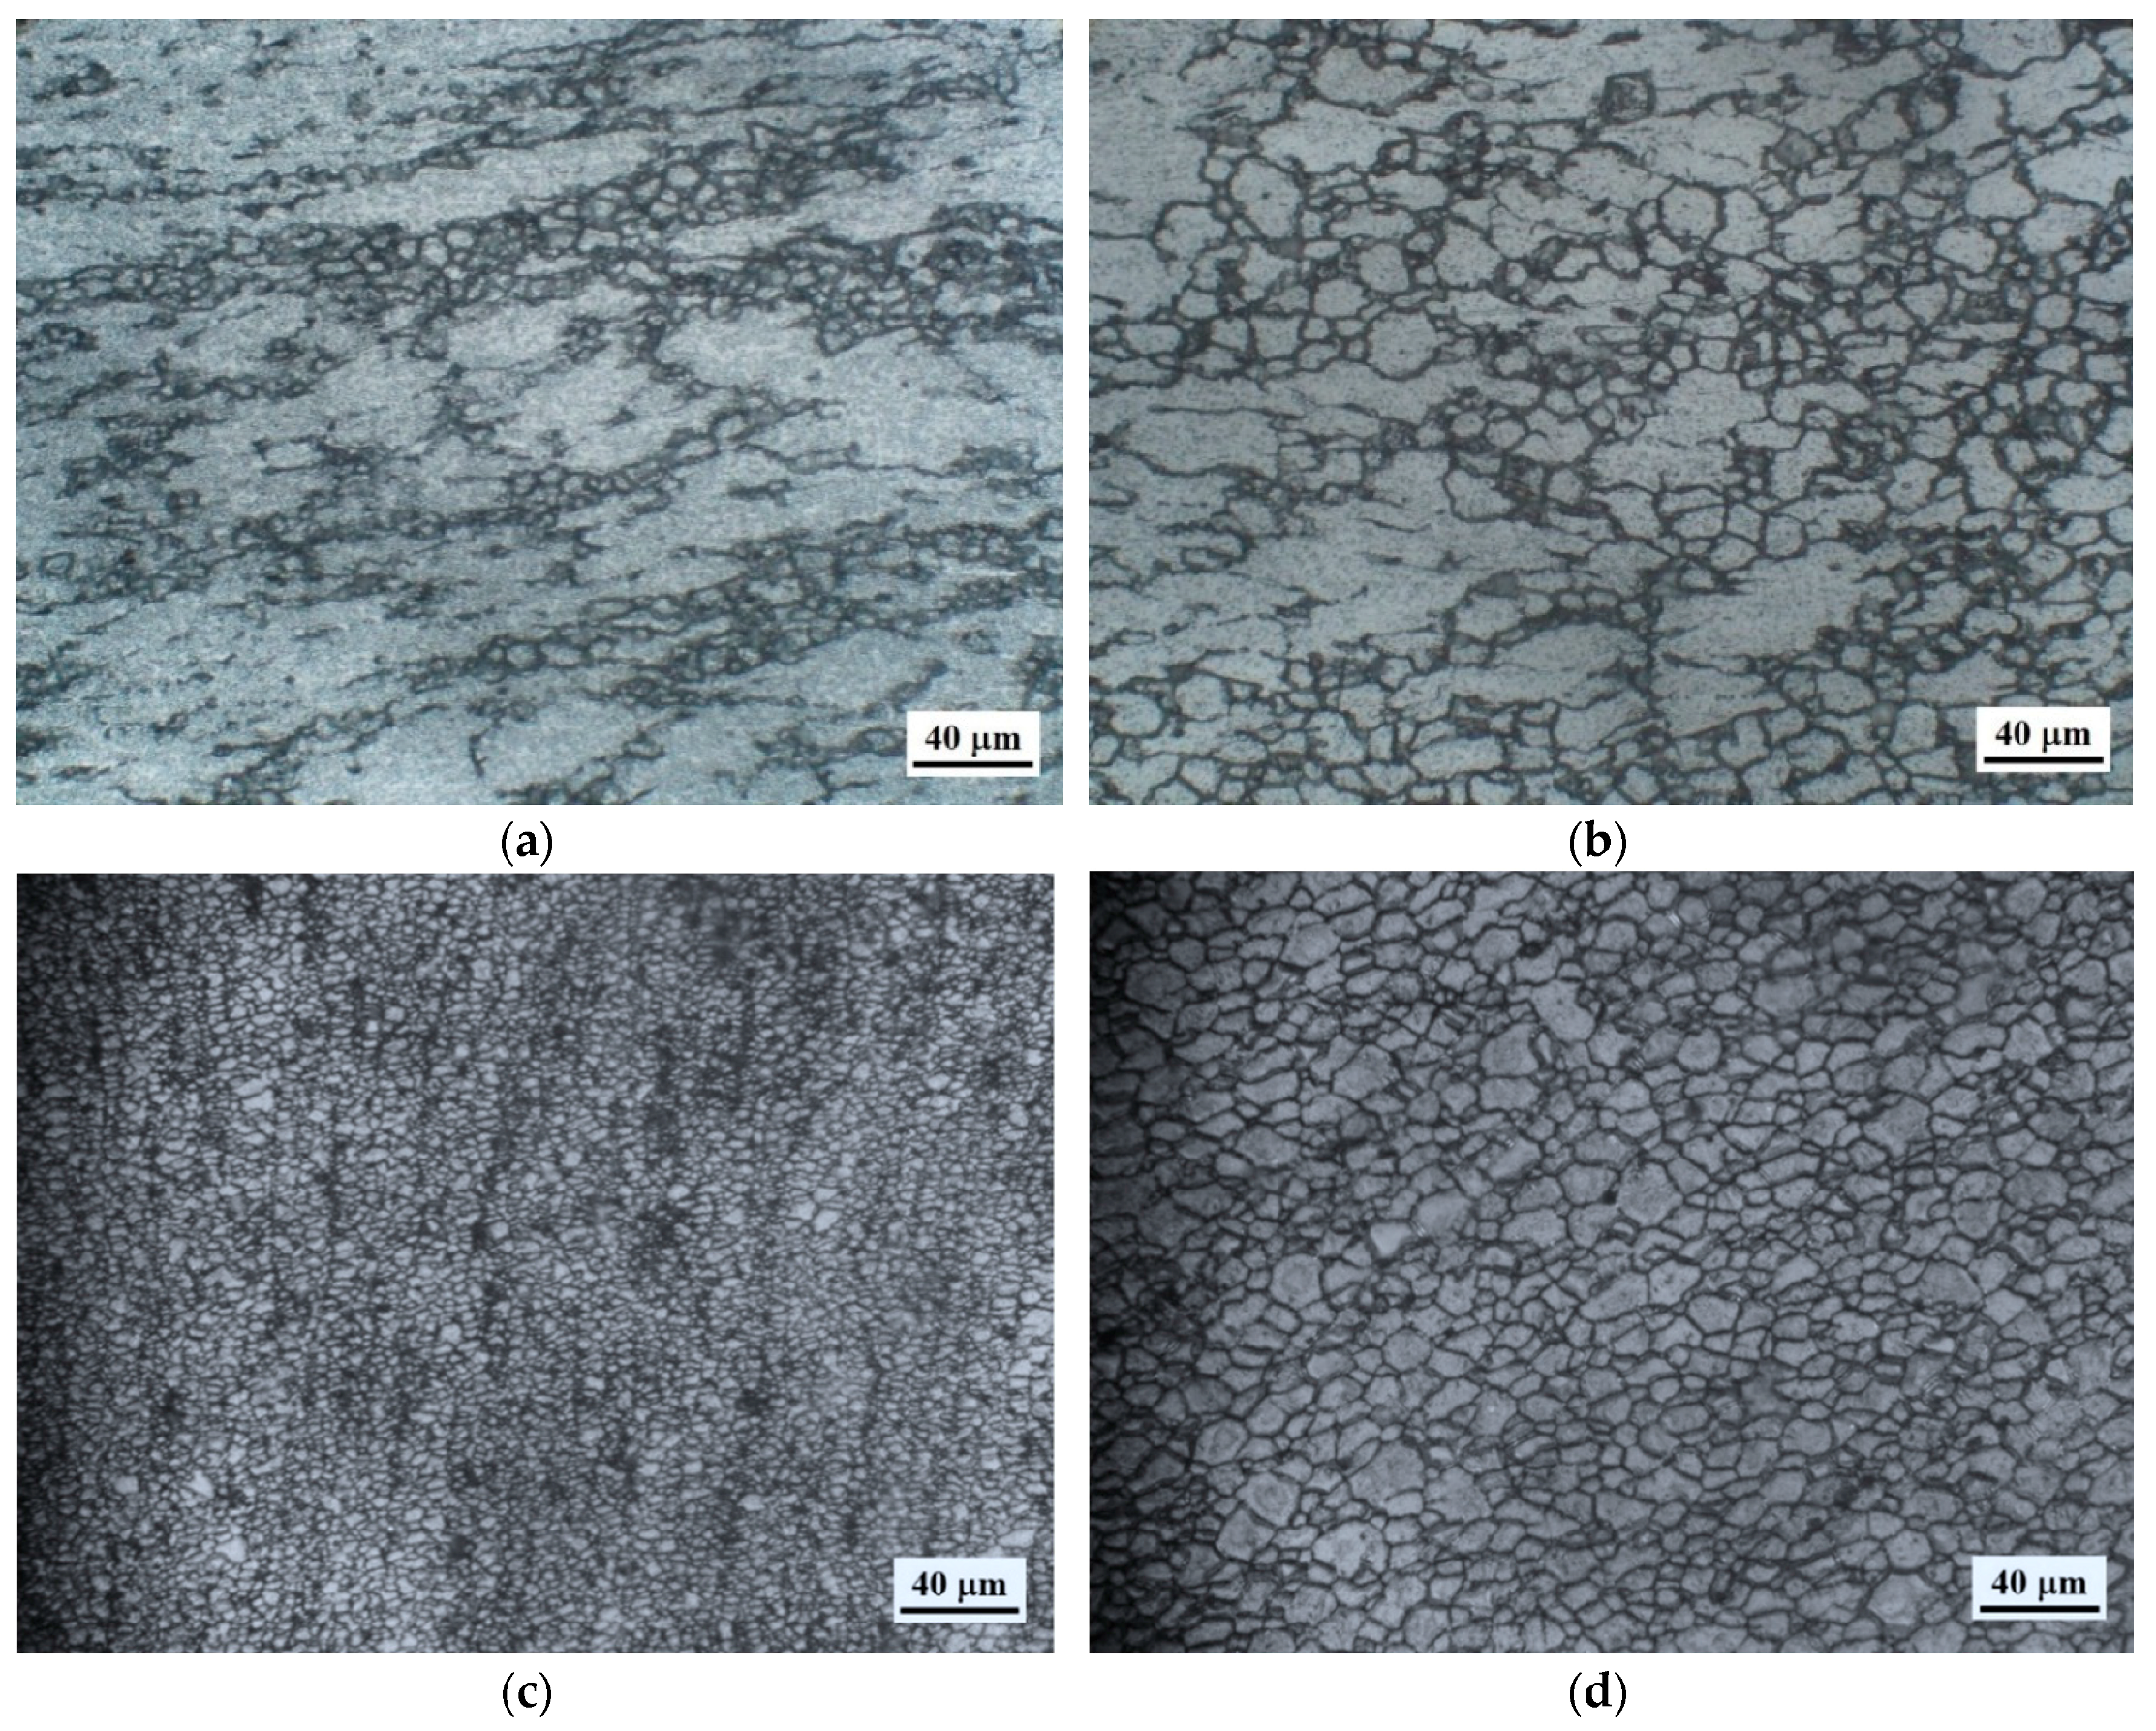
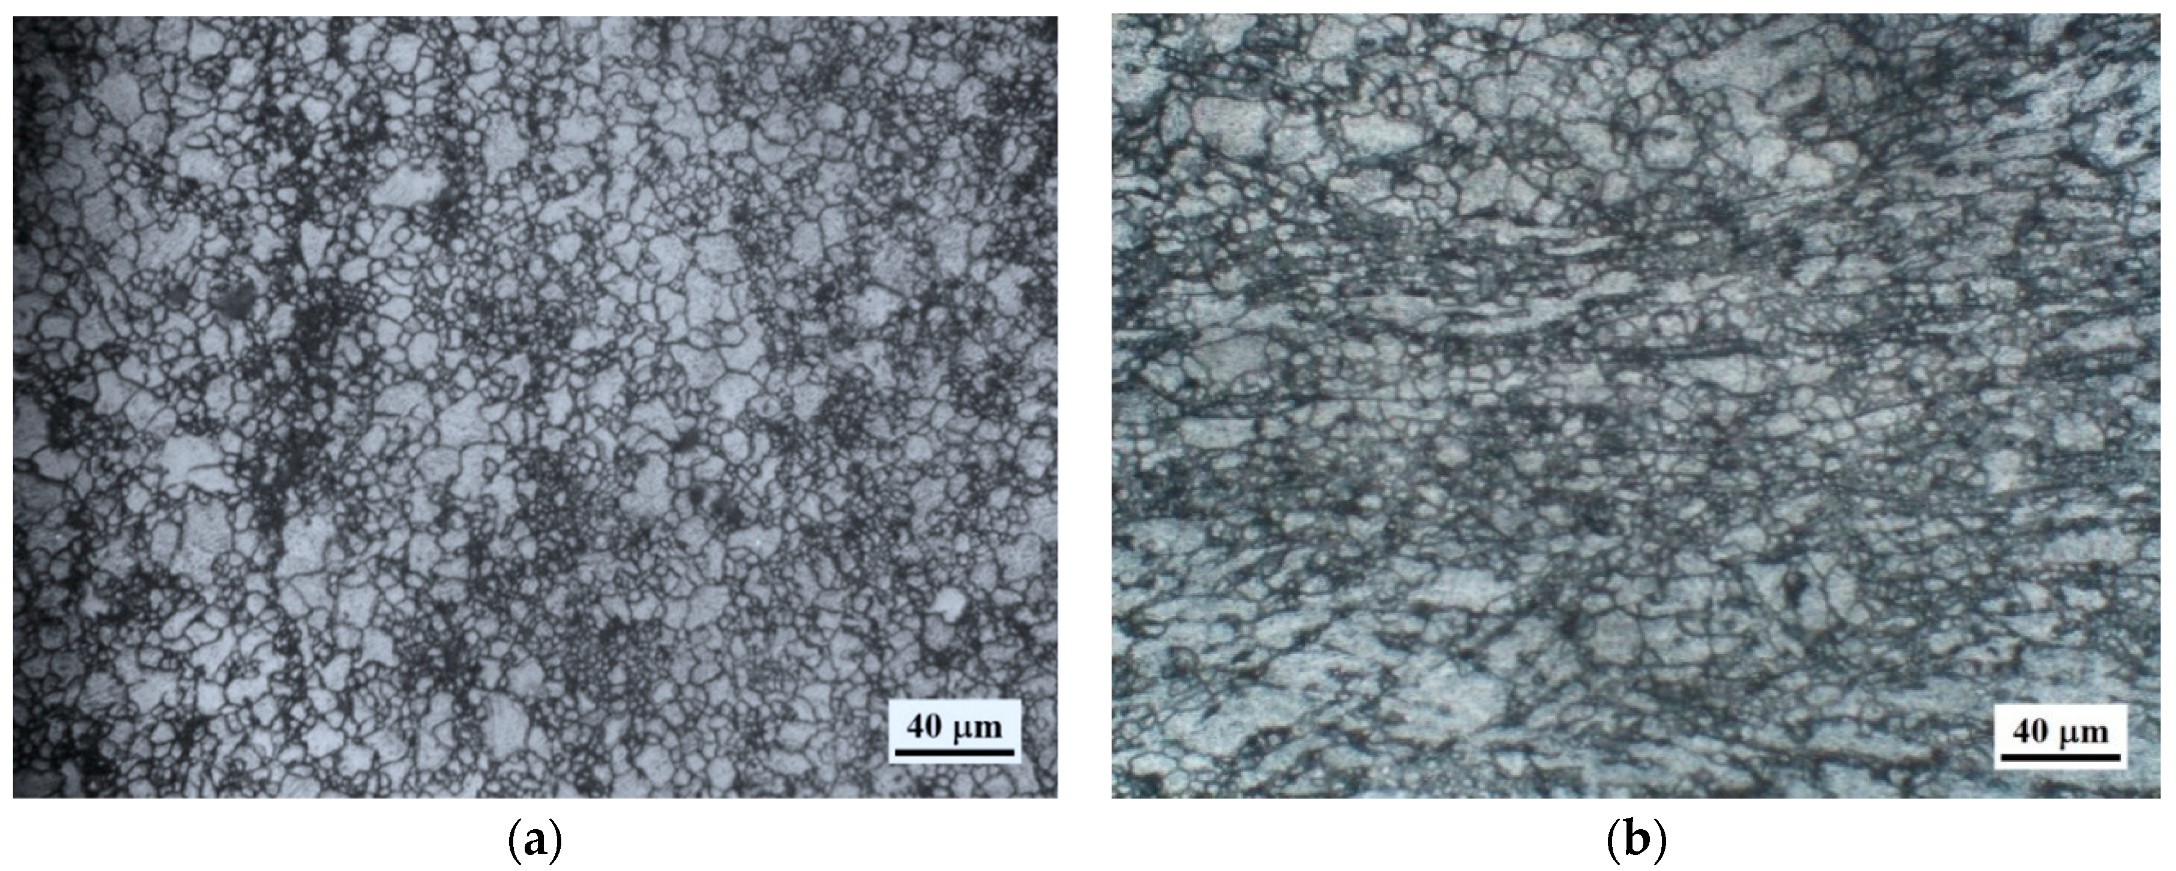
3.1. Starting Microstructures
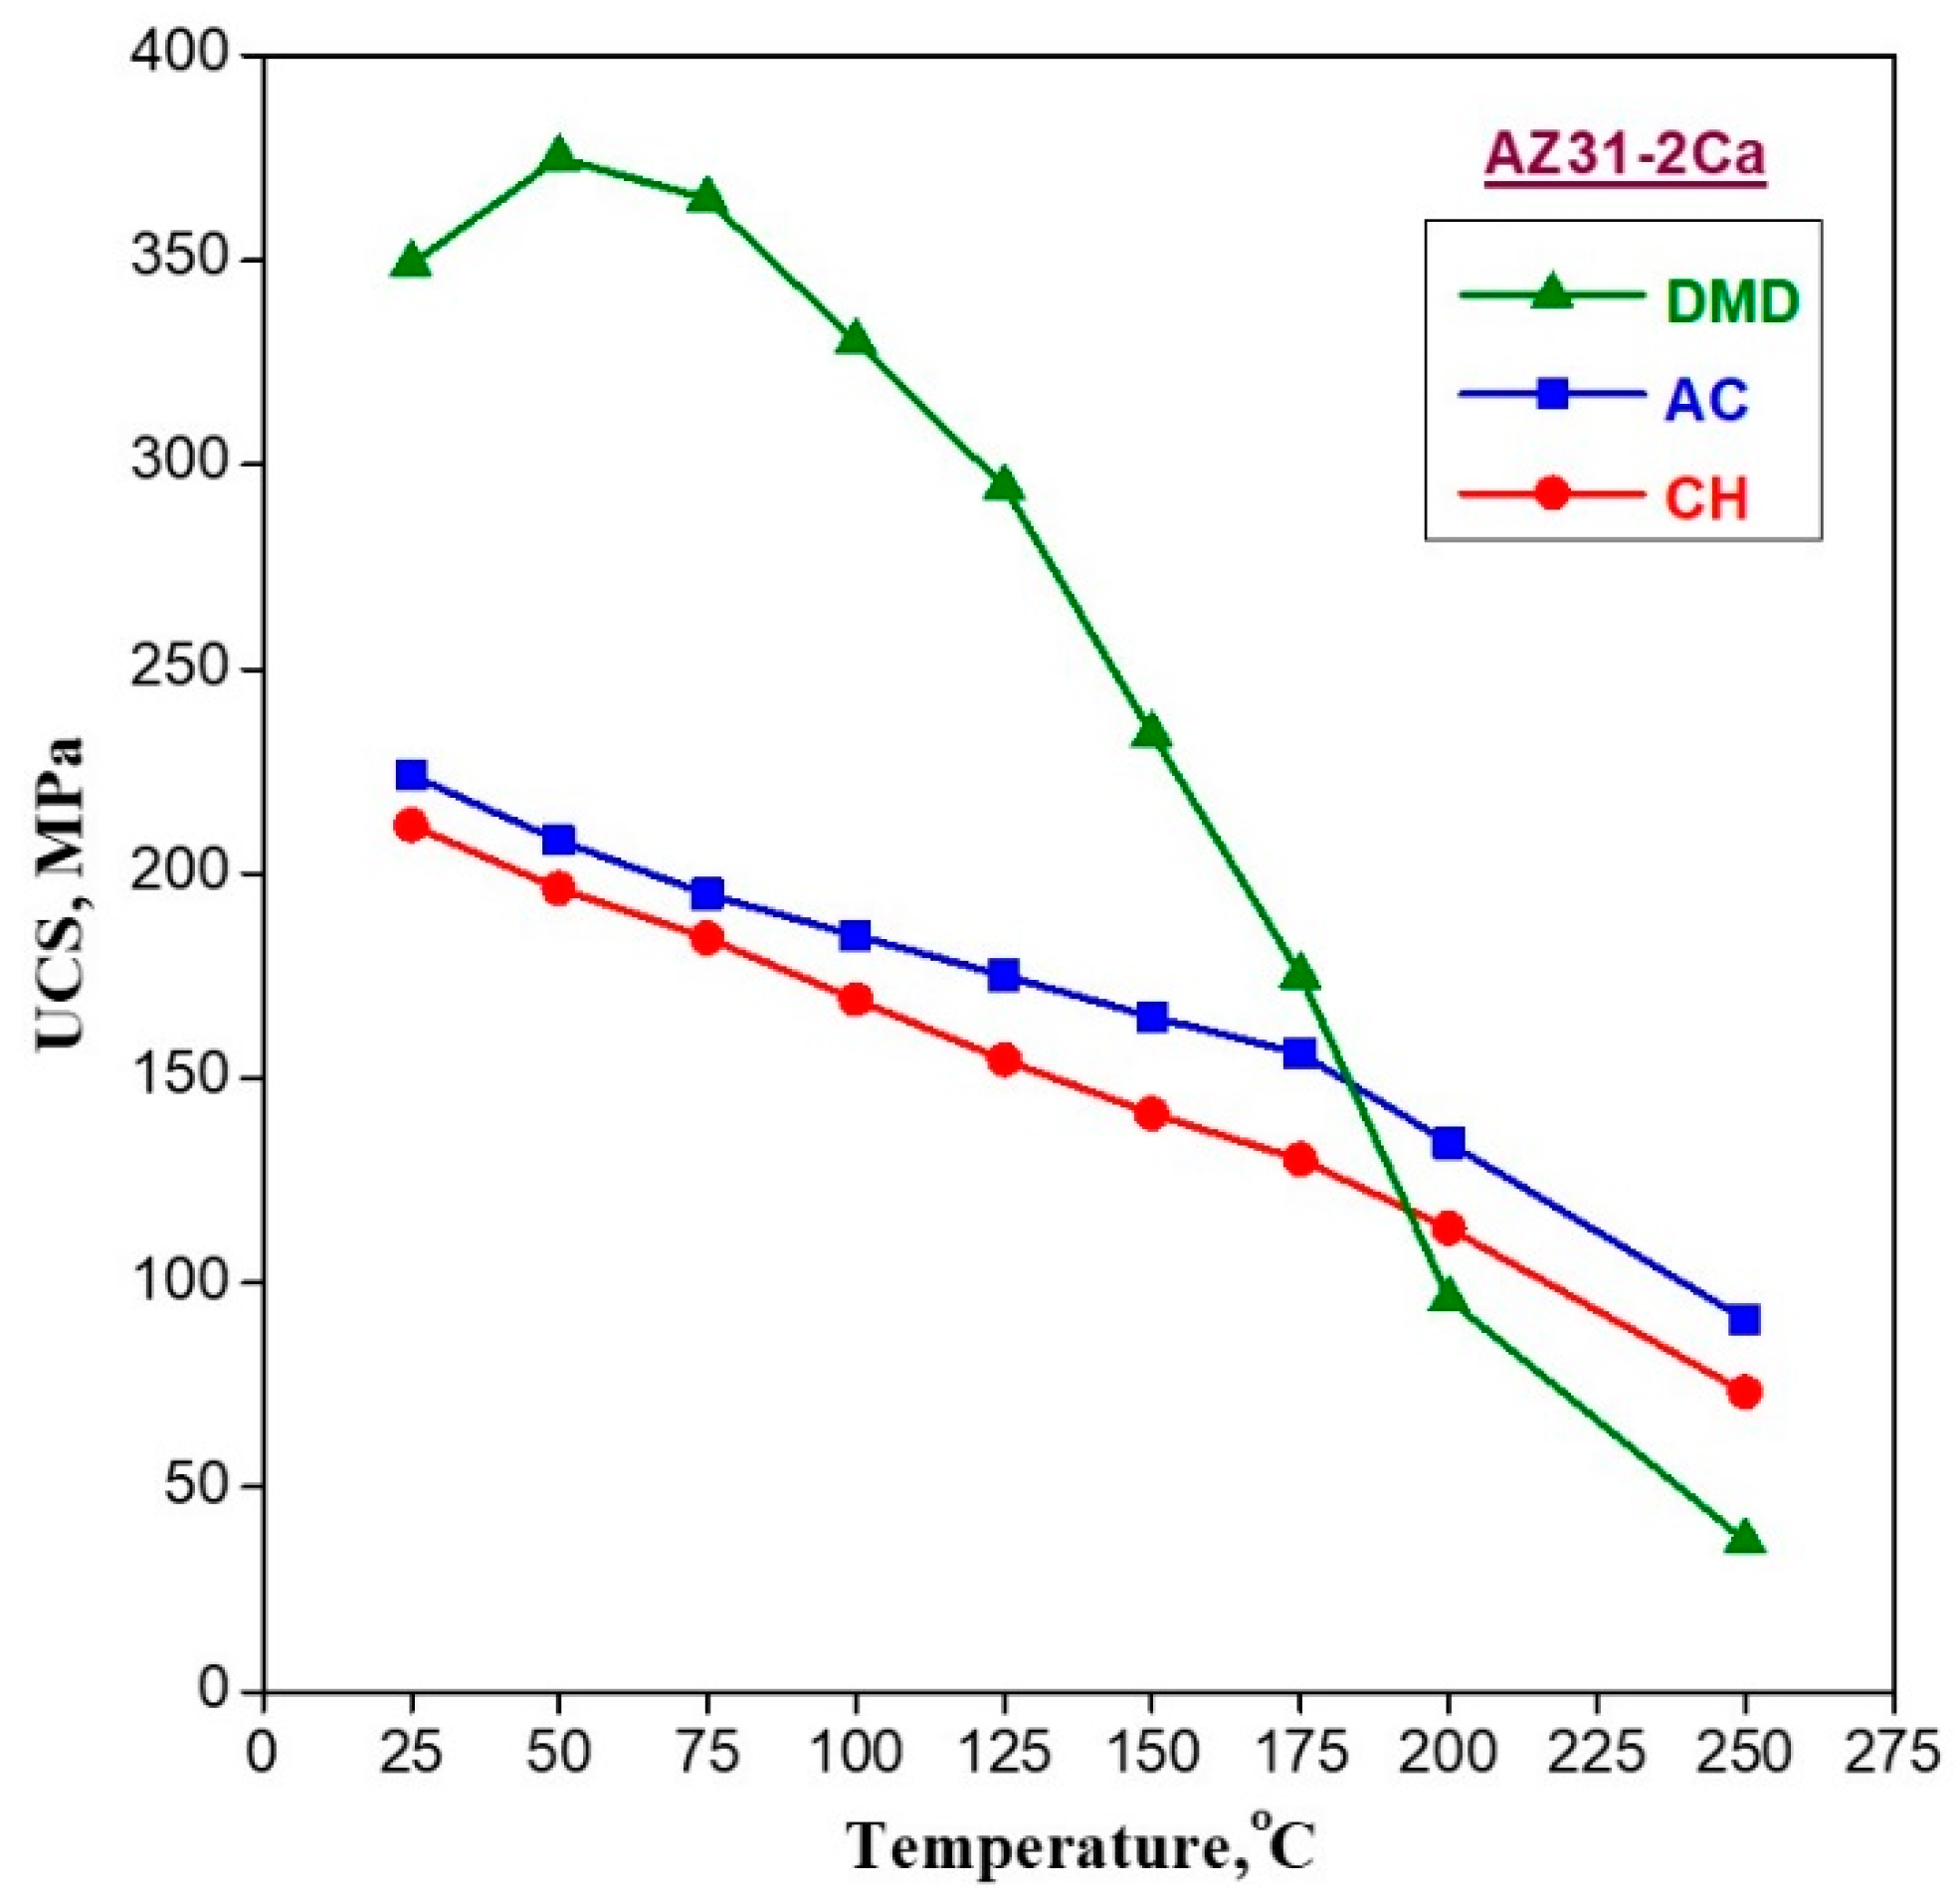
3.2. Ultimate Compressive Strength
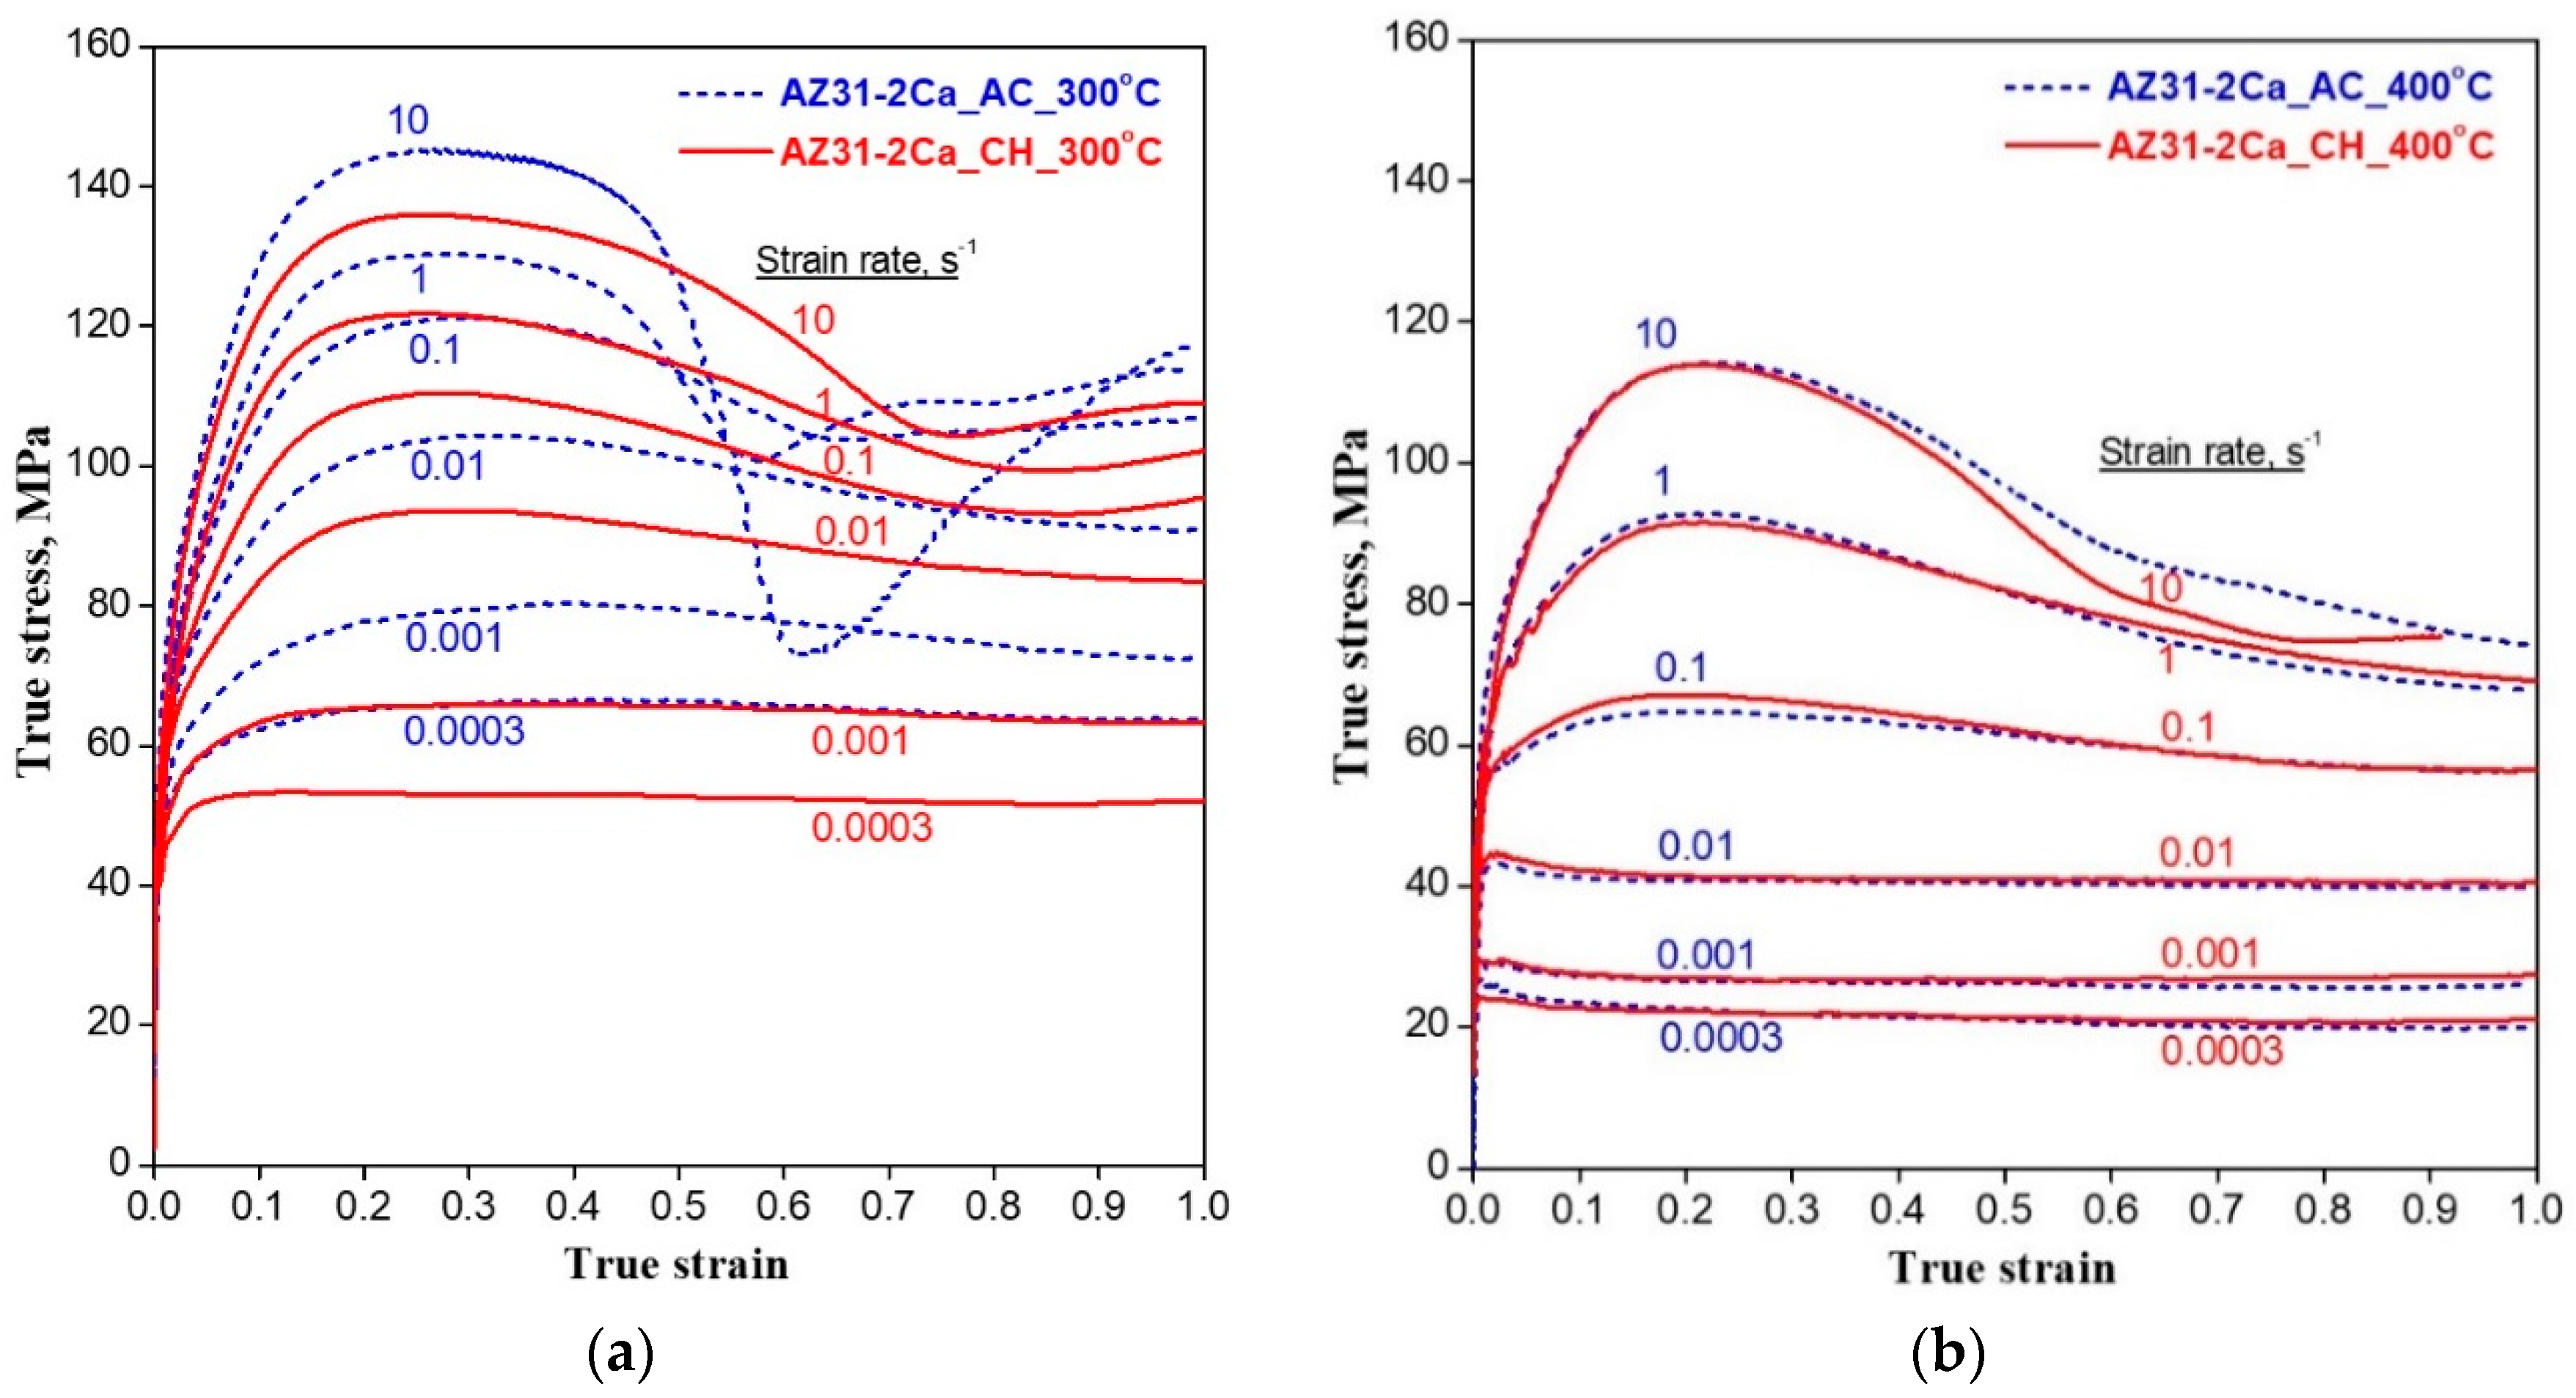
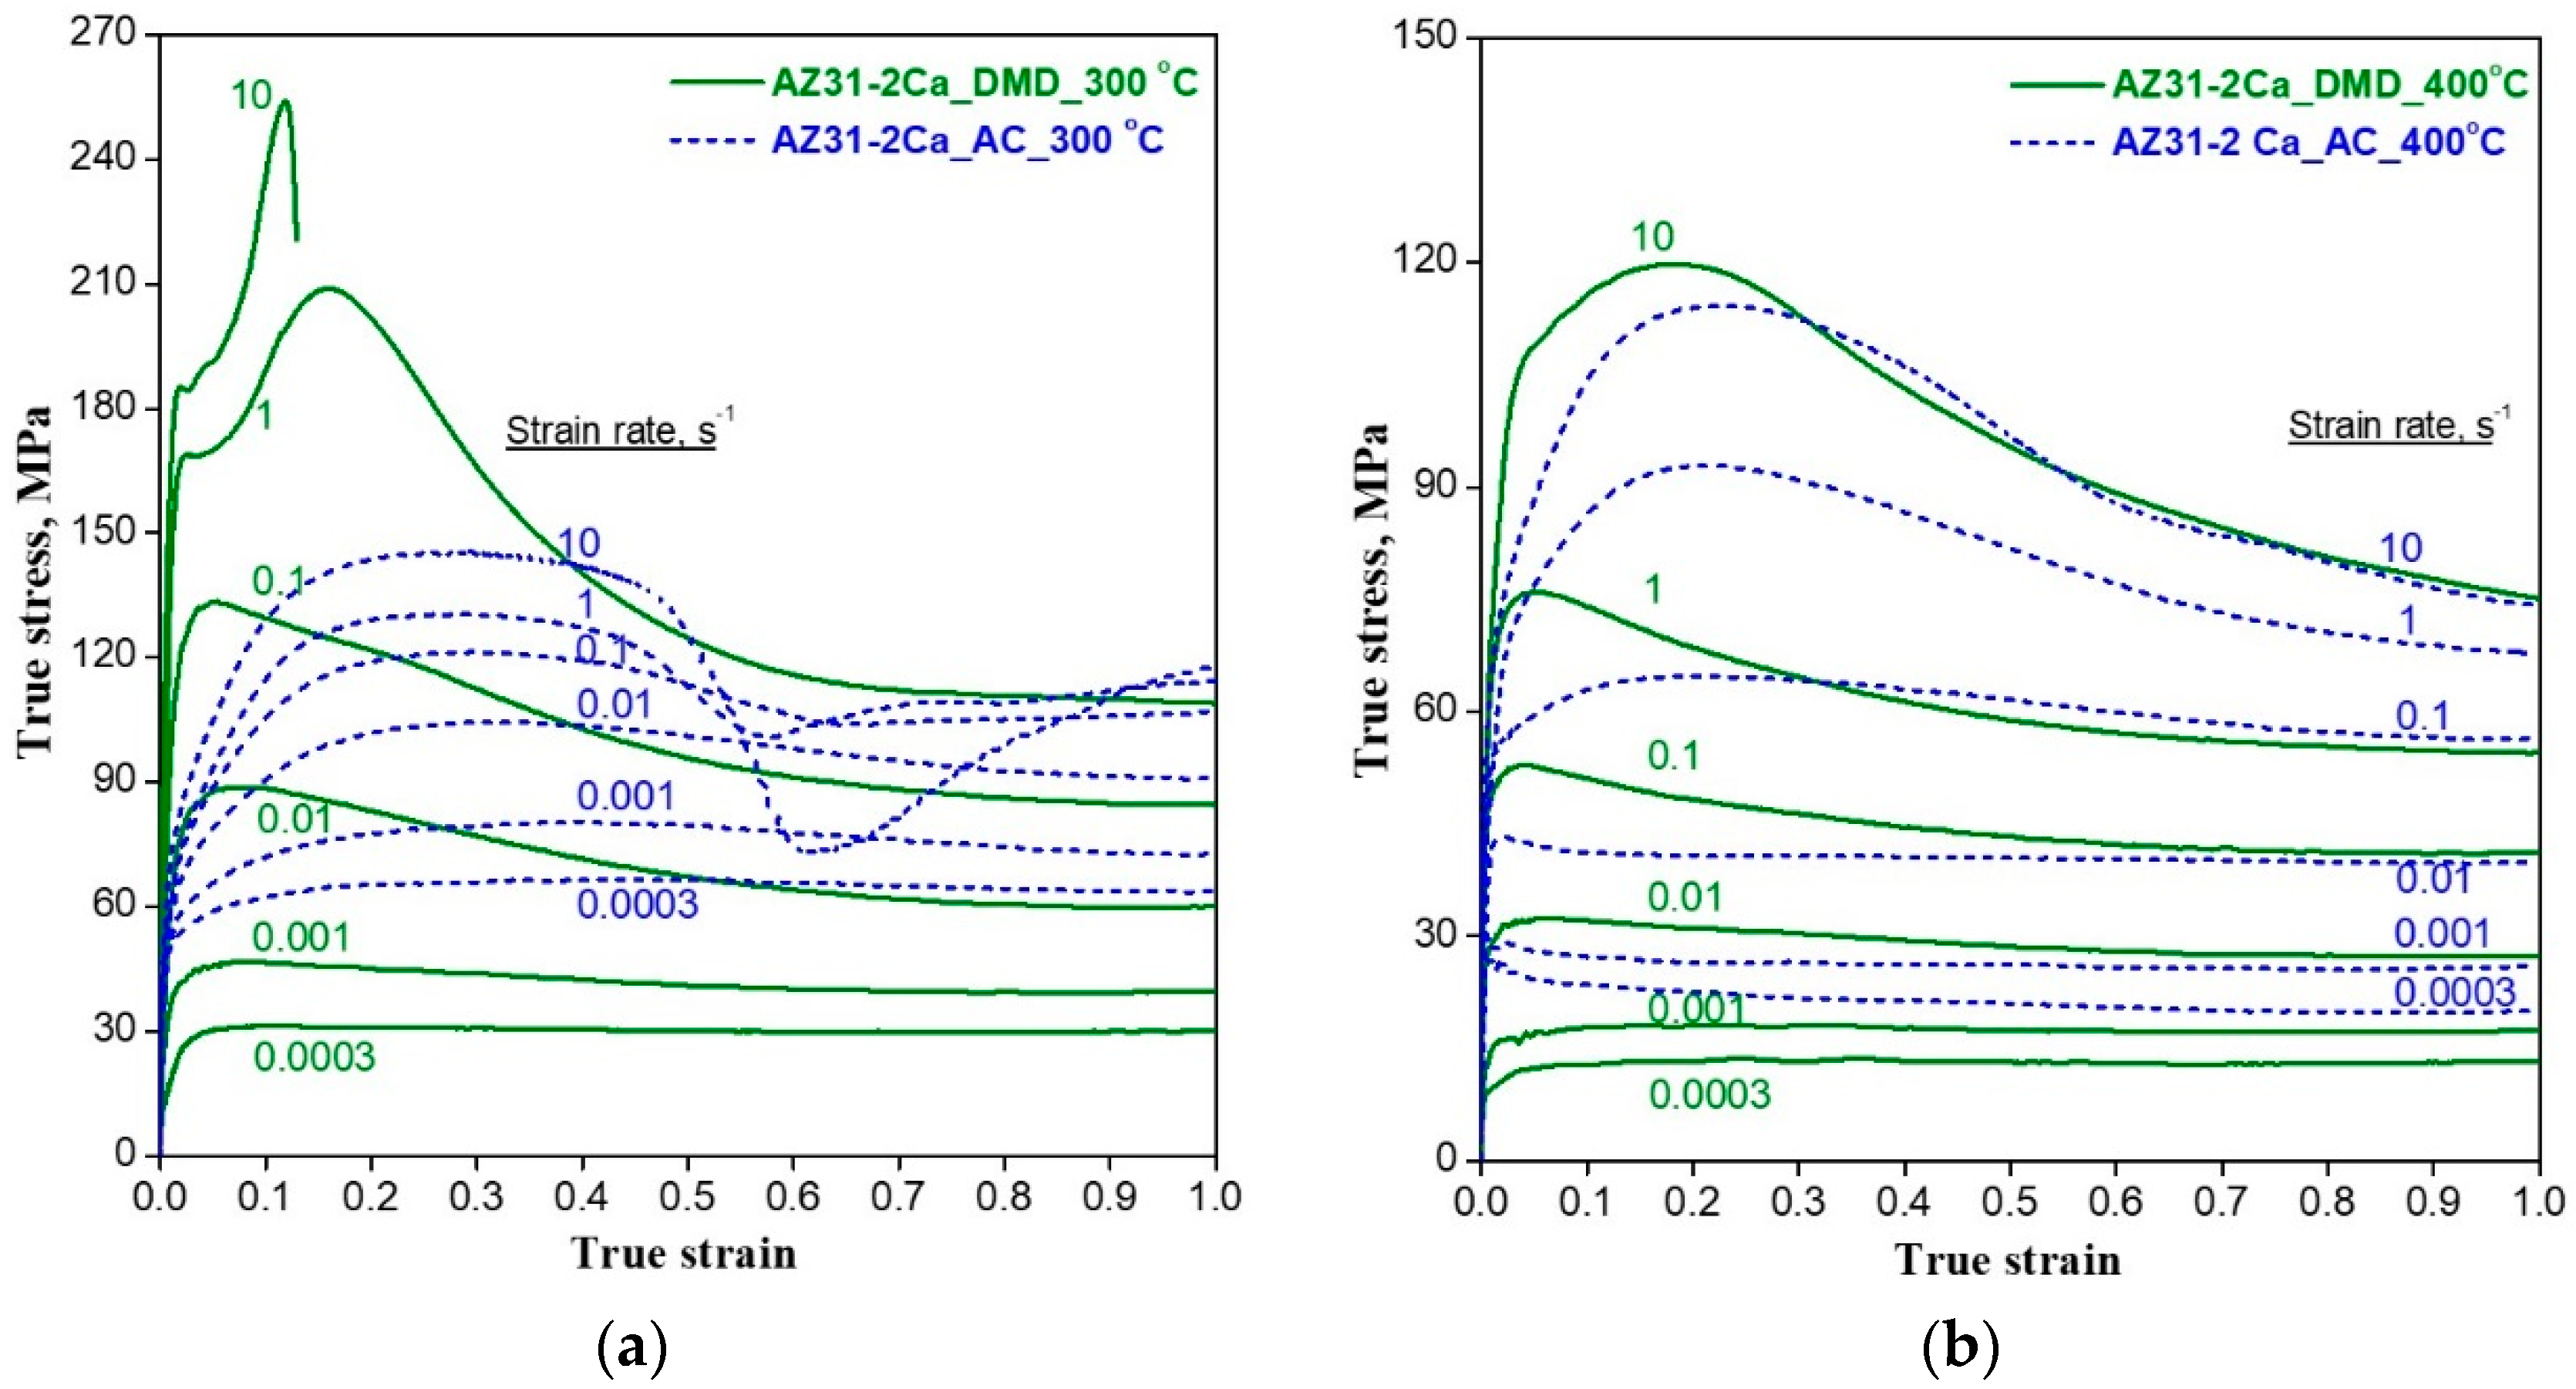
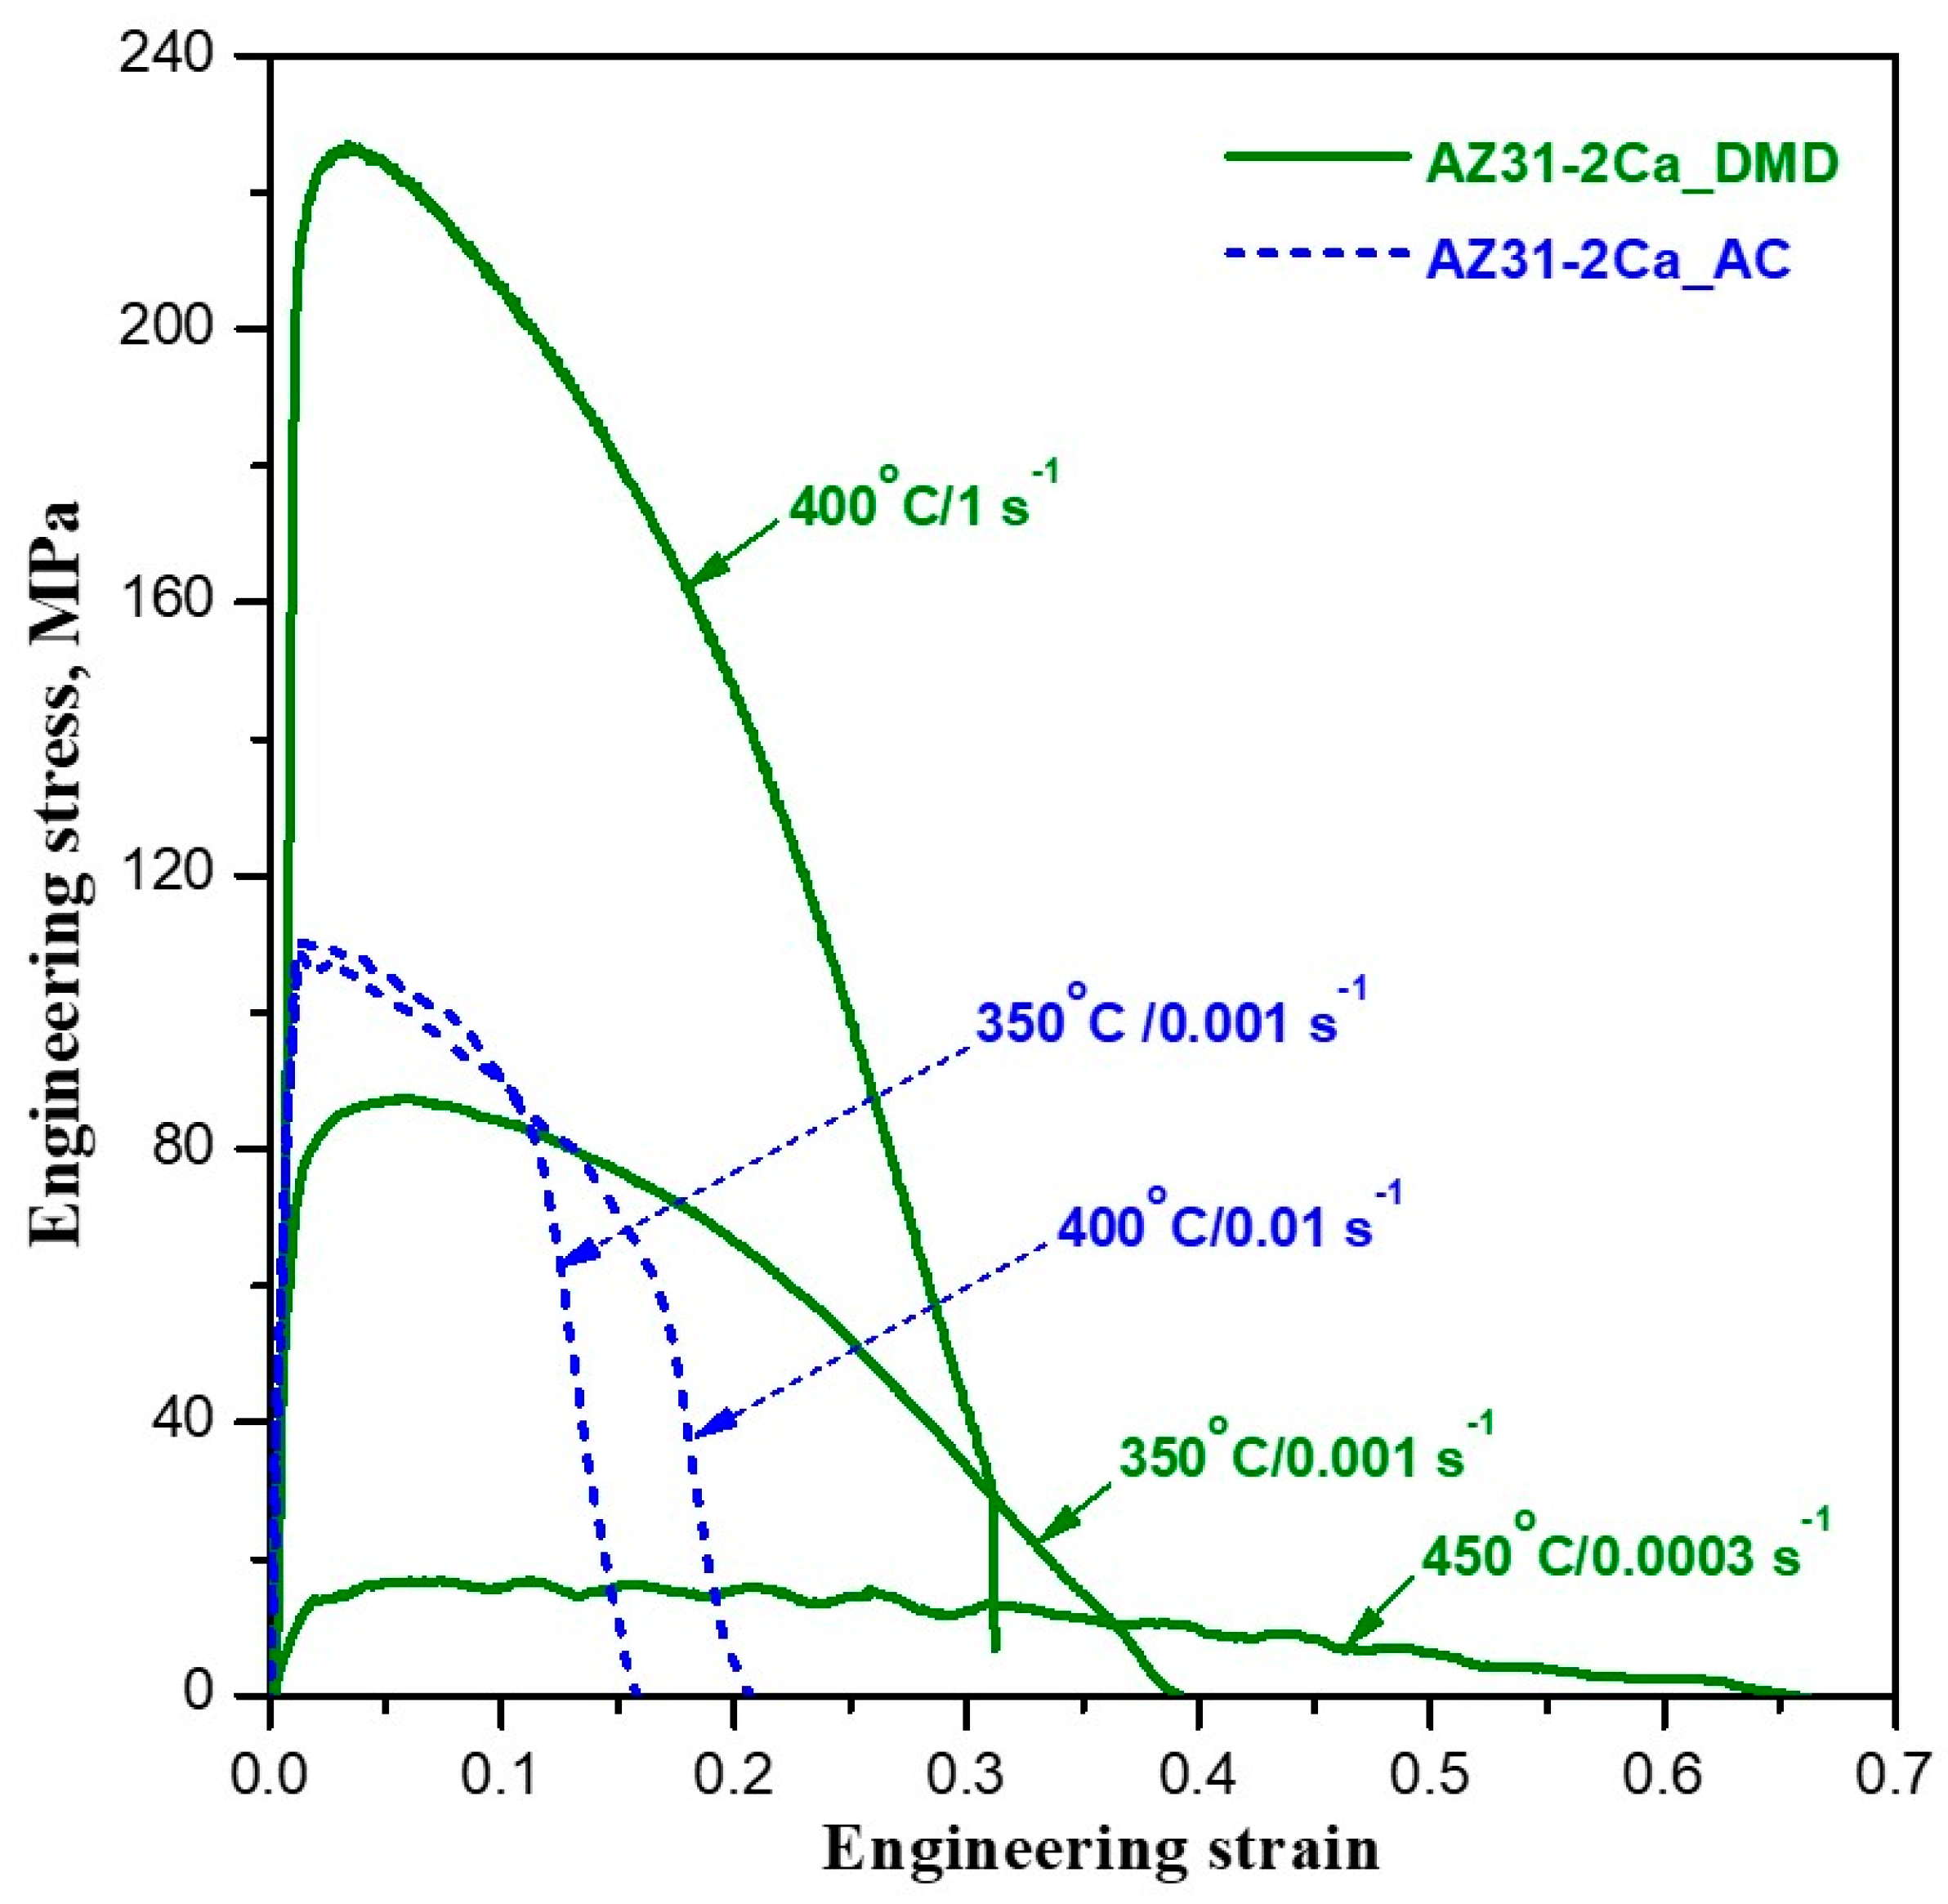
3.3. Stress-Strain Behaviour
3.4. Processing Maps
3.4.1. AC and CH Specimens
- (1)
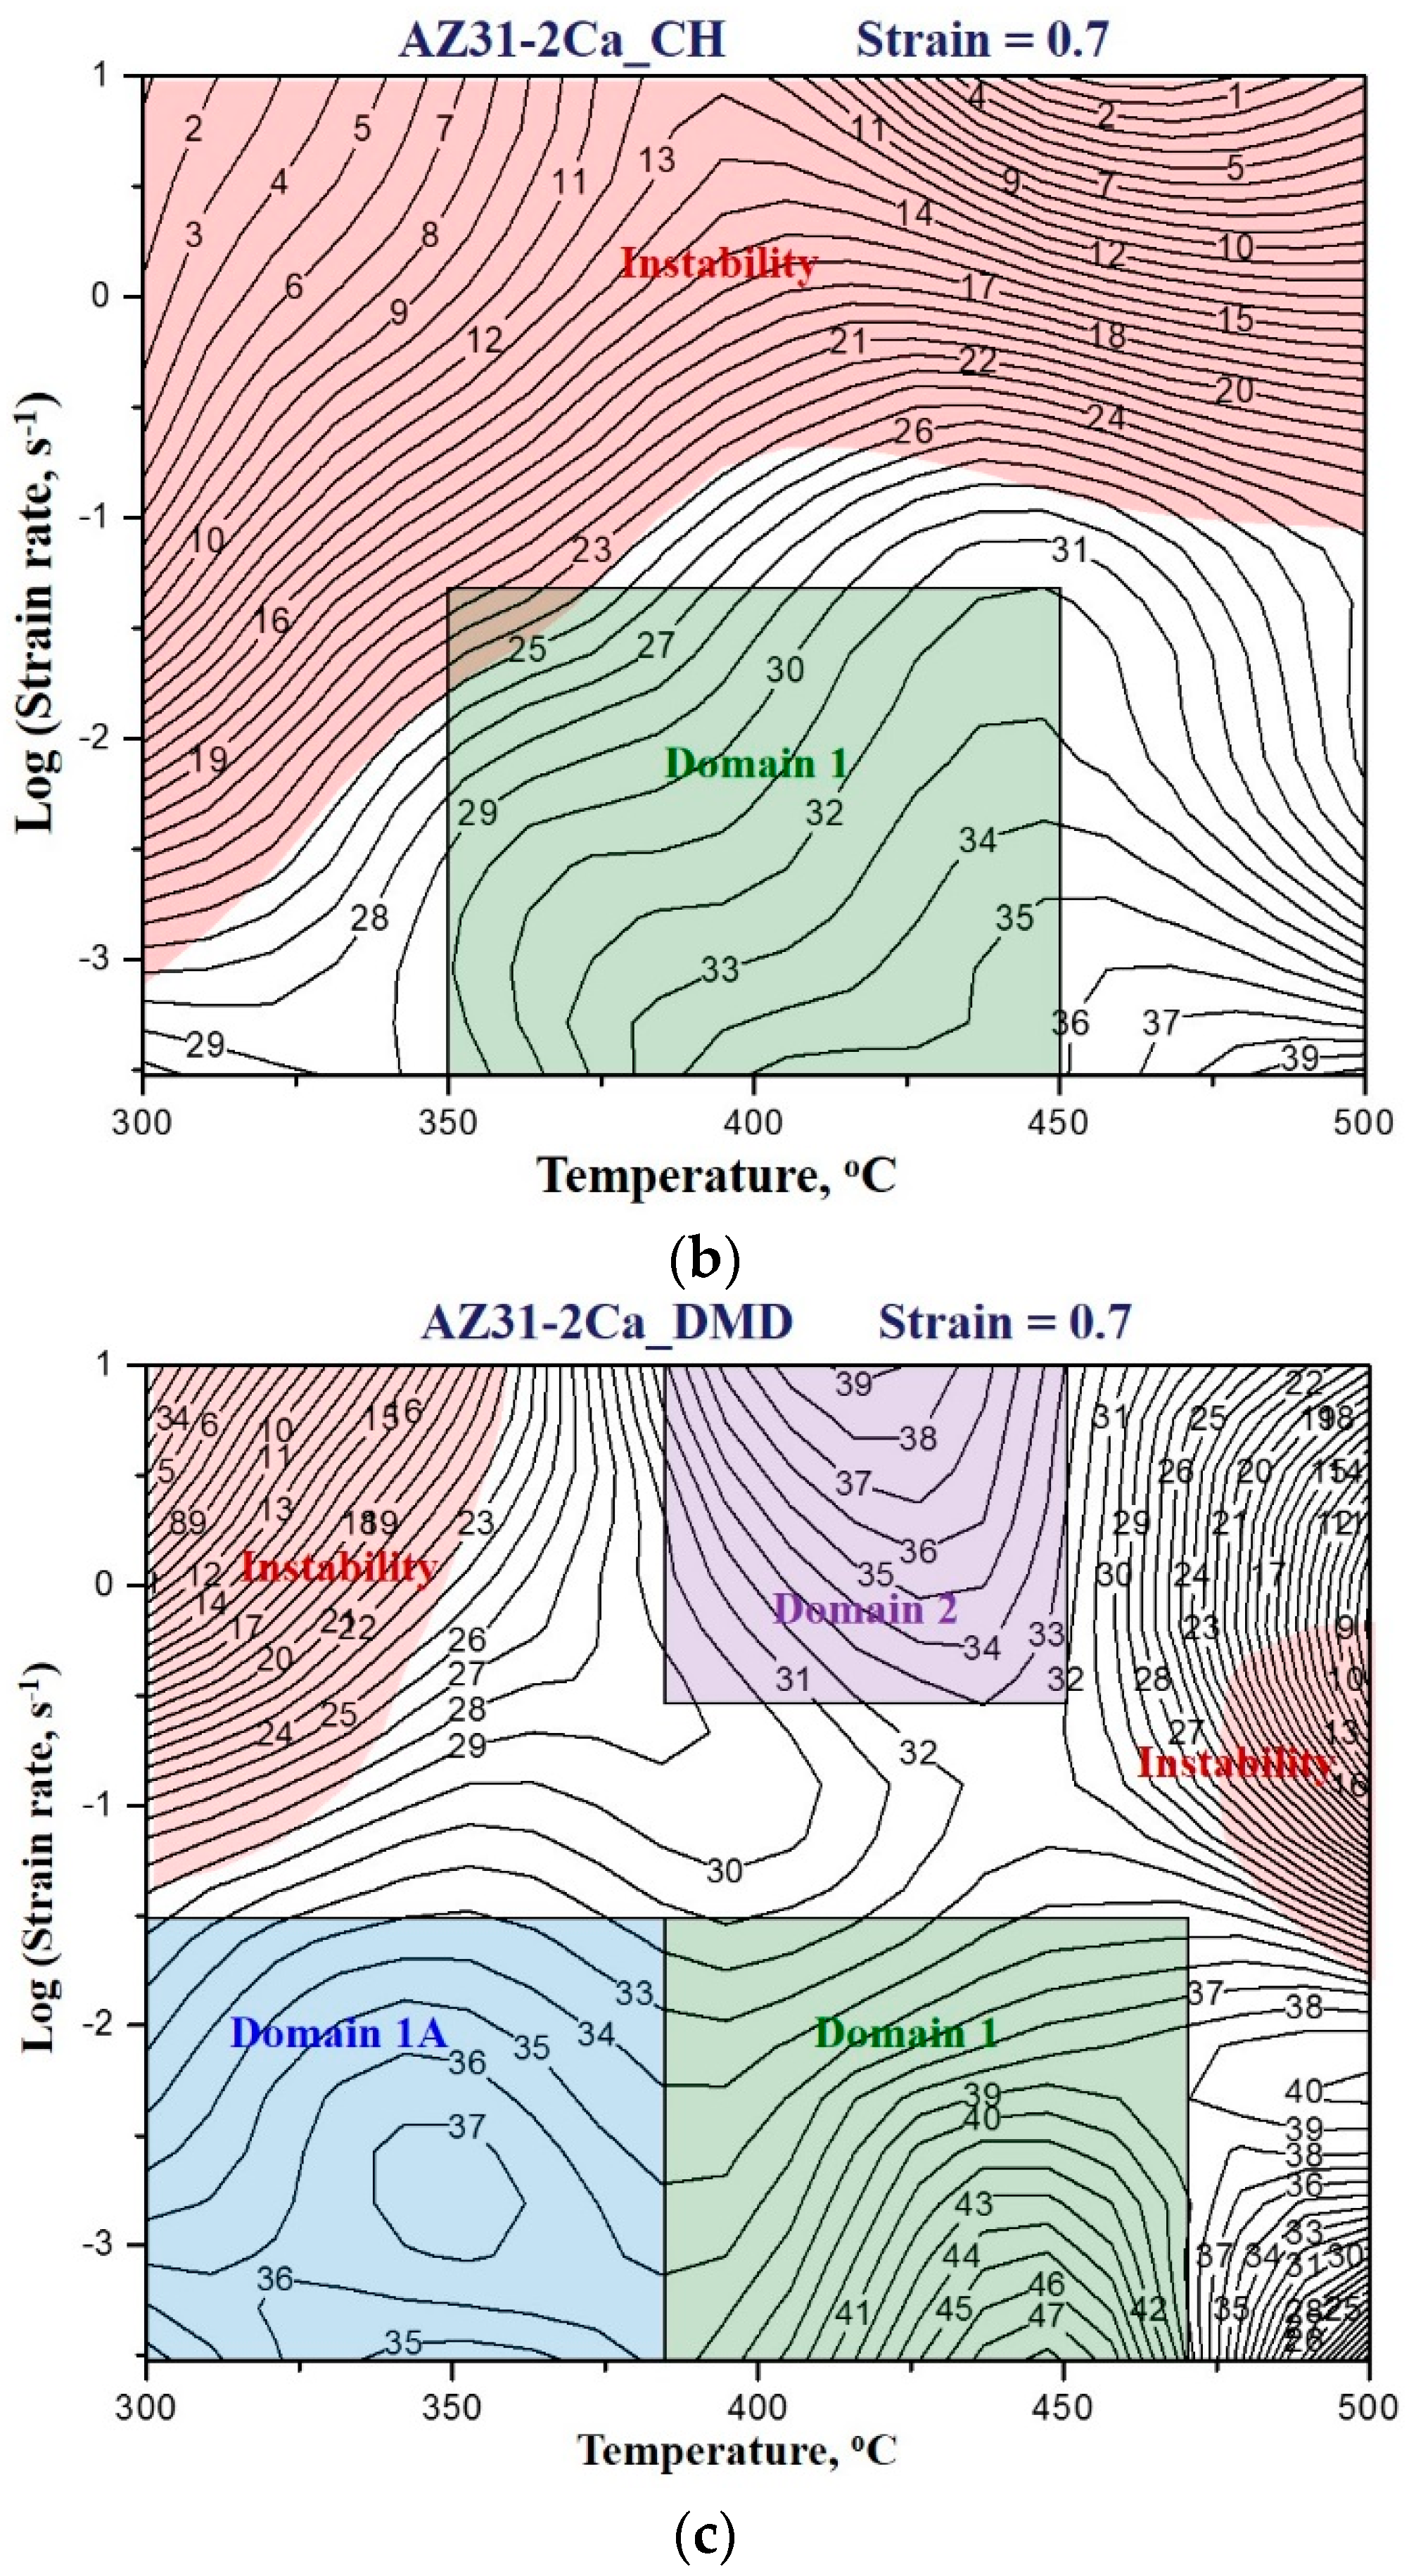
- 350–450 °C and 0.0003–0.05 s−1, with a peak efficiency of 38% at 450 °C/0.0003 s−1.
- (2)
- 450–500 °C and 0.03–3 s−1, with a peak efficiency of 40% at 500 °C/0.1 s−1.
3.4.2. DMD Processed Specimens
- (#1A)
- 300–385 °C and 0.0003–0.03 s−1, with a peak efficiency of 37% at 350 °C/0.003 s−1,
- (#1)
- 385–470 °C and 0.0003–0.03 s−1, with a peak efficiency of 48% at 450 °C/0.0003 s−1,
- (#2)
- 385–450 °C and 0.3–10 s−1, with a 38% peak efficiency of at 420 °C/10 s−1.
3.5. Implications in Process Design for AZX312 Alloy
4. Conclusions
- (1)
- The alloy in the AC and CH condition has a large grain size, with high volume fraction of intermetallic phases—(Mg,Al)2Ca and Ca2Mg6Zn3—present at the grain boundaries and in the matrix. In DMD processed alloy, the grain size is very fine and the phases are refined and distributed uniformly.
- (2)
- The ultimate compressive strength is slightly lowered by homogenization and is significantly improved by DMD processing, which is attributed to the grain refinement occurring in DMD.
- (3)
- The processing maps for AC and CH specimens are similar and exhibited a workability domain in the temperature range of 350–450 °C and the strain rate range of 0.0003–0.05 s−1. On the basis of microstructure, tensile ductility, and activation analysis, this domain is interpreted to represent DRX occurring by second order pyramidal slip and cross-slip.
- (4)
- The processing map for DMD processed alloy exhibited three workability windows in the temperature and strain rate ranges: (1A) 300–385 °C and 0.0003–0.03 s−1, (1) 385–470 °C and 0.0003–0.03 s−1, and (2) 385–450 °C and 0.3–10 s−1. DRX occurs in all these and is controlled by prismatic slip + climb in Domain #1A, second order pyramidal slip in Domains #1 and #2 with cross-slip and grain boundary self-diffusion as rate-controlling mechanisms, respectively.
- (5)
- While Domain #1 is common to all the three conditions, Domains #1A and #2 are new in the map for DMD processed alloy, indicating an enhancement in workability by DMD.
- (6)
- The availability of additional workability domains in the DMD map has implications in the design of hot working processes, since the higher strain rates offered by Domain #2 will lead to faster production rates and the fine grain sizes produced by finishing operations in Domain #1A will improve the mechanical properties of the product.
- (7)
- Homogenization is not beneficial to, either, improve the strength or the hot workability of the alloy and may be eliminated in designing hot working process schedules.
Author Contributions
Acknowledgments
Conflicts of Interest
References
- Kainer, K.U.; Dieringa, H.; Dietzel, W.; Hort, N.; Blawert, C. The use of magnesium alloys: Past, present and future. In Magnesium Technology in Global Age; Pekguleryuz, M.O., Mackenzie, L.W.F., Eds.; Canadian Institute of Mining, Metallurgy and Petroleum: Montreal, QC, Canada, 2006; pp. 3–19. [Google Scholar]
- Vespa, G.; Mackenzie, L.W.F.; Verma, R.; Zarandi, F.; Essadiqi, E.; Yue, S. The influence of the as-hot rolled microstructure on the elevated temperature mechanical properties of magnesium AZ31 sheet. Mater. Sci. Eng. A 2008, 487, 243–250. [Google Scholar] [CrossRef]
- Jain, A.; Duygulu, O.; Brown, D.W.; Tome, C.N.; Agnew, S.R. Grain size effects on the tensile properties and deformation mechanisms of a magnesium alloy AZ31B sheet. Mater. Sci. Eng. A 2008, 486, 545–555. [Google Scholar] [CrossRef]
- Ulacia, I.; Salisbury, C.P.; Hurtado, I.; Worswick, M.J. Tensile characterization and constitutive modeling of AZ31B magnesium alloy sheet over wide range of strain rates and temperatures. J. Mater. Process. Technol. 2011, 211, 830–839. [Google Scholar] [CrossRef]
- Yang, X.; Miura, H.; Sakai, T. Structural development at severely high strain in AZ31 magnesium alloy processed by cold forging and subsequent annealing. Mater. Des. 2013, 44, 573–579. [Google Scholar] [CrossRef]
- Habibnejad-Korayem, M.; Mahmudi, R.; Poole, W.J. Enhanced properties of Mg-based nano-composites reinforced with Al2O3 nanoparticles. Mater. Sci. Eng. A 2009, 519, 198–203. [Google Scholar] [CrossRef]
- Paramsothy, M.; Chan, J.; Kwok, R.; Gupta, M. Enhanced mechanical response of hybrid alloy AZ31/AZ91 based on the addition of Si3N4 nanoparticles. Mater. Sci. Eng. A 2011, 528, 6545–6551. [Google Scholar] [CrossRef]
- Paramsothy, M.; Hassan, S.F.; Srikanth, N.; Gupta, M. Enhancing tensile/compressive response of magnesium alloy AZ31 by integrating with Al2O3 nanoparticles. Mater. Sci. Eng. A 2009, 527, 162–168. [Google Scholar] [CrossRef]
- Zhong, T.; Rao, K.P.; Prasad, Y.V.R.K.; Zhao, F.; Gupta, M. Hot deformation mechanisms, microstructure and texture evolution in extruded AZ31-nano-alumina composite. Mater. Sci. Eng. A 2014, 589, 41–49. [Google Scholar] [CrossRef]
- Kim, J.H.; Kang, N.E.; Yim, C.D.; Kim, B.K. Effect of calcium content on the microstructural evolution and mechanical properties of wrought Mg-3Al-1Zn alloy. Mater. Sci. Eng. A 2009, 525, 18–29. [Google Scholar] [CrossRef]
- Masoudpanah, S.M.; Mahmudi, R. Effects of rare-earth elements and Ca additions on the microstructure and mechanical properties of AZ31 magnesium alloy processed by ECAP. Mater. Sci. Eng. A 2009, 526, 22–30. [Google Scholar] [CrossRef]
- Suresh, K.; Rao, K.P.; Prasad, Y.V.R.K.; Hort, N.; Kainer, K.U. Effect of calcium addition on the hot working behavior of as-cast AZ31 magnesium alloy. Mater. Sci. Eng. A 2013, 588, 272–279. [Google Scholar] [CrossRef]
- Yim, C.D.; You, B.S.; Lee, J.S.; Kim, W.C. Optimization of hot rolling process of gravity cast AZ31-xCa (x = 0∼2.0 mass%) alloys. Mater. Trans. 2004, 45, 3018–3022. [Google Scholar] [CrossRef]
- Yang, M.; Zhang, J.; Guo, T. Effects of Ca addition on as-cast microstructure and mechanical properties of Mg–3Ce–1.2Mn–1Zn (wt.%) magnesium alloy. Mater. Des. 2013, 52, 274–283. [Google Scholar] [CrossRef]
- Hassan, S.F.; Gupta, M. Development of nano-Y2O3 containing magnesium nanocomposites using solidification processing. J. Alloys Compd. 2007, 429, 176–183. [Google Scholar] [CrossRef]
- Nguyen, Q.B.; Gupta, M. Improving compressive strength and oxidation resistance of AZ31B magnesium alloy by addition of nano-Al2O3 particulates and Ca. J. Compos. Mater. 2010, 44, 883–896. [Google Scholar] [CrossRef]
- Nguyen, Q.B.; Gupta, M. Enhancing mechanical response of AZ31B using Cu+nano-Al2O3 addition. Mater. Sci. Eng. A 2010, 527, 1411–1416. [Google Scholar] [CrossRef]
- Prasad, Y.V.R.K.; Rao, K.P.; Sasidhara, S. Hot Working Guide: A Compendium of Processing Maps, 2nd ed.; ASM International: Materials Park, OH, USA, 2015; ISBN 978-1-62708-091-0. [Google Scholar]
- Prasad, Y.V.R.K.; Seshacharyulu, T. Modeling of hot deformation for microstructural control. Int. Mater. Rev. 1998, 44, 243–258. [Google Scholar] [CrossRef]
- Prasad, Y.V.R.K. Processing Maps—A Status Report. J. Mater. Eng. Perform. 2003, 12, 638–645. [Google Scholar] [CrossRef]
- Ziegler, H. Some extremum principles in irreversible thermodynamics with applications to continuum mechanics. In Progress in Solid Mechanics; John Wiley: New York, NY, USA, 1965; Volume 4, pp. 91–193. [Google Scholar]
- Prasad, Y.V.R.K.; Rao, K.P. Processing maps and rate controlling mechanisms of hot deformation of electrolytic tough pitch copper in the temperature range 300–950 °C. Mater. Sci. Eng. A 2005, 391, 141–150. [Google Scholar] [CrossRef]
- Grobner, J.; Schmid-Fetzer, R. Key issues in a thermodynamic Mg alloy database. Metall. Mater. Trans. A 2013, 44, 2918–2934. [Google Scholar] [CrossRef]
- Jeong, J.; Im, J.; Song, K.; Kwon, M.; Kim, S.K.; Kang, Y.B.; Oh, S.H. Transmission electron microscopy and thermodynamic studies of CaO-added AZ31 Mg alloys. Acta Mater. 2013, 61, 3267–3277. [Google Scholar] [CrossRef]
- Morris, J.R.; Schraff, J.; Ho, K.M.; Turner, D.E.; Ye, Y.Y.; Yoo, M.H. Prediction of a {1122} hcp stacking fault using a modified generalized stacking-fault calculation. Philos. Mag. A 1997, 76, 1065–1077. [Google Scholar] [CrossRef]
- Jonas, J.J.; Sellars, C.M.; Tegart, W.J.M. Strength and structure under hot working conditions. Metall. Rev. 1969, 14, 1–24. [Google Scholar] [CrossRef]
- Frost, H.J.; Ashby, M.F. Deformation-Mechanism Maps: The Plasticity and Creep of Metals and Ceramics; Pergamon Press: Oxford, UK, 1982; p. 44. [Google Scholar]


| Domain | As-Cast | Cast-Homogenized | DMD Processed | ||||||
|---|---|---|---|---|---|---|---|---|---|
| at Peak η | n | Q, kJ/mole | at Peak η | n | Q, kJ/mole | at Peak η | n | Q, kJ/mole | |
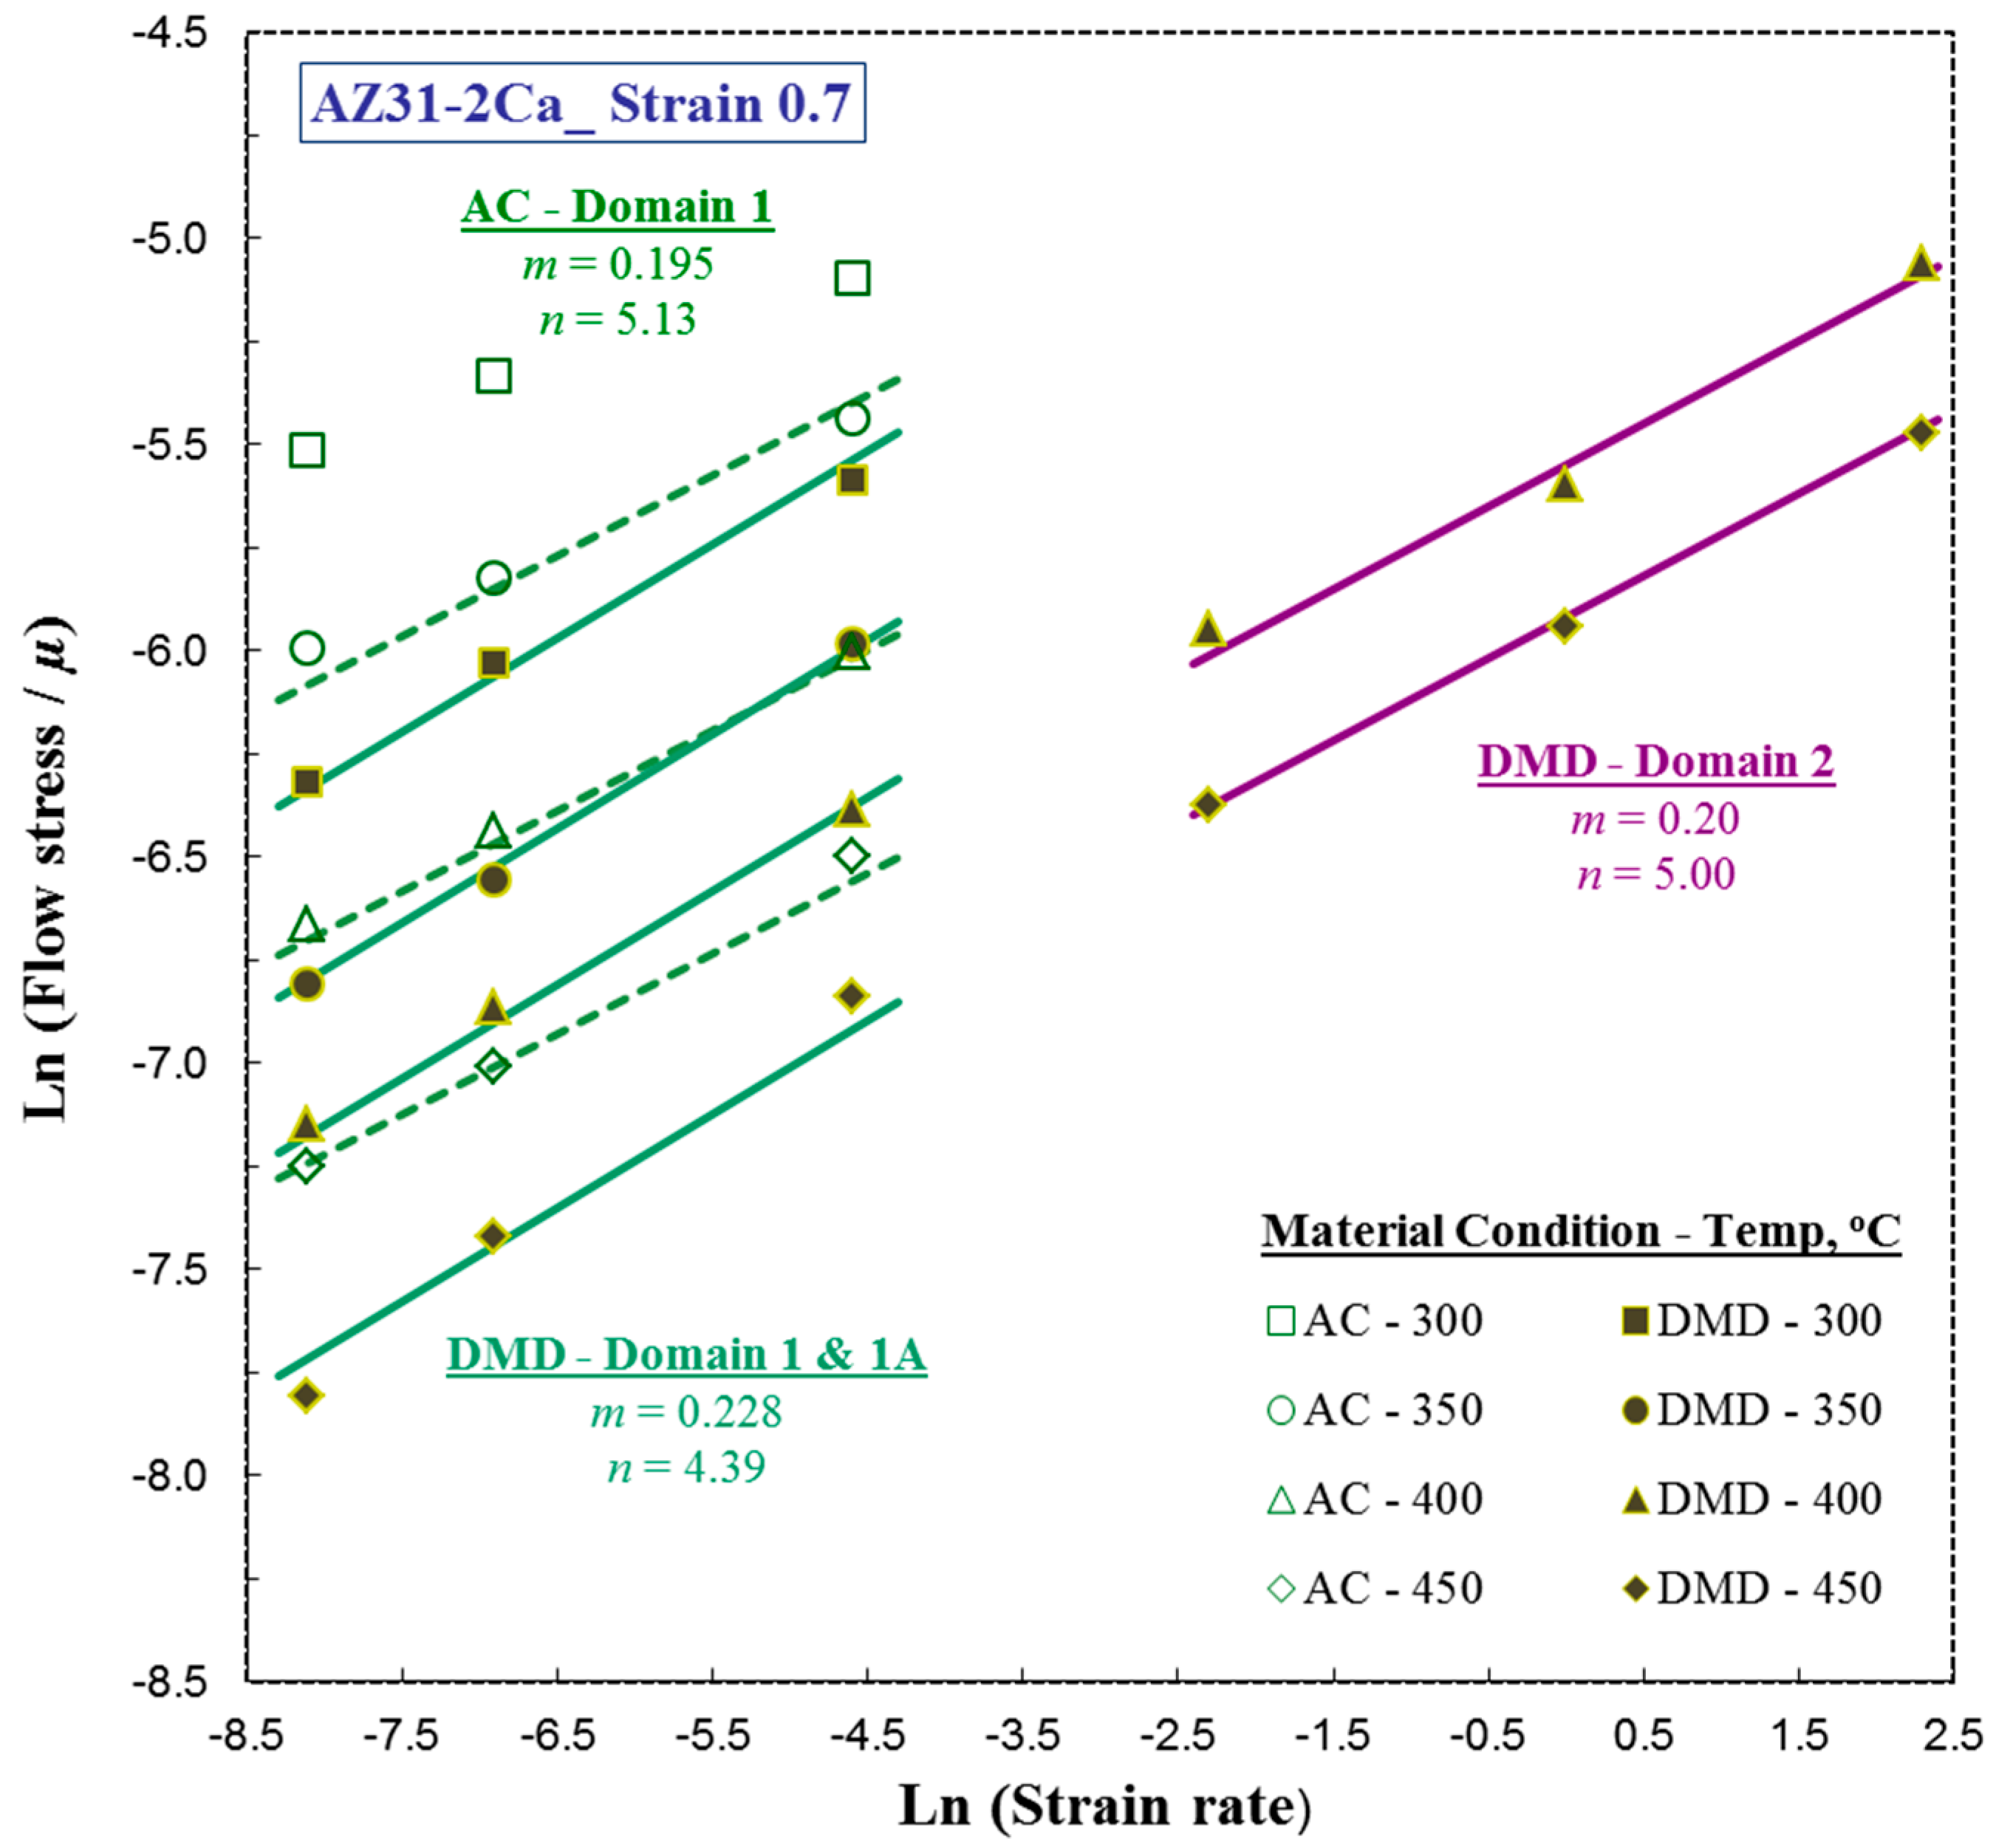
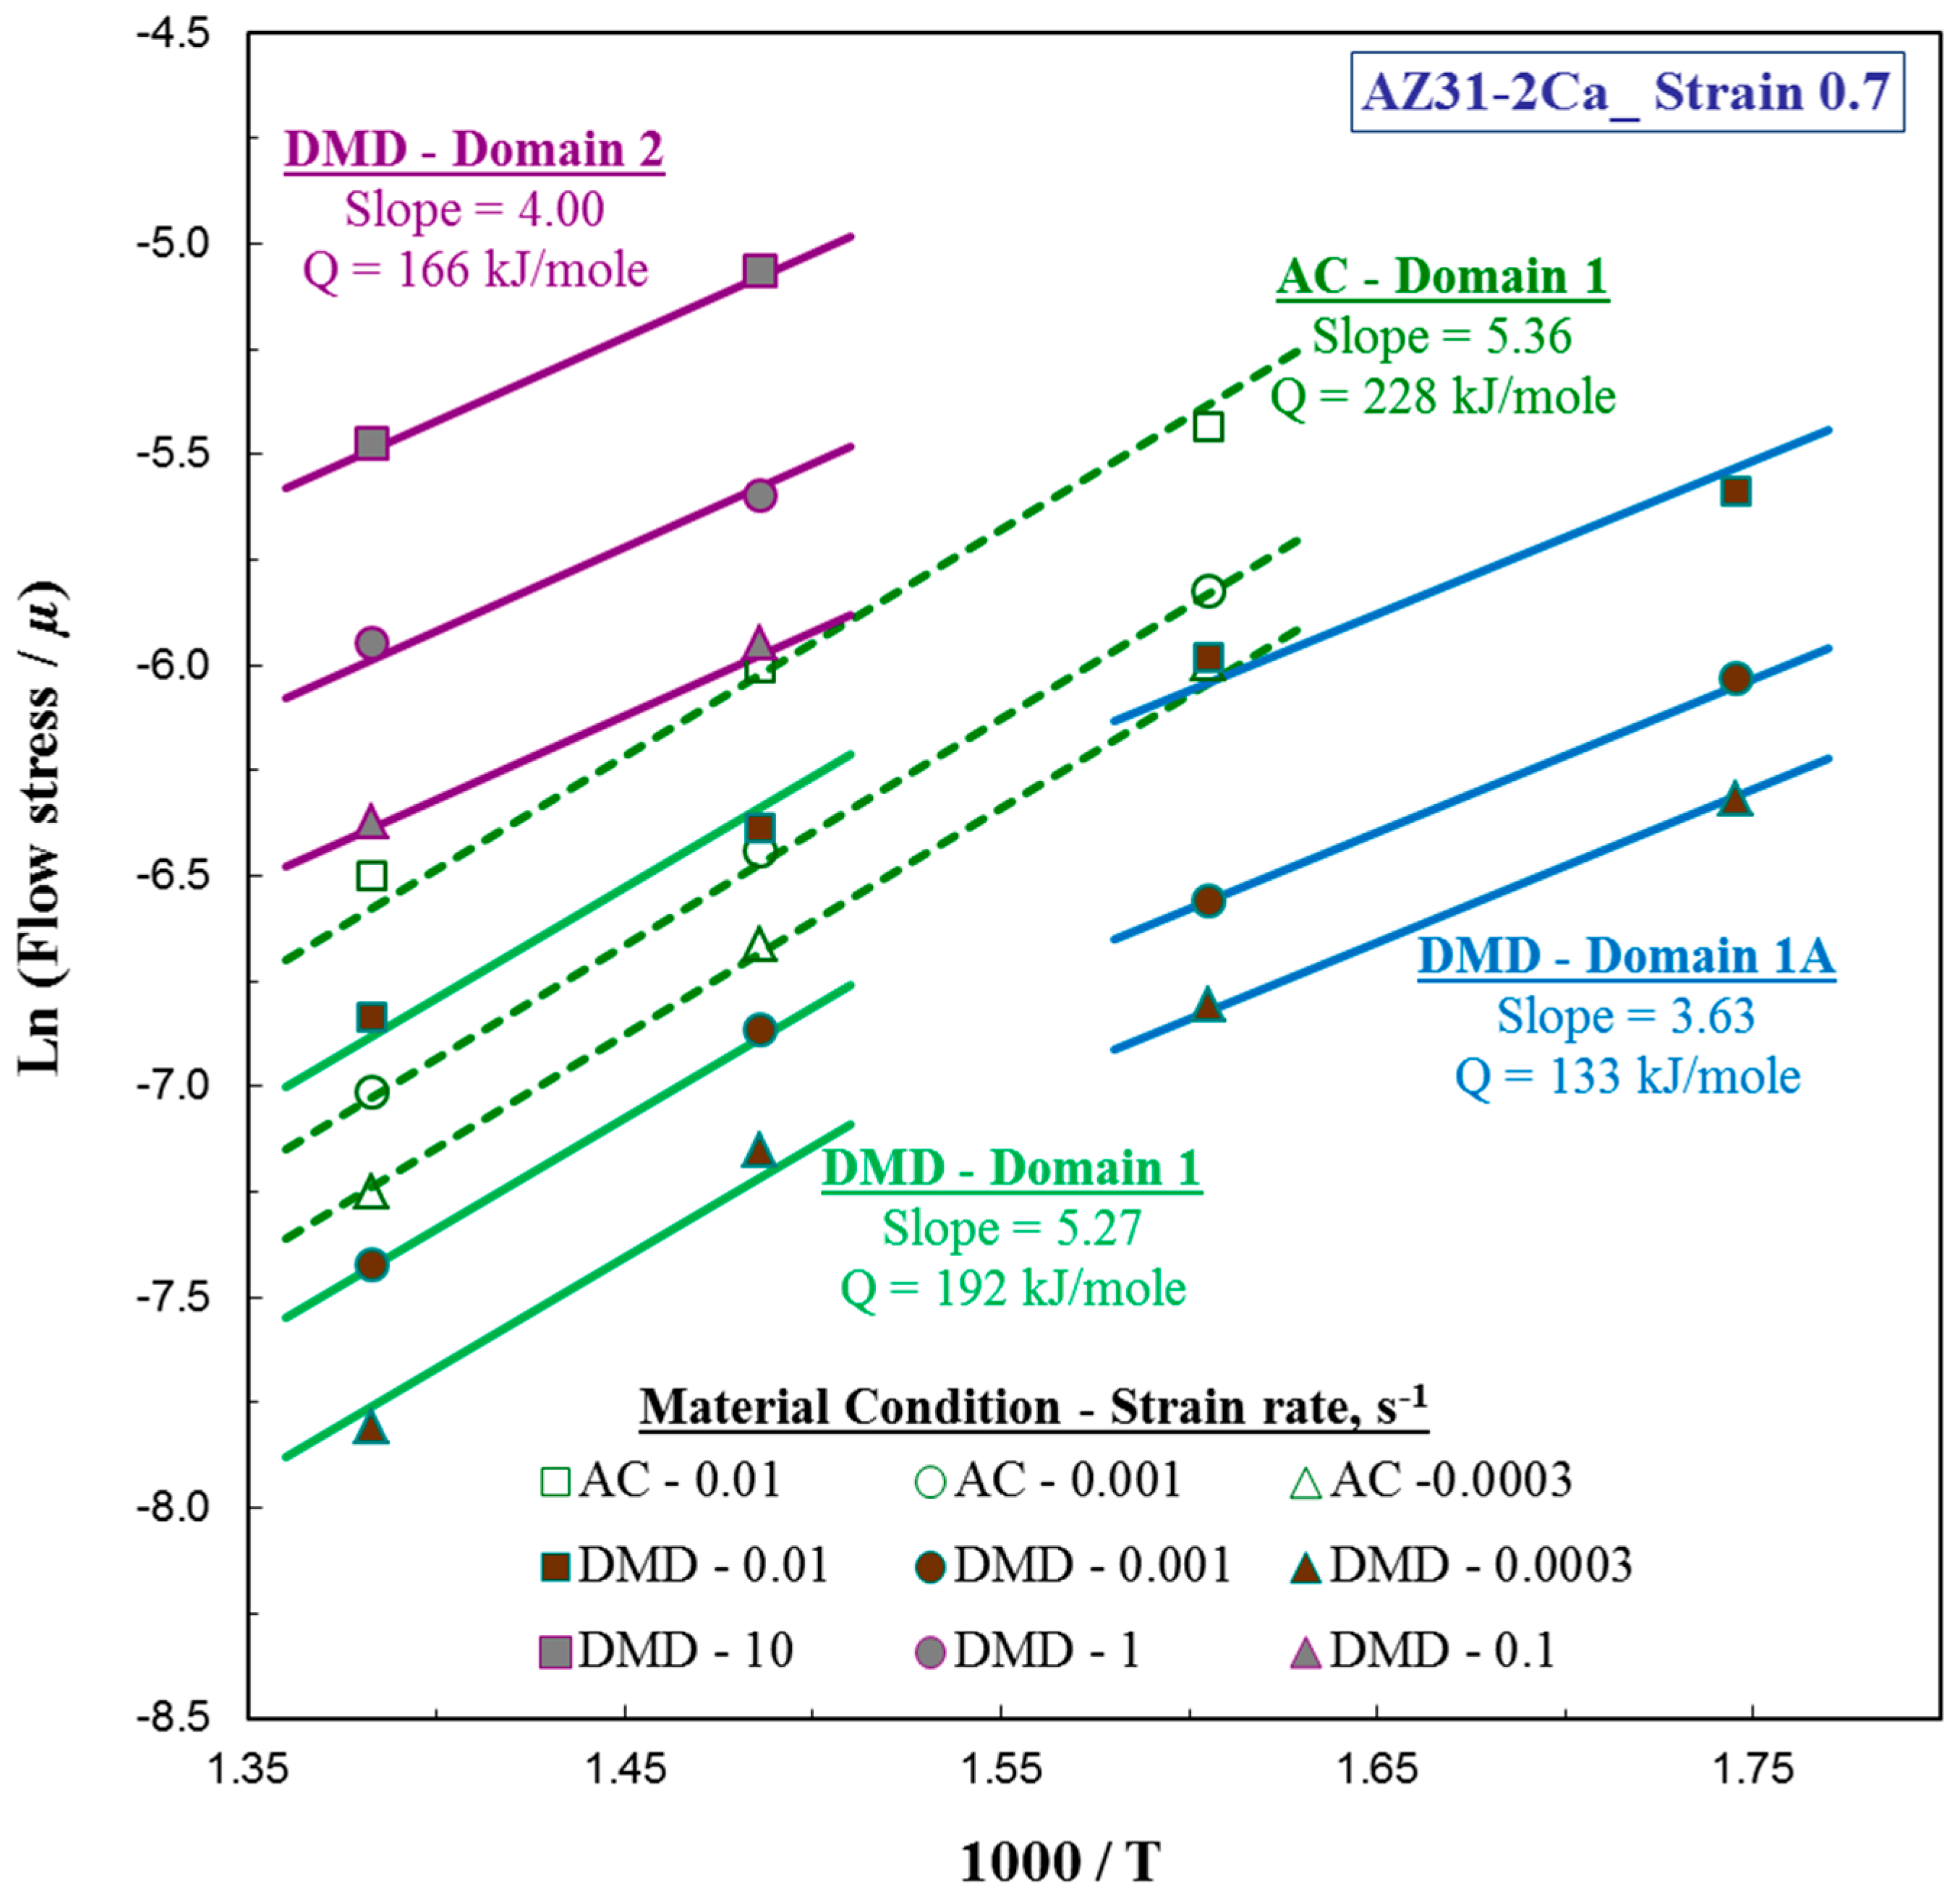
| #1 | 450 °C/0.0003 s−1 | 5.13 | 228 | 450 °C/0.0003 s−1 | 4.64 | 198 | 450 °C/0.0003 s−1 | 4.39 | 192 |
| #1A | - | - | - | - | - | - | 350 °C/0.002 s−1 | 4.39 | 133 |
| #2 | 500 °C/0.1 s−1 | Grain boundary cracking | - | - | - | 420 °C/10 s−1 | 5.00 | 166 | |
© 2018 by the authors. Licensee MDPI, Basel, Switzerland. This article is an open access article distributed under the terms and conditions of the Creative Commons Attribution (CC BY) license (http://creativecommons.org/licenses/by/4.0/).
Share and Cite
Rao, K.P.; Suresh, K.; Prasad, Y.V.R.K.; Hort, N.; Gupta, M. Enhancement of Strength and Hot Workability of AZX312 Magnesium Alloy by Disintegrated Melt Deposition (DMD) Processing in Contrast to Permanent Mold Casting. Metals 2018, 8, 437. https://doi.org/10.3390/met8060437
Rao KP, Suresh K, Prasad YVRK, Hort N, Gupta M. Enhancement of Strength and Hot Workability of AZX312 Magnesium Alloy by Disintegrated Melt Deposition (DMD) Processing in Contrast to Permanent Mold Casting. Metals. 2018; 8(6):437. https://doi.org/10.3390/met8060437
Chicago/Turabian StyleRao, Kamineni Pitcheswara, Kalidass Suresh, Yellapregada Venkata Rama Krishna Prasad, Norbert Hort, and Manoj Gupta. 2018. "Enhancement of Strength and Hot Workability of AZX312 Magnesium Alloy by Disintegrated Melt Deposition (DMD) Processing in Contrast to Permanent Mold Casting" Metals 8, no. 6: 437. https://doi.org/10.3390/met8060437