Article

The Effect of Impingement Velocity and Angle Variation on the Erosion Corrosion Performance of API 5L-X65 Carbon Steel in a Flow Loop

by
Ihsan UlHaq Toor
1,2,*,
Hafiz Muzammil Irshad
1,
Hassan Mohamed Badr
1 and
Mohammed Abdul Samad
1
1
Department of Mechanical Engineering, King Fahd University of Petroleum & Minerals (KFUPM), Dhahran 31261, Saudi Arabia
2
Center of Research Excellence in Nanotechnology, King Fahd University of Petroleum & Minerals (KFUPM), Dhahran 31261, Saudi Arabia
*
Author to whom correspondence should be addressed.
Metals 2018, 8(6), 402; https://doi.org/10.3390/met8060402
Submission received: 13 May 2018 / Revised: 26 May 2018 / Accepted: 29 May 2018 / Published: 31 May 2018
(This article belongs to the Special Issue Failure Mechanisms in Alloys)

Abstract

:
Erosion corrosion performance of API 5L-X65 carbon steel was investigated at three different impingement velocities (3, 6 & 12 m/s), five different angles (15, 30, 45, 60, & 90°), and with/without solid particles (average particle size of 314 µm). The experiments were conducted in 0.2 M NaCl solution at room temperature for a duration of 24 h and the results showed that the maximum erosion corrosion rate was observed at 45° irrespective of the velocity. The highest erosion corrosion rate at 45° was due to the balance between the shear and normal impact stress at this angle. Ploughing, deep craters, and micro-forging/plastic deformation were found to be the main erosion corrosion mechanisms. The maximum wear scar depth measured using optical profilometery was found to be 51 µm (average) at an impingement angle of 45°.

Graphical Abstract

1. Introduction

Erosion-corrosion is a combined material degradation mechanism in which material is removed by the mechanical process of erosion coupled with the electrochemical process of corrosion. This is one of the serious problems being faced by many industries and is responsible for multibillion-dollar losses due to premature equipment failures [1]. Erosion corrosion is ranked as the 5th most common degradation issue in fluid handling systems (pumps, compressors, piping systems in offshore oil/gas facilities, desalination plants, etc.) and has direct consequences in terms of equipment safety [2,3,4,5,6]. This problem gets more aggravated by the presence of high amounts of solid/sand particles of different morphologies in the flowing fluid [7,8]. These high velocity solid particles strike the stationary and rotating equipment in the presence of fluid mixed with water and/or oxygen and thus cause unplanned plant shutdowns, resulting in multibillion-dollar loss [9]. The seawater in desalination plants, cooling systems, fire-fighting systems, and power generation industries is very corrosive and if present together with solid particles, can reduce the equipment design life significantly by the combined effect of erosion and corrosion.
So, therefore, in order to overcome this problem of erosion corrosion in the industries, a detailed erosion corrosion database is required which can assist in developing erosion corrosion models for better prediction. The development of efficient prediction models depends on realistic and reliable experimental data obtained by simulating the real-time industrial conditions. The erosion corrosion behavior of carbon steel being used a lot as pipeline material can be investigated by conducting the experiments in flow loops. The design of such flow loops enables the researchers to investigate the erosion corrosion problem by controlling different parameters such as angle, velocity, fluid type, temperature and amount/type of solid particles etc. However, due to its high cost of maintenance, construction challenges and space limitations within the research laboratories, such types of experimental facilities are limited.
According to ASTM G73-98, corrosion is the progressive loss of original material from a solid surface due to continued exposure to impacts by liquid jets. The problems usually arise when a stream of water impinges on, or flows over components especially whenever there is a change of flow direction and/or a change in the cross-sectional area of the flow passage [10,11]. In erosion, solid particles entrained in high-velocity jets are repeatedly impacted on the metal at oblique angles, resulting in material removal from the surface, whereas corrosion is a material loss because of chemical or electrochemical reactions [12]. Erosion-corrosion caused by flowing fluid with/without solid particles is a form of tribo-corrosion material removal mechanism as it damages both the surface layers, (passive film or corrosion products) as well as the base metal. The degradation mechanism resulting from the combined effect of electrochemical and mechanical processes seems very complex [12,13,14,15]. The material removal during erosion corrosion process can be either by chemical dissolution or by erosion simply due to fluid flow alone or due to the impingement of slurry mixed with solid particles. There can be more intricate situations in which electrochemical corrosion can have synergistic effects [13,14] and the synergistic effects of erosion-corrosion can be considerably higher than the individual effect of erosion or corrosion.
So therefore, the main objective of this study was to evaluate the erosion corrosion behavior and underlying erosion corrosion mechanism in one of the most commonly used pipeline grade carbon steel material API 5L-X65. The experiments were conducted to examine the role of various parameters such as impingement velocity (3~12 m/s) and impingement angle (15°~90°) on the erosion corrosion behavior of this steel in 0.2 Mol NaCl solution at room temperature with/without solid particles for a duration of 24 h. The eroded surfaces were examined using Field Emission Scanning Electron Microscopy (FE-SEM) and optical profilometer to understand the erosion corrosion mechanism.

2. Experimental Procedure

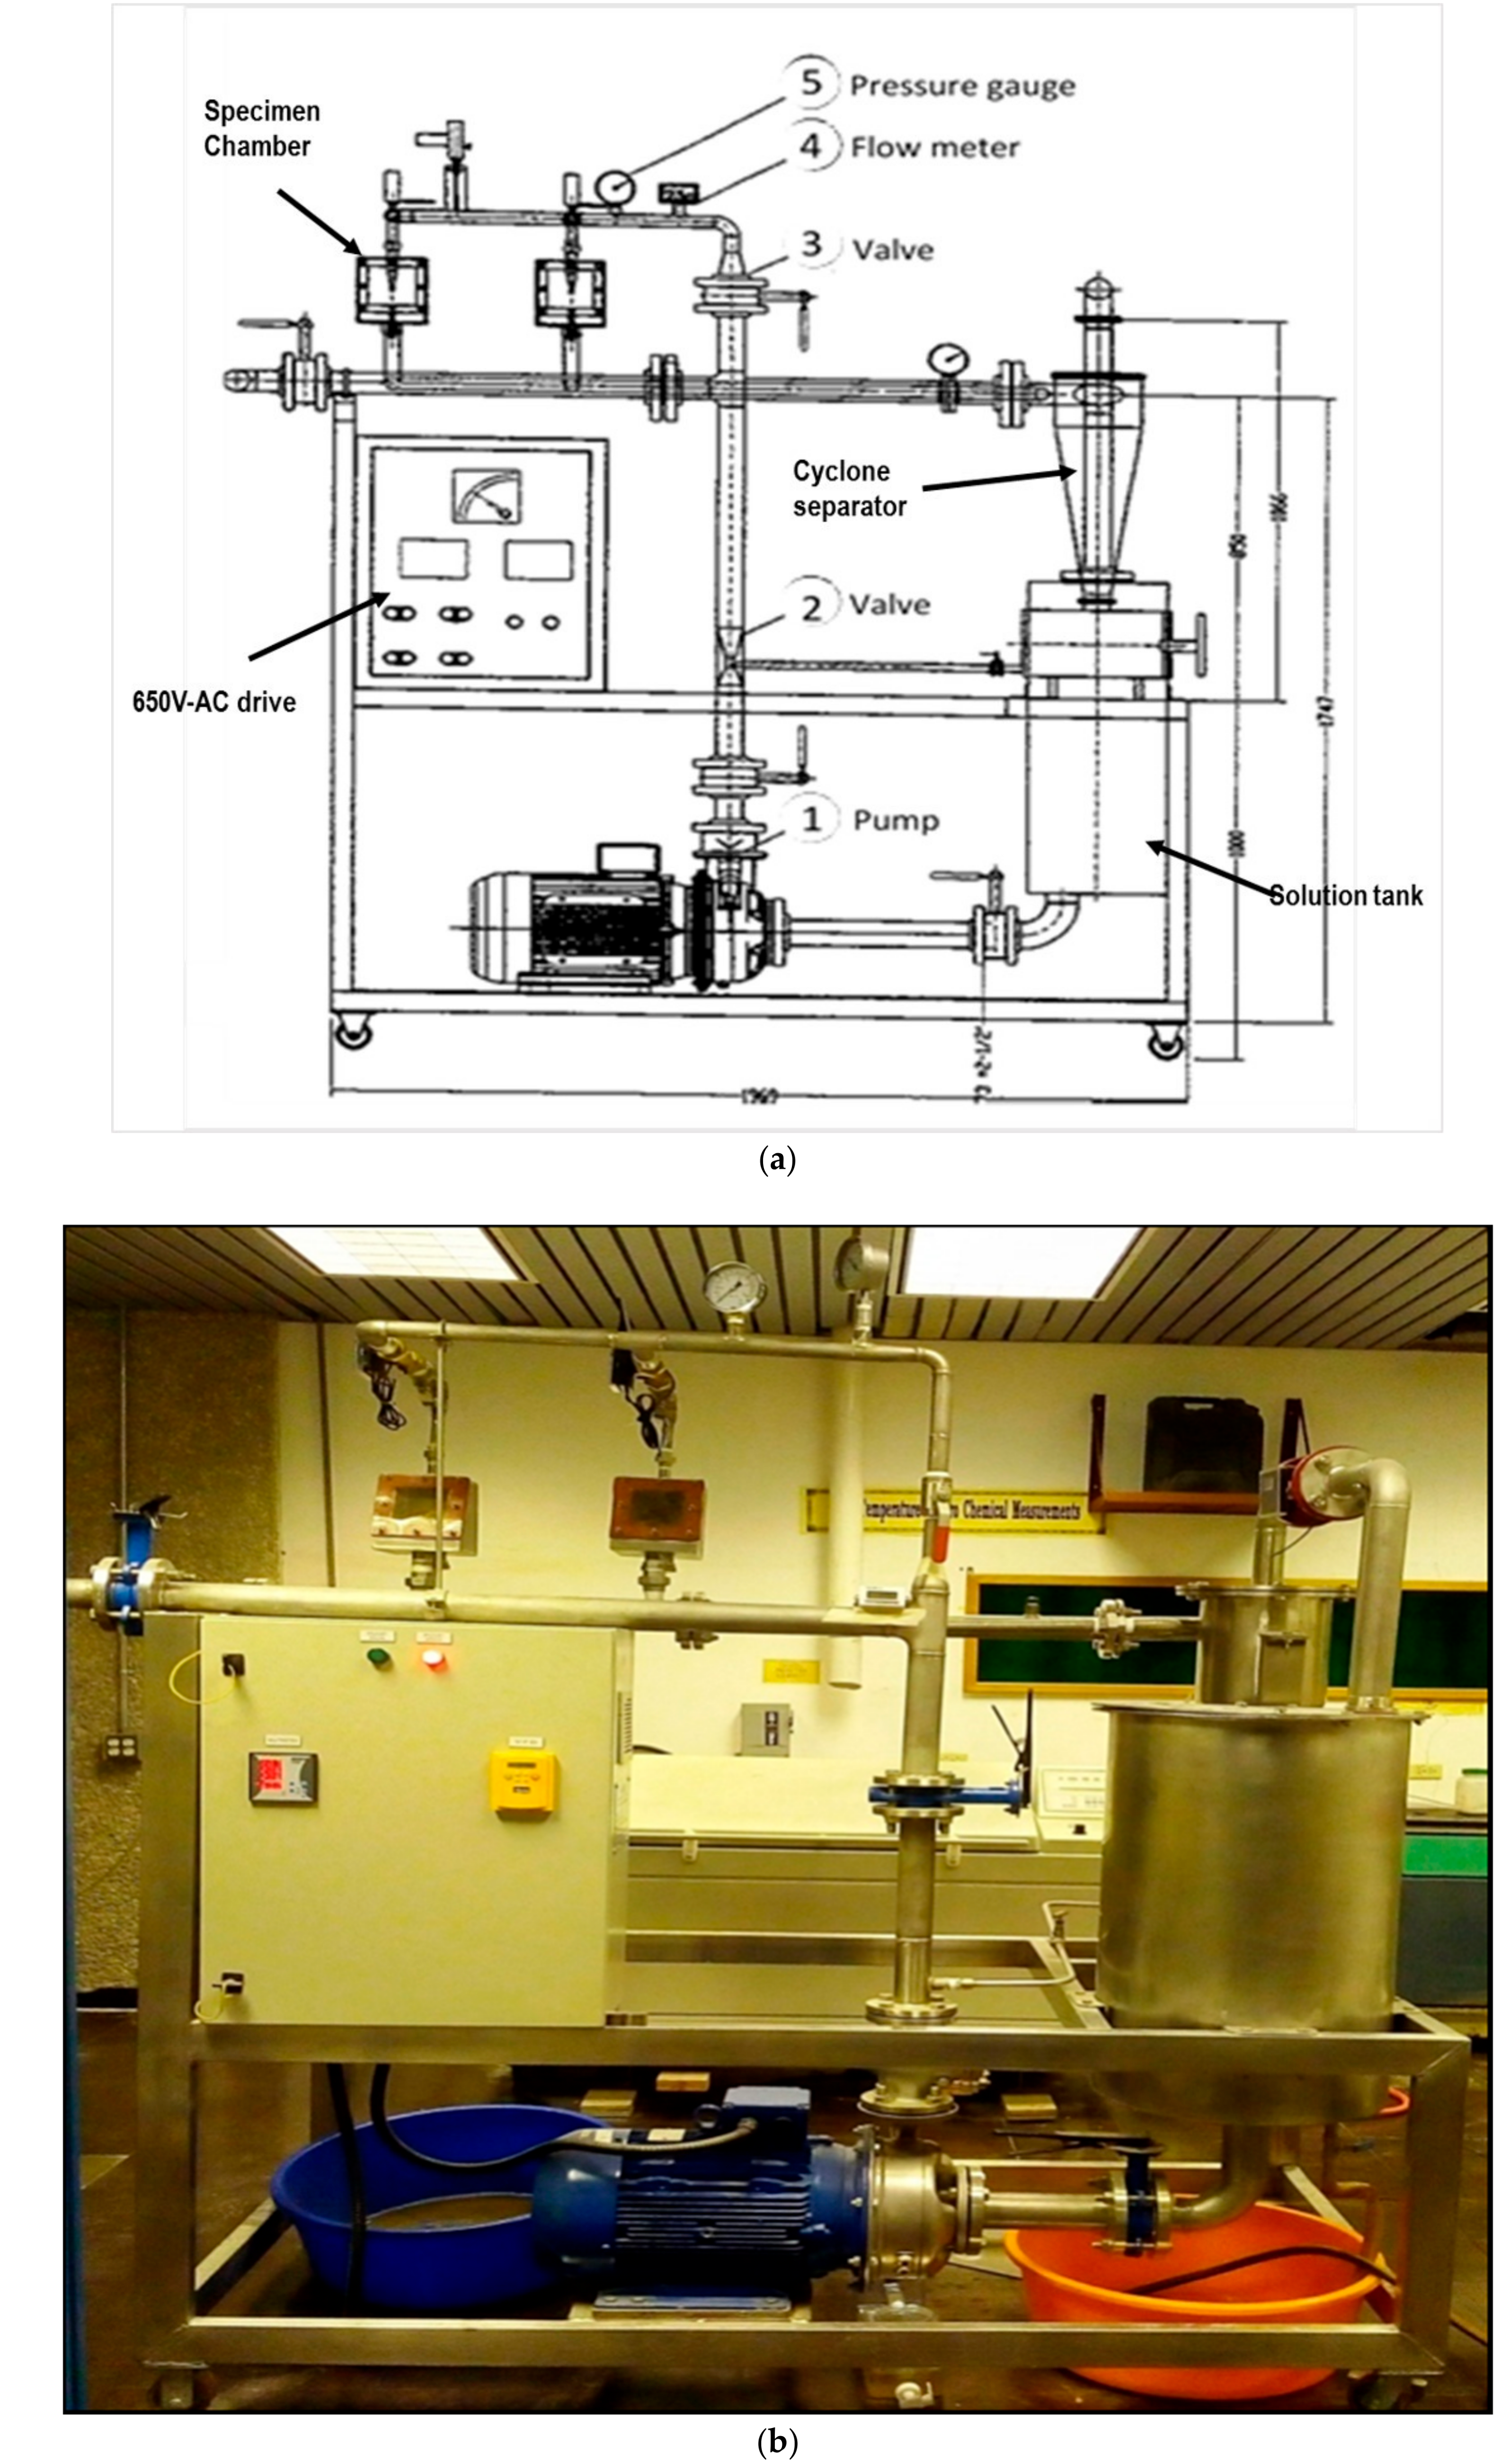
2.1. Erosion-Corrosion Test Apparatus

In order to carry out the detailed experimental investigations, a state of the art mini-flow loop was designed and manufactured locally as shown in Figure 1. A centrifugal pump was used to circulate the fluid in the flow loop. To investigate the effect of solid particles, the discharge pipe was equipped with a venture-tube with a controlled stream of solid particles. The two-phase mixture flows into the erosion-corrosion test cell and then to a cyclone separator for separating the solid particles before returning back to the main reservoir. The test cell is equipped with a fixed convergent nozzle (3 mm diameter nozzle made of 316 L stainless steel) to produce the required liquid jet velocity. The cell also has a sample holder, which can be used to fix the specimens at five different impingement angles. All of the components of the flow loop such as pipes, storage tank, cyclone separator, valves, pump etc., were made of corrosion resistant 316 L stainless steel. Fluid jet velocity was calculated using ultrasonic water flow meter (Model: Wprime-280W) and pump speed was controlled with the help of 650 V SSD drive control panel. Taylor 9940 N temperature gauge was used to monitor the temperature, whereas 15 kW pump (Lowara Company: Vicenza, Italy) was used for fluid pumping.

2.2. Test Specimens and Sand Particle Characterization
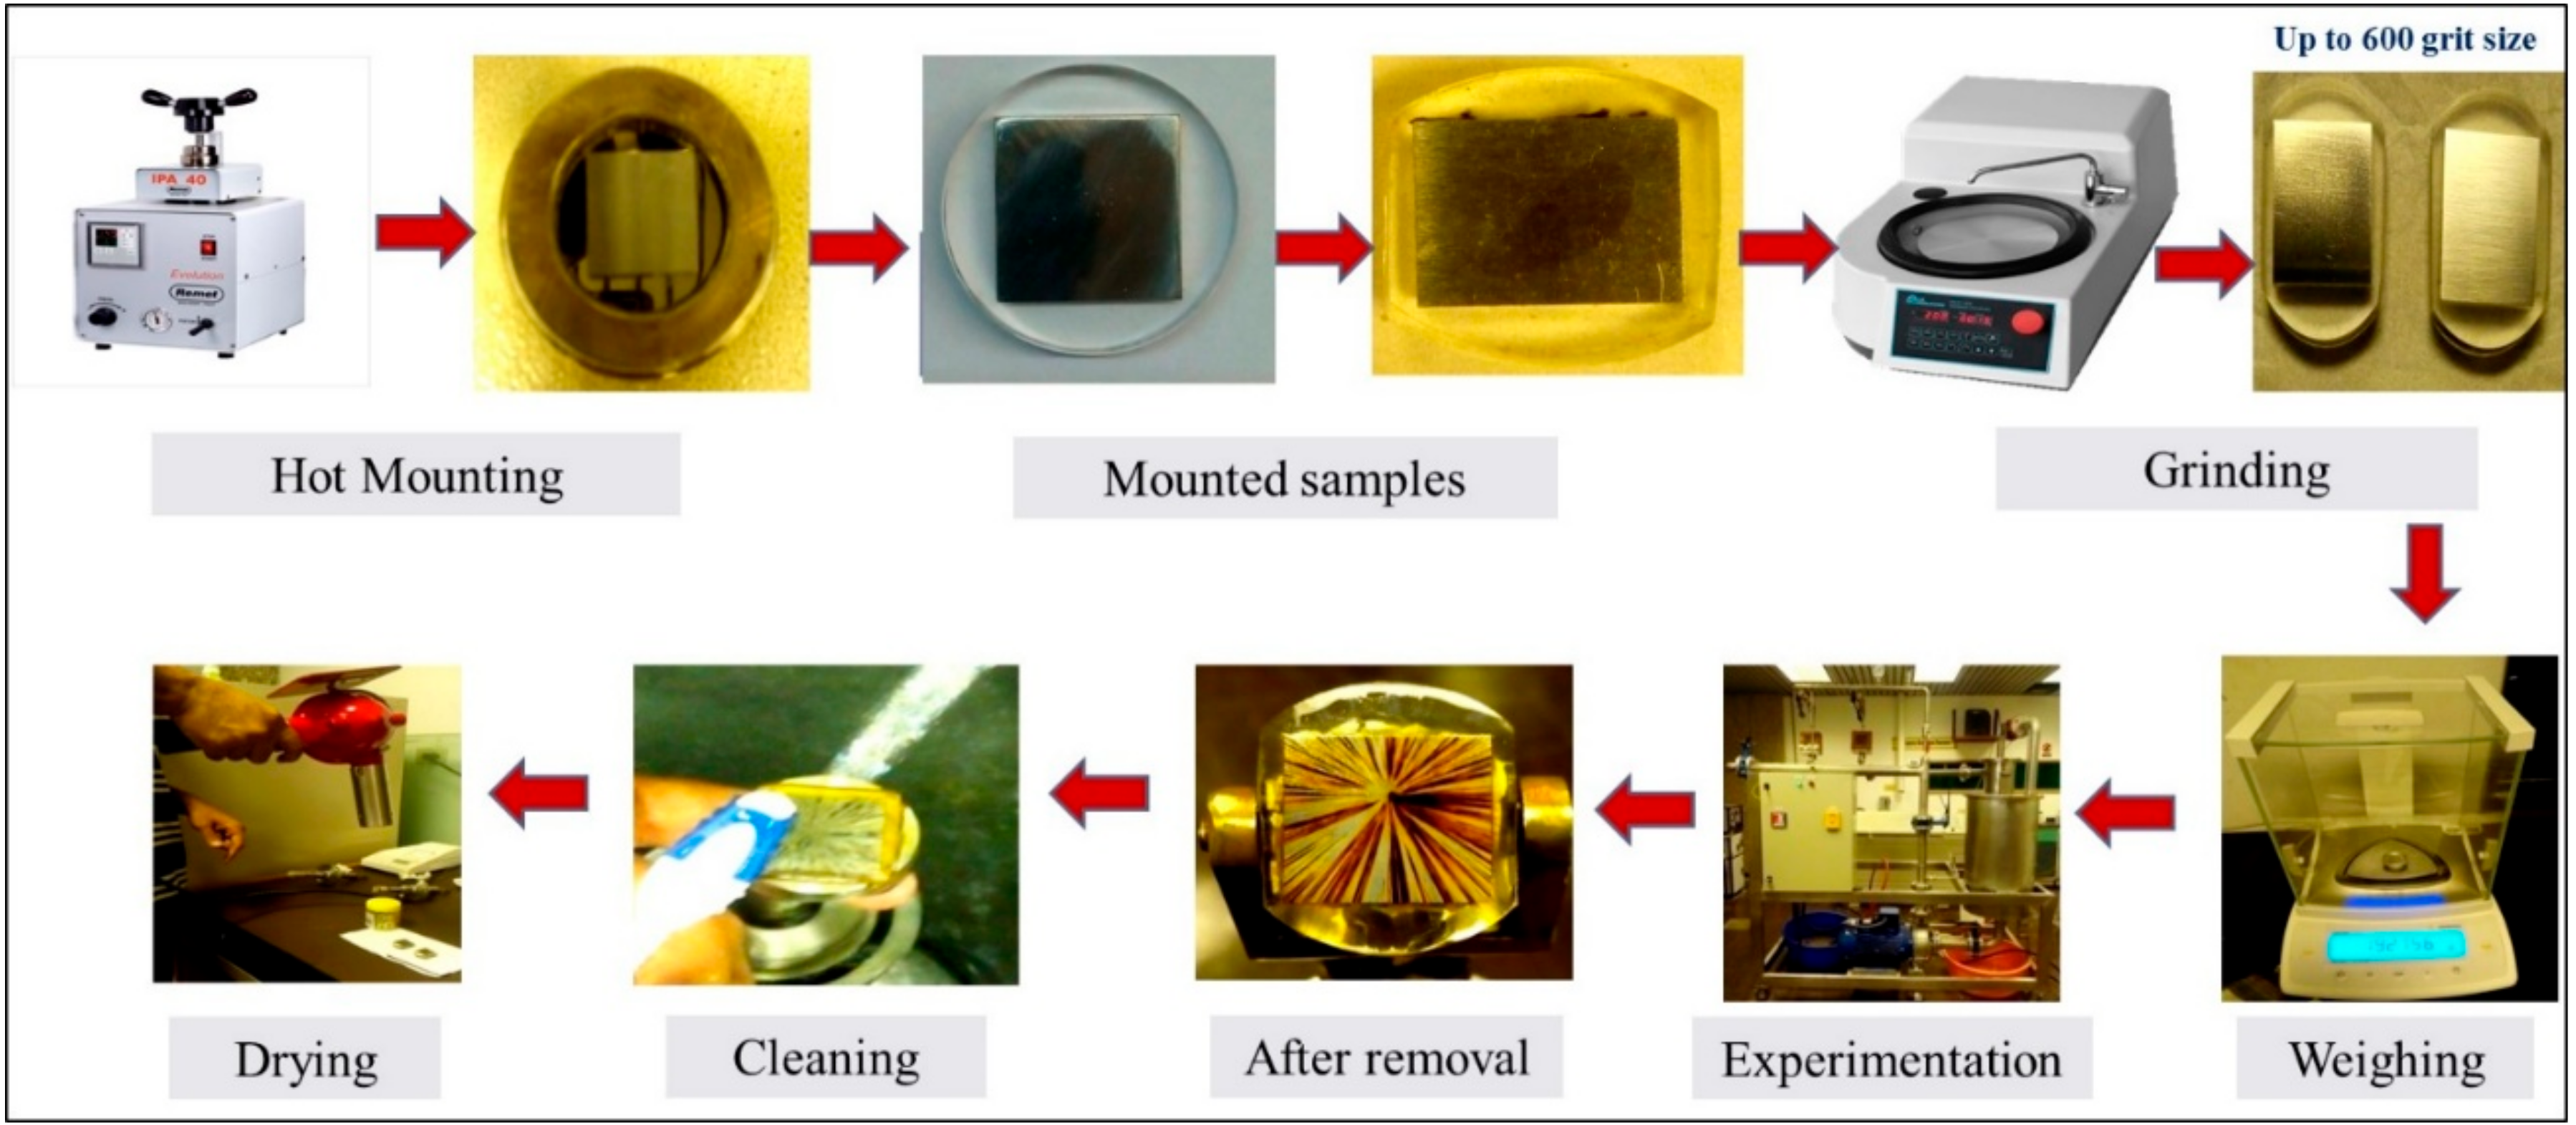
Table 1 shows the composition of pipeline grade API 5L-X65 carbon steel used in this study. This material is one of the most commonly used piping material for transportation of fluids in petroleum, desalination and many other industrial applications due to its distinct physical properties. It has appreciable ductility, strength, weld-ability, and can be heat treated to achieve desired properties. Its average Vickers hardness (HV) was measured using a CSM Micro Combi hardness tester (Diamond indenter) under 2N load (P) over an indentation time of 10 s and was found to be 298 HV. The specimen preparation involved cutting, mounting and grinding. The specimens were cut into 20 mm × 20 mm × 5 mm dimension, hot mounted in Lucite material to expose only (20 × 20) mm2 surface area to the impinging fluid. The hot mounted specimens were ground up to 600 grit size paper. The samples were cleaned with acetone, rinsed with distilled water and subsequently dried with a drier before conducting each experiment. The specimens were weighed to an accuracy of 0.01 mg. Figure 2 gives an overview of the whole process of specimen preparation.
Sand particles with an average particle size of 314 µm were used for erosion corrosion investigations. These silica sand particles were from Riyadh region of Saudi Arabia and supplied by a local company, based in Jeddah.

2.3. Test Procedure

Erosion corrosion tests were performed according to ASTM-G-73-98 and tap water from sweat water line was used to prepare the solution for experiments. The solution tank (Figure 1) was filled with an approximately 69 L of 0.2 Mol NaCl solution. The specimens were hot mounted, ground to 600 grit size SiC paper and subsequently weighed before fixing in the test cell. The specimens were fixed in an-inhouse designed specimen holder (Figure 1) inside the test chamber under a 3 mm circular nozzle for fluid impingement. Erosion corroison experiments were carried out at three different velocities (3 m/s, 6 m/s, and 12 m/s) and at five different impingement angle (15°, 30°, 45°, 60° and 90°) for a duration of 24 h. After each experiment, the specimens were cleaned using a soft toothbrush to remove any loosely attached corrosion products, subsequently cleaned using acetone, rinsed in distilled water and dried with a drier (Figure 2). The weight before and after the experiments was measured using a digital balance up to 0.01 mg and erosion corrosion rate calculation was done as per equation 1 based on ASTM G1-03 standard. The K is a contact to have the corrosion rate in desired units and a value of 3.45 × 10⁶ was used in these calculations. Each experiment was performed thrice under each experimental condition for data repeatability.
Corrosion   Rate   =   Weight   loss   ( mg / g )   *   K Density   of   sample   ( g / cm 3 )   *   Exposed   Area   ( cm 2 )   *   Exposure   time   ( hr )

3. Results and Discussion

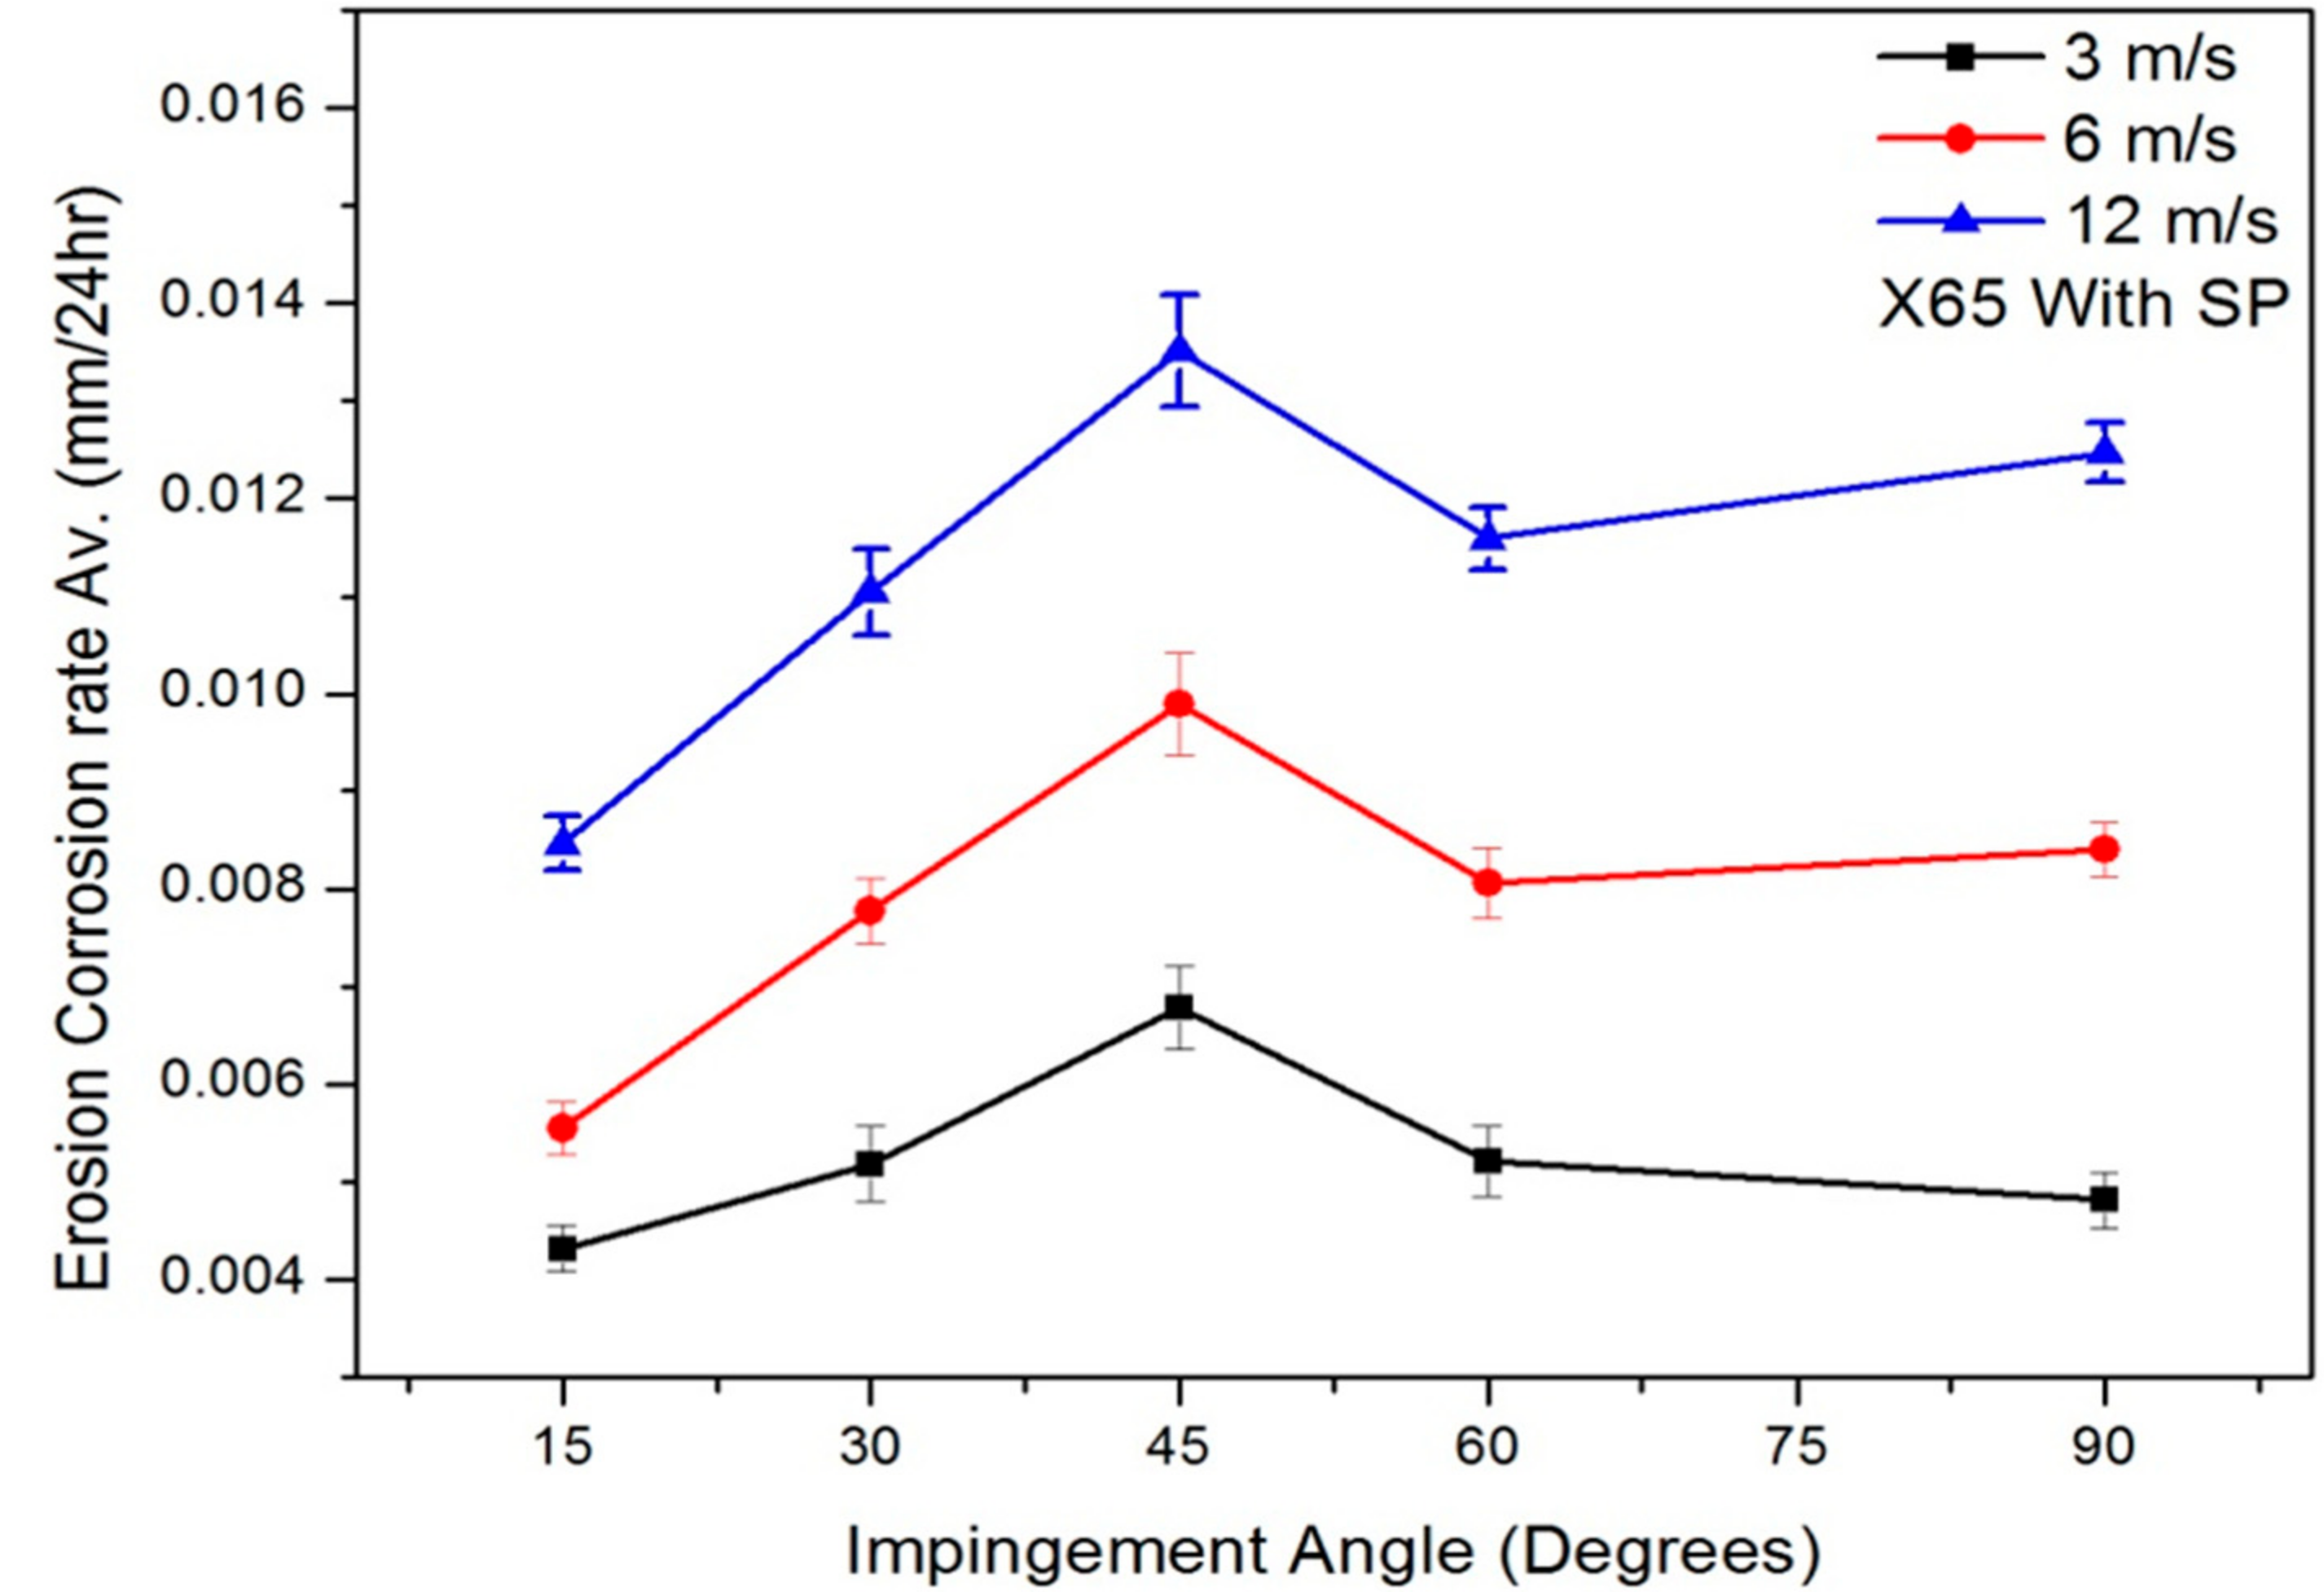
3.1. Effect of Impact Angle and Velocity on Corrosion Rate

Figure 3 shows the corrosion rate (without solid particles) of API 5L-X65 carbon steel as a function of impingement angle at three different velocities. The maximum and minimum corrosion rates were observed at 45° and 90° angles respectively. It is reported in the published literature that both the shear and normal stress play a vital role during fluid impingement and shear stress is dominant at lower angles and vice versa [8]. The highest corrosion rate observed at 45° is due to the balance between shear and impact force [8]. Corrosion rates were increased with an increase in velocity, though overall trend remains the same at all velocities. There was no significant difference in the corrosion rate between 3 m/s and 6 m/s, however, corrosion rate was significantly increased at 12 m/s, which is due to an increased wall shear stress values at this velocity. The shear stress is reported to be one of the important factors, which increases the corrosion rate at high fluid jet velocities. This finding, which is reported extensively in research, states that mass transport of oxygen increases with an increase in fluid velocity and that will increase the corrosion rate of the material [16].

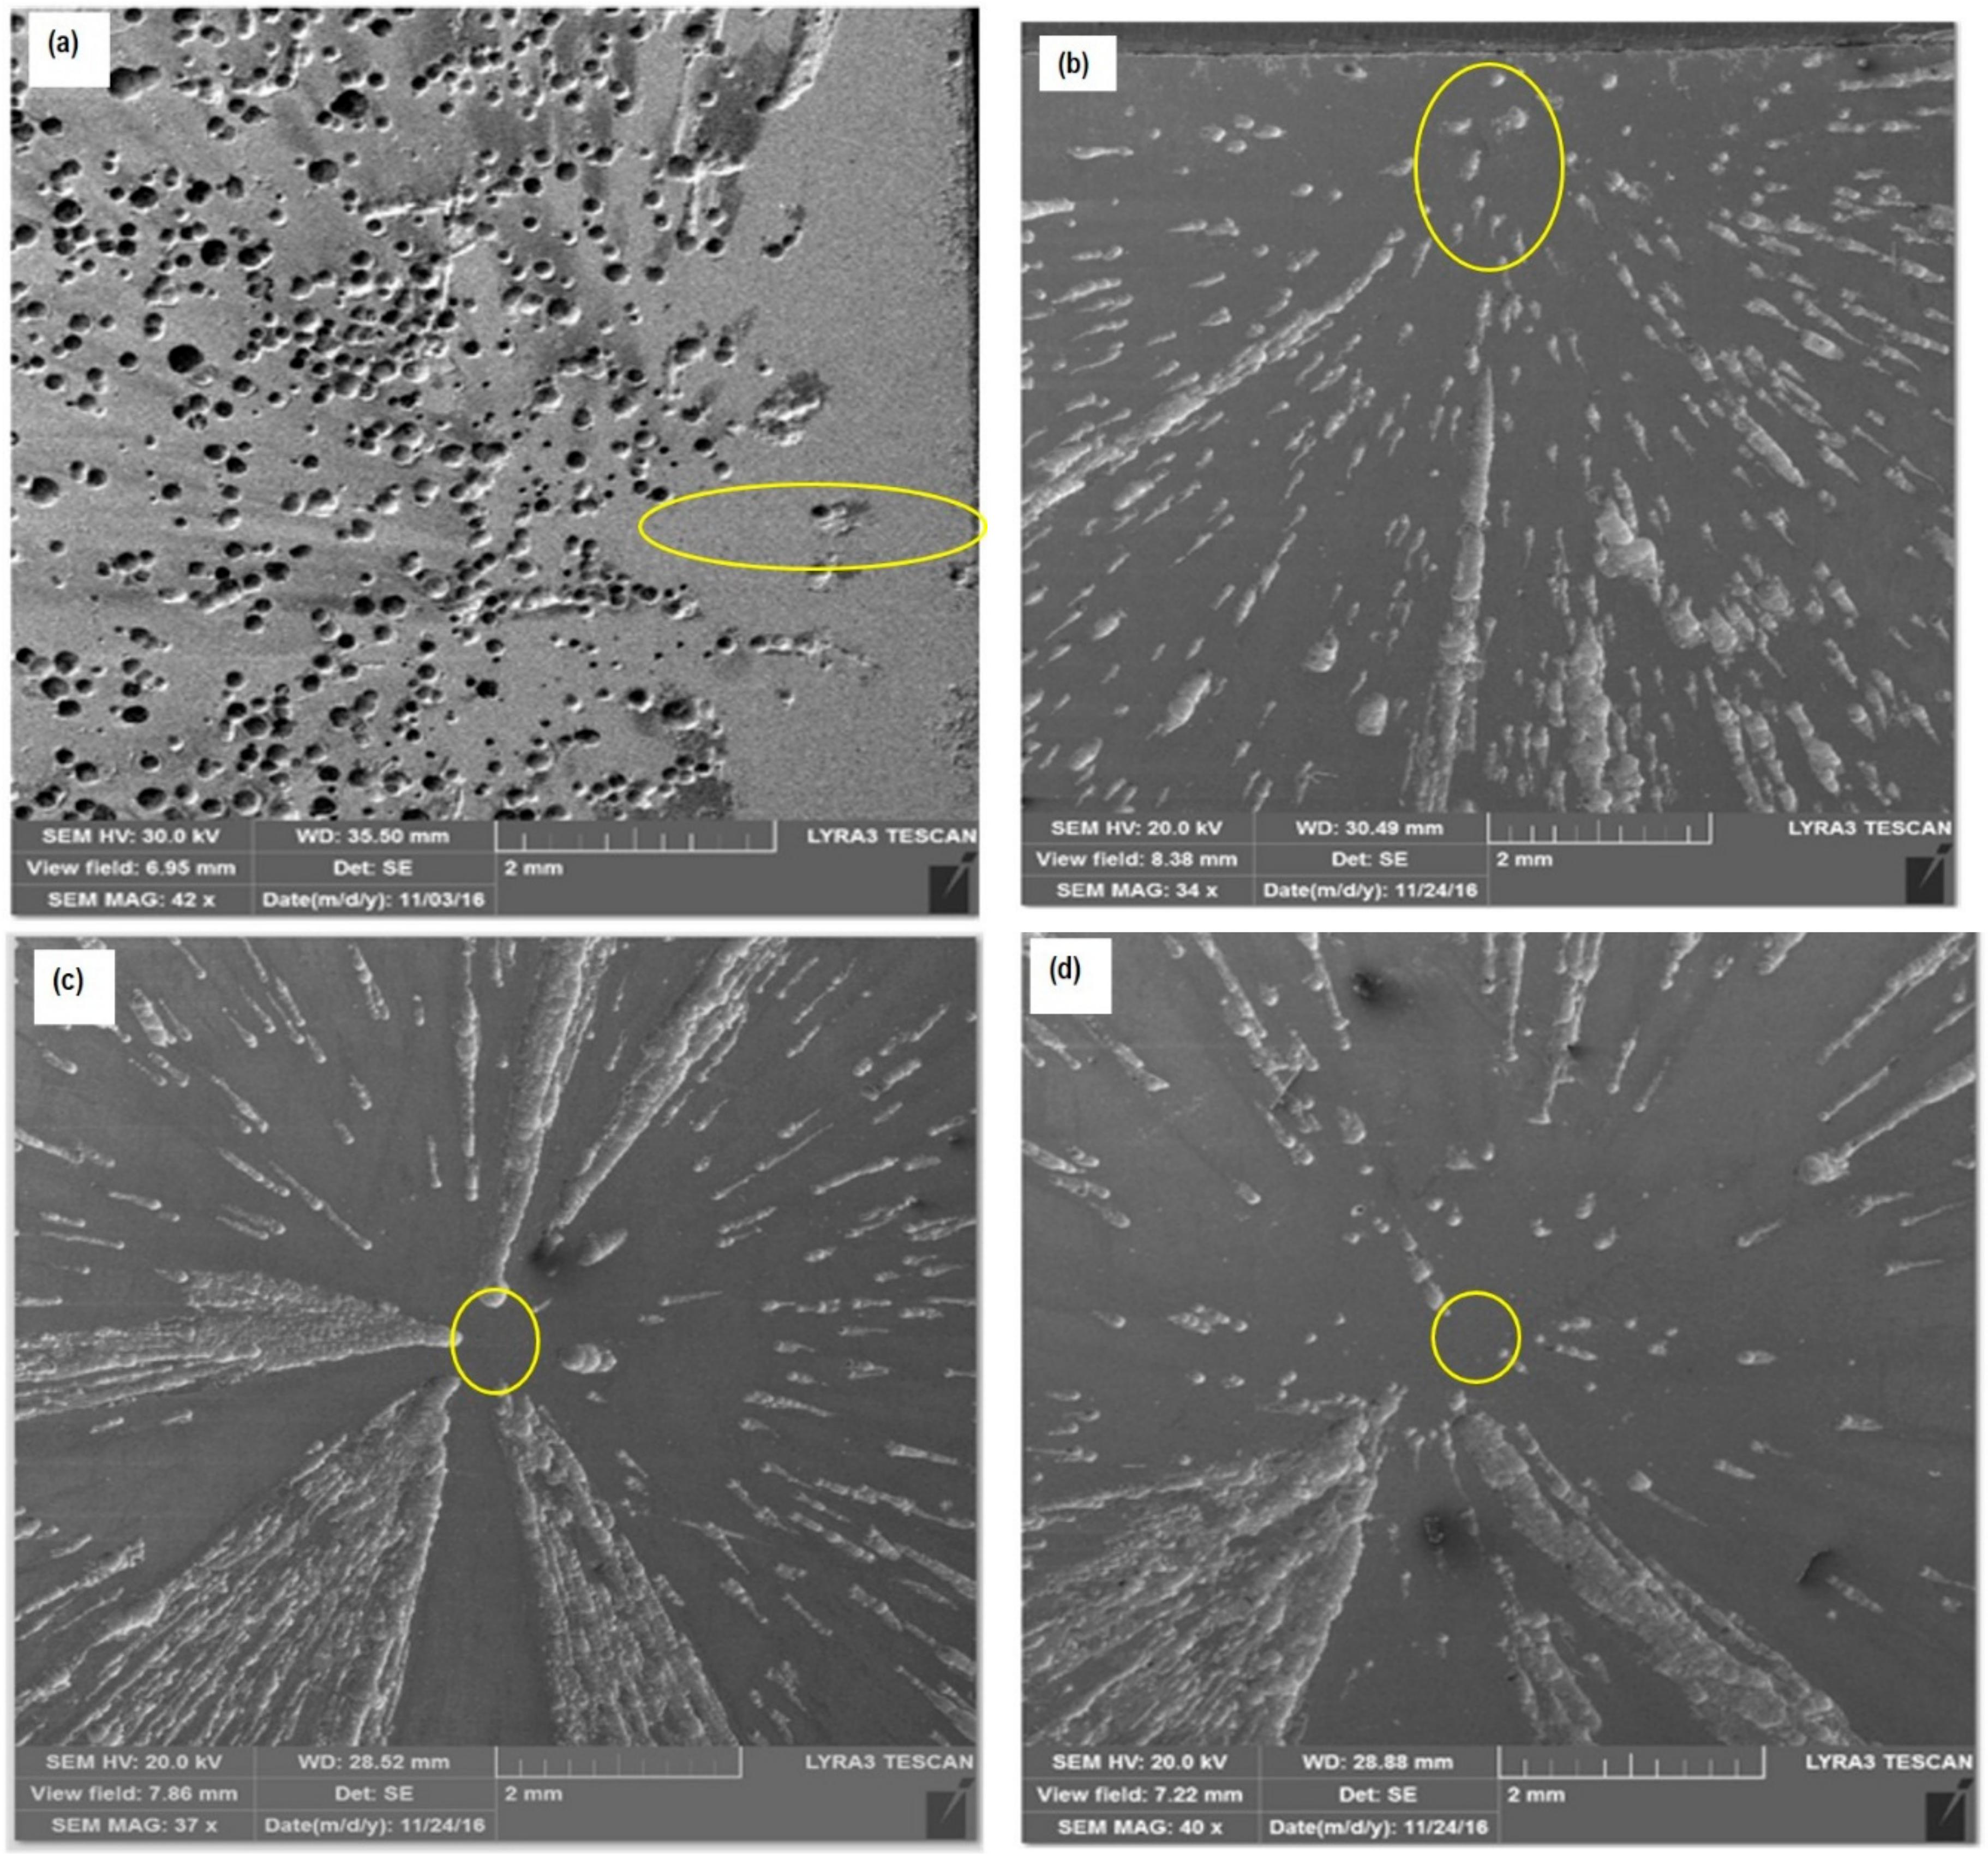
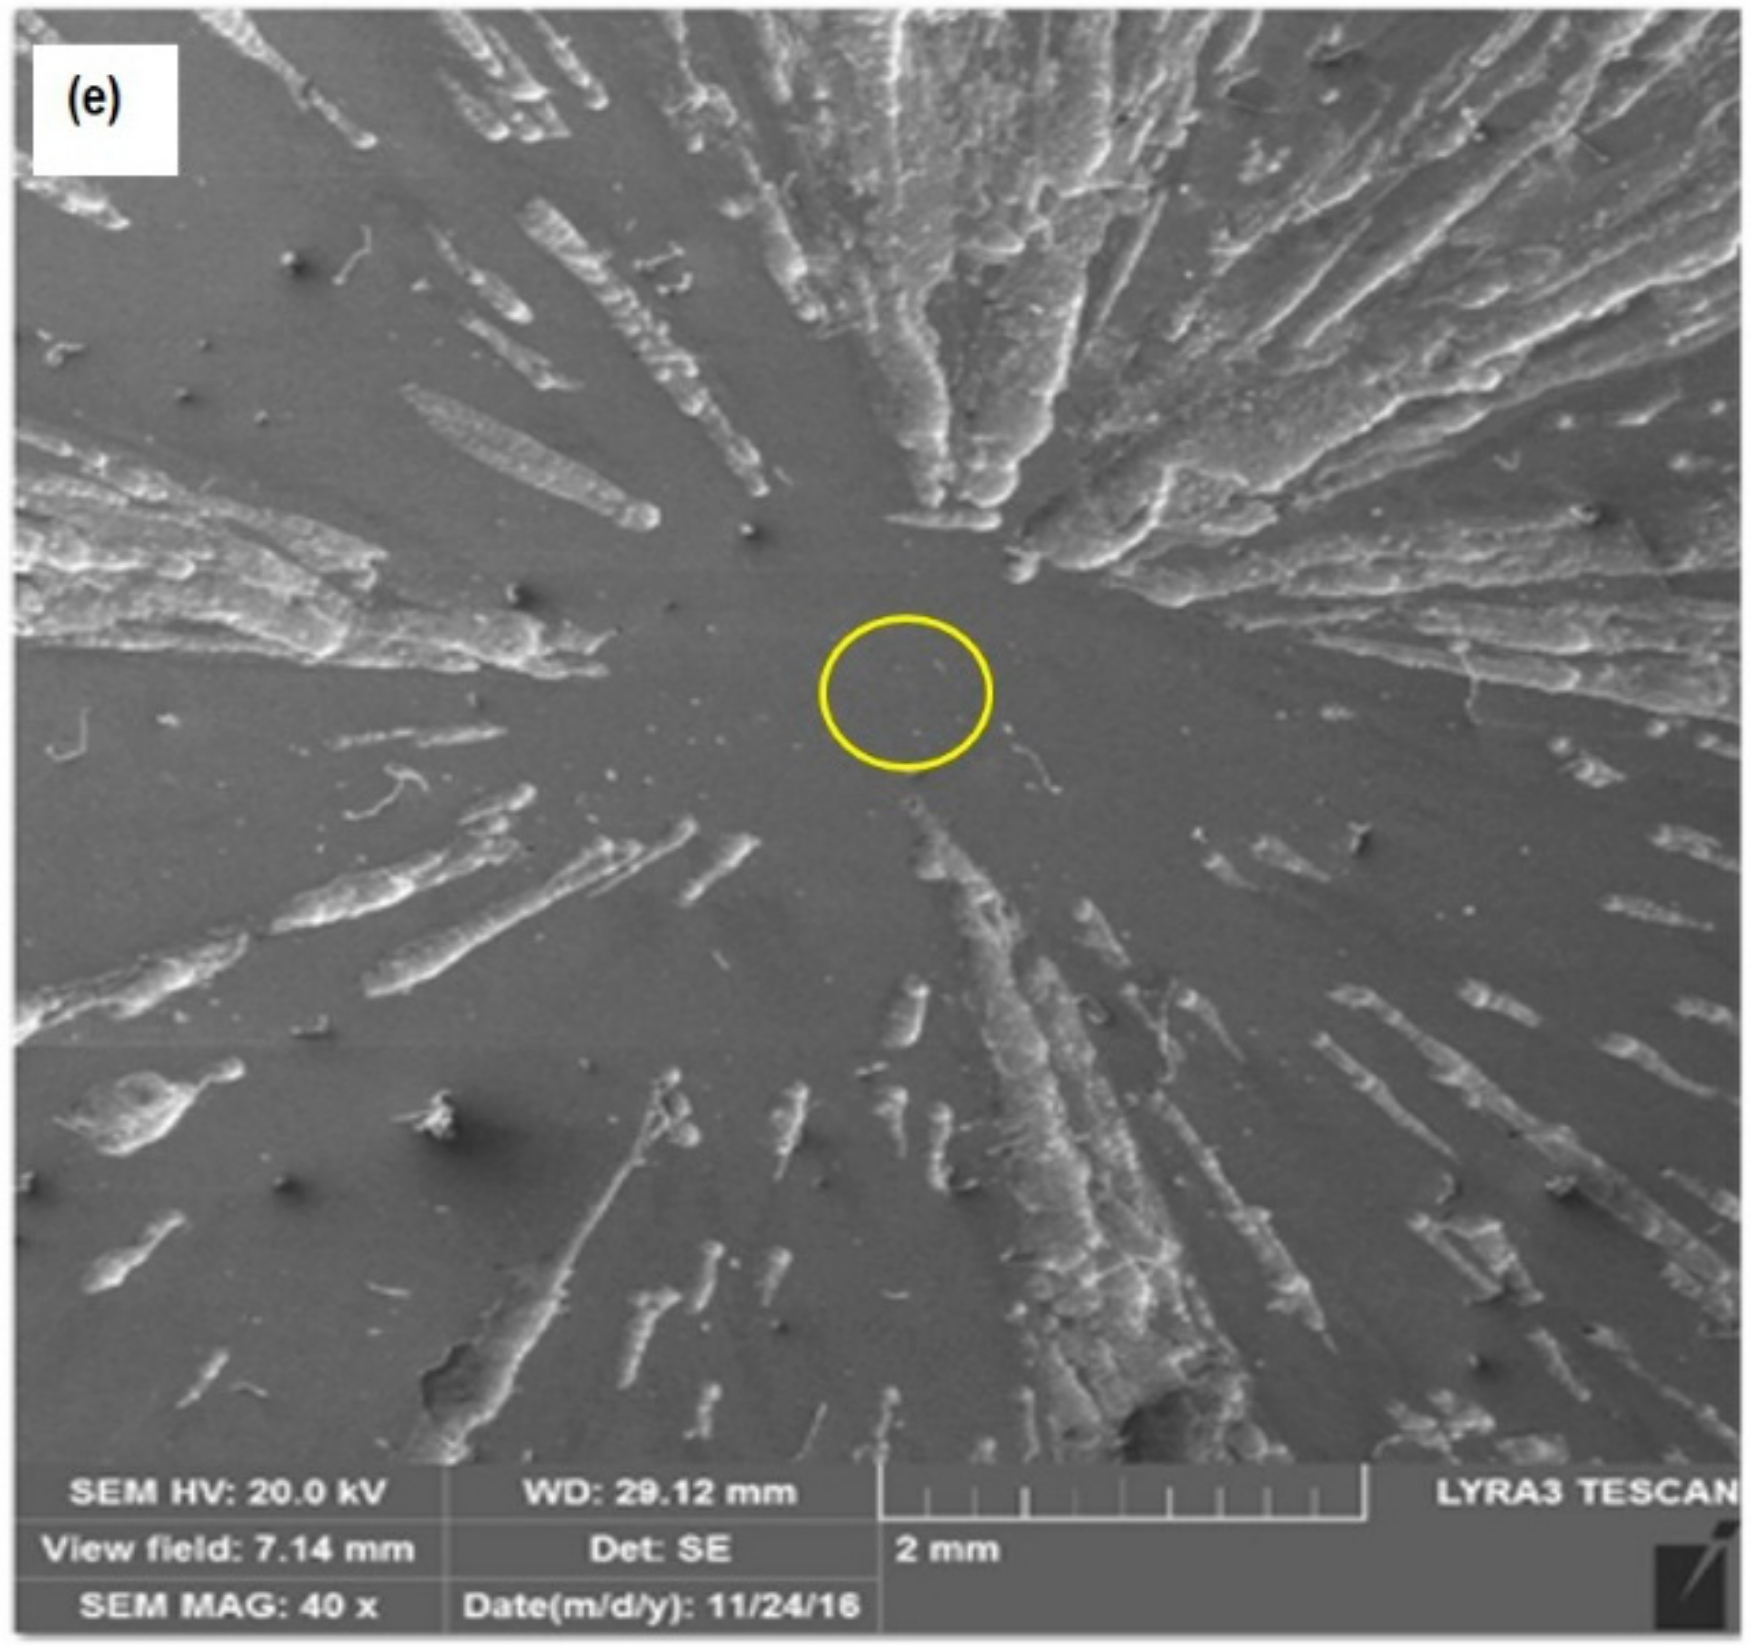
Surface Morphology of Corroded Surfaces

Surface morphologies of corroded specimens were examined using FE-SEM as shown in Figure 4a–e. It is interesting to note that corrosion pattern and wear scar morphology was changed with impingement angle indicating that different stresses are acting at different angles. Impingement points (circled in Figure 4a–e) changed from elliptical at lower angles to more round/circular at higher angles. Figure 4a shows the presence of plate-like circular holes in specimens eroded at 15°. This was because of the fact that the corrosive slurry attacked the target material surface locally at this angle. On the other hand, the fluid has its maximum velocity and forms a wide stagnant layer which by covering the entire surface of the specimen promotes susceptibility towards localized material loss/corrosion [17]. The wear scars were found to be neither continuous nor deeper and observed to have gaps among each other in the direction of the fluid movement. Figure 4a,b show an elliptical to circular morphology at the impingement point which can be attributed to the maximum tangential force/or shearing stress at lower angles. With an increase in impingement angle, normal impact/extrusion force was increased as well. The wear scars observed at 30° were found to be wider, deeper and continuous as compared to those observed at 15° as shown in Figure 4b. The electrolyte stagnation may have occurred which ultimately resulted in pitting [4]. However with continued fluid flow of high shear stress, elongated corrosive wear scars were observed. At 45° impingement angle, number of wear scars and the total affected area was much more when compared both with lower than and higher than 45° (Figure 4c) angle. The wear scars were found to be continuous. As the impingement angle was increased (>45°), normal impact component became dominant. At 60° angle, the wear scars were less in number and shallower in depth (Figure 4d). On the other hand, at 90° angle the normal stress component was maximum and after the impact, the fluid does not have enough energy to erode the surface deeper (Figure 4e).

3.2. Erosion Corrosion and Mechanism

Figure 5 shows the erosion corrosion rate (with solid particles) of API 5L-X65 carbon steel, as a function of impingement angle and velocity. The trend observed was similar to the one observed in Figure 3, however the values of erosion corrosion rates were higher than the ones without the presence of solid particles. The fluid jet velocity is an important parameter which can increase the erosion-corrosion rate and both are related through a relationship E = K(V)n. In this equation, E is the erosion rate, K is the material constant (K depends on particle size and impact angle), V is the fluid velocity, and n is the velocity exponent. The value of n in the case of slurry erosion corrosion was reported to be around two [18]. Both the horizontal and vertical components of kinetic energy play a vital role during erosion corrosion of the materials. It is reported that vertical component of kinetic energy (KE) is responsible for the solid particle’s penetration into the material, while horizontal component controls the ploughing during erosion corrosion experiments [18].
Figure 6a,b shows that longer erosion scars of ploughing were observed at oblique angles of 15° and 30°, suggesting that horizontal component of KE was dominant at these angles. Another observation is that larger surface area is affected by abrasive particles at lower angles than at higher angles. Severe plastic deformation together with deep ploughing and increased surface activation was observed at 45° angle, which was mainly due to the balance between shear and normal impact stress. The effect of microcutting was not that significant at 60° as confirmed by the presence of shallow and shorter erosion scars. Some wider erosion scars were also observed due to an increased friction force of sliding abrasive particles and this resulted in high normal impact stress. At normal impingement angle, the particles hit the surface with maximum kinetic energy and imparted highest normal impact force which resulted in the formation of flakes and platelets. These flakes were subsequently removed due to multiple strikes of the incoming particles (Figure 6e). Furthermore, the erosion scars became wider and some micro cracks also found at higher angles because of increased surface hardness due to work hardening. After multiple strikes of the sand particles, average hardness was found to be 303 HV and slight increase in weight loss was observed after 60° angle.

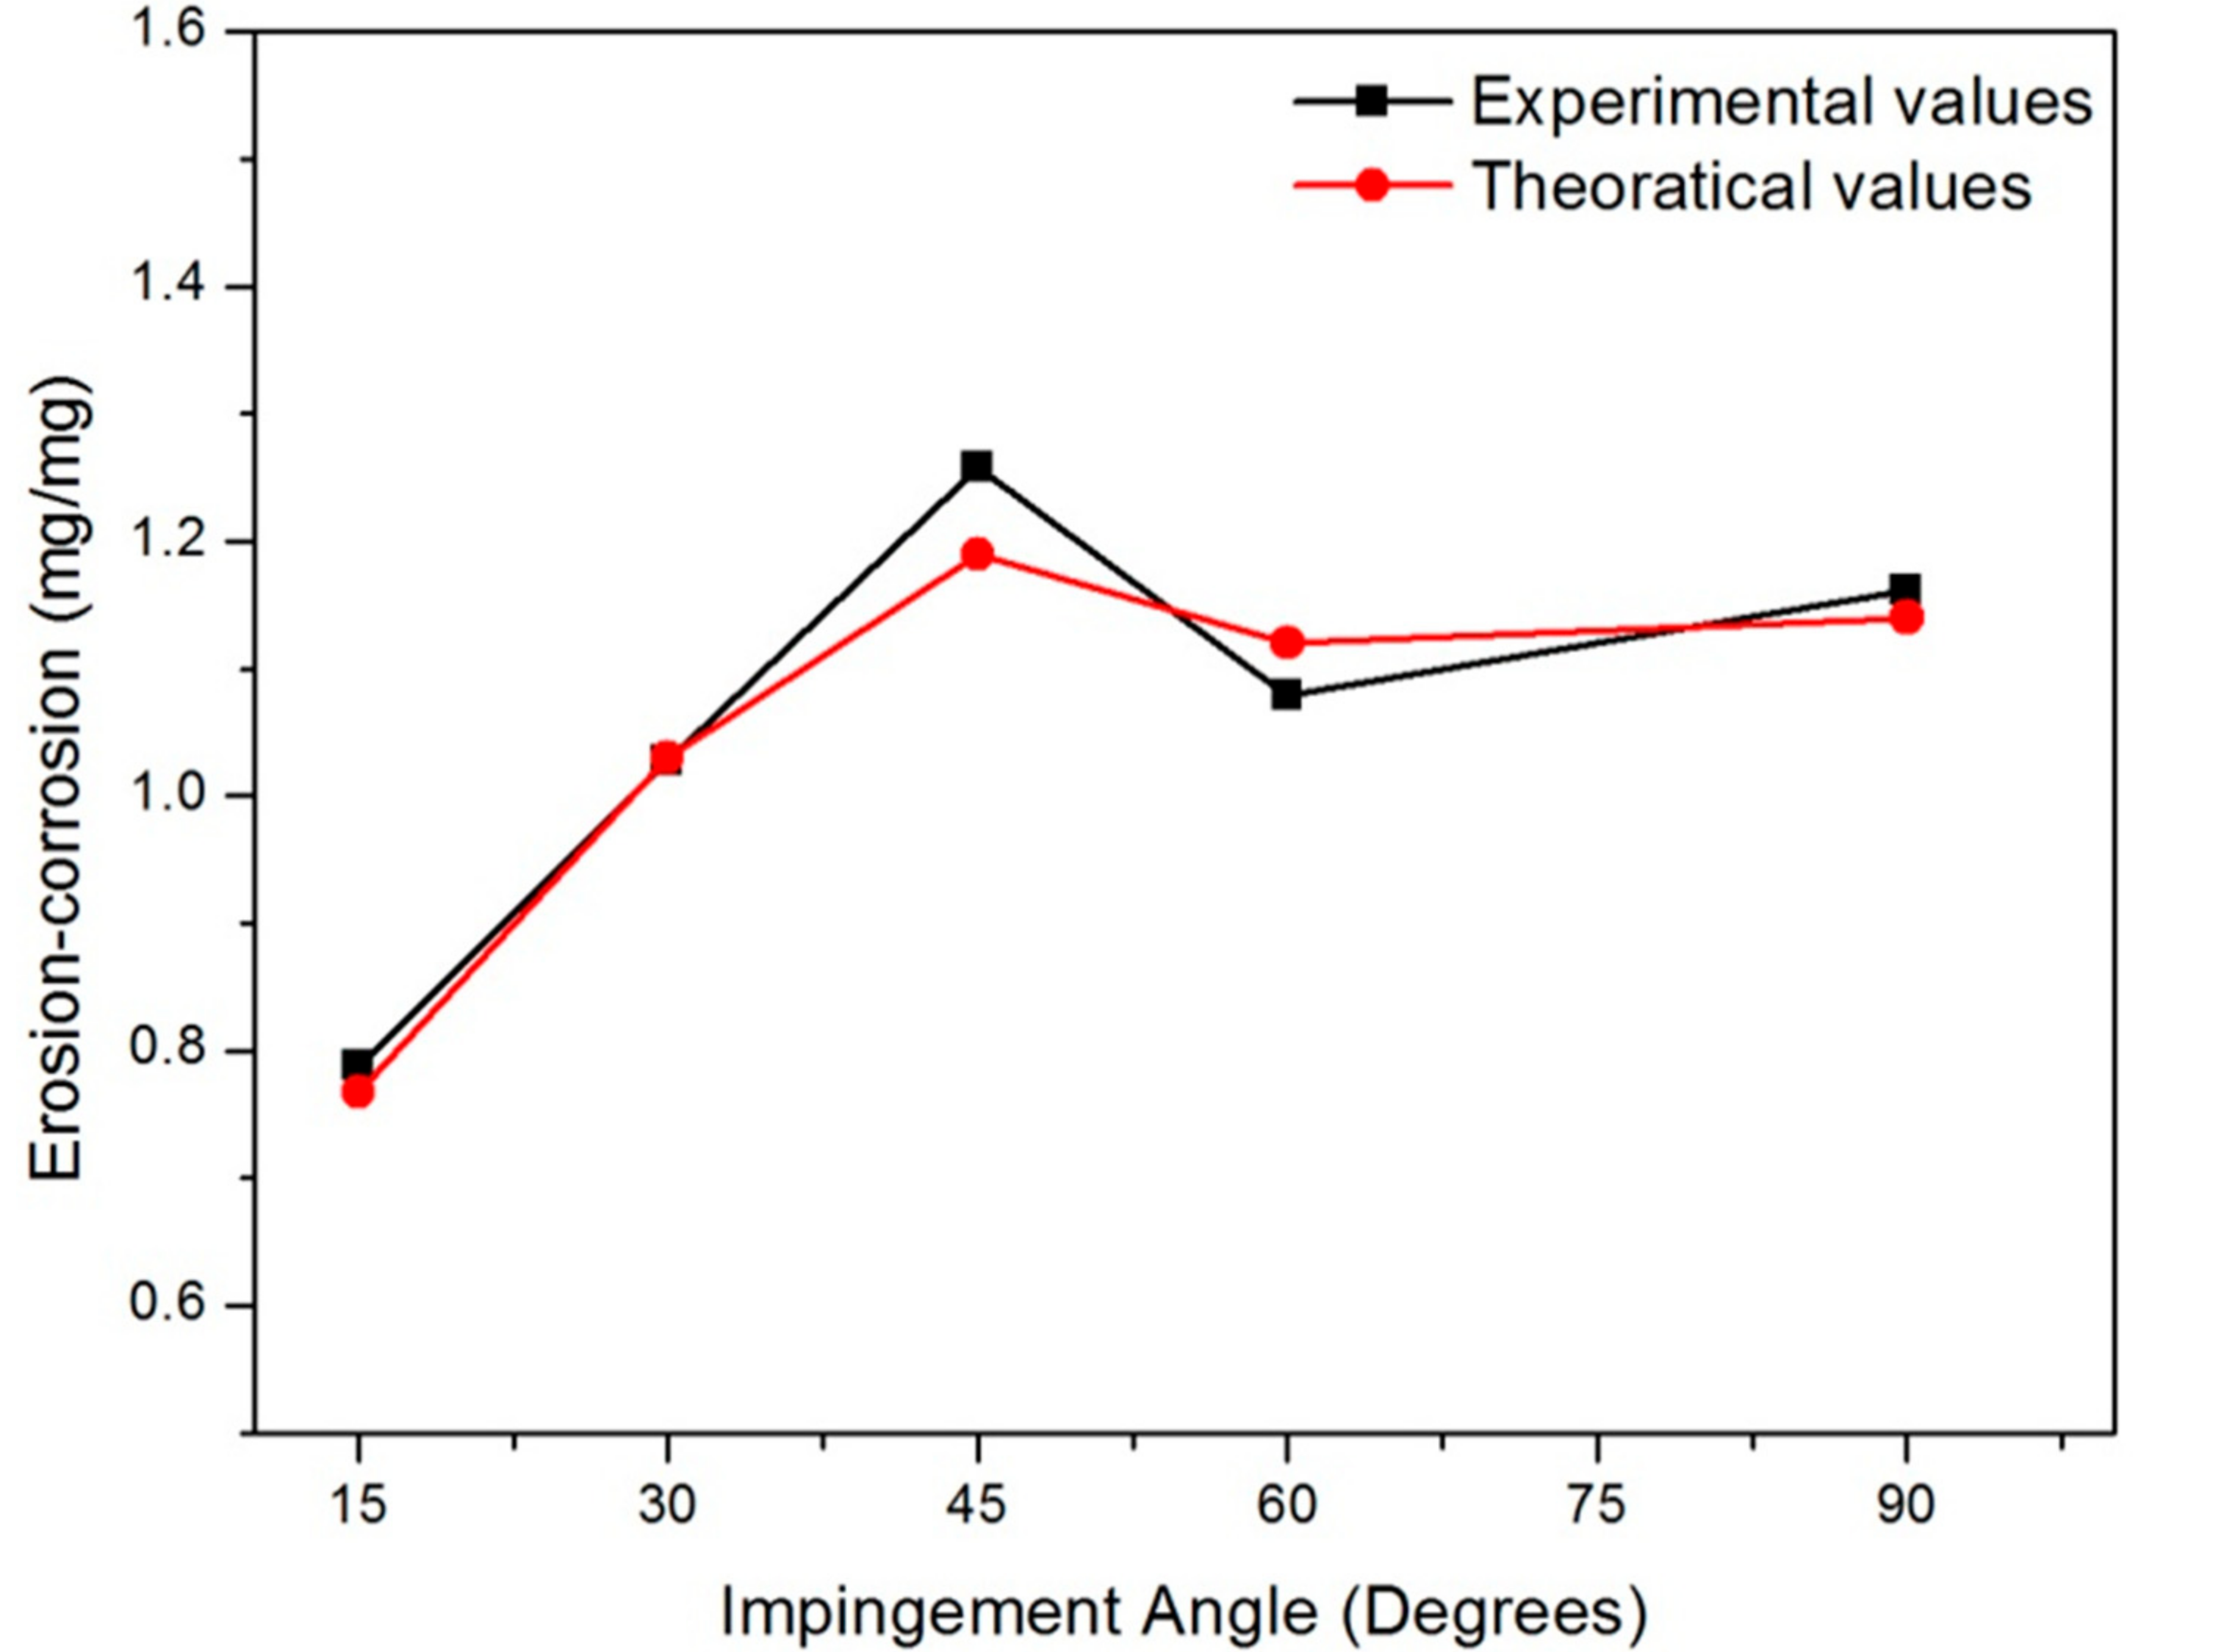
3.3. Correlation with Erosion Corrosion Model

Correlations are important to develop reliable erosion corrosion prediction models. The prediction models presented as a function of impingement velocity, angle, particle size/shape and substrate material properties [19,20,21,22]. One of the early erosion prediction models was the one developed by Finnie et al. [18]. The model shows the following relationship;
ER   =   A F s V n f ( θ )
where ER is the erosion rate (mg/mg), A is an empirical constant, V is the particle impingement velocity, and n is an empirical coefficient. It was reported that a value of 1.73 can be used safely for the empirical coefficient for various oilfield materials [23]. Fs is a particle shape coefficient and it is equal to 1 for angular sand particles. While f(θ) is a function of the impact angle as below;
f ( θ )   =   x cos 2 θ sin ( w θ )   +   y sin 2 θ   +   z
Whereas w, x, y, and z are empirical constants which depend on the material being eroded. The suitable values of the model constants for carbon steel, assuming V has units of ft/s are discussed elsewhere [23]. In this study, the impingement erosion data were correlated using above-mentioned model. The values of A and z were determined by performing a regression analysis using MATLAB software. Lower and upper bounds for A were found to be 0.012 and 0.0396 whereas for z, they were 0.428 and 0.572 respectively. Values of the correlation coefficients were found to be R2 > 99%, showing a good fit using the given parameters [23]. Furthermore, using known parameters as mentioned above, erosion rates were calculated at v = 12 m/s at 15° to 90° angles respectively. Figure 7 shows the comparison between experimentally obtained erosion rate versus the one calculated using Finnie’s model. The calculated erosion rate showed a good agreement with the present experimental data of API 5L-X65 carbon steel. It was deduced that Finnie’s model can be safely used to determine the erosion rate with a reasonable accuracy. However, the parameters for this model given and calculated are specific to current test materials and test conditions.

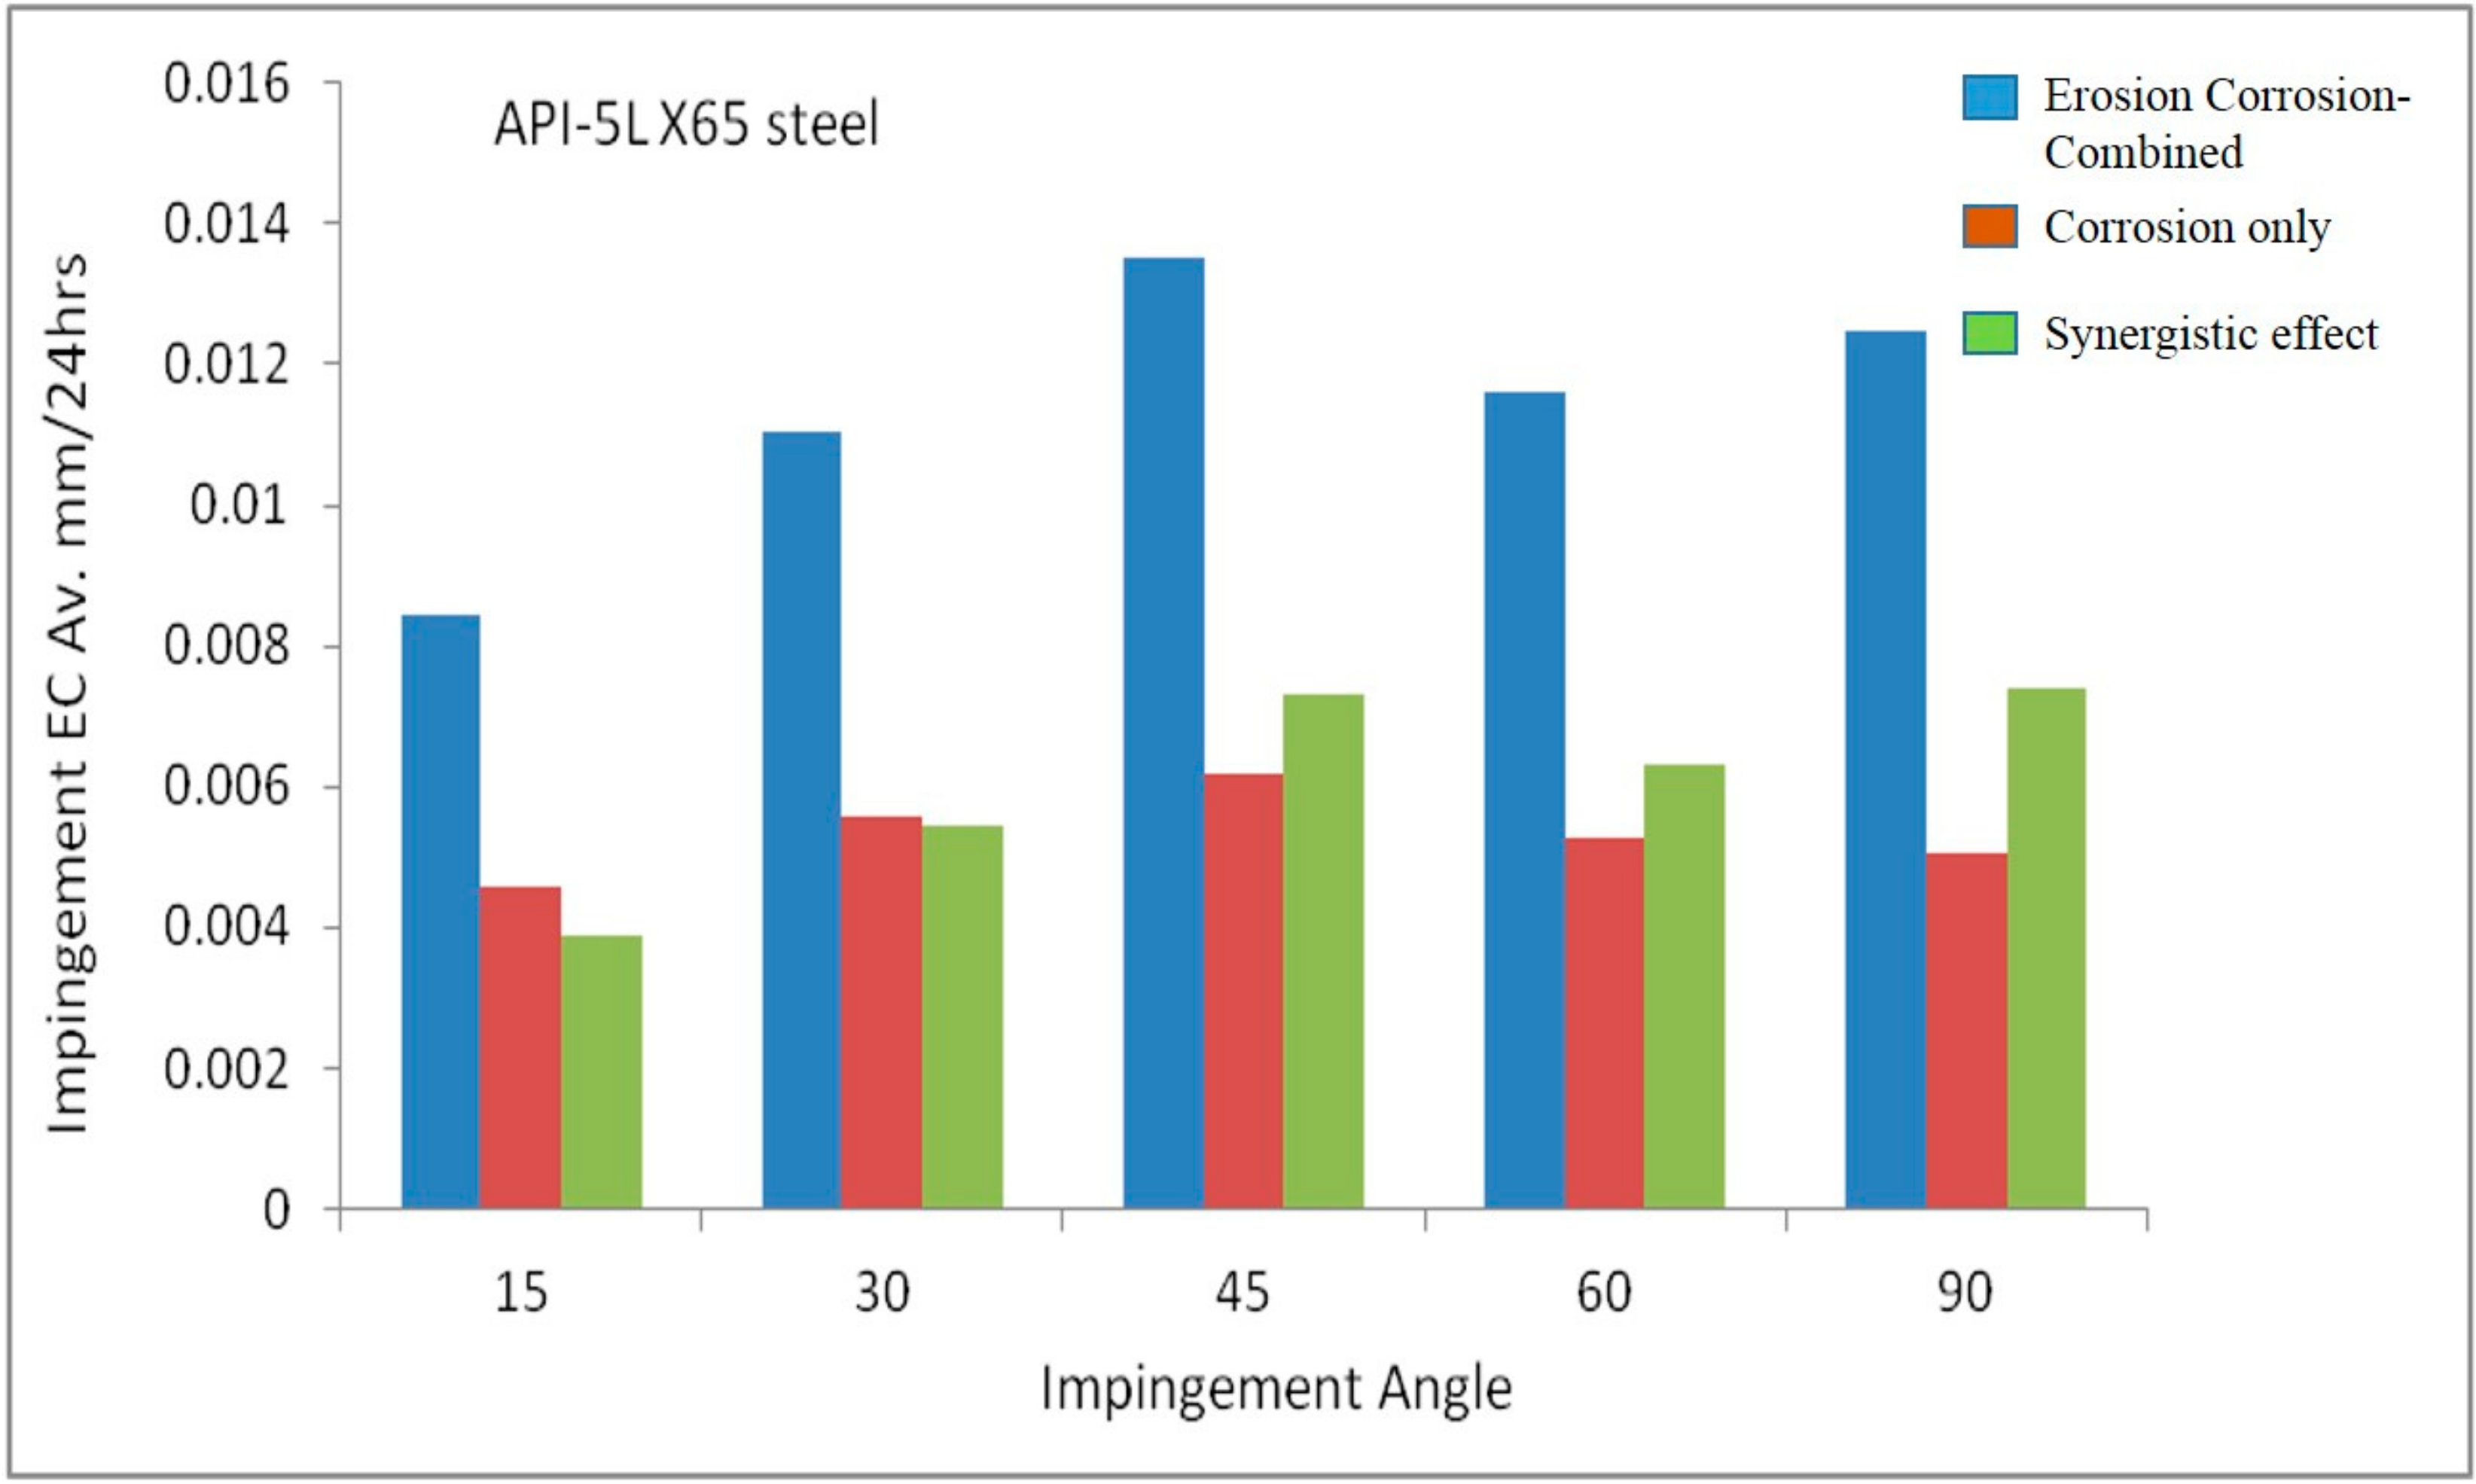
3.4. Effect of Erosion on Corrosion

Figure 8 shows the individual as well the combined effects of erosion-corrosion. It is clear that erosion has a considerable contribution to the overall material loss in terms of erosion corrosion. It was observed that the introduction of solid particles increased the erosion-corrosion rate of API 5L-X65 steel at all impingement angles. However, the synergistic effect at 45° and 90° angle was more significant as compared to other angles.
At 45° angle, particles penetrated much deeper into the specimens due to the combined effect of shear and impact stresses, which increased the erosion corrosion (Figure 8). It was found that at 90°, due to extensive extrusion and fracture of platelets, erosion enhanced the corrosion significantly. Corrosion rate was considered here as a pure corrosion damage (without solid particles) and solid particle effect was considered as erosion corrosion (the combined effect of erosion and corrosion). So the effect of erosion on corrosion was obtained by subtracting the corrosion values from total material loss observed during erosion corrosion experiments. With the introduction of solid particles, surface roughness was increased and that accelerated the localized attack. There was a close relationship between contact force exerted by the particles on the surface and predicted material degradation rate as reported elsewhere [24,25].

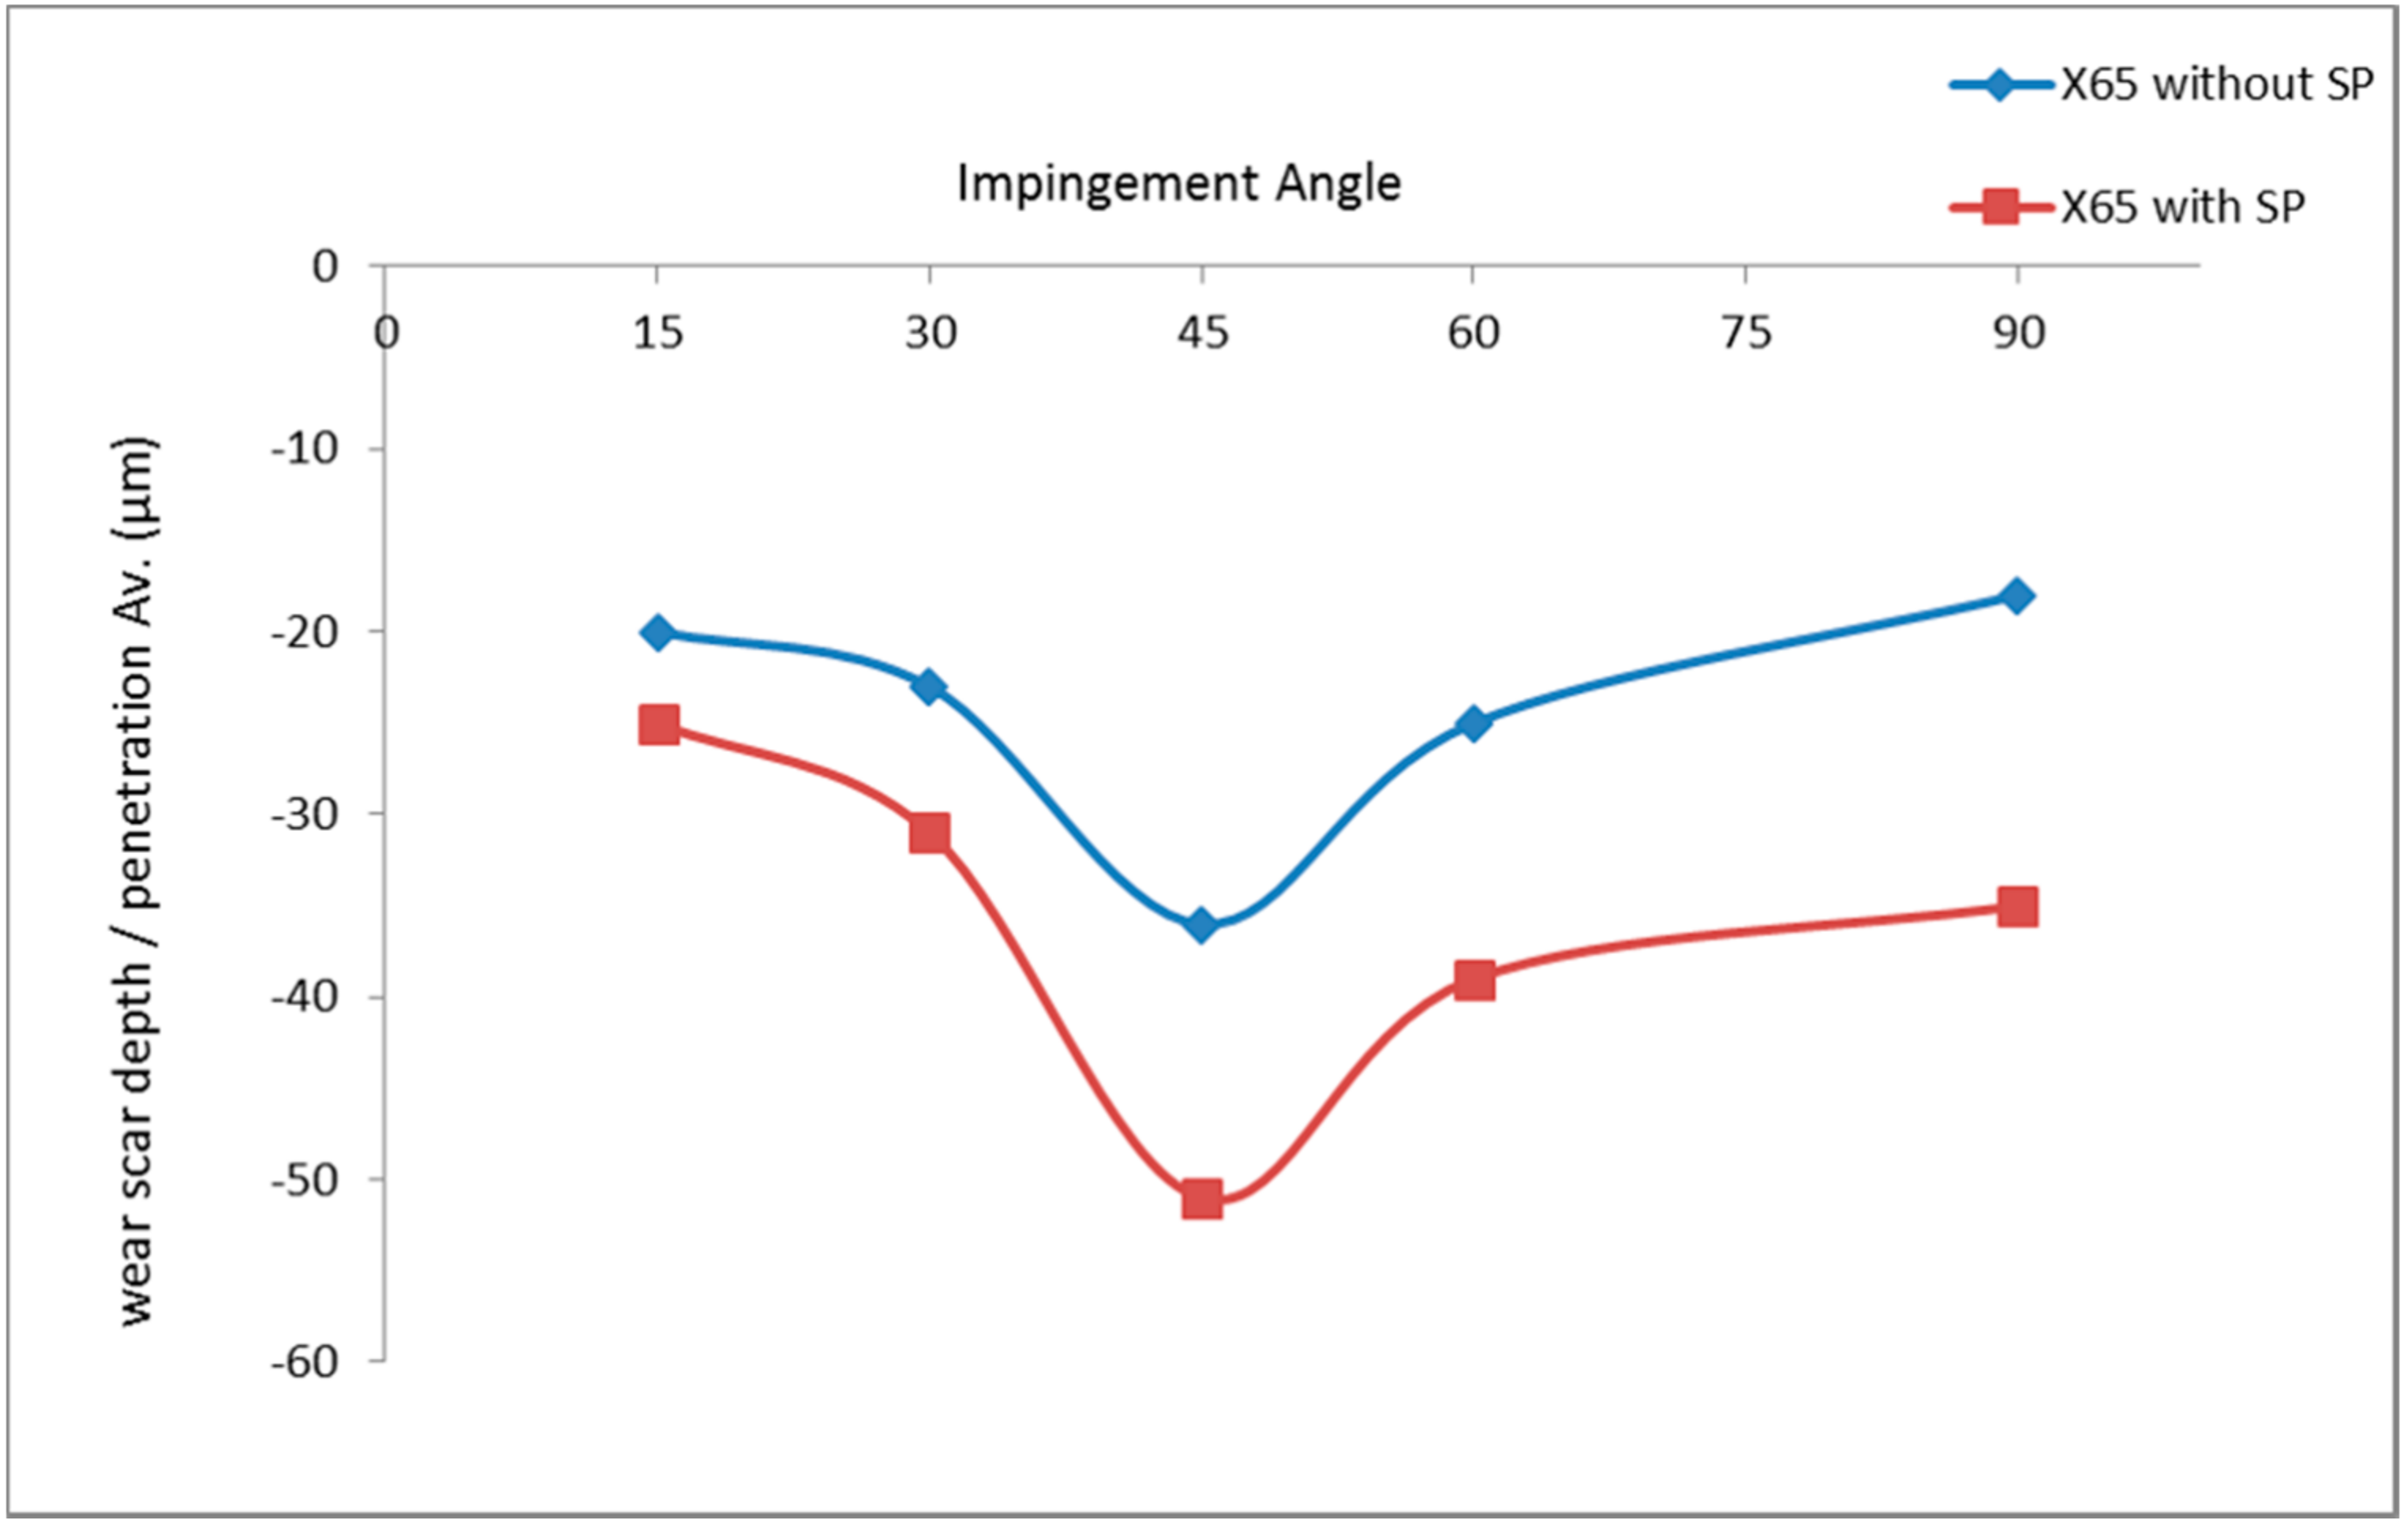
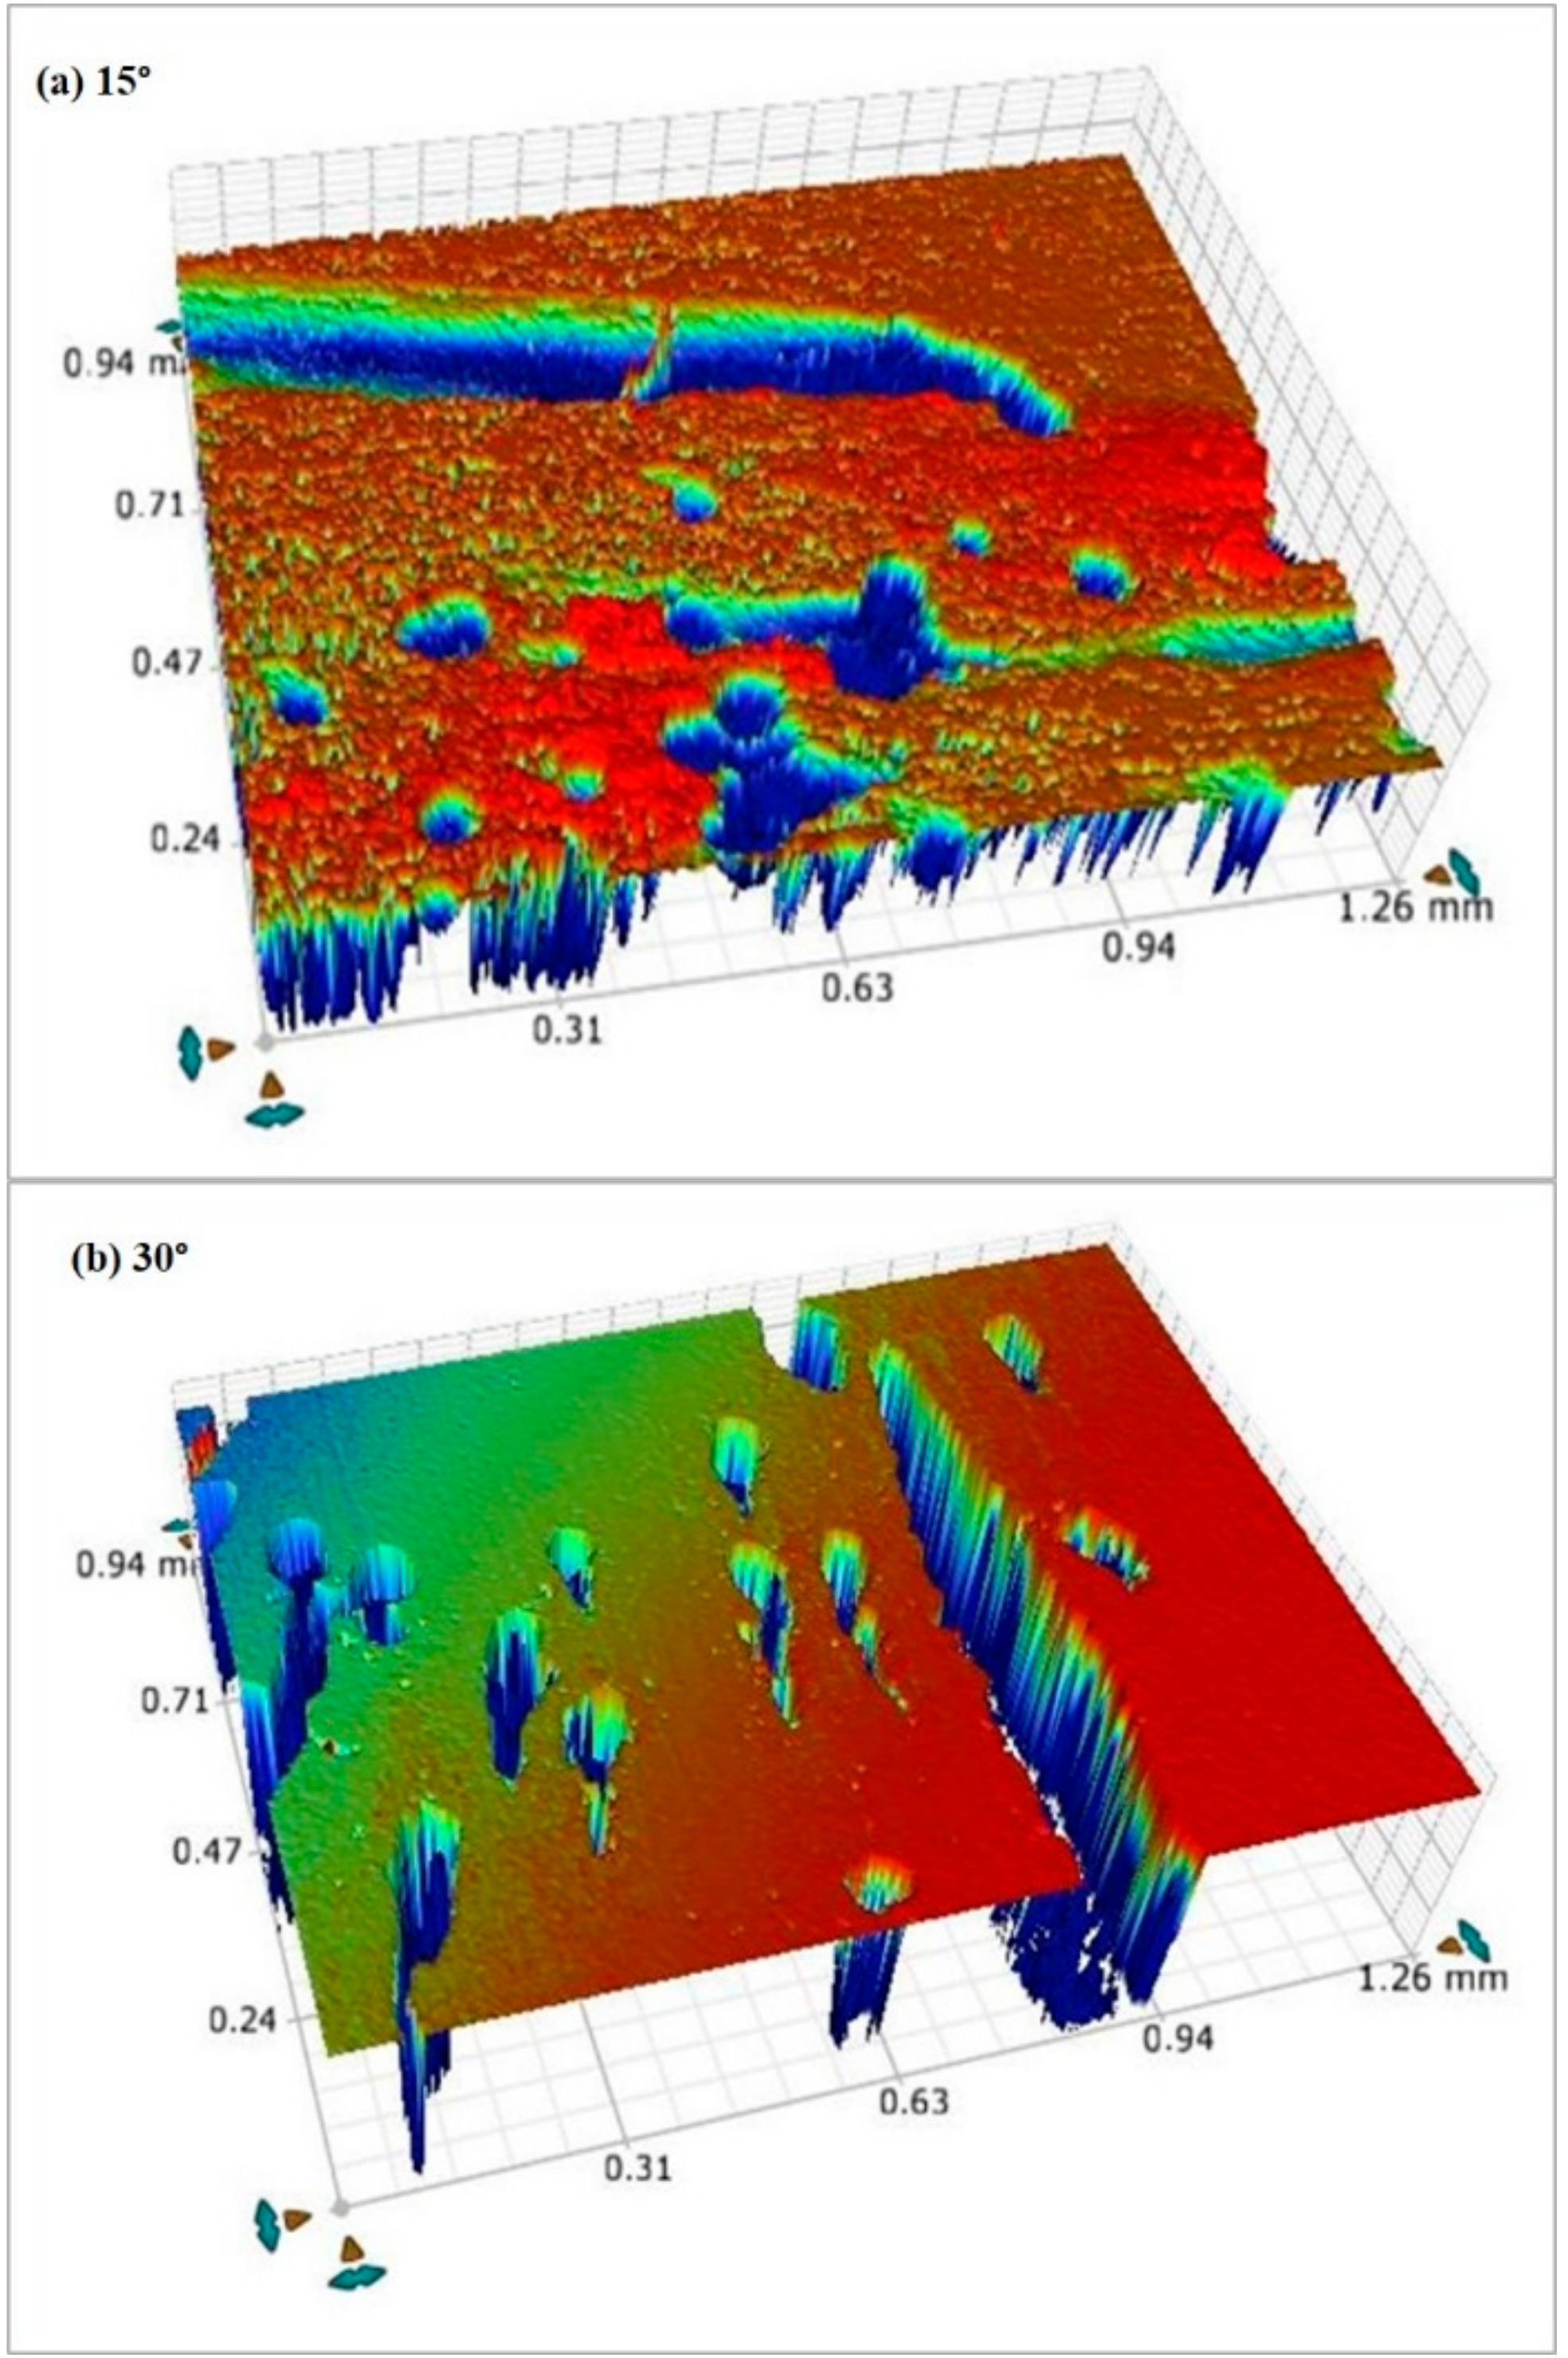
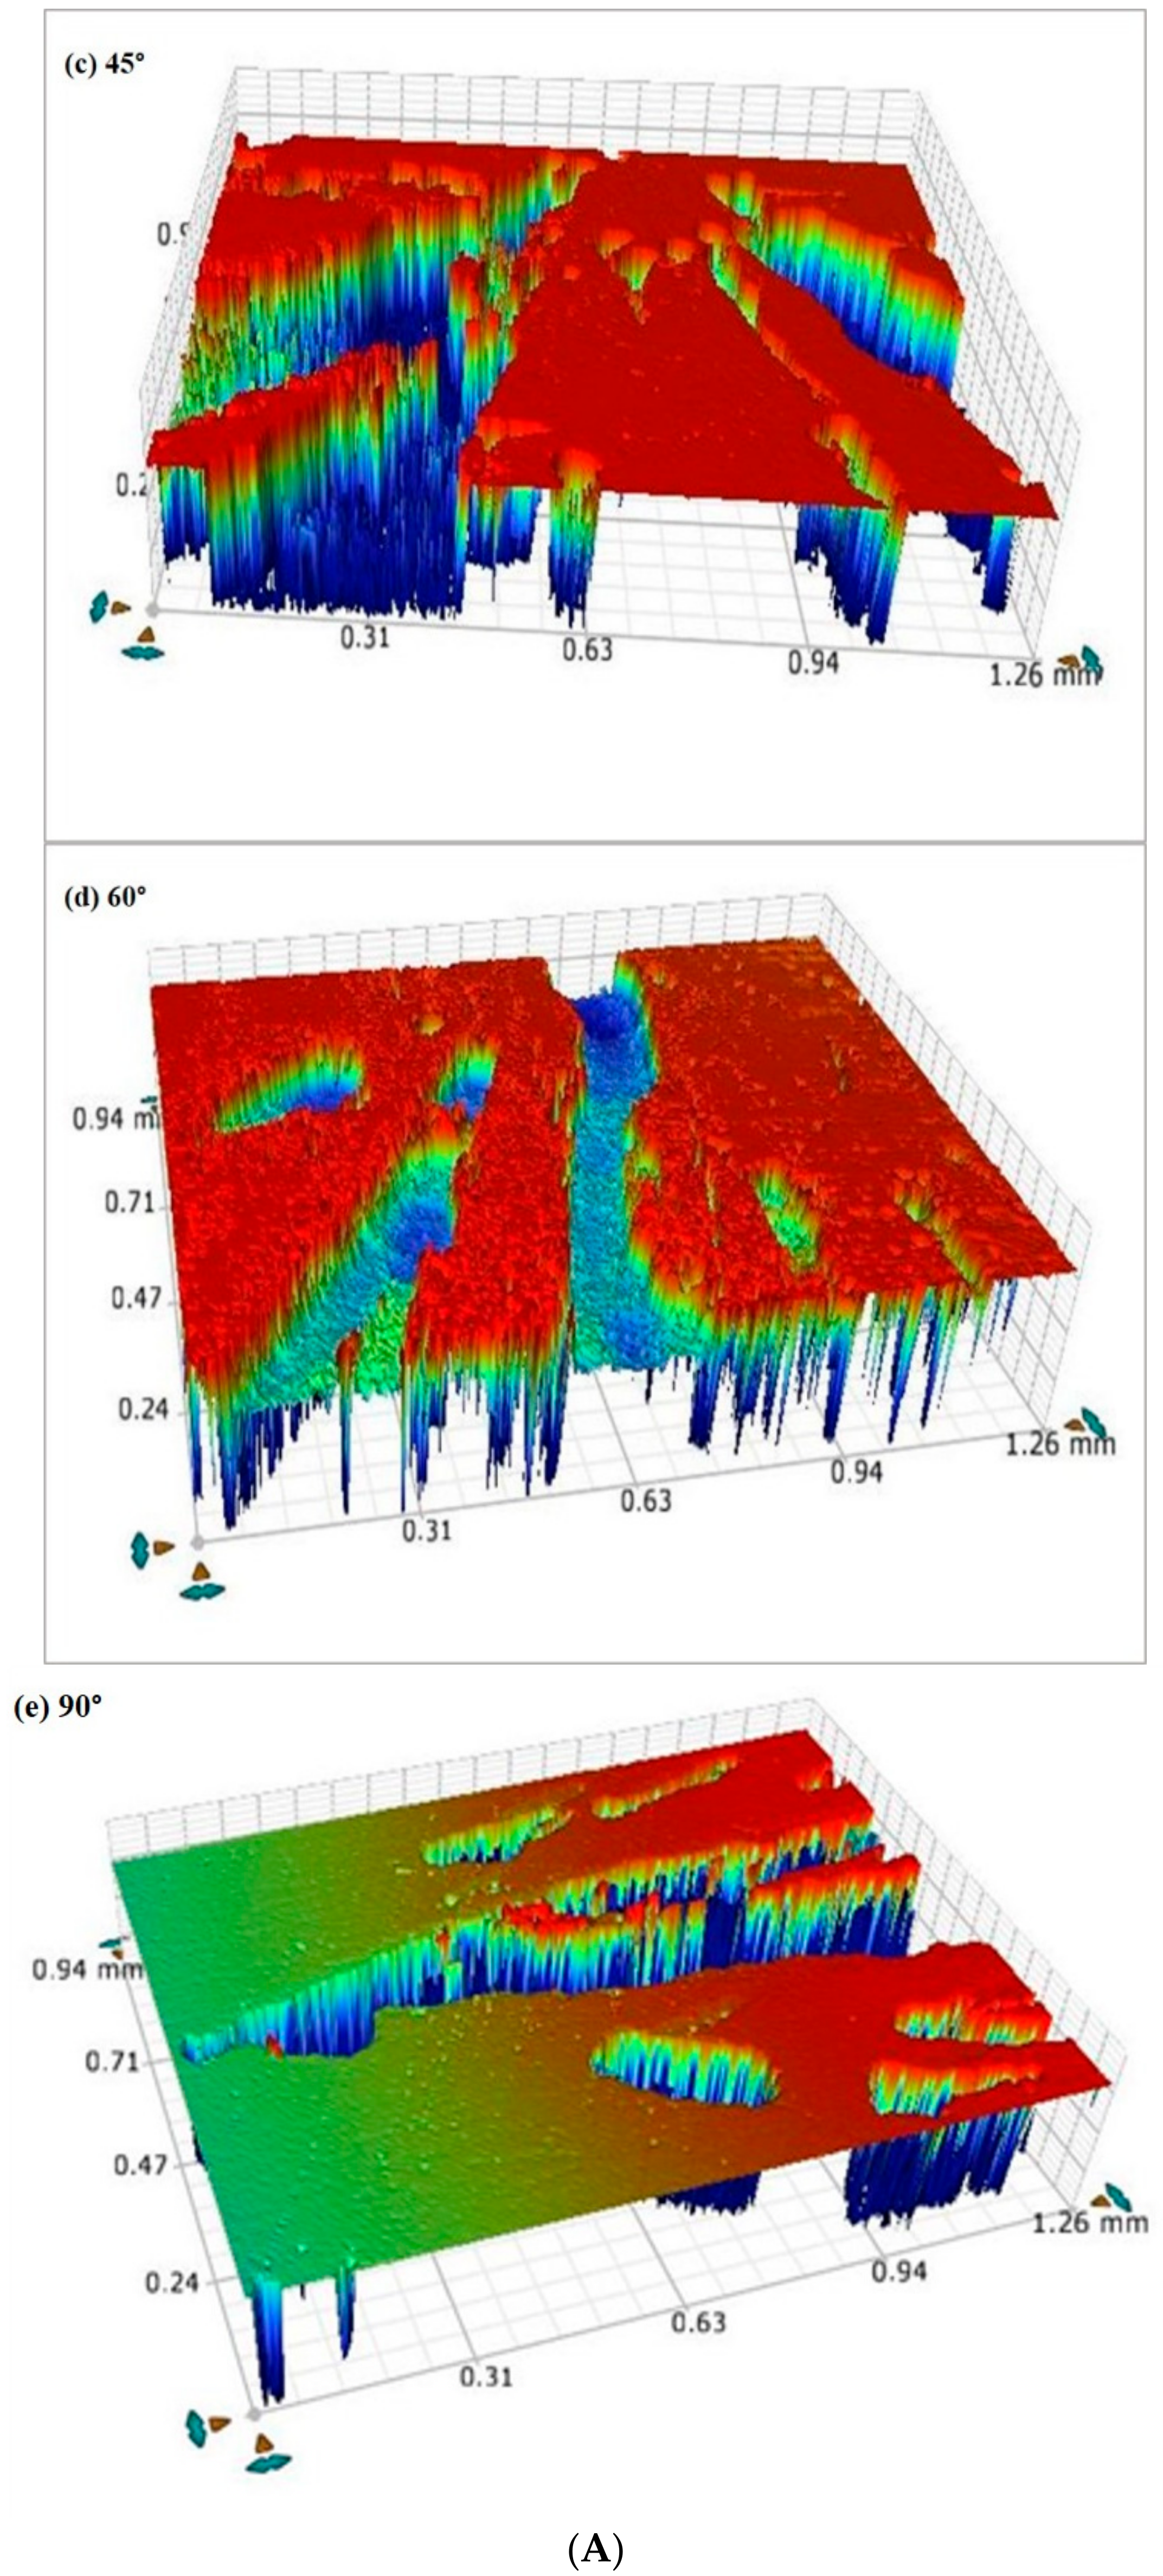
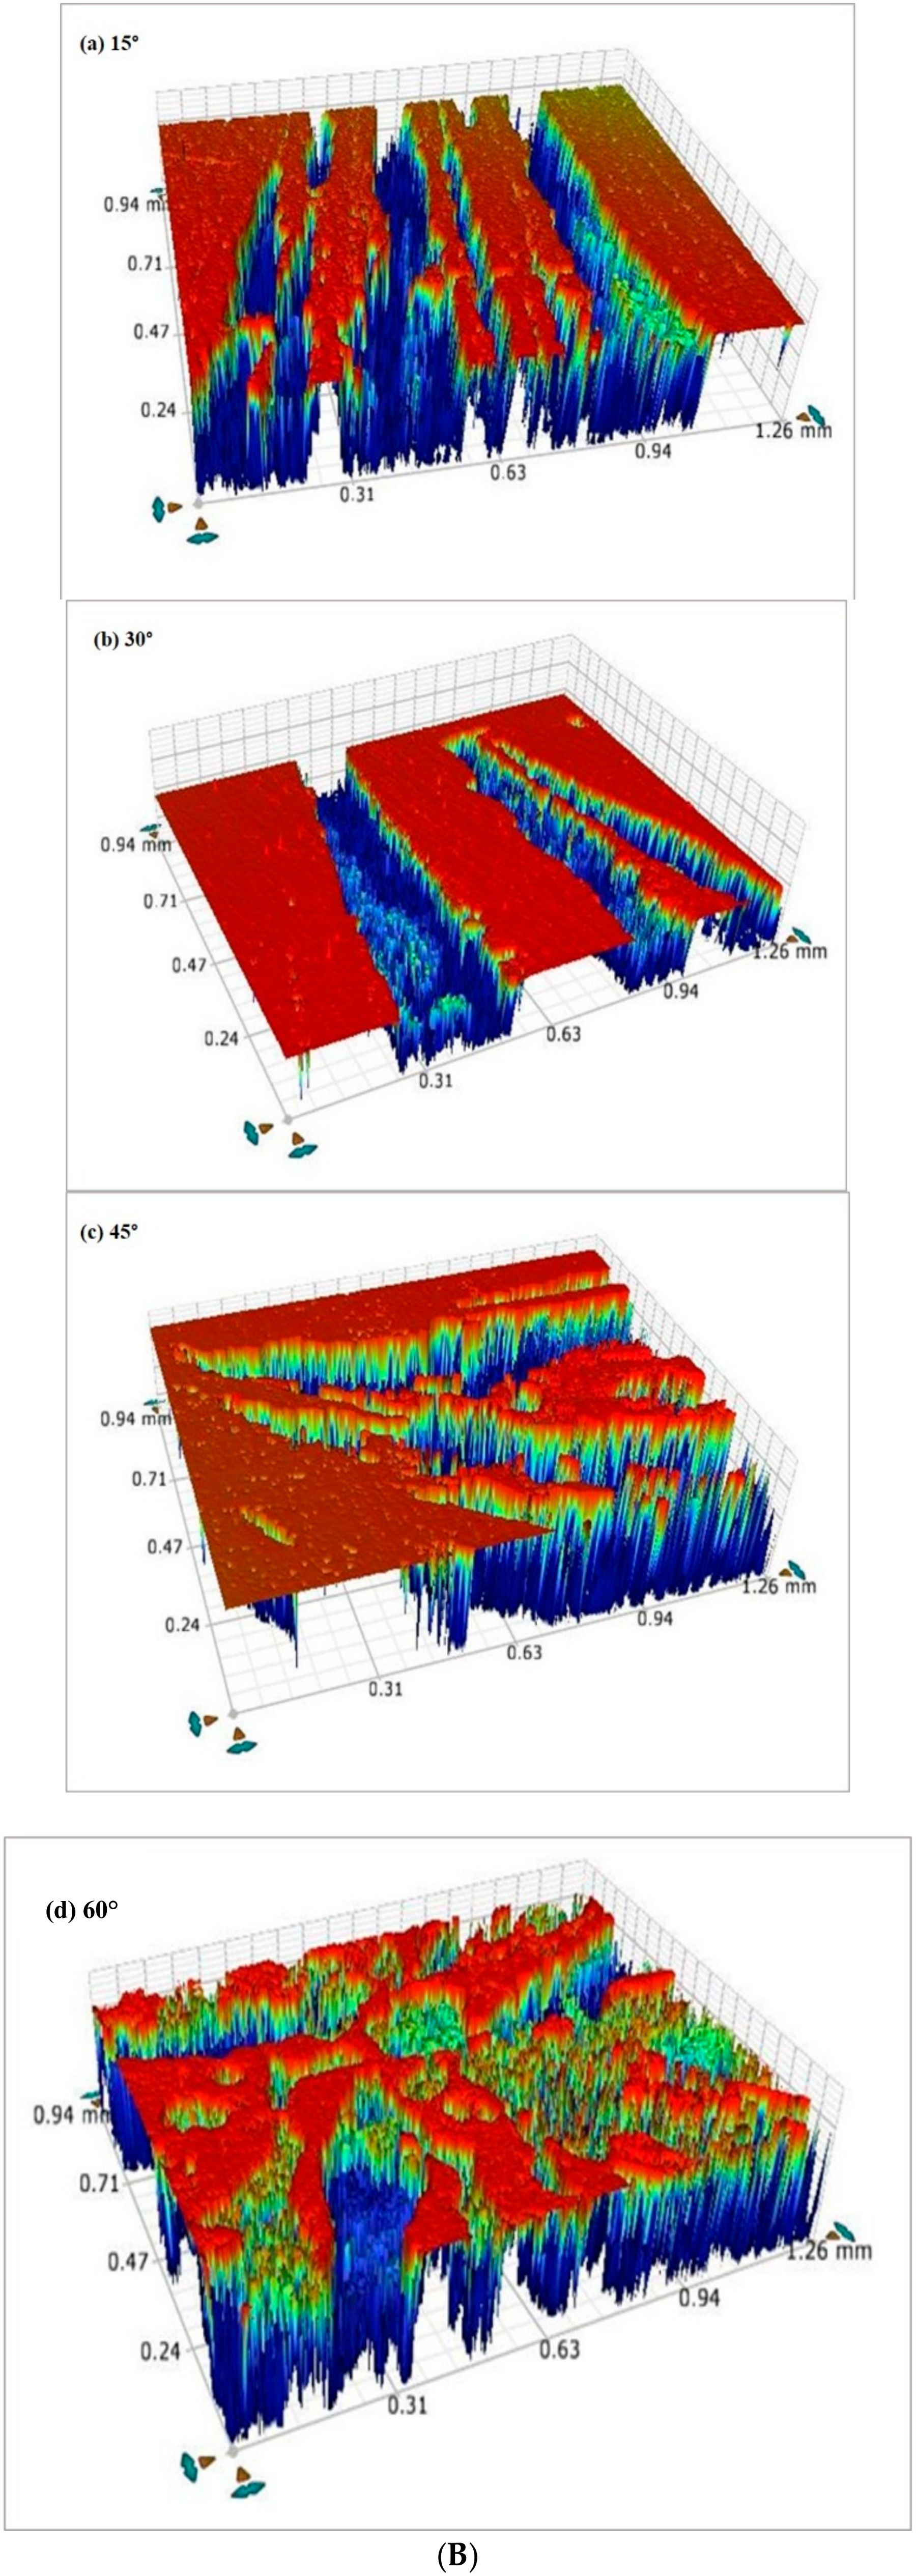
3.5. Wear Scar Penetration Depths Using Optical Profilometer

Figure 9 shows the average penetration depth of wear scars at the impingement point (high-velocity region close to impingement points) when the experiments were conducted at 12 m/s at five different angles for a duration of 24 h. These regions (impingement points) were selected expecting that the effect of shear and/or normal impact stress will be the highest at these points. Typical 3D image analysis of wear scars and their penetration depths were recorded using A GTK-A 3D optical profilometer from Bruker Co. (Billerica, MA, USA) as shown in Figure 10.
It is clear from Figure 9, that with an increase in impingement angle, corrosion (without solid particles) rate was increased and that was quite obvious with an observed increase in penetration depth as well (Figure 10). The maximum depth was observed at 45° and it was found to be 36 µm ± 5. As explained earlier, the maximum depth was expected at 45° due to the balance between shear stress and normal stress as is also seen in Figure 10A. However, in the case of erosion corrosion (with solid particles), the particle ploughed deeper and the maximum depth of 51 µm ± 5 was observed at 45°. At 90° angle particles strike with their maximum kinetic energy and activate the surface by extrusion which results in platelets. These platelets later fractured and removed by the subsequent impact of the particles as shown in Figure 10B. The 3D image of Figure 10B shows that the affected area exactly at impingement point for angle 90° was also eroded and recessed scars were wider with maximum depth of 35 µm ± 3.

4. Conclusions

An experimental study was performed using a Flow loop to investigate the corrosion and erosion-corrosion behavior of API 5L-X65 at five different impingement angles (15°, 30°, 45°, 60° and 90°) and three different jet velocities, i.e., 3 m/s, 6 m/s and 12 m/s at each angle. The eroded surfaces and wear scars were examined to determine surface morphology/penetration depths. The following conclusions can be drawn from this work;
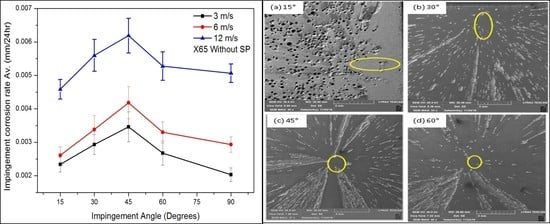
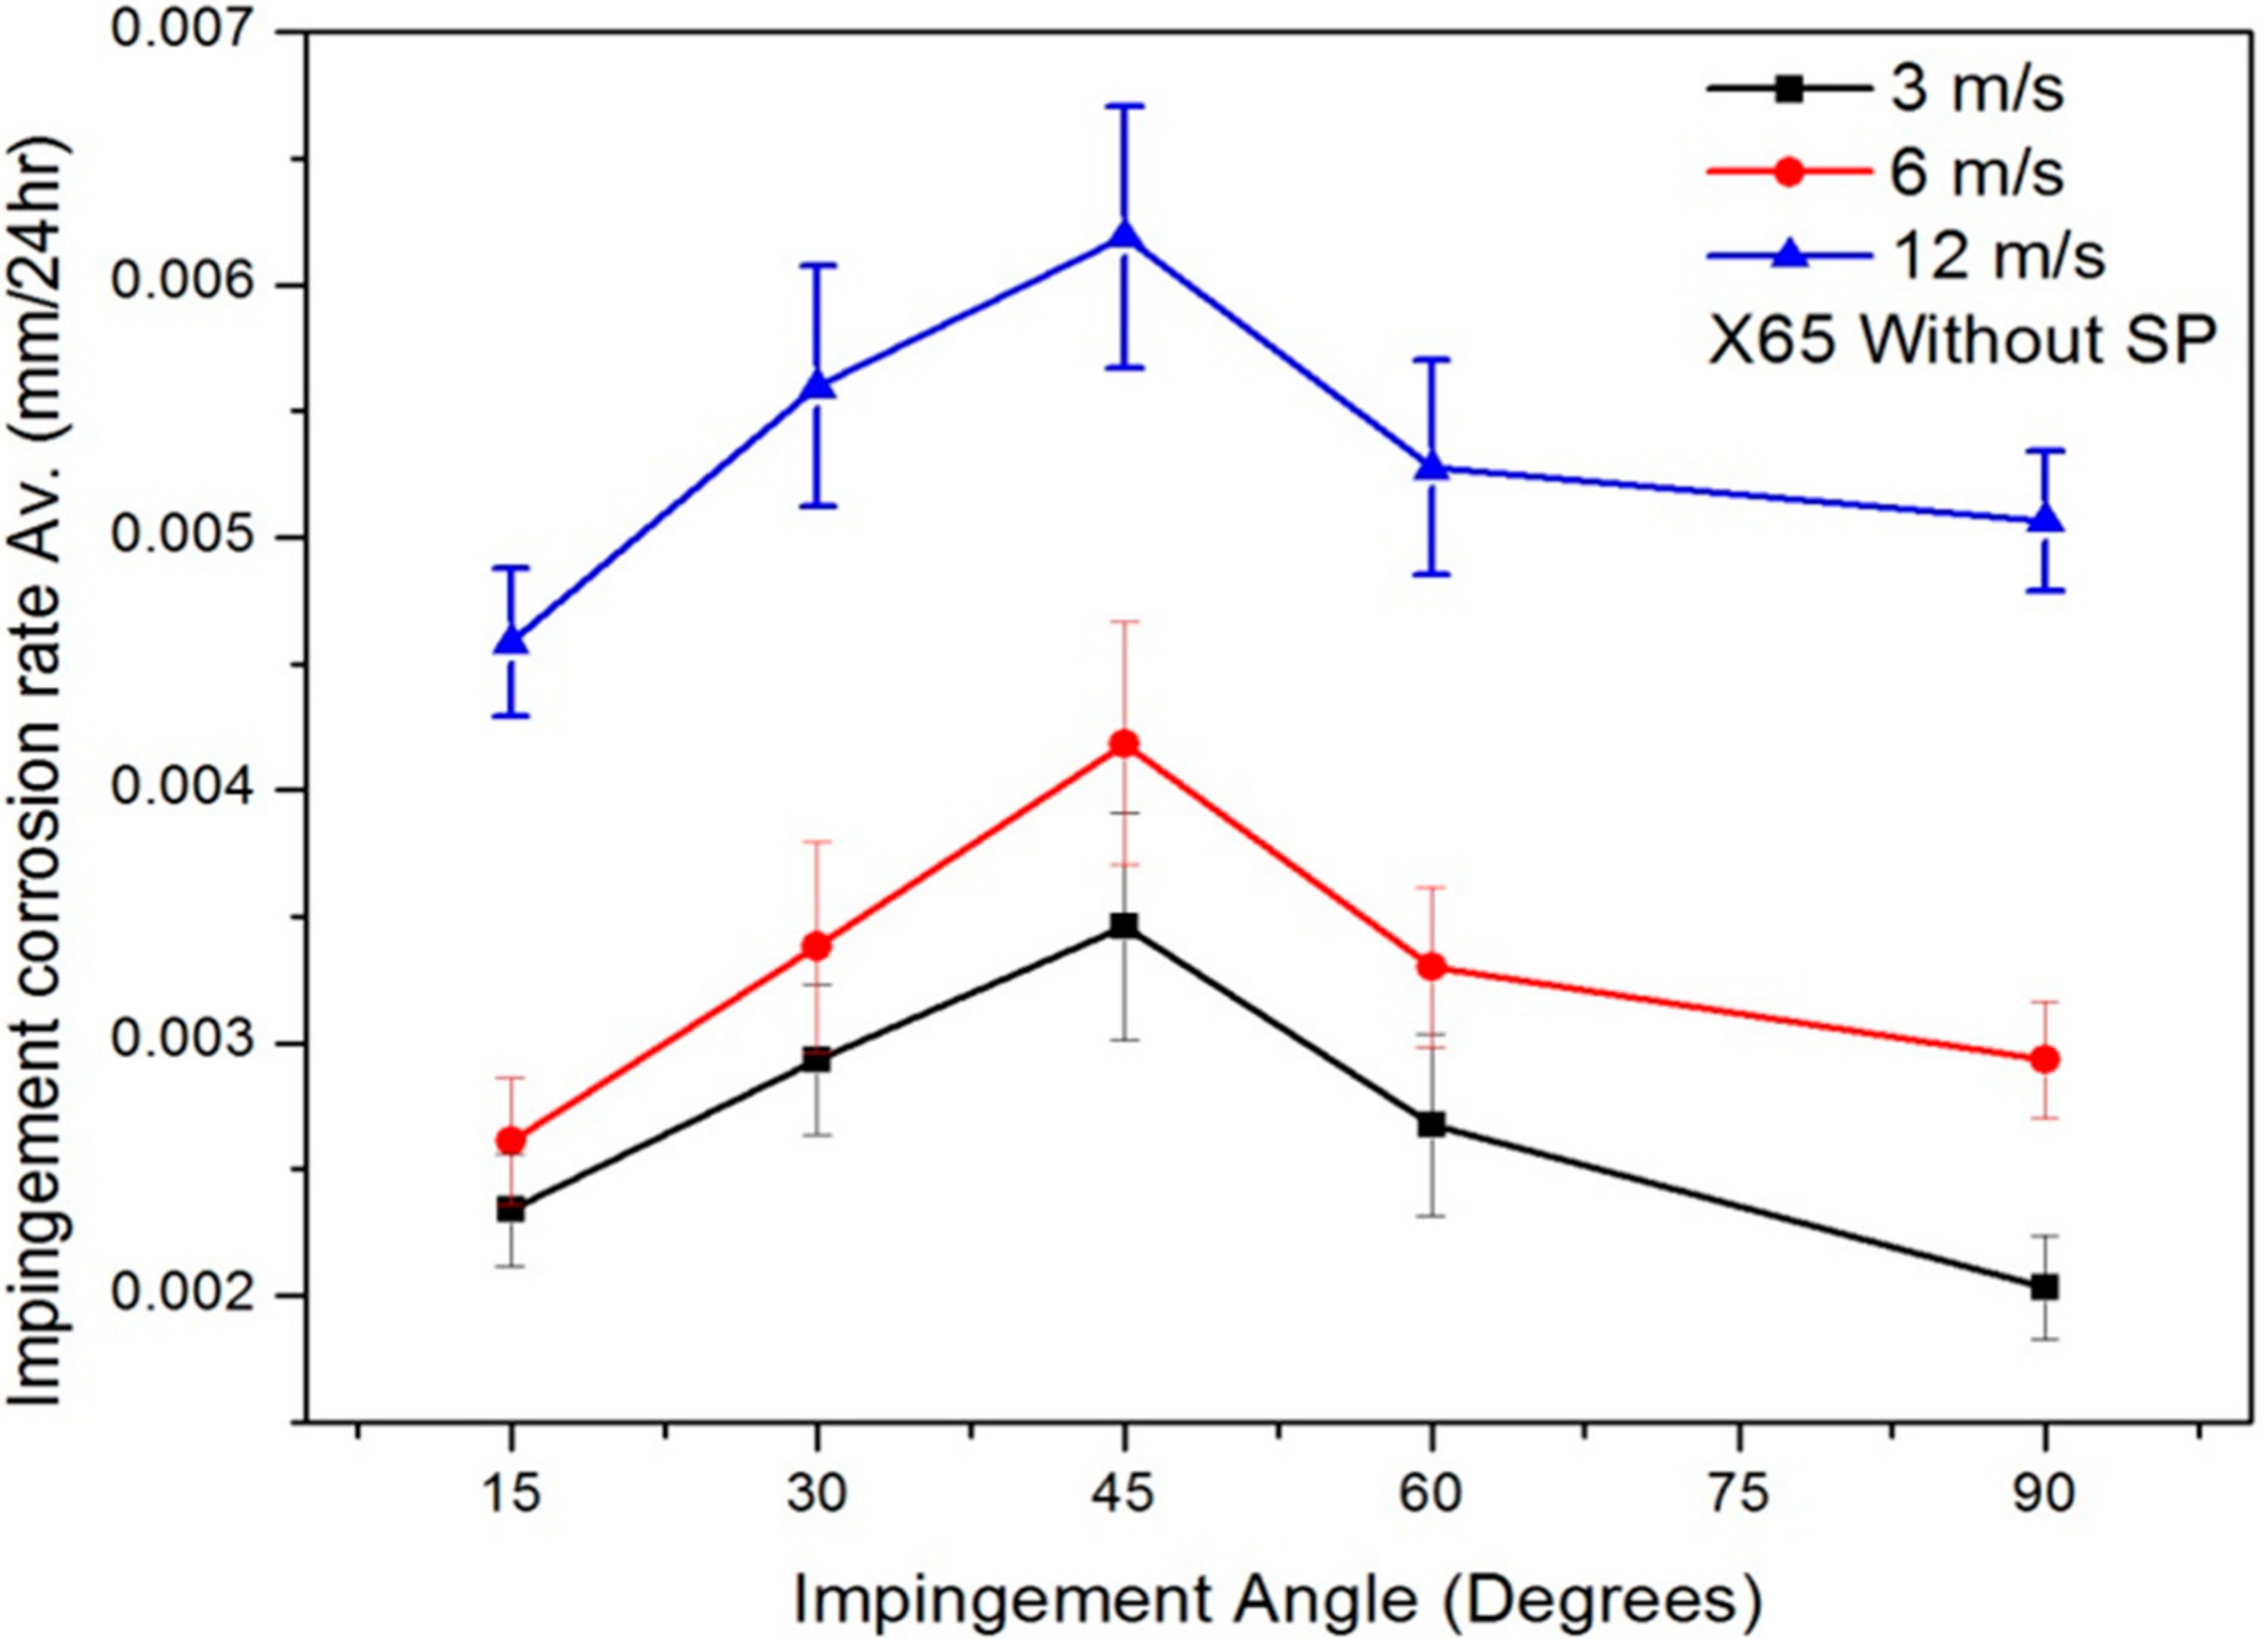
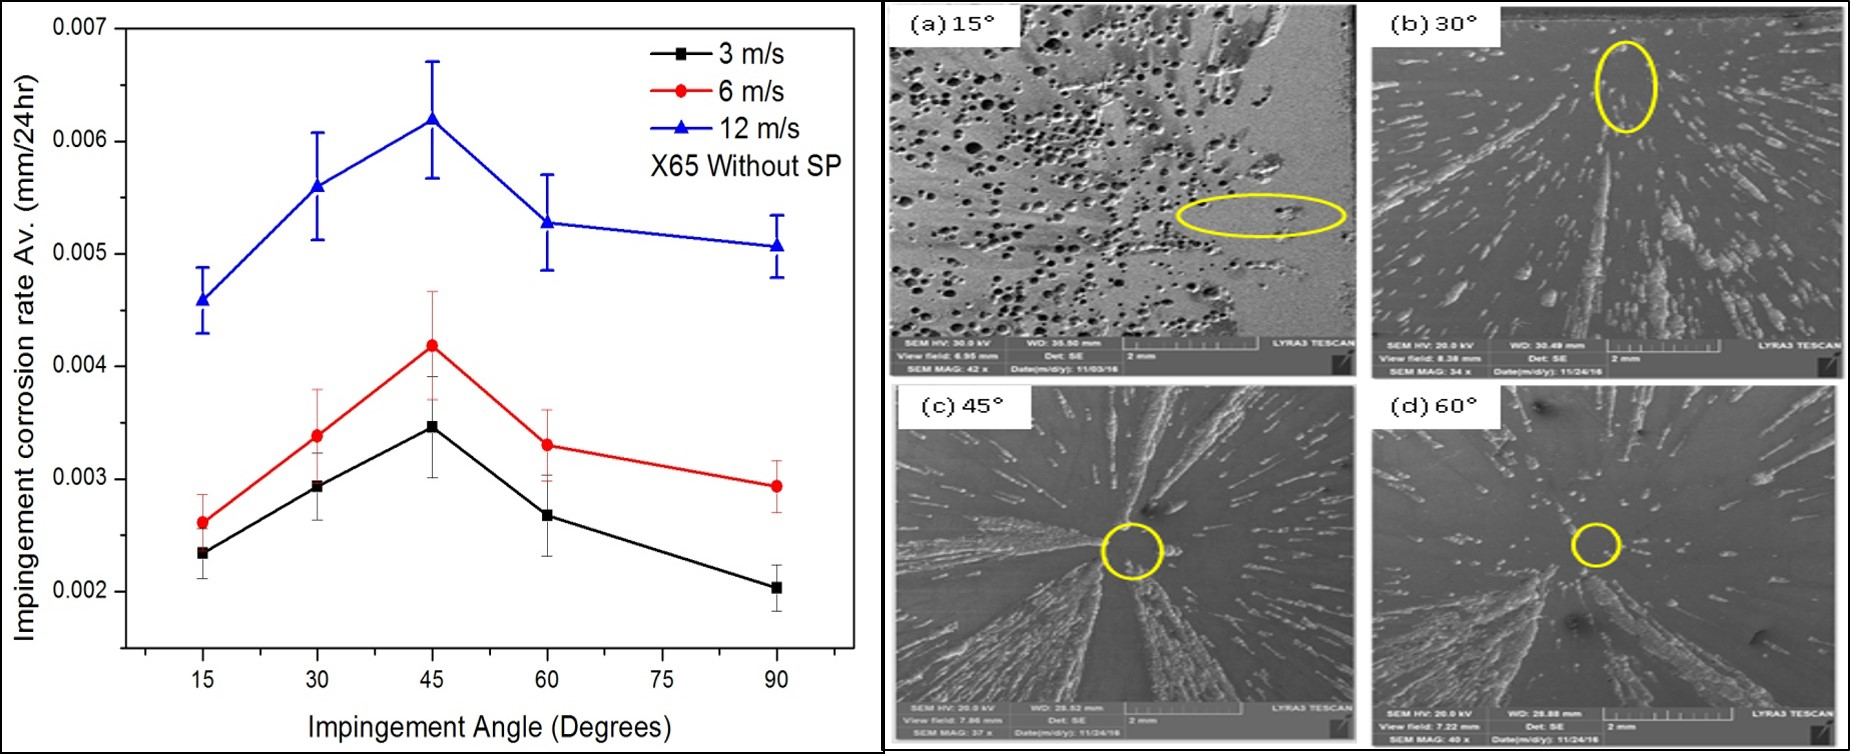
  • The maximum corrosion and erosion corrosion rates were observed at 45° angle due to a balance between shearing force and normal impact force. However the synergistic effect at 45° and 90° angle was more significant as compared to other angles.
  • The effect of erosion on corrosion is quite significant as striking solid particles cut the surface and activate the localised sites and thus accelerate the corrosion damage.
  • Corrosion and erosion corrosion rate was increased with an increase in the impingement velocity. This was mainly due to high shear and normal impact stresses in the absence of solid particles and due to the high kinetic energy in the presence of solid particles causing more mass loss.
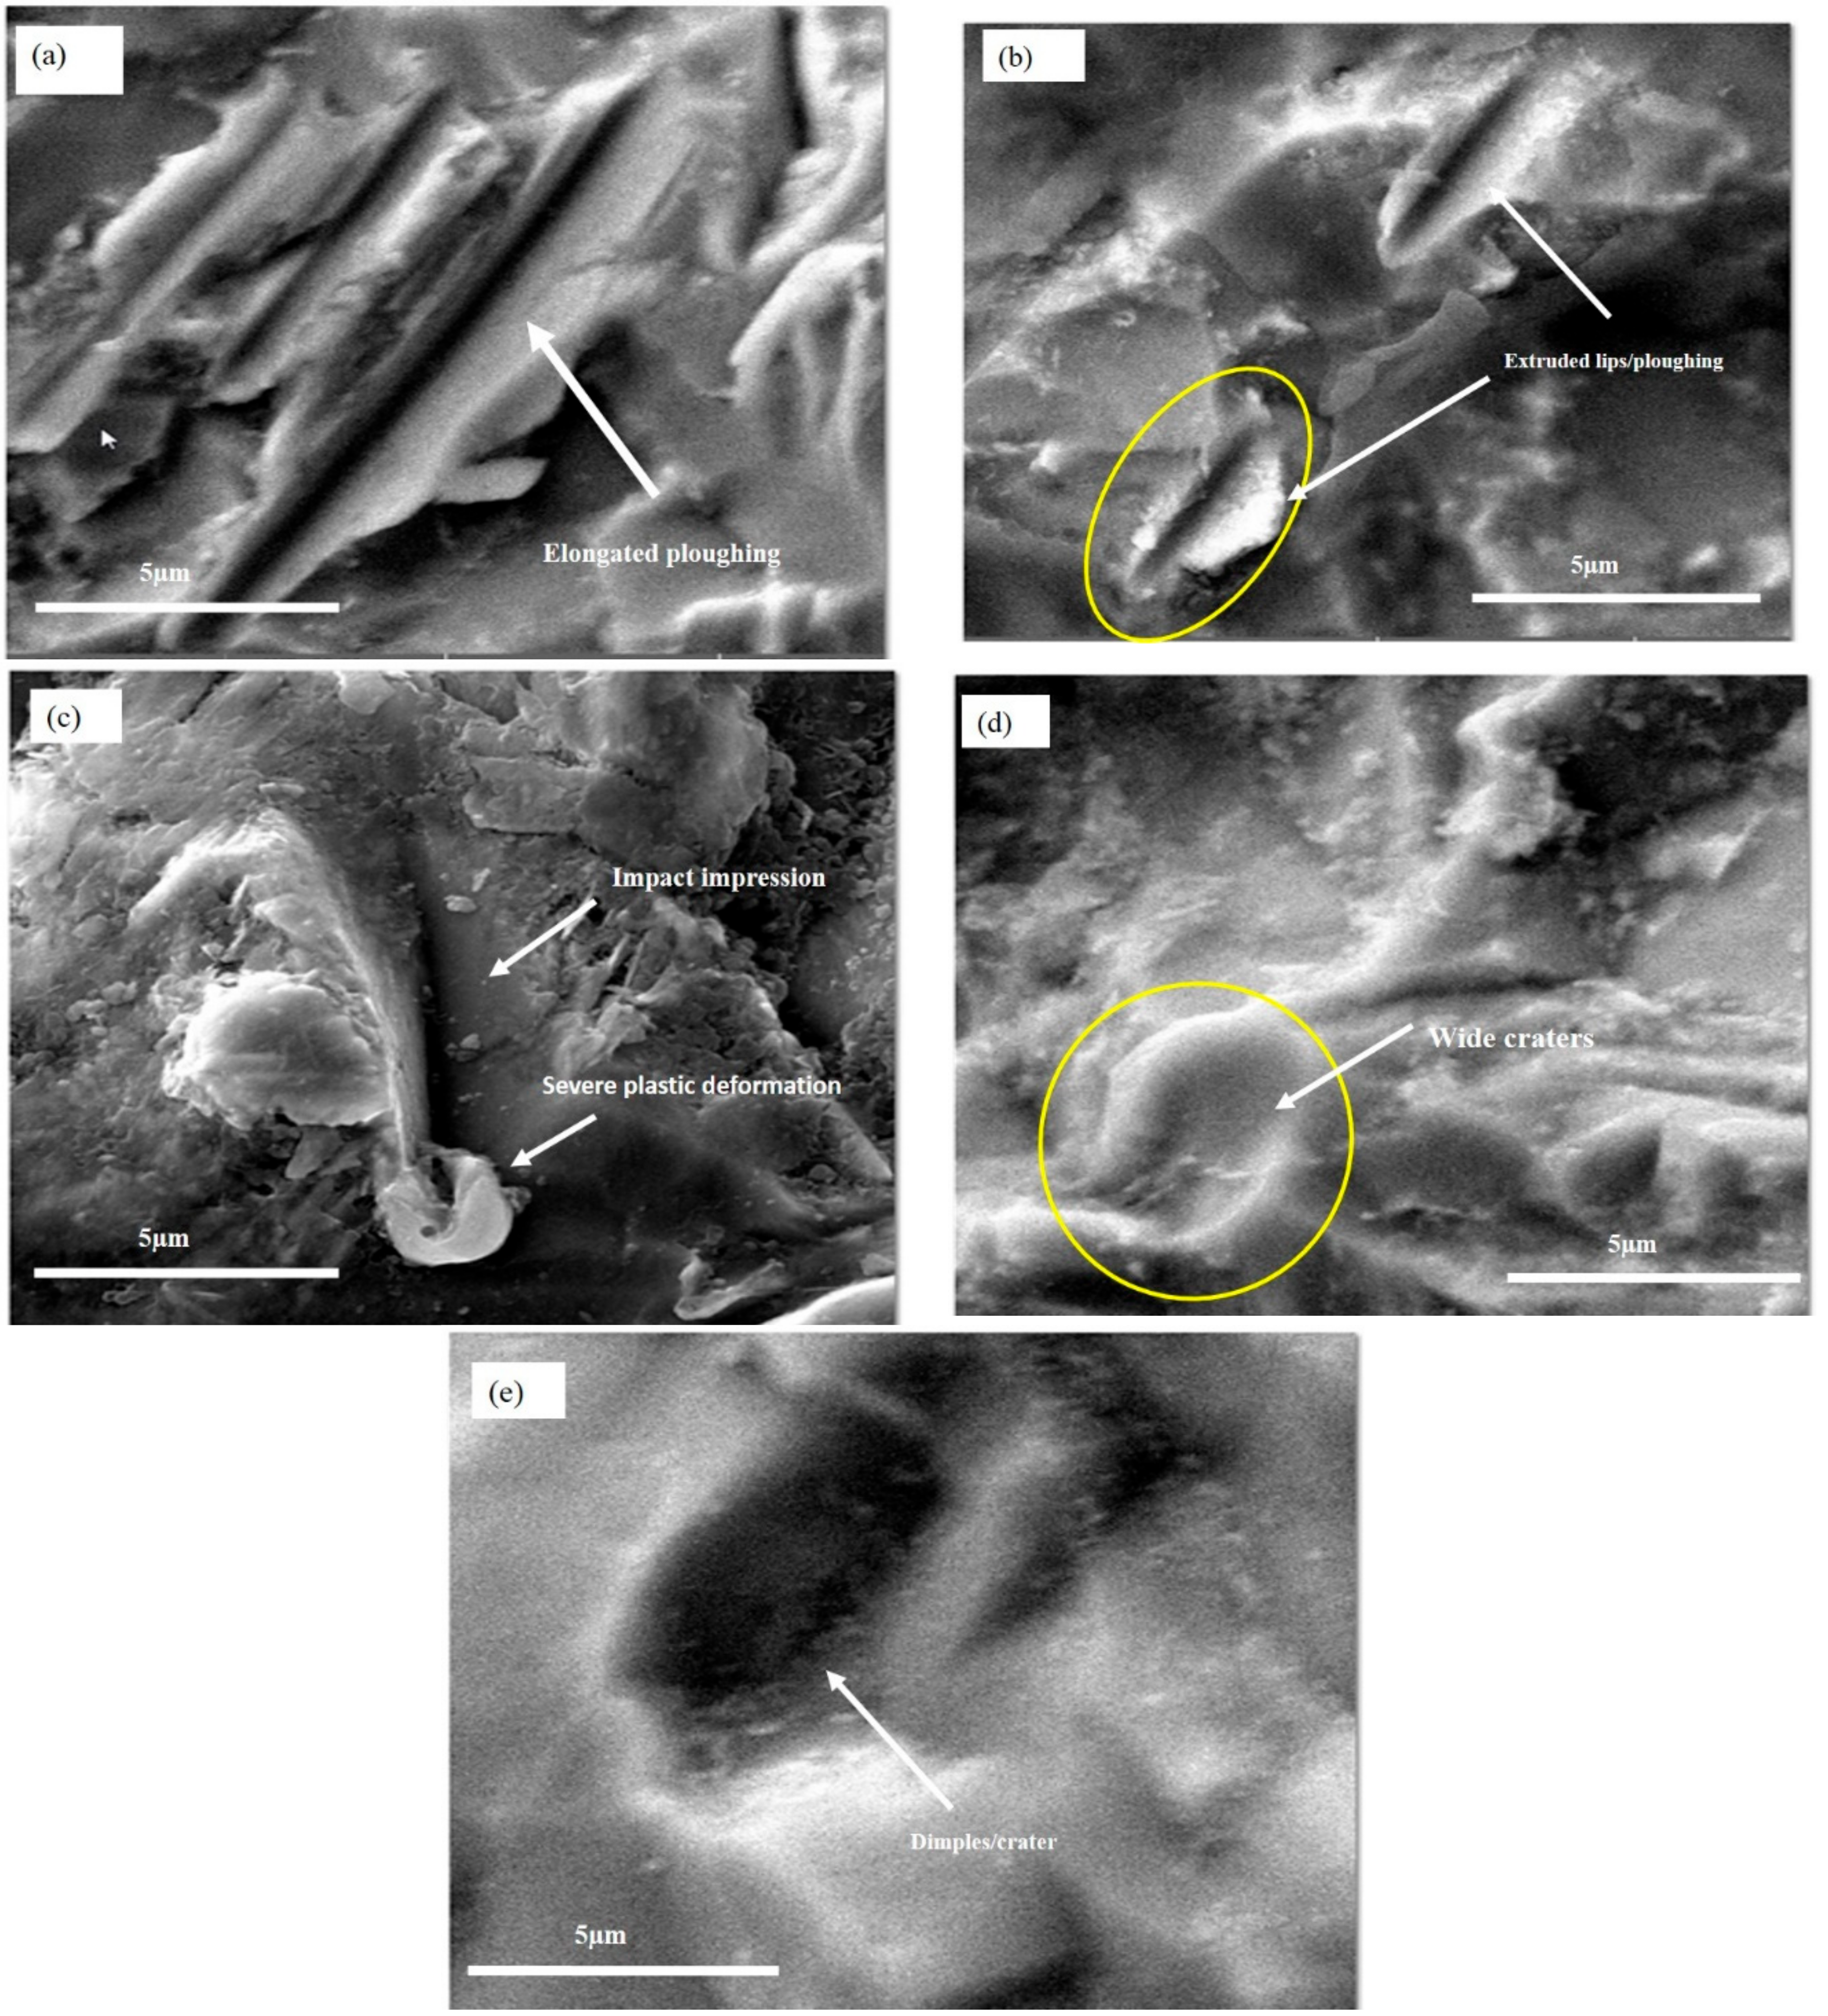
  • Ploughing, elongated erosion scars, and metal cutting were the dominant erosion corrosion mechanisms at oblique angles, whereas extrusion, flattening of ridges and fracture were dominant at high angles.
  • The corrosion product or oxide layer was not stable under these severe conditions of high velocity fluid impingement which resulted in more material loss.

Author Contributions

I.U.T., H.M.B. and H.M.I. designed the detailed experimental plan for this research. H.M.I. carried out the experiments and data analysis under the supervision of I.U.T. and H.M.B. M.A.S. and H.M.I. designed the 3D optical profilometric studies and subsequent data analysis. I.U.T. and H.M.I. prepared the manuscript with help of other coauthors.

Acknowledgments

The authors gratefully acknowledge the financial support provided by King Fahd University of petroleum & Minerals (KFUPM) Saudi Arabia, under the research grant# IN141022 in conducting this research.

Conflicts of Interest

The authors declare no conflicts of interest.

References

  1. Fontana, M.G. Corrosion Engineering; Tata McGraw-Hill Education: New York, NY, USA, 2005. [Google Scholar]
  2. Levy, A.V. Solid Particle Erosion and Erosion-Corrosion of Materials; ASM International: Geauga County, OH, USA, 1995. [Google Scholar]
  3. Heidersbach, R. Metallurgy and Corrosion Control in Oil and Gas Production; John Wiley & Sons: Hoboken, NJ, USA, 2010. [Google Scholar]
  4. Pasha, A.; Ghasemi, H.; Neshati, J. Synergistic Erosion–Corrosion Behavior of X-65 Carbon Steel at Various Impingement Angles. J. Tribol. 2017, 139, 011105. [Google Scholar] [CrossRef]
  5. Neville, A.; Reyes, M.; Xu, H. Examining corrosion effects and corrosion/erosion interactions on metallic materials in aqueous slurries. Tribol. Int. 2002, 35, 643–650. [Google Scholar] [CrossRef]
  6. Javaherdashti, R.; Nwaoha, C.; Tan, H. Corrosion and Materials in the Oil and Gas Industries; CRC Press: Boca Raton, FL, USA, 2013. [Google Scholar]
  7. Levy, A. Erosion and erosion-corrosion of metals. Corrosion 1995, 51, 872–883. [Google Scholar] [CrossRef]
  8. Liang, G. Erosion-corrosion of carbon steel pipes in oil sands slurry studied by weight-loss testing and CFD simulation. J. Mater. Eng. Perform. 2013, 22, 3043–3048. [Google Scholar] [CrossRef]
  9. Mazumder, Q.H. Prediction of Erosion due to solid particle Impact in Single-Phase and Multiphase Flows. J. Press. Vessel Technol. 2007, 129, 576–582. [Google Scholar] [CrossRef]
  10. Giourntas, L.; Hodgkiess, T.; Galloway, A. Enhanced approach of assessing the corrosive wear of engineering materials under impingement. Wear 2015, 338, 155–163. [Google Scholar] [CrossRef] [Green Version]
  11. Sasaki, K.; Burstein, G. Erosion-corrosion of stainless steel under impingement by a fluid jet. Corros. Sci. 2007, 49, 92–102. [Google Scholar] [CrossRef]
  12. Khan, M.I.; Yasmin, T. Erosion-Corrosion of Low Carbon (AISI 1008 Steel) Ring Gasket Under Dynamic High Pressure CO2 Environment. J. Fail. Anal. Prev. 2014, 14, 537–548. [Google Scholar] [CrossRef]
  13. Barker, R.; Hu, X.; Neville, A.; Cushnaghan, S. Flow-induced corrosion and erosion-corrosion assessment of carbon steel pipework in oil and gas production. Corrosion 2013, 69, 193–203. [Google Scholar] [CrossRef]
  14. Neville, A.; Hodgkiess, T.; Xu, H. An electrochemical and microstructural assessment of erosion—Corrosion of cast iron. Wear 1999, 233, 523–534. [Google Scholar] [CrossRef]
  15. Neville, A.; Hodgkiess, T.; Dallas, J. A study of the erosion-corrosion behaviour of engineering steels for marine pumping applications. Wear 1995, 186, 497–507. [Google Scholar] [CrossRef]
  16. Jingjun, L.; Yuzhen, L.; Xiaoyu, L. Numerical simulation for carbon steel flow-induced corrosion in high-velocity flow seawater. Anti-Corros. Methods Mater. 2008, 55, 66–72. [Google Scholar] [CrossRef]
  17. Guanghong, Z.; Hongyan, D.; Yue, Z.; Nianlian, L. Corrosion-erosion wear behaviors of 13Cr24Mn0.44N stainless steel in saline-sand slurry. Tribol. Int. 2010, 43, 891–896. [Google Scholar] [CrossRef]
  18. Lin, F.; Shao, H. Effect of impact velocity on slurry erosion and a new design of a slurry erosion tester. Wear 1991, 143, 231–240. [Google Scholar] [CrossRef]
  19. Finnie, I.; Kabil, Y. On the formation of surface ripples during erosion. Wear 1965, 8, 60–69. [Google Scholar] [CrossRef]
  20. Wong, C.Y. Predicting the material loss around a hole due to sand erosion. Wear 2012, 276, 1–15. [Google Scholar] [CrossRef]
  21. Sundararajan, G.; Shewmon, P. A new model for the erosion of metals at normal incidence. Wear 1983, 84, 237–258. [Google Scholar] [CrossRef]
  22. Hutchings, I. A model for the erosion of metals by spherical at normal incidence. Wear 1981, 70, 269–281. [Google Scholar] [CrossRef]
  23. Chen, X.; McLaury, B.S.; Shirazi, S.A. Application and experimental validation of a computational fluid dynamics (CFD) based erosion prediction model in elbows and plugged tees. Comput. Fluids 2004, 33, 1251–1272. [Google Scholar] [CrossRef]
  24. Nguyen, B.Q.; Nguyen, V.B.; Lim, C.Y.; Gupta, L.M. Effect of impact angle and testing time on erosion of stainless steel at higher velocities. Wear 2014, 321, 87–93. [Google Scholar] [CrossRef]
  25. Ige, O.; Umoru, L. Effects of shear stress on the erosion-corrosion behaviour of X-65 carbon steel: A combined mass-loss and profilometry study. Tribol. Int. 2016, 94, 155–164. [Google Scholar] [CrossRef]
Figure 1. (a) Schematic of the flow loop showing the details of its components; (b) State of the art in-house designed mini flow loop.
Metals 08 00402 g001
Figure 2. Specimen preparation process showing all the steps involved from the start till end.
Metals 08 00402 g002
Figure 3. Effect of impingement velocity and angle on the corrosion rate (without solid particles) of API 5L-X65 steel.
Metals 08 00402 g003
Figure 4. Field Emission Scanning Electron Microscopy (FE-SEM) micrographs (ae) of wear scars after corrosion experiments (without solid particles) at 15–90° angles (circled points show high-velocity regions).
Metals 08 00402 g004aMetals 08 00402 g004b
Figure 5. Effect of impingement velocity and angle on erosion corrosion rate (with solid particles) of API 5L-X65 steel.
Metals 08 00402 g005
Figure 6. FE-SEM micrographs (ae) showing different features of material removal during erosion corrosion experiments.
Metals 08 00402 g006
Figure 7. A comparison between the experimental erosion corrosion rate and theoretical data calculated using Finnie model at 12 m/s fluid impact velocity.
Metals 08 00402 g007
Figure 8. The synergistic effect of erosion on corrosion with the introduction of solid particles on material loss.
Metals 08 00402 g008
Figure 9. Variation of wear scar penetration depth (µm) during corrosion and erosion corrosion experiments at different angles.
Metals 08 00402 g009
Figure 10. (A) 3D images obtained using an optical profilometer at high velocity regions near the impingement points in the absence of solid particles; (B) 3D images obtained using an optical profilometer at high velocity regions near the impingement points in presence of solid particles.
Metals 08 00402 g010aMetals 08 00402 g010bMetals 08 00402 g010c
Table 1. Detailed chemical composition of API 5L-X65 carbon steel used in the experiments.
ElementsCMnFeCuMoNiCrSVCoP
Wt.% Compositions0.1651.2998.10.05480.00920.01830.02750.00620.00760.00630.0015

